transcity legacy way air monitoring...
TRANSCRIPT
Accredited for
compliance with
ISO/IEC 17025.
Accreditation
No. 14184.
TransCity
Legacy Way Air Monitoring Network
Ambient Air Quality Monitoring
Validated Report
1st August 2015 – 31st August 2015
Report No.: DAT9936
Report issue date: 28th September 2015
Maintenance contract: MC1027 & MC1028
ECOTECH PTY LTD. ABN: 32005752081
1492 Ferntree Gully Rd, Knoxfield VIC. 3180. AUSTRALIA
Tel No: 1300 364 946 Fax No: 1300 668 763
Email [email protected] WEB www.ecotech.com
This document shall not be reproduced except for in full, without the written approval of Ecotech Pty Ltd.
Legacy Way Air Monitoring Network
Report No: DAT9936
Transcity
Page 2 of 38
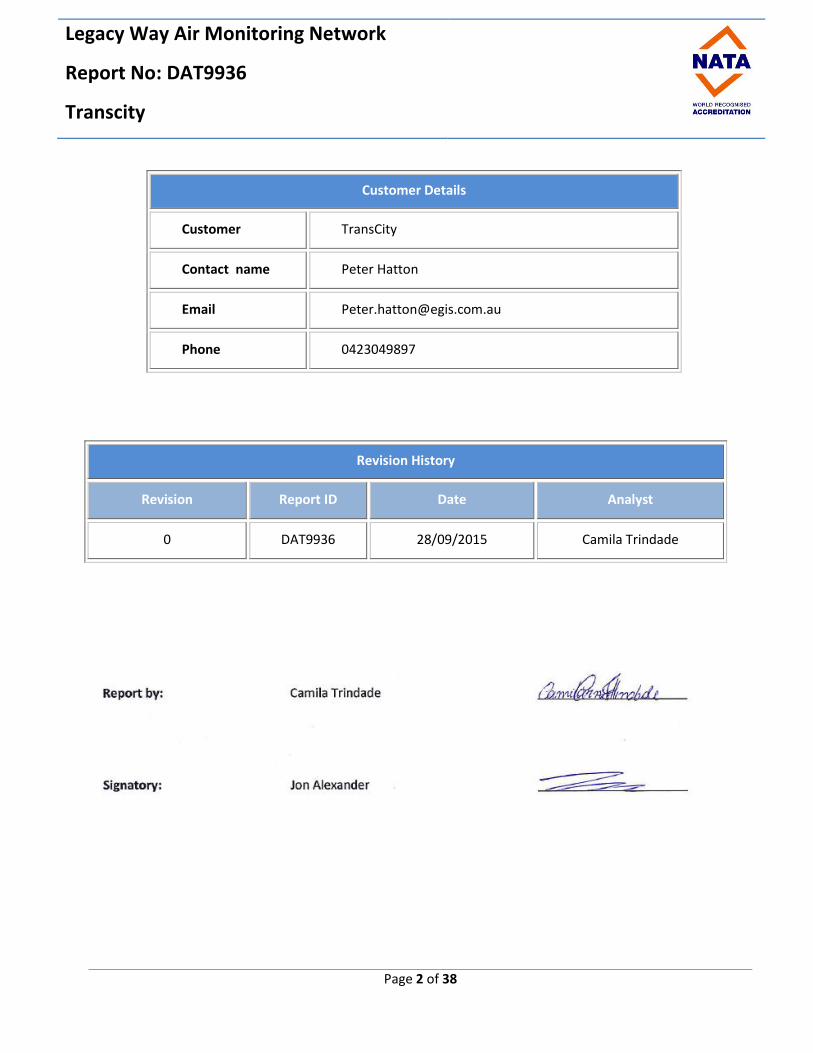
Customer Details
Customer TransCity
Contact name Peter Hatton
Email [email protected]
Phone 0423049897
Revision History
Revision Report ID Date Analyst
0 DAT9936 28/09/2015 Camila Trindade

Legacy Way Air Monitoring Network
Report No: DAT9936
Transcity
Page 3 of 38
Table of Contents Customer Details ............................................................................................................................2
Revision History .............................................................................................................................2
Table of Contents ...........................................................................................................................3
List of Figures .................................................................................................................................4
List of Tables ..................................................................................................................................4
Executive Summary ....................................................................................................................................... 7
1.0 Introduction ...................................................................................................................................... 8
2.0 Monitoring and Data Collection ........................................................................................................ 8
2.1. Siting Details .......................................................................................................................8
2.2. Monitored Parameters ...................................................................................................... 10
2.3. Data Collection Methods ................................................................................................... 11
2.3.1. Compliance with Standards ................................................................................................ 11
2.3.2. Data Acquisition .................................................................................................................. 11
2.4. Data Validation and Reporting ........................................................................................... 12
2.4.1. Validation ............................................................................................................................ 12
2.4.2. Reporting ............................................................................................................................. 12
3.0 Air Quality Goals ............................................................................................................................. 14
4.0 Calibrations and Maintenance ........................................................................................................ 16
4.1. Units and Uncertainties ..................................................................................................... 16
4.2. Maintenance ..................................................................................................................... 17
4.2.1. Calibration & Maintenance Summary Tables ..................................................................... 17
5.0 Results ............................................................................................................................................. 20

Legacy Way Air Monitoring Network
Report No: DAT9936
Transcity
Page 4 of 38
5.1. Data Capture ..................................................................................................................... 20
5.2. Air Quality Monthly Summary ........................................................................................... 23
5.3. Graphic Representations ................................................................................................... 26
5.3.1. External Ambient ........................................................................................................... 26
5.3.2. Ventilation outlet .......................................................................................................... 28
6.0 Valid Data Exception Tables ............................................................................................................ 30
7.0 Report Summary ............................................................................................................................. 35
Appendix 1 - Definitions & Abbreviations ................................................................................................... 36
Appendix 2 - Explanation of Exception Table ............................................................................................. 37
List of Figures Figure 1: TransCity Legacy Way Monitoring Station Locations ..................................................................... 9
Figure 2: TransCity Legacy Way (E1,E2, W1 and W2) - CO graph for August 2015 .................................... 26
Figure 3: TransCity Legacy Way (E1,E2, W1 and W2)- NO2 graph for August 2015 .................................... 26
Figure 4: TransCity Legacy Way (E1,E2, W1 and W2) - PM10 graph for August 2015 ................................. 27
Figure 5: TransCity Legacy Way (E1,E2, W1 and W2) - PM2.5 graph for August 2015................................. 27
Figure 6: TransCity Legacy Way VSO East and West - CO graph for August 2015 ...................................... 28
Figure 7: TransCity Legacy Way East and West – NO2 graph for August 2015 ........................................... 28
Figure 8: TransCity Legacy Way East and West – PM10 graph for August 2015 .......................................... 29
List of Tables Table 1: TransCity Legacy Way monitoring site locations ............................................................................. 8
Table 2: Parameters measured at the TransCity Legacy Way external ambient monitoring stations ....... 10
Table 3: Parameters measured at the TransCity Legacy Way ventilation outlets stations ........................ 10

Legacy Way Air Monitoring Network
Report No: DAT9936
Transcity
Page 5 of 38
Table 4: Methods ........................................................................................................................................ 11
Table 5: Automatic Span / Zero and Background checks at TransCity Legacy Way ................................... 13
Table 6: TransCity Legacy Way External Ambient Stations Air Quality Goals ............................................. 14
Table 7: TransCity Legacy Way Ventilation Outlet Stations Air Quality Criterias ....................................... 15
Table 8: Units and Uncertainties ................................................................................................................. 16
Table 9: TransCity East Victoria Park (E1) Maintenance Table August 2015 .............................................. 17
Table 10: TransCity Eastern Centenary Pool (E2) Maintenance Table August 2015 .................................. 17
Table 11: TransCity West Anzac Park (W1) Maintenance Table August 2015 ............................................ 18
Table 12: TransCity West Botanic Gardens (W2) Maintenance Table August 2015 ................................... 18
Table 13: TransCity VSO East Maintenance Table August 2015 ................................................................. 19
Table 14: TransCity VSO West Maintenance Table August 2015 ............................................................... 19
Table 15: Monthly Data Capture for TransCity East Victoria Park (E1) for August 2015 ............................ 20
Table 16: Monthly Data Capture for TransCity Eastern Centenary Pool (E2) for August 2015 .................. 21
Table 17: Monthly Data Capture for TransCity West Anzac Park (W1) for August 2015 ........................... 21
Table 18: Monthly Data Capture for TransCity Botanic Garndens (W2) for August 2015 .......................... 22
Table 19: Monthly Data Capture for TransCity VSO East for August 2015 ................................................. 22
Table 20: Monthly Data Capture for TransCity VSO West for August 2015 ............................................... 22
Table 21: TransCity East – Victoria Park (E1) Exceedences Recorded for August 2015.............................. 23
Table 22: TransCity Eastern Centenary Pool (E2) Exceedences Recorded for August 2015 ....................... 23
Table 23: TransCity West Anzac Park (W1) Exceedences Recorded for August 2015 ................................ 24
Table 24: TransCity West Botanic Gardens (W2) Exceedences Recorded for August 2015 ....................... 24
Table 25: TransCity VSO East Exceedences Recorded for August 2015...................................................... 25
Table 26: TransCity VSO West Exceedences Recorded for August 2015 .................................................... 25

Legacy Way Air Monitoring Network
Report No: DAT9936
Transcity
Page 6 of 38
Table 27: TransCity East – Victoria Park (E1) Valid Data Exception Table ................................................. 30
Table 28: TransCity Eastern Centenary Pool (E2) Valid Data Exception Table ........................................... 31
Table 29: TransCity West Anzac Park (W1) Valid Data Exception Table ..................................................... 32
Table 30: TransCity West Botanic Gardens (W2) Valid Data Exception Table ............................................ 32
Table 31: TransCity VSO East Valid Data Exception Table .......................................................................... 33
Table 32: TransCity VSO West Valid Data Exception Table ......................................................................... 34

Legacy Way Air Monitoring Network
Report No: DAT9936
Transcity
Page 7 of 38
Executive Summary
Legacy Way is a tunnel network located in Brisbane QLD linking the Western Freeway at Toowong
with the Inner City Bypass (ICB) at Kelvin Grove. TransCity is responsible for the design, construction
and operation of the network (TransCity website http://transcityjv.com.au/the-project/).
Ecotech Pty Ltd has been commissioned by TransCity for air quality monitoring, data collection and
reporting at four external ambient air quality monitoring stations, Legacy Way East Victoria Park
(E1), Eastern Centenary Pool (E2), West Anzac Park (W1) and West Botanic Gardens (W2). Two new
ventilation outlet air quality stations were commissioned in June 15, Legacy Way VSO East and VSO
West.
Percentage availability for all parameters at TransCity Legacy Way East Victoria Park (E1), West
Anzac Park (W1), West Botanic Gardens (W2), VSO East and VSO West was above 95% for the
reporting month.
Percentage availability for most parameters at TransCity Legacy Way Eastern Centenary Pool (E2),
was above 95% for the reporting month. CO data at Anzac Park fell slightly below 95% due to the
amount of maintenance performed to the instrument.
There were 2 exceedences of the air quality limits at TransCity Legacy Way Monitoring Network for
the reporting month. Please refer to Table 21-26 in Section 5.2 – Air Quality Summary for further
information.
Legacy Way Air Monitoring Network
Report No: DAT9936
Transcity
Page 8 of 38
1.0 Introduction
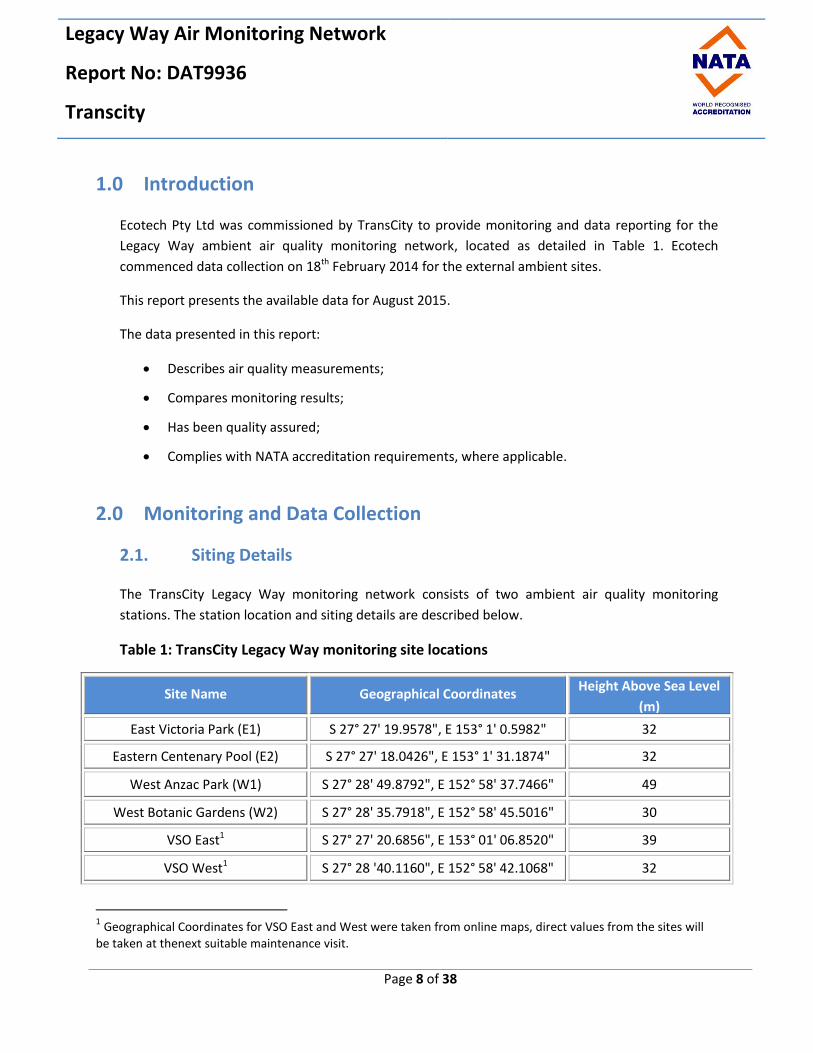
Ecotech Pty Ltd was commissioned by TransCity to provide monitoring and data reporting for the
Legacy Way ambient air quality monitoring network, located as detailed in Table 1. Ecotech
commenced data collection on 18th February 2014 for the external ambient sites.
This report presents the available data for August 2015.
The data presented in this report:
Describes air quality measurements;
Compares monitoring results;
Has been quality assured;
Complies with NATA accreditation requirements, where applicable.
2.0 Monitoring and Data Collection
2.1. Siting Details
The TransCity Legacy Way monitoring network consists of two ambient air quality monitoring
stations. The station location and siting details are described below.
Table 1: TransCity Legacy Way monitoring site locations
Site Name Geographical Coordinates Height Above Sea Level
(m)
East Victoria Park (E1) S 27° 27' 19.9578", E 153° 1' 0.5982" 32
Eastern Centenary Pool (E2) S 27° 27' 18.0426", E 153° 1' 31.1874" 32
West Anzac Park (W1) S 27° 28' 49.8792", E 152° 58' 37.7466" 49
West Botanic Gardens (W2) S 27° 28' 35.7918", E 152° 58' 45.5016" 30
VSO East1 S 27° 27' 20.6856", E 153° 01' 06.8520" 39
VSO West1 S 27° 28 '40.1160", E 152° 58' 42.1068" 32
1 Geographical Coordinates for VSO East and West were taken from online maps, direct values from the sites will
be taken at thenext suitable maintenance visit.

Legacy Way Air Monitoring Network
Report No: DAT9936
Transcity
Page 9 of 38
A siting audit was conducted on the 05th May 2015 at Legacy Way East Victoria Park (E1), Eastern
Centenary Pool (E2), West Anzac Park (W1) and West Botanic Gardens (W2) stations to assess for
compliance with AS/NZS equipment”. The siting of these stations does not comply fully with AS/NZS
3580.1.1:2007 due to the proximity of nearby trees.
A siting audit to assess for compliance with AS/NZS 3580.1.1:2007 has not yet been completed at
Legacy Way VSO East and VSO West. The audit will be completed at the next suitable maintenance
visit.
Figure 1: TransCity Legacy Way Monitoring Station Locations
Legacy Way Air Monitoring Network
Report No: DAT9936
Transcity
Page 10 of 38
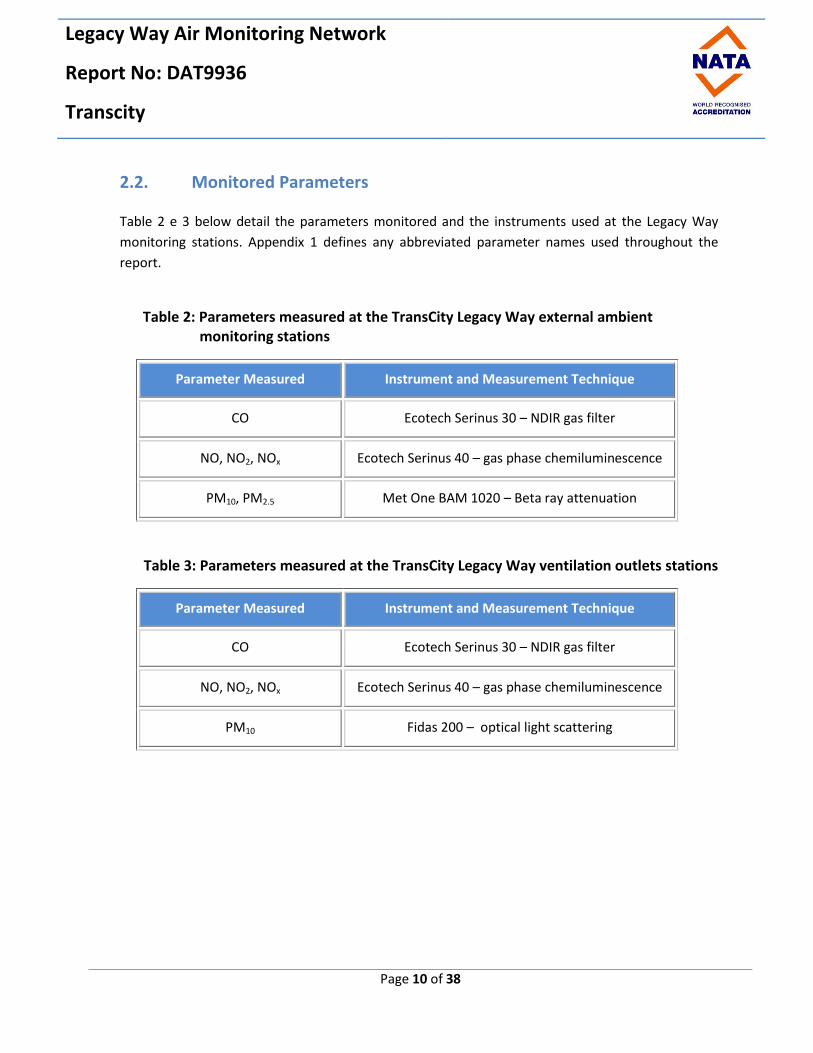
2.2. Monitored Parameters
Table 2 e 3 below detail the parameters monitored and the instruments used at the Legacy Way
monitoring stations. Appendix 1 defines any abbreviated parameter names used throughout the
report.
Table 2: Parameters measured at the TransCity Legacy Way external ambient
monitoring stations
Parameter Measured Instrument and Measurement Technique
CO Ecotech Serinus 30 – NDIR gas filter
NO, NO2, NOx Ecotech Serinus 40 – gas phase chemiluminescence
PM10, PM2.5 Met One BAM 1020 – Beta ray attenuation
Table 3: Parameters measured at the TransCity Legacy Way ventilation outlets stations
Parameter Measured Instrument and Measurement Technique
CO Ecotech Serinus 30 – NDIR gas filter
NO, NO2, NOx Ecotech Serinus 40 – gas phase chemiluminescence
PM10 Fidas 200 – optical light scattering

Legacy Way Air Monitoring Network
Report No: DAT9936
Transcity
Page 11 of 38
2.3. Data Collection Methods
Table 4 below shows the methods used for data collection. Any deviations from the stated methods
are detailed in section 2.3.1.
Table 4: Methods
Parameter
Measured
Data Collection Methods
Used Description of Method
NO, NO2, NOx AS/NZS 3580.5.1 - 2011 Methods for sampling and analysis of ambient air - Method
5.1: Determination of oxides of nitrogen-Chemiluminescence method
CO AS/NZS 3580.7.1 - 2011 Methods for sampling and analysis of ambient air. Method 7.1:
Determination of carbon monoxide—Direct-reading instrumental method
PM10 (BAM 1020) AS/NZS 3580.9.11 - 2008 Methods for sampling and analysis of ambient air Method
9.11: Determination of suspended particulate matter—PM10 beta attenuation monitors
PM2.5 (BAM 1020) Ecotech Laboratory
Manual In-house method 7.5 – Measurement of PM10, PM2.5 and TSP
using Beta Attenuation Monitor
PM10
(Fidas 200) Ecotech Laboratory
Manual
In-house method 7.7 – PM10 and PM2.5 Particulate Matter – Light Scattering Method Using Palas Fidas® 200 Series
Monitors
2.3.1. Compliance with Standards
Unless stated below, parameters are monitored at the TransCity Network according to the methods detailed in
Table 4.
Measurement of PM10 by Fidas is not yet covered by Ecotech’s NATA scope of
accreditation. Endorsement is pending and will be applied to future reports.
The siting of these stations does not comply fully with AS/NZS 3580.1.1:2007 due to the
proximity of nearby trees.
2.3.2. Data Acquisition
Data acquisition is performed using a PC based WinAQMS logger (using WinAQMS Version 2.0)
situated at each of the monitoring sites. Each logger is equipped with a 3G modem for remote

Legacy Way Air Monitoring Network
Report No: DAT9936
Transcity
Page 12 of 38
data collection. The recorded data is remotely collected from the AQMS loggers on a daily basis
(using AirodisTM version 5.1.0) and stored at Ecotech’s Environmental Reporting Services (ERS)
department in Melbourne, Australia. Data samples are logged in 5 minute intervals, expect for
dust parameters which are logged in 1 hour intervals.
2.4. Data Validation and Reporting
2.4.1. Validation
The Ecotech ERS department performs daily data checks to ensure maximum data capture rates
are maintained. Any equipment failures are communicated to the responsible field engineers for
urgent rectification. Ecotech ERS maintains two distinct databases containing non-validated and
validated data respectively.
The validated database is created by duplicating the non-validated database and then flagging
data affected by instrument faults, calibrations and other maintenance activities. The data
validation software requires the analyst to supply a valid reason (e.g. backed by maintenance
notes, calibration sheets etc) in the database for flagging any data as invalid.
Details of all invalid or missing data are recorded in the Valid Data Exception Tables.
Validation is performed by the analyst, and the validation is reviewed. Graphs and tables are
generated based on the validated five minute and one hour data.
2.4.2. Reporting
The reported data is in a Microsoft Excel format file named “TransCity Legacy Way Monthly
Data Report_August 2015.xls”
The Excel file(s) consists of nine worksheets:
1. Cover
2. 5 Minute Data
3. 1 Hour Data
4. 1 Day Data and Data Capture
5. CO 8hr Rolling
6. Span
7. Zero
8. Precision
9. Valid Data Exception Report
Legacy Way Air Monitoring Network
Report No: DAT9936
Transcity
Page 13 of 38
The data contained in this report is based on Australian Eastern Standard Time.
All averages are calculated from the five minute data, except dust parameters from BAM1020
instruments which are calculated from one hour data. Averages are based on a minimum of
75% valid readings within the averaging period.
As the Fidas® 200 instrument records mass concentrations values in µg/m³ referenced to the
local ambient temperature and pressure, the PM10 data is corrected to Australian STP.
Averaging periods of eight hours or less are reported for the end of the period, i.e. the hourly
average 02:00am is for the data collected from 1:00am to 2:00am. One hour averages are
calculated based on a clock hour. One day averages are calculated based on calendar days.
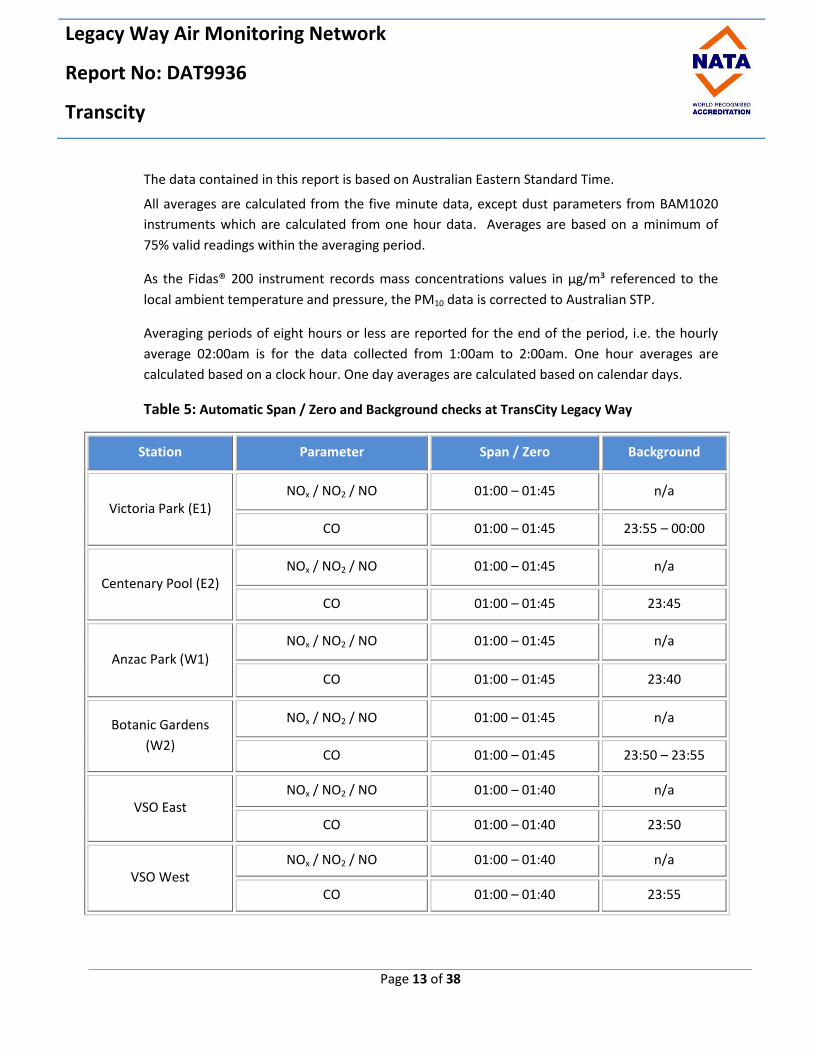
Table 5: Automatic Span / Zero and Background checks at TransCity Legacy Way
Station Parameter Span / Zero Background
Victoria Park (E1) NOx / NO2 / NO 01:00 – 01:45 n/a
CO 01:00 – 01:45 23:55 – 00:00
Centenary Pool (E2) NOx / NO2 / NO 01:00 – 01:45 n/a
CO 01:00 – 01:45 23:45
Anzac Park (W1) NOx / NO2 / NO 01:00 – 01:45 n/a
CO 01:00 – 01:45 23:40
Botanic Gardens
(W2)
NOx / NO2 / NO 01:00 – 01:45 n/a
CO 01:00 – 01:45 23:50 – 23:55
VSO East NOx / NO2 / NO 01:00 – 01:40 n/a
CO 01:00 – 01:40 23:50
VSO West NOx / NO2 / NO 01:00 – 01:40 n/a
CO 01:00 – 01:40 23:55

Legacy Way Air Monitoring Network
Report No: DAT9936
Transcity
Page 14 of 38
Missing data (excluding automatic spans/zeros and background checks) for all stations are
explained in the “Valid Data Exception Report” spreadsheets in the “TransCity Legacy Way
Monthly Data Report_August 2015.xls” file, as well as in Tables 23-26.
3.0 Air Quality Goals
The air quality goals and criteria for pollutants monitored at the TransCity Legacy Way ambient monitoring sites are based on the Coordinator- General’s report on project changes. The air quality goals goals and criteria are shown in Table 6
Table 6 and 7, for external ambient air monitoring and for ventilation outlet monitoring respectively.
Table 6: TransCity Legacy Way External Ambient Stations Air Quality Goals
Parameter Time Period Goal Level Units Maximum allowable
exceedences
CO
8 hours (rolling,
based on 1 hour
averages)
11.0 mg/m3 1 day a year
NO2 1 hour 250 µg/m³ 1 day a year
NO2 1 year 62 µg/m³ None
PM10 1 day 50 µg/m³ 5 days a year
PM2.5 1 day 25 µg/m³ Advisory goal only, no
maximum
PM2.5 1 year 8 µg/m³ Advisory goal only, no
maximum

Legacy Way Air Monitoring Network
Report No: DAT9936
Transcity
Page 15 of 38
Table 7: TransCity Legacy Way Ventilation Outlet Stations Air Quality Criterias
Parameter Time Period Criteria Level Units
CO 1 hour 70.0 ppm
NO2 1 hour 2 mg/m3
PM10 1 hour 1 mg/m³

Legacy Way Air Monitoring Network
Report No: DAT9936
Transcity
Page 16 of 38
4.0 Calibrations and Maintenance
4.1. Units and Uncertainties
The uncertainties for each parameter have been determined by the manufacturer’s tolerance limits
of the equipment’s parameters, and by the data collection standard method.
The reported uncertainties are expanded uncertainties, calculated using coverage factors which give
a level of confidence of approximately 95%.
Table 8: Units and Uncertainties
Parameter Units Resolution Uncertainty Measurement Range2
NO, NOx (S40)
µg/m³ 1 µg/m³ ± 18.7 µg/m³
k factor of 2.01 0 to 669 µg/m³
mg/m3 0.001 mg/m3 ± 0.018 mg/m³
k factor of 2.01 0 to 0.669 mg/m³
NO2 (S40)
µg/m³ 1 µg/m³ ± 32.8 µg/m³
k factor of 2.01 0 to 1026 µg/m³
mg/m3 0.001 mg/m3 ± 0.033 mg/m³
k factor of 2.01 0 to 1.026 mg/m³
CO (S30)
ppm 0.1 ppm ± 1.1 ppm
k factor of 2.00 0 to 50 ppm
mg/m³ 0.1 ppm ± 1.4 mg/m³
k factor of 2.00 0 to 62 mg/m³
PM10, PM2.5
(BAM 1020) µg/m³ 1 µg/m³
3.57% of reading
k factor of 1.98 0 to 1000 µg/m³
PM10
(Fidas) mg/m³ 0.001 mg/m³ TBA 0 to 10 mg/m³
2 Uncertainties may not be calculated based on the full measurement range.
Legacy Way Air Monitoring Network
Report No: DAT9936
Transcity
Page 17 of 38
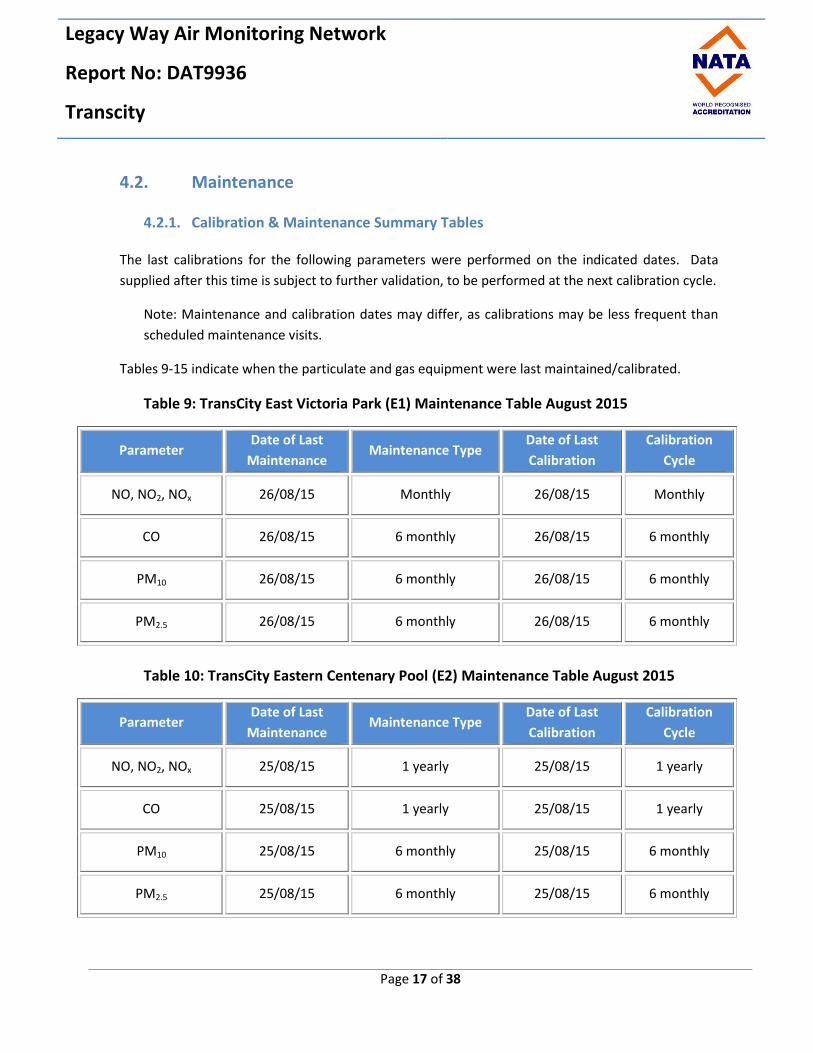
4.2. Maintenance
4.2.1. Calibration & Maintenance Summary Tables
The last calibrations for the following parameters were performed on the indicated dates. Data
supplied after this time is subject to further validation, to be performed at the next calibration cycle.
Note: Maintenance and calibration dates may differ, as calibrations may be less frequent than
scheduled maintenance visits.
Tables 9-15 indicate when the particulate and gas equipment were last maintained/calibrated.
Table 9: TransCity East Victoria Park (E1) Maintenance Table August 2015
Parameter Date of Last
Maintenance Maintenance Type
Date of Last
Calibration
Calibration
Cycle
NO, NO2, NOx 26/08/15 Monthly 26/08/15 Monthly
CO 26/08/15 6 monthly 26/08/15 6 monthly
PM10 26/08/15 6 monthly 26/08/15 6 monthly
PM2.5 26/08/15 6 monthly 26/08/15 6 monthly
Table 10: TransCity Eastern Centenary Pool (E2) Maintenance Table August 2015
Parameter Date of Last
Maintenance Maintenance Type
Date of Last
Calibration
Calibration
Cycle
NO, NO2, NOx 25/08/15 1 yearly 25/08/15 1 yearly
CO 25/08/15 1 yearly 25/08/15 1 yearly
PM10 25/08/15 6 monthly 25/08/15 6 monthly
PM2.5 25/08/15 6 monthly 25/08/15 6 monthly

Legacy Way Air Monitoring Network
Report No: DAT9936
Transcity
Page 18 of 38
Table 11: TransCity West Anzac Park (W1) Maintenance Table August 2015
Parameter Date of Last
Maintenance Maintenance Type
Date of Last
Calibration
Calibration
Cycle
NO, NO2, NOx 27/08/15 6 monthly 27/08/15 6 monthly
CO 27/08/15 6 monthly 27/08/15 6 monthly
PM10 27/08/15 6 monthly 27/08/15 6 monthly
PM2.5 27/08/15 6 monthly 27/08/15 6 monthly
Table 12: TransCity West Botanic Gardens (W2) Maintenance Table August 2015
Parameter Date of Last
Maintenance Maintenance Type
Date of Last
Calibration
Calibration
Cycle
NO, NO2, NOx 26/08/15 6 monthly 26/08/15 6 monthly
CO 26/08/15 6 monthly 26/08/15 6 monthly
PM10 26/08/15 6 monthly 26/08/15 6 monthly
PM2.5 26/08/15 6 monthly 26/08/15 6 monthly
Legacy Way Air Monitoring Network
Report No: DAT9936
Transcity
Page 19 of 38
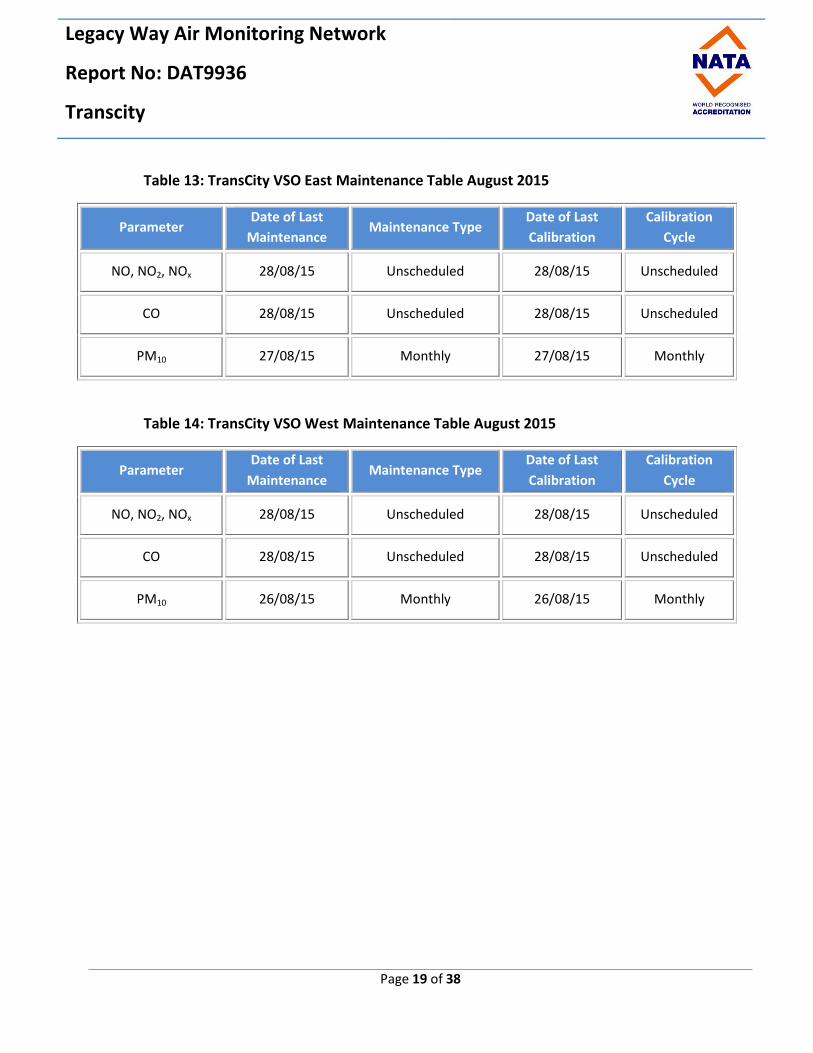
Table 13: TransCity VSO East Maintenance Table August 2015
Parameter Date of Last
Maintenance Maintenance Type
Date of Last
Calibration
Calibration
Cycle
NO, NO2, NOx 28/08/15 Unscheduled 28/08/15 Unscheduled
CO 28/08/15 Unscheduled 28/08/15 Unscheduled
PM10 27/08/15 Monthly 27/08/15 Monthly
Table 14: TransCity VSO West Maintenance Table August 2015
Parameter Date of Last
Maintenance Maintenance Type
Date of Last
Calibration
Calibration
Cycle
NO, NO2, NOx 28/08/15 Unscheduled 28/08/15 Unscheduled
CO 28/08/15 Unscheduled 28/08/15 Unscheduled
PM10 26/08/15 Monthly 26/08/15 Monthly
Legacy Way Air Monitoring Network
Report No: DAT9936
Transcity
Page 20 of 38
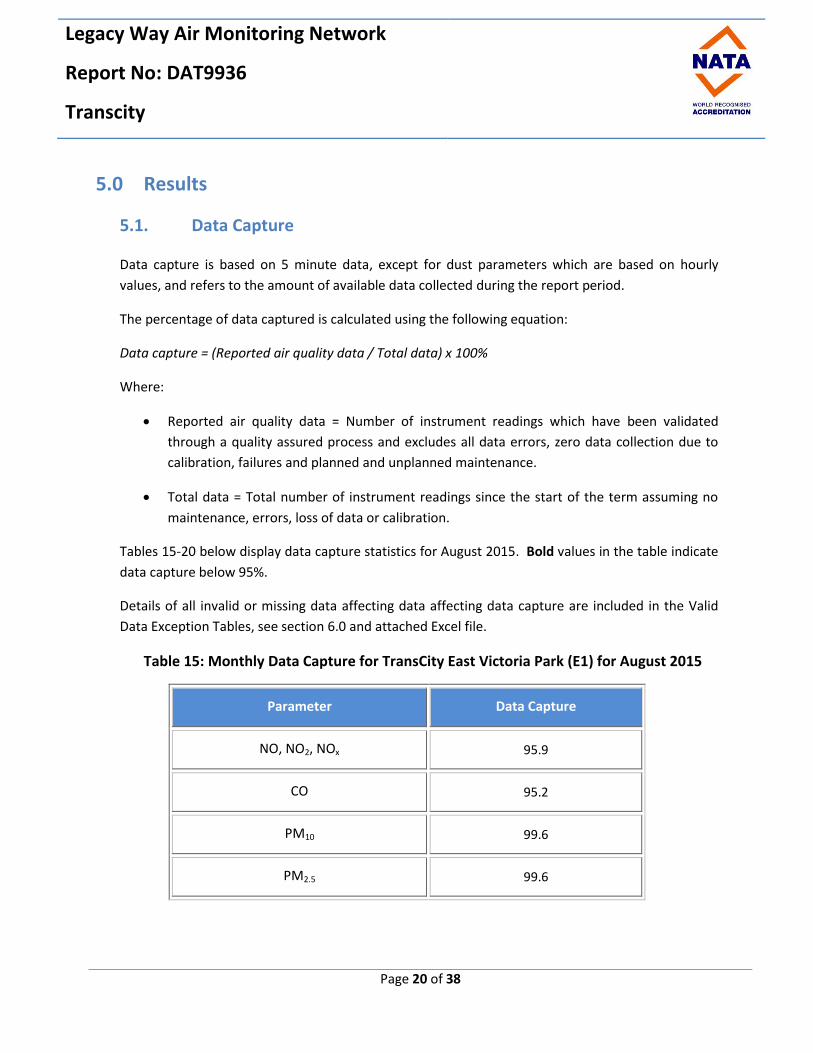
5.0 Results
5.1. Data Capture
Data capture is based on 5 minute data, except for dust parameters which are based on hourly
values, and refers to the amount of available data collected during the report period.
The percentage of data captured is calculated using the following equation:
Data capture = (Reported air quality data / Total data) x 100%
Where:
Reported air quality data = Number of instrument readings which have been validated
through a quality assured process and excludes all data errors, zero data collection due to
calibration, failures and planned and unplanned maintenance.
Total data = Total number of instrument readings since the start of the term assuming no
maintenance, errors, loss of data or calibration.
Tables 15-20 below display data capture statistics for August 2015. Bold values in the table indicate
data capture below 95%.
Details of all invalid or missing data affecting data affecting data capture are included in the Valid
Data Exception Tables, see section 6.0 and attached Excel file.
Table 15: Monthly Data Capture for TransCity East Victoria Park (E1) for August 2015
Parameter Data Capture
NO, NO2, NOx 95.9
CO 95.2
PM10 99.6
PM2.5 99.6
Legacy Way Air Monitoring Network
Report No: DAT9936
Transcity
Page 21 of 38
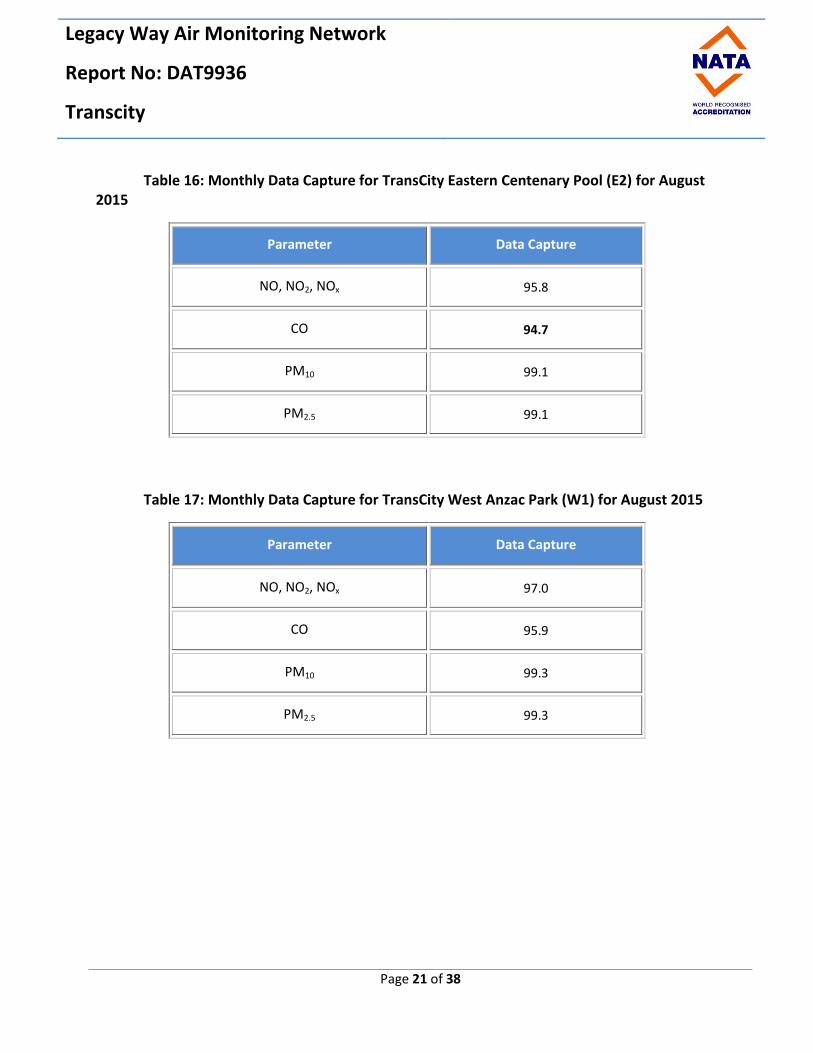
Table 16: Monthly Data Capture for TransCity Eastern Centenary Pool (E2) for August 2015
Parameter Data Capture
NO, NO2, NOx 95.8
CO 94.7
PM10 99.1
PM2.5 99.1
Table 17: Monthly Data Capture for TransCity West Anzac Park (W1) for August 2015
Parameter Data Capture
NO, NO2, NOx 97.0
CO 95.9
PM10 99.3
PM2.5 99.3
Legacy Way Air Monitoring Network
Report No: DAT9936
Transcity
Page 22 of 38
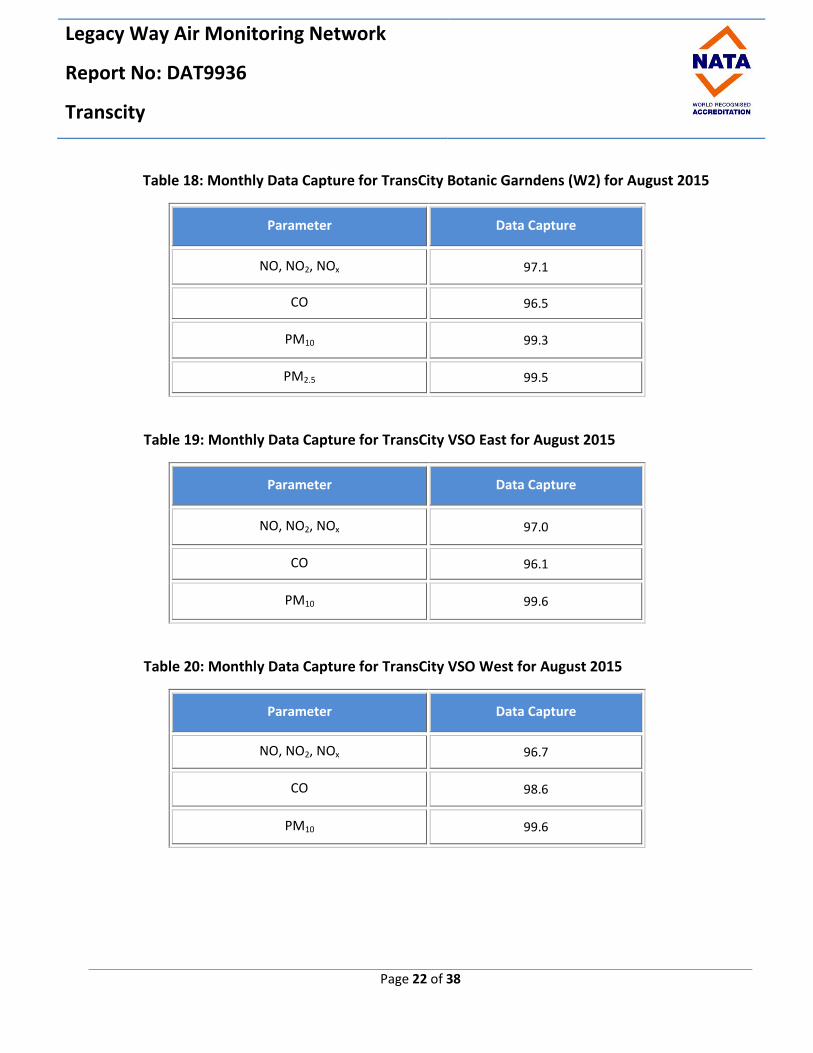
Table 18: Monthly Data Capture for TransCity Botanic Garndens (W2) for August 2015
Parameter Data Capture
NO, NO2, NOx 97.1
CO 96.5
PM10 99.3
PM2.5 99.5
Table 19: Monthly Data Capture for TransCity VSO East for August 2015
Parameter Data Capture
NO, NO2, NOx 97.0
CO 96.1
PM10 99.6
Table 20: Monthly Data Capture for TransCity VSO West for August 2015
Parameter Data Capture
NO, NO2, NOx 96.7
CO 98.6
PM10 99.6

Legacy Way Air Monitoring Network
Report No: DAT9936
Transcity
Page 23 of 38
5.2. Air Quality Monthly Summary
Table 21: TransCity East – Victoria Park (E1) Exceedences Recorded for August 2015
Parameter Time Period Value of
Exceedence
Date of
Exceedence
NO2 1 hour - -
CO 1 hour - -
PM10 24 hour - -
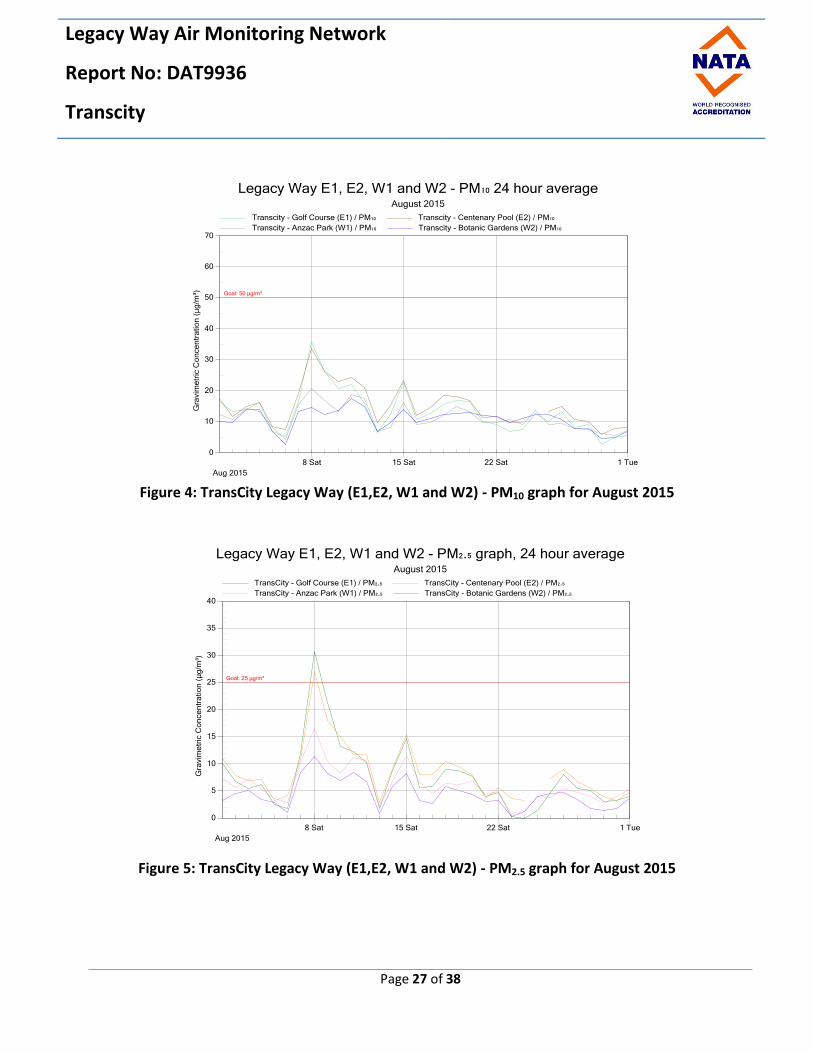
PM2.5 24 hour 31 µg/m3 08/08/15
Table 22: TransCity Eastern Centenary Pool (E2) Exceedences Recorded for August 2015
Parameter Time Period Value of
Exceedence
Date of
Exceedence
NO2 1 hour - -
CO 1 hour - -
PM10 24 hour - -
PM2.5 24 hour 27 µg/m3 08/08/15
Legacy Way Air Monitoring Network
Report No: DAT9936
Transcity
Page 24 of 38
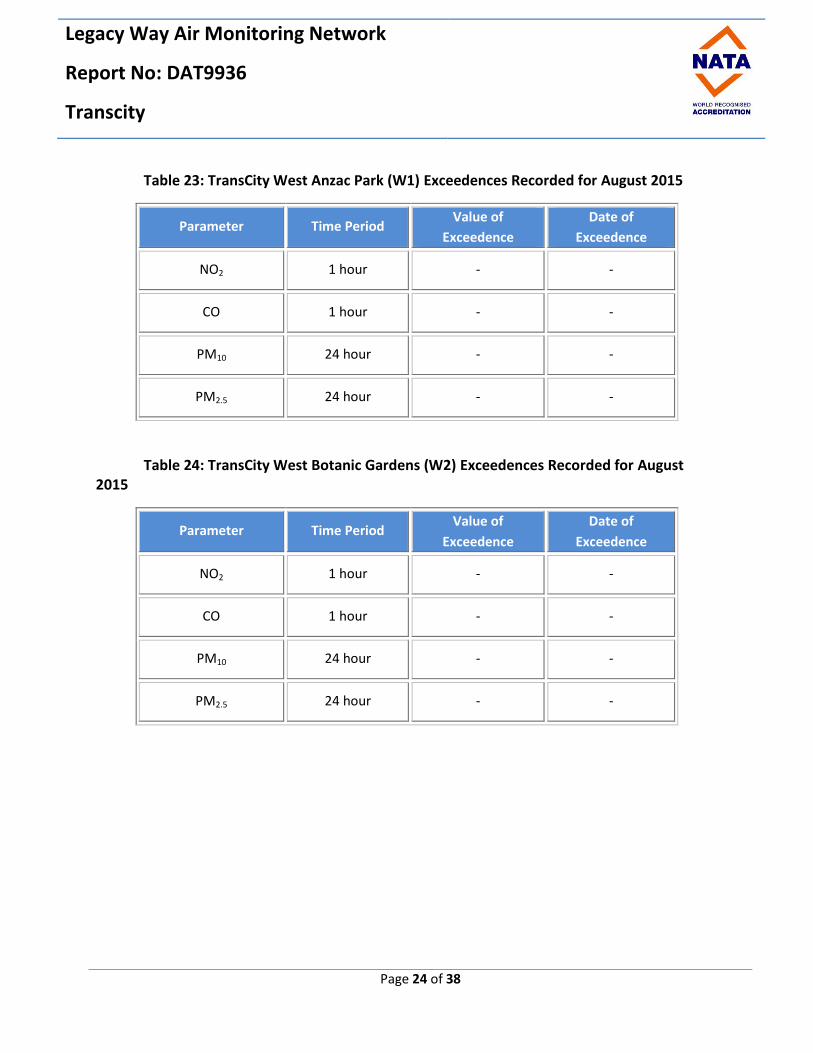
Table 23: TransCity West Anzac Park (W1) Exceedences Recorded for August 2015
Parameter Time Period Value of
Exceedence
Date of
Exceedence
NO2 1 hour - -
CO 1 hour - -
PM10 24 hour - -
PM2.5 24 hour - -
Table 24: TransCity West Botanic Gardens (W2) Exceedences Recorded for August 2015
Parameter Time Period Value of
Exceedence
Date of
Exceedence
NO2 1 hour - -
CO 1 hour - -
PM10 24 hour - -
PM2.5 24 hour - -

Legacy Way Air Monitoring Network
Report No: DAT9936
Transcity
Page 25 of 38
Table 25: TransCity VSO East Exceedences Recorded for August 2015
Parameter Time Period Value of
Exceedence
Date of
Exceedence
NO2 1 hour - -
CO 1 hour - -
PM10 1 hour - -
Table 26: TransCity VSO West Exceedences Recorded for August 2015
Parameter Time Period Value of
Exceedence
Date of
Exceedence
NO2 1 hour - -
CO 1 hour - -
PM10 1 hour - -
Legacy Way Air Monitoring Network
Report No: DAT9936
Transcity
Page 26 of 38
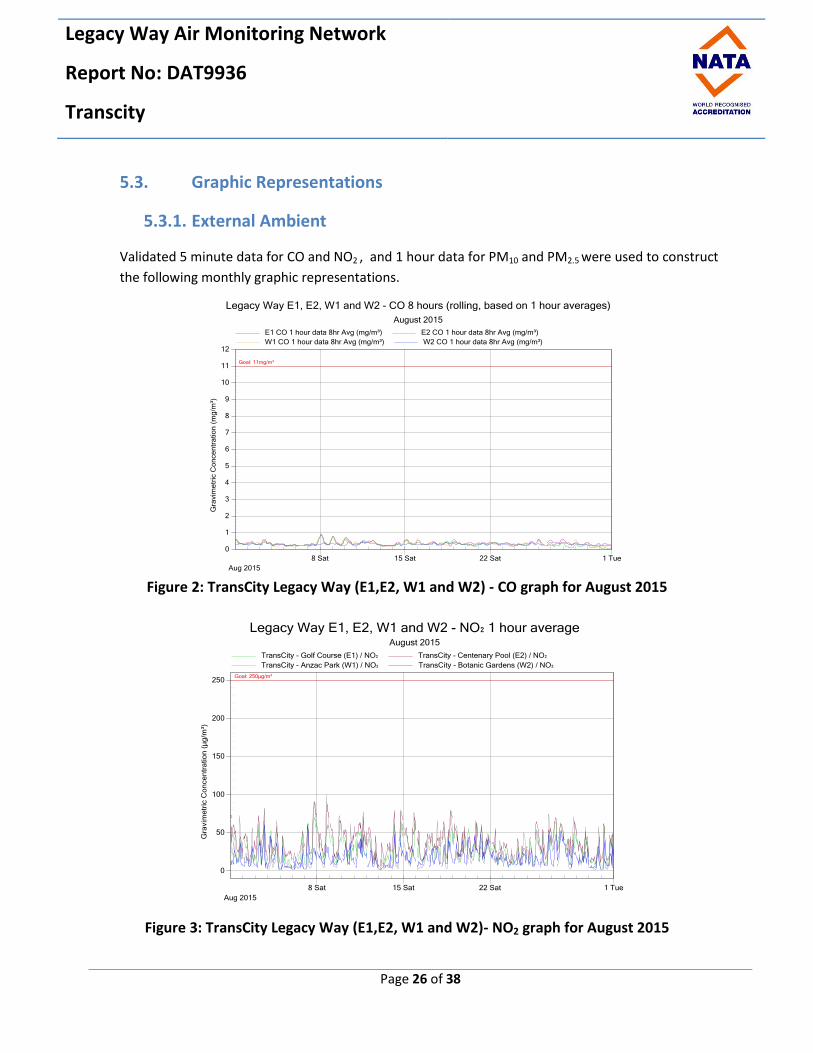
5.3. Graphic Representations
5.3.1. External Ambient
Validated 5 minute data for CO and NO2 , and 1 hour data for PM10 and PM2.5 were used to construct
the following monthly graphic representations.
Figure 2: TransCity Legacy Way (E1,E2, W1 and W2) - CO graph for August 2015
Figure 3: TransCity Legacy Way (E1,E2, W1 and W2)- NO2 graph for August 2015
Legacy Way Air Monitoring Network
Report No: DAT9936
Transcity
Page 27 of 38
Figure 4: TransCity Legacy Way (E1,E2, W1 and W2) - PM10 graph for August 2015
Figure 5: TransCity Legacy Way (E1,E2, W1 and W2) - PM2.5 graph for August 2015
Legacy Way Air Monitoring Network
Report No: DAT9936
Transcity
Page 28 of 38
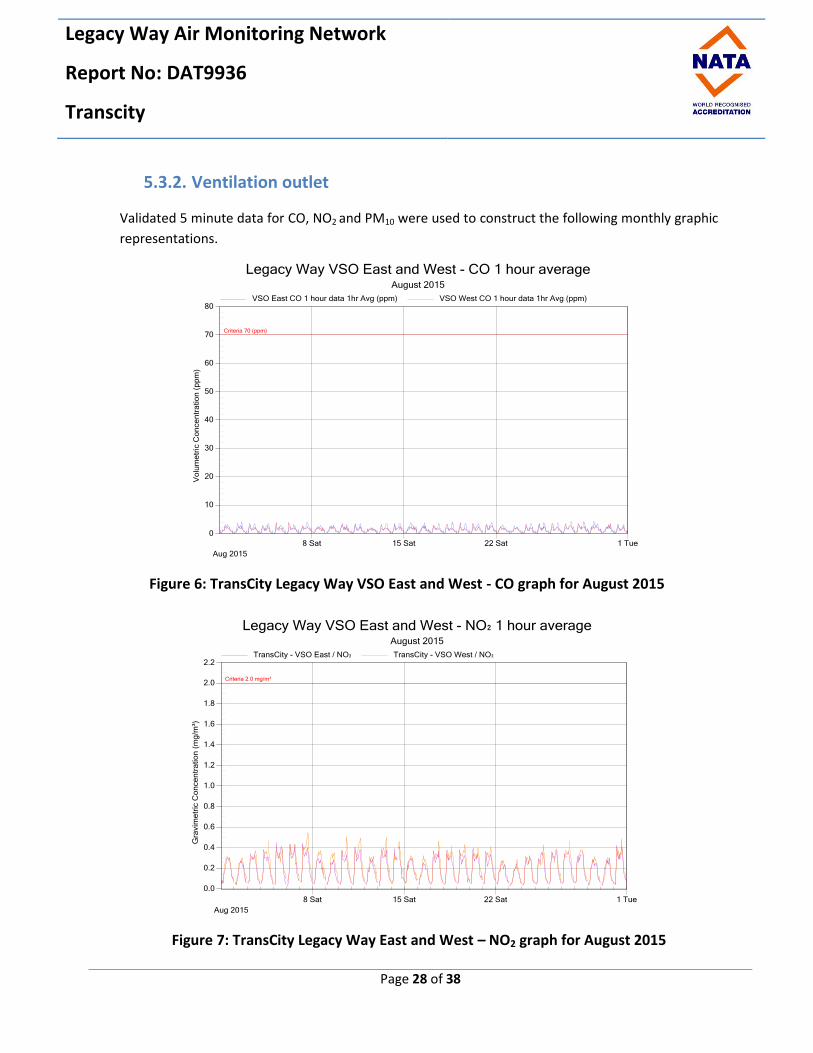
5.3.2. Ventilation outlet
Validated 5 minute data for CO, NO2 and PM10 were used to construct the following monthly graphic
representations.
Figure 6: TransCity Legacy Way VSO East and West - CO graph for August 2015
Figure 7: TransCity Legacy Way East and West – NO2 graph for August 2015

Legacy Way Air Monitoring Network
Report No: DAT9936
Transcity
Page 29 of 38
Figure 8: TransCity Legacy Way East and West – PM10 graph for August 2015

Legacy Way Air Monitoring Network
Report No: DAT9936
Transcity
Page 30 of 38
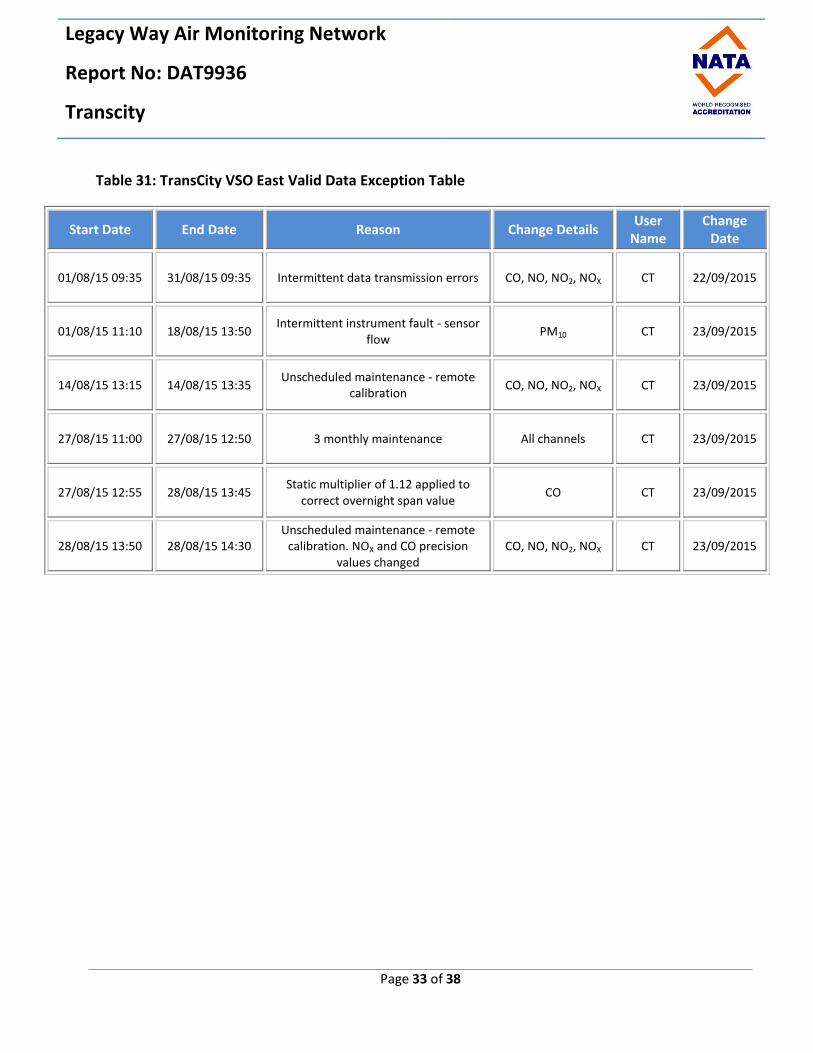
6.0 Valid Data Exception Tables
Tables 27 to 32 below detail all changes made to the raw data set during the validation process. An
explanation of reasons given in the table can be found in Appendix 2.
Table 27: TransCity East – Victoria Park (E1) Valid Data Exception Table
Start Date End Date Reason Change Details
User Name
Change Date
03/08/15 06:15 31/08/15 06:30 Intermittent data transmission errors CO, NO, NO2,
NOX CT 21/09/2015
06/08/15 05:00 06/08/15 09:45 Instrument fault - in calibration mode CO, NO, NO2,
NOX CT 21/09/2015
06/08/15 13:35 06/08/15 14:20 Unscheduled maintenance - fixed
instrument CO, NO, NO2,
NOX CT 21/09/2015
14/08/15 13:40 14/08/15 16:35 Unscheduled maintenance - remote
calibration CO, NO, NO2,
NOX CT 21/09/2015
26/08/15 06:00 26/08/15 08:00 6 monthly maintenance PM2.5, PM10 CT 22/09/2015
26/08/15 06:45 26/08/15 09:25 6 monthly maintenance CO, NO, NO2,
NOX CT 21/09/2015
Legacy Way Air Monitoring Network
Report No: DAT9936
Transcity
Page 31 of 38
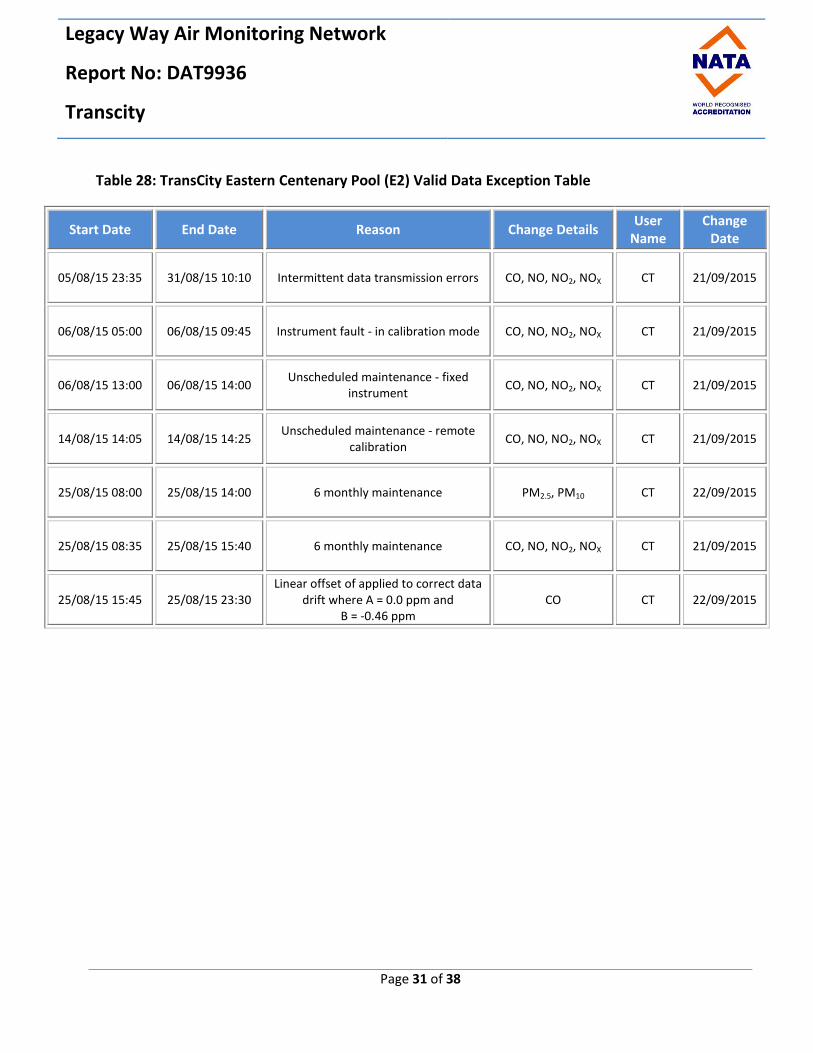
Table 28: TransCity Eastern Centenary Pool (E2) Valid Data Exception Table
Start Date End Date Reason Change Details User
Name Change
Date
05/08/15 23:35 31/08/15 10:10 Intermittent data transmission errors CO, NO, NO2, NOX CT 21/09/2015
06/08/15 05:00 06/08/15 09:45 Instrument fault - in calibration mode CO, NO, NO2, NOX CT 21/09/2015
06/08/15 13:00 06/08/15 14:00 Unscheduled maintenance - fixed
instrument CO, NO, NO2, NOX CT 21/09/2015
14/08/15 14:05 14/08/15 14:25 Unscheduled maintenance - remote
calibration CO, NO, NO2, NOX CT 21/09/2015
25/08/15 08:00 25/08/15 14:00 6 monthly maintenance PM2.5, PM10 CT 22/09/2015
25/08/15 08:35 25/08/15 15:40 6 monthly maintenance CO, NO, NO2, NOX CT 21/09/2015
25/08/15 15:45 25/08/15 23:30 Linear offset of applied to correct data
drift where A = 0.0 ppm and B = -0.46 ppm
CO CT 22/09/2015
Legacy Way Air Monitoring Network
Report No: DAT9936
Transcity
Page 32 of 38
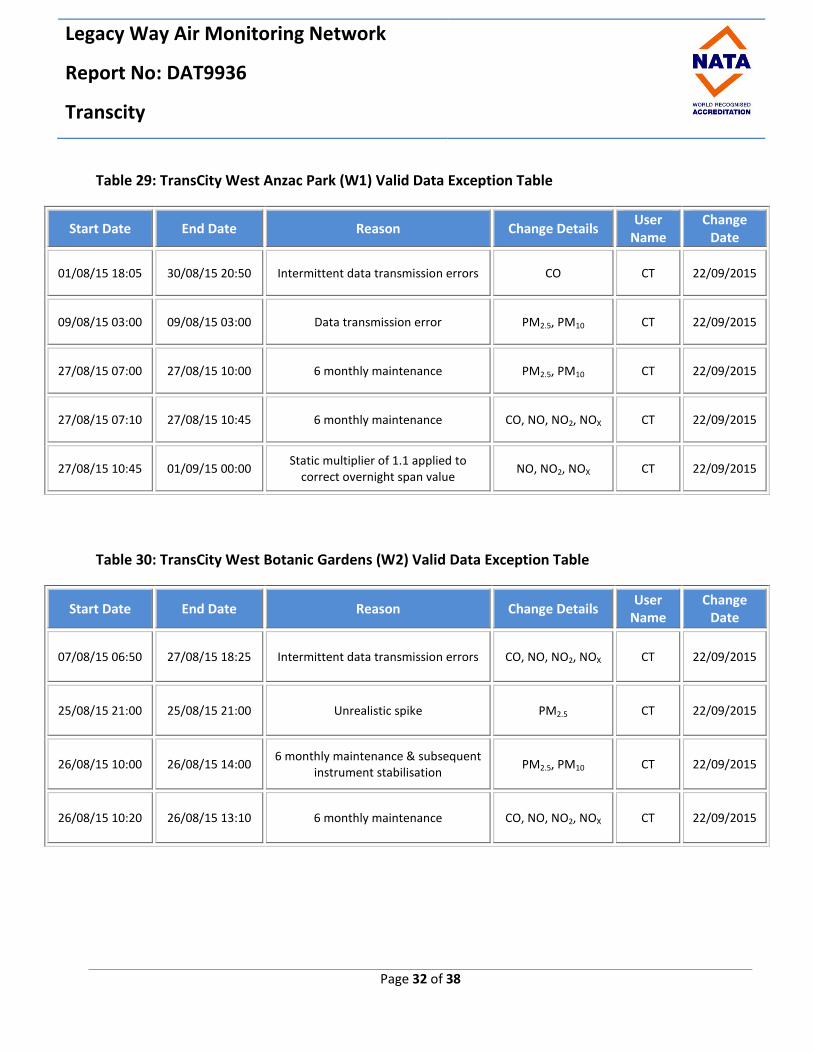
Table 29: TransCity West Anzac Park (W1) Valid Data Exception Table
Start Date End Date Reason Change Details User
Name Change
Date
01/08/15 18:05 30/08/15 20:50 Intermittent data transmission errors CO CT 22/09/2015
09/08/15 03:00 09/08/15 03:00 Data transmission error PM2.5, PM10 CT 22/09/2015
27/08/15 07:00 27/08/15 10:00 6 monthly maintenance PM2.5, PM10 CT 22/09/2015
27/08/15 07:10 27/08/15 10:45 6 monthly maintenance CO, NO, NO2, NOX CT 22/09/2015
27/08/15 10:45 01/09/15 00:00 Static multiplier of 1.1 applied to
correct overnight span value NO, NO2, NOX CT 22/09/2015
Table 30: TransCity West Botanic Gardens (W2) Valid Data Exception Table
Start Date End Date Reason Change Details User
Name Change
Date
07/08/15 06:50 27/08/15 18:25 Intermittent data transmission errors CO, NO, NO2, NOX CT 22/09/2015
25/08/15 21:00 25/08/15 21:00 Unrealistic spike PM2.5 CT 22/09/2015
26/08/15 10:00 26/08/15 14:00 6 monthly maintenance & subsequent
instrument stabilisation PM2.5, PM10 CT 22/09/2015
26/08/15 10:20 26/08/15 13:10 6 monthly maintenance CO, NO, NO2, NOX CT 22/09/2015
Legacy Way Air Monitoring Network
Report No: DAT9936
Transcity
Page 33 of 38
Table 31: TransCity VSO East Valid Data Exception Table
Start Date End Date Reason Change Details User
Name Change
Date
01/08/15 09:35 31/08/15 09:35 Intermittent data transmission errors CO, NO, NO2, NOX CT 22/09/2015
01/08/15 11:10 18/08/15 13:50 Intermittent instrument fault - sensor
flow PM10 CT 23/09/2015
14/08/15 13:15 14/08/15 13:35 Unscheduled maintenance - remote
calibration CO, NO, NO2, NOX CT 23/09/2015
27/08/15 11:00 27/08/15 12:50 3 monthly maintenance All channels CT 23/09/2015
27/08/15 12:55 28/08/15 13:45 Static multiplier of 1.12 applied to
correct overnight span value CO CT 23/09/2015
28/08/15 13:50 28/08/15 14:30 Unscheduled maintenance - remote
calibration. NOX and CO precision values changed
CO, NO, NO2, NOX CT 23/09/2015
Legacy Way Air Monitoring Network
Report No: DAT9936
Transcity
Page 34 of 38
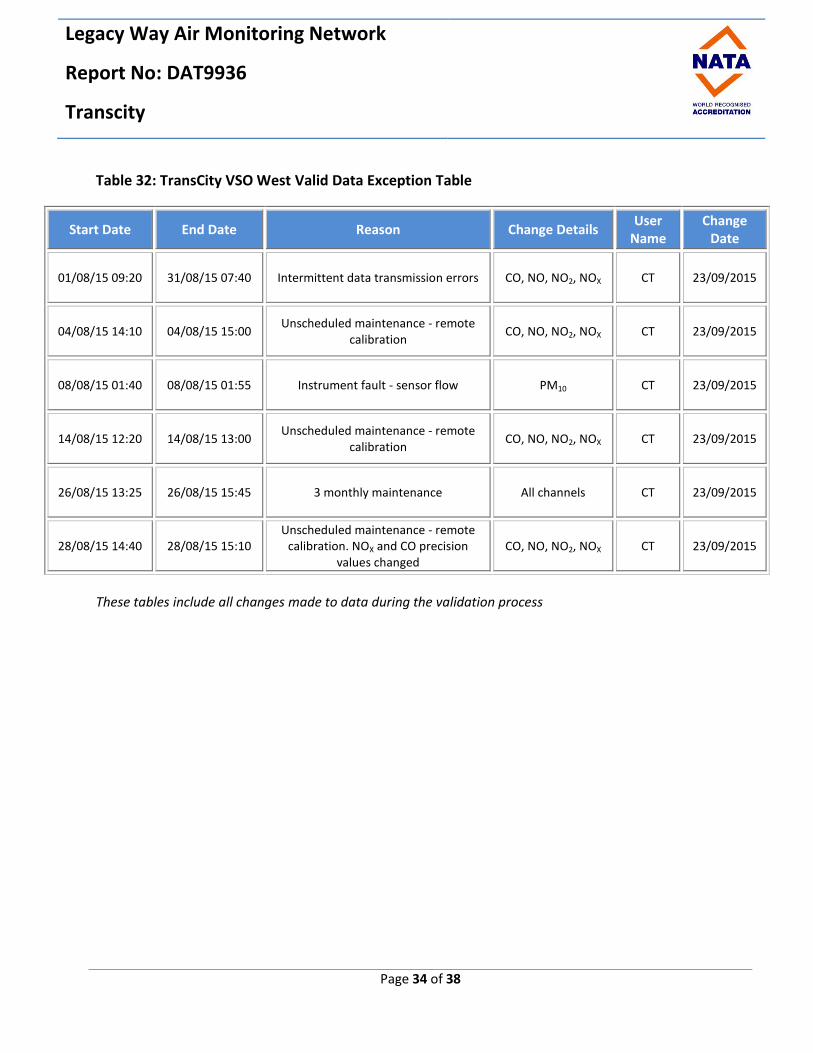
Table 32: TransCity VSO West Valid Data Exception Table
Start Date End Date Reason Change Details User
Name Change
Date
01/08/15 09:20 31/08/15 07:40 Intermittent data transmission errors CO, NO, NO2, NOX CT 23/09/2015
04/08/15 14:10 04/08/15 15:00 Unscheduled maintenance - remote
calibration CO, NO, NO2, NOX CT 23/09/2015
08/08/15 01:40 08/08/15 01:55 Instrument fault - sensor flow PM10 CT 23/09/2015
14/08/15 12:20 14/08/15 13:00 Unscheduled maintenance - remote
calibration CO, NO, NO2, NOX CT 23/09/2015
26/08/15 13:25 26/08/15 15:45 3 monthly maintenance All channels CT 23/09/2015
28/08/15 14:40 28/08/15 15:10 Unscheduled maintenance - remote
calibration. NOX and CO precision values changed
CO, NO, NO2, NOX CT 23/09/2015
These tables include all changes made to data during the validation process

Legacy Way Air Monitoring Network
Report No: DAT9936
Transcity
Page 35 of 38
7.0 Report Summary
Percentage availability for all parameters at TransCity Legacy Way East Victoria Park (E1),
West Anzac Park (W1), West Botanic Gardens (W2), VSO East and VSO West was above 95%
for the reporting month.
Percentage availability for most parameters at TransCity Legacy Way Eastern Centenary Pool
(E2), was above 95% for the reporting month. CO data at Anzac Park fell slightly below 95%
due to the amount of maintenance performed to the instrument.
There were 2 exceedences of the air quality limits at TransCity Legacy Way Monitoring
Network for the reporting month
------------------------------------------------END OF REPORT------------------------------------------------
Legacy Way Air Monitoring Network
Report No: DAT9936
Transcity
Page 36 of 38
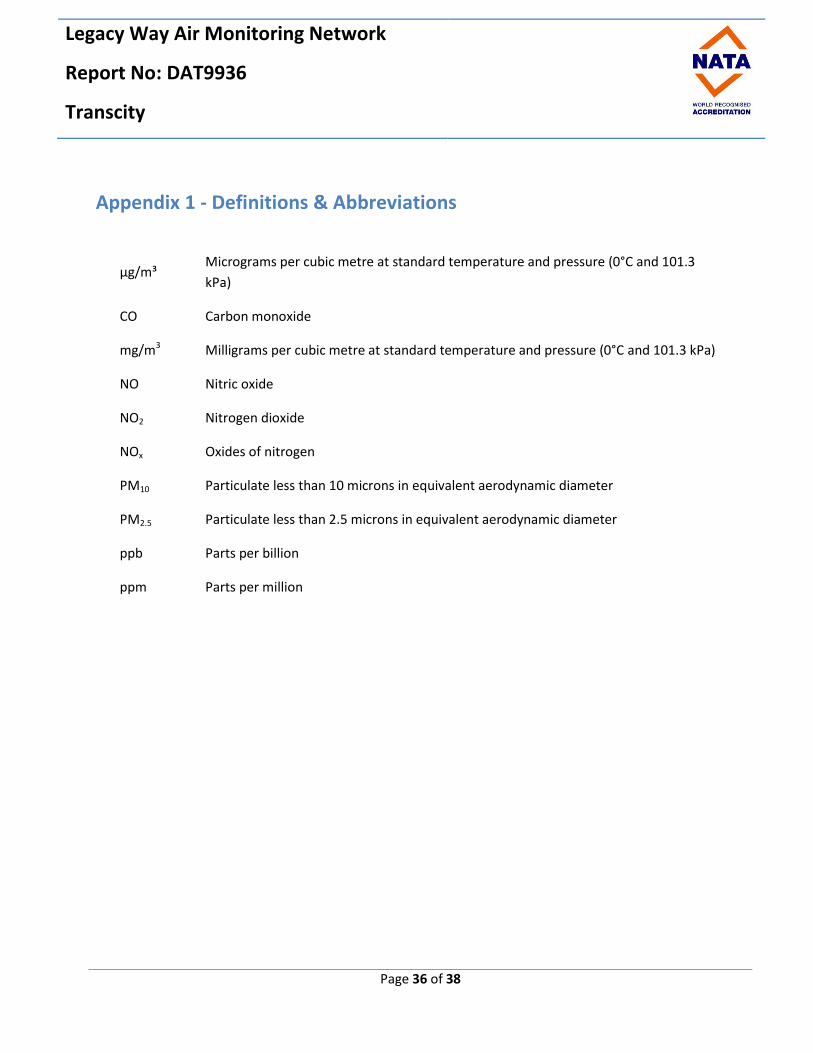
Appendix 1 - Definitions & Abbreviations
µg/m³ Micrograms per cubic metre at standard temperature and pressure (0°C and 101.3
kPa)
CO Carbon monoxide
mg/m3
NO
Milligrams per cubic metre at standard temperature and pressure (0°C and 101.3 kPa)
Nitric oxide
NO2 Nitrogen dioxide
NOx Oxides of nitrogen
PM10 Particulate less than 10 microns in equivalent aerodynamic diameter
PM2.5 Particulate less than 2.5 microns in equivalent aerodynamic diameter
ppb Parts per billion
ppm Parts per million

Legacy Way Air Monitoring Network
Report No: DAT9936
Transcity
Page 37 of 38
Appendix 2 - Explanation of Exception Table Automatic filter tape advance refers to the movement of the filter paper by the analyser to an un-
used spot.
Automatic background check refers to when analyser samples zero air and measures the level of
the concentration voltage. This voltage is taken as the zero signal level and this value is subtracted
from any subsequent readings as an active zero compensation. This is the analyser’s fine zero
measurement.
Automatic span/zero check. The E-Sampler is programmed to perform a zero calibration check
whereby air is passed through filter element, removing particulates, before entering the sensor in
the analyser. Data is invalidated when these checks occur.
Beta count failure refers to a fault in the functioning of the EBAM. A one minute beta count was less
than the maximum acceptable counts during operation.
Calibration check outside tolerance refers to when the calibration values are outside the tolerance
limits set for the precision check.
Calibration correction factor applied to data refers to an offset or multiplier applied to the data.
This operation may be performed for a number of reasons including: (a) when a clear trend / drift
outside the tolerance limit can be demonstrated by repeated operation precision checks, (b) when a
correction is required on previously logged data due to a calibration check being outside the
allowable tolerance
Commissioning refers to the initial setup and calibration of the instrument when it is first installed.
For some instruments there may be a stabilisation period before normal operation commences.
Data transmission error refers to a period of time when the instrument could not transmit data.
This may be due to interference, or a problem with the phone line or modem.
Equipment malfunction/instrument fault refers to a period of time when the instrument was not in
the normal operating mode and did not measure a representative value of the existing conditions.
Gap in data/data not available refers to a period of time when either data has been lost or could
not be collected.
Instrument Alarm refers to an alarm produced by the instrument. A range of alarms can be
produced depending on how operation of the instrument is being affected.
Legacy Way Air Monitoring Network
Report No: DAT9936
Transcity
Page 38 of 38
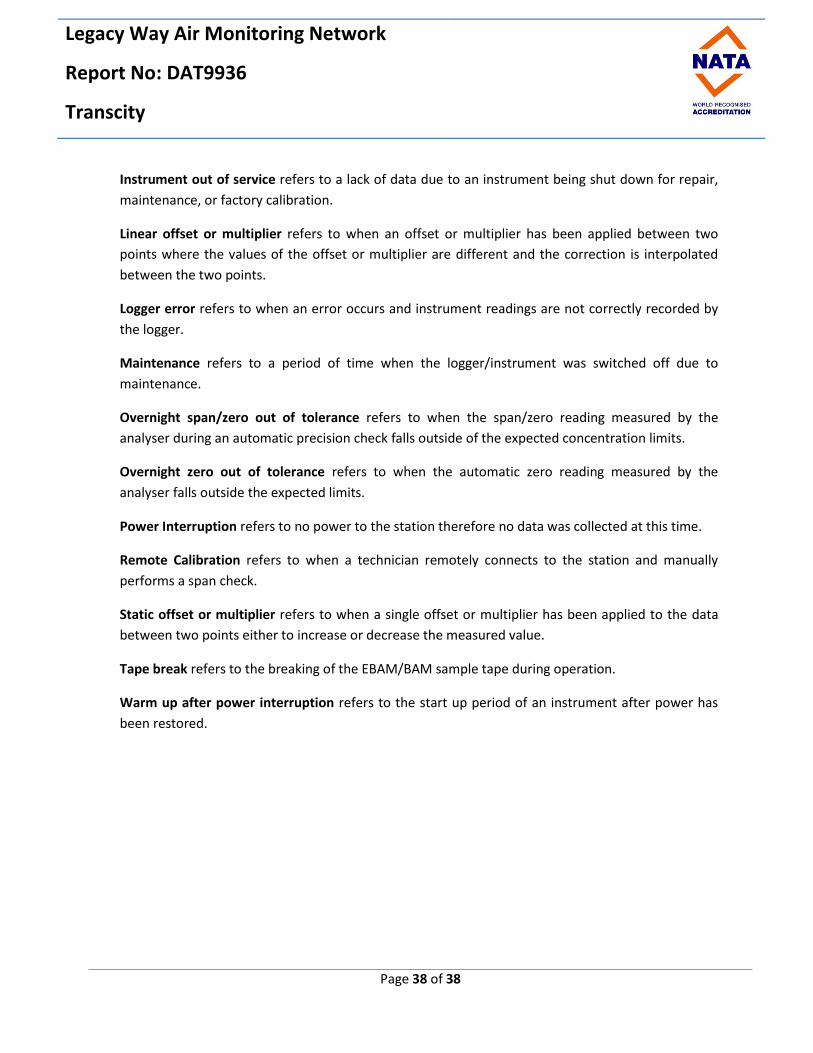
Instrument out of service refers to a lack of data due to an instrument being shut down for repair,
maintenance, or factory calibration.
Linear offset or multiplier refers to when an offset or multiplier has been applied between two
points where the values of the offset or multiplier are different and the correction is interpolated
between the two points.
Logger error refers to when an error occurs and instrument readings are not correctly recorded by
the logger.
Maintenance refers to a period of time when the logger/instrument was switched off due to
maintenance.
Overnight span/zero out of tolerance refers to when the span/zero reading measured by the
analyser during an automatic precision check falls outside of the expected concentration limits.
Overnight zero out of tolerance refers to when the automatic zero reading measured by the
analyser falls outside the expected limits.
Power Interruption refers to no power to the station therefore no data was collected at this time.
Remote Calibration refers to when a technician remotely connects to the station and manually
performs a span check.
Static offset or multiplier refers to when a single offset or multiplier has been applied to the data
between two points either to increase or decrease the measured value.
Tape break refers to the breaking of the EBAM/BAM sample tape during operation.
Warm up after power interruption refers to the start up period of an instrument after power has
been restored.