transas ecdis workbook - pfri.uniri.hrbrcic/downloads/2018_transas_ecdis_workbook.… · purpose:...
TRANSCRIPT

1
TRANSAS ECDIS
WORKBOOK
2
Copyright ©2011 Transas Marine Limited. All rights reserved.
The information contained herein is proprietary to Transas Marine Limited and shall not be duplicated in
whole or in part.
Every reasonable effort has been taken to ensure that the information contained in this manual is
complete, accurate and correct at the date of its issue. Nevertheless, Transas assumes no responsibility
for any error or omission and in no event shall Transas be liable for any loss of business or profit, or for
any direct or indirect, incidental or consequential damages arising out of any use of this manual.
Note: The information contained herein is subject to change without notice. Some information
contained in this manual may also be inaccurate due to the changes in the product since this version of
the manual was completed. As a reference for the correct handling of the product the original
documentation of the product should be used.

3
Table of Contents
Transas Navi-Sailor 4000 & ECDIS Demo ...................................................................................................... 5
Introduction .............................................................................................................................................. 5
Types of electronic charts ......................................................................................................................... 6
Questions 1 ........................................................................................................................................... 7
Basic Functions .......................................................................................................................................... 8
Monitor & Keyboard ............................................................................................................................. 8
Display Modes ....................................................................................................................................... 9
Cursor Modes ...................................................................................................................................... 10
Numerical Entries ................................................................................................................................ 11
Exercise 1 ............................................................................................................................................. 12
Control Panel ........................................................................................................................................... 13
Display Mode Panel Dropdown Menu .................................................................................................... 14
Setting Safety Parameters ....................................................................................................................... 15
Exercise 2 ............................................................................................................................................. 17
Alarms and Warnings .............................................................................................................................. 18
Customize the Display ............................................................................................................................. 21
Four shades vs. Two shade .................................................................................................................. 23
Basic Navigational Functions ................................................................................................................... 24
Ouestions 2.......................................................................................................................................... 26
Route Planning ........................................................................................................................................ 27
Questions 3 ......................................................................................................................................... 30
Exercise 3 ............................................................................................................................................. 31
Exercise 4 ............................................................................................................................................. 32
Exercise 5 ............................................................................................................................................. 33
Exercise 6 ............................................................................................................................................. 34
Route Monitoring .................................................................................................................................... 35
............................................................................................................................................................. 37
Ouestions 4.......................................................................................................................................... 37
Maps ........................................................................................................................................................ 38
Exercise 7 ............................................................................................................................................. 42
Risk of Overreliance ................................................................................................................................ 43
Ouestions 5.......................................................................................................................................... 49
Chart Assistant ............................................................................................................................................ 50
4
Introduction ............................................................................................................................................ 50
How to do your settings .......................................................................................................................... 51
Install your Chart & License..................................................................................................................... 53
Order Chart Licenses by Route ................................................................................................................ 57
Update via CD .......................................................................................................................................... 63
Obtaining Chart Correction ..................................................................................................................... 66
How to use the official chart corrections ................................................................................................ 68
Update via Email ..................................................................................................................................... 69
Answers to Exercises and Questions ....................................................................................................... 74
Questions 1 ......................................................................................................................................... 74
Exercise 1 ............................................................................................................................................. 74
Exercise 2 ............................................................................................................................................. 75
Questions 2 ......................................................................................................................................... 76
Questions 3 ......................................................................................................................................... 76
Exercise 5 ............................................................................................................................................. 77
Exercise 6 ............................................................................................................................................. 77
Questions 4 ......................................................................................................................................... 78
Questions 5 ......................................................................................................................................... 78
5
Transas Navi-Sailor 4000 & ECDIS Demo
Introduction
Purpose:
The main goal of this ECDIS Demo Workbook is to provide the vessel’s crew with knowledge,
understanding and proficiency in the use of Navi-Sailor 4000 ECDIS and Chart Assistant Utility. It is
designed for getting started with the Basic Functions of Navi-Sailor 4000 Software and train usage with
the Try ECDIS Demo software.
Entry Standards:
The workbook is designated for nautical officers and other persons with responsible duties in navigation
work.
Those wishing to work with this material should have experience in performing chart and radar work
and should be able to practice all usual tasks concerning standard navigational procedures and
equipment. They should be familiar with standard computer, including elements such as windows,
trackballs, etc.

6
Types of electronic charts
There are different principal types of electronic charts on the market.
Raster (ARCS, Seafarer, BSB, NOS Geo):
A scanned paper chart is similar to a photograph (what you see is what you get).
Advantages:
• Inexpensive to produce for the hydrographic offices
• Similar to paper charts in lookalike and presentation
Disadvantages:
• “Dead charts”
• Limited zoom-options
• Requires large memory capacity
• Expensive to correct. Correction of a chart requires the whole chart to be replaced(a lot data)
Vector (TX-97, ENC, C-Map93, DNC, VPF):
Digitalized paper charts: every object is defined and grouped in layers that can be selected in ECDIS
within set safety parameters.
Advantages:
Optional information (customized settings)
Good zoom options
Easy to correct. Only the actual corrected object needs to be sent / received.
Requires little memory capacity (quick loading)
Information can be added (files, pictures etc.)
Disadvantages:
Expensive and time demanding production
Layout can be a bit different from paper charts
ENC-charts (Vector Charts):
The only approved chart type for an ECDIS system.
Official chart data supplied from the national hydrographic office in each country.
Distributed, validated and encrypted to S-63 by a few approved institutes (RENC).
The chart distributor (Transas) receives ENC data from the approved institute.
In return, the Hydrographic Office (HO) receives a royalty based on the number of sold charts.
The chart distributor must be certified by RENC.
There is a good coverage of ENC-charts today with the primary and important areas covered and the
majority of the world will be covered within the next or the following years.
7
SENC (System ENC):
SENC is an internal system format of ENC’s that is unique for each ECDIS vendor (e.g. Transas, Furuno,
Kelvin Hughes) and has its own SENC format.
Transas SENC can only be used in a Transas ECDIS just as Furuno’s SENC only can be used in a Furuno
ECDIS, etc.
Onboard conversion from ENC to SENC is very time-demanding and no errors can be corrected.
Transas converts the ENC data to Transas own SENC format and corrects occurred errors already before
it reaches the end-user. From an end-user's point of view the distribution of official data in a SENC
format has the major advantage that there is no compilation of data required onboard when installing
the data in the ECDIS system.
Not only does this save time (reduces the installation and correction time due to a 40% reduction of
data volume) but it also means that the navigator on the bridge is never faced with the problem of
handling errors that may arise in a compilation process.
The Transas SENC distribution is type approved by the DNV and IC-ENC.
The SENC collections include the same ENC data as PRIMAR Stavanger and IC-ENC.
TX-97 is a Transas own chart format.
TX-97 charts are not official charts, even though the TX-97 is made of ENC-data and has the same
accuracy, and cannot be used for paperless navigation.
Questions 1
1. Which chart type is similar to the traditional paper chart?
2. Which chart type is capable of activating chart based alarms?
3. It is stated as advantage of vectorized charts to have good zoom option! Think about possible
disadvantages.
Answers to the questions can be found on page 74
8
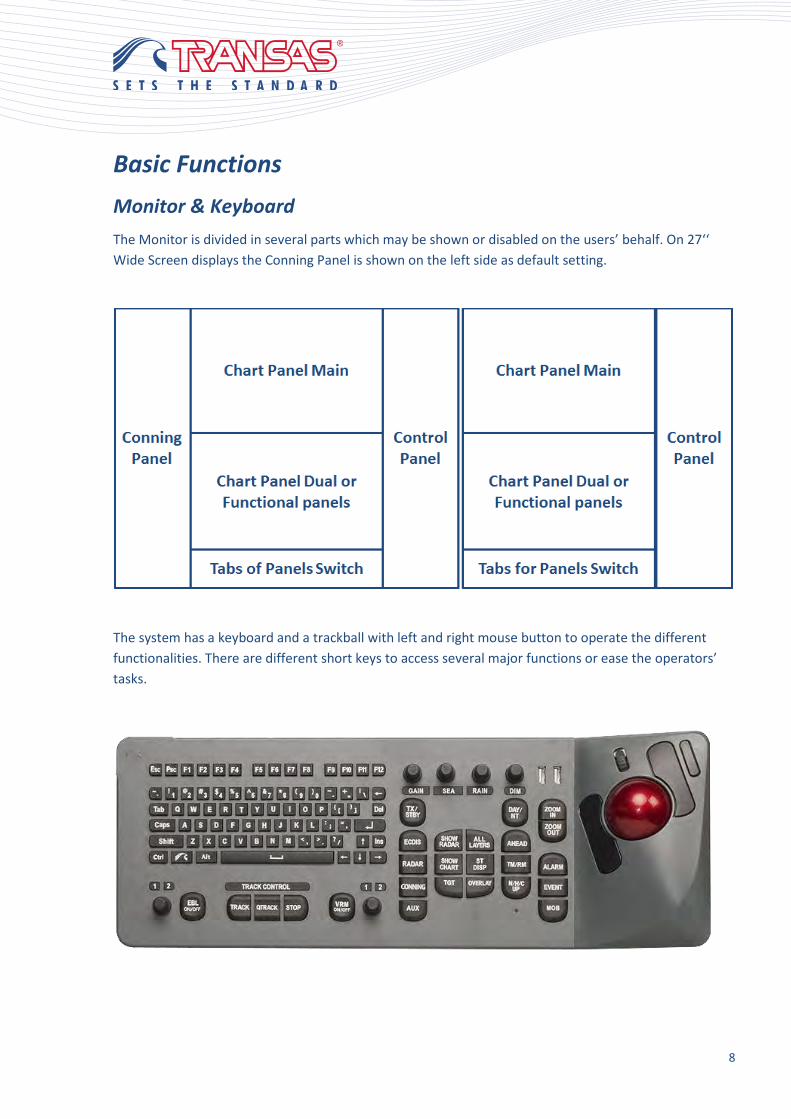
Basic Functions
Monitor & Keyboard
The Monitor is divided in several parts which may be shown or disabled on the users’ behalf. On 27‘‘
Wide Screen displays the Conning Panel is shown on the left side as default setting.
The system has a keyboard and a trackball with left and right mouse button to operate the different
functionalities. There are different short keys to access several major functions or ease the operators’
tasks.
9
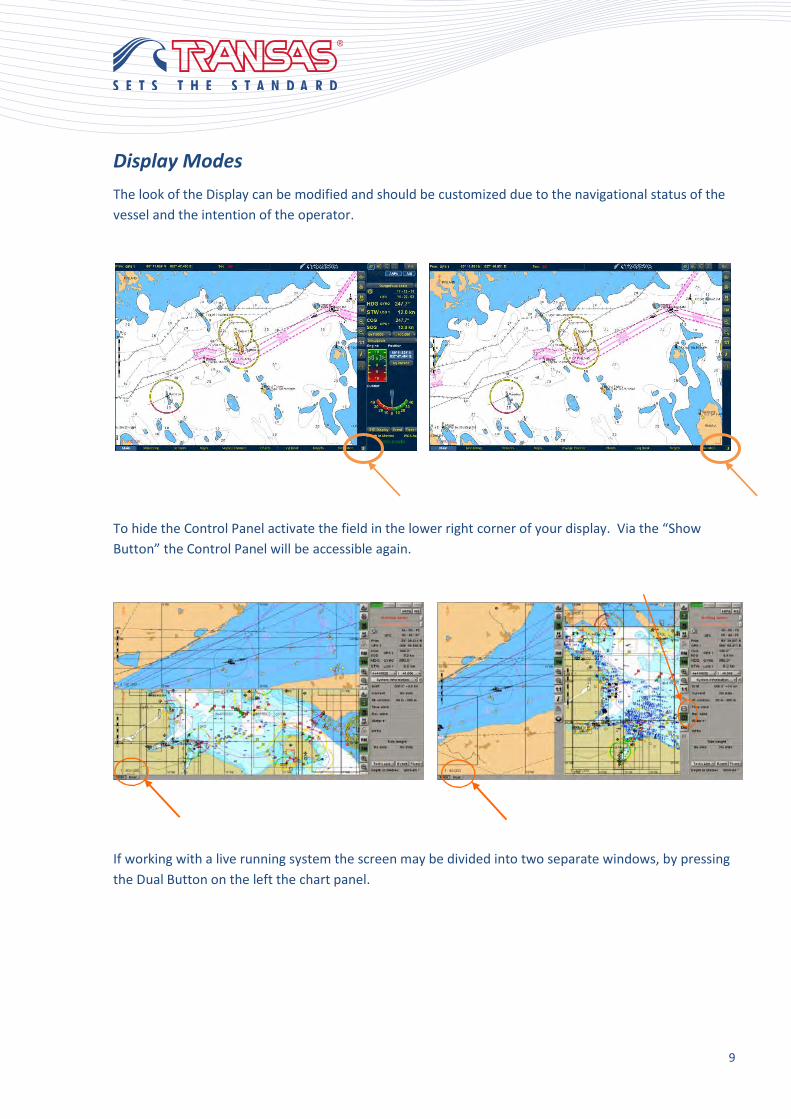
Display Modes
The look of the Display can be modified and should be customized due to the navigational status of the
vessel and the intention of the operator.
To hide the Control Panel activate the field in the lower right corner of your display. Via the “Show
Button” the Control Panel will be accessible again.
If working with a live running system the screen may be divided into two separate windows, by pressing
the Dual Button on the left the chart panel.
10
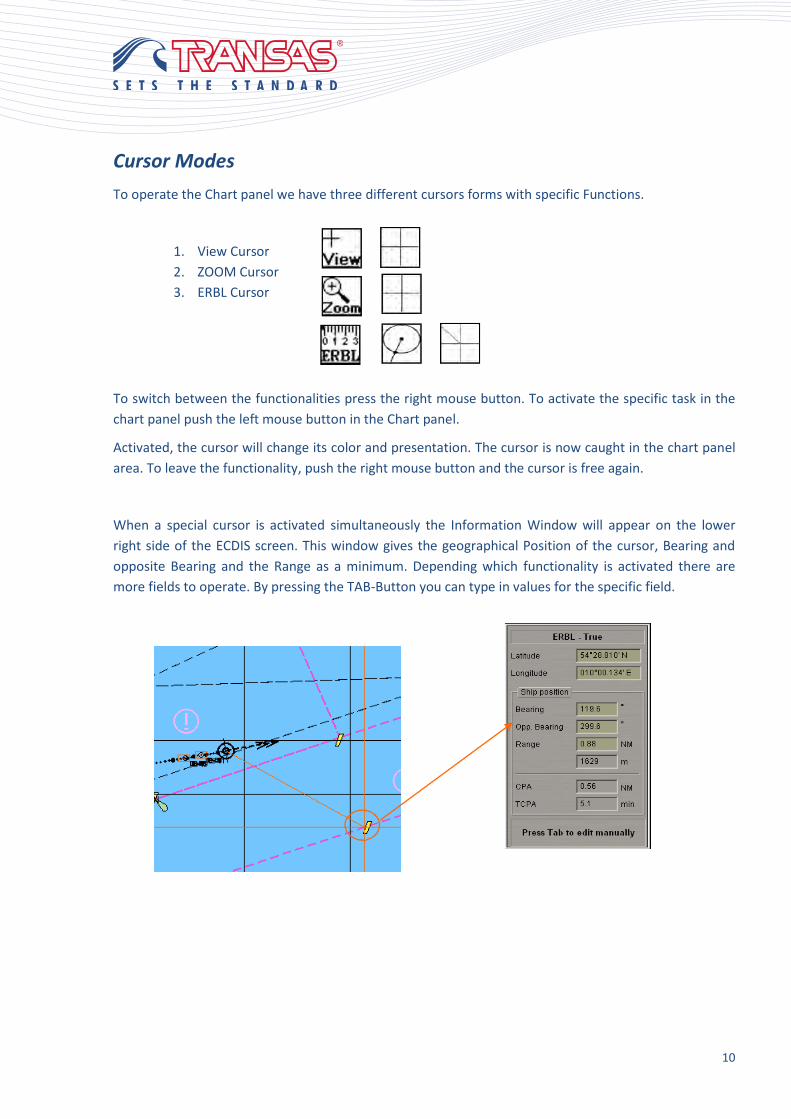
Cursor Modes
To operate the Chart panel we have three different cursors forms with specific Functions.
1. View Cursor
2. ZOOM Cursor
3. ERBL Cursor
To switch between the functionalities press the right mouse button. To activate the specific task in the
chart panel push the left mouse button in the Chart panel.
Activated, the cursor will change its color and presentation. The cursor is now caught in the chart panel
area. To leave the functionality, push the right mouse button and the cursor is free again.
When a special cursor is activated simultaneously the Information Window will appear on the lower
right side of the ECDIS screen. This window gives the geographical Position of the cursor, Bearing and
opposite Bearing and the Range as a minimum. Depending which functionality is activated there are
more fields to operate. By pressing the TAB-Button you can type in values for the specific field.
11
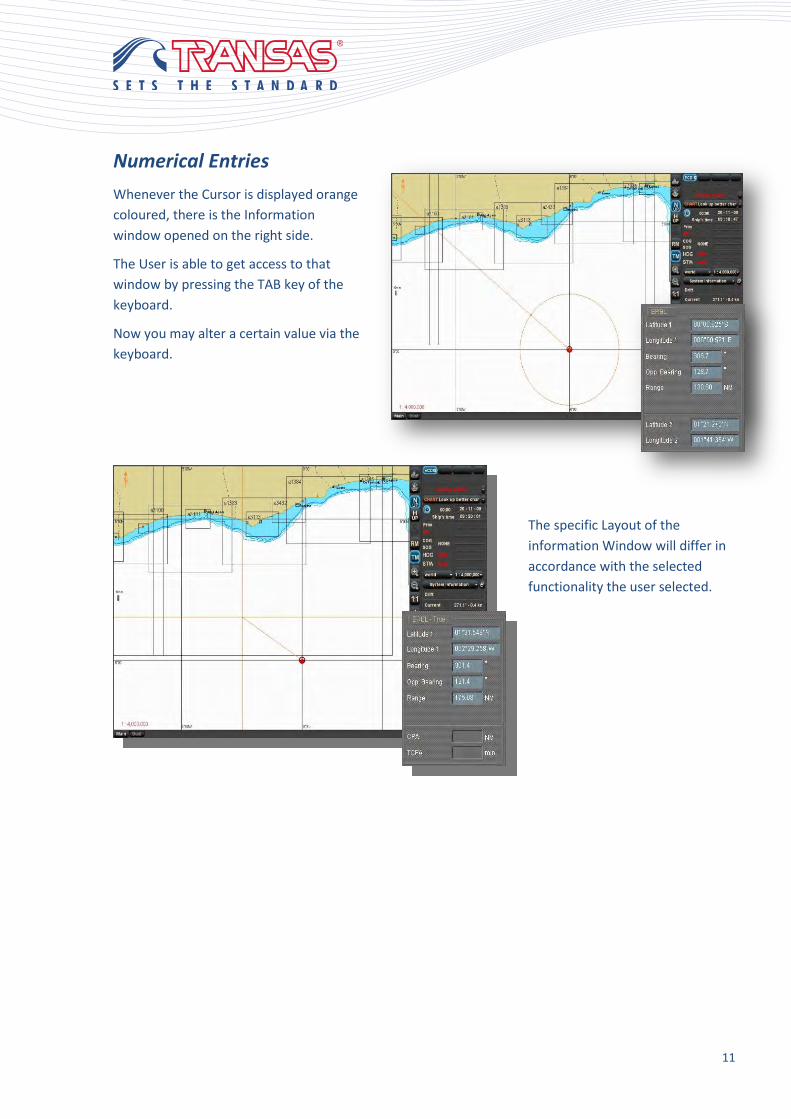
Numerical Entries
Whenever the Cursor is displayed orange
coloured, there is the Information
window opened on the right side.
The User is able to get access to that
window by pressing the TAB key of the
keyboard.
Now you may alter a certain value via the
keyboard.
The specific Layout of the
information Window will differ in
accordance with the selected
functionality the user selected.
12
Exercise 1
1. Activate the view cursor.
2. Enter the information window by pressing the TAB button.
3. Go to position 60°34.450` N 028° 25.390´E and watch how the cursor jumps to that position. You
will find a Lighthouse there. Read out the information concerning this Lighthouse using the
information cursor (Pick report). What can you find there?
4. Change to the zoom cursor and try how to handle by zooming in to a harbor starting from
position 60° 04.791´N 029°31.080´E. Which harbor you can find in vicinity?
5. Change to the ERBL cursor and measure the distance to the buoy in Position 54° 37.692´N 007°
55.182´E. What is the distance and which buoy you can expect (use also the information button
to find detailed information)?
6. Off center the ERBL cursor and measure the distance between two the buoy from Nr. 5 and the
southern cardinal buoy in south easterly direction. How far is it and in which direction is it
precisely?
Answers to the questions can be found on page 74
13
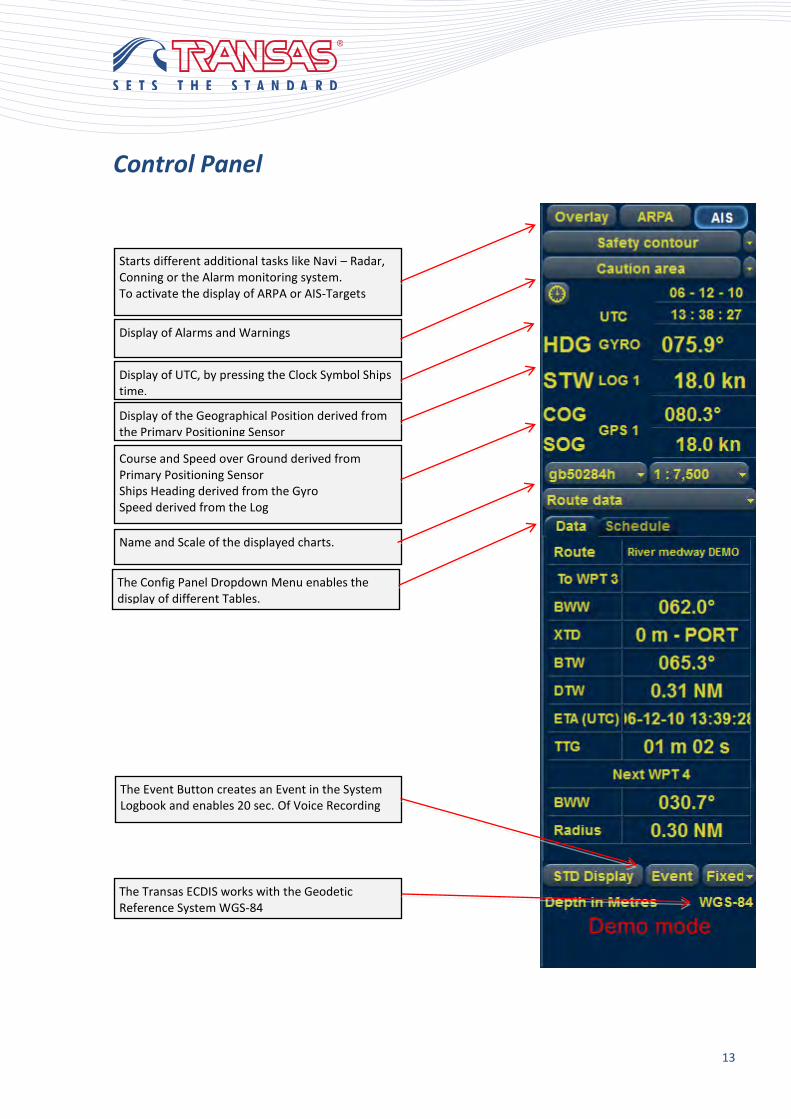
Control Panel
Starts different additional tasks like Navi – Radar, Conning or the Alarm monitoring system. To activate the display of ARPA or AIS-Targets
Display of Alarms and Warnings
Display of UTC, by pressing the Clock Symbol Ships time. Display of the Geographical Position derived from the Primary Positioning Sensor
Course and Speed over Ground derived from Primary Positioning Sensor Ships Heading derived from the Gyro Speed derived from the Log
Name and Scale of the displayed charts.
The Config Panel Dropdown Menu enables the display of different Tables.
The Transas ECDIS works with the Geodetic Reference System WGS-84
The Event Button creates an Event in the System Logbook and enables 20 sec. Of Voice Recording
14
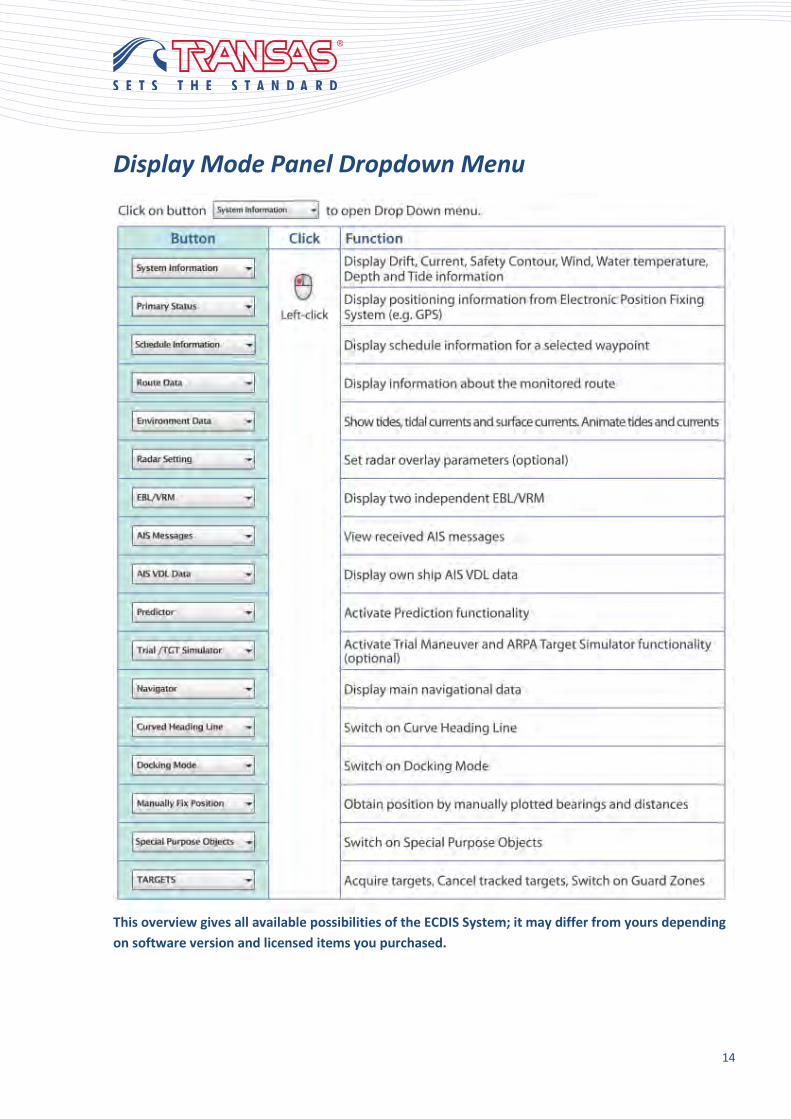
Display Mode Panel Dropdown Menu
This overview gives all available possibilities of the ECDIS System; it may differ from yours depending
on software version and licensed items you purchased.
15
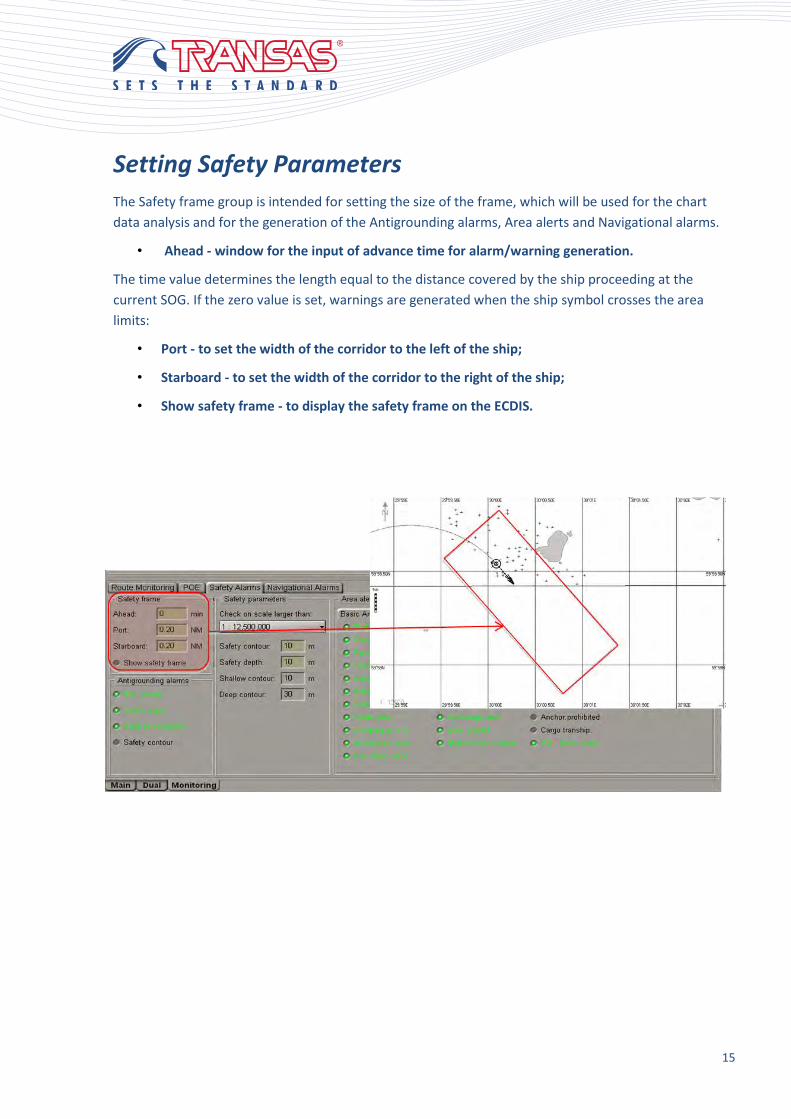
Setting Safety Parameters
The Safety frame group is intended for setting the size of the frame, which will be used for the chart
data analysis and for the generation of the Antigrounding alarms, Area alerts and Navigational alarms.
• Ahead - window for the input of advance time for alarm/warning generation.
The time value determines the length equal to the distance covered by the ship proceeding at the
current SOG. If the zero value is set, warnings are generated when the ship symbol crosses the area
limits:
• Port - to set the width of the corridor to the left of the ship;
• Starboard - to set the width of the corridor to the right of the ship;
• Show safety frame - to display the safety frame on the ECDIS.
16
Safety contour is a set value, which determined the safety contour depth.
The safety contour is highlighted on the ECDIS task screen with a bold line. Safety Contour parameter
cannot be larger than Safety Depth parameter. If, however, the operator sets a larger value, the same
value is automatically assigned to Safety Depth parameter. And the other way round, if an operator sets
a smaller value for the Safety Depth parameter, the same value is automatically assigned to Safety
Contour parameter. If, with a change of chart set under the ship position, the previously selected safety
contour becomes unavailable, Safety contour alarm is generated. In this case, the safety contour is
automatically set as equal to a deeper available depth contour.
Safety depth - operator-set value which, in the check of an area delimited with Safety frame, serves as
a criterion for classifying the detected depth as a danger to navigation.
A depth equal to or less than the Safety depth is highlighted on the ECDIS task screen in bold type
when the display of spot soundings is turned on. If such danger is detected, Nav. Danger alarm is
triggered off.
17
Exercise 2
1. Set the Safety contour and the Safety depth to the same value of 10m.
2. Use the View cursor and go to Position 01°11,120´N 103°47,639´ E read out the corresponding
information by using the Info cursor.
3. Set both values to 15m. What can be observed?
4. Can you see an unknown Symbol on your screen which is corresponding on your set values?
5. Go to Position 01°11,120´N 103°47,639´ E and read out the information by using the information
cursor. Which content is corresponding to the new symbol?
6. Now change the value of safety depth to 8m. What can be observed?
Answers to the questions can be found on page 75
18
Alarms and Warnings
Most of the Alarms are set at the Monitoring menu.
It depends on the navigational status of the vessel which Alarms make sense in being activated.
If the wrong settings are made Alarms may not be considered or may be acknowledged without paying
attention to it.
Special Alarms and Warnings for example:
• CPA Alarms
• End of Watch Alarm
• Waypoint and Route generated Alarms
are set and activated in the specific menu they are related to.
(TARGETS, CONFIG, MONITORING)
19
Alarms & Warnings are displayed in the Alarm Monitoring Window of
the Control Panel.
It contains:
Kind of Alarm/Source/Kind of error
They can be acknowledged via the mouse cursor or the Alarm button
on the dedicated keyboard.
Alarm Status Font Color Flashing Signal
Active unacknowledged Alarms Bold Red Yes Yes
Active unacknowledged Alarms Silent e.g.
ARPA
Bold Red Yes No
Active acknowledged Alarms Bold Red No No
Non-Active unacknowledged Alarms Normal Red Yes Yes
Non-Active acknowledged Alarms No No No No
Active unacknowledged Warnings Bold Orange Yes No
Active acknowledged Warnings Bold Orange No No
Non-Active unacknowledged Warnings Normal Orange Yes No
Non-Active acknowledged Warnings No No No No
20
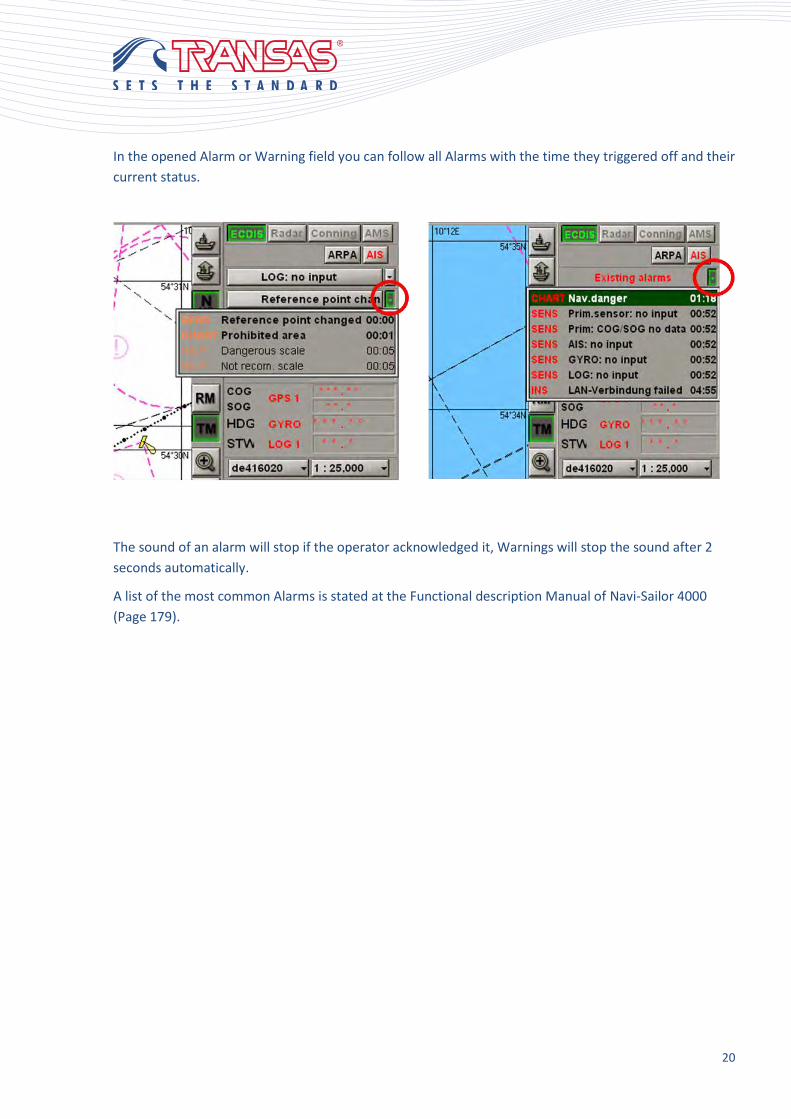
In the opened Alarm or Warning field you can follow all Alarms with the time they triggered off and their
current status.
The sound of an alarm will stop if the operator acknowledged it, Warnings will stop the sound after 2
seconds automatically.
A list of the most common Alarms is stated at the Functional description Manual of Navi-Sailor 4000
(Page 179).
21
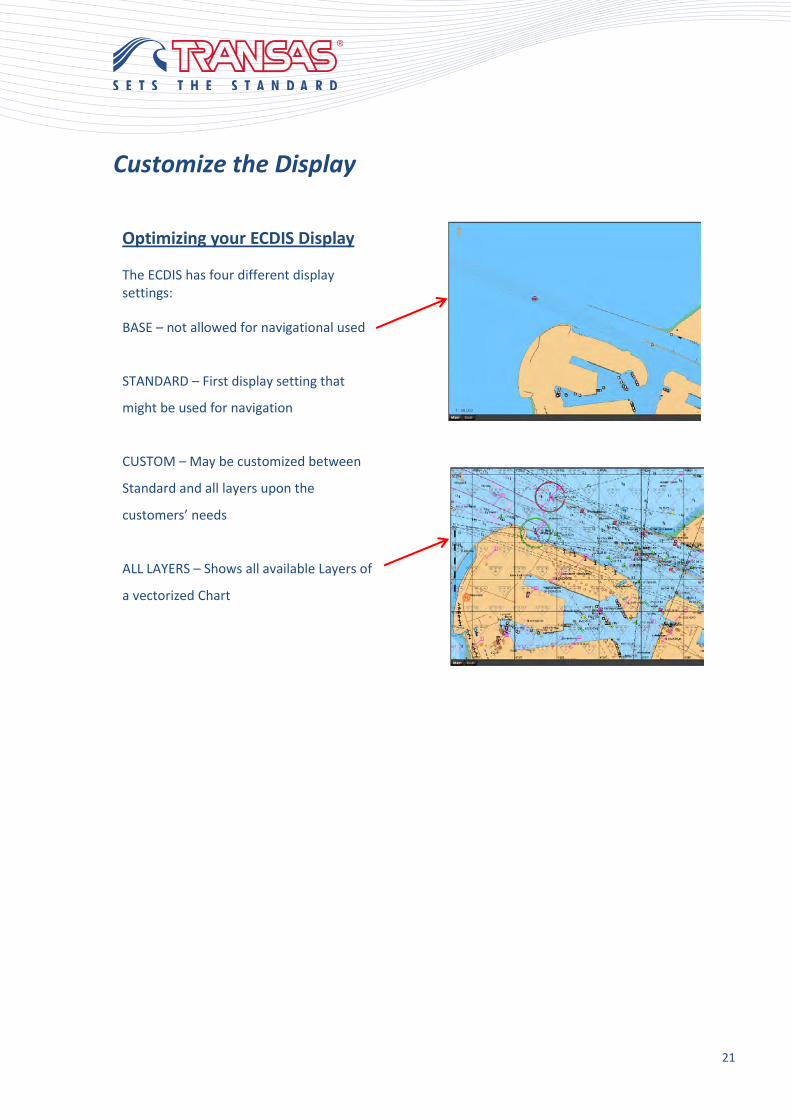
Customize the Display
Optimizing your ECDIS Display The ECDIS has four different display settings: BASE – not allowed for navigational used
STANDARD – First display setting that
might be used for navigation
CUSTOM – May be customized between
Standard and all layers upon the
customers’ needs
ALL LAYERS – Shows all available Layers of
a vectorized Chart
22
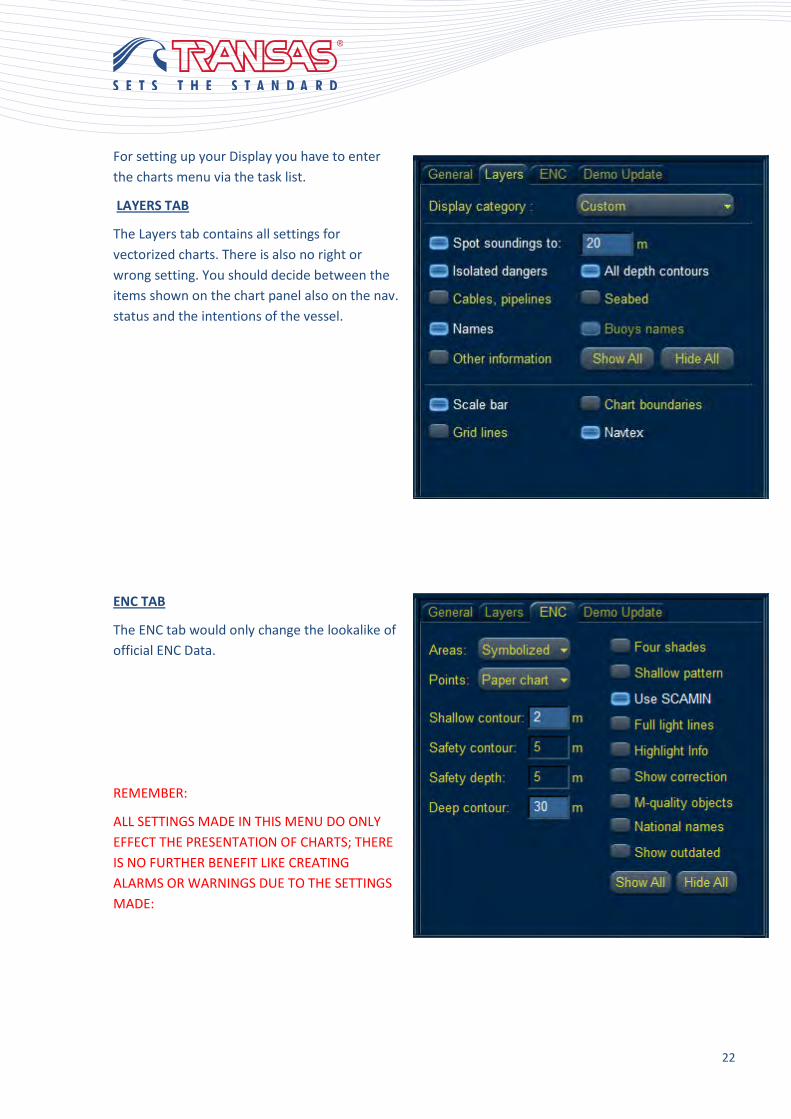
For setting up your Display you have to enter
the charts menu via the task list.
LAYERS TAB
The Layers tab contains all settings for
vectorized charts. There is also no right or
wrong setting. You should decide between the
items shown on the chart panel also on the nav.
status and the intentions of the vessel.
ENC TAB
The ENC tab would only change the lookalike of
official ENC Data.
REMEMBER:
ALL SETTINGS MADE IN THIS MENU DO ONLY
EFFECT THE PRESENTATION OF CHARTS; THERE
IS NO FURTHER BENEFIT LIKE CREATING
ALARMS OR WARNINGS DUE TO THE SETTINGS
MADE:

23
Four shades vs. Two shade
Situational Awareness:
Activating the four shades mode the display related Shallow and deep contour will be show as two
additional blue colored patterns on the chart panel.
The user must now distinguish between maneuverable water and non-navigable water. A help could be
reached by activating the “shallow Pattern” which crosses out the non-navigable waters.
This might lead to a cluttered screen.
Sailing in two shades Mode with proper set safety depth values the user can easily differ between Good-
White (black during night vision) and Bad-Blue displayed contours.
24
Basic Navigational Functions
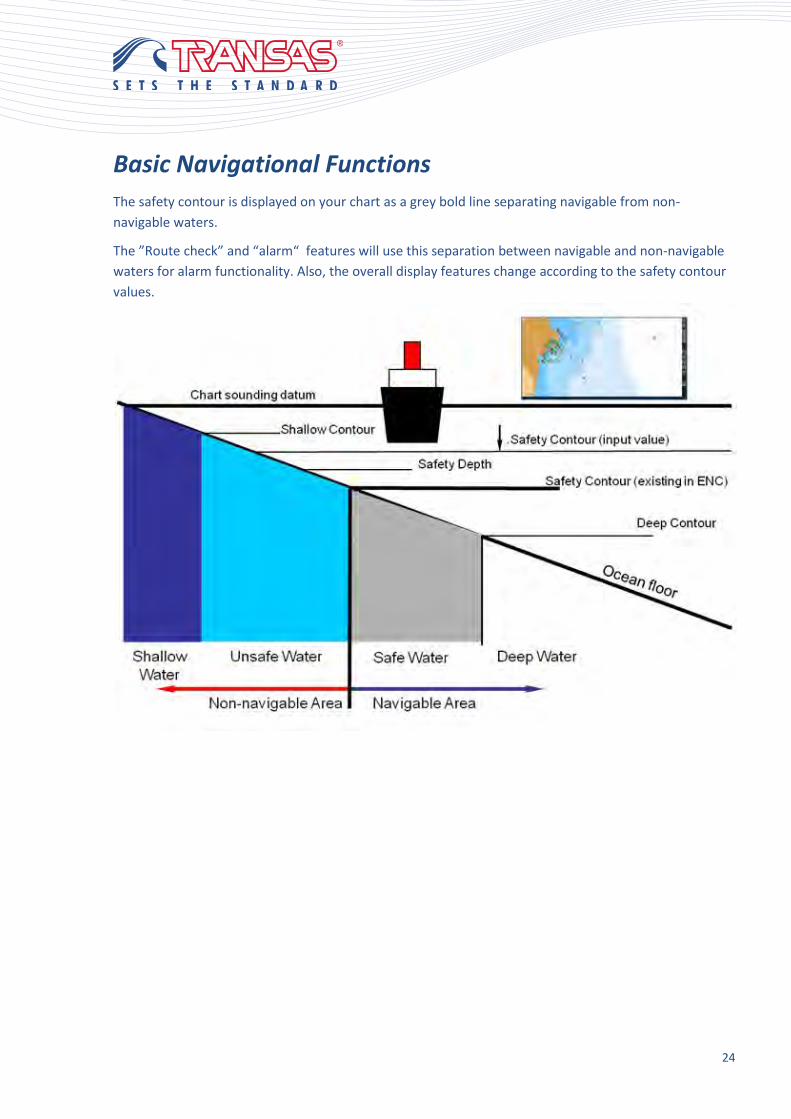
The safety contour is displayed on your chart as a grey bold line separating navigable from non-
navigable waters.
The ”Route check” and “alarm“ features will use this separation between navigable and non-navigable
waters for alarm functionality. Also, the overall display features change according to the safety contour
values.

25
Depending on the safety parameters, the display
mode and the position of an object, its presentation
style might change in order to indicate a danger.
Example - Isolated Dangers:
The symbol for an ”isolated danger” will change
depending on your safety contour.
If the isolated danger has a safe passing depth less
than your safety contour, it will be considered ”Not
safe to pass over” and the top warning symbols will
be in use.
If the safe passing depth is more than your safety
contour, the isolated danger becomes insignificant
and is only shown if selected in chart layers and
according to the blue symbol.
The same happens if the isolated danger lies in
waters already declared non-navigable by the
safety contour.
26
Ouestions 2
1. Which display mode is allowed for proper navigation?
2. When the user is setting the safety contour value, which contour line is selected by the ECDIS
computer?
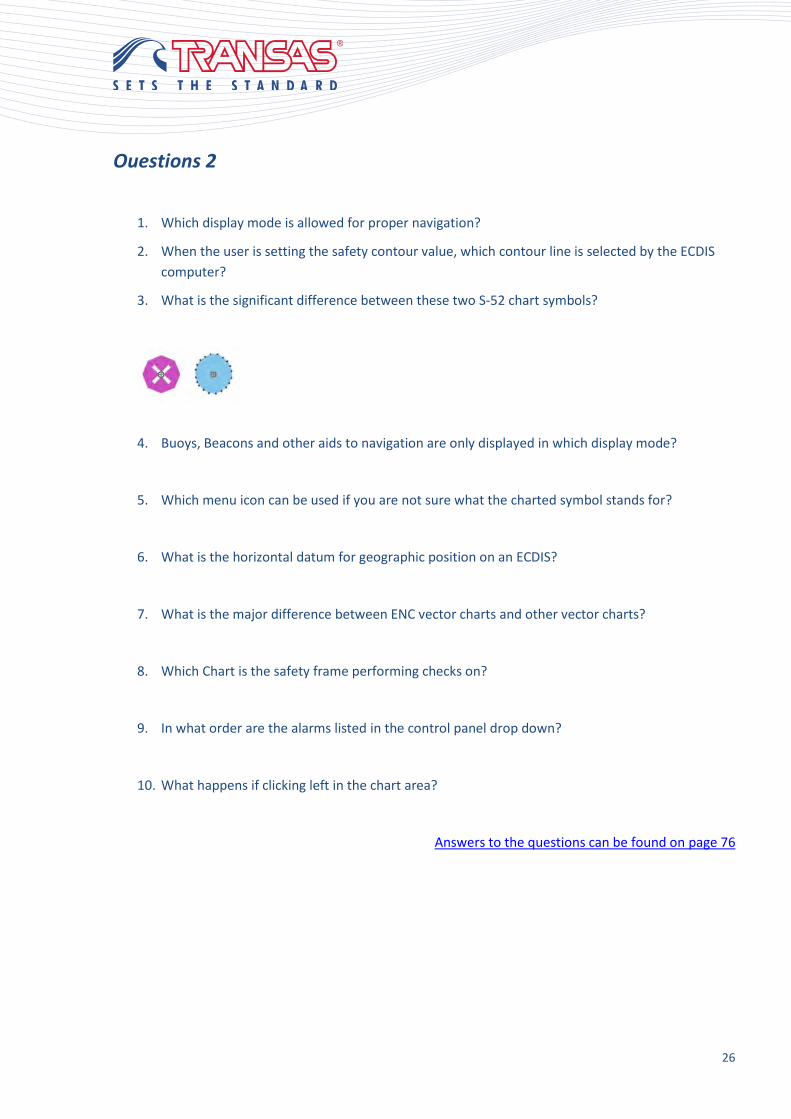
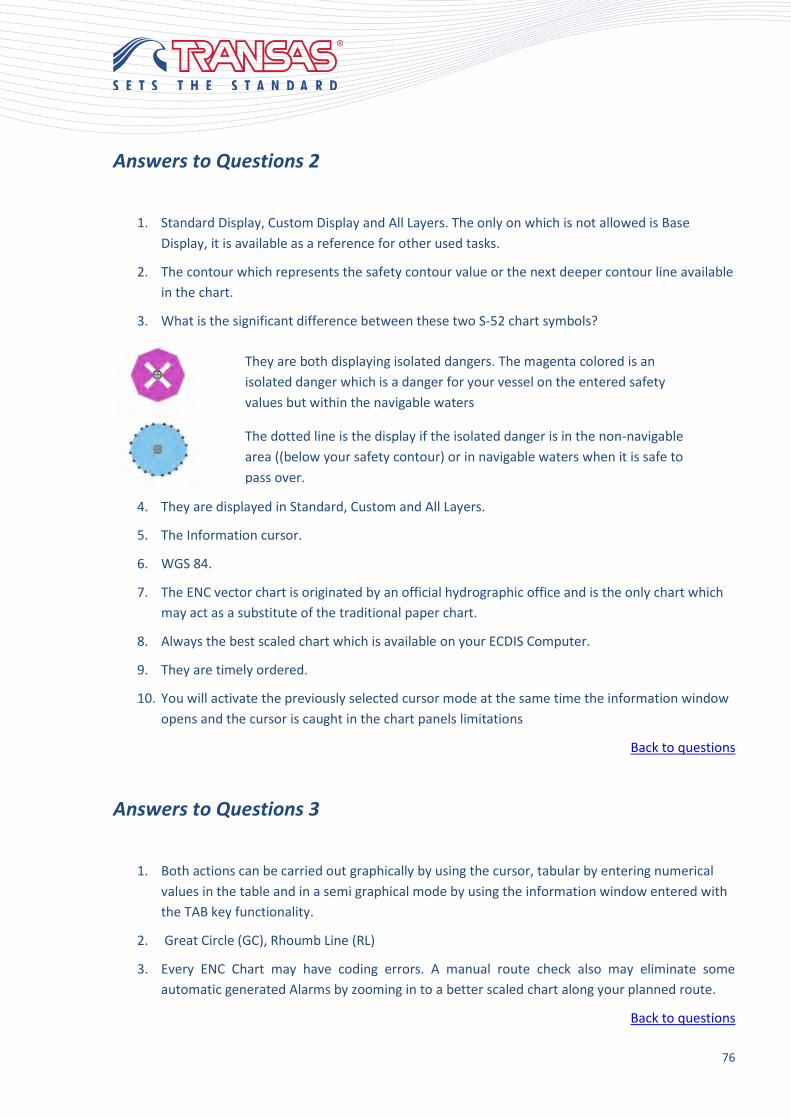
3. What is the significant difference between these two S-52 chart symbols?
4. Buoys, Beacons and other aids to navigation are only displayed in which display mode?
5. Which menu icon can be used if you are not sure what the charted symbol stands for?
6. What is the horizontal datum for geographic position on an ECDIS?
7. What is the major difference between ENC vector charts and other vector charts?
8. Which Chart is the safety frame performing checks on?
9. In what order are the alarms listed in the control panel drop down?
10. What happens if clicking left in the chart area?
Answers to the questions can be found on page 76
27
Route Planning
A route aims to establish the most favorable way to a destination, while maintaining appropriate safety
margins in regard of navigational and anti-collision hazards.
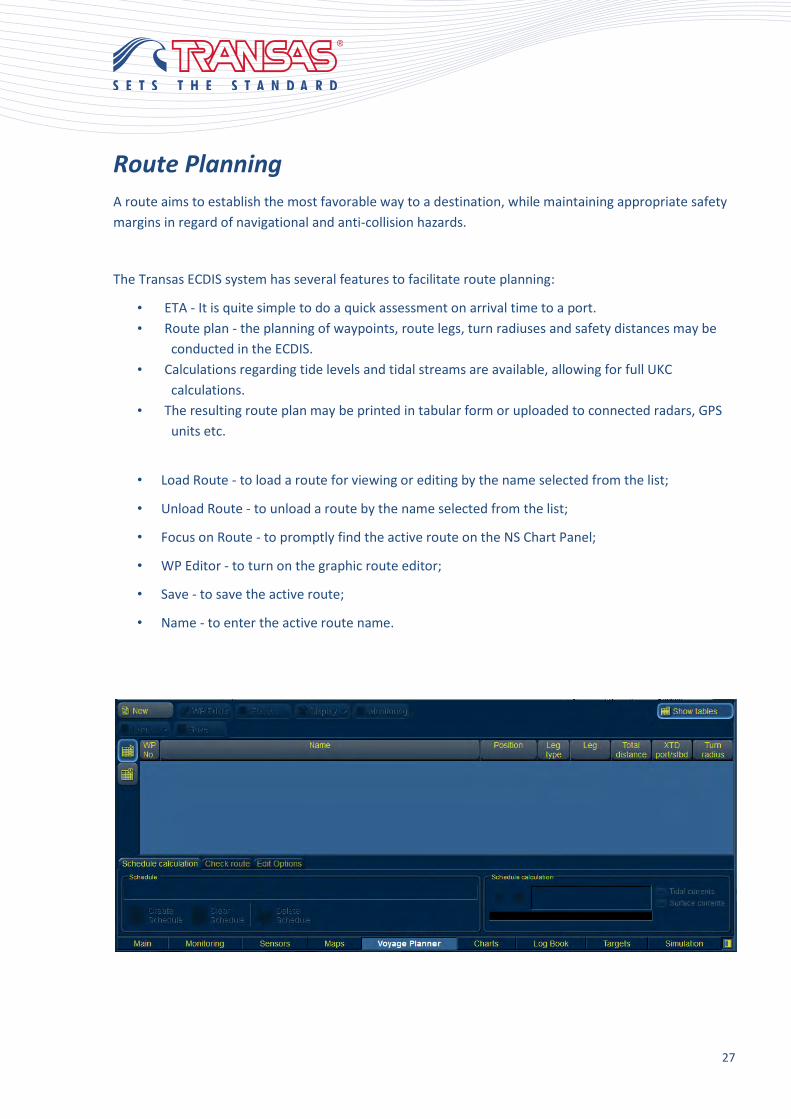
The Transas ECDIS system has several features to facilitate route planning:
• ETA - It is quite simple to do a quick assessment on arrival time to a port.
• Route plan - the planning of waypoints, route legs, turn radiuses and safety distances may be
conducted in the ECDIS.
• Calculations regarding tide levels and tidal streams are available, allowing for full UKC
calculations.
• The resulting route plan may be printed in tabular form or uploaded to connected radars, GPS
units etc.
• Load Route - to load a route for viewing or editing by the name selected from the list;
• Unload Route - to unload a route by the name selected from the list;
• Focus on Route - to promptly find the active route on the NS Chart Panel;
• WP Editor - to turn on the graphic route editor;
• Save - to save the active route;
• Name - to enter the active route name.
28
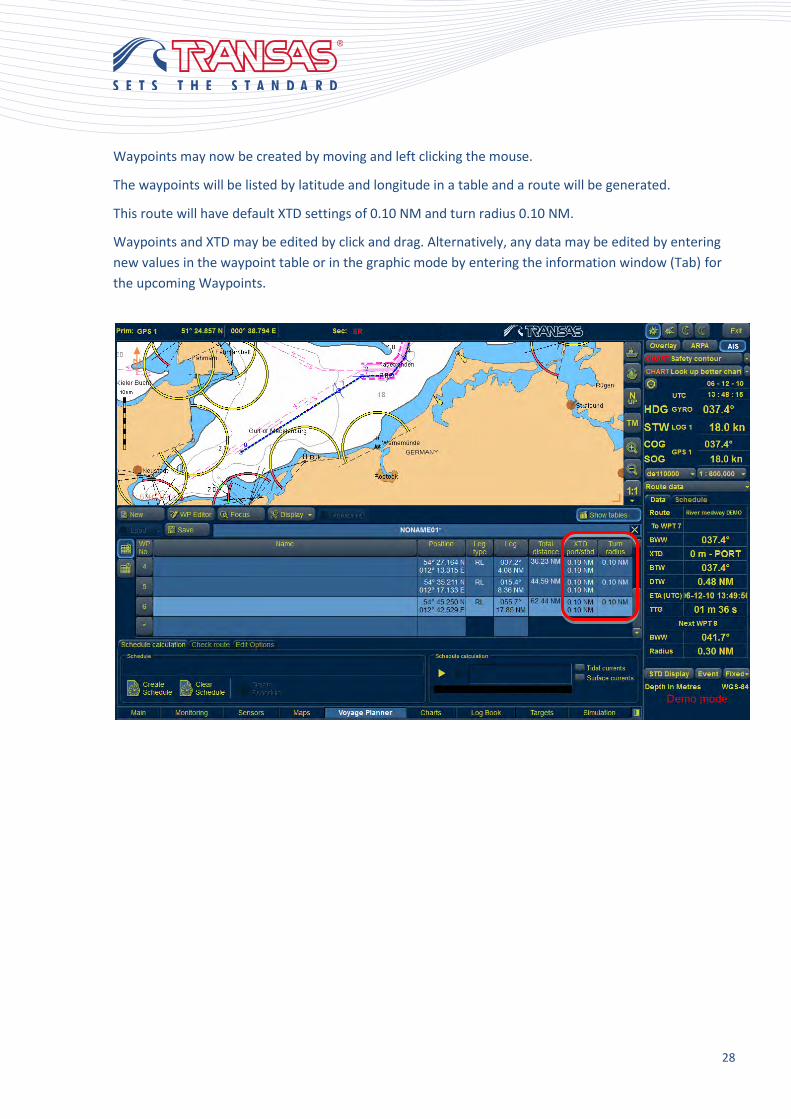
Waypoints may now be created by moving and left clicking the mouse.
The waypoints will be listed by latitude and longitude in a table and a route will be generated.
This route will have default XTD settings of 0.10 NM and turn radius 0.10 NM.
Waypoints and XTD may be edited by click and drag. Alternatively, any data may be edited by entering
new values in the waypoint table or in the graphic mode by entering the information window (Tab) for
the upcoming Waypoints.

29
When all the waypoints seem to be OK, the values for Turn radius and XTD should be adjusted to ensure
that the safety margins are adequate.
In areas where safety margins are narrow, special caution should be exercised in accordance with your
company’s navigation policy.
Precautions might include bridge manning, speed and engine readiness, requirements for daylight and
visibility, requirements for tidal levels and speed and direction of wind and currents.
When the route is completed, there is a feature whereby an automatic safety check might be made for
the entire route and all the charts that are affected.
The safety check will be made using your safety parameters and pre-programmed maneuvering
parameters.
Transas Marine recommends that all routes are thoroughly checked both manually and automatically
before being put to use.
A route that has been created can be modified in several ways.
Routes can be merged or linked with new or already existing routes.
30
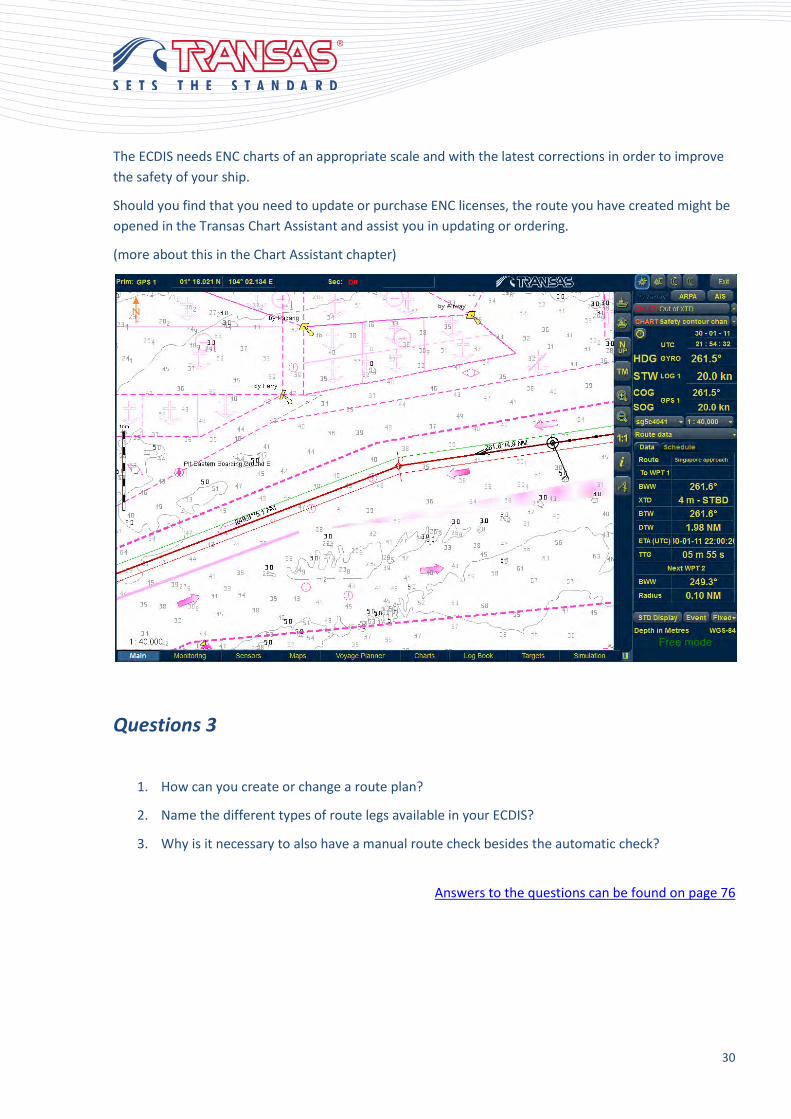
The ECDIS needs ENC charts of an appropriate scale and with the latest corrections in order to improve
the safety of your ship.
Should you find that you need to update or purchase ENC licenses, the route you have created might be
opened in the Transas Chart Assistant and assist you in updating or ordering.
(more about this in the Chart Assistant chapter)
Questions 3
1. How can you create or change a route plan?
2. Name the different types of route legs available in your ECDIS?
3. Why is it necessary to also have a manual route check besides the automatic check?
Answers to the questions can be found on page 76
31
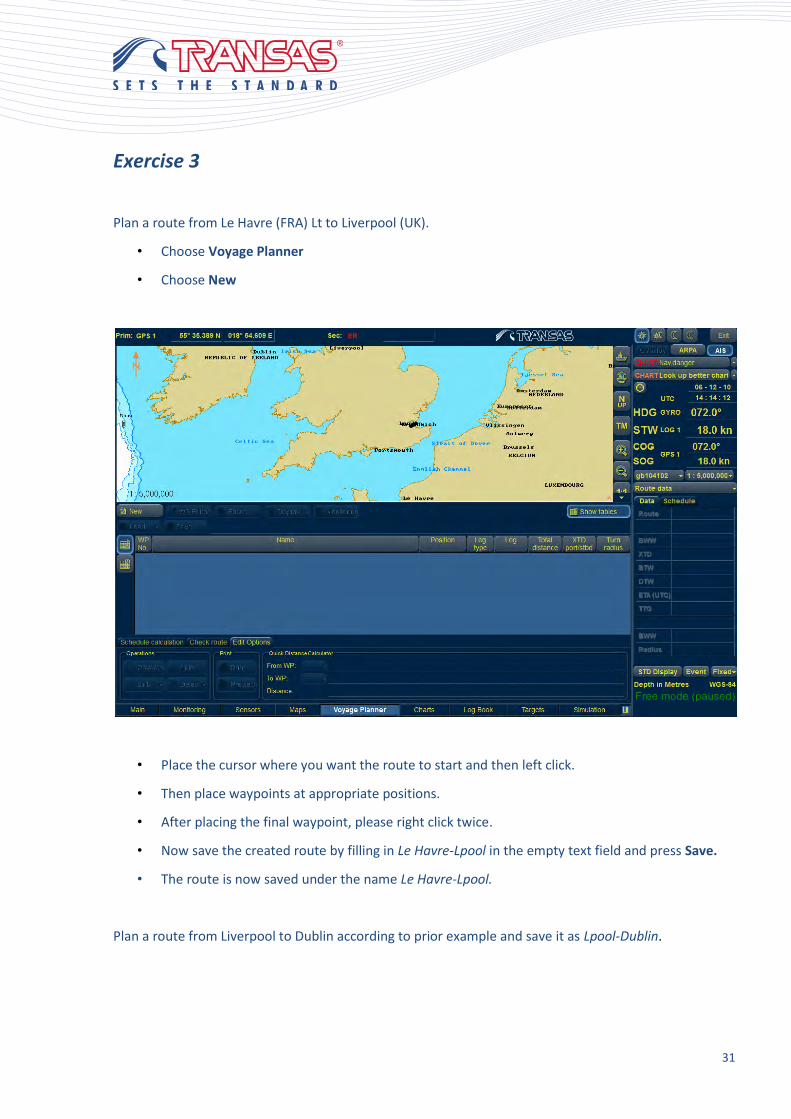
Exercise 3
Plan a route from Le Havre (FRA) Lt to Liverpool (UK).
• Choose Voyage Planner
• Choose New
• Place the cursor where you want the route to start and then left click.
• Then place waypoints at appropriate positions.
• After placing the final waypoint, please right click twice.
• Now save the created route by filling in Le Havre-Lpool in the empty text field and press Save.
• The route is now saved under the name Le Havre-Lpool.
Plan a route from Liverpool to Dublin according to prior example and save it as Lpool-Dublin.
32
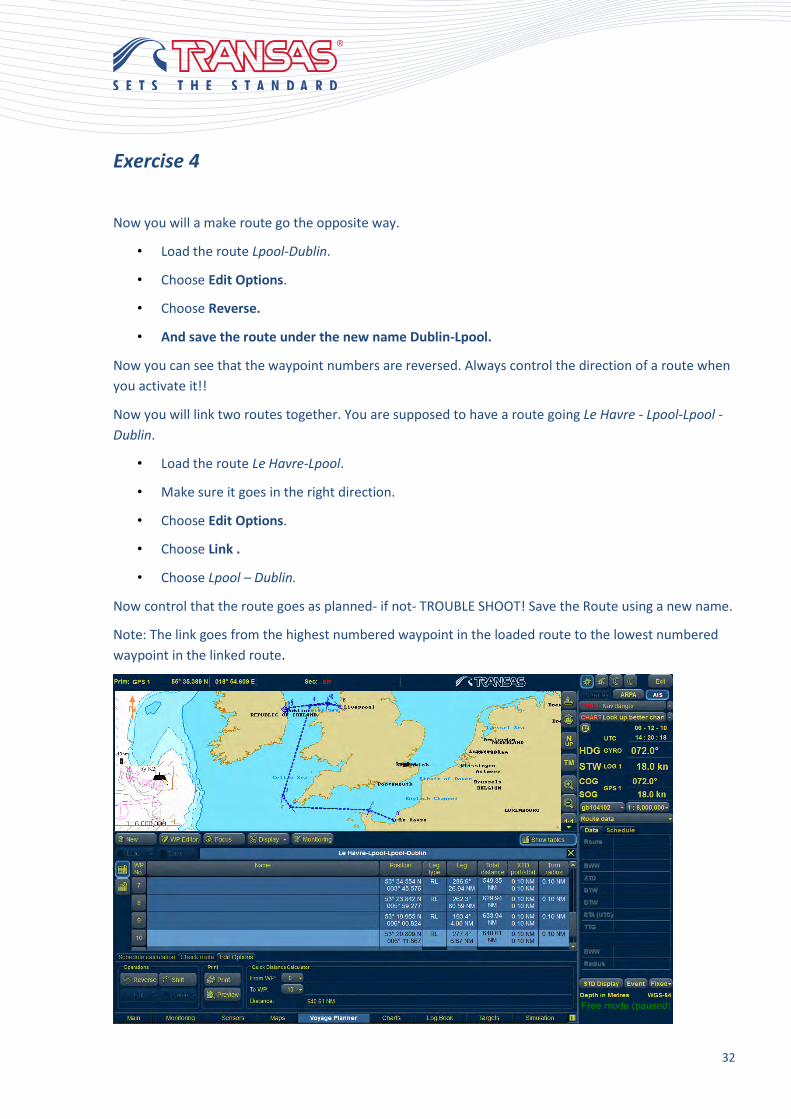
Exercise 4
Now you will a make route go the opposite way.
• Load the route Lpool-Dublin.
• Choose Edit Options.
• Choose Reverse.
• And save the route under the new name Dublin-Lpool.
Now you can see that the waypoint numbers are reversed. Always control the direction of a route when
you activate it!!
Now you will link two routes together. You are supposed to have a route going Le Havre - Lpool-Lpool -
Dublin.
• Load the route Le Havre-Lpool.
• Make sure it goes in the right direction.
• Choose Edit Options.
• Choose Link .
• Choose Lpool – Dublin.
Now control that the route goes as planned- if not- TROUBLE SHOOT! Save the Route using a new name.
Note: The link goes from the highest numbered waypoint in the loaded route to the lowest numbered
waypoint in the linked route.

33
Exercise 5
Create a new route using the positions from the Waypoint list.
WP 1: 36ᵒ 52.805 N 076ᵒ 19.823 W
WP 2: 36ᵒ 57.886 N 076ᵒ 20.459 W
WP 3: 36ᵒ 47.457 N 075ᵒ 44.251 W
WP 4: 25ᵒ 55.426 N 069ᵒ 12.223 W
WP 5: 49ᵒ 37.138 N 004ᵒ 48.823 W
WP 6: 51ᵒ 24.647 N 000ᵒ 36.174 E
• Name WP and the route from your departure place to the port of arrival
• As you see the route has to be adjusted
• Make changes in the routes, you may use both graphically and tabular method.
• Do not forget to save occasionally.
Check route (according to set safety parameters).
• Choose Check route
• Click on Play
If a lot of alarms occur, please check safety parameters and make a new check!
One of the most common settings that need to be changed is the “Check on scales larger than”. You are
probably not interested in safety contours on overview-charts smaller than 1:200 000. This will reduce
the number of alarms a lot.
If you lose yourself in the chart, press Focus Button!
When you are satisfied with your route plan, you can activated it and make it integrate with the system
by pressing Monitor. The route will now turn red. You can only make changes in a route plan (blue
route), not in a red route.
Do not forget to also adjust your XTD value if you plan narrow passages.
Answers to the questions can be found on page 77
34
Exercise 6
Go to the Simulation Tab and load the Singapore Scenario in Routes and Scenarios. The ECDIS Demo
Software changes to Demo Mode. Change to the Voyage Planner and create a new Route by planning 10
Waypoints along the displayed red Route. Save it under “Singapore approach”. Then again select NONE
in Scenario under the Simulation Tab.
Load Singapore approach and carry out a Route check using 5m as safety contour and depth value.
Change to the Schedule View of the table. Enter following data in the voyage plan table:
ETD: 01-11-12 15:00 (from first waypoint)
ETA: 01-11-12 19:30 (last waypoint)
Choose Schedule calculation and press the play button. Safe the result as SING app 1 by entering the
Name and click on Create Schedule.
What speed should you keep: ____________kn.
Activate Schedule 1 delete the ETA by clicking right in the cell and scroll to clear cell then enter 14 kn at
the speed column. Click again right and choose fill cells down. Safe that schedule as SING app 2
When will you be at the last waypoint if you keep the entered speed?
Between WP 7 and WP 8 there is the Western Pilot Boarding ground. Plan a stop at WP 7: and stay there
for 0.5 hours. ETA at the last WP is 01-11-12 18:30 if you sail with the speed of 12 kn to WP 7 what is
your SOA for the last 3 WP? Save the schedule under SING app 3.
Select the schedule 1 tab and activate Tidal currents and Surface currents under schedule calculation.
What SOA is now needed to arrive in time?
Use the Quick Distance Calculator in Edit options to calculate distance between WP 7 and WP10.
Answers to the questions can be found on page 77
35
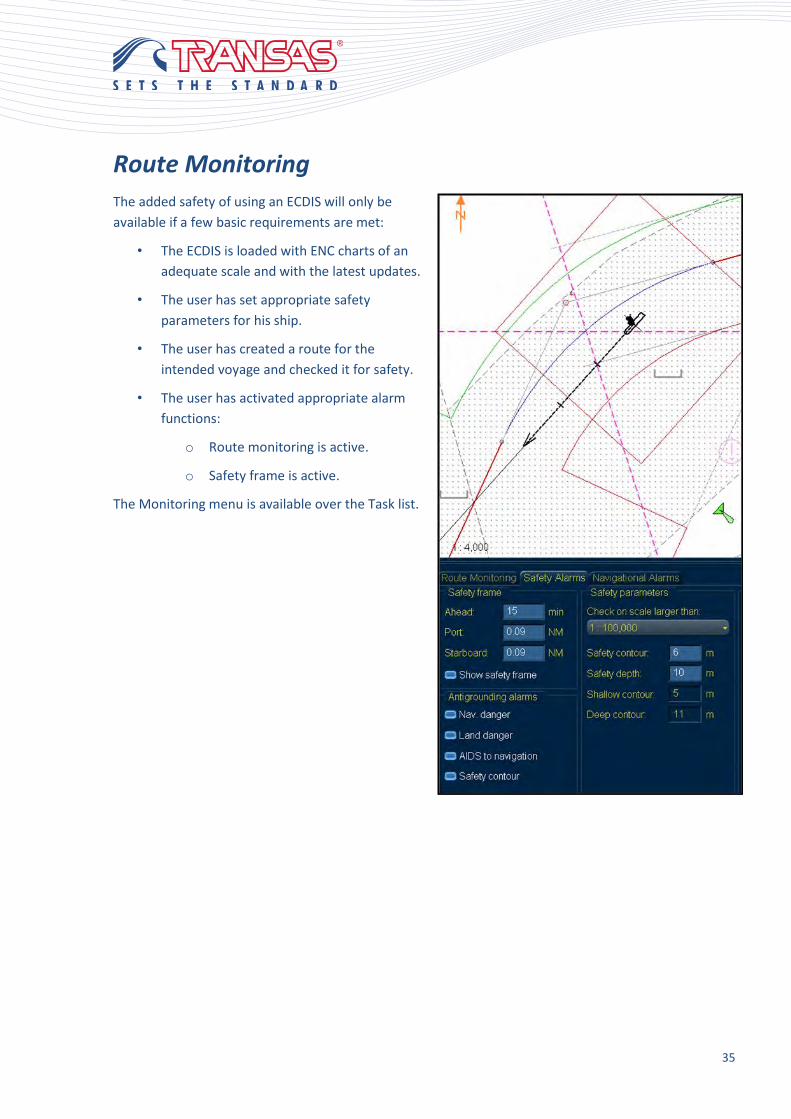
Route Monitoring
The added safety of using an ECDIS will only be
available if a few basic requirements are met:
• The ECDIS is loaded with ENC charts of an
adequate scale and with the latest updates.
• The user has set appropriate safety
parameters for his ship.
• The user has created a route for the
intended voyage and checked it for safety.
• The user has activated appropriate alarm
functions:
o Route monitoring is active.
o Safety frame is active.
The Monitoring menu is available over the Task list.
36
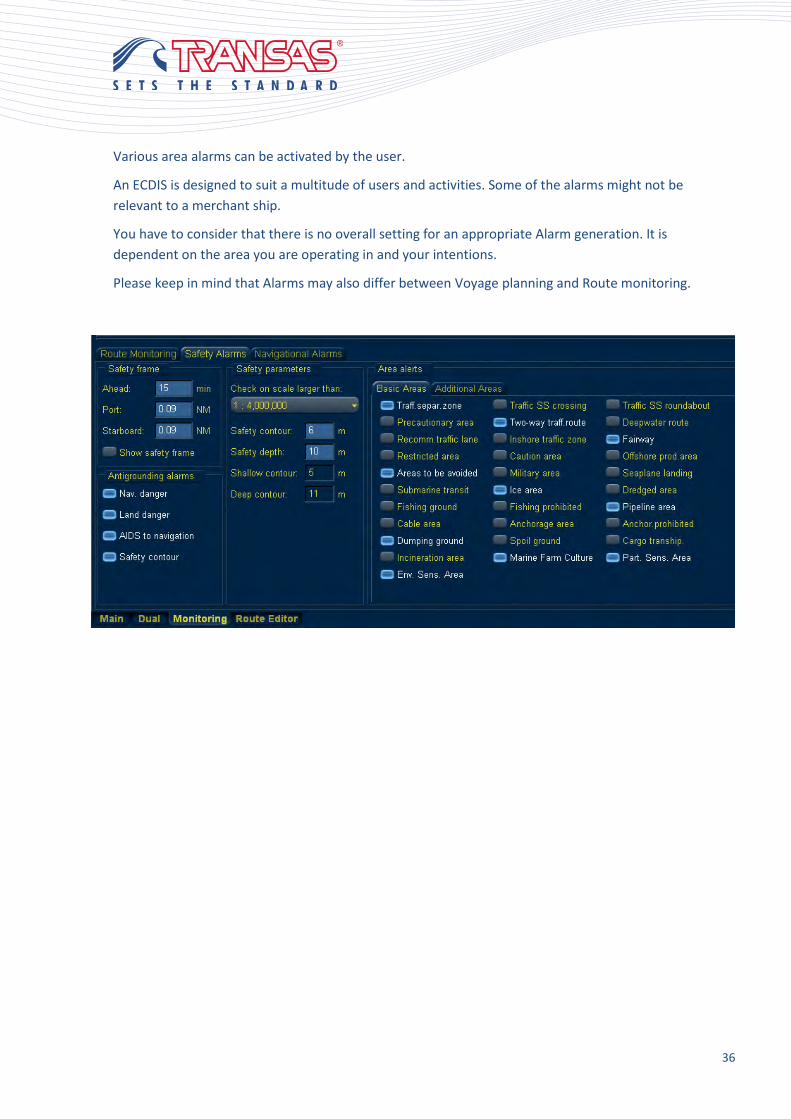
Various area alarms can be activated by the user.
An ECDIS is designed to suit a multitude of users and activities. Some of the alarms might not be
relevant to a merchant ship.
You have to consider that there is no overall setting for an appropriate Alarm generation. It is
dependent on the area you are operating in and your intentions.
Please keep in mind that Alarms may also differ between Voyage planning and Route monitoring.
37
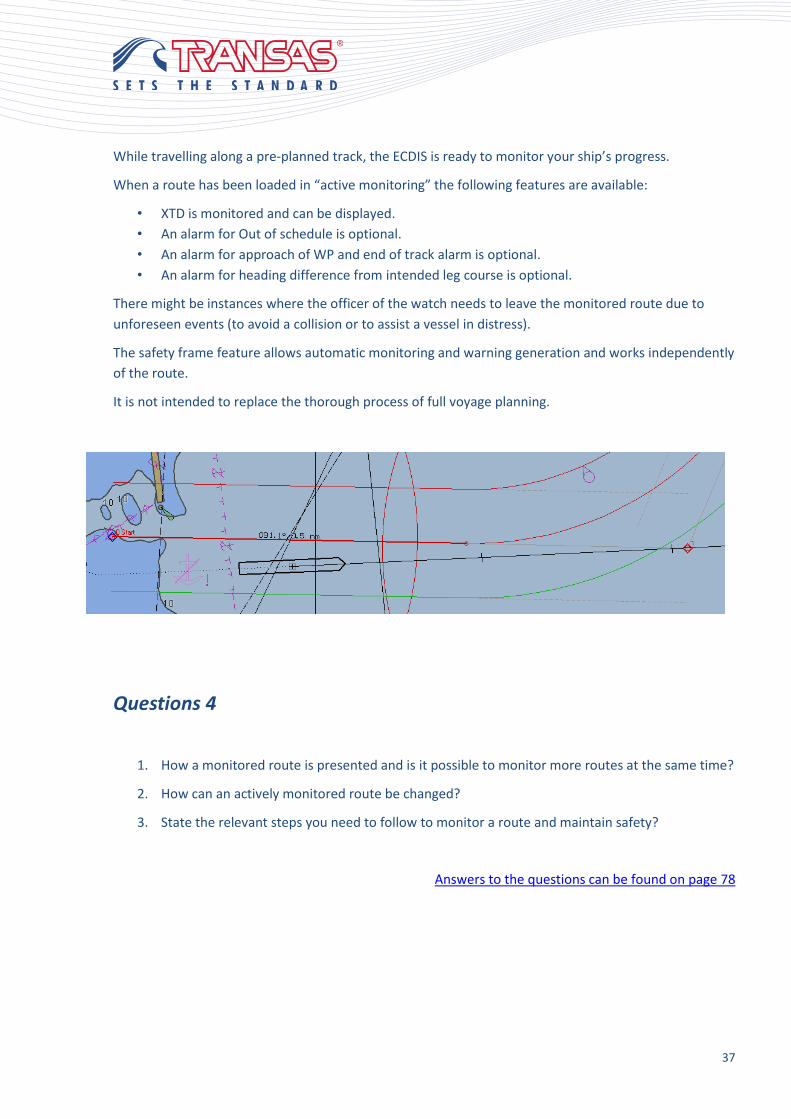
While travelling along a pre-planned track, the ECDIS is ready to monitor your ship’s progress.
When a route has been loaded in “active monitoring” the following features are available:
• XTD is monitored and can be displayed.
• An alarm for Out of schedule is optional.
• An alarm for approach of WP and end of track alarm is optional.
• An alarm for heading difference from intended leg course is optional.
There might be instances where the officer of the watch needs to leave the monitored route due to
unforeseen events (to avoid a collision or to assist a vessel in distress).
The safety frame feature allows automatic monitoring and warning generation and works independently
of the route.
It is not intended to replace the thorough process of full voyage planning.
Questions 4
1. How a monitored route is presented and is it possible to monitor more routes at the same time?
2. How can an actively monitored route be changed?
3. State the relevant steps you need to follow to monitor a route and maintain safety?
Answers to the questions can be found on page 78
38
Maps
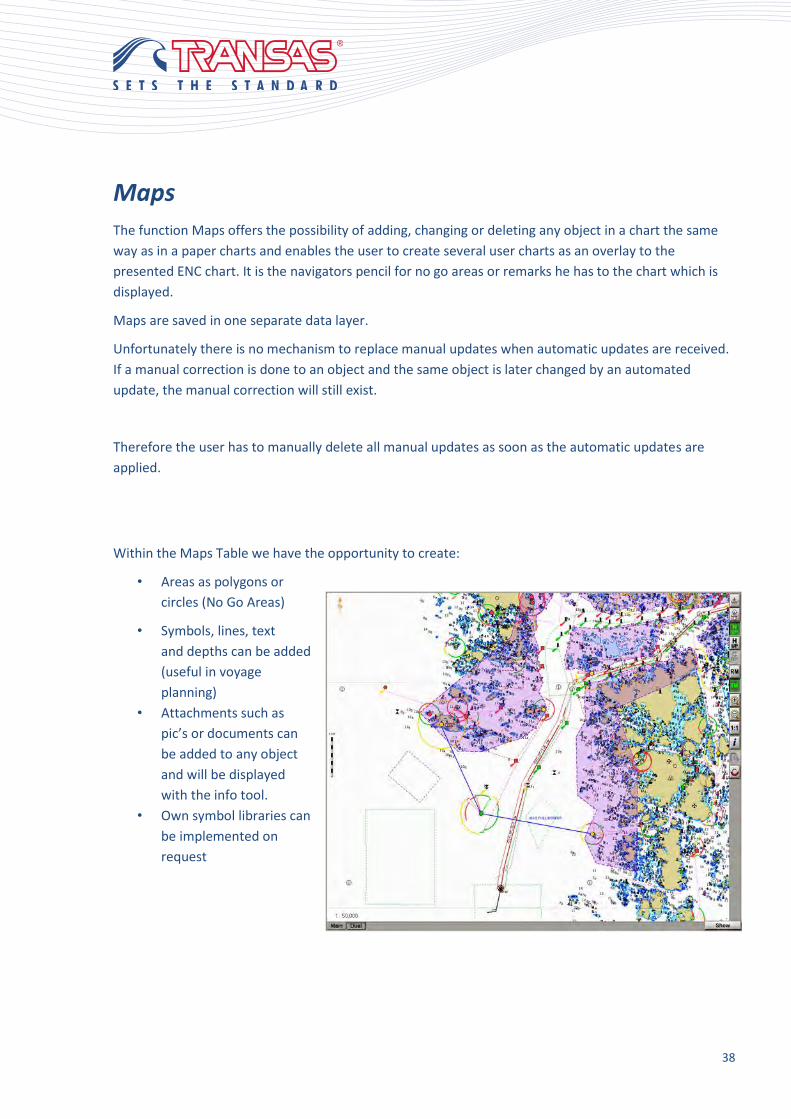
The function Maps offers the possibility of adding, changing or deleting any object in a chart the same
way as in a paper charts and enables the user to create several user charts as an overlay to the
presented ENC chart. It is the navigators pencil for no go areas or remarks he has to the chart which is
displayed.
Maps are saved in one separate data layer.
Unfortunately there is no mechanism to replace manual updates when automatic updates are received.
If a manual correction is done to an object and the same object is later changed by an automated
update, the manual correction will still exist.
Therefore the user has to manually delete all manual updates as soon as the automatic updates are
applied.
Within the Maps Table we have the opportunity to create:
• Areas as polygons or
circles (No Go Areas)
• Symbols, lines, text
and depths can be added
(useful in voyage
planning)
• Attachments such as
pic’s or documents can
be added to any object
and will be displayed
with the info tool.
• Own symbol libraries can
be implemented on
request

39
To display Maps panel select the appropriate tab on the panel bar.
Maps panel consists of the following groups:
Group for the control of the user chart object display consists of the following elements:
• On – to turn on the display of the active layer on the electronic chart;
• Save – to save the user chart;
• Attachments – to turn on the highlighting of objects with attached files;
• Deleted – to turn on the highlighting of deleted object;
• Colour – to turn on the orange colored lighting of all the user chart objects.
Area for Creating and Editing Objects in the active layer contains the following elements:
• New Object - to plot a new object on the chart;
• Edit Object - to select an existing object for editing;
• Shift Object - to select and move an existing object;
• Shift All Objects - to move all the objects to the distance;
• Delete Object - to select and delete an object;
• Restore Object - to select and restore a previously deleted object;
• Attachments - to assign "attached file" attribute by selecting a file from a list.

40
Area for selection of Object Category and Type contains 5 windows:
• Symbol - provides a point object symbol library;
• Lines - provides a symbol library of various line and area types;
• Depth - window for the input of the distinctive depth object value;
• Text - window for typing the text object characters;
• Circles - provides a symbol library of various circle line and area types.
Object Attributes Editing area contains the following elements:
• Colour palette - to assign "object colour" attribute to the object;
• Attributes - to open the window of the rest of the object attributes;
• Text - to assign "object text";
• Info - to assign "object information" attribute;
• Depth - to assign "object depth" attribute;
• Clear attributes … - to cancel all the attributes for each new object.
41
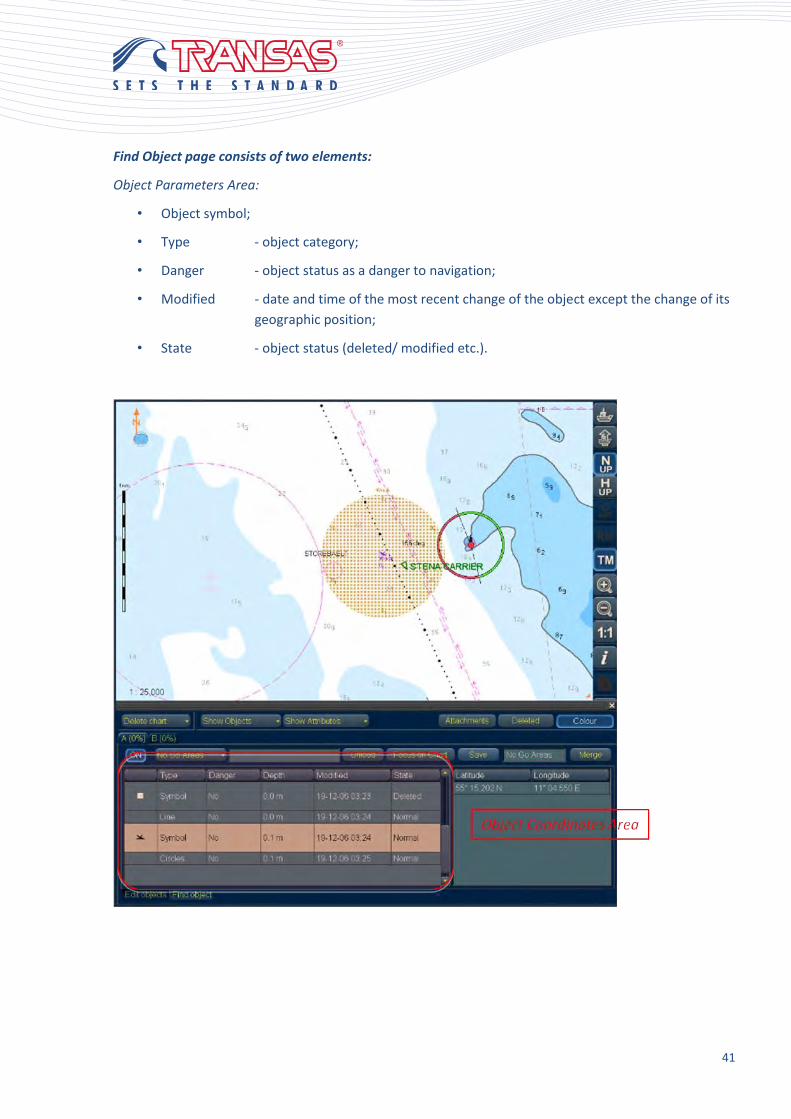
Find Object page consists of two elements:
Object Parameters Area:
• Object symbol;
• Type - object category;
• Danger - object status as a danger to navigation;
• Modified - date and time of the most recent change of the object except the change of its
geographic position;
• State - object status (deleted/ modified etc.).
42
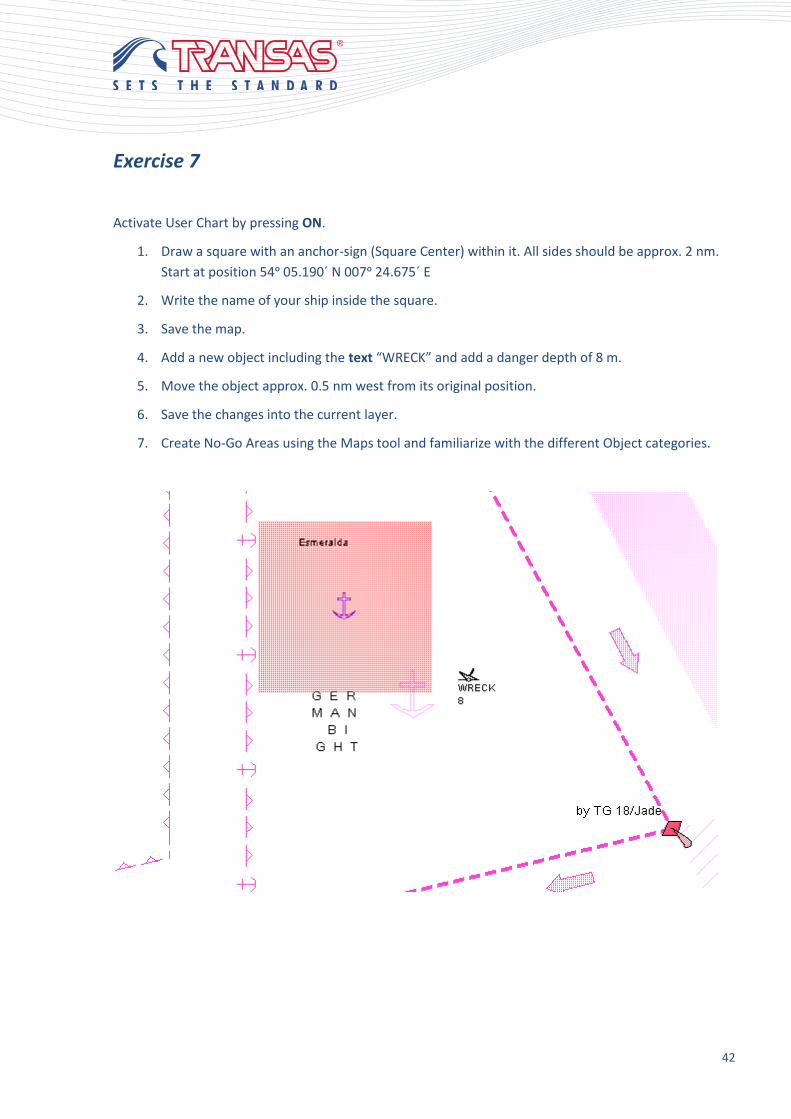
Exercise 7
Activate User Chart by pressing ON.
1. Draw a square with an anchor-sign (Square Center) within it. All sides should be approx. 2 nm.
Start at position 54ᵒ 05.190´ N 007ᵒ 24.675´ E
2. Write the name of your ship inside the square.
3. Save the map.
4. Add a new object including the text “WRECK” and add a danger depth of 8 m.
5. Move the object approx. 0.5 nm west from its original position.
6. Save the changes into the current layer.
7. Create No-Go Areas using the Maps tool and familiarize with the different Object categories.
43
Risk of Overreliance
The training in ECDIS operational use should address:
• the limitations of ECDIS as a navigational tool,
• potential risk of improper functioning of the system,
• system limitations, including those of its sensors,
• knowledge of principal types of ARPA/ECDIS/AIS, their display characteristics, performance
standards and the dangers of over reliance on ARPA/ECDIS/AIS,
• hydrographic data inaccuracy; limitations of vector and raster electronic charts (ECDIS vs. RCDS
and ENC vs. RNC), and
• Potential risk of human errors.
Emphasis should be placed on the need to keep a proper look-out and to perform periodical checking,
especially of the ship’s position, by ECDIS independent methods.
IMO. STCW.7/Circ.10 (2001)
The use of ECDIS does not relieve the officer of the watch from his duty to use all available means.
The ECDIS is a single unit that consolidates several sensors and the navigation chart.
Any error in a sensor, the chart or the ECDIS itself, may lead to a dangerous situation.
The officer of the watch should therefore conduct regular checks of all connected sensors, the back-up
ECDIS and use sight and hearing as well as all available means to fix ships position and progress.

44
The main sensor for your ECDIS is the EPFS.
The officer of the watch should familiarize him or herself with the
EPFS, know its menus and where the antenna is located.
A quick check of the unit should include:
• Power on
• All cables and connectors appear OK
• Several satellites are being tracked, and they have an OK value for SNR (signal strength)
• The HDOP value is low - normal might be 0,5 - 3, high is any value above 4
• RAIM settings are OK and indicate safe
• Position is being updated every second
• Chart datum is set to WGS-84
• If DGPS is in use - the station in use is near by
• If DGPS is in use - corrections are being received for most satellites

45
As mentioned the charted information in ENC is as it is on paper charts dependent on the surveyed
information the national Hydrographic offices provided.
These inaccuracies may be considered by displaying the M-Quality Objects from the Chart menu of the
Task list.
46
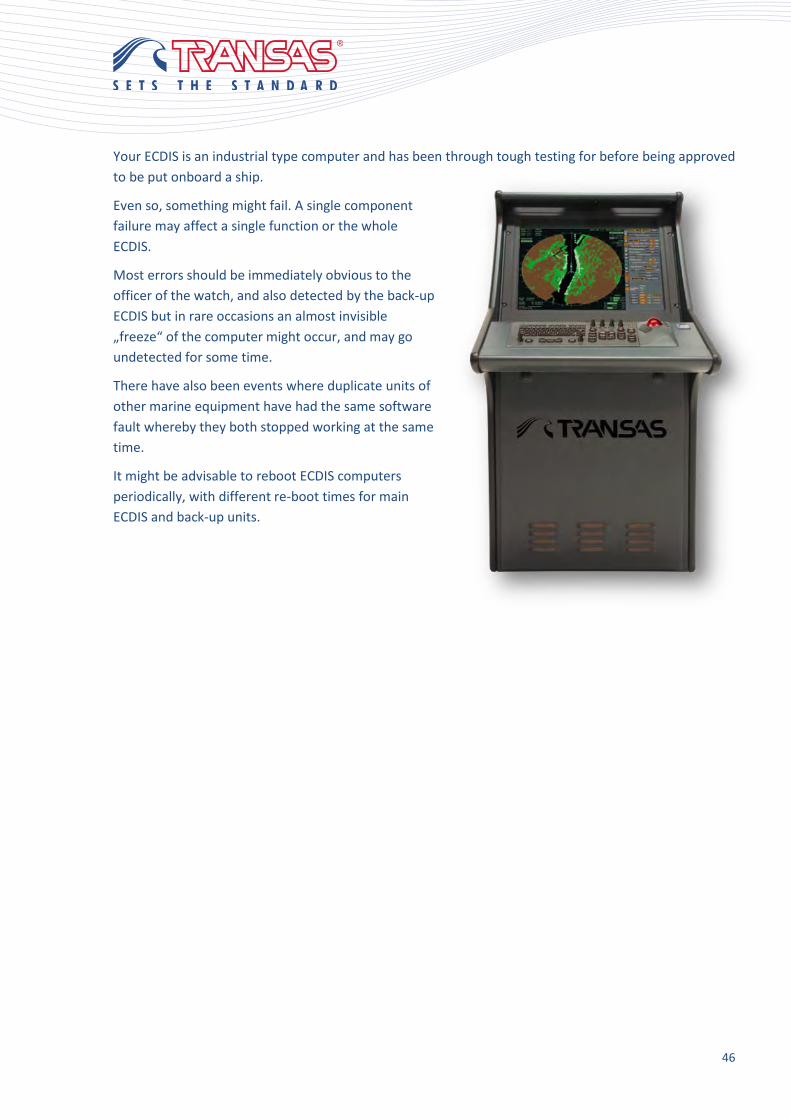
Your ECDIS is an industrial type computer and has been through tough testing for before being approved
to be put onboard a ship.
Even so, something might fail. A single component
failure may affect a single function or the whole
ECDIS.
Most errors should be immediately obvious to the
officer of the watch, and also detected by the back-up
ECDIS but in rare occasions an almost invisible
„freeze“ of the computer might occur, and may go
undetected for some time.
There have also been events where duplicate units of
other marine equipment have had the same software
fault whereby they both stopped working at the same
time.
It might be advisable to reboot ECDIS computers
periodically, with different re-boot times for main
ECDIS and back-up units.

47
Human Error
Preconditions for unsafe acts:
1. Internal:
physiology (illness), mental state
(fatigue, distraction)
2. External:
• mismatch between the
operator's ability and the task demands (lack of training);
• poor crew resource management (issues such as leadership and communication);
• poor personal readiness practices (e.g., violating the crew rest requirements in
aviation);
• Organizational influences (human or financial resources, structures, policies, culture,
procedures, schedules, oversight).
48
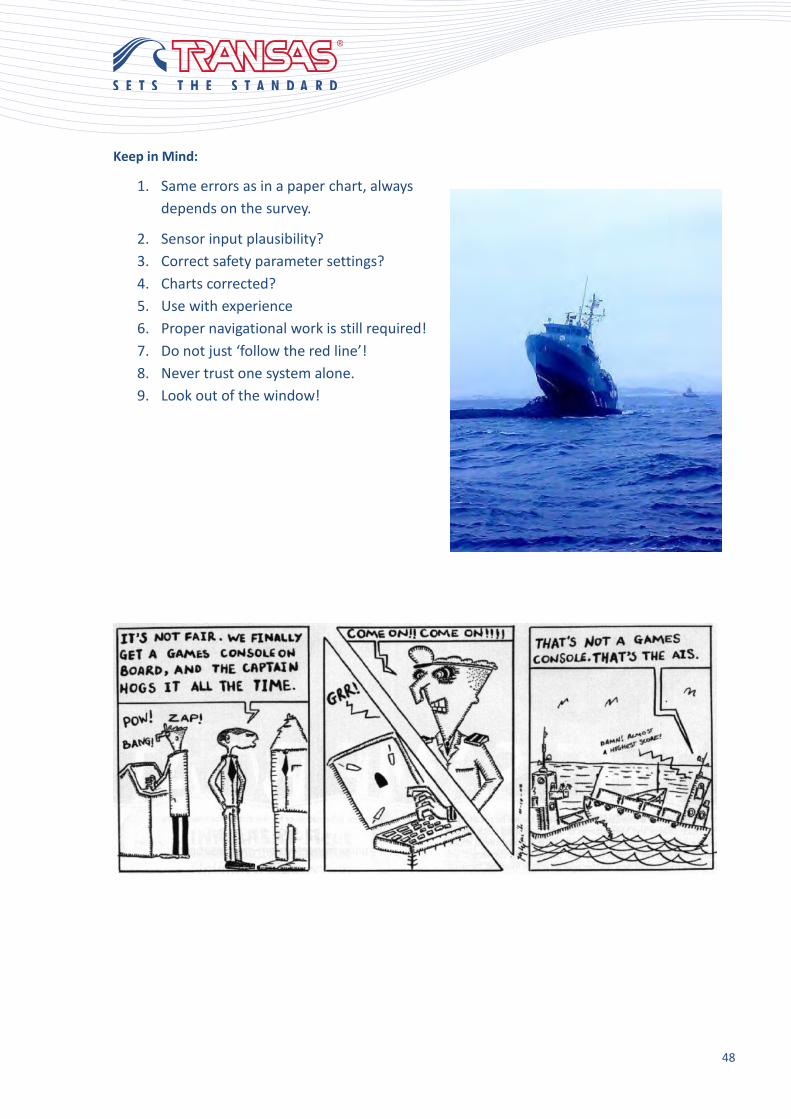
Keep in Mind:
1. Same errors as in a paper chart, always
depends on the survey.
2. Sensor input plausibility?
3. Correct safety parameter settings?
4. Charts corrected?
5. Use with experience
6. Proper navigational work is still required!
7. Do not just ‘follow the red line’!
8. Never trust one system alone.
9. Look out of the window!
49
Ouestions 5
1. Which Elements may cause possibly errors in display or any other failure in an ECDIS?
a. Inputs from sensors
b. Sensor settings
c. The ECDIS hardware
d. The charts
e. The charts
f. The ECDIS software
2. What means of checking the functioning of the ECDIS are available to the OOW?
a. ECDIS built-in alarm system?
b. Checks of the sensors that are connected to ECDIS
c. Position fixing by other means
d. ECDIS back-up unit
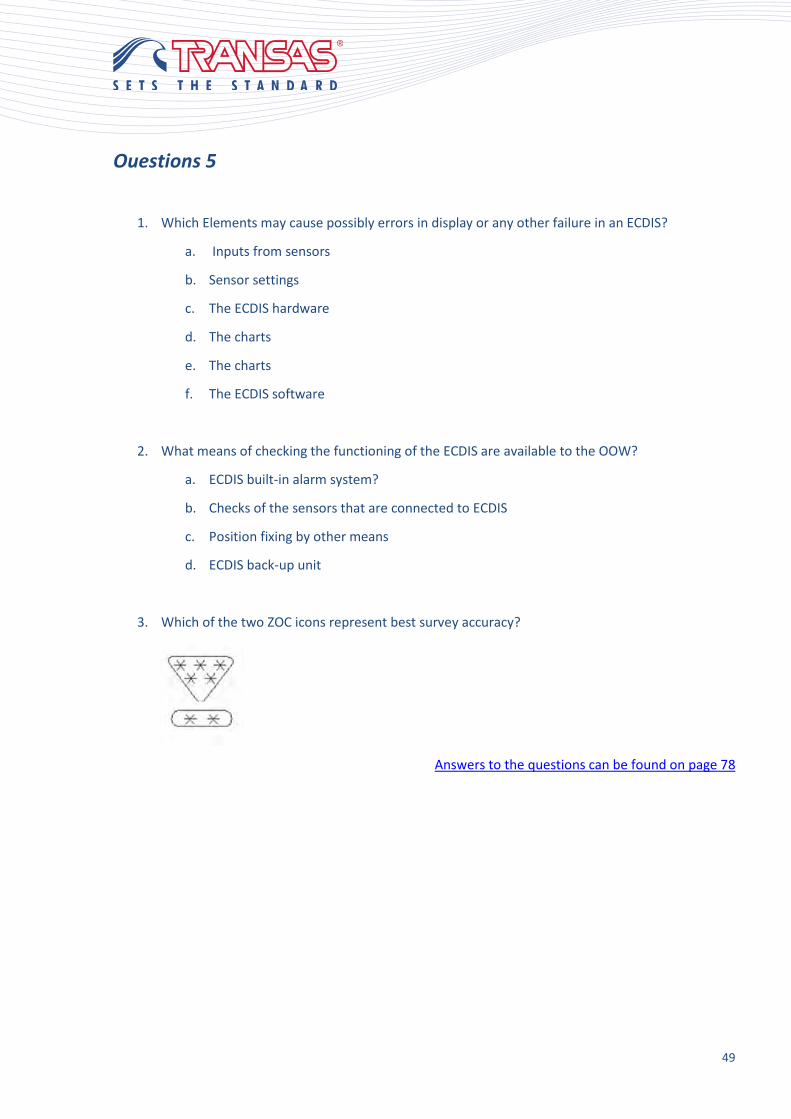
3. Which of the two ZOC icons represent best survey accuracy?
Answers to the questions can be found on page 78

50
Chart Assistant
Introduction
The ECDIS Demo contains a built in chart folio
for certain areas. The updating process is just
simulated. To give you an understanding how
the updating of a real Transas ECDIS System
may look we inserted the following pages.
The Chart Assistant application is build to
fulfill all actions regarding your chart folio.
Starting the application you have the choice
between a CA Wizard and the Chart Assistant
for advanced users. The Wizard will guide you
through a limited amount of actions CA is
capable of.
As mentioned in the Chapter Charts Transas ECDIS is capable to display multiple chart formats.
Depending on your chart supply and company regulations, you have to choose which charts you have on
board.
51
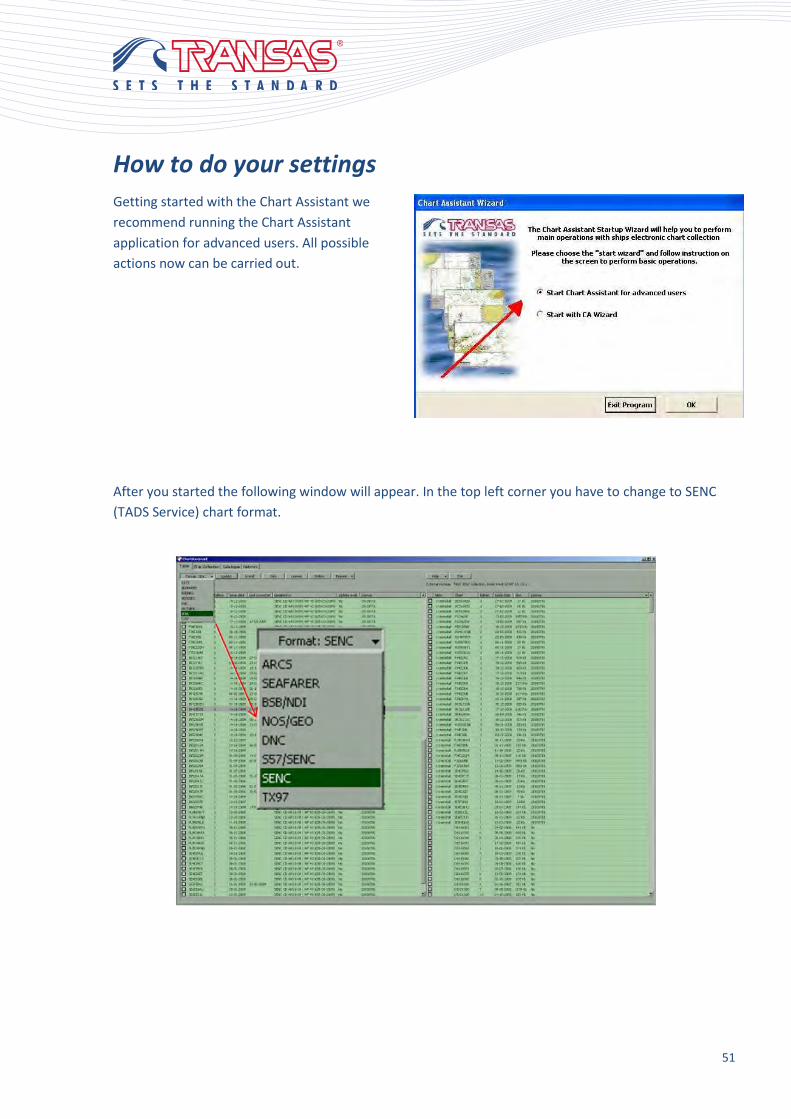
How to do your settings
Getting started with the Chart Assistant we
recommend running the Chart Assistant
application for advanced users. All possible
actions now can be carried out.
After you started the following window will appear. In the top left corner you have to change to SENC
(TADS Service) chart format.
52
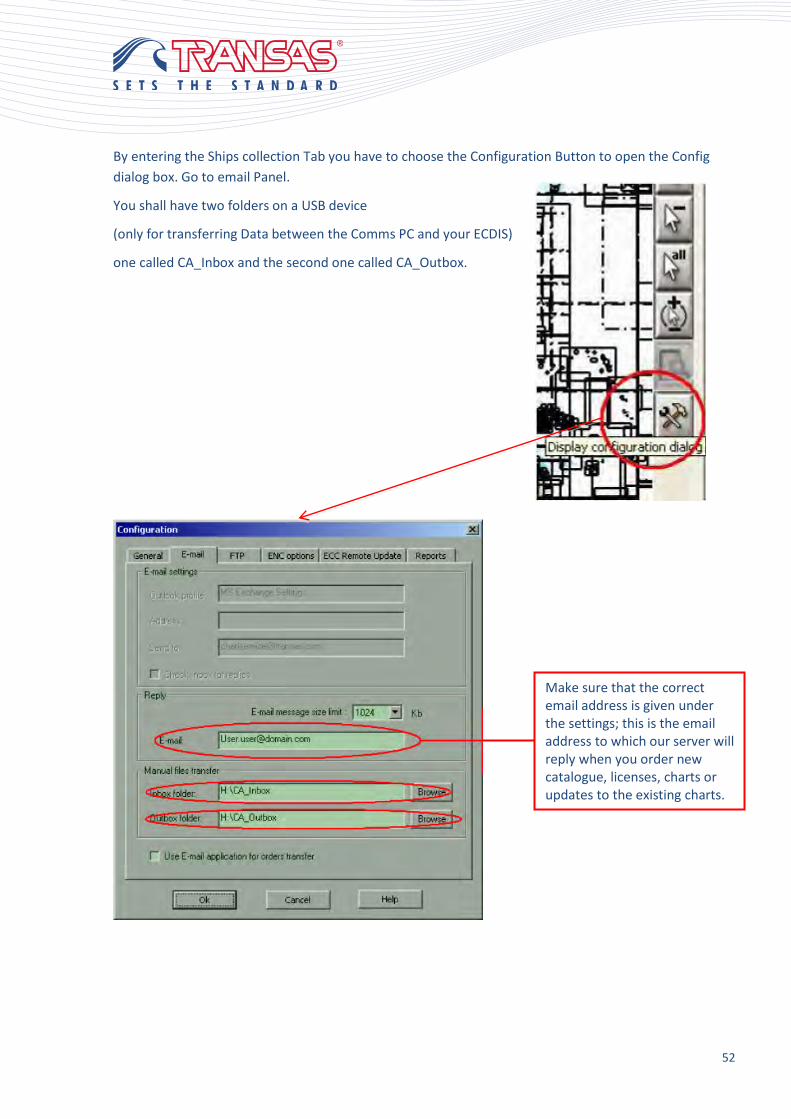
By entering the Ships collection Tab you have to choose the Configuration Button to open the Config
dialog box. Go to email Panel.
You shall have two folders on a USB device
(only for transferring Data between the Comms PC and your ECDIS)
one called CA_Inbox and the second one called CA_Outbox.
Make sure that the correct email address is given under the settings; this is the email address to which our server will reply when you order new catalogue, licenses, charts or updates to the existing charts.
53
Install your Chart & License
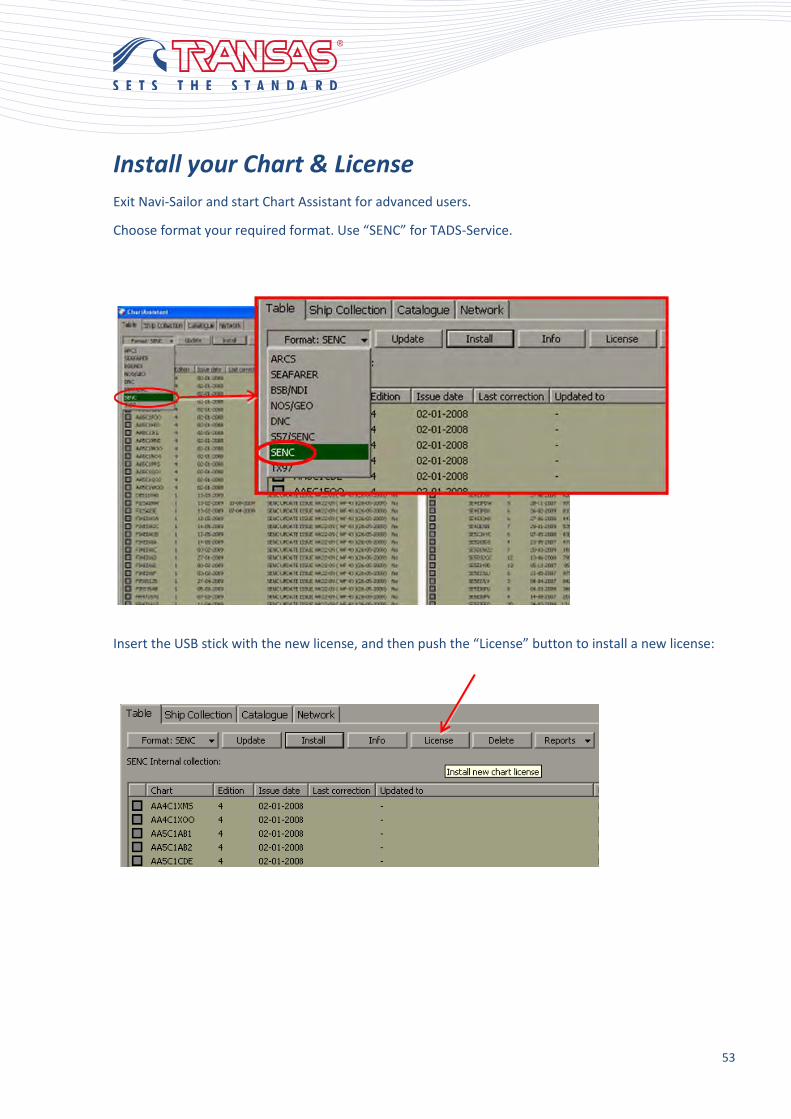
Exit Navi-Sailor and start Chart Assistant for advanced users.
Choose format your required format. Use “SENC” for TADS-Service.
Insert the USB stick with the new license, and then push the “License” button to install a new license:
54
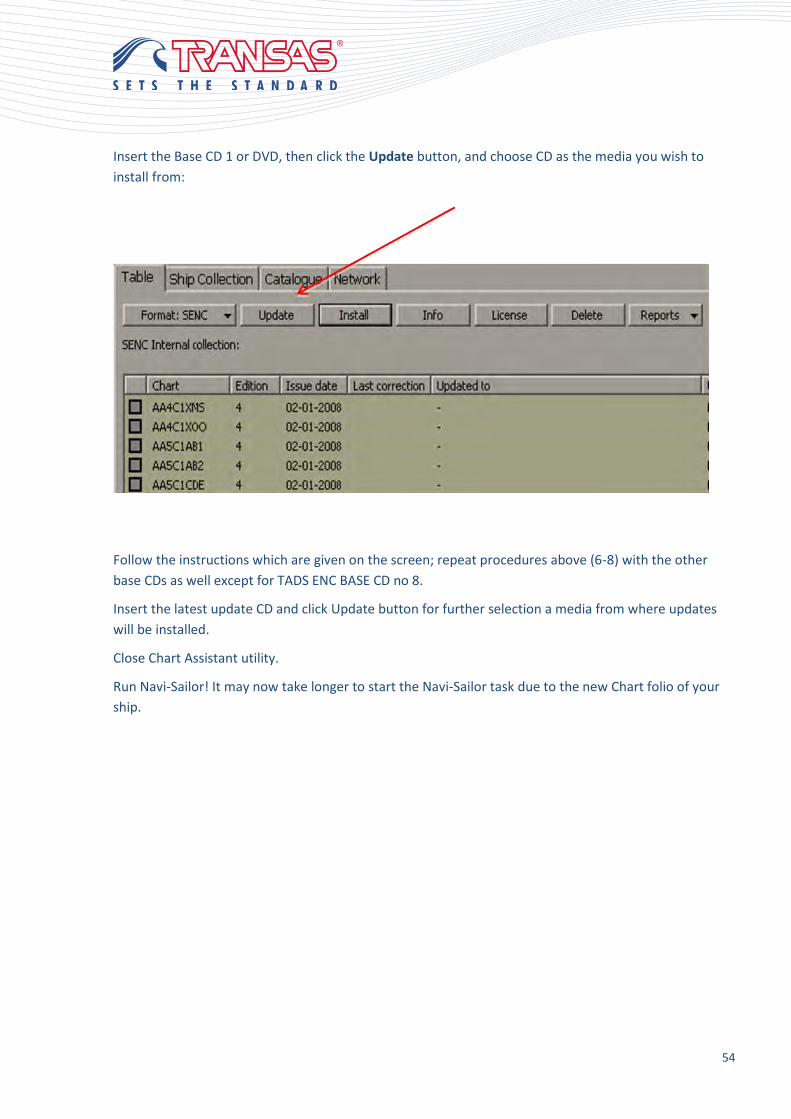
Insert the Base CD 1 or DVD, then click the Update button, and choose CD as the media you wish to
install from:
Follow the instructions which are given on the screen; repeat procedures above (6-8) with the other
base CDs as well except for TADS ENC BASE CD no 8.
Insert the latest update CD and click Update button for further selection a media from where updates
will be installed.
Close Chart Assistant utility.
Run Navi-Sailor! It may now take longer to start the Navi-Sailor task due to the new Chart folio of your
ship.
55
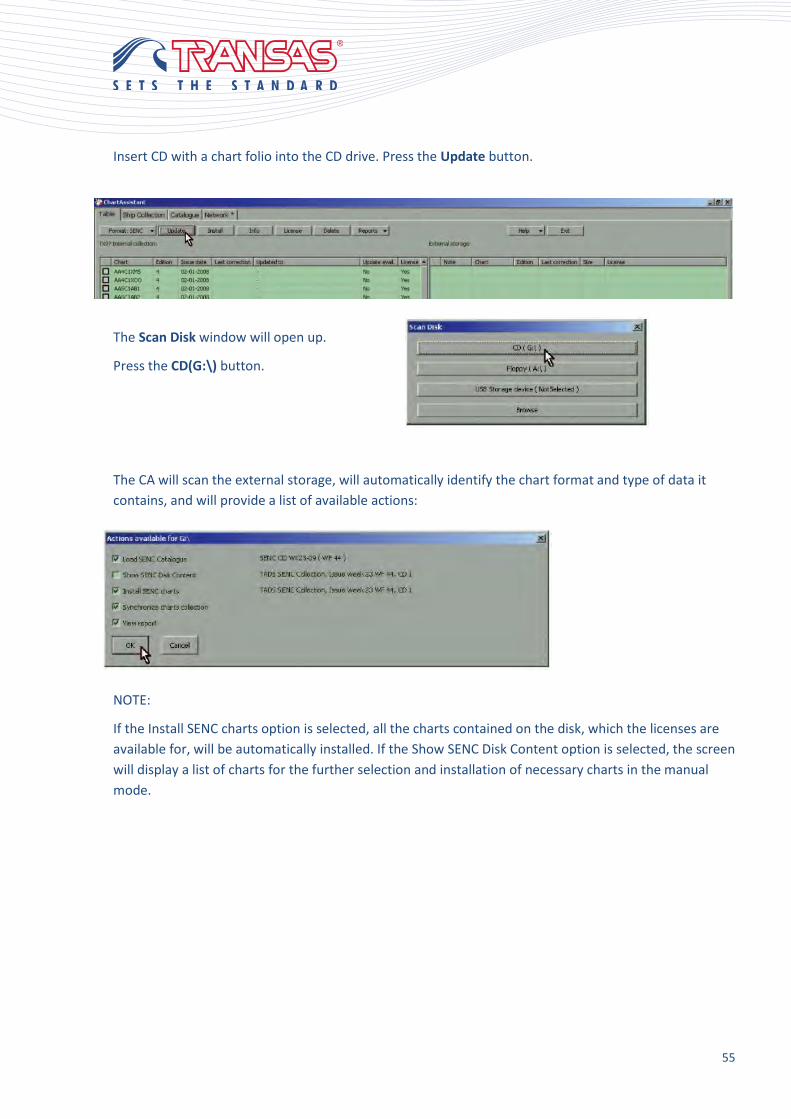
Insert CD with a chart folio into the CD drive. Press the Update button.
The Scan Disk window will open up.
Press the CD(G:\) button.
The CA will scan the external storage, will automatically identify the chart format and type of data it
contains, and will provide a list of available actions:
NOTE:
If the Install SENC charts option is selected, all the charts contained on the disk, which the licenses are
available for, will be automatically installed. If the Show SENC Disk Content option is selected, the screen
will display a list of charts for the further selection and installation of necessary charts in the manual
mode.
56
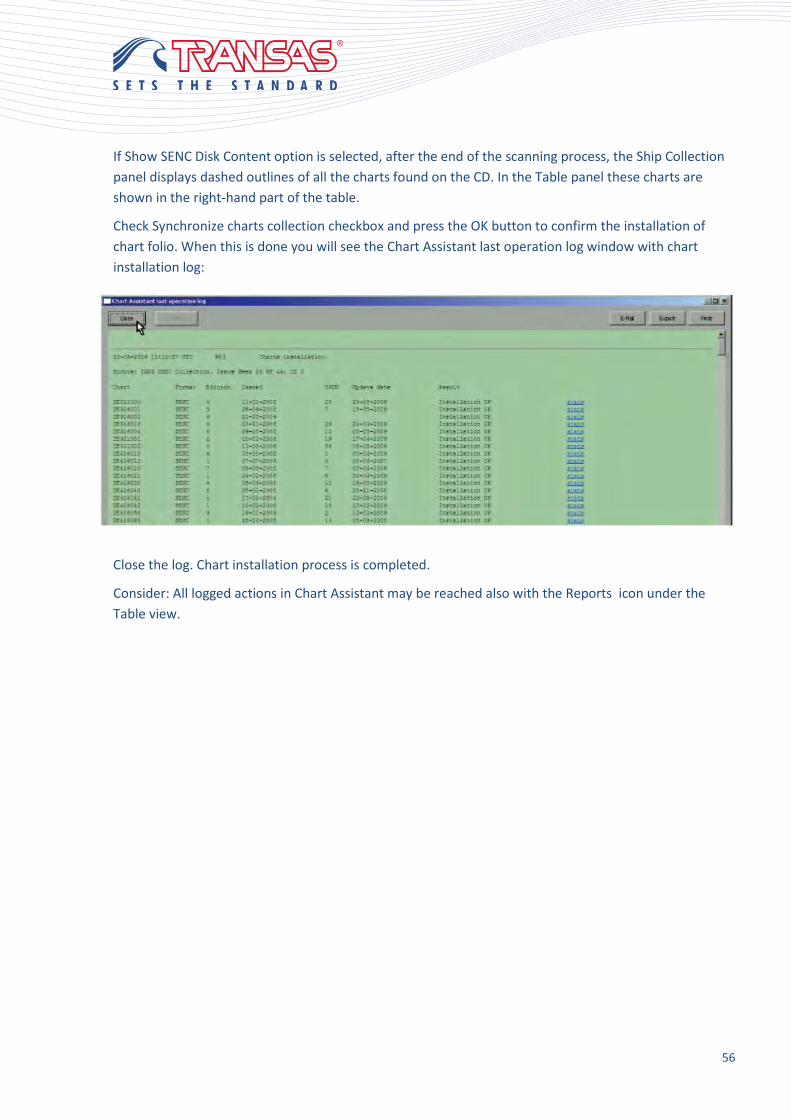
If Show SENC Disk Content option is selected, after the end of the scanning process, the Ship Collection
panel displays dashed outlines of all the charts found on the CD. In the Table panel these charts are
shown in the right-hand part of the table.
Check Synchronize charts collection checkbox and press the OK button to confirm the installation of
chart folio. When this is done you will see the Chart Assistant last operation log window with chart
installation log:
Close the log. Chart installation process is completed.
Consider: All logged actions in Chart Assistant may be reached also with the Reports icon under the
Table view.
57
Order Chart Licenses by Route
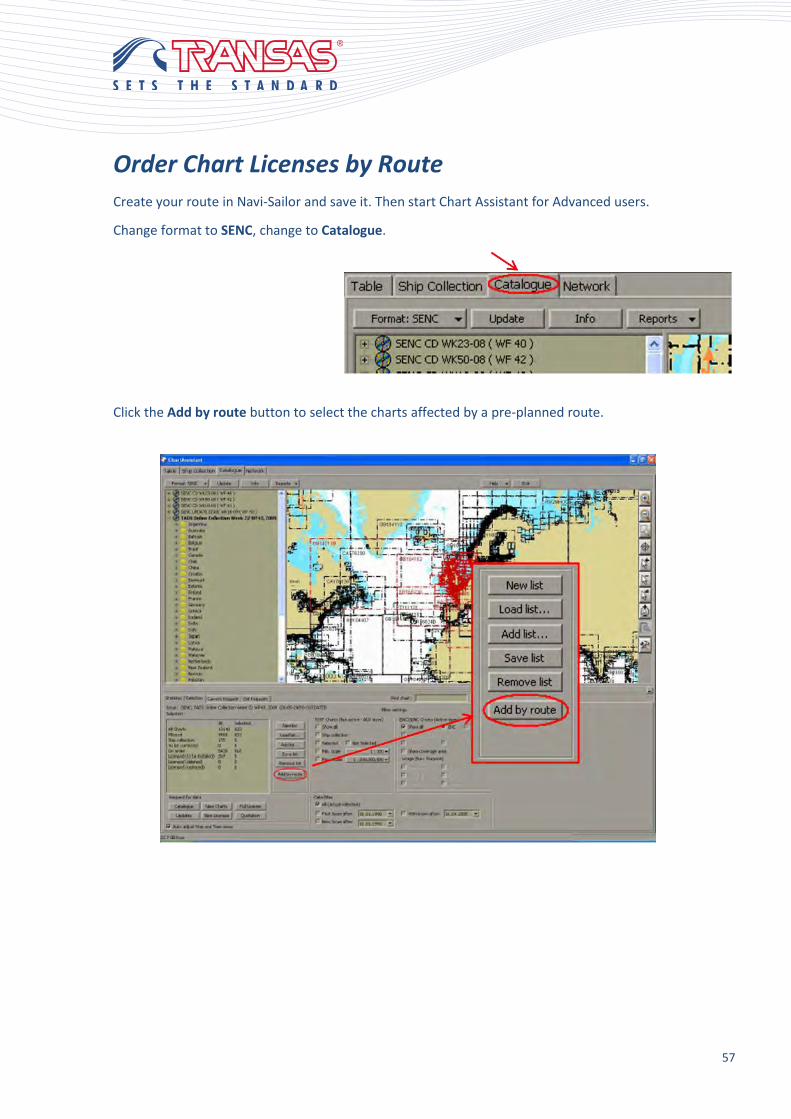
Create your route in Navi-Sailor and save it. Then start Chart Assistant for Advanced users.
Change format to SENC, change to Catalogue.
Click the Add by route button to select the charts affected by a pre-planned route.
58
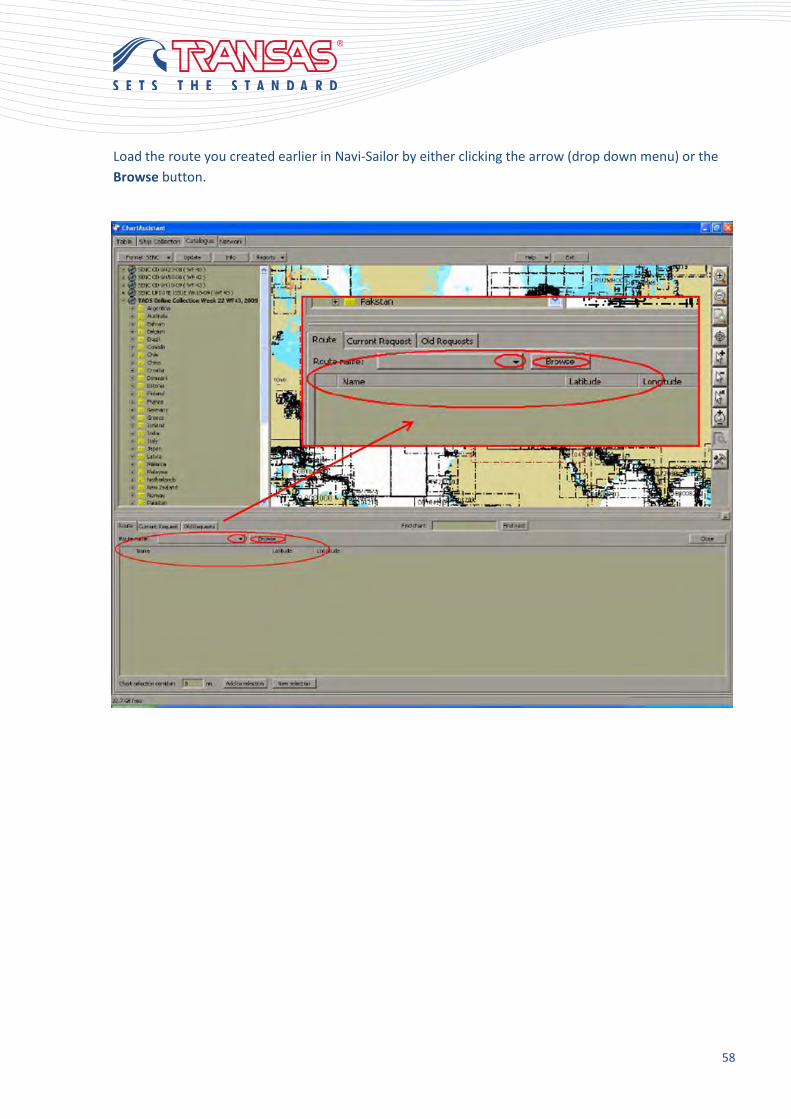
Load the route you created earlier in Navi-Sailor by either clicking the arrow (drop down menu) or the
Browse button.
59
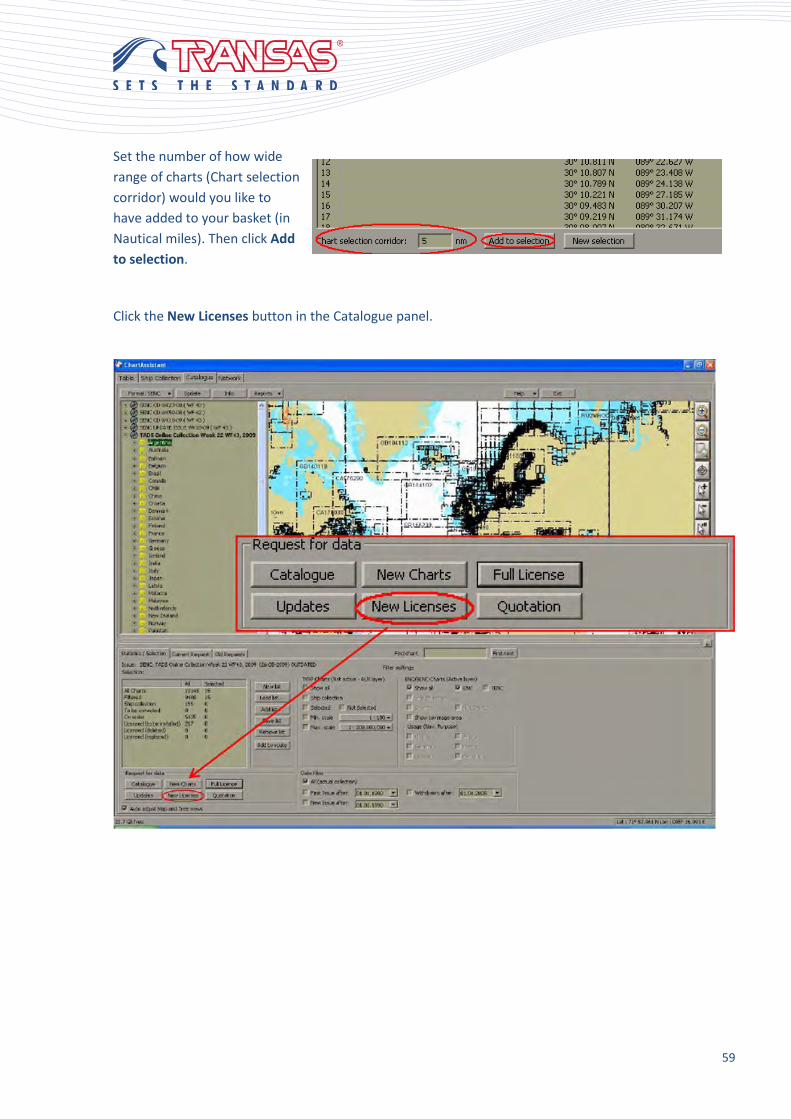
Set the number of how wide
range of charts (Chart selection
corridor) would you like to
have added to your basket (in
Nautical miles). Then click Add
to selection.
Click the New Licenses button in the Catalogue panel.
60
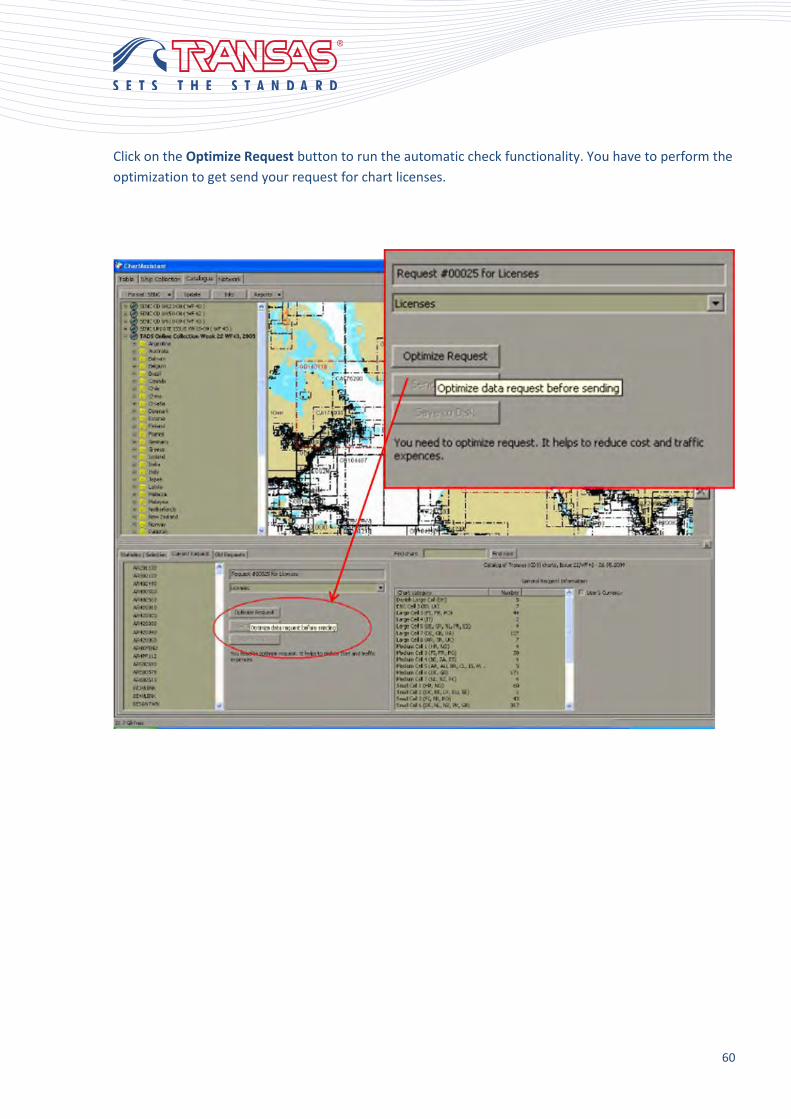
Click on the Optimize Request button to run the automatic check functionality. You have to perform the
optimization to get send your request for chart licenses.
61
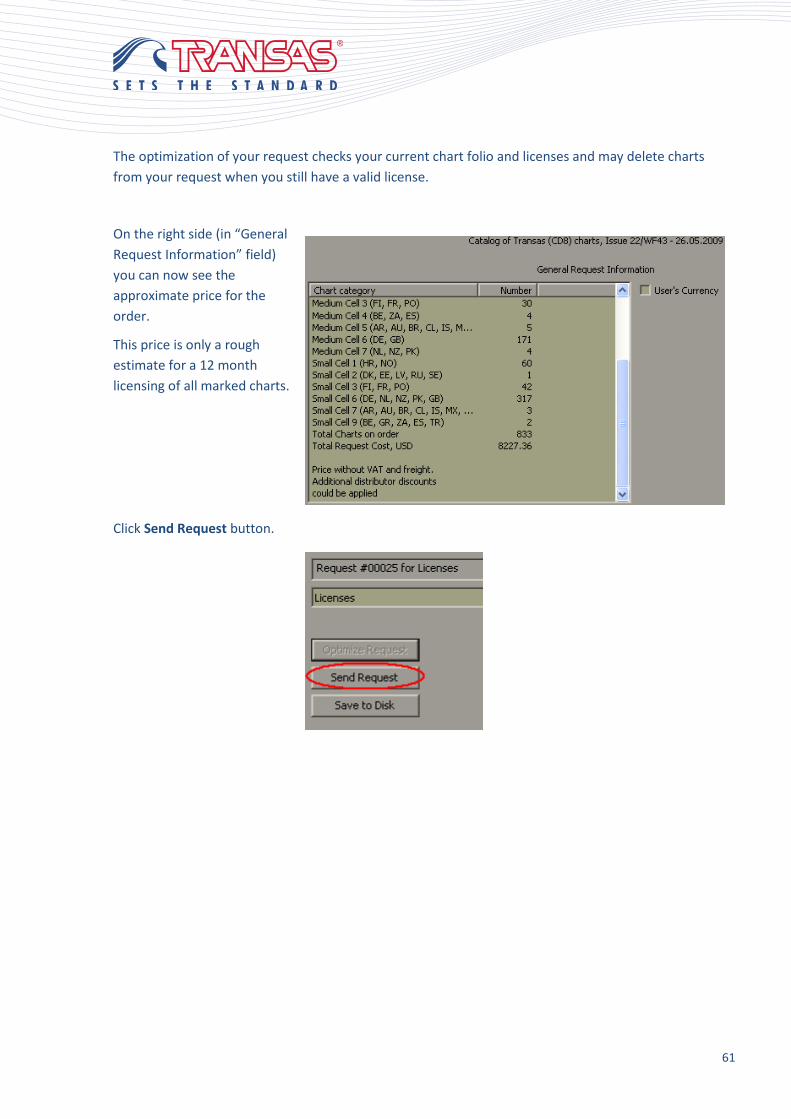
The optimization of your request checks your current chart folio and licenses and may delete charts
from your request when you still have a valid license.
On the right side (in “General
Request Information” field)
you can now see the
approximate price for the
order.
This price is only a rough
estimate for a 12 month
licensing of all marked charts.
Click Send Request button.

62
The dialog box will appear. Here you can find useful information about where the files will be saved and
where to send them. Create two folders on the USB stick, one called inbox and the second one called
Outbox (For full information upon on settings adjustment see How to do your settings in CA document).
Make sure your files will be saved on the USB stick in outbox. Click “finish”.
Bring the USB stick to your Internet/communication computer. Send the file you have just made to the
In a short while (as soon as Transas has confirmed the order) you will receive a new license sent to you
by email. Save the license on the USB stick in the Inbox folder. Bring the stick to the ECDIS and go to
Chart Assistant program. Chart Assistant will automatically detect the .cdf file containing the new
license.
When this is done, you will have to run the BASE CDs to load the new charts.
Run the latest update CD.
Your new charts are now in the system.

63
Update via CD
Make sure that you selected the relevant chart format. For TADS Service choose SENC chart format.
Press the Update button to perform the updating process.
The Scan Disk window will open up:
64
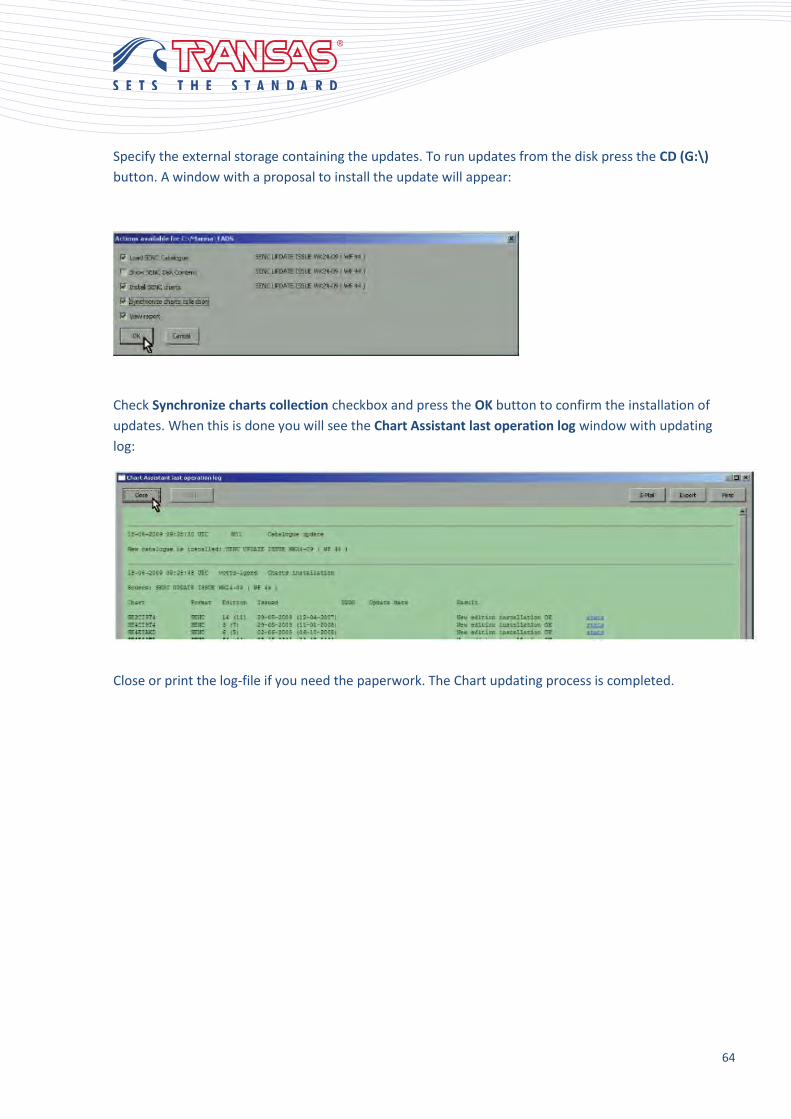
Specify the external storage containing the updates. To run updates from the disk press the CD (G:\)
button. A window with a proposal to install the update will appear:
Check Synchronize charts collection checkbox and press the OK button to confirm the installation of
updates. When this is done you will see the Chart Assistant last operation log window with updating
log:
Close or print the log-file if you need the paperwork. The Chart updating process is completed.
65
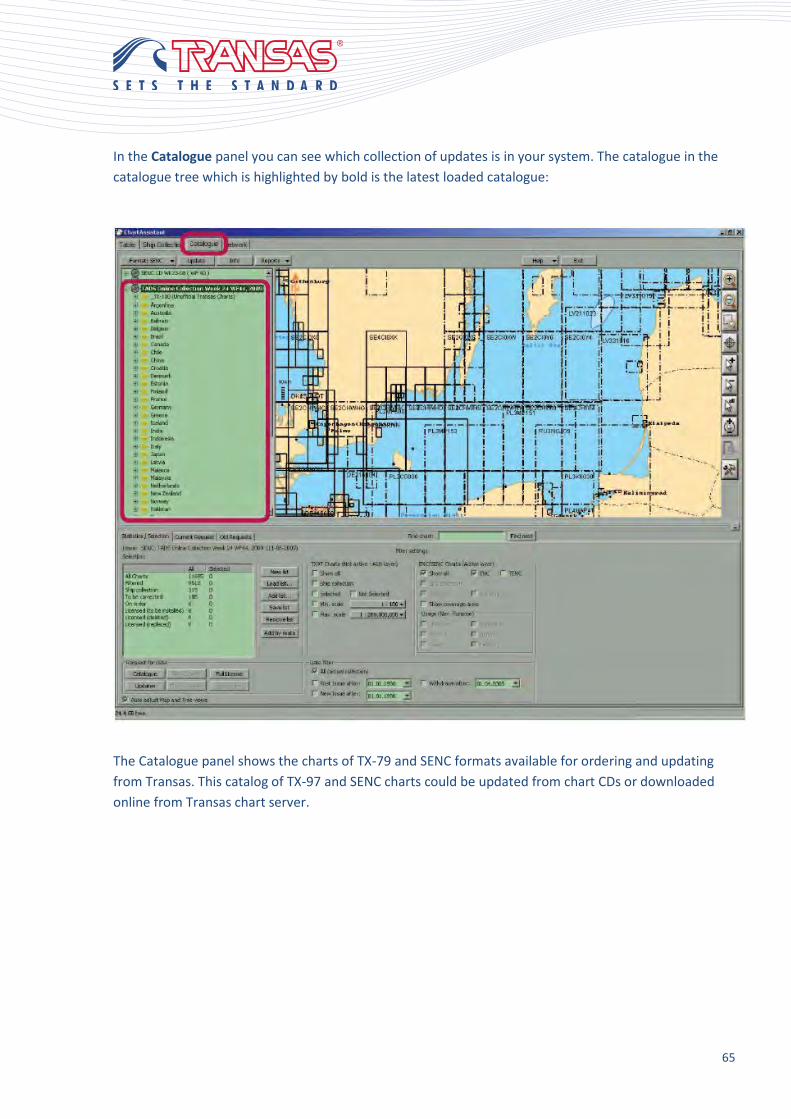
In the Catalogue panel you can see which collection of updates is in your system. The catalogue in the
catalogue tree which is highlighted by bold is the latest loaded catalogue:
The Catalogue panel shows the charts of TX-79 and SENC formats available for ordering and updating
from Transas. This catalog of TX-97 and SENC charts could be updated from chart CDs or downloaded
online from Transas chart server.
66
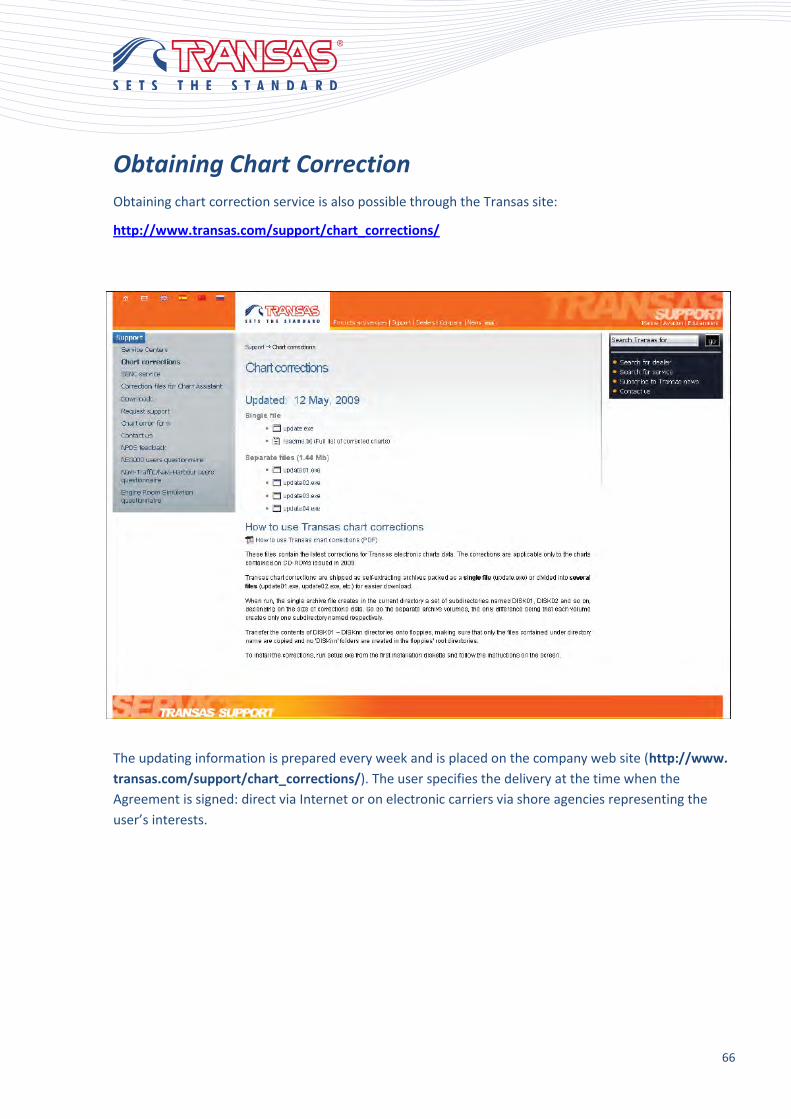
Obtaining Chart Correction
Obtaining chart correction service is also possible through the Transas site:
http://www.transas.com/support/chart_corrections/
The updating information is prepared every week and is placed on the company web site (http://www.
transas.com/support/chart_corrections/). The user specifies the delivery at the time when the
Agreement is signed: direct via Internet or on electronic carriers via shore agencies representing the
user’s interests.
67
Transas SENC Format Charts Updating
SENC updating data consists of:
• Update - includes all the incremental updating files in S-57 received since the time of
SENC CD issue (file Update<NN>_WF<XX>. exe); it should be noted that available for
installation is only the updating for charts purchased by the customer.
• New Charts - includes all the new charts in Transas SENC format received since the time
of SENC CD issue.
• New Edition - includes all the new edition charts in Transas SENC format not included in
SENC CD. The updating information is stored in the form of self-extracting archives (e.g.
Update24_WF44. exe).
For Transas format SENC, the following updating can be used:
• Open S-57 updating.
• S-57 updating encoded in accordance with S-63 standard (if valid permits are available).
• Transas encoded S-57 updating.
• Binary updating (received with e-mail from the Transas chart server).
ENC Format Charts Updating
ENC format charts can only be updated via the company’s Internet site (http://www. transas.
com/support/senc_data/). The collection on the site is updated every week.
68
How to use the official chart corrections
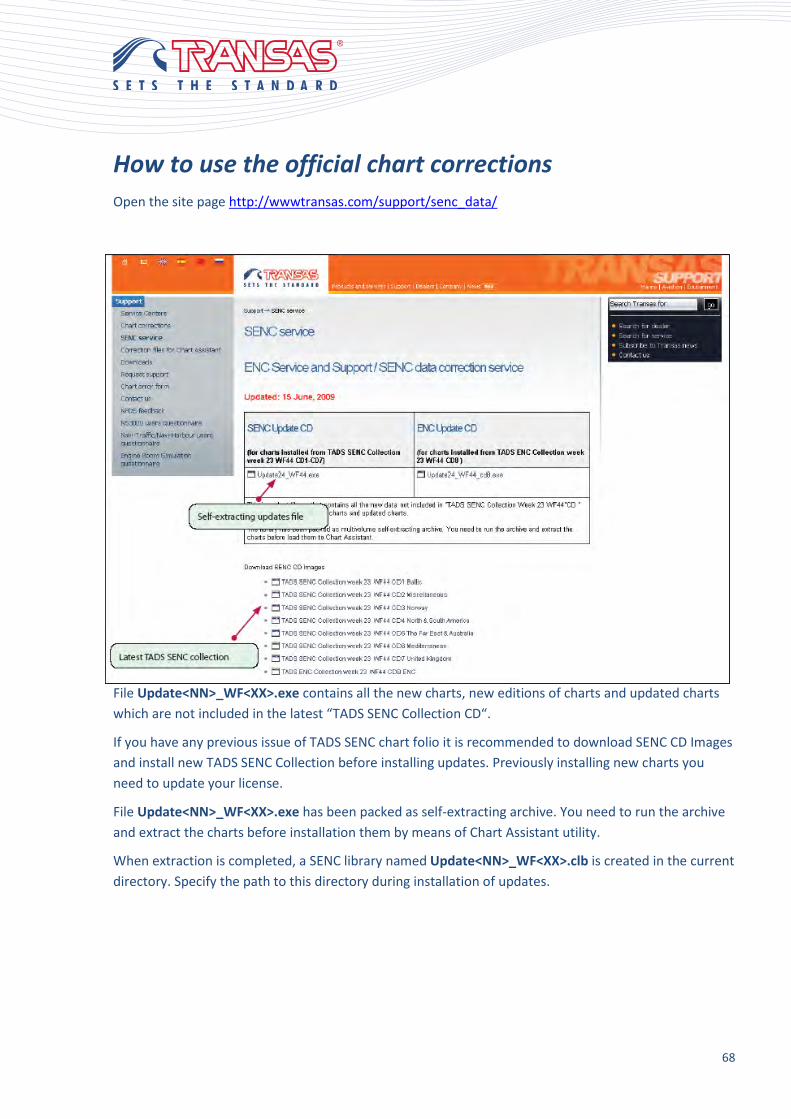
Open the site page http://wwwtransas.com/support/senc_data/
File Update<NN>_WF<XX>.exe contains all the new charts, new editions of charts and updated charts
which are not included in the latest “TADS SENC Collection CD“.
If you have any previous issue of TADS SENC chart folio it is recommended to download SENC CD Images
and install new TADS SENC Collection before installing updates. Previously installing new charts you
need to update your license.
File Update<NN>_WF<XX>.exe has been packed as self-extracting archive. You need to run the archive
and extract the charts before installation them by means of Chart Assistant utility.
When extraction is completed, a SENC library named Update<NN>_WF<XX>.clb is created in the current
directory. Specify the path to this directory during installation of updates.
69
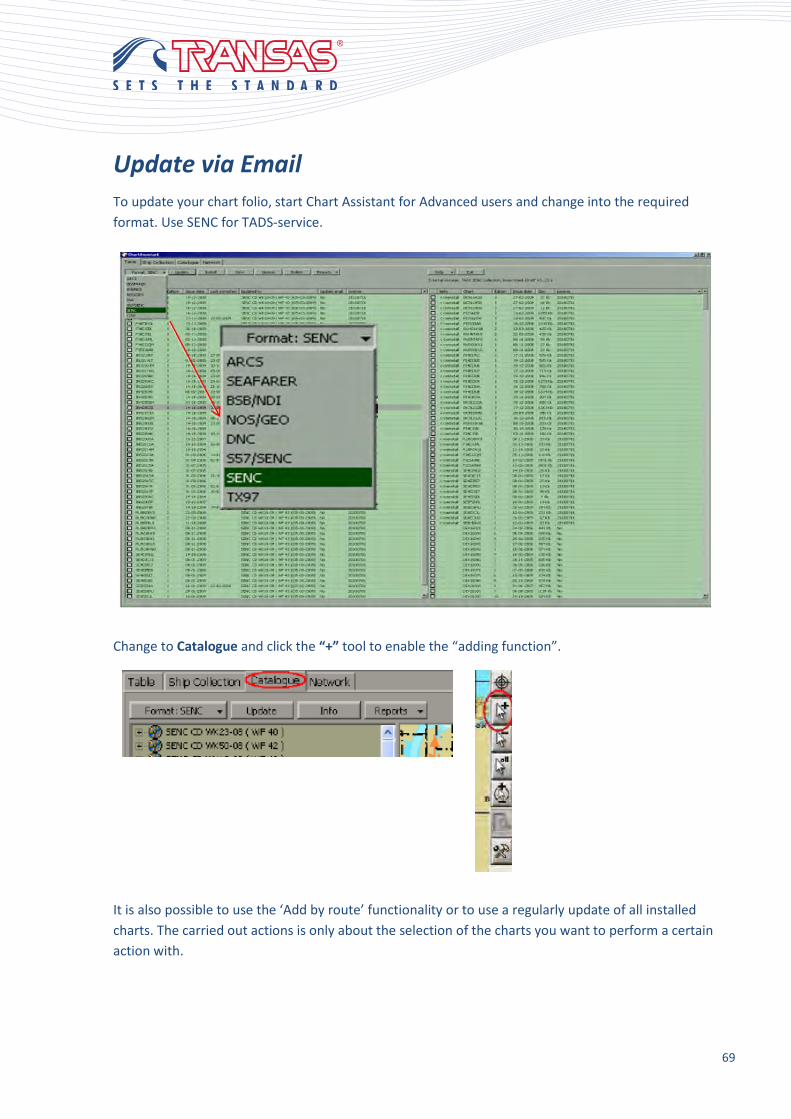
Update via Email
To update your chart folio, start Chart Assistant for Advanced users and change into the required
format. Use SENC for TADS-service.
Change to Catalogue and click the “+” tool to enable the “adding function”.
It is also possible to use the ‘Add by route’ functionality or to use a regularly update of all installed
charts. The carried out actions is only about the selection of the charts you want to perform a certain
action with.
70
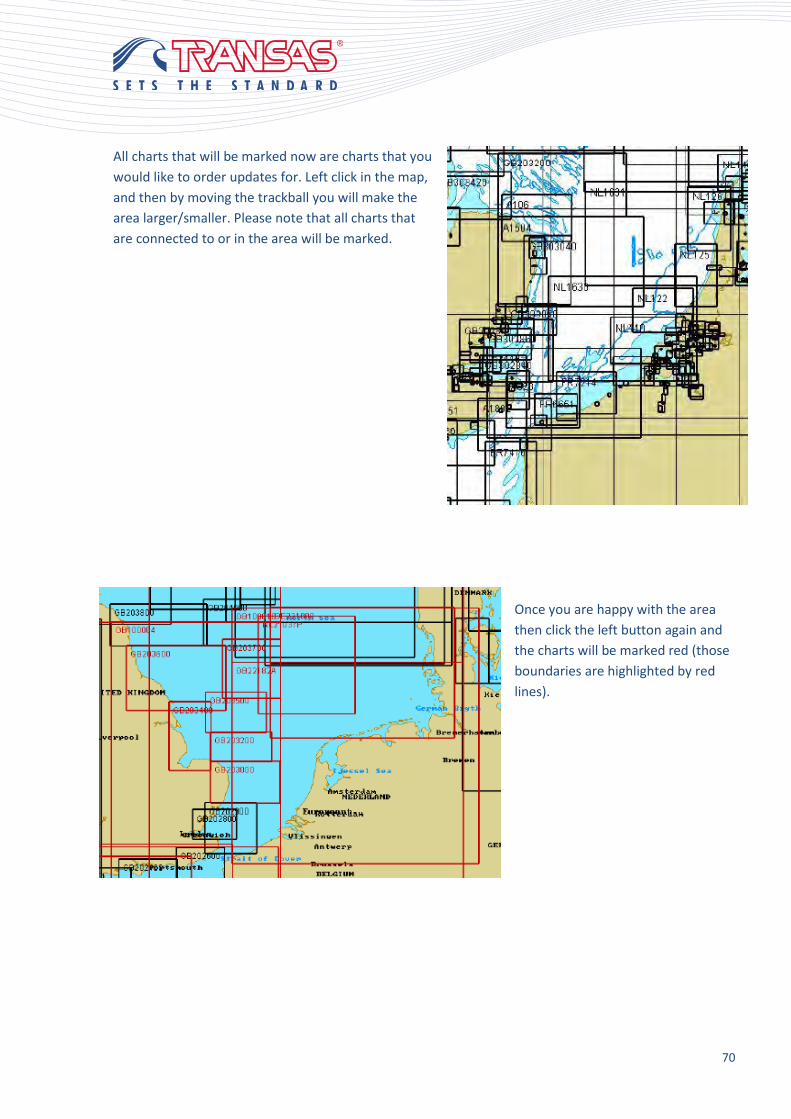
All charts that will be marked now are charts that you
would like to order updates for. Left click in the map,
and then by moving the trackball you will make the
area larger/smaller. Please note that all charts that
are connected to or in the area will be marked.
Once you are happy with the area
then click the left button again and
the charts will be marked red (those
boundaries are highlighted by red
lines).

71
Click the button “Updates”.
Click Optimize request.
(Only licensed charts are available for
updates, unlicensed will be
excluded).
NOTE that if you want to order
updates for all installed charts you
can check that box and in case of
that you don’t have to mark any
chart manually.
72
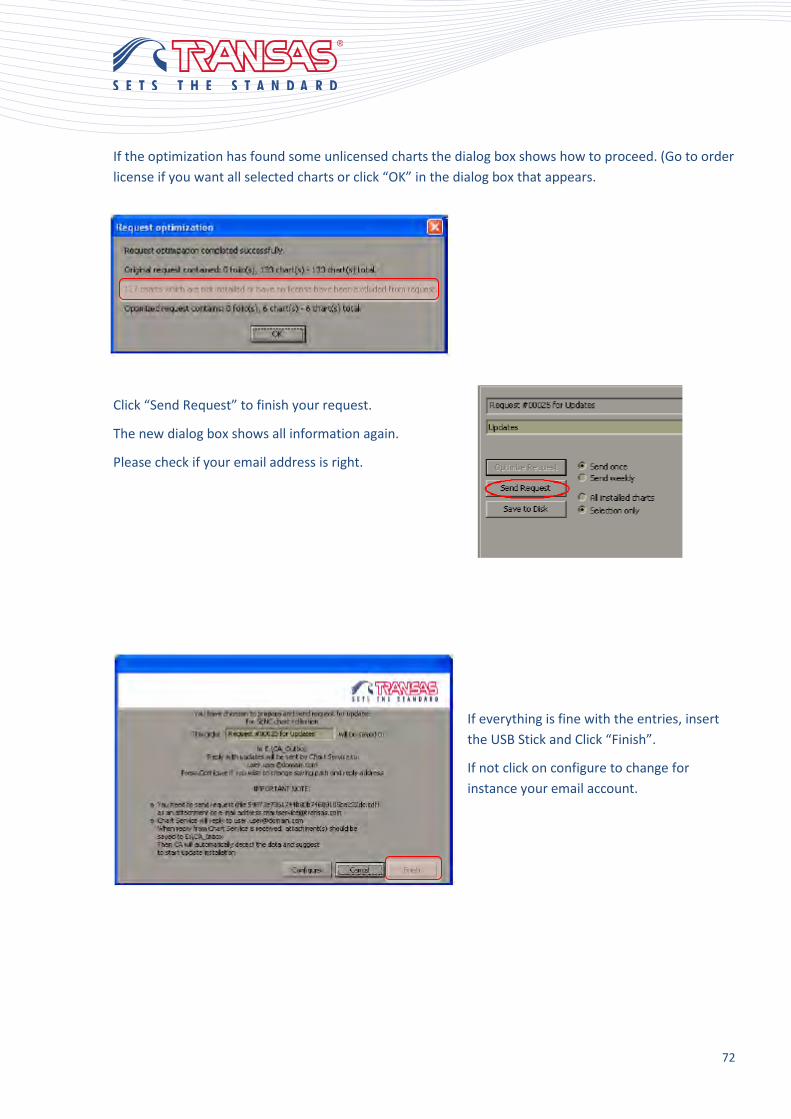
If the optimization has found some unlicensed charts the dialog box shows how to proceed. (Go to order
license if you want all selected charts or click “OK” in the dialog box that appears.
Click “Send Request” to finish your request.
The new dialog box shows all information again.
Please check if your email address is right.
If everything is fine with the entries, insert
the USB Stick and Click “Finish”.
If not click on configure to change for
instance your email account.

73
To send the request, attach your USB device to the internet/communication computer on the bridge
and send the .cdf file as an attachment to the [email protected].
A new file/ files will be sent to you from our chart server. Save this file on the USB stick (same place as
you use to save received files from TRANSAS). Insert the USB stick into the ECDIS and Chart Assistant will
automatically recognize the new updates and ask if you want to install them.
Once they are installed you can take out a report to find out what has been
done.
Synchronize your Network with your other workstations to have the latest update available on all
workstations.
Note: Do not try to open your sent .cdf files and also the reply of the chart server. The Chart Assistant
will recognize these files as corrupted and not install them.

74
Answers to Exercises and Questions
Answers to Questions 1
1. Raster charts are scanned images of traditional paper charts and look similar displayed in an
ECDIS Computer this mode is called RCDS.
2. Vector charts are capable of creating alarms on charted objects due to the safety parameters of
ship or users discretion e.g. Area Alarms or CPA alarm.
3. Also vector charts are produced in a certain scale. Raster charts will get more and more pixeled
in the ECDIS presentation by zooming in so the user is aware of a more and more inaccurate
display on the screen. By zooming in a vector chart the display assumes to be precise, but in fact
the charted data is only also getting inaccurate. This inaccuracy is displayed at the left below
corner of the chart panel with two orange lines.
Back to questions
Answers to Exercise 1
1. Povorotnyy Lighthouse, white tower as light support, height 18 m, additionally all light
information of the different sectors may be read out.
2. St. Petersburg.
3. Distance is 725,39 NM, western cardinal buoy Amrumbank W.
4. Bearing 137.7° - 8,22 NM to Amrumbank S cardinal buoy.
Back to exercise
75
Answers to Exercise 2
1. Safety contour takes now the 10m contour line from the chart and displays the spot sounding of
less than 10m in black.
2. There is a starboard hand lateral mark which may be found under the buoy information in the
list.
3. Now ECDIS displays the 15m contour line being the border between navigable and non-
navigable waters.
4. Indicating an isolated danger within the navigable waters you defined, but of a depth less
than your entered value or of an unknown depth.
5. With this 15m safety contour an obstruction topic has been added to the information window.
6. ECDIS is displaying again the 10m contour line as starting the non-navigable waters all spot
soundings of a depth less than 8m are displayed in black the others in light grey.
Back to exercise
76
Answers to Questions 2
1. Standard Display, Custom Display and All Layers. The only on which is not allowed is Base
Display, it is available as a reference for other used tasks.
2. The contour which represents the safety contour value or the next deeper contour line available
in the chart.
3. What is the significant difference between these two S-52 chart symbols?
4. They are displayed in Standard, Custom and All Layers.
5. The Information cursor.
6. WGS 84.
7. The ENC vector chart is originated by an official hydrographic office and is the only chart which
may act as a substitute of the traditional paper chart.
8. Always the best scaled chart which is available on your ECDIS Computer.
9. They are timely ordered.
10. You will activate the previously selected cursor mode at the same time the information window
opens and the cursor is caught in the chart panels limitations
Back to questions
Answers to Questions 3
1. Both actions can be carried out graphically by using the cursor, tabular by entering numerical
values in the table and in a semi graphical mode by using the information window entered with
the TAB key functionality.
2. Great Circle (GC), Rhoumb Line (RL)
3. Every ENC Chart may have coding errors. A manual route check also may eliminate some
automatic generated Alarms by zooming in to a better scaled chart along your planned route.
Back to questions
They are both displaying isolated dangers. The magenta colored is an
isolated danger which is a danger for your vessel on the entered safety
values but within the navigable waters
The dotted line is the display if the isolated danger is in the non-navigable
area ((below your safety contour) or in navigable waters when it is safe to
pass over.
77
Answers to Exercise 5
Create a new route using the positions from the Waypoint list.
WP 1: Norfolk Lambertspoint Coal Pier
WP 2: Sewels Point
WP 3: Cheasapeake BayApproach Bouy
WP 4: North American Basin Nares Abyssal Plain
WP 5: Approach English Channel
WP 6: Kingsnorth Jetty
Name of the Route: Norfolk – Kingsnorth Oil Rafinery.
Back to exercise
Answers to Exercise 6
During the Route check also consider to change the safety scale to a appropriate scale for your voyage
and activate all necessary warnings which may be good to know for you in advance when planning a trip
on that route. Also check the XTD. Use the information cursor to check and double check found alerts.
SOA: 7,3 kn.
ETA on WP 10 01-11-12 17:21 at a SOA of 14 kn.
SOA with 30 min stop and 12 kn up to WP 7 is 7,7 kn.
The live running ECDIS System is capable of taking Tidal and surface currents into account. It is
possible to use Total Tide database for official data and a Transas owned database which comes
by default with ship borne equipment.
The SOA for the last three waypoints is 10,6 if taking also currents into account.
Distance between WP 7 and WP 10 is 5.54 nm.
Back to exercise

78
Answers to Questions 4
1. It is displayed as a red bold line and it is only possible to monitor one route.
2. The same route has to be loaded to the Voyage planner tool first. Then using the WPT Editor
functionality.
3. Steps you need to follow to monitor a route and maintain safety
a. These charts have been updated to the latest available update
b. The user has activated the safety frame
c. The use has set appropriate safety depth and safety contour
d. This route has been checked for safety
e. The safety frame has been set with appropriate safety parameters
f. The ECDIS is using ENC charts
g. These charts are of the latest edition
h. All relevant route monitoring alarms are activated
i. The user has created a route for the intended voyage
j. The user has activated the route monitoring function
Back to questions
Answers to Questions 5
1. All answers are correct.
2. All answers are correct.
3. The more stars the M-Quality object has the more accurate the survey was carried out. 5 stars
stand for CAT ZOC A 2, two for D
Back to questions
