tram passenger survey (tps) sheffield autumn 2016 results
TRANSCRIPT

Tram Passenger Survey (TPS) Sheffield
Autumn 2016 results
Robert PainTel: 0300 123 0835 Email: [email protected]
Insight Team, Transport Focus, Fleetbank House, 2-6 Salisbury Square, London, EC4Y 8JXMarch 2017

22
Contents
Overview
• Context to the survey 3
• Summary of 2016 findings 6
The findings
• Experience and opinions of the journey 14
• Waiting at the stop 21
• The tram 28
• Negative experiences during the journey 33
• Passengers’ suggested improvements 37
• Opinion of trams in the local area 40
Further information
• Appendix 1: Passenger and journey context 43
• Appendix 2: Further detail on survey background and method 60
• Appendix 3: Questionnaire 66

TPS 2016 Sheffield
Context to the survey

44
The Tram Passenger Survey (TPS)
The TPS provides a consistent, robust measurement of
passenger satisfaction with tram services in Britain
It also informs our understanding of barriers to (greater) tram
use, how to encourage greater use, and how to improve the
passenger experience
Comparisons can also be made with passenger experiences
on buses and trains, as measured by the Bus Passenger
Survey (BPS) and National Rail Passenger Survey (NRPS)
The 2016 TPS covered tram services in Manchester,
Birmingham, Blackpool, Edinburgh, Nottingham and Sheffield
Context to the 2016 survey
The survey method
Passengers are approached while making a journey; they answer the survey about that journey specifically
The questionnaire is self-completion, with passengers offered a choice of online or paper
Interviewers approached passengers on all days of the week between 6am and 10pm, between
26 September and 4 December 2016
283 surveys were completed for Sheffield in Autumn 2016
For further details of the survey method, see Appendix
5
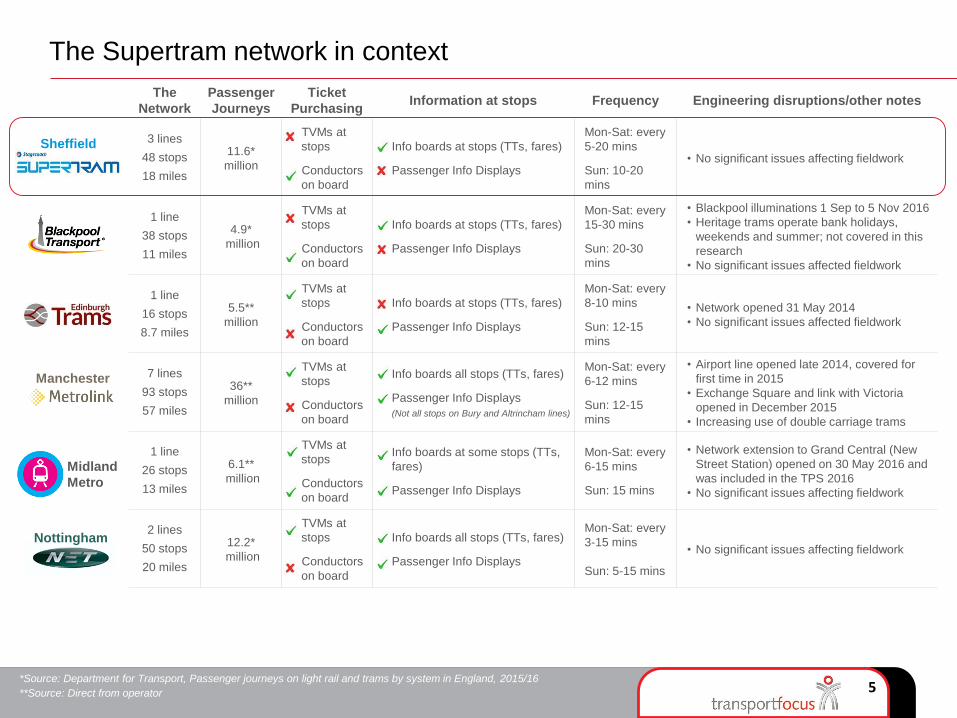
The Supertram network in context
The
Network
Passenger
Journeys
Ticket
Purchasing Information at stops Frequency Engineering disruptions/other notes
3 lines
48 stops
18 miles
11.6*
million
TVMs at
stops
Conductors
on board
Info boards at stops (TTs, fares)
Passenger Info Displays
Mon-Sat: every
5-20 mins
Sun: 10-20
mins
• No significant issues affecting fieldwork
1 line
38 stops
11 miles
4.9*
million
TVMs at
stops
Conductors
on board
Info boards at stops (TTs, fares)
Passenger Info Displays
Mon-Sat: every
15-30 mins
Sun: 20-30
mins
• Blackpool illuminations 1 Sep to 5 Nov 2016
• Heritage trams operate bank holidays,
weekends and summer; not covered in this
research
• No significant issues affected fieldwork
1 line
16 stops
8.7 miles
5.5**
million
TVMs at
stops
Conductors
on board
Info boards at stops (TTs, fares)
Passenger Info Displays
Mon-Sat: every
8-10 mins
Sun: 12-15
mins
• Network opened 31 May 2014
• No significant issues affected fieldwork
7 lines
93 stops
57 miles
36**
million
TVMs at
stops
Conductors
on board
Info boards all stops (TTs, fares)
Passenger Info Displays
(Not all stops on Bury and Altrincham lines)
Mon-Sat: every
6-12 mins
Sun: 12-15
mins
• Airport line opened late 2014, covered for
first time in 2015
• Exchange Square and link with Victoria
opened in December 2015
• Increasing use of double carriage trams
1 line
26 stops
13 miles
6.1**
million
TVMs at
stops
Conductors
on board
Info boards at some stops (TTs,
fares)
Passenger Info Displays
Mon-Sat: every
6-15 mins
Sun: 15 mins
• Network extension to Grand Central (New
Street Station) opened on 30 May 2016 and
was included in the TPS 2016
• No significant issues affecting fieldwork
2 lines
50 stops
20 miles
12.2*
million
TVMs at
stops
Conductors
on board
Info boards all stops (TTs, fares)
Passenger Info Displays
Mon-Sat: every
3-15 mins
Sun: 5-15 mins
• No significant issues affecting fieldwork
*Source: Department for Transport, Passenger journeys on light rail and trams by system in England, 2015/16
Nottingham
Sheffield
Manchester
**Source: Direct from operator
Midland
Metro
TPS 2016 Sheffield
Summary of 2015 results

7Figures shown are total very or fairly satisfied.
Last year’s figure is shown in grey

8

9
91
93
9
Overall passenger experience in Sheffield 2016: comparison to all networks
Overall journey satisfaction: 2016
All
Networks
9492
97
9190 90
9293
70
75
80
85
90
95
100
2013 2014 2015 2016
Sheffield
All networks*
Overall journey satisfaction: trend
*The 2013 survey did not include Edinburgh Trams
Statistically significant increase since 2015
No change
Statistically significant decrease since 2015

1010
What makes a satisfactory or great journey on Supertram?
The top factors linked to overall journey satisfaction on Supertram*
Tram stop condition
Cleanliness and condition of the tram
2%2%
3%
3%
What makes a satisfactory journey? What makes a great journey?
*Key Driver Analysis looks at fare paying passengers’ overall journey satisfaction response and their response to the 25 individual satisfaction measures in the survey (including value for
money), which have been grouped into 10 themes based upon a statistical analysis of the responses.
The left hand chart shows which themes most differentiate between those not satisfied and satisfied overall – making a journey ‘satisfactory’.
The right hand chart shows which themes most differentiate between those fairly and very satisfied overall – making a ‘great’ journey.
The analysis combines data from 2015 and 2016 surveys to increase robustness. It also excludes satisfaction measures relating to tram staff; due to differences in staff availability across the
networks not all TPS questionnaires feature questions about tram staff. In order to run the analysis in a consistent and practical manner all staff measures have been excluded.
See appendix 2 for a full explanation of the analysis to identify factors linked to overall journey satisfaction.
11
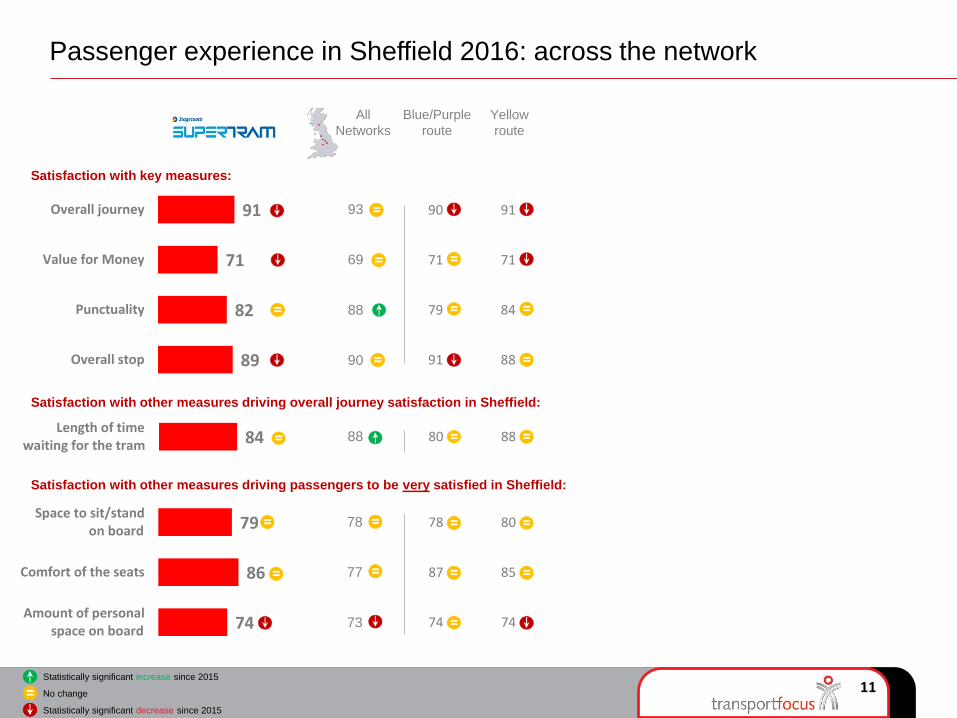
91
71
82
89
Overall journey
Value for Money
Punctuality
Overall stop
All
Networks
Blue/Purple
route
Yellow
route
93
69
88
90
Satisfaction with key measures:
Passenger experience in Sheffield 2016: across the network
Statistically significant increase since 2015
No change
Statistically significant decrease since 2015
78 80
87 85
74 74
Satisfaction with other measures driving overall journey satisfaction in Sheffield:
84 Length of timewaiting for the tram
79
86
74
Space to sit/stand on board
Comfort of the seats
Amount of personal space on board
Satisfaction with other measures driving passengers to be very satisfied in Sheffield:
80 88
90 91
71 71
79 84
91 88
88
78
77
73

1212
Sheffield 2016: summary of key findings (1)
• Overall satisfaction for journeys on Sheffield Supertram has fallen significantly, from 97 per
cent of passengers satisfied in 2015 to 91 per cent satisfied in 2016. This significant decrease
has been driven by younger males, and those using Supertram to commute
• The key factors which make journeys satisfactory on Supertram relate to the timeliness of
trams. Satisfaction with punctuality and the length of time waiting for the tram has decreased
since last wave (from 85 per cent in 2015 to 82 per cent in 2016 for punctuality and from 86
per cent in 2015 to 84 per cent in 2016 for length of wait time)
• The key factor which makes passengers ‘very’ rather than ‘fairly’ satisfied with journeys on
Supertram is the environment and comfort on board. Passenger satisfaction with the amount
of personal space on board and the provision of grab rails has decreased significantly since
2015 (from 83 per cent to 74 per cent and 91 per cent to 84 per cent respectively). Satisfaction
with other factors have also decreased since last year (although not significantly): availability
of space to sit or stand and the temperature on board
• Amongst fare paying passengers, satisfaction with value for money has decreased
significantly to 71 per cent satisfied (2015: 83 per cent). This has been driven by those in the
16-34 age group and those using Supertram to commute
• When evaluating satisfaction with value for money, the cost for the distance travelled remains
the most important factor

1313
Sheffield 2016: summary of key findings (2)
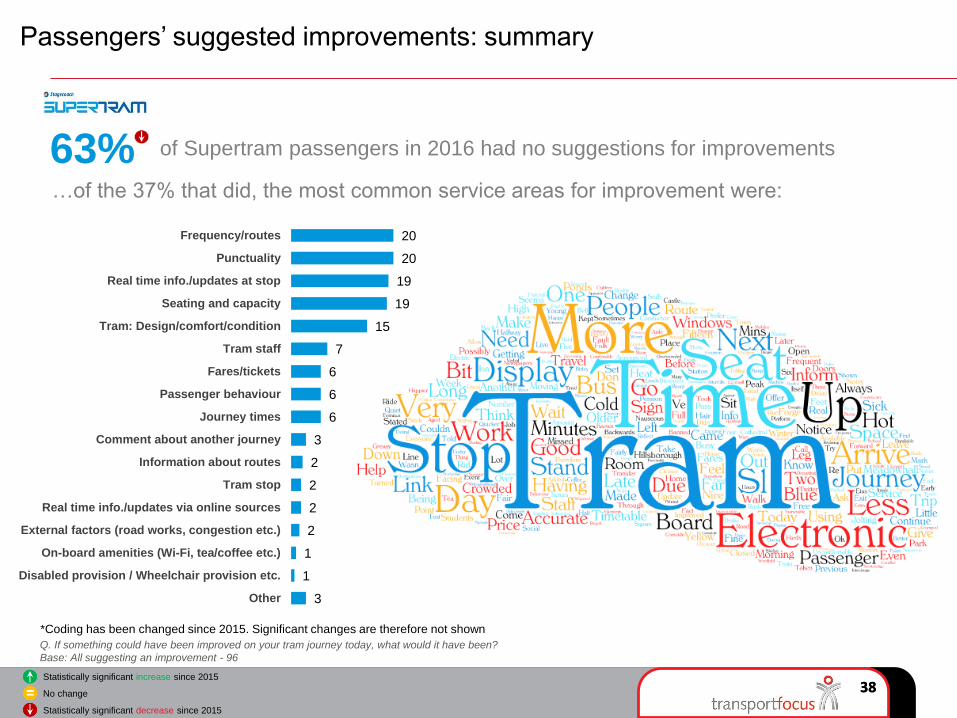
• Just over a third of passengers (37 per cent) spontaneously mentioned an improvement that
could be made to their journey. Passenger comments mostly related to the frequency of trams,
tram routes and the punctuality of trams
• Other improvements mentioned by passengers related to having real time information at tram
stops and the seating and capacity of trams
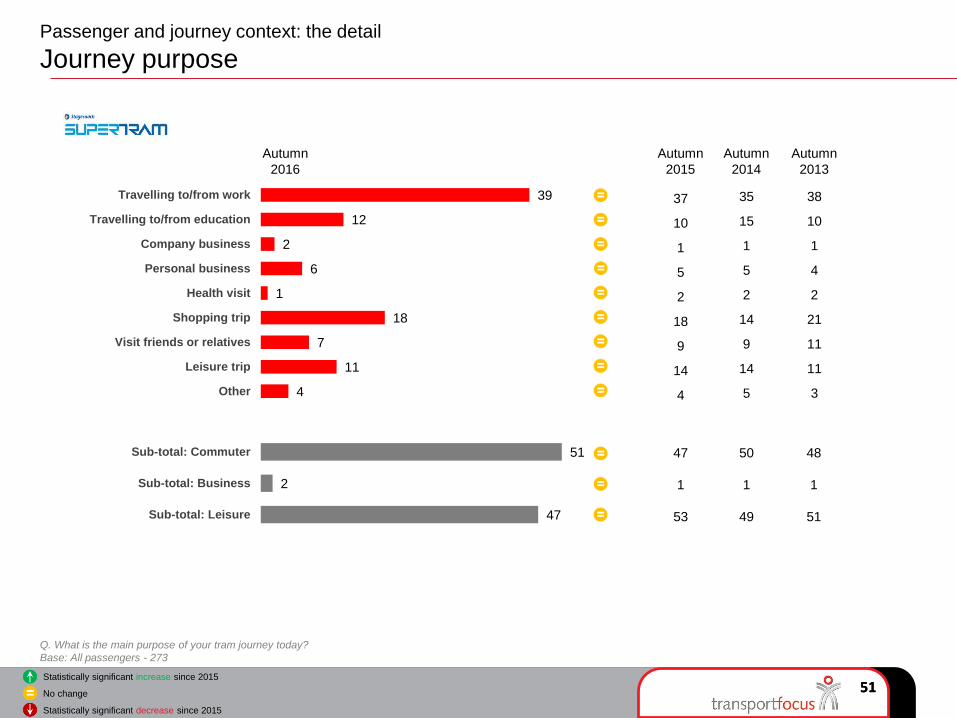
• Just over half pas passengers (51 per cent) were using Supertram to commute: 39 per cent
were commuting to work and 12 per cent to education
• Just over a quarter of passengers (27 per cent) were using a concessionary ticket (2015: 24
per cent)
• When using tickets, more significantly more Supertram passengers were using a plastic card
this wave: 44 per cent compared to 27 per cent in 2015
• Compared to bus passengers, those using the tram tend to have better access to private
transport: 35 per cent of tram passengers have ‘easy’ access to private transport, compared to
only 18 per cent of bus passengers
• The age profile of passengers is a little older than last wave, with 30 per cent of passengers
falling into the 16-34 age bracket compared to 40 per cent in 2015 (a significant decrease)
This section includes comparisons between tram (TPS) and bus (BPS) where applicable.
TPS 2016 Sheffield
Experience and opinions of the journey
15
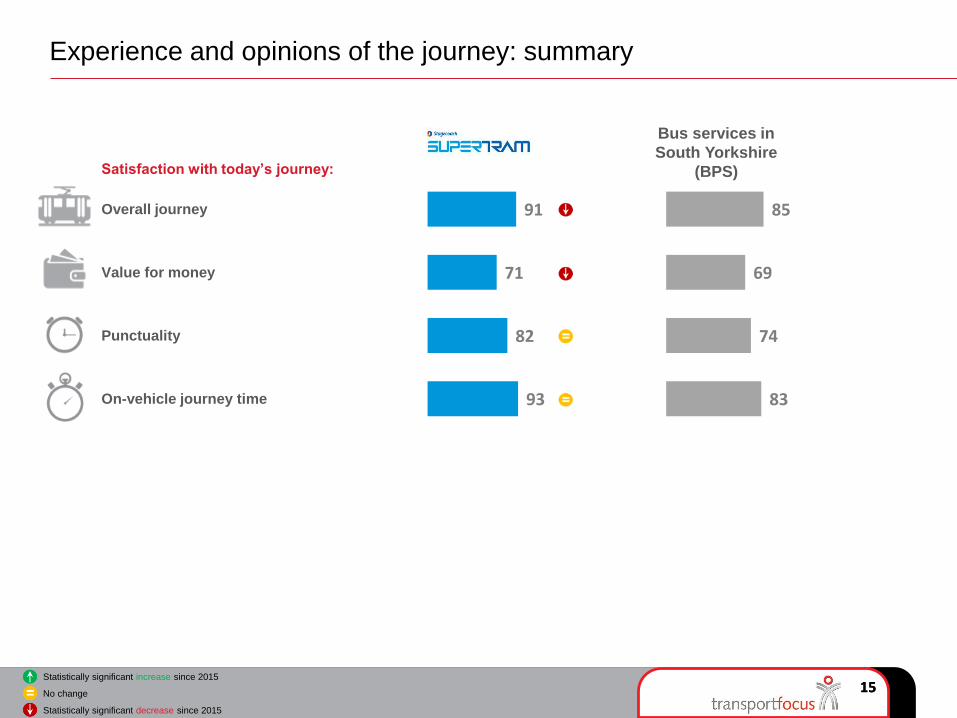
85
69
74
83
91
71
82
93
15
Experience and opinions of the journey: summary
Satisfaction with today’s journey:
Overall journey
Value for money
Punctuality
On-vehicle journey time
Bus services in
South Yorkshire
(BPS)
Statistically significant increase since 2015
No change
Statistically significant decrease since 2015

16
60
55
62
40
65
74
31
28
34
39
31
24
3
5
1
5
2
2
5
12
13
2
1
1
2
3
1
Male
Female
Age 16 to 34
Age 35 to 59
Age 60+
Very satisfied Fairly satisfied Neither/nor Fairly dissatisfied Very dissatisfied
16
Experience and opinions of the journey: the detail
Overall satisfaction: by gender and age
Q. Overall, taking everything into account from the start to the end of this tram journey, how satisfied were you with your tram journey today?
Base: All passengers - 279
92
90
95
87
96
99
94
94
94
91
95
99
Autumn
2014
Autumn
2013
All passengers 97
96
98
98
96
99
Total fairly/very satisfied
Autumn
2015
91
83
96
79
96
98
Autumn
2016
Statistically significant increase since 2015
No change
Statistically significant decrease since 2015

1717
Experience and opinions of the journey: the detail
Overall satisfaction: by passenger type
Q. Overall, taking everything into account from the start to the end of this tram journey, how satisfied were you with your tram journey today?
Base: All passengers - 279
60
54
76
43
77
31
35
21
41
21
3
3
2
4
1
5
6
1
8
1
1
2
3
Fare-payers
Free pass holders
Commuting
Not commuting
Very satisfied Fairly satisfied Neither/nor Fairly dissatisfied Very dissatisfied
92
90
99
86
99
94
93
100
91
97
All passengers 97
96
99
95
99
91
89
97
84
98
Statistically significant increase since 2015
No change
Statistically significant decrease since 2015
Autumn
2014
Autumn
2013
Total fairly/very satisfied
Autumn
2015
Autumn
2016

1818
Experience and opinions of the journey: the detail
Value for money (fare-payers only)
Q. How satisfied were you with the value for money of your journey?
Base: All fare paying passengers - 168
35
29
38
29
46
36
30
41
38
34
16
18
13
14
16
8
10
6
9
5
6
12
2
9
Age 16 to 34
Age 35 to 59
Commuting
Not commuting
Very satisfied Fairly satisfied Neither/nor Fairly dissatisfied Very dissatisfied
69
66
75
60
84
70
63
81
67
74
All passengers 83
78
86
81
84
71
59
79
67
79
Statistically significant increase since 2015
No change
Statistically significant decrease since 2015
Autumn
2014
Autumn
2013
Total fairly/very satisfied
Autumn
2015
Autumn
2016

19
2016
2015
2014
2013
Cost tram versus other transport Cost for distance travelled Comfort/quality for the fare paid
Fare compared to everyday items Other reason
19
Experience and opinions of the journey: the detail
What influenced value for money rating
Q. What had the biggest influence on the ‘value for money’ rating you gave in the previous question?
Base: All fare paying passengers – 120/38 (Caution low base)
25
34
26
30
39
30
28
34
16
17
25
18
9
9
12
8
12
11
9
10
10
24
26
26
47
37
29
38
13
12
14
5
21
19
19
14
8
9
11
17
Those not satisfied with value for moneyThose satisfied with value for money
NOTE: Those not satisfied with value for money includes respondents answering ‘Neither satisfied nor dissatisfied’
Statistically significant increase since 2015
No change
Statistically significant decrease since 2015

2020
Q. How satisfied were you with each of the following…Punctuality? Base: All passengers - 256
Q. How satisfied were you with the amount of time your journey on the tram took? Base: All passengers - 275
54
57
27
36
8
2
4
2
6
3
78
85
84
92
Satisfaction with punctuality 85
93Satisfaction with on-vehicle
journey time
Experience and opinions of the journey: the detail
Punctuality and on-vehicle journey time
82
93
Statistically significant increase since 2015
No change
Statistically significant decrease since 2015
Autumn
2014
Autumn
2013
Total fairly/very satisfied
Autumn
2015
Autumn
2016

This section includes comparisons between tram (TPS) and bus (BPS) where applicable.
TPS 2016 Sheffield
Waiting at the stop

2222
Waiting at the stop: summary
Satisfaction with the stop:
Overall satisfaction with stop
Distance from journey start
Convenience/accessibility
General condition and maintenance
Freedom from graffiti/vandalism
Freedom from litter
Behaviour of other passengers
Information provided
Personal safety
Buses in
South Yorkshire
89
82
86
82
87
85
89
77
87
Buses in
South Yorkshire
Satisfaction:
waiting time
Expected wait time
Actual reported wait
time
Passengers who
checked tram time
Info sources used
before arriving at
stop
Info sources used at
stop
Among those that
didn’t check…
84
6.5 mins
6.4 mins
77%
Online tram times
59% electronic
display
82% knew
service frequent
75
84
87
70
73
66
N/A*
71
79
73
5 mins
5 mins
72%
Online timetables
most common,
then paper
timetables
49% timetable
at stop
57% knew
service frequent
*Not asked in BPS
Statistically significant increase since 2015
No change
Statistically significant decrease since 2015

23
50
56
58
56
59
50
55
45
46
39
33
29
31
27
35
27
37
31
8
5
8
9
8
7
8
11
12
3
3
3
2
5
4
5
5
6
2
2
2
2
3
5
2
5
Overall satisfaction - tram stop
Behaviour of other passengers
Freedom from graffiti/vandalism
Personal safety at stop
Convenience/accessibility
Freedom from litter
Distance from journey start
General condition/maintenance
Information provided at the stop
Very satisfied Fairly satisfied Neither/nor Fairly dissatisfied Very dissatisfied
23
Waiting at the stop: the detail
Satisfaction with the tram stop
Q. Overall, how satisfied were you with the tram stop? & Q. Thinking about the tram stop itself, how satisfied were you with the following:
Base: All passengers - 275
96
93
96
94
90
89
84
92
84
93
85
91
88
92
87
83
87
86
94
88
91
90
92
87
84
91
81
89
89
87
87
86
85
82
82
77
Statistically significant increase since 2015
No change
Statistically significant decrease since 2015
Autumn
2014
Autumn
2013
Total fairly/very satisfied
Autumn
2015
Autumn
2016

24
55 28 6 3 7Length of time had to wait
Very satisfied Fairly satisfied Neither/nor Fairly dissatisfied Very dissatisfied
24
Waiting at the stop: the detail
Waiting time
Q. How satisfied were you with each of the following? & Q. Thinking about the time you waited for the tram today, was it […] than expected?
Base: All passengers - 269
11 14 51 16 8Actual versus expected waiting time
Much less A little less About expected A little longer Much longer Don't know
80
76
83
82
Total about the same or a
little/much less than expected
86
85
84
77
Statistically significant increase since 2015
No change
Statistically significant decrease since 2015
Autumn
2014
Autumn
2013
Total fairly/very satisfied
Autumn
2015
Autumn
2016

25
16
42
24
8
5
Waiting at the stop: the detail
Expected and reported waiting times
Q. Approximately how long did you expect to wait for the tram? & Q. Approximately, how long did you wait for your tram
Base: All passengers – 267
25
8
48
36
2
2
Under 2 mins
2-5 mins
5-10 mins
10-15 mins
Over 15 mins
Reported tram waiting timeExpected tram waiting time
Average expected waiting
time 6.5 minutes (2015: 7.3
minutes)
Average reported waiting
time 6.4 minutes (2015: 5.9
minutes)
Autumn
2016
Autumn
2013
Autumn
2016
Autumn
2013
6
45
45
3
1
18
42
30
5
4
Autumn
2014
18
39
24
11
8
Autumn
2014
3
45
46
4
2
Autumn
2015
20
45
26
4
3
Autumn
2015
6
46
44
2
2
Statistically significant increase since 2015
No change
Statistically significant decrease since 2015
26
59
12
3
2
1
2
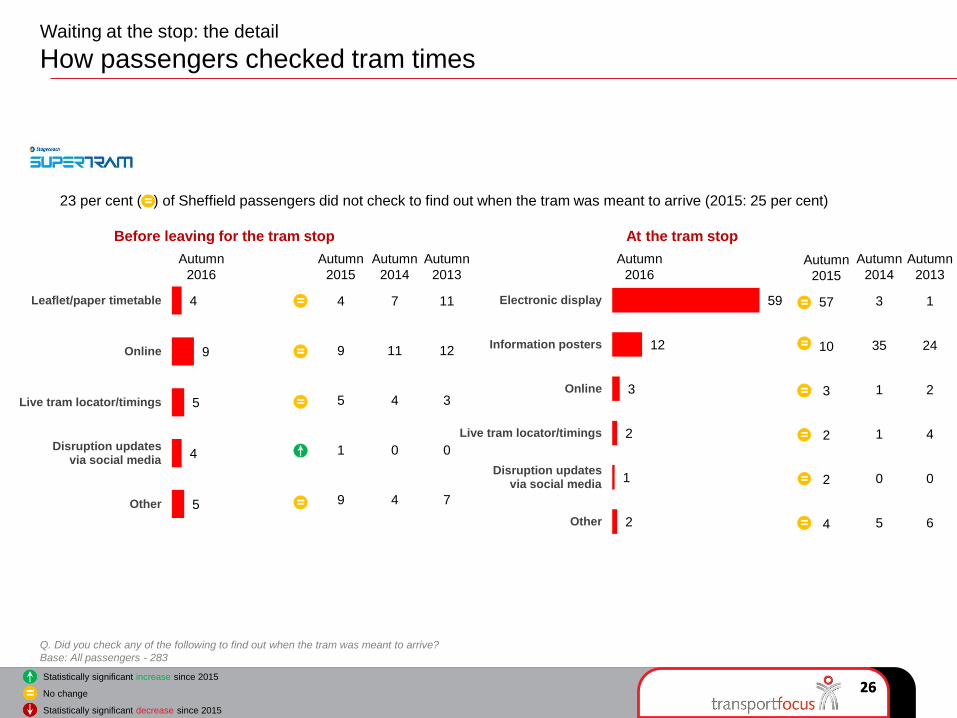
Electronic display
Information posters
Online
Live tram locator/timings
Disruption updates via social media
Other
26
Waiting at the stop: the detail
How passengers checked tram times
Q. Did you check any of the following to find out when the tram was meant to arrive?
Base: All passengers - 283
4
9
5
4
5
Leaflet/paper timetable
Online
Live tram locator/timings
Disruption updates via social media
Other
Before leaving for the tram stop At the tram stop
23 per cent ( ) of Sheffield passengers did not check to find out when the tram was meant to arrive (2015: 25 per cent)
Autumn
2013
Autumn
2016
Autumn
2013
1
24
2
4
0
6
Autumn
2016
11
12
3
0
7
Autumn
2014
3
35
1
1
0
5
Autumn
2014
7
11
4
0
4
Autumn
2015
57
10
3
2
2
4
Autumn
2015
4
9
5
1
9
Statistically significant increase since 2015
No change
Statistically significant decrease since 2015
27
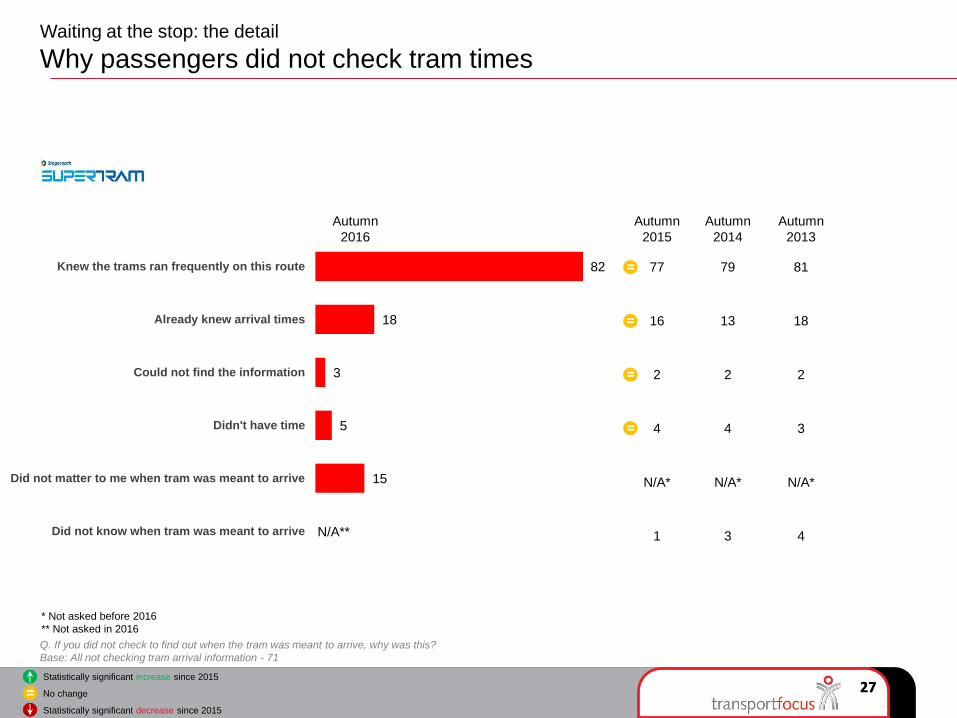
82
18
3
5
15
Knew the trams ran frequently on this route
Already knew arrival times
Could not find the information
Didn't have time
Did not matter to me when tram was meant to arrive
Did not know when tram was meant to arrive
27
Waiting at the stop: the detail
Why passengers did not check tram times
Q. If you did not check to find out when the tram was meant to arrive, why was this?
Base: All not checking tram arrival information - 71
Autumn
2013
81
18
2
3
N/A*
4
Autumn
2016
Autumn
2014
79
13
2
4
N/A*
3
Autumn
2015
77
16
2
4
N/A*
1
Statistically significant increase since 2015
No change
Statistically significant decrease since 2015
* Not asked before 2016
** Not asked in 2016
N/A**

This section includes comparisons between tram (TPS) and bus (BPS) where applicable.
TPS 2016 Sheffield
The tram

2929
The tram: summary
Start of journey
Route info on tram
Exterior cleanliness
Ease getting on
Time taken to board
Buses in
South
Yorkshire
90
90
95
96
Interior cleanliness
Info on board
Seat/standing space
Seat comfort
Personal space
Provision grabrails
Temperature
Personal security
Buses in
South
Yorkshire
92
80
79
86
74
84
84
92
On board
Appearance
Greeting
Helpfulness/attitude
Safety of driving
Smoothness journey
Buses in
South
Yorkshire
The driver
93
85
89
92
85
83
78
90
89
79
63
86
74
76
84
77
83
88
69
70
88
75
Statistically significant increase since 2015
No change
Statistically significant decrease since 2015

30
71
70
65
57
25
25
25
32
3
3
5
7
2
3
2
2
1
Time taken to board
Ease of getting on/off tram
Route/destinationinformation on tram
Exterior cleanliness
Very satisfied Fairly satisfied Neither/nor Fairly dissatisfied Very dissatisfied
30
The tram: the detail
Satisfaction with start of journey
Q. Thinking about when the tram arrived, please indicate how satisfied you were with the following:
Base: All passengers - 277
97
96
93
92
95
95
91
91
94
95
95
91
96
95
90
90
Statistically significant increase since 2015
No change
Statistically significant decrease since 2015
Autumn
2014
Autumn
2013
Total fairly/very satisfied
Autumn
2015
Autumn
2016

31
95
90
86
91
88
83
85
83
90
93
88
84
88
82
85
79
31
The tram: the detail
Satisfaction on the tram
Q. Thinking about whilst you were on the tram, please indicate how satisfied you were with the following:
Base: All passengers - 278
53
49
46
44
41
42
48
43
39
42
39
40
44
38
31
31
6
5
7
10
10
16
9
10
1
2
5
3
4
3
5
9
1
2
3
3
2
1
7
7
Personal security
Interior cleanliness/condition
Comfort of the seats
Provision of grab rails
Temperature inside the tram
Information provided inside the tram
Availability of seating or space to stand
Amount of personal space
Very satisfied Fairly satisfied Neither/nor Fairly dissatisfied Very dissatisfied
92
87
84
86
88
83
86
80
92
92
86
84
84
80
79
74
Statistically significant increase since 2015
No change
Statistically significant decrease since 2015
Autumn
2014
Autumn
2013
Total fairly/very satisfied
Autumn
2015
Autumn
2016

3232
The tram: the detail
Satisfaction with tram staff
TPS: Q. Thinking about any tram staff you encountered on your journey, please indicate how satisfied you were with each of the following:
Base: All passengers - 276
64
64
59
56
46
29
28
30
30
39
5
5
7
12
10
1
1
3
1
2
3
2
2
Appearance
Safety of the driving
Helpfulness/attitude
Greeting/welcome
Smoothness/freedom from jolting
Very satisfied Fairly satisfied Neither/nor Fairly dissatisfied Very dissatisfied
90
94
84
79
85
91
94
84
78
84
94
97
89
82
86
93
92
89
85
85
Statistically significant increase since 2015
No change
Statistically significant decrease since 2015
Autumn
2014
Autumn
2013
Total fairly/very satisfied
Autumn
2015
Autumn
2016

This section includes comparisons between tram (TPS) and bus (BPS) where applicable.
TPS 2016 Sheffield
Negative experiences during the journey

34
16
34
Negative experiences during the journey: summary
Passengers experiencing
a delay to their journey
Average length of delay
(perceived)
6 mins*
Passengers with worry or
concern about others’
behaviour on board
5
Tram waiting too
long at stops*
Most common cause of
delay*Caution: small base (33)
*Caution: small base (27)
Statistically significant increase since 2015
No change
Statistically significant decrease since 2015
3535
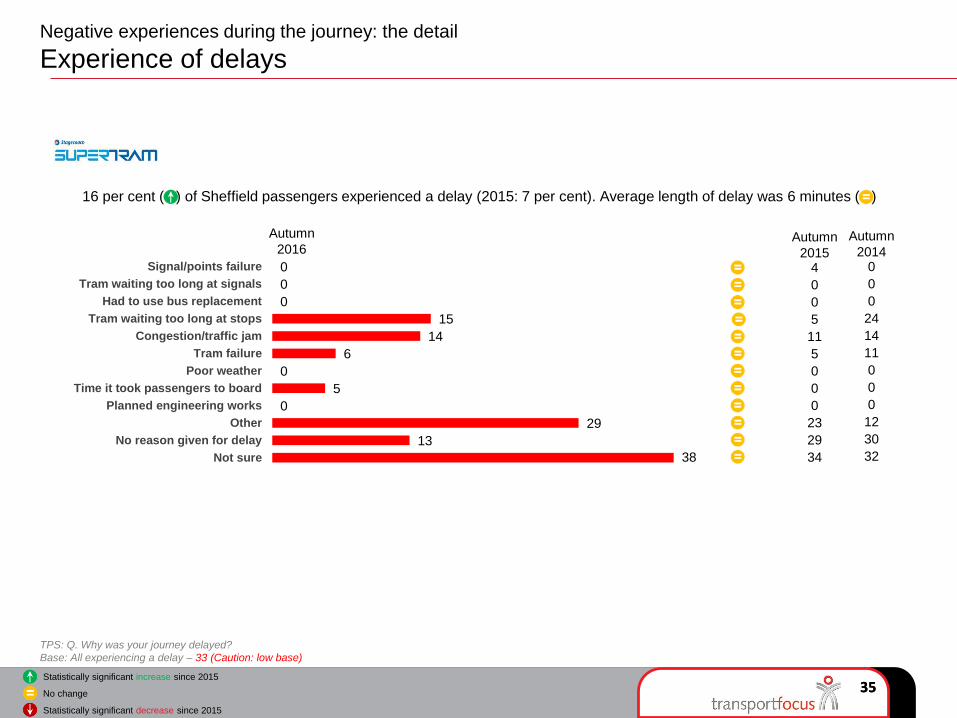
TPS: Q. Why was your journey delayed?
Base: All experiencing a delay – 33 (Caution: low base)
0
0
0
15
14
6
0
5
0
29
13
38
Signal/points failure
Tram waiting too long at signals
Had to use bus replacement
Tram waiting too long at stops
Congestion/traffic jam
Tram failure
Poor weather
Time it took passengers to board
Planned engineering works
Other
No reason given for delay
Not sure
16 per cent ( ) of Sheffield passengers experienced a delay (2015: 7 per cent). Average length of delay was 6 minutes ( )
Negative experiences during the journey: the detail
Experience of delays
Autumn
2016Autumn
20140
0
0
24
14
11
0
0
0
12
30
32
Autumn
20154
0
0
5
11
5
0
0
0
23
29
34
Statistically significant increase since 2015
No change
Statistically significant decrease since 2015

3636
Negative experiences during the journey: the detail
Worry or concern at other passengers’ behaviour
5
2
6
6
3
5
Male
Female
Age 16 to 34
Age 35 to 59
Age 60+
All passengers
Autumn
2013
5
5
6
7
4
4
Autumn
2016
1
0
2
1
2
0
Autumn
2014
Feet on seats
Rowdy behaviour
Passengers not moving out of priority seats
Loud use of mobiles
Passengers playing loud music
Passengers under influence of alcohol
Passengers under influence of drugs
Abusive or threatening behaviour
Smoking
Passengers not paying fares
Graffiti/vandalism
Autumn
2016
% worried/concerned of other passengers’ behaviour
Types of worrying/concerning behaviour (%)
*Not asked in 2013
Q. Did other passengers’ behaviour give you cause to worry or make you feel uncomfortable during your journey?
Base: All passengers - 274
Q. Which of the following were the reasons for [other passengers behaviour causing you concern]?
Base: All experiencing worrying/concerning behaviour – 10 (Caution: low base)
Sample
size of
concerned
passengers
too small to
report upon
3
3
4
5
2
2
Autumn
2015
Statistically significant increase since 2015
No change
Statistically significant decrease since 2015

TPS 2016 Sheffield
Passengers’ suggested improvements
3838
Passengers’ suggested improvements: summary
of Supertram passengers in 2016 had no suggestions for improvements 63%
Q. If something could have been improved on your tram journey today, what would it have been?
Base: All suggesting an improvement - 96
Statistically significant increase since 2015
No change
Statistically significant decrease since 2015
…of the 37% that did, the most common service areas for improvement were:
20
20
19
19
15
7
6
6
6
3
2
2
2
2
1
1
3
Frequency/routes
Punctuality
Real time info./updates at stop
Seating and capacity
Tram: Design/comfort/condition
Tram staff
Fares/tickets
Passenger behaviour
Journey times
Comment about another journey
Information about routes
Tram stop
Real time info./updates via online sources
External factors (road works, congestion etc.)
On-board amenities (Wi-Fi, tea/coffee etc.)
Disabled provision / Wheelchair provision etc.
Other
*Coding has been changed since 2015. Significant changes are therefore not shown

3939
Passengers’ suggested improvements: the detail
Selected verbatim comments
More room. Tram always
crowded at this time of day.
The electronic sign at the tram stop said it would arrive at 17:49
which meant I would have to wait some time . I actually came a
bit later than usual but not this long. The sign was wrong which
leads you to worry about getting home on time.
Myself and a friend were on our way to
the cinema and knew we needed to get
off stop after Carbrook for
Centretainment but it wasn't announced
or up on the screen to remind us.
Most tram stops have an electronic
display board giving ETAs. Hillsborough
does not. Inside the tram it would be
useful to know if it is a blue/yellow tram.
I think you should put extra trams on in the morning and
evening. I'm really fed up with having to stand up every
morning and evening and stood on my feet all day at
work. It would be nice to sit down after and before work.
I was a long distance from tram doors on
this trip but couldn't reach a halt at next
stop bell without standing which being 65
and not having a good sense of balance I
prefer not to. I'm not timid so I can ask
another passenger if they are there but I
prefer to be independent.
The electronic "next tram due" sign said two blue trams
were due next but a yellow one arrives . Can these be
made to update real time, reflect reality?
The electronic information board at
Cathedral tram stop only had a
scheduled time for the tram which
disappeared before it turned up
replacing the next departure
information with a blue route tram.
There were no trams for fifteen
minutes and then two arrived within
the space of three minutes. It would
have helped if passengers were told
to board the next tram when busy.
Staff noticing that it's not a social
event, have more seats and more
room as everyone was cramped
and I hardly could get off my stop.
I also think trams should arrive on
time as I've been late for work a
number of times
The trams are always too hot
with heaters blasting out.
Even in winter too hot and
summer is unbearable.

TPS 2016 Sheffield
Opinion of trams in the local area

4141
Opinion of trams in the local area: summary
General opinion of services in area:
Bus services in
South Yorkshire
(BPS)
Statistically significant increase since 2015
No change
Statistically significant decrease since 2015
60
66
82
75
89
80
81
88
67
87
90
N/A*
N/A*
*
* N/A*
Ease of buying tickets
Punctuality
Frequency
Range of tickets available
Range of payment options available
Ease of getting to local amenities
Connections with other modes
*Not asked in 2015/BPS. Punctuality refers to ‘reliability’ in BPS

42
45
44
44
44
5
8
3
4
2
2
Connections with other modes of transport
Ease of getting to local amenities
Very good Good Neither/nor Fairly poor Very poor
54
42
40
34
34
46
40
46
7
10
7
8
4
2
9
7
4
5
Ease of buying ticket
Range of tickets available
Frequency(how often they run)
Punctuality(running on time)
Very satisfied Fairly satisfied Neither/nor Fairly dissatisfied Very dissatisfied
42
Opinion of trams in the local area: the detail
Satisfaction with trams generally
Q. And how satisfied are you overall with tram services for the following: & Q: How would you rate your local tram services for the following:
Base: All passengers - 264
91
73
84
81
94
N/A*
86
84
91
90
90
91
Total good/very good
*Not asked in 2013
93
83
87
85
90
89
89
88
81
80
90
87
Statistically significant increase since 2015
No change
Statistically significant decrease since 2015
Autumn
2014
Autumn
2013
Total fairly/very satisfied
Autumn
2015
Autumn
2016

TPS 2016 Sheffield
Appendix 1: the passenger and journey context

4444
Sheffield passengers: summary
Overview of passenger demographics
Access to private transport
Disability
Passengers’ postcodes relative to tram network
30
39
26
416-34
35-59
60+
Notstated
Age
40
37
21
2
21
71
8
Yes
No
Notstated
18
76
7
35
52
11
2
35
51
11 3Easy
Moderate
Limited /noneNot stated
*The weighting process for 2015 was adapted to include passengers choosing not to provide their age and gender, in line with BPS. This allows their answers to not be wasted
Autumn
2015
Autumn
2015
Autumn
2015
Tram stop Respondent
45
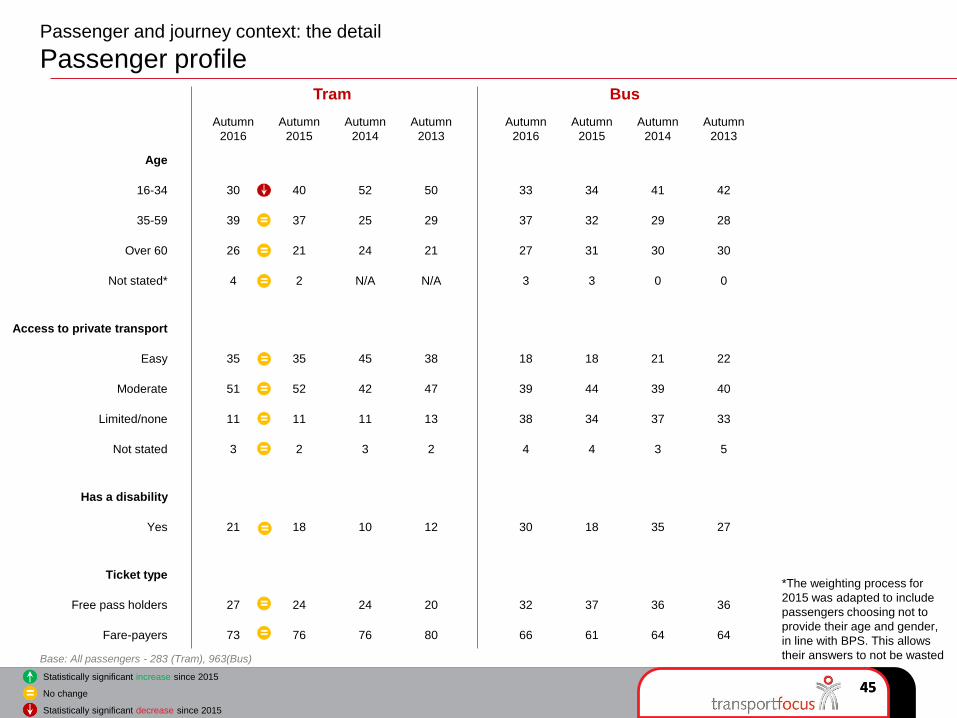
Passenger and journey context: the detail
Passenger profile
Tram Bus
Autumn
2016
Autumn
2015
Autumn
2014
Autumn
2013
Autumn
2016
Autumn
2015
Autumn
2014
Autumn
2013
Age
16-34 30 40 52 50 33 34 41 42
35-59 39 37 25 29 37 32 29 28
Over 60 26 21 24 21 27 31 30 30
Not stated* 4 2 N/A N/A 3 3 0 0
Access to private transport
Easy 35 35 45 38 18 18 21 22
Moderate 51 52 42 47 39 44 39 40
Limited/none 11 11 11 13 38 34 37 33
Not stated 3 2 3 2 4 4 3 5
Has a disability
Yes 21 18 10 12 30 18 35 27
Ticket type
Free pass holders 27 24 24 20 32 37 36 36
Fare-payers 73 76 76 80 66 61 64 64
Base: All passengers - 283 (Tram), 963(Bus)
45
*The weighting process for
2015 was adapted to include
passengers choosing not to
provide their age and gender,
in line with BPS. This allows
their answers to not be wasted
Statistically significant increase since 2015
No change
Statistically significant decrease since 2015
4646
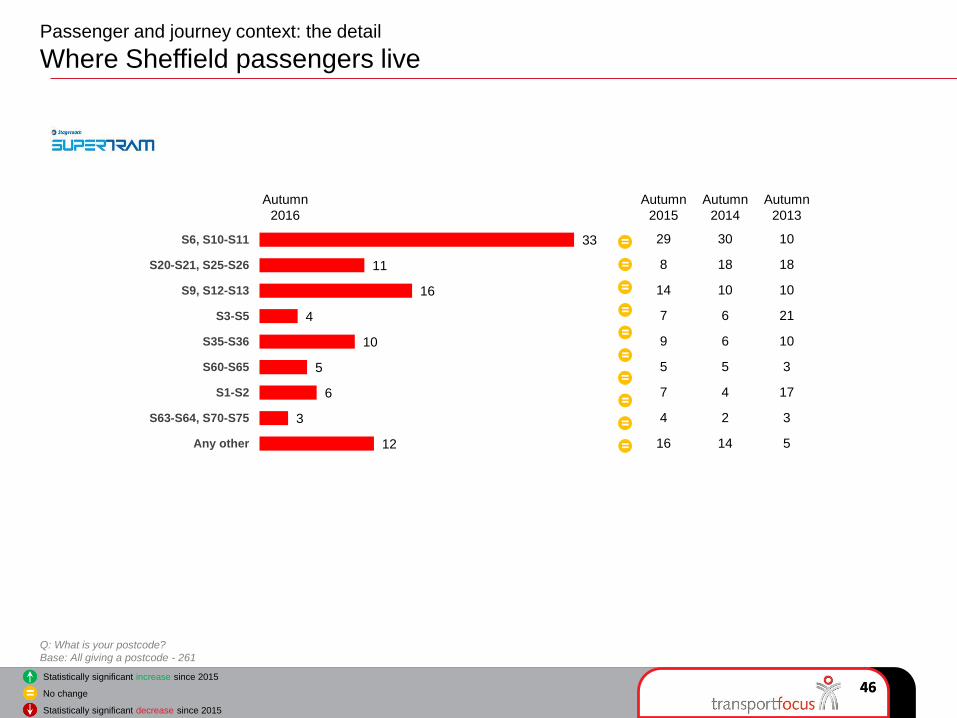
33
11
16
4
10
5
6
3
12
S6, S10-S11
S20-S21, S25-S26
S9, S12-S13
S3-S5
S35-S36
S60-S65
S1-S2
S63-S64, S70-S75
Any other
Passenger and journey context: the detail
Where Sheffield passengers live
Q: What is your postcode?
Base: All giving a postcode - 261
Autumn
2013
Autumn
2016
10
18
10
21
10
3
17
3
5
30
18
10
6
6
5
4
2
14
Autumn
2014
Statistically significant increase since 2015
No change
Statistically significant decrease since 2015
Autumn
2015
29
8
14
7
9
5
7
4
16

47
6
0
Sheffield journeys: summary (1)
Passenger journey details
Journey purpose Frequency using trams in area
51
2
47
Commuting
Business
Leisure
5+ days
week
3-4 days
week
1-2 days a
week
Once a
fortnight
Once a
month
45
21
19
4
5
Less often
First time
Statistically significant increase since 2015
No change
Statistically significant decrease since 2015

48
Sheffield journeys: summary (2)
Tickets used for today’s journey
Free/fare payers
Fare payer
Free pass
73
27
Ticket type
Single/return 10
Season 59
Other 3
Mode permitted
Tram only 39
Multi-mode 61
Purchased ticket via… Ticket format
58
10
18
14
40
14
44
2
Conductor
Rail/bus company
Tram operator
Other
Paper
Photocard
Plastic card
Other
Statistically significant increase since 2015
No change
Statistically significant decrease since 2015
49
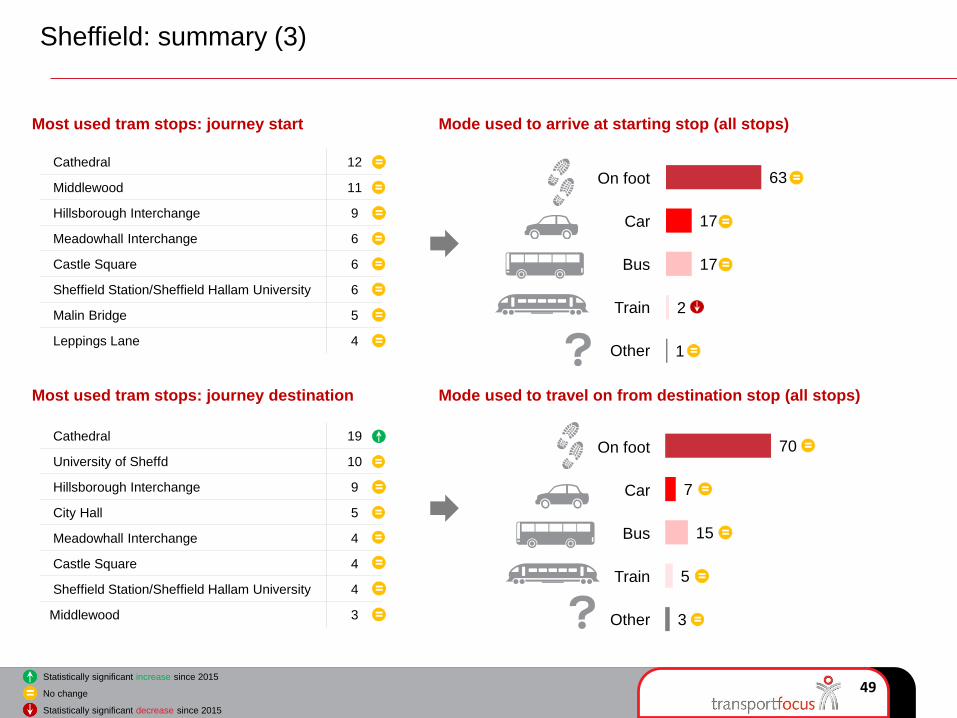
Sheffield: summary (3)
Most used tram stops: journey start
Cathedral 12
Middlewood 11
Hillsborough Interchange 9
Meadowhall Interchange 6
Castle Square 6
Sheffield Station/Sheffield Hallam University 6
Malin Bridge 5
Leppings Lane 4
Cathedral 19
University of Sheffd 10
Hillsborough Interchange 9
City Hall 5
Meadowhall Interchange 4
Castle Square 4
Sheffield Station/Sheffield Hallam University 4
Middlewood 3
Most used tram stops: journey destination
Mode used to arrive at starting stop (all stops)
Mode used to travel on from destination stop (all stops)
63
17
17
2
1
On foot
Car
Bus
Train
Other
70
7
15
5
3
On foot
Car
Bus
Train
Other
Statistically significant increase since 2015
No change
Statistically significant decrease since 2015

50
Sheffield journeys: summary (4)
Journey direction
Sitting/standing
Weather on day of journey
90
9
0
1
Dry
Light rain
Heavy rain
Other
56
41
3
Outward
Return
One way only
94
4
2
Had a seat
Stood, would
have liked seat
Stood, happy
to stand
Statistically significant increase since 2015
No change
Statistically significant decrease since 2015
5151
Passenger and journey context: the detail
Journey purpose
Q. What is the main purpose of your tram journey today?
Base: All passengers - 273
39
12
2
6
1
18
7
11
4
Travelling to/from work
Travelling to/from education
Company business
Personal business
Health visit
Shopping trip
Visit friends or relatives
Leisure trip
Other
Autumn
2013
Autumn
2016
38
10
1
4
2
21
11
11
3
35
15
1
5
2
14
9
14
5
Autumn
2014
51
2
47
Sub-total: Commuter
Sub-total: Business
Sub-total: Leisure
48
1
51
50
1
49
37
10
1
5
2
18
9
14
4
Autumn
2015
47
1
53
Statistically significant increase since 2015
No change
Statistically significant decrease since 2015
5252
Passenger and journey context: the detail
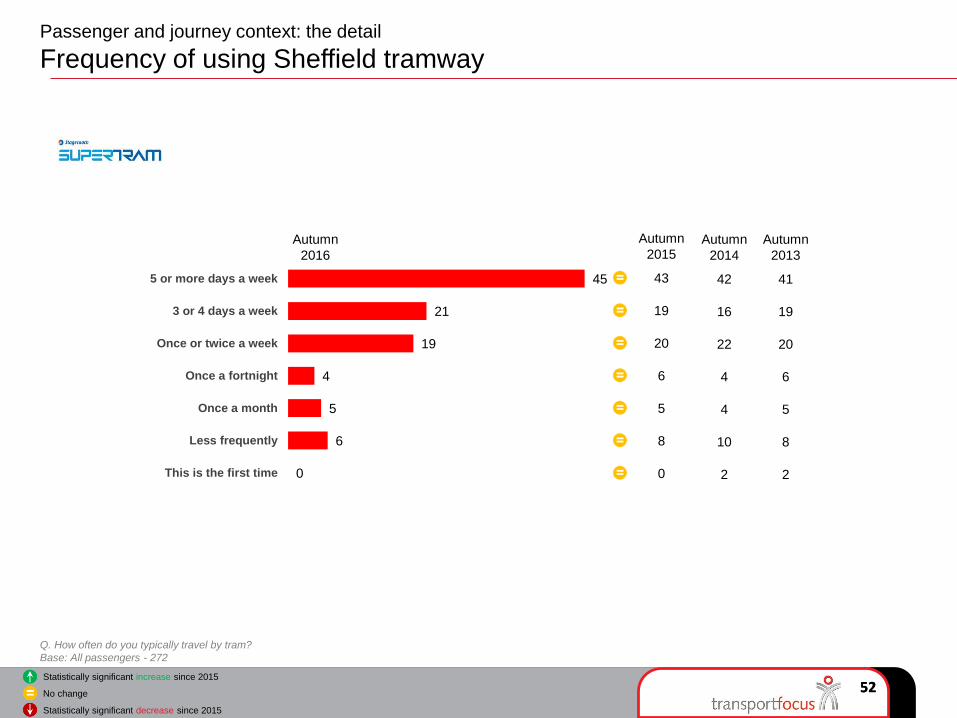
Frequency of using Sheffield tramway
Q. How often do you typically travel by tram?
Base: All passengers - 272
45
21
19
4
5
6
0
5 or more days a week
3 or 4 days a week
Once or twice a week
Once a fortnight
Once a month
Less frequently
This is the first time
Autumn
2013
Autumn
2016
41
19
20
6
5
8
2
42
16
22
4
4
10
2
Autumn
2014
43
19
20
6
5
8
0
Autumn
2015
Statistically significant increase since 2015
No change
Statistically significant decrease since 2015

53
10
5
6
59
15
0
22
0
18
0
4
1
27
3
Sub-total: Single/return
Single
Return
Sub-total: Season ticket/pass
Day pass
3 day/weekend
5 days/1 week
10 days/2 weeks
4 weeks/1 month
Quarterly/3 months
1 year
Other time period
Free pass/journey
Other ticket type
Passenger and journey context: the detail
Ticket type and modes of transport permitted
Q. What type of ticket/pass did you use for this tram journey today?
Base: All passengers - 279
Q. What modes of transport does your ticket allow you to travel on?
Base: All passengers - 274
53
39
148
12Tram only
Train and tram
Bus and tram
Train, bus andtram
Autumn
2013
Autumn
2016
18
13
5
58
17
0
22
0
11
1
3
0
20
5
34
2
53
11
19
13
6
50
14
0
18
0
13
0
1
0
24
6
Autumn
2014
28
2
48
23
45
0
43
12
14
11
4
55
14
0
21
0
14
2
3
0
24
7
Autumn
2015
Statistically significant increase since 2015
No change
Statistically significant decrease since 2015

54
40
14
44
2Paper ticket/pass
Photocard pass
Plastic card
Ticket on mobile
Other format
58
6
18
10
0
0
7
Ticket machine at stop
Conductor that day
Travel shop
Direct from the tram company
Rail/bus company
Local shop or post office
Direct debit through work/college
Other
54
Passenger and journey context: the detail
Method of buying ticket and ticket format
Q. How did you buy that ticket or pass?
Base: All fare paying passengers – 165Q. In what format was your ticket?
Base: All passengers - 271
Autumn
2013
Autumn
2016
N/A*
66
9
10
4
0
1
7
70
12
14
0
4
N/A*
61
10
16
8
0
0
5
56
15
23
0
6
*Not asked for Sheffield Supertram
Autumn
2014
N/A* N/A*
61
7
15
5
1
1
10
60
12
27
0
1
Autumn
2015
Statistically significant increase since 2015
No change
Statistically significant decrease since 2015

55
56 per cent of passengers were on an outward journey, 41 per cent on a return and 3 per cent on a
one-way trip (2015: 48 per cent, 48 per cent and 4 per cent respectively)
89 per cent had a seat for their whole journey, while 4 per cent said they had to stand but would
have liked to have a seat (2015: 92 per cent and 1 per cent)
Boarding
• Cathedral 12 7 9 9
• Middlewood 11 8 7 14
• Hillsborough Interchange 9 7 5 5
• Meadowhall Interchange 6 11 12 13
• Castle Square 6 5 3 4
• Sheff. Station/Sheff. Hallam
Uni6 6 3 3
• Malin Bridge 5 3 8 5
• Leppings Lane 4 3 2 3
• Halfway 3 3 9 3
• Crystal Peaks 3 2 2 1
55
Passenger and journey context: the detail
Sheffield stops used by passengers surveyed
Q: Were you on your outward or return journey? Q. Did you get a seat on the tram? Q: At which stop did you board/leave this tram?
Base: All passengers - 283
Autumn
2013
Autumn
2015Alighting
• Cathedral 19 11 20 13
• University of Sheffield 10 9 10 9
• Hillsborough Interchange 9 8 3 5
• City Hall 5 5 6 3
• Meadowhall Interchange 4 8 6 9
• Castle Square 4 7 5 5
• Sheff. Station/Sheff. Hallam
Uni.4 3 10 7
• Middlewood 3 4 3 4
• Fitzalan Square/Ponds Forge 3 6 3 5
• Valley Centertainment 3 2 2 3
Autumn
2013
Autumn
2015
Any changes in tram stops used reflects the sample of passengers in this survey rather than actual usage of stops
Autumn
2014
Autumn
2014
Autumn
2016
Autumn
2016
Statistically significant increase since 2015
No change
Statistically significant decrease since 2015

56
63
0
4
9
5
17
2
4
0
70
0
1
2
4
15
5
3
0
On foot
Cycled
Car - dropped off/picked up
Car - park and ride
Car - parked elsewhere
Bus/coach
Train
Tram
Other
Got to tram stop Left tram stop
Q: How did you get to/from the tram stop where you boarded/left the tram today?
Base: All passengers - 274
56
Passenger and journey context: the detail
How got to and from the tram stop
Autumn
2013
Autumn
2016
6874
00
63
54
31
1513
34
23
11
6073
00
42
72
82
1716
34
11
02
Autumn
2014
6270
00
44
63
22
1715
85
32
03
Autumn
2015
Statistically significant increase since 2015
No change
Statistically significant decrease since 2015
57
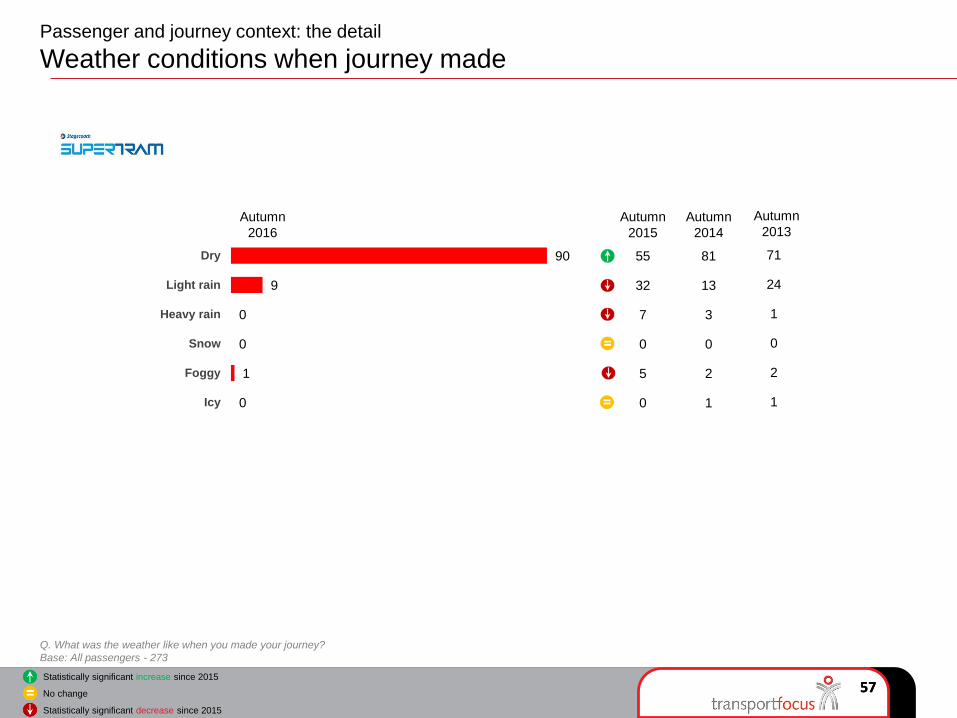
90
9
0
0
1
0
Dry
Light rain
Heavy rain
Snow
Foggy
Icy
57
Passenger and journey context: the detail
Weather conditions when journey made
Q. What was the weather like when you made your journey?
Base: All passengers - 273
Autumn
2013Autumn
2016
71
24
1
0
2
1
81
13
3
0
2
1
Autumn
2014
Autumn
2015
55
32
7
0
5
0
Statistically significant increase since 2015
No change
Statistically significant decrease since 2015
5858
Passenger and journey context: the detail
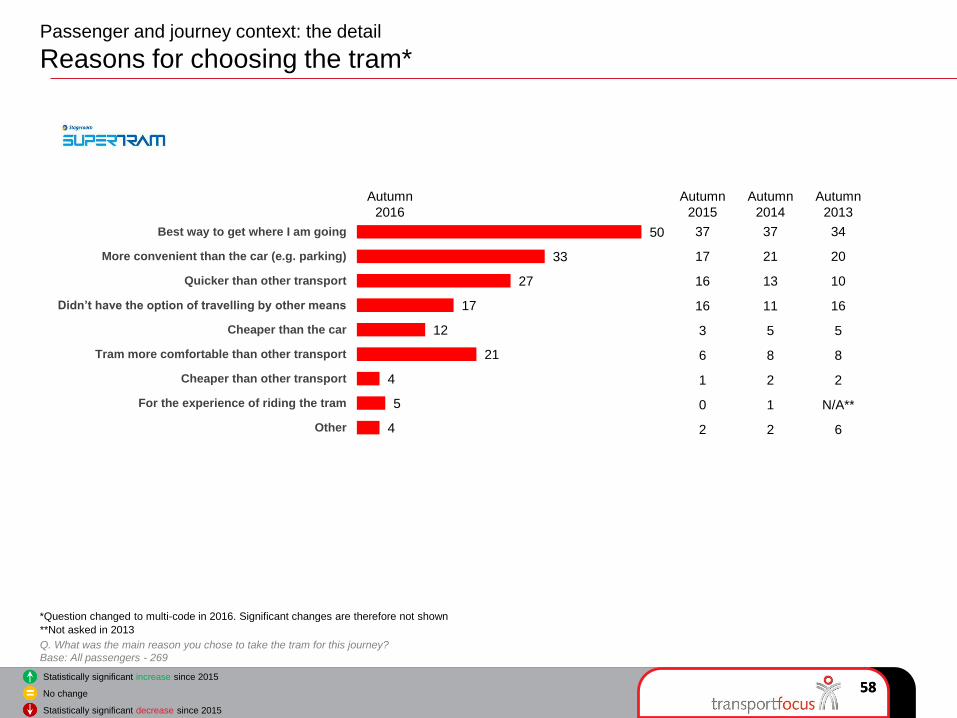
Reasons for choosing the tram*
Q. What was the main reason you chose to take the tram for this journey?
Base: All passengers - 269
50
33
27
17
12
21
4
5
4
Best way to get where I am going
More convenient than the car (e.g. parking)
Quicker than other transport
Didn’t have the option of travelling by other means
Cheaper than the car
Tram more comfortable than other transport
Cheaper than other transport
For the experience of riding the tram
Other
Autumn
2013
Autumn
2016
34
20
10
16
5
8
2
N/A**
6
37
21
13
11
5
8
2
1
2
Autumn
2014
37
17
16
16
3
6
1
0
2
Autumn
2015
Statistically significant increase since 2015
No change
Statistically significant decrease since 2015
**Not asked in 2013
*Question changed to multi-code in 2016. Significant changes are therefore not shown

5959
Passenger and journey context: the detail
Factors preventing more journeys being made
Q. Have any of the following frequently stopped you making journeys by tram? (More than one answer permissible)
Base: All previously using the tram - 196
*Not asked in 2013. The addition of ‘Tram network improvement works’ in TPS 2014 could have caused the significant drops in other factors
54
12
8
10
2
1
11
4
35
3
26
Places reachable
Frequency of trams
Reliability of trams
Cost of using trams
Understanding the fares
Understanding ticket machines
Journey times
Comfort of trams
Level of crowding
Concern for personal safety
Tram network improvement works
Autumn
2013
Autumn
2016
53
10
12
21
2
1
11
4
44
5
N/A*
42
10
8
20
6
1
11
8
32
1
36
Autumn
2014
48
9
7
13
3
1
10
3
27
2
44
Autumn
2015
Statistically significant increase since 2015
No change
Statistically significant decrease since 2015
TPS 2016 Sheffield
Appendix 2: Further detail on survey background and method

6161
Methodology – fieldwork
Sheffield Supertram (TPS)
Fieldwork: 26 September to 4 December 2016 (with a gap for half term from 24 to 30 October)
Interviewer shifts: covered all days of the week and ran from 6am to 10pm. Each interviewer worked a three-hour shift; four hour shifts were
conducted in a few cases.
Method: Choice of paper or online self-completion questionnaire
Sample size: 283 interviews (234 paper and 49 online)
In 2015 fieldwork took place between 17 September to 26 November 2015
Bus (BPS) data for South Yorkshire PTE area
Fieldwork 5 September to 18 December 2016
Interviewer shifts: covered all days of the week and ran from 6am to 10pm. Each interviewer worked a three-hour shift
Method: Choice of paper or online self-completion questionnaire
Sample size: 1658 interviews

6262
Methodology – data analysis
Base definitions: All charts are based on those who gave an answer to an individual
question. Those who either left the question blank or said ‘don’t know’ have been excluded
from the base. For this reason the base sizes for those charts based on ‘all passengers’
vary slightly between the different charts in this report.
Weighting: this was based on passenger count information collected by the interviewer
during each interviewer shift. The weighting matrix used the following weighting cells:
• Tram network (for Sheffield Supertram this was by line)
• Age: 16-25, 26-59, 60+
• Gender: male, female
• Time/day travelled: weekday peak, weekday off peak and weekend
The full details of the weighting matrix can be found in the TPS Autumn 2015 technical
report.
Waiver
Transport Focus has taken care to ensure that the information contained in TPS is correct. However, no warranty, express or implied, is given as to
its accuracy and Transport Focus does not accept any liability for error or omission.
Transport Focus is not responsible for how the information is used, how it is interpreted or what reliance is placed on it. Transport Focus does not
guarantee that the information contained in TPS is fit for any particular purpose.

6363
Methodology – themes that are affecting overall passenger satisfaction charts (1)
This year, we introduced a new approach for identifying the key drivers of overall journey satisfaction amongst
bus passengers, comprising two stages. At the first stage, we took all 25 individual satisfaction measures from
the survey (apart from the overall journey satisfaction) and formed them into themes using a statistical technique
known as factor analysis, which groups together those satisfaction measures that are responded to similarly
within the data. For instance, where high or low scores are given for measure ‘x’, there tends to be a similar
rating for measures ‘y’ and ‘z’, so the ‘factor’ or theme becomes ‘A’. Through this process we identified ten
themes, which are shown below, alongside measures that formed each theme:
Theme (factor) Questions
1 On tram environment and comfort • Sufficient room for all the passengers to sit/stand
• The comfort of the seats
• The amount of personal space you had around you
• Provision of grab rails to hold on to when standing/moving about the tram
• The temperature inside the tram
2 Tram stop condition • Its general condition/standard of maintenance
• Its freedom from graffiti/vandalism
• Its freedom from litter
3 Boarding the tram • The ease of getting on to and off of the tram
• The length of time it took to board the tram
4 Timeliness • The length of time you had to wait for the tram
• The punctuality of the tram
5 Access to the tram stop • Its distance from your journey start e.g. home, shops
• The convenience/accessibility of its location
6 Personal safety throughout journey • Behaviour of fellow passengers waiting at the stop
• Your personal safety whilst at the tram stop
• Your personal security whilst on the tram
7 Cleanliness and condition of the tram • The cleanliness and condition of the outside of the tram
• The cleanliness and condition of the inside of the tram
8 Smoothness/speed of tram • The amount of time the journey took
• Smoothness/freedom from jolting during the journey
9 Information throughout journey • The information provided at the tram stop
• Route/destination information on the outside of the tram
• The information provided inside the tram
10 Value for money • How satisfied were you with the value for money of your tram journey?

6464
Methodology – themes that are affecting overall passenger satisfaction charts (2)
For the second stage, these themes were then used to identify how much effect each one has on passengers’
rating for overall journey satisfaction, by means of a key driver analysis.
The square diagrams show the proportional influence that each theme has on satisfaction for that area/operator.
They should be read like a pie chart where the slices or portions are relative to each other and together add up
to 100%. So in the example below, the theme of ‘on tram environment and comfort’ which is shaded red, has the
greatest influence on satisfaction, followed by ‘smoothness/speed of tram’, while themes such as ‘boarding the
tram’ and ‘information throughout journey’ have relatively influence here.
This analysis was conducted on fare-paying
passengers only, so that the influence of value for
money could be included. It also combines data from
2015 and 2016 surveys to increase robustness. The
analysis excludes satisfaction measures relating to tram
staff; due to differences in staff availability across the
networks not all TPS questionnaires feature questions
about tram staff. In order to run the analysis in a
consistent and practical manner all staff measures have
been excluded.
There are noticeable and interesting differences in the
impact of different themes between the various tram
networks.

6565
The Sheffield tramway route map
TPS 2016 Sheffield
Appendix 3: Questionnaire
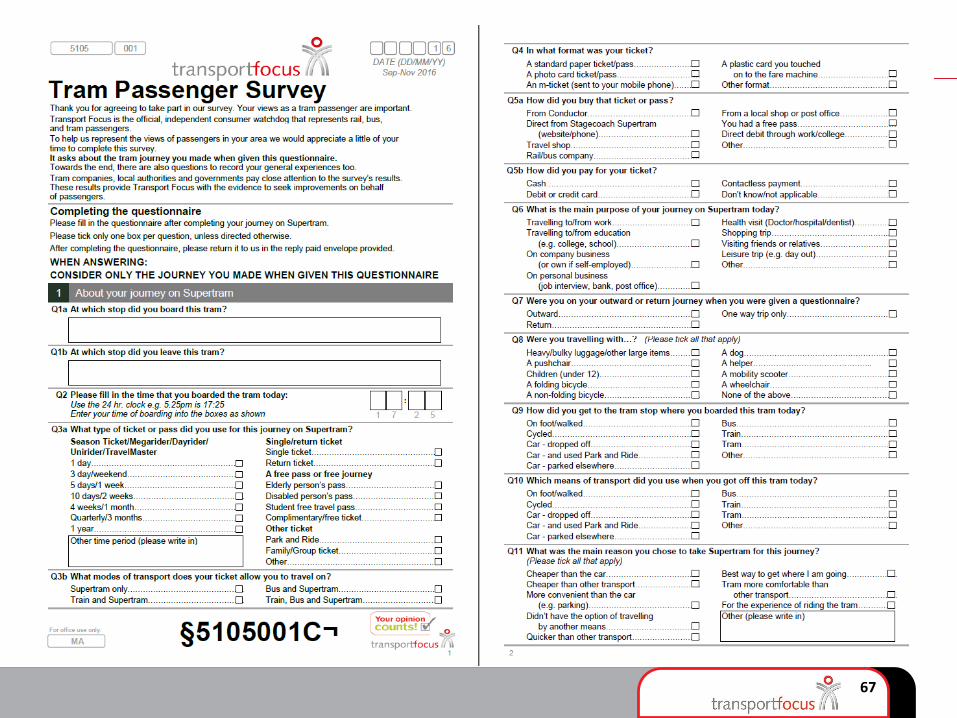
67
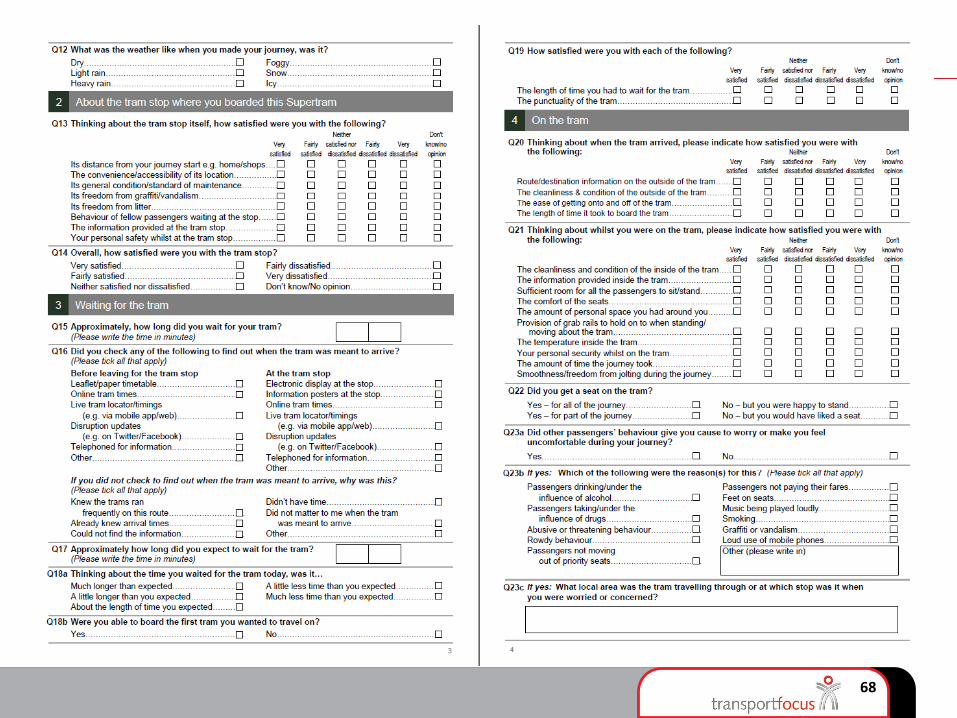
68

69
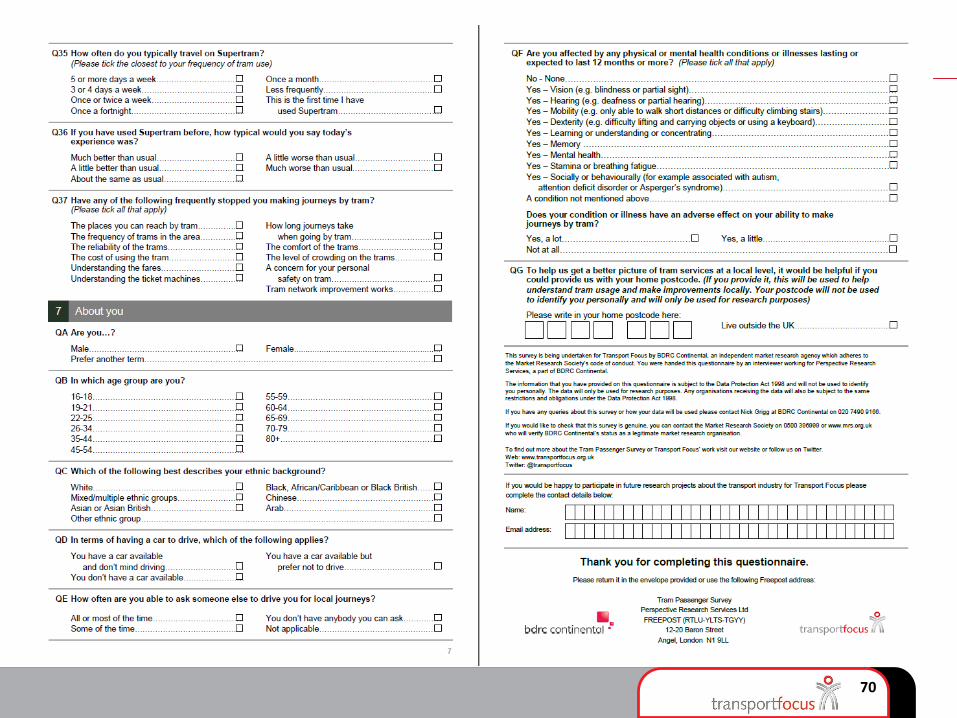
70

Tram Passenger Survey (TPS) Sheffield
Autumn 2016 results
Robert PainTel: 0300 123 0835 Email: [email protected]
Insight Team, Transport Focus, Fleetbank House, 2-6 Salisbury Square, London, EC4Y 8JXMarch 2017