training and technical assistance webinar series - jrsa · training and technical assistance...
TRANSCRIPT

Statistical Analysis for Criminal Justice Research
Justice Research and Statistics Association 720 7th Street, NW, Third Floor Washington, DC 20001
Training and Technical Assistance Webinar Series

Justice Research and Statistics Association 720 7th Street, NW, Third Floor Washington, DC 20001
II. Statistical Sampling: An Overview for Criminal Justice
Researchers
Erin J. Farley Ph.D. Stan Orchowsky Ph.D.
Justice Research and Statistics Association
4/28/2016

Training and Technical Assistance Webinar Series
This webinar is being audio cast via the speakers on your computer and via teleconference. To access the audio stream information, select audio and audio conference from the menu bar. This will display the call information and the button to access the audio stream. If you have speakers or headphones for your computer there is no need to call in, simply select call using computer.
Justice Research and Statistics Association 720 7th Street, NW, Third Floor Washington, DC 20001

Training and Technical Assistance Webinar Series
Justice Research and Statistics Association 720 7th Street, NW, Third Floor Washington, DC 20001
All telephones have been muted. If you would like to ask a question please use the chat feature unless instructed otherwise. Please remember to select Host.

Webinar Objectives
1. Describe different types of probability and non-probability sampling designs – Address strengths and limitations of each
design
2. Discuss the importance of sampling to the external validity of experimental designs and to statistical analysis

Sampling from the Population
Population
Sample Sampling process
What you can infer
about pop. What you actually
observe in the data

Terminology • Target Population
– Collection of elements about which we wish to make an inference • Unit/Case:
– Element you are interested in • People, organizations, documents etc.
• Sampling Frame: – List of all the units of the population of interest
• Sample: – Non-overlapping selection of units/cases drawn from the sampling
frame • Representativeness
– Sample characteristics are similarly distributed as the populations characteristics
• Sample estimates (statistics) can be generalized to the population • Sampling Error:
– Deviation between an estimate from a sample and the true population sample
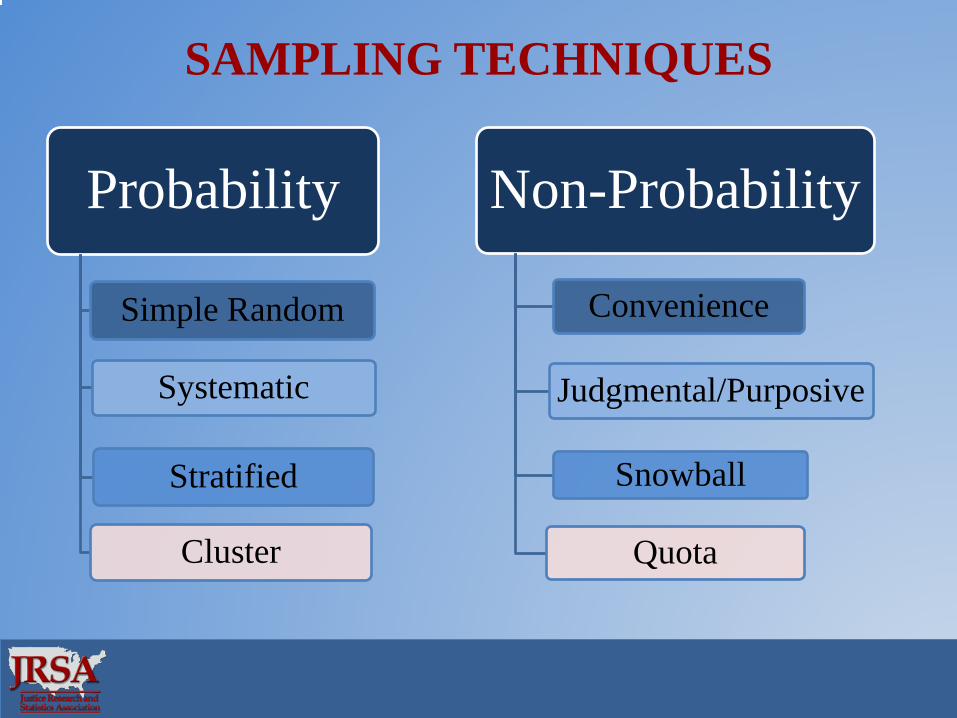
SAMPLING TECHNIQUES
Probability
Simple Random
Stratified
Systematic
Cluster
Non-Probability
Convenience
Judgmental/Purposive
Snowball
Quota

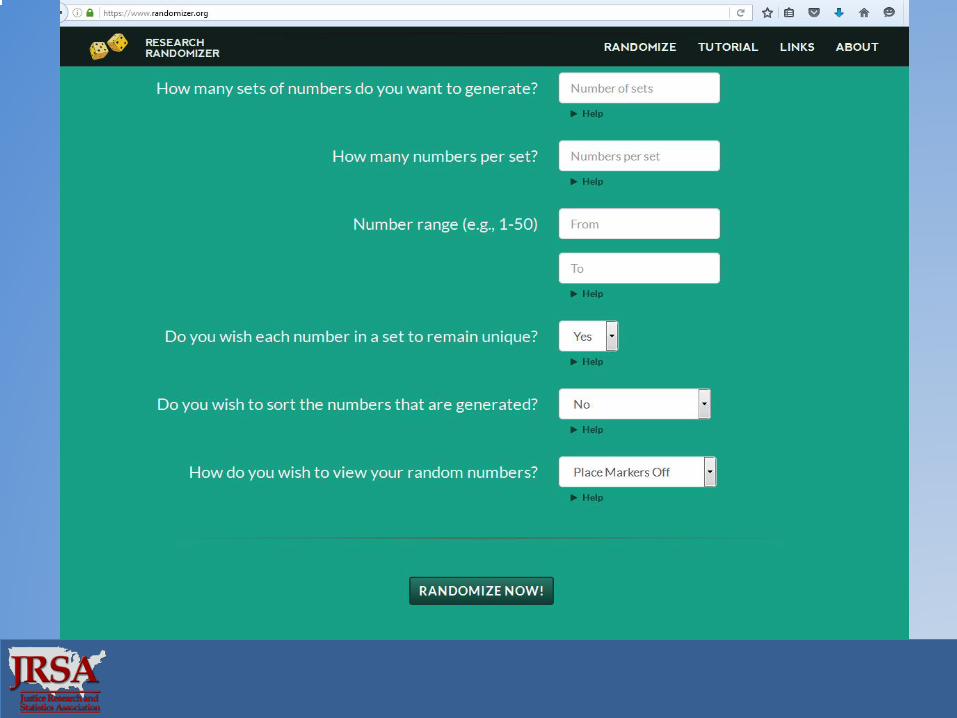
Simple Random Sampling • Every unit/element in the population has
the known probability of being included in the sample.
• Number each element from 1 to N. • Use random number generator to generate
n distinct numbers between 1 and N. – Random Number Generator:
https://www.randomizer.org

Simple Random Sampling Example

Simple Random Sampling Example

Systematic Sampling • Involves the selection of elements from an
ordered sampling frame – Begin by selecting an element from the list at
random and then every kth element in the frame is selected
• Every element does not have an equal chance of being chosen
– Useful with homogenous groups – Be cautions of hidden patterns

Systematic Sampling Example

Systematic Sampling Example Cont.

Stratified Random Sampling
• Divide population into non-overlapping subgroups
• Utilize simple random sampling on each subgroup
• Two Types: – Proportionate and Disproportionate

Stratified Random Sampling Caucasian Males
African American Males
Asian Males Latino Males

StRS: Proportionate Example Caucasian Males
African American Males
Asian Males Latino Males 50% 25%
15% 10%
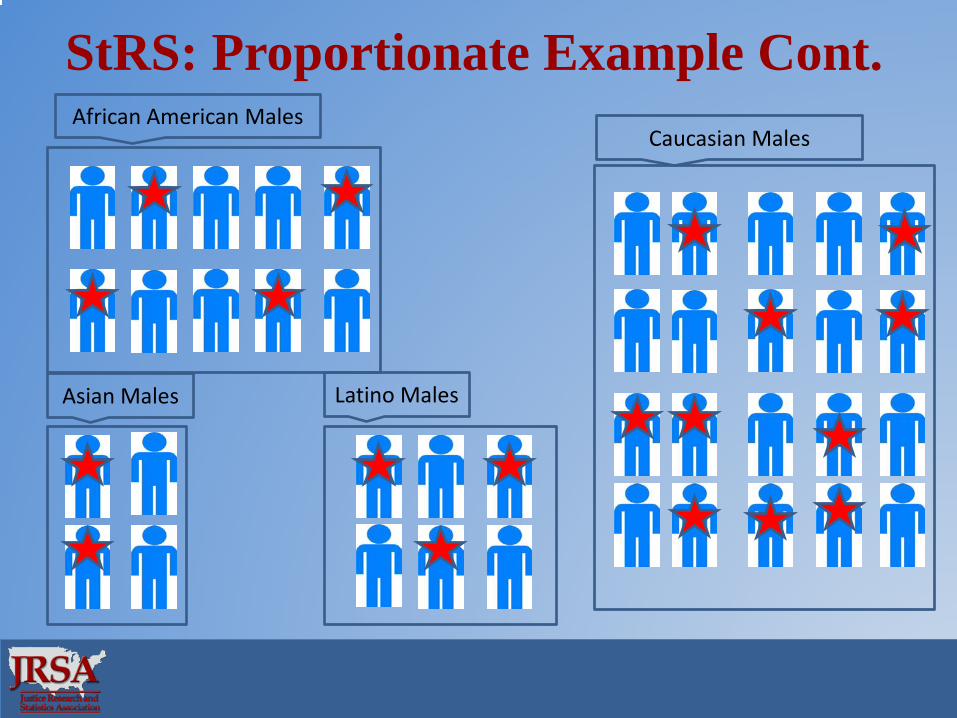
StRS: Proportionate Example Cont. Caucasian Males
African American Males
Asian Males Latino Males

StRS: Disproportionate Example Caucasian Males
African American Males
Asian Males Latino Males

Cluster Random Sampling • Population is divided into non-overlapping
(geographic/regional) clusters or areas • Subset of clusters is randomly selected for the
sample • One-stage sampling: All of the elements within
selected cluster/area are included in the sample • Two-stage sampling: A subset of elements within
selected clusters are randomly selected for inclusion in the sample – Multi-stage

Cluster Sampling Example: Kansas

Cluster Sampling Example Cont.

Cluster Sampling Example Cont.
Crawford County
Second-Stage

Cluster Sampling Example Cont. Third Stage
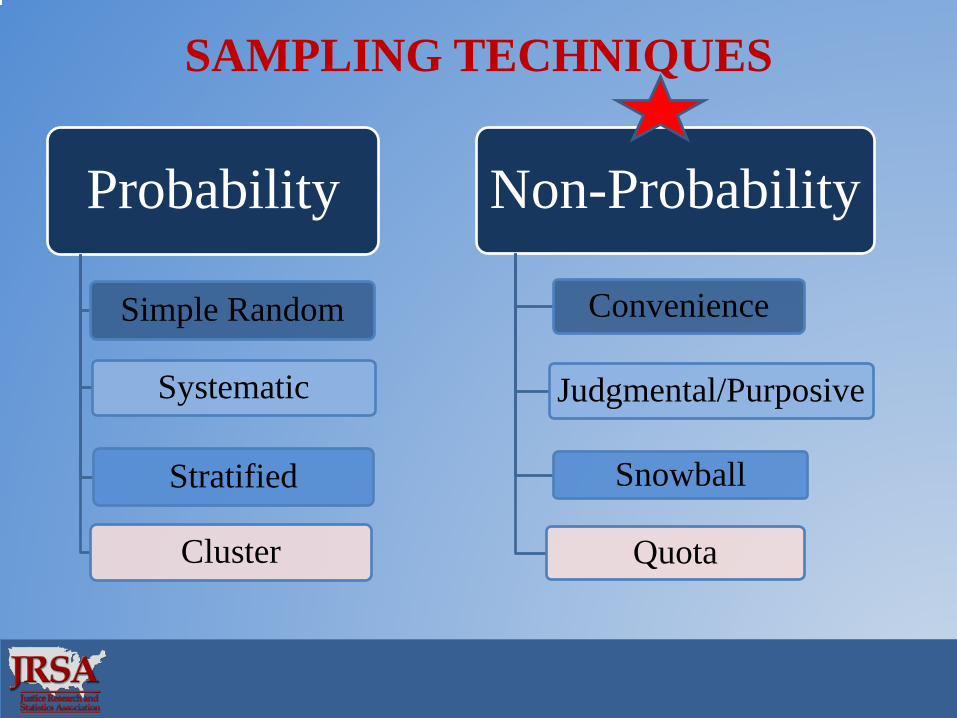
SAMPLING TECHNIQUES
Probability
Simple Random
Stratified
Systematic
Cluster
Non-Probability
Convenience
Judgmental/Purposive
Snowball
Quota

Convenience Sampling
• Also referred to as accidental or haphazard sampling
• Select sampling units that are most conveniently available at a certain point and a certain period, or time – Man on the street interviews – Teacher uses students
• Psychology research – Volunteers

Purposive Sampling
• Also referred to as Judgmental Sampling • Groups to be recruited are predefined
– Subjective judgment by researcher • Types:
– Typical case sampling • Select cases that fit “typical” characteristics
– Extreme (deviant) case sampling • Select usual or special cases
Quota Sampling
Population is segmented into non-overlapping subgroups
Researcher sets the proportions of each subgroup in the sample Usually done to ensure the inclusion of a particular segment of the
population. Proportions may or may not significantly differ from the actual
proportion in the population

Snowball Sampling
• When subjects are hard to find/very small population
– Additional respondents are obtained from the initial sample respondents

Standard Error
• The standard deviation of the sampling distribution of a statistic (e.g., the mean)
• Estimates how far the sample statistic (e.g., the mean) is likely to be from the population parameter

Confidence Intervals • Gives us an interval estimate of where the population parameter (e.g., mean) will fall
Upper limit = x + (z x SEM) Lower limit = x – (z x SEM)
• Estimates how far the sample statistic (e.g., the mean) is likely to be from the population parameter
90% CI z = 1.65 95% CI z = 1.96 99% CI z = 2.58

1 SD z = 1.65 2 SD z = 1.96 3 SD z = 2.58

Sample Size • Function of:
– Confidence • The more confidence, the greater the sample size
– Error rate • The smaller the error rate, the greater the sample size
– Population variability • The greater the variability, the greater the sample size
– To a degree, population size • The larger the population, the greater the sample size

Sample Size
Where z = confidence level (1.96) σ2 = variance (SD2) e = error (.05)

Sampling and Research Design
• Experimental Study (the “Gold Standard”) – Requires participants to be randomly designed to
either a treatment or a control group – Random assignment controls for a variety of
factors, other than the IV, that might account for observed group differences
– These are “threats” to internal validity (Campbell & Stanley)

Sampling and Research Design • External Validity
– The generalizability of the study’s conclusions to: • Other people • In other places • At other times
• Threats to external validity: – Non-random (biased) sample – Non-response and dropout

Sampling and Research Design • Another way of thinking about sample size: power
analysis • Type I error: concluding that there is an effect when in
fact there is not (p < 0.05) • Type II error: concluding that there is no effect when in
fact there is • To minimize Type II error, ask:
– How large is the effect size I’m looking for? – Is my sample large enough to detect an effect of this size?
• The smaller the effect size, the larger the sample will need to be

Future Topics in the Statistical Analysis for Criminal Justice Research Series
• Significance Testing: Comparing Means • Significance Testing: Comparing Proportions • Correlation and Simple Linear Regression • Displaying Data • Multiple Linear Regression • Logistic Regression • Exploratory Data Analysis