jrsa justice research and statistics association
TRANSCRIPT

October 1999
JRSAJRSA Justice Research and Statistics AssociationJustice Research and Statistics Association

An Analysis of Variables Affecting the Clearance of
Homicides: A Multistate Study
Charles WellfordJames Cronin
with the assistance of
Steve BrandlTimothy Bynum
Tom EversenSteve Galeria
October 1999
Justice Research and Statistics Association777 North Capitol Street, N.E.
Suite 801Washington, D.C. 20002
202-842-9330www.jrsa.org

Acknowledgments
This multistate research project was conducted by four state Statistical Analysis Centers: California (SteveGaleria, Director); Maryland (Charles Wellford, Director); Michigan (Tim Bynum, Director); and Wisconsin(Steve Grohmann). Charles Wellford, University of Maryland, served as Principal Investigator. James Cronin,University of Maryland, performed the data analyses. Site research was carried out in California by Roy V.Lewis, Sharon DeAngelis, and Debra Callahand; in Maryland, by Charles Wellford and James Cronin, withthe assistance of Leanna Allen, Dawn Cecil, Daniel Lee, Ray Paternoster, and Andre Rosay; by Tim Bynumand Sean Varano in Michigan; and by Steve Brandl and Tom Eversen in Wisconsin.
We would like to thank the members of the project advisory group for their suggestions and ideas: ThomasBarnes, Charlotte-Mecklenburg Police Department; John Firman, International Association of Chiefs ofPolice; Lawrence Sherman, University of Maryland, and Richard Williams, Madison (WI) Police Department.We would also like to thank the following homicide detectives whose experience and expertise in homicideinvestigations were helpful during the planning stages of this project: Bud Campbell, Philadelphia PoliceDepartment; Errol Etting and Timothy Keel, Baltimore City Police Department; Larry Nodiff, PhiladelphiaPolice Department; and Michael Sullivan, District of Columbia Metropolitan Police Department.
Paul White, Grant Manager at the Bureau of Justice Statistics, provided valuable information. Finally, PhyllisMcDonald, our grant monitor at the National Institute of Justice, has lent us her knowledge and supportthroughout this project, for which we are extremely grateful.
The following staff of the Justice Research and Statistics Association made valuable contributions to thisproject: Kellie Dressler, Senior Program Manager, Office of Juvenile Justice and Delinquency Prevention(former JRSA Deputy Director); Nancy Michel, Editor; and Stan Orchowsky, Research Director.
Joan C. WeissExecutive Director
This project was supported by Grant No. 96-IJ-CX-0047 awarded by the National Institute of Justice, Office of JusticePrograms, U.S. Department of Justice. Points of view in this document are those of the authors and do not necessarilyrepresent the official position or policies of the U.S. Department of Justice.

i
Executive Summary
In recent years, the ability of law enforcement to make arrests in crimes would appear to have
significantly diminished. This is especially true for homicide: from 1980 to 1996, the clearance rate for
homicides decreased more than 7 %. While there has been a decrease in clearance rates nationally, some
cities have high clearance rates for total crime and for homicides, and others have much lower rates than the
average. Analysis of clearance rates from 1980 through 1994 shows that clearance rates in cities have
remained very stable: those cities that are high in total clearance and high in homicide rates have remained
consistently so throughout this period, as have cities which are high-low, low-high, and low-low. This stability
suggests the existence of persistent factors that affect law enforcement agencies’ ability to clear homicide
cases. The purpose of this study was to identify these factors by comparing the characteristics of solved and
unsolved homicide cases.
This study examined 798 homicides that occurred in four large U.S. cities during 1994 and 1995.
These cities were selected to maximize variation on homicide and total index crime clearance rates measured
from 1980 through 1993. The cities include one that had relatively low homicide and total index crime
clearance rates; another that had high homicide clearance rates and low total clearance rates; a third that had
a high total clearance rate, but low homicide; and a fourth that had high total clearance and high homicide
crime clearance.
Two data collection instruments were employed to provide information for the study. The Homicide
Attribute Coding Instrument (HAC) provided a detailed description of the circumstances surrounding the
homicide case, along with information regarding prior criminal records of victims and offenders, relationship
between the victims and offenders, drug use by the offender or victim at the time of the incident, the number
of eyewitnesses, and suspected motivation for the homicide.
The Investigative Instrument provided information related to the process used by homicide detectives
to investigate the case. The Investigative Instrument provided information such as the status of the case, the
number of detectives assigned to the case, what evidence was found at the crime scene and what types of
checks and tests were performed on any evidence found, whether search warrants were issued, who was
interviewed, and what information was obtained by following up on the initial stages of the investigation.
The data collected with these two instruments were gathered from a random sample of 200 homicide
incidents in three cities and 198 in the fourth, for a total of 798 incidents. The cases in each city were selected
so that the proportion of open and closed homicide cases in the sample matched that of the entire homicide
caseload for those years for that city. This resulted in a total of 589 (74%) solved cases and 209 (26%)
unsolved cases in the sample.
ii
The data were collected by researchers from the Statistical Analysis Centers (SACs) in the states
in which each city was located. Data collectors searched through the open and closed homicide case files in
each city to locate relevant information.
A total of 215 factors related to the characteristics of the case and its investigation were examined
to determine their relationship to the status of the case (solved or unsolved). The factors that were found in
these preliminary bivariate analyses to be significantly related to the likelihood of the case being solved are
listed below.
A case was more likely to be closed if the victim was not a drug user or buyer and had no criminal
record. If the offender was Hispanic rather than black, the case was more likely to be solved. A case was
more likely to be closed if the offender was not identified as a drug buyer.
Cases in which the victim was killed by the use of a rifle, knife, or personal weapon (hands or feet)
were more likely to be solved than cases in which the victim was killed with a handgun. Furthermore, if the
police identified the weapon used to kill the victim, the case was more likely to be solved.
The presence of drugs in a case had an effect on its closing. Cases in which drugs were a
circumstance were less likely to be solved.
If the police did not identify the homicide as drug related, the homicide occurred in a private location,
the weather was not bad, the crime scene was not identified as a drug market, or there was at least one
witness, the case was more likely to be closed.
Motivation affected the closing of cases as follows: if the homicide involved preemption for an
anticipated retaliatory attack, involved a conflict over money or property other than drugs, or the offender was
defending him/herself, the case was more likely to be solved. If the homicide involved punishment for
informing, the case was less likely to be closed.
The number of detectives assigned to a case, and their actions, had a significant effect on closing the
case. A case was more likely to be solved if 3, 4, or 11 detectives were assigned to the case, compared to
just one detective. The case was less likely to be solved if it took the detectives more than 30 minutes to
arrive at the crime scene. If the detectives followed up on witness information, the case was more likely to
be solved.
The homicide was less likely to be solved if the first officer on the scene did not notify the homicide
unit, the medical examiner, or the crime lab, or if the officer did not attempt to locate witnesses. The case was
less likely to be solved if the crime scene was not measured or if no weapon was found at the scene. If the
crime scene itself was a residence, bar, or club rather than a public area, the case was more likely to be
solved.
iii
A case was more likely to be solved when witnesses were at the crime scene and provided valuable
information, including the circumstances of death, the motivation for the homicide, an identification of the
offender, an identification of the victim, or the location of the offender. When a neighborhood survey of the
crime scene provided valuable information or the neighbors of the victim were interviewed, the crime was
more likely to be solved. However, when friends of the victim were interviewed, the case was less likely to
be solved.
When computer checks were conducted on a suspect or a gun, the case was more likely to be solved,
but when computer checks were conducted on the victim or witnesses, the case was less likely to be solved.
Cases in which one of the detectives assigned was present at the postmortem examination were more
likely to result in closure. When the medical examiner collected specimens, recovered a projectile, or prepared
a body chart, the case was more likely to be solved.
The sources of information had an impact on the closing of cases. When police used surveillance in
a case, the case was more likely to be solved. Additionally, cases in which confidential informants provided
valuable information or witnesses came forward on their own were more likely to be closed.
When the variables discussed above were entered into a series of multivariate analyses, 15 variables
remained which were significantly related to the probability of closing a case. These 15 variables were: 1)
the offender was African American; 2) the offender was Hispanic; 3) a body chart of the victim was
prepared; 4) a computer check on the decedent was conducted; 5) a computer check on the suspect was
conducted; 6) a computer check on a witness was conducted; 7) a computer check on a gun was conducted;
8) the local Criminal Justice Information System (CJIS) was used for computer checks; 9) a witness at the
crime scene provided valuable information; 10) friends and acquaintances of the victim were interviewed;
11) neighbors of the victim were interviewed; 12) three or more detectives were assigned to the case; 13)
the location of the homicide was private; 14) an eyewitness observed the homicide; 15) the homicide was not
drug-related.
These findings have important implications for the investigation of homicides. The study identified 51
characteristics of homicide events and investigative practices that were significantly associated with
clearance. Of these, 37 were characteristics associated with police practices, with the remainder being
characteristics associated with the homicide event. This indicates that law enforcement policies and
procedures with regard to the investigation of homicides do make a difference in clearing cases. For example,
it appears that the actions of the initially responding officer(s) at the crime scene are important. How quickly
homicide detectives, evidence technicians, and medical examiners are notified and the time it takes them to
respond to the scene are associated with clearance. The initial activities of the first responding officers,
including securing the scene, identifying potential witnesses, preserving evidence, and initiating and

iv
participating in neighborhood surveys appear to be critical in solving homicide cases. The assignment of 3 or
4 detectives is optimal for clearing a case, but increasing the number is not efficient until one reaches very
large numbers of detectives (11 or more).
The findings suggest the growing importance of computer checks of various types, particularly checks
on guns, suspects, and victims. The results also suggest that defender and victim characteristics are not
critical variables in understanding clearance, nor are many other characteristics of the case. While drug cases
continue to be the most difficult for police to solve, the results show that the police can clear these cases given
the proper allocation of resources.
Overall, these results suggest that practices and policies of law enforcement agencies can have a
substantial impact on the clearance of homicide cases, and that clearance rates for homicide cases could be
increased if law enforcement agencies improved investigation policies and procedures. There are few
homicide cases that given the right initial response, the right timing, and the right dedication of resources
cannot be solved.

1
Introduction
In recent years, the number of arrests made in crimes known to police has significantly diminished
in the United States. The Uniform Crime Reports (UCR), which indicate the number of specific crime types
reported to police and the number of arrests made for those crimes, have shown a decline in clearance
rates since the 1960s. Additionally, various reports from individual law enforcement agencies have also
indicated a decline, especially for one of the most serious crimes, the crime of homicide.
UCR clearance rates indicate the rate of arrests made for a particular type of crime. For example,
the homicide clearance rate is determined by dividing the number of homicides reported in a year by the
number of arrests made for those homicides. However, for homicides, the number of murder/suicides and
the number of self-defense homicides are also included with the number of arrests when determining the
clearance rate. In other words, a case is considered cleared or closed if it was determined to be in self-
defense or the offender committed suicide at the scene.
Figure 1 shows the national clearance rate for homicide from 1961 to 1996. As the figure indicates,
the homicide clearance rate declined from 94% in 1961 to 67% in 1996. That means an arrest occurred
for 94% of the homicides in 1961 and only 67% of the homicides in 1996. While there are many reasons
to believe clearance rates are not a dependable measure of police performance (e.g., the arrest of a suspect
does not necessarily mean the suspect actually committed the crime), clearance rates can and have been
used to indicate the arrest of the most probable crime suspect.

1New York City was excluded due to the size and complexity of its homicide problem and homicideinvestigation system, and because it has recently experienced dramatic changes in its homicide rates.
2
The arrest of a suspect is one of the most important events in the criminal justice system, for
without an arrest, none of the accepted forms of punishment can be applied. According to deterrence
theory (Beccaria, 1764/1963) a punishment must be applied with certainty, severity, and celerity to prevent
an offender from committing future offenses (specific deterrence), as well as to prevent others who witness
the results of the punishment from engaging in criminal behavior (general deterrence). Although traditionally
most of the emphasis has been placed on severity, criminologists have long considered certainty and celerity
to be the more important aspects of deterrence (Beccaria, 1764/1963). Therefore, a decrease in clearance
rates (low certainty) signals an inability of the criminal justice system to achieve one of its primary goals–the
reduction of future crime, both specific and general. Similarly, incapacitation, rehabilitation, retribution, or
any other aim of punishment cannot be achieved without an arrest. Clearance rates can also affect citizens’
perception and fear of crime, in addition to reflecting the criminal justice system’s ability to impose
punishments on offenders.
While clearance rates have decreased nationally, the clearance rates of individual jurisdictions show
variation. Table 1 represents the 1994 homicide clearance rates for the 20 largest cities in the United States
for which UCR data are available, excluding New York City.1 The table depicts the level–high, medium,
or low–of both the total clearance rate and the homicide clearance rate in a 3x3 matrix. The levels (high,
medium, and low) are determined by breaking the 20 cities into three equal percentiles on homicide and
total clearance rate. Some cities are uniformly high, uniformly medium, uniformly low, or varied with regard
to total clearance and homicide clearance rates. Some cities have high clearance rates for total crimes and
homicides. Others have much lower than average clearance rates. The 20 cities are spread throughout the
matrix. Our preliminary analysis for the period from 1980 through 1994 demonstrated that the clearance
rates in these cities have remained amazingly stable over time and in relation to each other. This is especially
true for cities at the high and low ends of the classification. While a few shifts in the relative level of
clearance rates have occurred for some cities (e.g., San Francisco), generally cities with high clearance
rates have had high clearance rates from 1980 to 1994 and cities with low clearance rates have had low
clearance rates throughout that period. This was true for both homicide and total clearance rates taken
together and taken separately, indicating that there are variables affecting clearance rates in these cities that

3
are constant. Identifying these variables related to high levels of clearance could help improve police
practices and the ability of departments to clear serious crimes.
Table 1Homicide and Total Clearance Rate Levels, 1994,
for 20 of the Largest Cities in the United States
Homicide Clearance Level
Total Clearance
Level High Medium Low
High City Aa
Austin
Dallas
Jacksonville
Philadelphia
San Jose
City C
Boston
Medium El Paso Memphis
Phoenix
Seattle
San Diego
Washington, D.C.
Low City D Columbus
Houston
City B
San Antonio
San Francisco*Cities A, B, C, and D are the cities selected for study.
This study addresses the issue of clearance rates with the expectation that by understanding what
accounts for cities having high clearance rates for homicide, we will be able to prescribe changes that other
departments could use to improve their rate of homicide clearance. We focused on homicide because it
is a type of crime to which substantial police resources are devoted and one that greatly affects the public’s
confidence in law enforcement’s ability to deter crime. Large cities were used because of the substantial
contribution they make to the total homicide problem in the United States. In 1993, for example, 50.3%
of the homicides in the United States occurred in 62 of the largest cities (Maguire & Pastore, 1995).
Finally, by closely examining the way clearance rates are constructed in different cities, we hope to offer
4
guidance on the extent to which clearance rates can function as a measure of police performance in dealing
with the most serious crime reported to police.
Prior Research
Surprisingly, very little research has been conducted on the determinants of clearance rates for any
type of crime, including homicide. Our review of the existing literature found no comparative studies and
no systematic attempt to understand the determinants of clearance. While there has been some speculation
on what affects clearance rates, this speculation has not involved systematic research. The International
Association of Chiefs of Police Murder Summit (1995) and studies by Riedel and Rinehart (1994) and
Cardarelli and Cavanaugh (1992) have demonstrated the decline in homicide clearance, have offered
various reasons for the decline, and have identified certain methodological problems in this research. The
suggested reasons for the decline in homicide clearance can be categorized as follows:
• Change in the nature of homicide. In the past, homicide was thought to be primarily a crime
of passion involving family members or close acquaintances. These social relationships and the way
in which the crime was carried out made it quite easy to identify the alleged offender. This, in turn,
led to higher rates of clearance. In recent years, however, homicides have more often been
stranger-to-stranger crimes and have involved more activity in the illegal drug market. Stranger-to-
stranger crimes and drug market-related homicide are expected to have much lower probability
of identifying alleged offenders; therefore, clearance rates will be lower.
• Change in the nature of police resources. In recent years police resources have been
stretched, which may have diminished the ability of police departments to devote substantial and
experienced personnel to police investigations. This change in the way police departments respond
could have a negative impact on rates of clearance.
• Changes in bystander behavior. The willingness to cooperate with police, particularly in large
urban areas, may have decreased. Third parties may be less likely to act as witnesses and sources

5
of information, making it less likely that alleged offenders will be identified, especially in stranger-
to-stranger crimes.
These suggestions provide interesting anecdotal hypotheses that might explain changes in homicide
clearance, but no one has subjected these or other possible explanations to systematic research.
In part, the absence of systematic research has been, as Maxwell (1989) has observed, due to
problems in the national data on homicides. The primary source of homicide data is the supplemental
homicide reports (SHR) filed with the Federal Bureau of Investigation (FBI). These reports are quite useful
for basic descriptions of homicides, including details such as race, ethnicity, and gender of victim and
offender; number of victims and offenders in the incident; weapons used; circumstances of the homicide;
and relationship between victim and offender. However, the SHR do not indicate how the homicide was
cleared or whether it was cleared. UCR data also do not provide detailed information on the nature of the
offense or, more importantly, on the nature of the investigation. Therefore, they offer little as a source of
data for understanding the clearance process.
The absence of research on the homicide investigation process is not surprising when one considers
the general absence of attention by researchers to police investigations other than those conducted by patrol
officers. The works of Greenwood, Chaiken, and Petersilia on detectives (1977), Skolnick on rape
investigations (1966), Forst on arrest convictability (1982), and Eck (1992) on investigation are the most
widely cited studies of nonpatrol investigation practices. Greenwood’s work was focused more on
outcomes than it was on the variations in strategies and their impact on outcomes. It is widely thought to
question whether the resources devoted to detective functions are justified. Skolnick focused more on the
role the victim plays in determining the level of investigation. Forst was most concerned with developing
a measure of patrol performance that relates to the subsequent conviction of arrested offenders. Eck
focused more on the conceptualization of the investigation than on analysis of the models he developed.
In general, criminologists have paid more attention to patrol functions than the investigative process.
For example, in a recent compendium of police research (Tonry and Morris, 1992), not one mention is
made of studies of detectives or other police investigations (except those in internal affairs). Given the
seriousness of cases referred for investigation, especially homicide cases, our research on homicide units

2Since the cities were chosen based on the UCR data, the reader should be cautioned about theinaccuracies of that data. Police departments have been accused of underreporting crimes to the FBI for the purposeof making their city’s crime problem seem less serious.
6
and the cases they handle is important and should have an impact on the resources allocated to homicide
units in all medium and large police departments.
Methodology
Using data provided to us by the FBI, we constructed a data set for 170 cities consisting of their
levels of total crime and homicide, the demographic characteristics of the city, and the number of homicides
and other crimes cleared by an arrest for 1980, 1985, 1990, 1991, 1992, 1993, and 1994. In addition to
creating and conducting preliminary analyses of these data, we focused on 20 of the largest cities, looking
for variations in their rates of clearance, changes in clearance rates through this period, and levels of
homicide. As noted above, these analyses demonstrated clearance rate levels for most of these cities are
relatively stable from the period 1980 through 1994, although the cities varied considerably in their rates
of clearance of homicide. For that reason, our basic study design is multisite, selecting four cities that have
relatively stable patterns of clearance and high levels of homicide.2 Only four cities were chosen because
of limited resources. The four cities are not identified because of an agreement to maintain their anonymity.
City A’s Police Department has consistently had high rates of clearance for homicides and for total
crimes relative to the other departments. City B has had a low rate for each of these crime categories. City
C has had a high rate of clearance for total crimes but a low homicide clearance rate, and City D has had
a high homicide clearance rate but a low total crime clearance rate. These four cities were among those of
the largest cities in the United States with the highest homicide rates in 1994. Figure 2 shows the homicide
clearance rate for these four cities for the period 1980–93. These four cities have had high homicide rates
and consistently different clearance levels throughout this 14-year period.

3Adapted from an instrument developed by Colin Loftin, Brian Wiersema, April Pattavina, Paul Mazerolle,and Adam Dobrin.
7
Instruments
Three instruments were employed to provide information for this study. The instruments describe
the circumstances surrounding the homicide case, the investigation process, and the organizational structure
of the departments.
The Homicide Attribute Coding Instrument3 (HAC) supplies a detailed description of each
homicide case. It provides information concerning prior records of the victim and offender, relationship
between victim and offender, drug use by the offender or victim at the time of the incident, the number of
eyewitnesses, and motivation for the homicide. Examples of motivations for the homicide include rivalry
over a lover; conflict over drugs, drug paraphernalia, or drug territory; commission of a crime; and conflicts
not involving drug use. The purpose of the HAC instrument is to describe the circumstances surrounding
the homicide.
The Investigative Instrument arose from a focus group consisting of police researchers and
experienced homicide investigators from three different departments. The group helped identify key aspects
of the investigation that should be included in the instrument. The Investigative Instrument provides
information such as the status of case; the number of detectives assigned to the case; evidence found at the
scene; whether search warrants were issued; interviews with witnesses, family, friends, neighbors, hospital
staff, and the medical examiner; and details gathered from following up on information acquired during initial
stages of the investigation. The Investigative Instrument describes the events that occurred during the
investigation.
4Data collectors differed by state and were supplied by each state’s Statistical Analysis Center (SAC).Through contacts each SAC had with police departments in the four cities, it was arranged for data collectors to goto the homicide departments and read through the opened and closed homicide files. After reading a file, the datacollectors completed a Homicide Attribute Coding Instrument and an Investigative Instrument for that file.
8
The last instrument provides an organizational profile of the four homicide departments. The
Organizational Instrument characterizes the level of resources, personnel, training, and management each
department devoted to homicide investigations during the last 10 years. This instrument also provides
information concerning the dynamics of each department during the past 10 years.
Data Collection
The data collected from the HAC Instrument and the Investigative Instrument were gathered from
a random sample of 200 homicide incidents in each city, for a total of 800 incidents. The homicides
occurred during the years 1994 and 1995. However, the cases may have been solved after those years
since the data were collected from September 1997 to January 1998. The total number of open and closed
cases was known before the sampling process was begun. It was not known, however, which individual
cases were open and closed. Therefore, a random sample was used to approximate the proportion of open
and closed cases for each city.
The data for the HAC and Investigative Instruments were collected from the homicide departments’
case files. Data collectors4 searched through the open and closed homicide files to locate relevant
information. In departments with well-organized files, the HAC and Investigative Instruments both took
approximately an hour and fifteen minutes to complete; in the less organized files, the two instruments took
up to two and a half hours to complete.
Some homicide cases involve more than one victim. Cases with multiple homicides were regarded
as one incident. Victim information was collected for all victims in multiple homicide cases and entered in
the database.
The Organizational Instrument was mailed out to the site researchers in each state. The site
researchers were responsible for having the department in their city fill out the instrument. Some
departments could not fill out all the information due to the organizational structure of their departments.
9
For example, in City C, everything is done on a divisional level, not a unit level. Therefore, some
information, such as the budget, overtime spending, and number of personnel, is known only at the
departmental level, and not for the homicide units. Additionally, one department did not return its
Organizational Instrument and another department was not comfortable giving out the information asked
in the instrument. Therefore, an analysis of the Organizational Instrument could not be performed.
Findings
The findings consist of four sections. The first two sections are descriptive in nature: the first section
describes the homicides and the second describes the investigative process. The third section discusses
variables associated with solving a case. Logistical regression analysis, with clearance as the dependent
variable, is used to determine the estimated impact various variables had on clearing a case. The final
section presents logistical regression models using independent variables that have a significant effect on
solving a case.
Homicide Case Analysis
Detailed data were collected on 798 homicides in City A, City B, City C, and City D. The sample
contains 200 homicide cases from each city, except for City C, which submitted 198 cases. This section
consists of three parts. Part one discusses general circumstances of the homicide, part two contains victim
information, and the final part discusses information about the offender.
General Circumstances
A total of 589 (74%) solved cases and 209 (26%) unsolved cases are in our sample. Of the
unsolved cases, 44 are still active with the homicide unit, 87 have been turned over to the “cold case”
squad, and 78 are inactive. The “cold case” squad attempts to solve cases that the regular homicide unit
has been unable to solve. Inactive cases are open cases that no one is currently attempting to solve. These
cases could become active again if new information is discovered.
10
Of the cases active with the homicide unit, the mean time since the case opened is 35.1 months
(1,067 days). The mean time since a case has been opened for cases turned over to the cold case squad
is 35.4 months (1,078 days). For inactive cases, the mean time since the case opened is 36.4 months
(1,105 days). The average unsolved case in our study has been open for approximately 3 years. Of the
closed cases in our study, 93.2% were solved within 1 year and 50% were solved within a week.
Therefore, if a case is not solved within a year, the chances of it ever being solved are low.
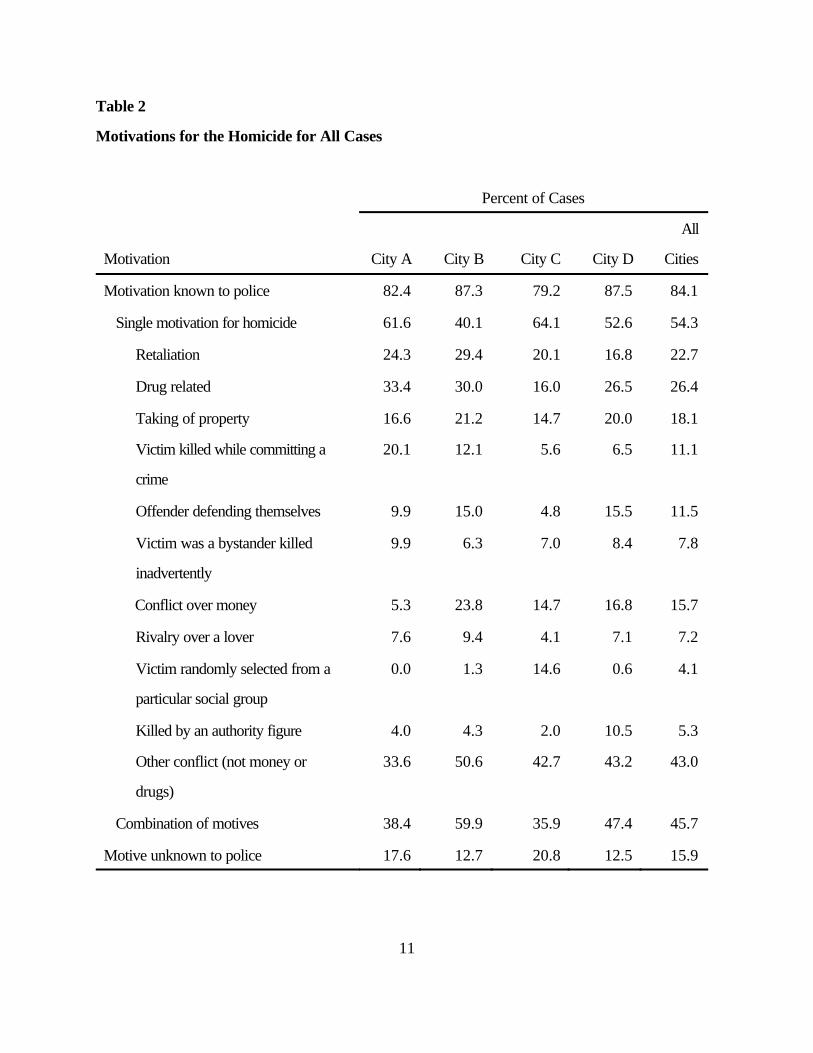
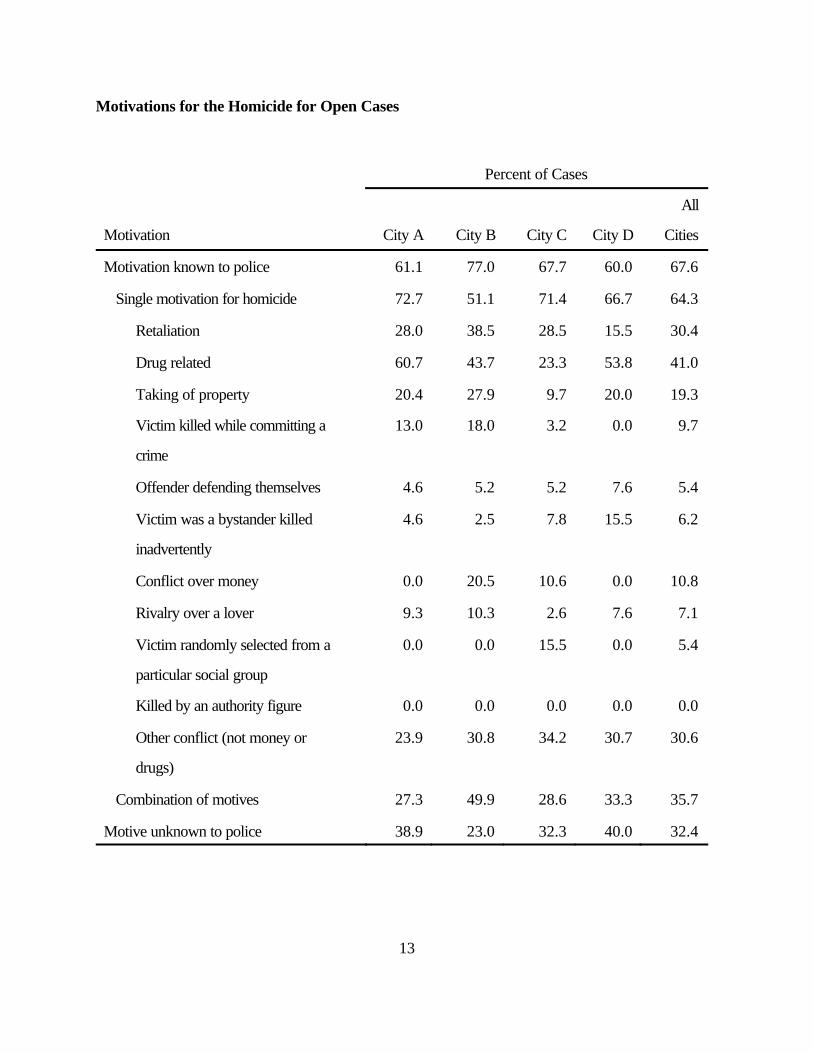
Table 2 lists motivations for the homicide for all cases, closed cases, and open cases. The
motivations, which were classified by the data collectors who read the homicide files, are based on the
percent of known motives. The motivations can and do overlap in some cases. The predominate reason
for committing the homicide for all cases was “other conflict” (43.0%). “Other conflict” involves an
argument between the victim and offender that does not involve money or drugs. The second largest
motivation for the homicide was drug related (26.4%). Some of the drug-related motives are failure to pay
a drug debt, robbery during a drug deal, and conflict over drug territory. The third greatest motivation for
the homicide was retaliation (22.7%). This was followed by taking of property (18.1%), conflict over
money (15.7%), self-defense (11.5%), victim killed while committing a crime (11.1%), victim was a
bystander who was killed inadvertently (7.8%), rivalry over a lover (7.2%), killed by an authority figure
(5.3%), and victim randomly selected from a particular social group (4.1%). Killed by an authority figure
refers to being killed by a parent or guardian.
The motivations for the closed cases were “other conflict” (45.8%), drug related (23.0%),
retaliation (20.9%), taking of property (17.7%), conflict over money (16.7%), self-defense (12.9%), victim
killed while committing a crime (11.6%), victim was a bystander killed inadvertently (8.1%), rivalry over
a lover (7.1%), killed by an authority figure (6.9%), and victim randomly selected from particular social
group (3.8%). A motive was unknown by the police in 10.1% of the closed cases. Of those cases, 66%
of the time the victim and offender knew each other before the homicide incident.
11
Table 2
Motivations for the Homicide for All Cases
Percent of Cases
Motivation City A City B City C City D
All
Cities
Motivation known to police 82.4 87.3 79.2 87.5 84.1
Single motivation for homicide 61.6 40.1 64.1 52.6 54.3
Retaliation 24.3 29.4 20.1 16.8 22.7
Drug related 33.4 30.0 16.0 26.5 26.4
Taking of property 16.6 21.2 14.7 20.0 18.1
Victim killed while committing a
crime
20.1 12.1 5.6 6.5 11.1
Offender defending themselves 9.9 15.0 4.8 15.5 11.5
Victim was a bystander killed
inadvertently
9.9 6.3 7.0 8.4 7.8
Conflict over money 5.3 23.8 14.7 16.8 15.7
Rivalry over a lover 7.6 9.4 4.1 7.1 7.2
Victim randomly selected from a
particular social group
0.0 1.3 14.6 0.6 4.1
Killed by an authority figure 4.0 4.3 2.0 10.5 5.3
Other conflict (not money or
drugs)
33.6 50.6 42.7 43.2 43.0
Combination of motives 38.4 59.9 35.9 47.4 45.7
Motive unknown to police 17.6 12.7 20.8 12.5 15.9

12
Motivations for the Homicide for Closed Cases
Percent of Cases
Motivation City A City B City C City D
All
Cities
Motivation known to police 0.3 1.9 84.4 92.4 89.9
Single motivation for homicide 58.8 36.0 61.4 51.0 51.6
Retaliation 22.8 26.4 17.1 16.9 20.9
Drug related 28.2 25.6 13.4 24.0 23.0
Taking of property 15.2 18.2 17.0 20.0 17.7
Victim killed while committing a
crime
22.8 9.4 6.7 7.6 11.6
Offender defending themselves 10.9 18.1 4.8 16.2 12.9
Victim was a bystander killed
inadvertently
10.9 7.5 6.7 7.8 8.1
Conflict over money 6.3 24.8 16.2 18.3 16.7
Rivalry over a lover 7.2 9.1 4.8 7.1 7.1
Victim randomly selected from a
particular social group
0.0 1.6 14.3 0.7 3.8
Killed by an authority figure 5.2 5.9 3.0 12.0 6.9
Other conflict (not money or drugs) 35.4 56.9 45.8 44.4 45.8
Combination of motives 41.2 64.0 38.6 49.0 48.4
Motive unknown to police 9.7 8.1 15.6 7.6 10.1
13
Motivations for the Homicide for Open Cases
Percent of Cases
Motivation City A City B City C City D
All
Cities
Motivation known to police 61.1 77.0 67.7 60.0 67.6
Single motivation for homicide 72.7 51.1 71.4 66.7 64.3
Retaliation 28.0 38.5 28.5 15.5 30.4
Drug related 60.7 43.7 23.3 53.8 41.0
Taking of property 20.4 27.9 9.7 20.0 19.3
Victim killed while committing a
crime
13.0 18.0 3.2 0.0 9.7
Offender defending themselves 4.6 5.2 5.2 7.6 5.4
Victim was a bystander killed
inadvertently
4.6 2.5 7.8 15.5 6.2
Conflict over money 0.0 20.5 10.6 0.0 10.8
Rivalry over a lover 9.3 10.3 2.6 7.6 7.1
Victim randomly selected from a
particular social group
0.0 0.0 15.5 0.0 5.4
Killed by an authority figure 0.0 0.0 0.0 0.0 0.0
Other conflict (not money or
drugs)
23.9 30.8 34.2 30.7 30.6
Combination of motives 27.3 49.9 28.6 33.3 35.7
Motive unknown to police 38.9 23.0 32.3 40.0 32.4

14
The motivations for open cases were in a slightly different order than for closed cases. The main
motivation was drug related (41.0%). This was followed by “other conflict” (30.6%) and retaliation
(30.4%). Next was taking of property (19.3%), conflict over money (10.8%), victim killed while
committing a crime (9.7%), rivalry over a lover (7.1%), victim was a bystander killed inadvertently (6.2%),
self-defense (5.4%), and victim randomly selected from a particular social group (5.4%). There were no
open cases with the motivation killed by an authority figure.
Table 2 also lists motives by city. Some difference in motivation across cities can be seen. Homicides
in City B are more likely to involve more than one motive than homicides in the other three cities.
Homicides in City C are less likely to be drug related but more likely to involve randomly selecting a victim
from a particular social group. Homicides in City A are less likely to involve a conflict over money or an
“other conflict” compared to the other cities, but more likely to involve the victim getting killed while
committing a crime.
Table 3 lists the primary cause of death for all homicides, closed homicides, and open homicides. The
majority of homicides involved being shot by a handgun (65.7%). This was distantly followed by being
stabbed with a knife or other instrument (11.0%), being shot with other than a handgun (9.5%), and other
causes of death (13.7%).
The primary cause of death for each city is also listed in Table 3. Three noticeable differences between
cities can be seen. The primary cause of death is more likely to be a handgun in City A than in the other
cities. Being shot with other than a handgun is more likely to occur in City B than in the other three cities.
And homicides in City D are more likely to involve “other” (not shot or stabbed) causes of death.
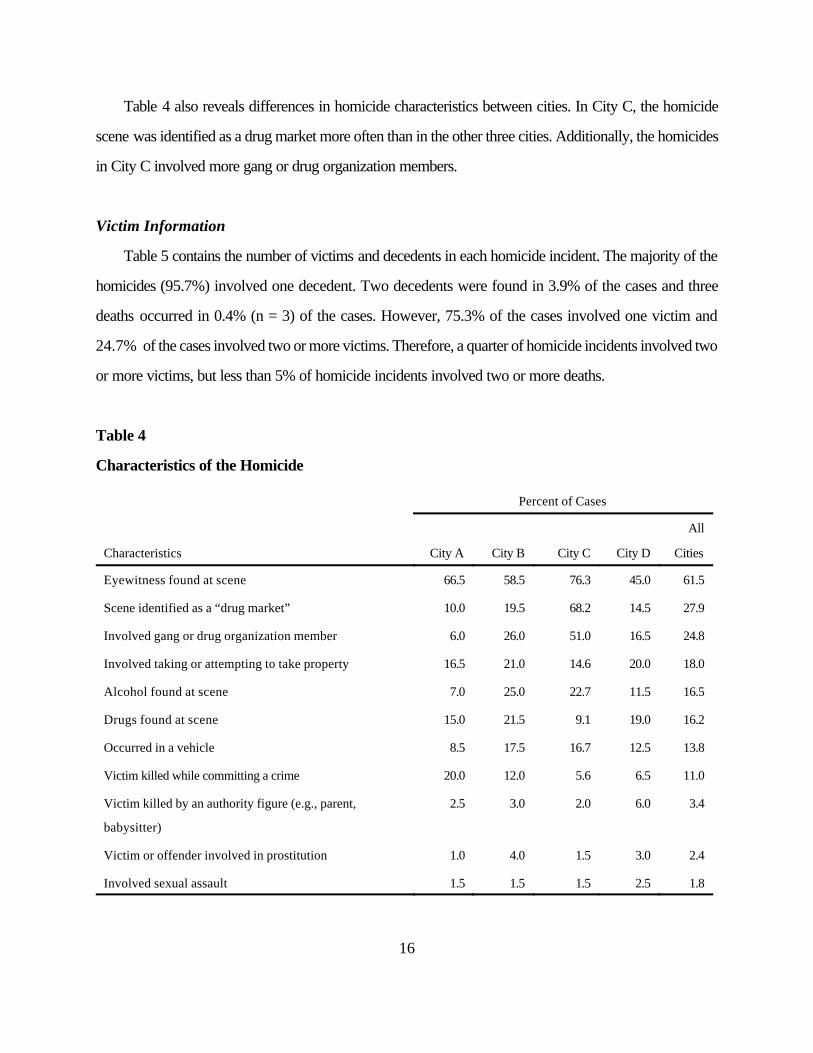
Table 4 lists characteristics surrounding the homicides. Drugs were found at the scene for 16.2% of
the homicides and alcohol was found at 16.5% of the homicide scenes. The homicide scenes were
described as “drug market areas” in 27.9% of the cases. The police located at least one eyewitness for
61.5% of the homicides. The homicide occurred in a vehicle for 13.8% of the homicides. The taking or
attempting to take property was involved in 18% of the homicides. The victim was killed while committing
a crime 11.0% of the time.

15
Table 3
Primary Cause of Death for All Cases
Percent of Cases
Cause of Death City A City B City C City D All Cities
Shot with a handgun 75.5 61.8 64.1 61.5 65.7
Shot with other than a handgun 3.0 19.0 11.6 4.5 9.5
Stabbed 9.5 8.0 12.6 14.0 11.0
Other 12.0 11.0 11.6 20.0 13.7
Missing 0.0 0.5 0.0 0.0 0.1
Primary Cause of Death for Closed Cases
Percent of Cases
Cause of Death City A City B City C City D All Cities
Shot with a handgun 74.5 62.6 62.2 61.2 65.0
Shot with other than a handgun 2.8 17.3 11.9 3.5 8.5
Stabbed 10.3 7.9 13.3 15.9 12.1
Other 12.4 12.2 12.6 19.4 14.5
Missing 0.0 0.0 0.0 0.0 0.0
Primary Cause of Death for Open Cases
Percent of Cases
Cause of Death City A City B City C City D All Cities
Shot with a handgun 78.2 59.0 68.3 63.3 67.5
Shot with other than a handgun 3.6 23.0 11.1 10.0 12.4
Stabbed 7.3 8.2 11.1 3.3 4.3
Other 10.9 9.8 9.5 23.2 11.5
Missing 0.0 1.6 0.0 0.0 0.5
16
Table 4 also reveals differences in homicide characteristics between cities. In City C, the homicide
scene was identified as a drug market more often than in the other three cities. Additionally, the homicides
in City C involved more gang or drug organization members.
Victim Information
Table 5 contains the number of victims and decedents in each homicide incident. The majority of the
homicides (95.7%) involved one decedent. Two decedents were found in 3.9% of the cases and three
deaths occurred in 0.4% (n = 3) of the cases. However, 75.3% of the cases involved one victim and
24.7% of the cases involved two or more victims. Therefore, a quarter of homicide incidents involved two
or more victims, but less than 5% of homicide incidents involved two or more deaths.
Table 4
Characteristics of the Homicide
Percent of Cases
Characteristics City A City B City C City D
All
Cities
Eyewitness found at scene 66.5 58.5 76.3 45.0 61.5
Scene identified as a “drug market” 10.0 19.5 68.2 14.5 27.9
Involved gang or drug organization member 6.0 26.0 51.0 16.5 24.8
Involved taking or attempting to take property 16.5 21.0 14.6 20.0 18.0
Alcohol found at scene 7.0 25.0 22.7 11.5 16.5
Drugs found at scene 15.0 21.5 9.1 19.0 16.2
Occurred in a vehicle 8.5 17.5 16.7 12.5 13.8
Victim killed while committing a crime 20.0 12.0 5.6 6.5 11.0
Victim killed by an authority figure (e.g., parent,
babysitter)
2.5 3.0 2.0 6.0 3.4
Victim or offender involved in prostitution 1.0 4.0 1.5 3.0 2.4
Involved sexual assault 1.5 1.5 1.5 2.5 1.8

17
Table 5
Number of Victims per Homicide Incident
Victims
(Percent/Number of Incident)
Number City A City B City C City D All Cities
1 78.0
(156)
73.5
(147)
68.7
(136)
81.0
(162)
75.3
(601)
2 12.5
(25)
15.0
(30)
20.2
(40)
11.0
(22)
14.7
(117)
3 or more 9.5
(19)
11.0
(22)
11.1
(22)
8.0
(16)
9.9
(79)
Unknown 0.0
(--)
0.5
(1)
0.0
(--)
0.0
(--)
0.1
(1)
Number of Decedents per Homicide Incident
Decedents
(Percent/Number of Incidents)
Number City A City B City C City D All Cities
1 96.0
(192)
92.0
(184)
97.5
(193)
97.5
(195)
95.7
(764)
2 4.0
(8)
6.5
(13)
2.5
(5)
2.5
(5)
3.9
(31)
3 or more 0.0
(--)
1.5
(3)
0.0
(--)
0.0
(--)
0.4
(3)
Unknown 0.0
(--)
0.0
(--)
0.0
(--)
0.0
(--)
0.0
(--)

18
Table 6 Victim Characteristics (Age, Race, and Sex)
Age Group
(years)
Male
(Percent/Number of Cases)
Female
(Percent/Number of Cases) All
CasesWhite African
American
Hispanic Other Missing White African
American
Hispanic Other Missing
0-14 0.2
(2)
1.8
(14)
0.5
(4)
0.0
(--)
0.0
(--)
0.1
(1)
1.3
(11)
0.0
(--)
0.0
(--)
0.1
(1)
4.1
(33)
15-24 1.1
(9)
22.8
(182)
7.4
(59)
0.6
(5)
0.2
(2)
0.4
(3)
2.3
(18)
0.5
(4)
0.2
(2)
0.1
(1)
35.7
(285)
25-34 2.6
(21)
19.7
(157)
3.5
(28)
0.2
(2)
0.4
(3)
0.0
(--)
3.1
(25)
0.1
(1)
0.0
(--)
0.0
(--)
29.7
(237)
35-44 2.6
(21)
10.0
(80)
1.9
(15)
0.5
(4)
0.0
(--)
0.4
(3)
2.1
(17)
0.4
(3)
0.2
(2)
0.0
(--)
18.2
(145)
45-64 1.1
(9)
4.1
(33)
0.8
(6)
0.2
(2)
0.0
(--)
0.2
(2)
0.4
(3)
0.1
(1)
0.0
(--)
0.0
(--)
7.0
(56)
65+ 0.8
(6)
1.1
(9)
0.0
(--)
0.1
(1)
0.0
(--)
0.6
(5)
0.1
(1)
0.0
(--)
0.0
(--)
0.0
(--)
2.8
(22)
Missing 0.2
(2)
0.9
(7)
0.4
(3)
0.0
(--)
0.0
(--)
0.1
(1)
0.6
(5)
0.2
(2)
0.0
(--)
0.0
(--)
2.5
(20)
Total 8.8
(70)
60.4
(482)
14.4
(115)
1.8
(14)
0.6
(5)
1.9
(15)
10.0
(80)
1.3
(11)
0.5
(4)
0.2
(2)
100.0
(798)

19
The persons with the highest risk of being a homicide victim in our sample were young, black males.
Table 6 presents the homicide rate by age, sex, and race. The victim was 24 years of age or under in
39.8% of the cases. In 70.4% of the cases the victim was African American and 86.0% of the victims were
male.
Alcohol was being used by 21.5% of the decedents at the time of their death, and 15.1% of the
decedents were using drugs. Police identified 19.8% of the decedents as drug dealers and 13.6% of the
decedents as drug buyers. The decedents were killed while buying drugs in 3.6% of the cases and killed
while selling drugs in 6% of the cases.
Criminal record searches revealed 29.8% of the decedents had a prior record for drugs, 31.9% had
a prior record for violent crimes, and 33.3% had a prior record for property crimes. In all, 48% of
decedents had some type of prior record. At the time of the homicide, 15% of the decedents were in
possession of a weapon.
Offender Information
The majority of homicides involved a lone offender. Two-offender homicides occurred in only 9.3%
of the cases. Young, black males represent the majority of offenders in our sample. Table 7 displays the
offenders’ age, sex, and race. The offenders were 24 years old or younger in 53.7% of the cases. In 93.5%
of the cases the offender was a male and in 74.8% of the cases the offender was an African American.
Police officers account for 1% (n = 8) of the “offenders” in our sample. In 7 of the 8 police officer
homicides in our sample, the officer was acting in the line of duty. In the eighth case, the officer was off duty
and the homicide was not justifiable.
Alcohol was being used by 15.9% of the offenders at the time of the incident and 8.6% of the
offenders were on drugs when they killed the victim. Police identified 2.5% of the offenders as drug buyers
and 3.5% of them as drug sellers. A criminal records search revealed 24.8% of offenders had a prior
record for a drug offense, 33.6% had previously committed a violent crime, and 31.5% had a prior record
for a property crime. In all, some type of prior record was found for 45.1% of the offenders.

20
Table 7 Offender Characteristics (Age, Race, and Sex)
Age
Group
(years)
Male
(Percent/Number of Cases)
Female
(Percent/Number of Cases) All
Cases aWhite African
American
Hispanic Other Missin
g
White African
American
Hispanic Other Missing
0-14 0.0
(--)
0.6
(4)
0.0
(--)
0.0
(--)
0.0
(--)
0.0
(--)
0.3
(2)
0.0
(--)
0.0
(--)
0.0
(--)
0.9
(6)
15-24 1.3
(9)
38.1
(257)
9.8
(66)
0.7
(5)
0.4
(3)
0.6
(4)
1.8
(12)
0.0
(--)
0.0
(--)
0.0
(--)
52.8
(356)
25-34 1.9
(13)
14.4
(97)
2.7
(18)
0.4
(3)
0.3
(2)
0.0
(--)
2.1
(14)
0.0
(--)
0.0
(--)
0.0
(--)
21.8
(147)
35-44 0.9
(6)
6.4
(43)
0.7
(5)
0.0
(--)
0.0
(--)
0.1
(1)
0.9
(6)
0.1
(1)
0.0
(--)
0.0
(--)
9.2
(62)
45-64 0.7
(5)
2.5
(17)
0.7
(5)
0.4
(3)
0.1
(1)
0.0
(--)
0.4
(3)
0.0
(--)
0.0
(--)
0.0
(--)
4.9
(33)
65+ 0.1
(1)
0.3
(2)
0.0
(--)
0.0
(--)
0.0
(--)
0.0
(--)
0.0
(--)
0.0
(--)
0.0
(--)
0.0
(--)
0.4
(3)
Missing 0.3
(2)
7.1
(48)
2.5
(17)
0.0
(--)
0.0
(--)
0.0
(--)
0.0
(--)
0.0
(--)
0.0
(--)
0.0
(--)
9.9
(67)
Total 5.3
(36)
69.3
(468)
16.4
(111)
1.6
(11)
0.9
(6)
0.7
(5)
5.5
(37)
0.1
(1)
0.0
(--)
0.0
(--)
100
(675)a There are 123 cases for which the race, gender, and age of the offender are unknown.

21
Table 8
Relationship Between Victim and Offender for All Cases
Percent of Cases
Relationship City A City B City C City D All Cities
Victim knew offender 46.0 55.0 45.5 66.0 53.1
Member of the same family 4.0 13.0 3.5 10.5 7.8
Romantic relationship 6.5 7.0 3.5 8.0 6.3
Friendship/Circumstances 24.5 31.5 38.4 42.5 34.2
Strangers 28.0 18.0 28.3 20.0. 23.6
Relationship unknown 26.0 27.0 26.3 14.0 23.3
Relationship Between Victim and Offender for Closed Cases
Percent of Cases
Relationship City A City B City C City D All Cities
Victim knew offender 62.1 73.4 59.3 75.9 68.1
Member of the same family 5.5 18.0 5.2 12.4 10.4
Romantic relationship 9.0 10.1 4.4 9.4 8.3
Friendship/Circumstances 33.1 41.7 50.4 48.8 43.6
Strangers 37.2 22.3 39.3 23.5 30.2
Relationship unknown 0.7 4.3 1.5 0.6 1.7
22
Relationship Between Victim and Offender for Open Cases
Percent of Cases
Relationship City A City B City C City D All Cities
Victim knew offender 3.6 13.1 15.9 10.0 11.0
Member of the same family 0.0 1.6 0.0 0.0 0.5
Romantic relationship 0.0 0.0 1.6 0.0 0.5
Friendship/Circumstances 1.8 8.2 12.7 6.7 7.7
Strangers 3.6 8.2 4.8 0.0 4.8
Relationship unknown 92.7 78.7 79.4 90.0 84.2
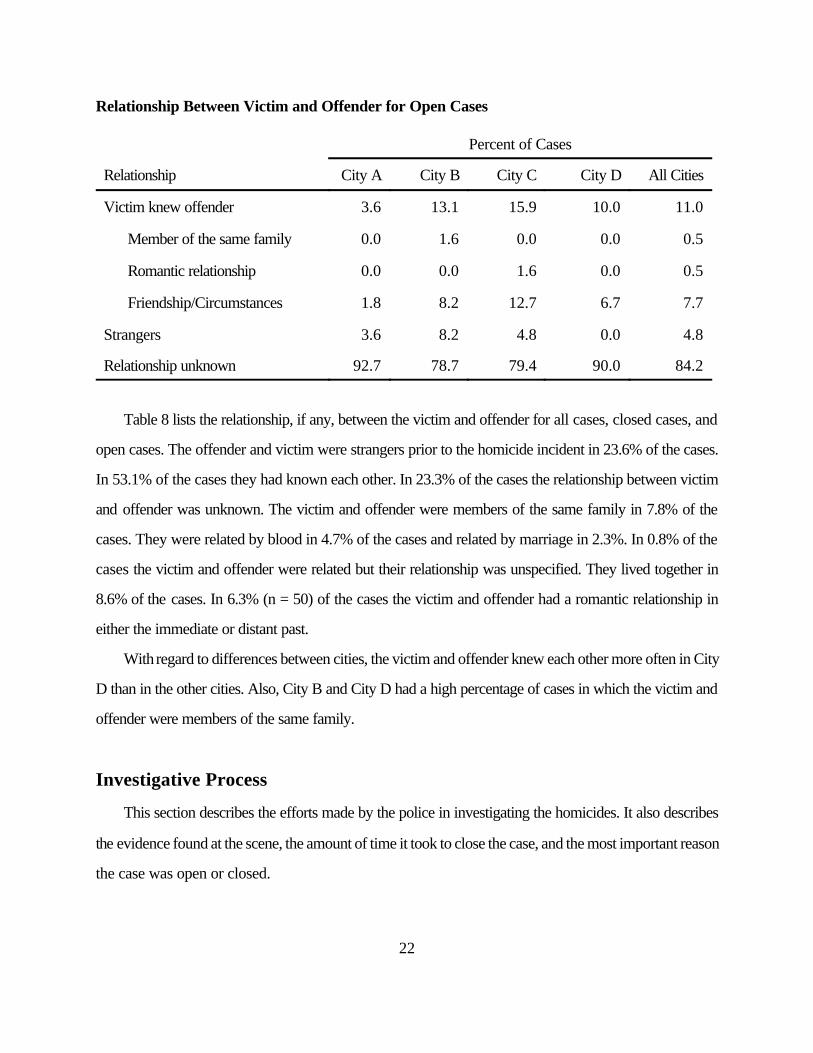
Table 8 lists the relationship, if any, between the victim and offender for all cases, closed cases, and
open cases. The offender and victim were strangers prior to the homicide incident in 23.6% of the cases.
In 53.1% of the cases they had known each other. In 23.3% of the cases the relationship between victim
and offender was unknown. The victim and offender were members of the same family in 7.8% of the
cases. They were related by blood in 4.7% of the cases and related by marriage in 2.3%. In 0.8% of the
cases the victim and offender were related but their relationship was unspecified. They lived together in
8.6% of the cases. In 6.3% (n = 50) of the cases the victim and offender had a romantic relationship in
either the immediate or distant past.
With regard to differences between cities, the victim and offender knew each other more often in City
D than in the other cities. Also, City B and City D had a high percentage of cases in which the victim and
offender were members of the same family.
Investigative Process
This section describes the efforts made by the police in investigating the homicides. It also describes
the evidence found at the scene, the amount of time it took to close the case, and the most important reason
the case was open or closed.

23
The majority of homicide cases are handled by one or two detectives. One detective was assigned to
23.7% of the cases and two detectives were assigned to 41.6% of the cases. More than two detectives
were assigned to 34.5% of the cases. However, 15.5% of those cases were handled by 11 homicide
detectives and these cases were all from City D.
The detective assigned to the homicide went to the crime scene in 90.4% of the cases. The crime scene
was a public place (street or park) in 52.4% of the cases. The homicides occurred in a private
residence 34.2% of the time. The remainder of cases occurred in a commercial establishment. Only 2%
of the homicides occurred in a bar or club.
A search warrant was necessary for the crime scene for 3.2% of the cases. A search warrant was
issued for another location besides the crime scene in 14.9% of the cases. When a search warrant was
issued for another location besides the crime scene, 68.9% (82 cases) of the time the location was the
suspect’s home. A search warrant was issued for a total of 138 (17.2%) cases in our sample.
The crime scene was secured by the first officer on the scene in 87.1% of the cases. The first officer
on the scene protected the scene, notified the homicide unit, notified the medic, notified the crime lab, and
attempted to locate witnesses in over 90% of the cases. In over 70% of the cases the crime scene was
secured within 10 minutes. The majority of crime scenes were kept secure for 2 to 5 hours.
Evidence technicians are responsible for collecting evidence at a crime scene. Some form of physical
evidence was discovered in 72.8% (581) of the cases. In cases in which physical evidence was found,
8.8% of the time fingerprints were located. Of the 600 cases in which a gun was used, a bullet was found
33.7% (202 cases) of the time and shell casings were found 63.7% (382 cases) of the time.
A witness was found at the crime scene in 80.3% of the cases. In 19.4% of the cases no witnesses
were found at the crime scene, and for 0.3% of the cases this information was missing. When witnesses
were found at the crime scene, they were interviewed 97.5% of the time. In approximately 60% of the
cases the witnesses were interviewed by both the first officer on the scene and the homicide detective
assigned to the case. Of the cases in which witnesses were interviewed, 85.6% of the witnesses were
interviewed at the police department and 13.8% were interviewed at just the crime scene. The location for
24
the interview was unknown for 0.6% of the cases. The interviews lasted less than 2 hours per witness for
approximately 90% of the cases.
The witnesses at the scene provide valuable information to the police in 65% of the cases. A witness
described the circumstances of the death 50.8% of the time and the motivation for the death 31% of the
time. For 30.2% of the cases, a witness identified the physical characteristics of the offender and in 39.2%
of the cases a witness identified the offender. The identification of the victim was provided by a witness for
27.4% of the cases. The location of the offender was discovered for 8.9% of the cases by way of a witness
and a witness identified a vehicle connected with the homicide for 14.2% of the cases.
The police conducted a neighborhood survey in 61.2% of the homicide cases. A neighborhood survey
consists of the police going door to door asking neighbors if they saw or heard anything. In our sample, as
few as 1 officer and as many as 15 officers conducted the survey. However, the average number of officers
who conducted a neighborhood survey was 2. When a neighborhood survey was conducted, 35.3% of
the time the police discovered some form of valuable information.
In addition to conducting a neighborhood survey the police also interviewed family, friends, and
coworkers of the deceased. Family members were interviewed in 54.4% of the cases, friends were
interviewed in 46.4% of the cases, and coworkers were interviewed in 3.9% of the cases. These interviews
provided the circumstances of the death in 7.8% of the cases and the motivation for the death in 7.3% of
the cases. An offender was identified in 7% of the cases and the characteristics of the offender were
provided in 4% of the cases due to these interviews. These interviews also provided the identification of
the victim in 31.7% of the cases, the location of an offender in 1.9% of the cases, and the description of
a vehicle used in the homicide in 2.8% of the cases.
In addition to interviews, the police also conduct a computer check on the decedent; the suspect;
witnesses; and any guns, shell casings, or vehicles involved in the homicide. A computer check for any prior
criminal record was conducted 66.9% of the time for decedents, 64.9% of the time for suspects, and
38.3% of the time for witnesses. A computer check was run on guns 16.9% of the time when a gun was
found. When shell casings were found, a computer check was conducted 22.7% of the time, and when a
25
vehicle was involved, a check was run 46% of the time. These computer checks provided valuable
information to the police in only 15.2% of the cases in our sample.
The police also use confidential informants, other officers, and surveillance in their quest to solve a
case. A confidential informant was used in 12.8% of the cases. They provided valuable information in
65.7% of the cases in which they were used. Other police officers were used in 7.9% of the homicide
cases. When another officer besides the detective assigned to the case provided information, 95.2% of the
time the information proved valuable to the investigation. Surveillance was used in 4.4% of the cases.
Approximately 70% of the time the surveillance was used on a suspect, the suspect’s residence, or possible
locations of the suspect. The surveillance provided valuable information in 71.4% of the cases in which it
was used.
In addition to actively looking for information, the police also accumulate information from witnesses
who come forward on their own. In 31.3% of the homicides, witnesses came forward on their own accord.
When witnesses did come forward, they provided valuable information 87.6% of the time. Valuable
information consists of circumstances of the death, motivation for the homicide, identifying the offender,
providing characteristics of the offender, identifying the victim, identifying a vehicle used in the homicide,
or providing the location of the offender. In 61.2% of the cases in which a witness provided valuable
information, the witness either identified the offender or confirmed the offender’s identity.
The detective assigned to the homicide was present at the postmortem examination in 58.4% of the
cases. Specimens such as blood, hair, fibers, fingernail scrapings, and seminal fluid were collected in 76.3%
of the cases. During the examination, projectiles were recovered in 83% of the cases in which a gun was
used.
After detectives gather information during the initial stages of the investigation, they follow up on that
information. In 91.7% of the cases the detective followed up on information provided by witnesses. The
follow-up provided valuable information in 67% of the cases. In 42.9% of the cases in which detectives
followed up on information, the follow-up led to the identity of a suspect/offender. The location of the
offender was discovered in 18% of the followed-up cases, and the motivation for the death was ascertained
for 5% of the cases as a result of following up on witness information.
26
An arrest warrant was requested and issued for 59.4% of the suspects in our sample. An arrest
warrant was served and the suspect was arrested in 57% of the cases. A suspect was identified but no
warrant was issued for 16.1% of the cases. Of those cases, 50.8% of the suspects were already in custody,
so an arrest warrant was not necessary.
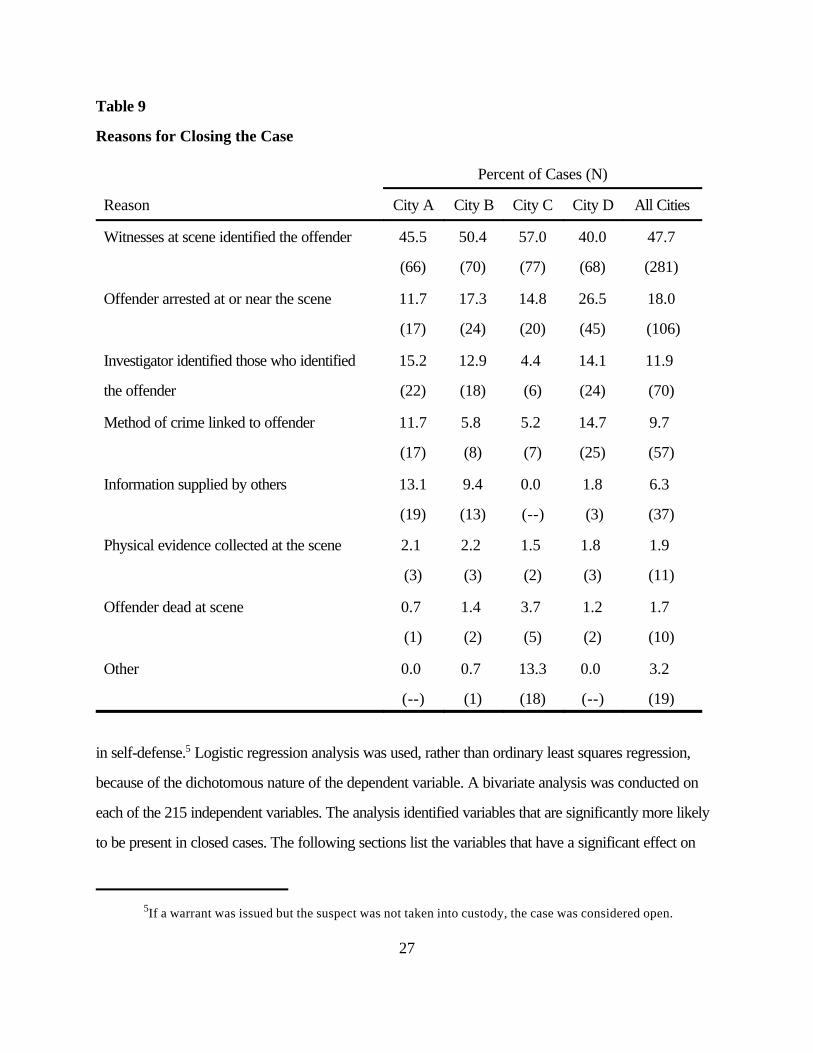
Table 9 lists the most important reasons in closing the case. A witness identifying the offender was the
most prevalent reason in closing a case. In 47.7% of the closed cases a witness identifying the offender was
the most significant reason in closing the case. An offender being arrested at or near the crime scene was
the second most prevalent reason for closing a case. This occurred in 18% of the closed cases. In 11.9%
of the closed cases, the crime was solved by the homicide detective identifying someone who identified the
offender—for example, the police located a witness who left the homicide scene or found a friend/family
member of the decedent who knew why someone would want to harm the decedent.
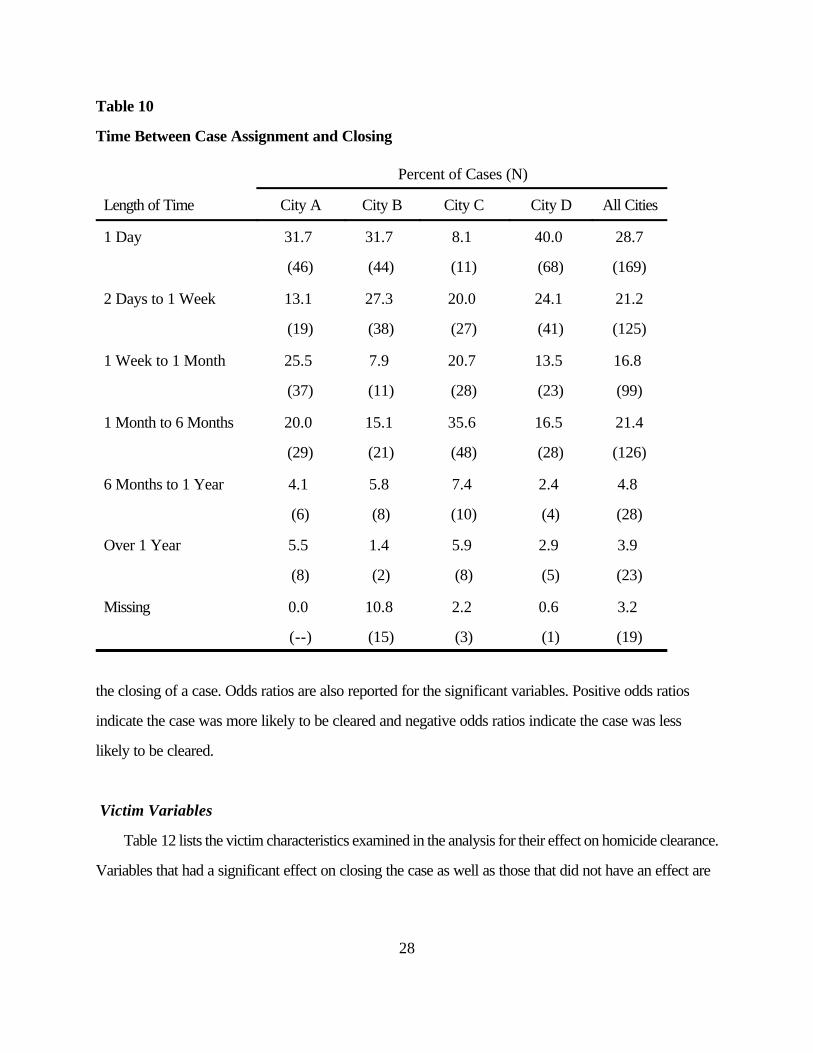
The time between the case being assigned to a detective and its closing is listed in Table 10.
Approximately 50% of the closed cases were solved within a week and 88.1% were solved within 6
months. Only 3.9% of the closed cases took longer than a year to solve.
Table 10 also lists the time it took to solve a case for each city. City C solved the fewest cases in one
day. The other three cities solved 32% to 40% of their homicide cases within 24 hours. City C only solved
8.1% of its cases in the first 24 hours after the homicide. However, City C solved more of its homicide
cases between 1 and 6 months than the other three cities.
Table 11 lists the most important reasons a case was still open. In 17.2% of the open cases, no
physical evidence was found to link a suspect to the homicide. In 10% of the cases, the police were unable
to identify a witness who saw the homicide take place. The majority of the homicide cases were not solved
due to a myriad of reasons.
Variables Associated with Solving a Case
This section identifies the variables associated with closing a case. In all four cities, we considered a
case closed when an arrest was made, the homicide was a murder/suicide situation, or the homicide was
5If a warrant was issued but the suspect was not taken into custody, the case was considered open.
27
Table 9
Reasons for Closing the Case
Percent of Cases (N)
Reason City A City B City C City D All Cities
Witnesses at scene identified the offender 45.5
(66)
50.4
(70)
57.0
(77)
40.0
(68)
47.7
(281)
Offender arrested at or near the scene 11.7
(17)
17.3
(24)
14.8
(20)
26.5
(45)
18.0
(106)
Investigator identified those who identified
the offender
15.2
(22)
12.9
(18)
4.4
(6)
14.1
(24)
11.9
(70)
Method of crime linked to offender 11.7
(17)
5.8
(8)
5.2
(7)
14.7
(25)
9.7
(57)
Information supplied by others 13.1
(19)
9.4
(13)
0.0
(--)
1.8
(3)
6.3
(37)
Physical evidence collected at the scene 2.1
(3)
2.2
(3)
1.5
(2)
1.8
(3)
1.9
(11)
Offender dead at scene 0.7
(1)
1.4
(2)
3.7
(5)
1.2
(2)
1.7
(10)
Other 0.0
(--)
0.7
(1)
13.3
(18)
0.0
(--)
3.2
(19)
in self-defense.5 Logistic regression analysis was used, rather than ordinary least squares regression,
because of the dichotomous nature of the dependent variable. A bivariate analysis was conducted on
each of the 215 independent variables. The analysis identified variables that are significantly more likely
to be present in closed cases. The following sections list the variables that have a significant effect on
28
Table 10
Time Between Case Assignment and Closing
Percent of Cases (N)
Length of Time City A City B City C City D All Cities
1 Day 31.7
(46)
31.7
(44)
8.1
(11)
40.0
(68)
28.7
(169)
2 Days to 1 Week 13.1
(19)
27.3
(38)
20.0
(27)
24.1
(41)
21.2
(125)
1 Week to 1 Month 25.5
(37)
7.9
(11)
20.7
(28)
13.5
(23)
16.8
(99)
1 Month to 6 Months 20.0
(29)
15.1
(21)
35.6
(48)
16.5
(28)
21.4
(126)
6 Months to 1 Year 4.1
(6)
5.8
(8)
7.4
(10)
2.4
(4)
4.8
(28)
Over 1 Year 5.5
(8)
1.4
(2)
5.9
(8)
2.9
(5)
3.9
(23)
Missing 0.0
(--)
10.8
(15)
2.2
(3)
0.6
(1)
3.2
(19)
the closing of a case. Odds ratios are also reported for the significant variables. Positive odds ratios
indicate the case was more likely to be cleared and negative odds ratios indicate the case was less
likely to be cleared.
Victim Variables
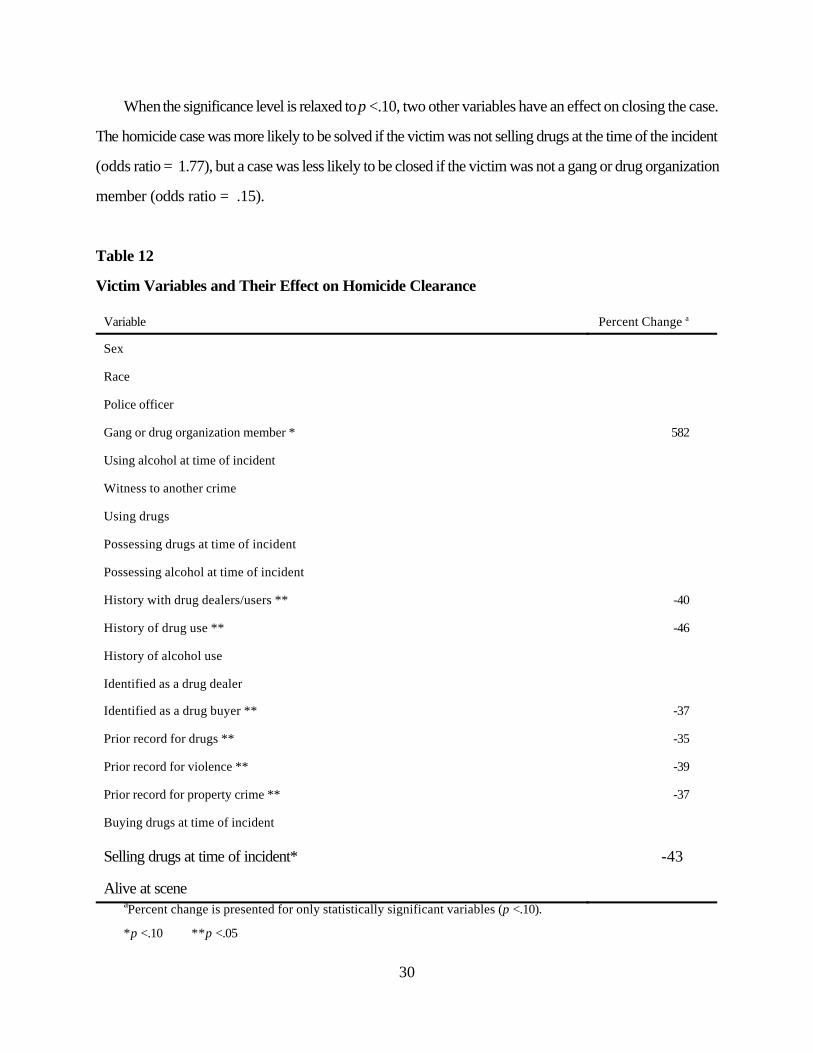
Table 12 lists the victim characteristics examined in the analysis for their effect on homicide clearance.
Variables that had a significant effect on closing the case as well as those that did not have an effect are

29
listed. The sex and race of the victim did not have a significant effect on closing the case. There were six
variables, however, that had a significant (p < .05) effect.
The case was significantly more likely to be solved if the victim had no history of associating with
drug dealers/users (odds ratio = 1.65), had no history of drug use (odds ratio = 1.85), or was not a
drug buyer (odds ratio = 1.58). Additionally, the case was significantly more likely to be closed if the
victim had no prior record for drugs (odds ratio = 1.53), violent crime (odds ratio = 1.63), or
property crime (odds ratio = 1.58).
Table 11
Reasons for Not Closing the Case
Percent of Cases (N)
Reason City A City B City C City D All Cities
Absence of physical evidence 30.9
(17)
4.9
(3)
22.2
(14)
6.7
(2)
17.2
(36)
Witness not identified 12.7
(7)
8.2
(5)
12.7
(8)
3.3
(1)
10.0
(21)
Witness intimidated/refused to cooperate 10.9
(6)
8.2
(5)
4.8
(3)
3.3
(1)
7.7
(16)
Unable to determine circumstances of death 1.8
(1)
18.0
(11)
1.6
(1)
3.3
(1)
6.7
(14)
Unable to identify the victim 1.8
(1)
0.0
(--)
1.6
(1)
0.0
(--)
1.0
(2)
Other 41.8
(23)
55.7
(34)
52.4
(33)
80.0
(24)
54.5
(118)
Missing 0.0
(--)
4.9
(3)
4.8
(3)
3.3
(1)
3.3
(7)
30
When the significance level is relaxed to p <.10, two other variables have an effect on closing the case.
The homicide case was more likely to be solved if the victim was not selling drugs at the time of the incident
(odds ratio = 1.77), but a case was less likely to be closed if the victim was not a gang or drug organization
member (odds ratio = .15).
Table 12
Victim Variables and Their Effect on Homicide Clearance
Variable Percent Change a
Sex
Race
Police officer
Gang or drug organization member * 582
Using alcohol at time of incident
Witness to another crime
Using drugs
Possessing drugs at time of incident
Possessing alcohol at time of incident
History with drug dealers/users ** -40
History of drug use ** -46
History of alcohol use
Identified as a drug dealer
Identified as a drug buyer ** -37
Prior record for drugs ** -35
Prior record for violence ** -39
Prior record for property crime ** -37
Buying drugs at time of incident
Selling drugs at time of incident* -43
Alive at sceneaPercent change is presented for only statistically significant variables (p <.10).
*p <.10 **p <.05
31
Offender Variables
Table 13 lists offender characteristics associated with closing a case. Table 13 shows two offender
variables had a significant effect on closing the case at the p <.05 level and three variables had an effect at
the p <.10 level. The two variables are race and whether the offender was a drug buyer. The case was less
likely to be solved if the offender was Black compared to the offender being Hispanic (odds ratio =
.4428). The case was more likely to close if the offender was not identified as a drug buyer (odds ratio =
2.33).
The three variables at the p <.10 level are sex, race, and prior record for property crime. A case was
less likely to be solved if the offender was a male (odds ratio = .15) and if the offender was White rather
than Hispanic (odds ratio = .38). Additionally, if the offender had a prior record for a property offense, the
case was less likely to be solved (odds ratio = .51).
There was no significant difference between Black and White offenders in solving a case.
Weapon Variables
Variables related to the use of a weapon and closing a case are listed in Table 14. Eight variables had
a significant effect on closing a case at the p <.05 level.
A case was more likely to be closed if the primary cause of death resulted from the use of a rifle (odds
ratio = 3.31), knife (odds ratio = 2.14), or personal weapon (odds ratio = 5.52) compared to a handgun.
However, the case was less likely to close if the primary cause of death was from an unidentified weapon
(odds ratio = .13) or an “other gun” (odds ratio = .07) compared to a handgun. (“Other gun” refers to
a gun other than a handgun, rifle, or shotgun; e.g., an assault rifle such as an AK-47.) Additionally, a case
was more likely to be solved when an “other gun” was not used compared to being used (odds ratio =
5.82).
If a weapon was not identified or suggested in the police report, the case was less likely to be solved
(odds ratio = .32). Additionally, if the decedent was not in possession of a weapon at the time of death,
the case was less likely to be solved (odds ratio = .52).
32
When the significance level is relaxed to p <.10, one additional variable has an effect on solving a case.
A case was less likely to close if personal weapons (hands and feet) were not used in the homicide (odds
ratio = .54).
Drug Variables
Table 15 lists drug variables and their effect on solving a case. Two drug variables, one at the
p <.05 level and one at the p <.10 level, had a significant effect on closing a case. If drugs were not
a circumstance in the homicide, the case was significantly (p <.05) more likely to be solved (odds ratio =
2.17). Additionally, the homicide was more likely to be solved if the incident did involve an effort to obtain
money to buy drugs (odds ratio = 3.56).
General Circumstances
Table 16 lists five variables that had a significant (p <.05) effect on solving the case. If the police did
not identify the homicide as drug related, the case was more likely to be solved (odds ratio = 2.17). If the
homicide occurred in a private location, the case was more likely to be solved (odds ratio = 2.71). If the
weather during the investigation was not “bad” (too hot, too cold, raining, or snowing), the case was more
likely to close (odds ratio = 1.84). The case was more likely to be solved if the crime scene was not
identified as a drug market area (odds ratio = 1.49), and the case was more likely to be solved if there was
at least one witness (odds ratio = 1.85).
Motivation and Other Circumstances
Table 17 lists motivations for the homicide that had a significant effect on closing the case. Four
motivations had a significant effect at the p <.05 level. If the homicide involved preemption for an
anticipated retaliatory attack, the case was more likely to be solved (odds ratio = 4.54). If the homicide
involved punishment for informing, the case was less likely to close (odds ratio = .17). The case was more
likely to be solved if the homicide involved a conflict over money/property other than drugs (odds ratio =
2.55). If the offender was defending himself or herself, the case was more likely to be solved (odds ratio
= 3.88).
33
When we relax the significance level to p <.10, two additional motivation variables become significant.
If the victim was a bystander killed inadvertently by the offender, the case was more likely to be solved.
Additionally, the case was more likely to be solved if the homicide involved an attempt to get money to buy
drugs.
Detective Variables
Table 18 lists detective variables that have a significant effect on the closing of a case. The number of
detectives assigned to a case has a significant (p <.10) effect on closing a case. A case was more likely to
be solved if 3 (odds ratio = 2.21), 4 (odds ratio = 3.10), or 11 (odds ratio = 2.05) detectives were
assigned to the case compared to just 1 detective. However, a case was less likely to close if 7 (odds ratio
= .04) or 8 (odds ratio = .04) detectives were assigned to the case compared to 1 detective.
The amount of time it took the detective(s) assigned to the case to arrive on the scene after they were
notified had a significant (p <.05) effect on the closing of the case. The case was less likely to be solved
if it took the detectives 30 to 60 minutes (odds ratio = .38) or 60 to 120 minutes (odds ratio = .47)
compared to the detectives arriving within 30 minutes.
If a detective followed up on witness information, the case was more likely to be solved (odds ratio
= 2.17). Additionally, if the follow-up proved valuable, the case was more likely to be solved (odds ratio
= 17.31).
Crime Scene Variables
Crime scene variables significant to solving the case are listed in Table 19. The homicide was less likely
to be solved if the first officer on the scene did not notify the homicide unit (odds ratio = .44), the medical
examiner (odds ratio = .43), or crime lab (odds ratio = .41). Additionally, the case was less likely to be
solved if the first officer on the scene did not attempt to locate witnesses (odds ratio = .41).

34
Table 13
Offender Variables and Their Effect on Homicide Clearance
Variable Percent Changea
Sex (male) * -85
Race
White v. Hispanic * 166
Black v. Hispanic ** -56
White v. Black
Police officer
Victim and offender strangers
Victim and offender members of the same family
Victim and offender related by blood
Victim and offender related by marriage
Romantic relationship between victim and offender
Victim and offender friends
Victim and offender live in same household
Victim and offender communicated frequently
Gang or drug organization member
Drinking alcohol at time of incident
Using drugs at time of incident
Possessing drugs at time of incident
Possessing alcohol at time of incident
History with drug dealers/users
History of drug abuse
History of alcohol abuse
Identified as a drug dealer
Identified as a drug buyer ** -57
Prior record for drug crime
Prior record for violent crime
Prior record for property crime * -49
Buying drugs at time of incident
Selling drugs at time of incident
Killed at sceneaPercent change is presented for only statistically significant variables (p <.10).
*p <.10 **p <.05
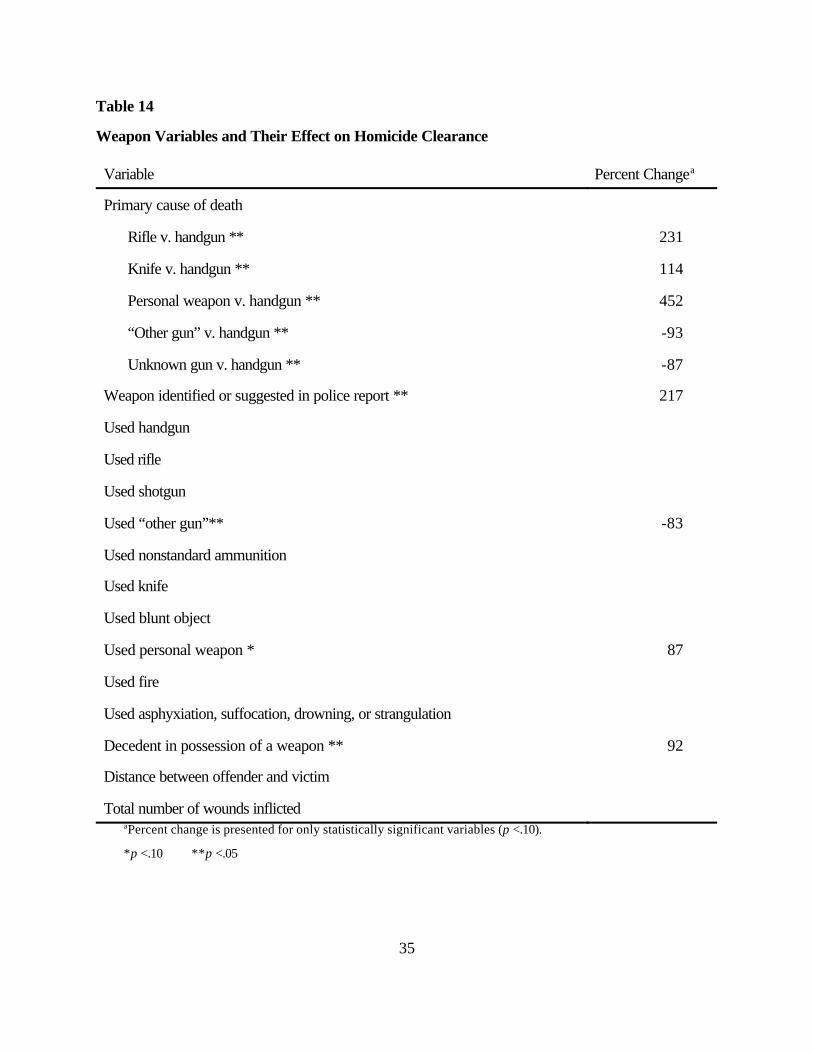
35
Table 14
Weapon Variables and Their Effect on Homicide Clearance
Variable Percent Changea
Primary cause of death
Rifle v. handgun ** 231
Knife v. handgun ** 114
Personal weapon v. handgun ** 452
“Other gun” v. handgun ** -93
Unknown gun v. handgun ** -87
Weapon identified or suggested in police report ** 217
Used handgun
Used rifle
Used shotgun
Used “other gun”** -83
Used nonstandard ammunition
Used knife
Used blunt object
Used personal weapon * 87
Used fire
Used asphyxiation, suffocation, drowning, or strangulation
Decedent in possession of a weapon ** 92
Distance between offender and victim
Total number of wounds inflictedaPercent change is presented for only statistically significant variables (p <.10).
*p <.10 **p <.05

36
Table 15
Drug Variables and Their Effect on Homicide Clearance
Variable Percent Changea
Drugs not a circumstance * 117
Incident involved crack
Incident involved powder cocaine
Incident involved alcohol
Incident involved marijuana
Incident involved heroin
Incident involved amphetamines
Incident involved barbiturates
Incident involved PCP
Incident involved hallucinogens
Incident involved other drugs
Conflict over drug territory
Robbery of drug dealer during drug deal
Robbery of drug buyer during drug deal
Violation of normative rules for sale or distribution of drugs
Retaliation for earlier drug theft
Conflict over quality, type, or amount of drugs
Homicide resulted in an attempt to get money to buy drugs * 256
Failure to pay a drug debt
Conflict over drug paraphernalia
Conflict over drug-using etiquetteaPercent change is presented for only statistically significant variables (p <.10).
*p <.10 **p <.05

37
Table 16
General Circumstances Variables and Their Effect on Homicide Clearance
Variable Percent
Changea
Homicide identified as drug related ** -54
Day of week incident occurred
Location (private v. public)** 171
Bad weather during the investigation ** -46
Drugs at scene
Alcohol at scene
Drug paraphernalia at scene
Scene identified as drug market area ** -33
Number of eyewitnesses (at least 1 vs. 0)** 85
Gambling
Sexual assault
Penetration by use or threat of force
Offender unlawfully entered a structure
Homicide occurred in a vehicle
Victim or offender involved in prostitution ** -85
Offender took or attempted to take property
Offender committed or attempted to commit arsonaPercent change is presented for only statistically significant variables (p <.10).
*p<.10 **p<.05
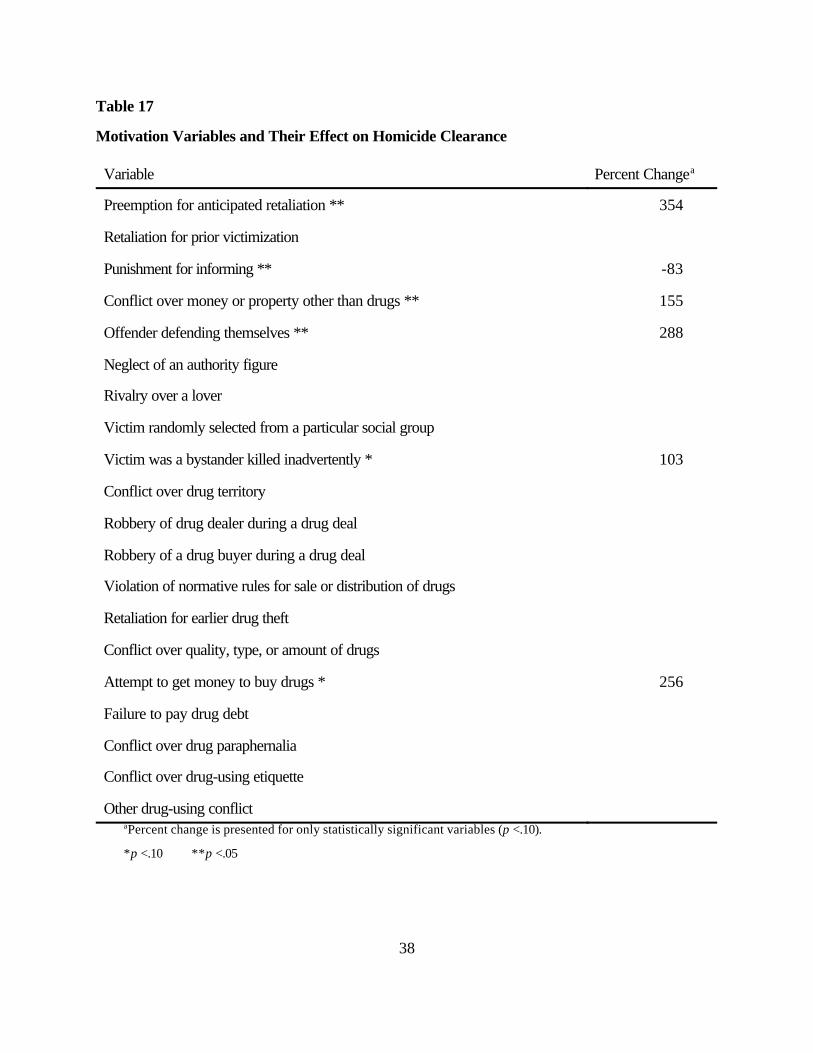
38
Table 17
Motivation Variables and Their Effect on Homicide Clearance
Variable Percent Changea
Preemption for anticipated retaliation ** 354
Retaliation for prior victimization
Punishment for informing ** -83
Conflict over money or property other than drugs ** 155
Offender defending themselves ** 288
Neglect of an authority figure
Rivalry over a lover
Victim randomly selected from a particular social group
Victim was a bystander killed inadvertently * 103
Conflict over drug territory
Robbery of drug dealer during a drug deal
Robbery of a drug buyer during a drug deal
Violation of normative rules for sale or distribution of drugs
Retaliation for earlier drug theft
Conflict over quality, type, or amount of drugs
Attempt to get money to buy drugs * 256
Failure to pay drug debt
Conflict over drug paraphernalia
Conflict over drug-using etiquette
Other drug-using conflictaPercent change is presented for only statistically significant variables (p <.10).
*p <.10 **p <.05

39
Table 18
Detective and Investigative Variables and Their Effect on Homicide Clearance
Variable Percent
Changea
Number of detectives assigned to case
3 v. 1 ** 121
4 v. 1 * 210
7 v. 1 * -96
8 v. 1 * -96
11 v. 1 * 105
Time for detective to arrive on scene
30 to 60 minutes v. <30 minutes ** -62
60 to 120 minutes v. <30 minutes ** -53
Other agencies involved
Detective at scene during initial investigation
Detective described crime scene in notes * 190
Search warrant necessary for scene
Detective followed up on witness information ** 117
Follow-up proved valuable ** 1621
Most important reason in closing the case
Time between assignment of case and closing
Most important reason case not closeda Percent change is presented for only statistically significant variables (p <.10).
*p<.10 **p<.05

40
The homicide was less likely to be solved if the crime scene was not measured (odds ratio = .61). If
a weapon was not found at the scene, the homicide was less likely to be solved (odds ratio = .35). When
the significance level is relaxed to p <.10 one other crime scene variable becomes significant. If the
homicide detective described the crime scene in notes (Table 18), the case was more likely to close (odds
ratio = 2.90).
The crime scene itself also had a significant effect on closing the case. The crime was significantly (p
<.05) more likely to be solved if the crime scene was a residence rather than a public area (odds ratio
= 4.00). If the crime scene was a bar or club, the case was more likely to be solved compared to the scene
being a public area (odds ratio = 4.25). A public area refers to a street or park.
Witness Variables
A case was less likely to be solved when no witnesses were at the crime scene (odds ratio = .39)
(Table 20). However, when witnesses were at the crime scene and they provided valuable information, the
case was more likely to be solved (odds ratio = 4.75). The homicide was significantly more likely to be
solved if a witness provided the circumstances of death (odds ratio = 2.96), the motivation for death (odds
ratio = 2.89), the identification of the offender (odds ratio = 28.11), the identification of the victim (odds
ratio = 1.63), or the location of the offender (odds ratio = 3.92). However, when a witness provided the
characteristics of the offender, the case was significantly less likely to be solved (odds ratio = .37). When
a neighborhood survey provided valuable information, the case was more likely to close (odds ratio =
1.60). When neighbors of the victim were interviewed, the case was more likely to close (odds ratio =
1.66). However, when friends/ acquaintances of the victim were interviewed, the case was less likely to
be solved (odds ratio = .67). When friends, family, coworkers, or neighbors provided valuable information
to the police, the cases was more likely to be solved (odds ratio = 2.63).
Computer Check Variables
When computer checks were conducted on the decedent (odds ratio = .36) or witnesses (odds ratio
= .64), the case was less likely to be solved (Table 21). However, when computer checks were conducted
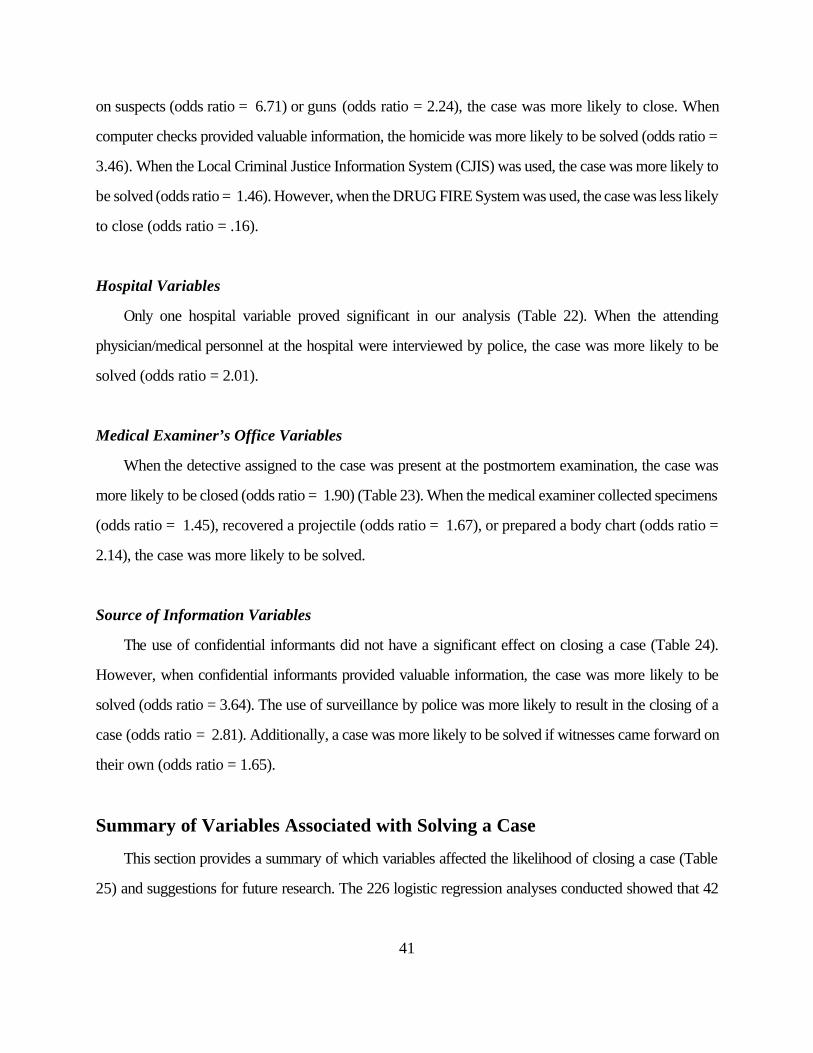
41
on suspects (odds ratio = 6.71) or guns (odds ratio = 2.24), the case was more likely to close. When
computer checks provided valuable information, the homicide was more likely to be solved (odds ratio =
3.46). When the Local Criminal Justice Information System (CJIS) was used, the case was more likely to
be solved (odds ratio = 1.46). However, when the DRUG FIRE System was used, the case was less likely
to close (odds ratio = .16).
Hospital Variables
Only one hospital variable proved significant in our analysis (Table 22). When the attending
physician/medical personnel at the hospital were interviewed by police, the case was more likely to be
solved (odds ratio = 2.01).
Medical Examiner’s Office Variables
When the detective assigned to the case was present at the postmortem examination, the case was
more likely to be closed (odds ratio = 1.90) (Table 23). When the medical examiner collected specimens
(odds ratio = 1.45), recovered a projectile (odds ratio = 1.67), or prepared a body chart (odds ratio =
2.14), the case was more likely to be solved.
Source of Information Variables
The use of confidential informants did not have a significant effect on closing a case (Table 24).
However, when confidential informants provided valuable information, the case was more likely to be
solved (odds ratio = 3.64). The use of surveillance by police was more likely to result in the closing of a
case (odds ratio = 2.81). Additionally, a case was more likely to be solved if witnesses came forward on
their own (odds ratio = 1.65).
Summary of Variables Associated with Solving a Case
This section provides a summary of which variables affected the likelihood of closing a case (Table
25) and suggestions for future research. The 226 logistic regression analyses conducted showed that 42

42
variables had a significant (p <.05) effect on the likelihood of closing a case. When the significance level
is relaxed to p <.10, an additional 9 variables had an effect.
Table 19
Crime Scene Variables and Their Effect on Homicide Clearance
Variable Percent Changea
Crime scene
Bar/club v. Public area (street or park)* 325
Residence v. Public area ** 300
Scene secured by first officer on scene
First officer protected scene
First officer notified the homicide unit ** 127
First officer notified medical examiner’s office ** 134
First officer notified crime lab ** 146
First officer attempted to locate witnesses ** 147
Time between report of homicide and crime scene secured
Evidence technicians at the scene
Length of time evidence technicians were at scene
Number of evidence technicians at scene
Searched for fingerprints/physical evidence
Found fingerprints/physical evidence
Photographed crime scene
Sketched crime scene
Measured crime scene ** 63
Weapon found at crime scene ** 189
Bullets found at crime scene
Shell casings found at crime scene
Fingerprints found at crime scene
Drugs at crime scene
Clothing found at crime scenea Percent change is presented for only statistically significant variables (p <.10).
*p <.10 **p <.05

43
Table 20
Witness Variables and Their Effect on Homicide Clearance
Variable Percent Changea
No witness at crime scene ** -61
Who interviewed witness (first officer on scene or detective)
Time between notification of homicide and witness interviews
Where witnesses were interviewed (crime scene or headquarters)
Length of time witnesses were questioned
Witness at scene provided valuable information ** 375
Circumstances of death ** 196
Motivation for death ** 189
Identification of offender ** 2711
Characteristics of offender ** -63
Identification of victim ** 63
Location of offender ** 292
Identification of vehicle
Homicide captured on surveillance video
Neighborhood survey conducted
Number of officers who conducted the neighborhood survey
Neighborhood survey provided valuable information ** 60
Witness found who was not at crime scene (at least 1 v. 0)* 32
Family members of victim interviewed
Friends/acquaintances of victim interviewed ** -33
Coworkers of victim interviewed
Roommates of victim interviewed
Neighbors of victim interviewed ** 66
Family members, friends, coworkers, roommates, or neighbors provide valuable
information **
63
a Percent change is presented for only statistically significant variables (p <.10).
*p <.10 **p <.05

44
Table 21
Computer Check Variables and Their Effect on Homicide Clearance
Variable Percent Changea
Computer check conducted on decedent ** -64
Computer check conducted on suspect ** 571
Computer check conducted on witness ** -36
Computer check conducted on guns ** 124
Computer check conducted on shell/casings
Computer check conducted on vehicles
Computer check conducted on crime scene
Computer check provided valuable information ** 245
Computer system used
Local Criminal Justice Information System (CJIS) ** 46
State CJIS
National Crime Information Center (NCIC)
Alcohol, Tobacco, and Firearms (ATF)
DRUG FIRE ** -84
Motor Vehicle Administration (MVA)
WARRANTSa Percent change is presented for only statistically significant variables (p <.10).
*p <.10 **p <.05

45
Table 22
Hospital Variables and Their Effect on Homicide Clearance
Variable Percent Changea
Decedent went to the hospital
Decedent’s belongings submitted to evidence control
Attending physician/medical personnel interviewed ** 101
Witnesses found at hospital interviewed
Provided valuable information
Person who transported decedent to hospital interviewed
Provided valuable informationaPercent change is presented for only statistically significant variables (p <.10).
*p <.10 **p <.05
Table 23
Medical Examiner’s Office Variables and Their Effect on Homicide Clearance
Variable Percent Changea
Detective present at postmortem examination ** 90
Specimens collected from decedent ** 45
Projectiles recovered from decedent ** 67
Medical examiner prepared a body chart ** 114aPercent change is presented for only statistically significant variables (p <.10).
*p <.10 **p <.05

46
Table 24
Source of Information Variables and Their Effect on Homicide Clearance
Variable Percent Changea
Confidential informants used
Provided valuable information 264
Other police officers used
Surveillance used 181
Witnesses came forward on their own 65aPercent change is presented for only statistically significant variables (p <.10).
*p <.10 **p <.05
Victim and offender attributes had an effect on the closing of a case. A case was more likely to be
solved if the victim was not a drug user or buyer and had no criminal record. If the offender was Hispanic
rather than Black, the case was more likely to be solved. Additionally, a case was more likely to be closed
if the offender was not identified as a drug buyer.
The type of weapon used in the homicide also had an effect on the status of the case. Cases in which
the victim was killed by the use of a rifle, knife, or personal weapon (hands or feet) were more likely to be
solved than cases in which the victim was killed with a handgun. Furthermore, if the police identified the
weapon used to kill the victim, the case was more likely to be solved.
The presence of drugs in a case had an effect on its closing. Cases in which drugs were a circumstance
were significantly less likely to be closed.
Some general circumstances surrounding a homicide also had an effect on its closing. If the homicide
occurred in a private location, if the weather was not bad, or if the crime scene was not identified as a drug
scene, the case was more likely to be solved.
The motivation for the homicide had an effect on the status of the case. A case was less likely to be
solved if the motivation was “punishment for informing.” Cases in which “preemption for an anticipated
retaliatory attack” was the motive were more likely to be solved. If the homicide involved a conflict not
involving drugs, the case was more likely to be solved.

47
Table 25
Significant Variables and Their Effect on Homicide Clearance
Variable Percent Change
Victim a gang or drug organization member ** 582
White v. Hispanic * 166
Primary cause of death
Rifle v. handgun ** 231
Knife v. handgun ** 114
Personal weapon v. handgun ** 452
Weapon identified or suggested in police report ** 217
Decedent in possession of a weapon ** 92
Drugs not a circumstance * 117
Location (private v. public)** 171
Number of eyewitnesses (at least 1 vs. 0)** 85
Preemption for anticipated retaliation ** 354
Conflict over money or property other than drugs ** 155
Offender defending themselves ** 288
Victim was a bystander killed inadvertently * 103
Attempt to get money to buy drugs * 256
Number of detectives assigned to case
3 v. 1 ** 121
4 v. 1 * 210
11 v. 1 * 105
Time for detective to arrive on scene
30 to 60 minutes v. <30 minutes ** -62
Detective described crime scene in notes * 190
Detective followed up on witness information ** 117

48
Warrant requested for a suspect ** 4230
Crime scene
Bar/club v. public area (street or park)* 325
Residence v. public area ** 300
First officer notified the homicide unit ** 127
First officer notified medical examiner’s office ** 134
First officer notified crime lab ** 146
First officer attempted to locate witnesses ** 147
Measured crime scene ** 63
Weapon found at crime scene ** 189
Witness at scene provided valuable information ** 375
Circumstances of death ** 196
Motivation for death ** 189
Identification of offender ** 2711
Identification of victim ** 63
Location of offender ** 292
Neighborhood survey provided valuable information ** 60
Witness found who was not at crime scene (at least 1 v. 0)* 32
Neighbors of victim interviewed ** 66
Family members, friends, coworkers, roommates, or neighbors provide valuable
information **
163
Computer check conducted on suspect ** 571
Computer check conducted on guns ** 124
Computer check provided valuable information ** 245
Computer system used
Local Criminal Justice Information System (CJIS) ** 46
Attending physician/medical personnel interviewed ** 101

49
Detective present at postmortem examination ** 90
Specimens collected from decedent ** 45
Projectiles recovered from decedent ** 67
Medical examiner prepared a body chart ** 114
Confidential informants provided valuable information ** 264
Surveillance used ** 181
Witnesses came forward on their own ** 65*p<.10 **p<.05
The number of detectives assigned to a case and their actions had an effect on the closing of a case.
A case was more likely to be solved if 3, 4, or 11 detectives were assigned to it as opposed to just 1
detective. City D, which has a high homicide clearance rate, was the only department to use 11 homicide
detectives on a case. They used 11 detectives in 63% of the 200 cases in our sample. Cases in which 7
or 8 detectives were assigned were significantly less likely to be solved compared to cases in which 1
detective was assigned. Additionally, City D was the only city to assign 7 or 8 detectives to a case.
The amount of time it took detectives to arrive on the homicide scene also had an effect on closing the
case. When the homicide detective arrived on the scene within 30 minutes, the case was more likely to be
solved than when the detective took longer than 30 minutes to arrive on the scene. A case was also more
likely to be solved when detectives followed up on witness information.
Some crime scene variables affected the closure of a case. When the first officer on the scene
attempted to locate witnesses and notified the homicide unit, the medical examiner’s office, or the crime
lab, the homicide was more likely to be solved. Cases in which the homicide weapon was present at the
crime scene were more likely to be solved. And when a crime scene was measured, the closure rate was
higher than when a crime scene was not measured.
The presence of a witness at the crime scene increased the likelihood of solving the case. If the witness
provided valuable information, the likelihood of solving the case increased. Additionally, when a
neighborhood survey of the crime scene provided valuable information or the neighbors of the victim were
interviewed, the crime was more likely to be solved. However, when friends of the victim were interviewed,
the crime was less likely to be solved.
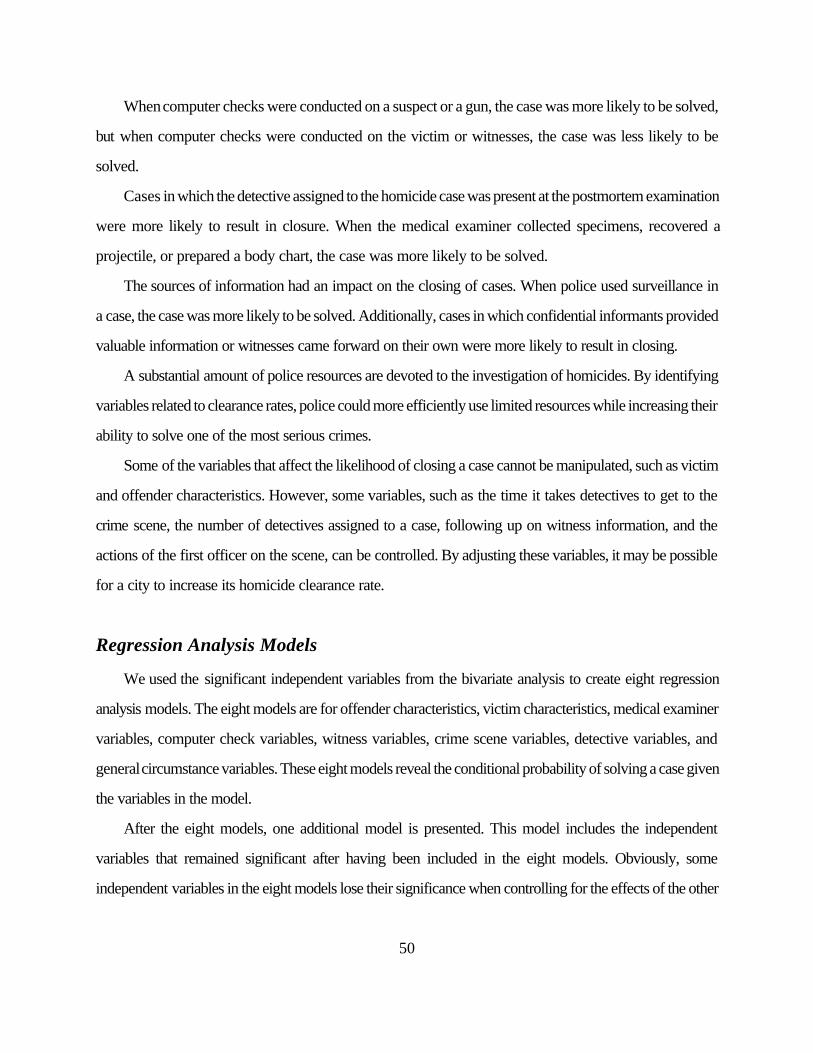
50
When computer checks were conducted on a suspect or a gun, the case was more likely to be solved,
but when computer checks were conducted on the victim or witnesses, the case was less likely to be
solved.
Cases in which the detective assigned to the homicide case was present at the postmortem examination
were more likely to result in closure. When the medical examiner collected specimens, recovered a
projectile, or prepared a body chart, the case was more likely to be solved.
The sources of information had an impact on the closing of cases. When police used surveillance in
a case, the case was more likely to be solved. Additionally, cases in which confidential informants provided
valuable information or witnesses came forward on their own were more likely to result in closing.
A substantial amount of police resources are devoted to the investigation of homicides. By identifying
variables related to clearance rates, police could more efficiently use limited resources while increasing their
ability to solve one of the most serious crimes.
Some of the variables that affect the likelihood of closing a case cannot be manipulated, such as victim
and offender characteristics. However, some variables, such as the time it takes detectives to get to the
crime scene, the number of detectives assigned to a case, following up on witness information, and the
actions of the first officer on the scene, can be controlled. By adjusting these variables, it may be possible
for a city to increase its homicide clearance rate.
Regression Analysis Models
We used the significant independent variables from the bivariate analysis to create eight regression
analysis models. The eight models are for offender characteristics, victim characteristics, medical examiner
variables, computer check variables, witness variables, crime scene variables, detective variables, and
general circumstance variables. These eight models reveal the conditional probability of solving a case given
the variables in the model.
After the eight models, one additional model is presented. This model includes the independent
variables that remained significant after having been included in the eight models. Obviously, some
independent variables in the eight models lose their significance when controlling for the effects of the other

6Conditional probabilities (p-hat) were calculated using the following formula from Logit ModelingPractical Applications by Alfred Demaris:
p-hat = e(Bo+X1B1+X2B2.....XnBn)/1+e(Bo+X1B1+X2B2.....XnBn)
51
independent variables in the model. For example, being a male offender had a significant effect on closing
a homicide case in the bivariate analysis, but when placed in a model with three other independent variables
that describe offender characteristics, it loses its significance.
Before we begin discussing the models, the reader should keep in mind that 74% of the cases in our
sample have been solved. Therefore, a model with a conditional probability greater than the base rate of
74% would indicate an increase in the likelihood of solving a case. Conversely, a conditional probability
lower than the base rate of 74% would indicate a decrease in the likelihood of solving a case.6
The first of the eight models is the offender characteristics model (Table 26). This model consists of
four variables: offender is a male, offender identified as a drug buyer, offender arrested for prior property
offense, and offender’s race. This model actually consists of three models since being African American,
Hispanic, or White had different effects on a case being solved. In this model, when an offender is African
American, there is a 90% chance the police will solve the case, an increase over the base rate of 74%.
When the offender is Hispanic, there is a 63% chance the case will be closed, a decrease compared to the
base rate. When the offender is White, there is a 78% chance of closing the case, a rate close to the base
rate in our sample. Additionally, being African American or being Hispanic were statistically significant at
the p <.05 level.
The second model we looked at was the victim characteristics model (Table 27). This model consists
of eight variables: victim was a gang or drug organization member, victim had a history with drug
dealers/users, victim had a history of drug use, victim identified as a drug buyer, victim had a prior record
for drugs, victim had a prior record for violence, victim had a prior record for property offense, and victim
was selling drugs at the time of the homicide. When all these variables were present, there was a 63%
chance the case would be solved. This is lower than the base rate of 74% for our sample. Only one variable
remained statistically significant (p < .10): victim had a history of drug use
The third model consisted of medical examiner variables (Table 28). The four variables were detective
present at postmortem examination, specimens collected (i.e., blood, hair, fiber), projectile recovered, and

52
body chart of the victim prepared. The only variable that remained statistically significant (p <.05) was body
chart of the victim prepared. When these four variables were present, there was a 90% chance of solving
the case. This model represented an improvement over the base rate of 74%.
The fourth model consisted of computer checks conducted during the investigation (Table 29). The
six variables in this model were computer check conducted on the decedent, computer check conducted
on the suspect, computer check conducted on witnesses, computer check conducted on guns, DRUG
FIRE system used, and the local Criminal Justice Information System (CJIS) used. All these variables
remained statistically significant (p <.05) when placed in the model except DRUG FIRE system used.
When these six variables were present, there was an 87% chance the case would be solved, an
improvement compared to the base rate of 74% in our sample.
The fifth model consisted of five witness variables (Table 30). The variables were: witness at scene
interviewed, witness provided valuable information, witnesses found who were not at the scene,
friends/acquaintances interviewed, and neighbors interviewed. Three of the variables were statistically
significant (p<.05) when placed in this model. They were: witness provided valuable information,
friends/acquaintances interviewed, and neighbors interviewed. There was a 95% chance of solving a case
with these five variables present, an improvement over the base rate of 74%.
Table 26
Effects of Offender Characteristics on Homicide Clearance
Variable Percent Changea
Offender male
Offender identified as a drug buyer
Offender arrested for prior property offense
Offender African American** 117
Chance of solving the case 90

53
Effects of Offender Characteristics on Homicide Clearance
Variable Percent Change
Offender male
Offender identified as a drug buyer
Offender arrested for prior property offense
Offender Hispanic** -62
Chance of solving the case 63
Effects of Offender Characteristics on Homicide Clearance
Variable Percent Change
Offender male
Offender identified as a drug buyer
Offender arrested for prior property offense
Offender White
Chance of solving the case 78aPercent change is presented for only statistically significant variables (p <.10).
*p <.10 **p <.05
The sixth model involved crime scene variables (Table 31). The five variables in this model were: first
officer on the scene notified the homicide unit, notified the medic, notified the crime lab, and attempted to
locate witnesses; and the crime scene was measured. The actions of the first officer on the scene were
important because the sooner the homicide unit, the medic, and the crime lab arrive on the scene, the
sooner the investigation can begin. Additionally, by attempting to locate witnesses, the first officer can help
the homicide detective begin the investigation. When these five variables were present, there was an 88%
chance of solving the case. This is an increase over the base rate of 74% in our sample. Only one variable
remained statistically significant at the p <.10 level: first officer on scene attempted to locate witnesses.

54
Table 27
Effects of Victim Characteristics on Homicide Clearance
Variable Percent Changea
Victim a gang or drug organization member
Victim had a history with drug dealers/users
Victim had a history of drug use * -40
Victim identified as a drug buyer
Victim had prior record for drugs
Victim had prior record for violence
Victim had prior record for property offense
Victim selling drugs at time of homicide
Chance of solving the case 63aPercent change is presented for only statistically significant variables (p <.10).
*p <.10 **p <.05
Table 28
Effects of Medical Examiner Factors on Homicide Clearance
Variable Percent Changea
Detective present at postmortem examination
Specimens collected during postmortem (blood, hair, fiber)
Projectile recovered during postmortem
Body chart of victim prepared ** 97
Chance of solving the case 90aPercent change is presented for only statistically significant variables (p <.10).
*p <.10 **p <.05

55
Table 29
Effects of Computer Checks on Homicide Clearance
Variable Percent Changea
Computer check on decedent ** -63
Computer check on suspect ** 1384
Computer check on witnesses ** -61
Computer check on guns ** 212
Used DRUG FIRE system
Used local Criminal Justice Information System (CJIS) ** 92
Chance of solving the case 87aPercent change is presented for only statistically significant variables (p <.10).
*p <.10 **p <.05
These variables are within the control of the police. Therefore, we looked at the effects of removing
each variable from the model. By removing any one variable from the model, the chance of solving the case
fluctuates between 86% and 89%. Therefore, if only four out of the five variables in model six are present,
there was at least a 86% chance of solving the case.
The seventh model examined consisted of detective variables (Table 32). The four variables in this
model were: three or more detectives assigned to the case, detective arrived at the scene within 30 minutes
of being notified of the homicide, detective described the crime scene in notes, and the detective followed
up on all witness information. By having three or more detectives on the case, detectives will have more
time to investigate the case more thoroughly. The sooner the detective arrives on the scene, the less likely
the crime scene will be contaminated. When detectives describe the crime scene in their notes, this could
indicate they paid more attention to the details of the scene. And by following up on all witness information,
the detectives are more likely to find additional information that would lead to closing the case. When these
four variables were present in a case, there was a 96% chance of solving a case, a large increase over the
base rate of 74%. Three variables were statistically significant: three or more detectives assigned to the case
(p < .05), detectives described the scene in their notes (p <.10), and detective followed up on all witness
information (p <.10).

56
Table 30
Effects of Witness Variables on Homicide Clearance
Variable Percent Changea
Witness at scene interviewed
Witness provided valuable information ** 359
Witnesses found who were not at the scene
Friends/acquaintances interviewed ** -41
Neighbors interviewed ** 83
Chance of solving the case 95aPercent change is presented for only statistically significant variables (p <.10).
*p <.10 **p <.05
Table 31
Effects of Crime Scene Variables on Homicide Clearance
Variable Percent Changea
First officer on scene notified the homicide unit
First officer on scene notified the medic
First officer on scene notified the crime lab
First officer on scene attempted to locate witnesses * 83
Crime scene was measured
Chance of solving the case 88aPercent change is presented for only statistically significant variables (p <.10).
*p <.10 **p <.05

57
Table 32
Effects of Detective Variables on Homicide Clearance
Variable Percent Changea
Three or more detectives assigned to the case ** 105
Detective arrived at the scene within 30 minutes
Detective described the scene in notes * 393
Detective followed up on all witness information * 70
Chance of solving the case 96a Percent change is presented for only statistically significant variables (p <.10).
*p <.10 **p <.05
Since these four variables can be controlled by the police, we looked at the effects each variable had
on the model. In removing any one variable from the model, there was still a 92% to 96% chance of solving
the case. Therefore, if any three variables in model seven are present in a case, there is at least a 92%
chance of solving the case.
The eighth model examined consisted of general circumstances surrounding the homicide (Table 33).
The three variables in this model were: homicide occurred in a private residence, there was an eyewitness
to the homicide, and the homicide was not drug related. All three variables remained statistically significant
(p <.05) when placed in this model. When a case involved these three variables, there was a 98% chance
the case would be solved, an improvement over the base rate of 74%.
Table 33
Effects of General Circumstances on Homicide Clearance
Variable Percent Changea
Homicide occurred in a private residence ** 215
Eyewitness to the homicide ** 111
Homicide was not drug related ** 118
Chance of solving the case 98a Percent change is presented for only statistically significant variables (p <.10).
*p <.10 **p <.05
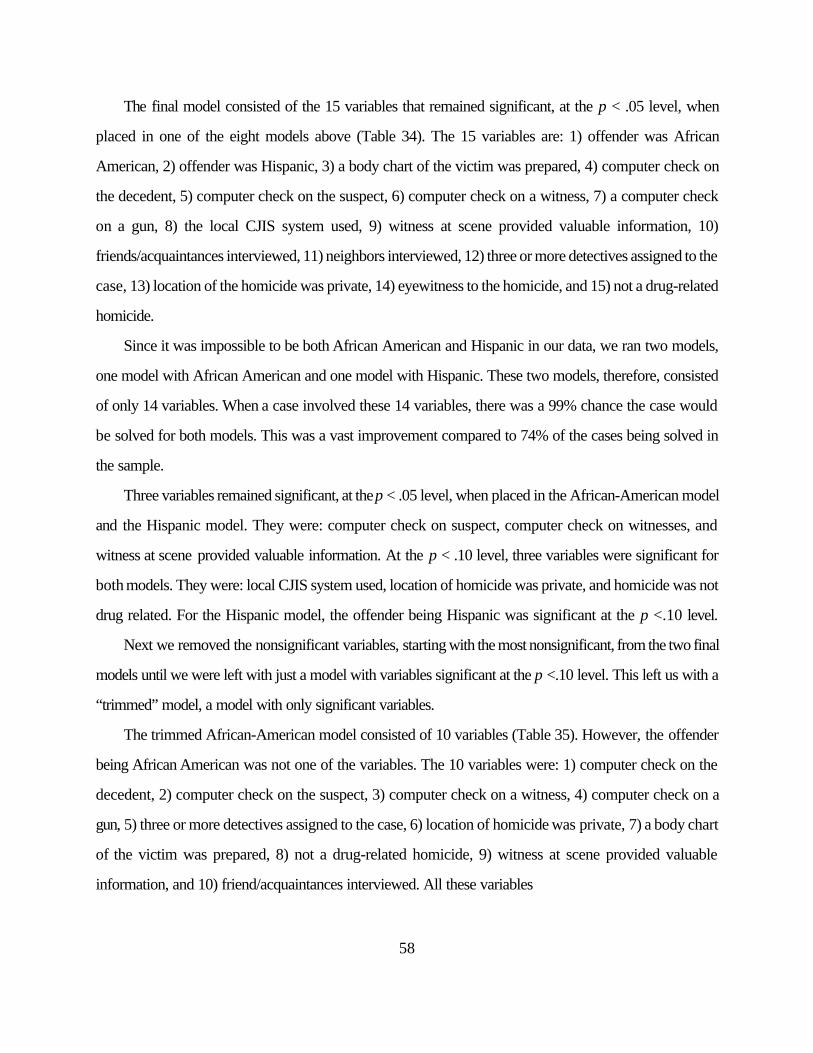
58
The final model consisted of the 15 variables that remained significant, at the p < .05 level, when
placed in one of the eight models above (Table 34). The 15 variables are: 1) offender was African
American, 2) offender was Hispanic, 3) a body chart of the victim was prepared, 4) computer check on
the decedent, 5) computer check on the suspect, 6) computer check on a witness, 7) a computer check
on a gun, 8) the local CJIS system used, 9) witness at scene provided valuable information, 10)
friends/acquaintances interviewed, 11) neighbors interviewed, 12) three or more detectives assigned to the
case, 13) location of the homicide was private, 14) eyewitness to the homicide, and 15) not a drug-related
homicide.
Since it was impossible to be both African American and Hispanic in our data, we ran two models,
one model with African American and one model with Hispanic. These two models, therefore, consisted
of only 14 variables. When a case involved these 14 variables, there was a 99% chance the case would
be solved for both models. This was a vast improvement compared to 74% of the cases being solved in
the sample.
Three variables remained significant, at the p < .05 level, when placed in the African-American model
and the Hispanic model. They were: computer check on suspect, computer check on witnesses, and
witness at scene provided valuable information. At the p < .10 level, three variables were significant for
both models. They were: local CJIS system used, location of homicide was private, and homicide was not
drug related. For the Hispanic model, the offender being Hispanic was significant at the p <.10 level.
Next we removed the nonsignificant variables, starting with the most nonsignificant, from the two final
models until we were left with just a model with variables significant at the p <.10 level. This left us with a
“trimmed” model, a model with only significant variables.
The trimmed African-American model consisted of 10 variables (Table 35). However, the offender
being African American was not one of the variables. The 10 variables were: 1) computer check on the
decedent, 2) computer check on the suspect, 3) computer check on a witness, 4) computer check on a
gun, 5) three or more detectives assigned to the case, 6) location of homicide was private, 7) a body chart
of the victim was prepared, 8) not a drug-related homicide, 9) witness at scene provided valuable
information, and 10) friend/acquaintances interviewed. All these variables

59
Table 34
Effects of Significant Variables from Models 1 through 8 on Homicide Clearance
Variable Percent Changea
Offender African American
Body chart of victim prepared
Computer check on decedent
Computer check on suspect ** 428
Computer check on witnesses ** -55
Computer check on guns
Used local Criminal Justice Information System (CJIS) * 122
Witness provided valuable information ** 267
Friends/acquaintances interviewed
Neighbors interviewed
Three or more detectives assigned to the case
Homicide occurred in a private residence * 120
Eyewitness to the homicide
Homicide was not drug related * 93
Chance of solving the case 99aPercent change is presented for only statistically significant variables (p <.10).
*p <.10 **p <.05
were significant at the p <.05 level except location of homicide was private, computer check on a gun, and
friends/acquaintances interviewed. Those three variables were significant at the p <.10 level. When a case
consisted of all 10 variables, there was a 99% chance the case would be solved.The Hispanic trimmed
model consisted of nine variables (Table 36). The variables were: 1) computer check on the decedent, 2)
computer check on the suspect, 3) computer check on a witness, 4) used local CJIS system, 5) location
of homicide was private, 6) a body chart of the victim was prepared, 7) not a drug-related homicide, 8)

60
Effects of Significant Variables from Models 1 through 8 on Homicide Clearance
Variable Percent Changea
Offender Hispanic * -58
Body chart of victim prepared
Computer check on decedent
Computer check on suspect ** 429
Computer check on witnesses ** -54
Computer check on guns
Used local CJIS system * 135
Witness provided valuable information ** 267
Friends/acquaintances interviewed
Neighbors interviewed
Three or more detectives assigned to the case
Homicide occurred in a private residence * 114
Eyewitness to the homicide
Homicide was not drug related * 103
Chance of solving the case 99aPercent change is presented for only statistically significant variables (p <.10).
*p <.10 **p <.05
offender was Hispanic, and 9) witness at scene provided valuable information. All of these variables were
significant at the p <.05 level except for offender was Hispanic, which was significant at the p <.10 level.
When a case consisted of these nine variables, there was a 98% chance the case would be solved.
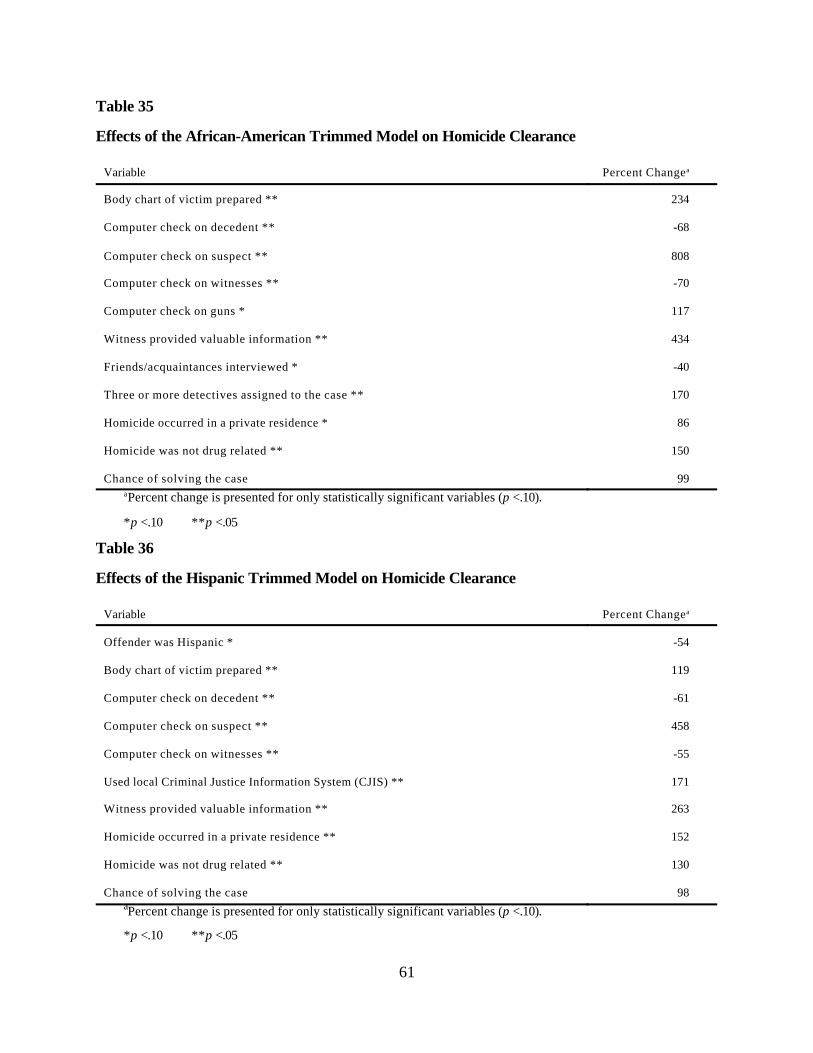
61
Table 35
Effects of the African-American Trimmed Model on Homicide Clearance
Variable Percent Changea
Body chart of victim prepared ** 234
Computer check on decedent ** -68
Computer check on suspect ** 808
Computer check on witnesses ** -70
Computer check on guns * 117
Witness provided valuable information ** 434
Friends/acquaintances interviewed * -40
Three or more detectives assigned to the case ** 170
Homicide occurred in a private residence * 86
Homicide was not drug related ** 150
Chance of solving the case 99aPercent change is presented for only statistically significant variables (p <.10).
*p <.10 **p <.05
Table 36
Effects of the Hispanic Trimmed Model on Homicide Clearance
Variable Percent Changea
Offender was Hispanic * -54
Body chart of victim prepared ** 119
Computer check on decedent ** -61
Computer check on suspect ** 458
Computer check on witnesses ** -55
Used local Criminal Justice Information System (CJIS) ** 171
Witness provided valuable information ** 263
Homicide occurred in a private residence ** 152
Homicide was not drug related ** 130
Chance of solving the case 98aPercent change is presented for only statistically significant variables (p <.10).
*p <.10 **p <.05

62
Conclusions
We began this research to develop a better understanding than currently exists of the variables that are
associated with the clearance of homicide cases. Previous literature suggested that two variables related
to clearance were the level of drug-related homicides and the size of police departments. Drug-related
homicides were thought to be associated with clearance rates because they frequently lack the close
relationship between victim and offender that facilitate clearance. Levels of policing were thought to be
associated because they indicate the level of resources that could be devoted to homicide clearance. Our
analysis of the 100 largest cities in the United States for the year 1993 suggested very modest associations
between clearance levels and these variables. For drug-related homicides, we correlated the portion of
homicides that were judged to be drug related with clearance rates in these cities and found the zero-order
explained variation to be approximately 12%. The relationship between clearance and rate of police per
index crime was even less (explained variation equals 3%). While drug-related homicides and overall
policing levels may have some correlation with clearance, these relationships appear to be modest at best,
and, more importantly, provide little policy guidance for law enforcement agencies as to how they should
organize to improve clearance.
As we noted at the beginning of this paper, the clearance for homicides (and for all crimes) is
fundamentally important for one of the underlying paradigms for law enforcement, deterrence.
For that reason, we have focused on a more detailed consideration of homicide events and investigative
practices to help us understand clearance. We identified approximately 250 characteristics of homicide
events and investigative practices and determined that approximately 51 of those were statistically
significant and positively associated with clearance. Of these 51, 37 were characteristics associated with
police practices, with the remainder being characteristics associated with the homicide event. While we did
find that drug-related homicides were more difficult to clear, it is our conclusion that there are substantial
variations in homicide clearances associated with police practices. Furthermore, although we selected our
sample of cities to maximize variation in the clearance of homicides and total index crimes, we found that
these differences between cities for homicide clearances disappeared for the most part when we controlled

63
for characteristics of cases and characteristics of investigations. Only one of the cities, the one with the
consistently highest level of clearance for homicides, appeared to have a level of clearance that was not
explained by these characteristics of events and investigations. We will comment on this later.
In considering the implications we think this research has for law enforcement, we would point
especially to the following observations. It appears that what happens at the crime scene by the initially
responding officer(s) is important. The speed with which homicide detectives, evidence technicians, and
medical examiners are notified and the time it takes them to respond to the scene are associated with
clearance. The activities of the first responding officers to secure the scene, to identify potential witnesses,
to preserve evidence, to initiate, when appropriate, neighborhood surveys, and to participate in
neighborhood surveys appears critical. We find that the assignment of 3 or 4 detectives is optimal for
clearing a case, but that increasing that number is not efficient until one reaches very large numbers of
detectives (i.e., 11 or more). In the city that continued to have a significant city effect on homicide clearance
after all other characteristics of the case and of the investigation were controlled (Table 37), the practice
of assigning very large numbers of detectives was frequently employed. In addition, although our data were
not able to assess this element, experienced homicide detectives with whom we discussed our research
indicated that another factor, in addition to the number of detectives, was the degree of autonomy that
detectives were able to exercise at the crime scenes. Policies that require detectives to either seek approval
for continuing past their regularly scheduled shift or that deny the possibility for overtime were identified by
these detectives as significantly reducing their effectiveness in a case. These detectives suggested to us, and
it would be consistent with our data, although we were not able to measure this directly, that policies that
allow responding detectives to stay on the case as long as they think necessary without seeking approval
is critical. In addition, our data indicate the importance of detectives arriving at the crime scene as quickly
as possible and preferably in less than 30 minutes. Again, although we were not able to measure this
directly with our data, experienced detectives tell us that a critical element in quickness of response is
whether they have cars assigned to them on a 24-hour basis. If they do not and their assignment to a case
occurs while they are off duty, it is impossible to respond as quickly as they think, and our data suggest,
is necessary.
64
Our data also suggest the growing importance of computer checks of various types, particularly checks
on guns, on suspects, and on victims. Our data suggest this even though the time frame of our sample meant
we had cases in which the police were not asked to take full advantage of emerging information technology
available to law enforcement. We also note the minimal impact of the defender and victim characteristics
in clearance. Although there are some significant variables (for example, ethnicity), we do not find these to
be critical variables in understanding clearance, nor are many other characteristics of the case in the
investigation. While drug cases continue to be the most difficult for police to solve, even when we restrict
our analysis to this subset we find that police are able to clear these cases given the right allocation of
resources. Overall, then, our analysis has led us to believe that practices and policies of law enforcement
agencies can have a substantial impact on the clearance of homicide cases and that clearance of homicides
could be increased if law enforcement agencies improved investigation policies and practices. Lawrence
Sherman (1998) has recently written about the importance of evidence-based policing to draw attention
to the fact that we have little evidence to guide most policing practices. We believe that the research
reported in this paper is consistent with the idea of using research to assess strategies that will improve the
ability of law enforcement agencies to effectuate arrest in very serious cases. While our analysis only applies
to homicides cases, similar analyses of other types of serious crimes could assist police in structuring their
response to improve apprehension.
The kind of research that we report here could be extremely useful in the area of police performance
measurement as well. When we presented the preliminary results of this research at a National Institute of
Justice conference, an experienced homicide police administrator observed that one of the values he saw
for this research was to allow for the estimation of the difficulty of a case and to use that in weighing the
effectiveness of detectives’ performance. We concur. We think that homicide cases, and most other crimes,
begin with different levels of “solvability.” Our research suggests that homicides do differ in regard to the
probability of an arrest, but even more importantly, we think there are few homicide cases that given the
right initial response, the right timing, and the right dedication of resources cannot be solved.
Finally, while we have described what we think are characteristics of investigations that increase the
chance of clearance, our ability to recommend strategies for effective homicide investigation is limited by

65
the fact that our data are drawn from a range of activities that police agencies have used in the past. The
indication of the importance of information technology in computer checks on case closure leads us to
believe that a wider range of information that could and should be more effectively utilized in the
investigative process exists. For example, particularly for drug-related cases, access to data maintained by
vice and drug squads within police departments in the region in which the crime occurs could prove
extremely useful in identifying potential offenders. This information, particularly in drug-related crimes, could
be vitally important, and if easily accessed through information technology, could be useful in focusing
investigative priorities. Similarly, domestic violence data sets could prove useful. These examples suggest
a broader set of information sources for law enforcement that could improve homicide and other
investigations, mainly the rapid adoption of incident-based crime reporting in its fuller sense. Police would
have access within their jurisdiction and other jurisdictions to a wide range of information that could be
useful in identifying potential offenders for all cases. The future of evidence-based policing, and we think
more successful policing, may well depend upon the degree to which law enforcement can take fuller
advantage of the information technology age.
Future Research
By no means do we think we have solved the problem of homicide clearance. We do believe,
however, the approach we have taken is viable and that it offers suggestions for police agencies. At the
same time, we believe that the range and number of law enforcement agencies included in research of this
kind should be increased. We urge support for research covering a much larger number of cases and
different types of agencies. In addition, we think the design of the research that we have completed should
be done in multiple years for homicide cases to help us understand whether the change in homicide
clearance rates over the last 10 to 15 years reflects changes in homicide events and/or homicide practice.
Finally, we think that the design suggested here and its logic should be extended to other types of crimes,
particularly to the crimes of rape, aggravated assault, and robbery. Providing detailed assessments of a
variety of ways for law enforcement to respond to crime will allow us to conduct research that is far more
relevant to the practice of policing than much of the research that has been conducted in the past.

66
References
Beccaria, C. (1963). On crimes and punishment. (H. Paolucci, Trans.). New York: Bobbs-MerrillCo., Inc.(Original work published 1764).
Cardarelli, A.P. & Cavanaugh, D. (1992, November). Uncleared homicides in the United States:An exploratory study of trends and patterns. Paper presented at the annual meeting of theAmerican Society of Criminology, San Francisco, CA.
Eck, J.E. (1992). Criminal investigation. In G.W. Cordner and D.C. Hale (Eds.), What works in policing (pp.19-34). Cincinnati: Anderson Publishing Co.
Forst, B. (1982). Arrest convictability as a measure of police performance. Washington, DC: National Institute of Justice.
Greenwood, P., Chaiken, J., & Petersilia, J. (1977). The criminal investigation process. Lexington,MA: Lexington Books.
International Association of Chiefs of Police. (1995). Murder in America: Recommendationsfrom the IACP murder summit (Available from John Firman, Coordinator for Research andAnalysis at 1-800-THE-IACP).
Maguire, K. & Pastore, A.L. (Eds.). (1995). Sourcebook of criminal justice statistics 1994.UnitedStates Department of Justice, Bureau of Justice Statistics. Publication No. NCJ-154591.Washington, DC: U.S. Government Printing Office.
Maxwell, M.G. (1989). Circumstances in supplementary homicide reports. Criminology, 27,671–695.
Riedel, M. & Rinehart, A. (1994, March). Clearance, missing data, and murder. Paper presented atthe annual meeting of the Academy of Criminal Justice Sciences, Chicago, IL.
Sherman, L. (1998). Ideas in American policing: Evidence-based policing. Washington, D.C.:Police Foundation.
Skolnick, J. (1966). Justice without trial. New York: John Wiley.
Tonry, M. & Morris, N. (1992) Modern policing. Chicago: University of Chicago Press.