capital punishment, 2010 - bureau of justice statistics
TRANSCRIPT

U.S. Department of Justice Office of Justice Programs Bureau of Justice Statistics
Bureau of Justice Statistics · Statistical Tables
BJS
December 2011, NCJ 236510
At yearend 2010, 36 states and the Federal Bureau of Prisons held 3,158 inmates under sentence of death, 15 fewer inmates than at
yearend 2009. This represents the tenth consecutive year that the number of inmates under sentence of death has decreased.
Four States (California, Florida, Texas, and Pennsylvania) held more than half of all inmates on death row as of December 31, 2010. The Federal Bureau of Prisons held 58 inmates on death row.
Of those under sentence of death at yearend, 55% were white and 42% were black. The 388 Hispanic inmates under sentence of death accounted for 14% of inmates with a known ethnicity. Ninety-eight percent of inmates under sentence of death were male, and 2% were female. The race and gender of those under sentence of death has remained relatively unchanged since 2000.
During 2010, 119 inmates were removed from under sentence: 46 were executed, 20 died by means other than execution, and 53 were removed as a result of sentences or convictions overturned or commutations
of sentences. A total of 104 inmates were received under sentence of death during 2010, representing the smallest number of admissions since 1973 when 44 persons were admitted.
During 2010, 22 states and the Federal Bureau of Prisons received 104 prisoners under sentence of death. Admissions in California (24), Florida (14), Arizona (9), and Texas (8) accounted for 53% of those sentenced to death in 2010.
Twelve states executed 46 inmates during 2010, 6 fewer inmates than in 2009. The inmates executed in 2010 had been under sentence of death an average of 14 years and 10 months, which was 9 months longer than those executed in 2009.
Of the 7,879 people under sentence of death between 1977 and 2010, 16% had been executed, 6% died by causes other than execution, and 39% received other dispositions.*
Capital Punishment, 2010 – Statistical TablesTracy L. Snell, BJS Statistician
*Following the U.S. Supreme Court’s approval of revised statutes in some states (Gregg v. Georgia), executions of inmates resumed in 1977.
Figure 2Number of persons under sentence of death, 1953–2010
0
1,000
2,000
3,000
4,000
2010200019901980197019601953
Number
Source: BJS, National Prisoner Statistics Program.
Figure 1Number of persons executed in the United States, 1930–2010
0
50
100
150
200
201020001990198019701960195019401930
Executions
Source: BJS, National Prisoner Statistics Program.

2 Capital Punishment, 2010 - Statistical Tables
Four states revised capital statutes in 2010At yearend 2010, the death penalty was authorized by 36 states and the federal government (table 1). While New Mexico repealed the death penalty in 2009 (Laws 2009, ch. 11 § 5), the repeal was not retroactive. As of December 31, 2010, New Mexico held two men under previously imposed death sentences, and one person was awaiting sentencing with the state seeking the death penalty.
During 2010, four states revised statutory provisions relating to the death penalty:
South Carolina—Amended the list of aggravating factors to include murder committed while in the commission of trafficking in persons (§ 16-3-20(c)(a)(1)(c)), effective June 11, 2010.
Tennessee—Added as an aggravating circumstance the intentional murder of a pregnant woman when it was known by the defendant that the victim was pregnant (Tenn. Code Ann § 39-13-204(i)(16)), effective July 1, 2010.
Utah—Revised the minimum sentence required in capital felony cases in which the jury does not reach a unanimous decision to impose a death sentence. The minimum sentence was increased from an indeterminate sentence of 20 years to life to an indeterminate sentence of 25 years to life (Utah Code Ann § 76-3-207 and § 76-5-202), effective May 11, 2010.
Virginia—Revised the definition of capital murder to include fire marshals, auxiliary police officers, and auxiliary deputy sheriffs among law enforcement officers killed while performing official duties (Va Code § 18.2-31(6)), effective July 1, 2010.
Lethal injection was authorized by all states with capital statutesAs of December 31, 2010, all 36 states with death penalty statutes authorized lethal injection as a method of execution (table 2).
In addition to lethal injection, 16 states authorized an alternative method of execution. Nine states authorized electrocution; three states, lethal gas; three states, hanging; and two states, firing squad.
For states that authorize multiple methods of execution, the method is generally selected by the condemned prisoner. Five of the 16 states stipulated which method must be used depending on either the date of the offense or sentencing. One state authorized hanging only if lethal injection could not be given. Five states authorized alternative methods if lethal injection is ruled to be unconstitutional: one authorized hanging, one state authorized electrocution, one authorized electrocution or firing squad, one authorized firing squad, and one authorized lethal gas.
The method of execution of federal prisoners is lethal injection, pursuant to 28 CFR, Part 26. For offenses under the Violent Crime Control and Law Enforcement Act of 1994, the method is that of the state in which the conviction took place (18 U.S.C. 3596).
executions in 2011Between January 1 and December 19, 2011, 13 states executed 43 inmates, which was 3 fewer than the number executed as of the same date in 2010.
Three states accounted for more than half of the executions carried out during this period: Texas executed 13 inmates; Alabama executed 6; and Ohio executed 5.
Of the 43 executions carried out during this period, all were by lethal injection.
No women were executed during this period.
0 10 20 30 40 50TotalTexas
AlabamaOhio
GeorgiaArizonaFlorida
MississippiOklahoma
MissouriDelaware
South CarolinaVirginia
Idaho
4313
11111
222
44
56
Number of executions
Figure 3Advance count of executions, January 1, 2011–December 19, 2011

December 2011 3
MethodologyCapital punishment information is collected annually as part of the National Prisoner Statistics program (NPS-8). This data series is collected in two parts: data on persons under sentence of death are obtained from the department of corrections in each jurisdiction currently authorizing capital punishment, and information on the status of death penalty statutes is obtained from the Office of the Attorney General in each of the 50 states, the District of Columbia, and the federal government. Data collection forms are available on the BJS website at www.bjs.gov.
NPS-8 covers all persons under sentence of death at any time during the year who were held in a state or federal nonmilitary correctional facility. Included are capital offenders transferred from prison to mental hospitals and those who may have escaped from custody. Excluded are persons whose death sentences have been overturned by the court, regardless of their current incarceration status.
The statistics reported in this report may differ from data collected by other organizations for a variety of reasons: (1) NPS-8 adds inmates to the population under sentence of death not at sentencing but at the time they are admitted to a state or federal correctional facility; (2) if inmates entered prison under a death sentence or were reported as being relieved of a death sentence in one year but the court had acted in the previous year, the counts are adjusted to reflect the dates of court decisions (See note on table 4 for the affected jurisdictions.); and (3) NPS-8 counts are always for the last day of the calendar year and will differ from counts for more recent periods.
All data in this report have been reviewed for accuracy by the data providers in each jurisdiction prior to publication.

4 Capital Punishment, 2010 - Statistical Tables
2010 Statistical TablesTable 1. Capital offenses, by state, 2010
Table 2. Method of execution, by state, 2010
Table 3. Federal capital offenses, 2010
Table 4. Prisoners under sentence of death, by region, jurisdiction, and race, 2009 and 2010
Table 5. Women under sentence of death, by region, jurisdiction, and race, 2009 and 2010
Table 6. Hispanics under sentence of death, by region and jurisdiction, 2009 and 2010
Table 7. Inmates removed from under sentence of death, by method of removal, 2010
Table 8. Average time between sentencing and execution, 1977-2010
Table 9. Number of inmates executed, by race, 1977-2010
Table 10. Executions, by state and method, 1977-2010
Table 11. Number of persons executed, by jurisdiction, 1930-2010
Table 12. Prisoners under sentence of death on December 31, 2010, by jurisdiction and year of sentencing
Table 13. Executions and other dispositions of inmates sentenced to death, by race and Hispanic origin, 1977-2010
Table 14. Prisoners sentenced to death and outcome of sentence, by year of sentencing, 1973-2010
Table 15. Number sentenced to death and number of removals, by jurisdiction and reason for removal, 1973-2010

December 2011 5
Table 1 Capital offenses, by state, 2010State Offense State OffenseAlabama Intentional murder with 18 aggravating factors (Ala.
Stat. Ann. 13A-5-40(a)(1)-(18)).Montana Capital murder with 1 of 9 aggravating circumstances
(Mont. Code Ann. § 46-18-303); aggravated sexual intercourse without consent (Mont. Code Ann. § 45-5-503).
Arizona First-degree murder, including pre-meditated murder and felony murder, accompanied by at least 1 of 14 aggravating factors (A.R.S. § 13-703(F)).
Nebraska First-degree murder with a finding of at least 1 statutorily-defined aggravating circumstance.
Arkansas Capital murder (Ark. Code Ann. 5-10-101) with a finding of at least 1 of 10 aggravating circumstances; treason.
Nevada First-degree murder with at least 1 of 15 aggravating circumstances (NRS 200.030, 200.033, 200.035).
California First-degree murder with special circumstances; sabotage; train wrecking causing death; treason; perjury causing execution of an innocent person; fatal assault by a prisoner serving a life sentence.
New Hampshire Murder committed in the course of rape, kidnapping, or drug crimes; killing of a police officer, judge, or prosecutor; murder for hire; murder by an inmate while serving a sentence of life without parole (RSA 630:1, RSA 630:5).
Colorado First-degree murder with at least 1 of 17 aggravating factors; first-degree kidnapping resulting in death; treason.
New York* First-degree murder with 1 of 13 aggravating factors (NY Penal Law §125.27).
Connecticut Capital felony with 8 forms of aggravated homicide (C.G.S. § 53a-54b).
North Carolina First-degree murder (NCGS §14-17).
Delaware First-degree murder (11 Del. C. § 636) with at least 1 statutory aggravating circumstance (11 Del. C. § 4209).
Ohio Aggravated murder with at least 1 of 10 aggravating circumstances (O.R.C. secs. 2903.01, 2929.02, and 2929.04).
Florida First-degree murder; felony murder; capital drug trafficking; capital sexual battery.
Oklahoma First-degree murder in conjunction with a finding of at least 1 of 8 statutorily-defined aggravating circumstances.
Georgia Murder; kidnapping with bodily injury or ransom when the victim dies; aircraft hijacking; treason.
Oregon Aggravated murder (ORS 163.095-150).
Idaho First-degree murder with aggravating factors; first-degree kidnapping; perjury resulting in death.
Pennsylvania First-degree murder with 18 aggravating circumstances.
Illinois First-degree murder with 1 of 21 aggravating circumstances (720 ILCS 5/9-1).
South Carolina Murder with 1 of 12 aggravating circumstances (§ 16-3-20(C)(a)).
Indiana Murder with 16 aggravating circumstances (IC 35-50-2-9).
South Dakota First-degree murder with 1 of 10 aggravating circumstances.
Kansas Capital murder with 8 aggravating circumstances (KSA 21-3439, KSA 21-4625, KSA 21-4636).
Tennessee First-degree murder with 1 of 16 aggravating circumstances (Tenn. Code Ann. § 39-13-204).
Kentucky Murder with aggravating factors; kidnapping with aggravating factors (KRS 532.025).
Texas Criminal homicide with 1 of 9 aggravating circumstances (Tex. Penal Code § 19.03).
Louisiana First-degree murder; treason (La. R.S. 14:30 and 14:113). Utah Aggravated murder (76-5-202, Utah Code Annotated).
Maryland First-degree murder, either premeditated or during the commission of a felony, provided that certain death eligibility requirements are satisfied.
Virginia First-degree murder with 1 of 15 aggravating circumstances (VA Code § 18.2-31).
Mississippi Capital murder (Miss. Code Ann. § 97-3-19(2)); aircraft piracy (Miss. Code Ann. § 97-25-55(1)).
Washington Aggravated first-degree murder.
Missouri First-degree murder (565.020 RSMO 2000). Wyoming First-degree murder; murder during the commission of sexual assault, sexual abuse of a minor, arson, robbery, burglary, escape, resisting arrest, kidnapping, or abuse of a minor under 16 (W.S.A. § 6-2-101(a)).
*The New York Court of Appeals has held that a portion of New York’s death penalty sentencing statute (CPL 400.27) was unconstitutional (People v. Taylor, 9 N.Y.3d 129 (2007)). As a result, no defendants can be sentenced to death until the legislature corrects the errors in this statute.Source: BJS, National Prisoner Statistics Program.

6 Capital Punishment, 2010 - Statistical Tables
Table 2Method of execution, by state, 2010Jurisdiction Lethal injection Electrocution Lethal gas Hanging Firing squad
Total 36 9 3 3 2Alabama X XArizonaa X XArkansasb X XCalifornia XColorado XConnecticut XDelawarec X XFlorida X XGeorgia XIdaho XIllinoisd X XIndiana XKansas XKentuckye X XLouisiana XMaryland XMississippi XMissouri X XMontana XNebraska XNevada XNew Hampshiref X XNew York XNorth Carolina XOhio XOklahomag X X XOregon XPennsylvania XSouth Carolina X XSouth Dakota XTennesseeh X XTexas XUtahi X XVirginia X XWashington X XWyoming X XNote: The method of execution of federal prisoners is lethal injection, pursuant to 28 CFR, Part 26. For offenses prosecuted under the Violent Crime Control and Law Enforcement Act of 1994, the execution method is that of the state in which the conviction took place (18 U.S.C. 3596).aAuthorizes lethal injection for persons sentenced after November 15, 1992; inmates sentenced before that date may select lethal injection or gas.bAuthorizes lethal injection for those whose offense occurred on or after July 4, 1983; inmates whose offense occurred before that date may select lethal injection or electrocution.cAuthorizes hanging if lethal injection is held to be unconstitutional by a court of competent jurisdiction.dAuthorizes electrocution only if lethal injection is held illegal or unconstitutional.eAuthorizes lethal injection for persons sentenced on or after March 31, 1998; inmates sentenced before that date may select lethal injection or electrocution.fAuthorizes hanging only if lethal injection cannot be given.gAuthorizes electrocution if lethal injection is held to be unconstitutional, and firing squad if both lethal injection and electrocution are held to be unconstitutional.hAuthorizes lethal injection for those whose capital offense occurred after December 31, 1998; inmates whose offense occurred before that date may select electrocution by written waiver.iAuthorizes firing squad if lethal injection is held unconstitutional. Inmates who selected execution by firing squad prior to May 3, 2004, may still be entitled to execution by that method.jAuthorizes lethal gas if lethal injection is held to be unconstitutional.Source: BJS, National Prisoner Statistics Program.

December 2011 7
Table 3 Federal capital offenses, 2010Statute Description
8 U.S.C. 1342 Murder related to the smuggling of aliens.
18 U.S.C. 32-34 Destruction of aircraft, motor vehicles, or related facilities resulting in death.
18 U.S.C. 36 Murder committed during a drug-related drive-by shooting.
18 U.S.C. 37 Murder committed at an airport serving international civil aviation.
18 U.S.C. 115(b)(3) [by cross-reference to 18 U.S.C. 1111]
Retaliatory murder of a member of the immediate family of law enforcement officials.
18 U.S.C. 241, 242, 245, 247 Civil rights offenses resulting in death.
18 U.S.C. 351 [by cross-reference to 18 U.S.C. 1111]
Murder of a member of Congress, an important executive official, or a Supreme Court Justice.
18 U.S.C. 794 Espionage.
18 U.S.C. 844(d), (f ), (i) Death resulting from offenses involving transportation of explosives, destruction of government property, or destruction of property related to foreign or interstate commerce.
18 U.S.C. 924(i) Murder committed by the use of a firearm during a crime of violence or a drug-trafficking crime.
18 U.S.C. 930 Murder committed in a federal government facility.
18 U.S.C. 1091 Genocide.
18 U.S.C. 1111 First-degree murder.
18 U.S.C. 1114 Murder of a federal judge or law enforcement official.
18 U.S.C. 1116 Murder of a foreign official.
18 U.S.C. 1118 Murder by a federal prisoner.
18 U.S.C. 1119 Murder of a U.S. national in a foreign country.
18 U.S.C. 1120 Murder by an escaped federal prisoner already sentenced to life imprisonment.
18 U.S.C. 1121 Murder of a state or local law enforcement official or other person aiding in a federal investigation; murder of a state correctional officer.
18 U.S.C. 1201 Murder during a kidnapping.
18 U.S.C. 1203 Murder during a hostage taking.
18 U.S.C. 1503 Murder of a court officer or juror.
18 U.S.C. 1512 Murder with the intent of preventing testimony by a witness, victim, or informant.
18 U.S.C. 1513 Retaliatory murder of a witness, victim, or informant.
18 U.S.C. 1716 Mailing of injurious articles with intent to kill or resulting in death.
18 U.S.C. 1751 [by cross-reference to 18 U.S.C. 1111]
Assassination or kidnapping resulting in the death of the President or Vice President.
18 U.S.C. 1958 Murder for hire.
18 U.S.C. 1959 Murder involved in a racketeering offense.
18 U.S.C. 1992 Willful wrecking of a train resulting in death.
18 U.S.C. 2113 Bank robbery-related murder or kidnapping.
18 U.S.C. 2119 Murder related to a carjacking.
18 U.S.C. 2245 Murder related to rape or child molestation.
18 U.S.C. 2251 Murder related to sexual exploitation of children.
18 U.S.C. 2280 Murder committed during an offense against maritime navigation.
18 U.S.C. 2281 Murder committed during an offense against a maritime fixed platform.
18 U.S.C. 2332 Terrorist murder of a U.S. national in another country.
18 U.S.C. 2332a Murder by the use of a weapon of mass destruction.
18 U.S.C. 2340 Murder involving torture.
18 U.S.C. 2381 Treason.
21 U.S.C. 848(e) Murder related to a continuing criminal enterprise or related murder of a federal, state, or local law enforcement officer.
49 U.S.C. 1472-1473 Death resulting from aircraft hijacking.

8 Capital Punishment, 2010 - Statistical Tables
Table 4 Prisoners under sentence of death, by region, jurisdiction, and race, 2009 and 2010
Region and jurisdiction
Prisoners under sentence of death, 12/31/09
Received under sentence of death, 2010
Removed from death row (excluding executions), 2010a Executed, 2010
Prisoners under sentence of death, 12/31/10
Totalb Whitec Blackc Totalb Whitec Blackc Totalb Whitec Blackc Totalb Whitec Blackc Totalb Whitec Blackc
U.S. total 3,173 1,779 1,318 104 45 42 73 41 31 46 33 13 3,158 1,750 1,316Federald 56 26 29 3 3 0 1 0 1 0 0 0 58 29 28State 3,117 1,753 1,289 101 42 42 72 41 30 46 33 13 3,100 1,721 1,288
Northeast 229 84 136 3 1 2 6 3 3 0 0 0 226 82 135Connecticut 10 4 6 1 1 0 1 1 0 0 0 0 10 4 6New Hampshire 1 0 1 0 0 0 0 0 0 0 0 0 1 0 1New York 0 0 0 0 0 0 0 0 0 0 0 0 0 0 0Pennsylvania 218 80 129 2 0 2 5 2 3 0 0 0 215 78 128
Midwest 265 142 120 9 3 5 10 3 7 8 3 5 256 139 113Illinois 14 10 4 1 1 0 0 0 0 0 0 0 15 11 4Indiana 13 10 3 0 0 0 0 0 0 0 0 0 13 10 3Kansas 9 5 4 0 0 0 1 0 1 0 0 0 8 5 3Missouri 51 29 22 0 0 0 2 1 1 0 0 0 49 28 21Nebraska 11 8 2 1 0 0 0 0 0 0 0 0 12 8 2Ohio 165 78 85 7 2 5 7 2 5 8 3 5 157 75 80South Dakota 2 2 0 0 0 0 0 0 0 0 0 0 2 2 0
South 1,661 912 726 45 21 22 41 22 18 35 27 8 1,630 884 722Alabama 202 103 98 7 4 3 3 1 2 5 4 1 201 102 98Arkansas 42 18 24 1 0 0 1 1 0 0 0 0 42 17 24Delaware 17 9 8 0 0 0 0 0 0 0 0 0 17 9 8Florida 390 256 134 14 6 8 11 8 3 1 1 0 392 253 139Georgia 104 54 49 0 0 0 2 0 1 2 2 0 100 52 48Kentucky 35 29 6 2 1 1 3 1 2 0 0 0 34 29 5Louisiana 83 29 53 2 1 1 0 0 0 1 1 0 84 29 54Maryland 5 1 4 0 0 0 0 0 0 0 0 0 5 1 4Mississippi 60 28 31 4 2 2 1 1 0 3 3 0 60 26 33North Carolina 159 65 86 4 3 1 5 2 3 0 0 0 158 66 84Oklahoma 77 42 31 0 0 0 3 3 0 3 2 1 71 37 30South Carolina 55 25 30 2 0 2 1 1 0 0 0 0 56 24 32Tennessee 89 49 38 1 1 0 4 1 3 0 0 0 86 49 35Texas 330 198 127 8 3 4 6 3 3 17 12 5 315 186 123Virginia 13 6 7 0 0 0 1 0 1 3 2 1 9 4 5
West 962 615 307 44 17 13 15 13 2 3 3 0 988 616 318Arizona 130 108 17 9 2 3 5 5 0 1 1 0 133 104 20California 683 401 250 24 8 7 8 6 2 0 0 0 699 403 255Colorado 2 0 2 1 0 1 0 0 0 0 0 0 3 0 3Idaho 15 15 0 2 2 0 1 1 0 0 0 0 16 16 0Montana 2 2 0 0 0 0 0 0 0 0 0 0 2 2 0Nevada 78 46 31 4 3 1 1 1 0 0 0 0 81 48 32New Mexico 2 2 0 0 0 0 0 0 0 0 0 0 2 2 0Oregon 31 27 3 3 1 1 0 0 0 0 0 0 34 28 4Utah 10 8 1 0 0 0 0 0 0 1 1 0 9 7 1Washington 8 5 3 1 1 0 0 0 0 1 1 0 8 5 3Wyoming 1 1 0 0 0 0 0 0 0 0 0 0 1 1 0
Note: Some figures shown for yearend 2009 are revised from those reported in Capital Punishment, 2009 - Statistical Tables, BJS Web, NCJ 231676. The revised figures include 11 inmates who were either reported late to the National Prisoner Statistics program or were not in custody of state correctional authorities on December 31, 2009 (3 in Georgia, 2 in Arkansas, and 1 each in Alabama, Florida, Texas, Idaho, Nevada, and the Federal Bureau of Prisons) and exclude 11 inmates who were relieved of a death sentence before December 31, 2009 (3 in Nevada; 2 each in Illinois, Oklahoma, and Texas; and 1 each in Indiana, Florida, North Carolina, Arizona, and California). Data for December 31, 2009, also include 3 inmates who were erroneously reported as being removed from under sentence of death (1 each in Alabama, Florida, and North Carolina).aIncludes 15 deaths from natural causes (5 in Florida; 2 each in Pennsylvania, Texas, and California; and 1 each in Oklahoma, South Carolina, Tennessee, and Arizona), 4 deaths from suicide (1 each in Georgia, Texas, Arizona, and California), and 1 death from a drug overdose (California). bIncludes American Indians, Alaska Natives, Asians, Native Hawaiians, other Pacific Islanders, and Hispanic inmates for whom no other race was identified.cThe reporting of race and Hispanic origin differs from that presented in other tables in this document. In this table, counts of white and black inmates include persons of Hispanic/Latino origin.dExcludes persons held under Armed Forces jurisdiction with a military death sentence for murder.Source: BJS, National Prisoner Statistics Program.

December 2011 9
Table 5 Women under sentence of death, by region, jurisdiction, and race, 2009 and 2010
Region and jurisdiction
Under sentence of death, 12/31/09
Received under sentence of death, 2010
Removed from death row, 2010 Executed, 2010
Under sentence of death, 12/31/10
Totala Whiteb Blackb Totala Whiteb Blackb Totala Whiteb Blackb Totala Whiteb Blackb Totala Whiteb Blackb
U.S. total 60 42 15 3 2 0 4 3 1 1 1 0 58 40 14Federal 2 2 0 0 0 0 0 0 0 0 0 0 2 2 0State 58 40 15 3 2 0 4 3 1 1 1 0 56 38 14
Northeast 5 2 3 0 0 0 1 1 0 0 0 0 4 1 3Pennsylvania 5 2 3 0 0 0 1 1 0 0 0 0 4 1 3
Midwest 2 1 1 0 0 0 0 0 0 0 0 0 2 1 1Indiana 1 0 1 0 0 0 0 0 0 0 0 0 1 0 1Ohio 1 1 0 0 0 0 0 0 0 0 0 0 1 1 0
South 32 22 9 1 1 0 3 2 1 1 1 0 29 20 8Alabama 5 3 2 0 0 0 1 0 1 0 0 0 4 3 1Florida 1 1 0 0 0 0 0 0 0 0 0 0 1 1 0Georgia 1 1 0 0 0 0 0 0 0 0 0 0 1 1 0Kentucky 1 1 0 0 0 0 0 0 0 0 0 0 1 1 0Louisiana 2 1 1 0 0 0 0 0 0 0 0 0 2 1 1Mississippi 3 3 0 0 0 0 1 1 0 0 0 0 2 2 0North Carolina 5 2 2 0 0 0 0 0 0 0 0 0 5 2 2Oklahoma 1 1 0 0 0 0 0 0 0 0 0 0 1 1 0Tennessee 2 2 0 0 0 0 1 1 0 0 0 0 1 1 0Texas 10 6 4 1 1 0 0 0 0 0 0 0 11 7 4Virginia 1 1 0 0 0 0 0 0 0 1 1 0 0 0 0
West 19 15 2 2 1 0 0 0 0 0 0 0 21 16 2Arizona 2 2 0 0 0 0 0 0 0 0 0 0 2 2 0California 16 12 2 2 1 0 0 0 0 0 0 0 18 13 2Idaho 1 1 0 0 0 0 0 0 0 0 0 0 1 1 0
aIncludes American Indians, Alaska Natives, Asians, Native Hawaiians, other Pacific Islanders, and Hispanic inmates for whom no other race was identified.bThe reporting of race and Hispanic origin differs from that presented in other tables in this document. In this table, counts of white and black inmates include persons of Hispanic/Latino origin.Source: BJS, National Prisoner Statistics Program.

10 Capital Punishment, 2010 - Statistical Tables
Table 6 Hispanics under sentence of death, by region and jurisdiction, 2009 and 2010
Region and jurisdictionUnder sentence of death, 12/31/09
Received under sentence of death, 2010
Removed from death row (excluding executions), 2010 Executed, 2010
Under sentence of death, 12/31/10
U.S. total 376 22 5 5 388Federal 6 2 0 0 8State 370 20 5 5 380
Northeast 21 0 0 0 21Connecticut 1 0 0 0 1Pennsylvania 20 0 0 0 20
Midwest 9 1 0 0 10Illinois 2 0 0 0 2Nebraska 4 1 0 0 5Ohio 3 0 0 0 3
South 148 2 2 5 143Alabama 2 0 0 0 2Arkansas 0 1 0 0 1Delaware 2 0 0 0 2Florida 32 0 0 0 32Georgia 2 0 0 0 2Kentucky 1 0 0 0 1Louisiana 2 0 0 0 2North Carolina 4 0 0 0 4Oklahoma 2 0 0 0 2South Carolina 1 0 0 0 1Tennessee 1 0 0 0 1Texas 99 1 2 5 93
West 192 17 3 0 206Arizona 20 6 0 0 26California 157 10 3 0 164Idaho 1 0 0 0 1Nevada 8 0 0 0 8New Mexico 1 0 0 0 1Oregon 2 1 0 0 3Utah 3 0 0 0 3
Note: The count of Hispanics under sentence of death at yearend 2009 has been revised from those reported in Capital Punishment, 2009 - Statistical Tables, BJS Web, NCJ 231676.Source: BJS, National Prisoner Statistics Program.

December 2011 11
Table 7Inmates removed from under sentence of death, by method of removal, 2010
Appeals or higher courts overturnedRegion and jurisdiction Total Execution Other death Capital statute Conviction Sentence Sentence commutedU.S. total 119 46 20 2 8 38 5
Federal 1 0 0 0 0 1 0State 118 46 20 2 8 37 5
Northeast 6 0 2 0 1 3 0Connecticut 1 0 0 0 0 1 0Pennsylvania 5 0 2 0 1 2 0
Midwest 18 8 0 0 0 7 3Kansas 1 0 0 0 0 1 0Missouri 2 0 0 0 0 2 0Ohio 15 8 0 0 0 4 3
South 76 35 12 0 7 20 2Alabama 8 5 0 0 0 3 0Arkansas 1 0 0 0 0 1 0Florida 12 1 5 0 4 2 0Georgia 4 2 1 0 0 1 0Kentucky 3 0 0 0 0 3 0Louisiana 1 1 0 0 0 0 0Mississippi 4 3 0 0 0 1 0North Carolina 5 0 0 0 1 4 0Oklahoma 6 3 1 0 1 0 1South Carolina 1 0 1 0 0 0 0Tennessee 4 0 1 0 1 1 1Texas 23 17 3 0 0 3 0Virginia 4 3 0 0 0 1 0
West 18 3 6 2 0 7 0Arizona 6 1 2 0 0 3 0California 8 0 4 0 0 4 0Idaho 1 0 0 1 0 0 0Nevada 1 0 0 1 0 0 0Utah 1 1 0 0 0 0 0Washington 1 1 0 0 0 0 0
Source: BJS, National Prisoner Statistics Program.

12 Capital Punishment, 2010 - Statistical Tables
Table 8 Average time between sentencing and execution, 1977–2010
Year
Number of inmates executed
Average elapsed time from sentence to execution for all inmates
Total 1,234 131mo.1977 1 :1979 2 :1981 1 :1982 2 :1983 5 :1984 21 741985 18 711986 18 871987 25 861988 11 801989 16 951990 23 951991 14 1161992 31 1141993 38 1131994 31 1221995 56 1341996 45 1251997 74 1331998 68 1301999 98 1432000 85 1372001 66 1422002 71 1272003 65 1312004 59 1322005 60 1472006 53 1452007 42 1532008 37 1392009 52 1692010 46 178Note: In 1972, the U.S. Supreme Court invalidated capital punishment statutes in several states (Furman v. Georgia, 408 U.S. 238 (1972)), effecting a moratorium on executions. Executions resumed in 1977 when the Supreme Court found that revisions to several state statutes had effectively addressed the issues previously held unconstitutional (Gregg v. Georgia, 428 U.S. 153 (1976) and its companion cases). Average time was calculated from the most recent sentencing date.: Not calculated. A reliable average could not be generated from fewer than 10 cases.Source: BJS, National Prisoner Statistics Program.
December 2011 13
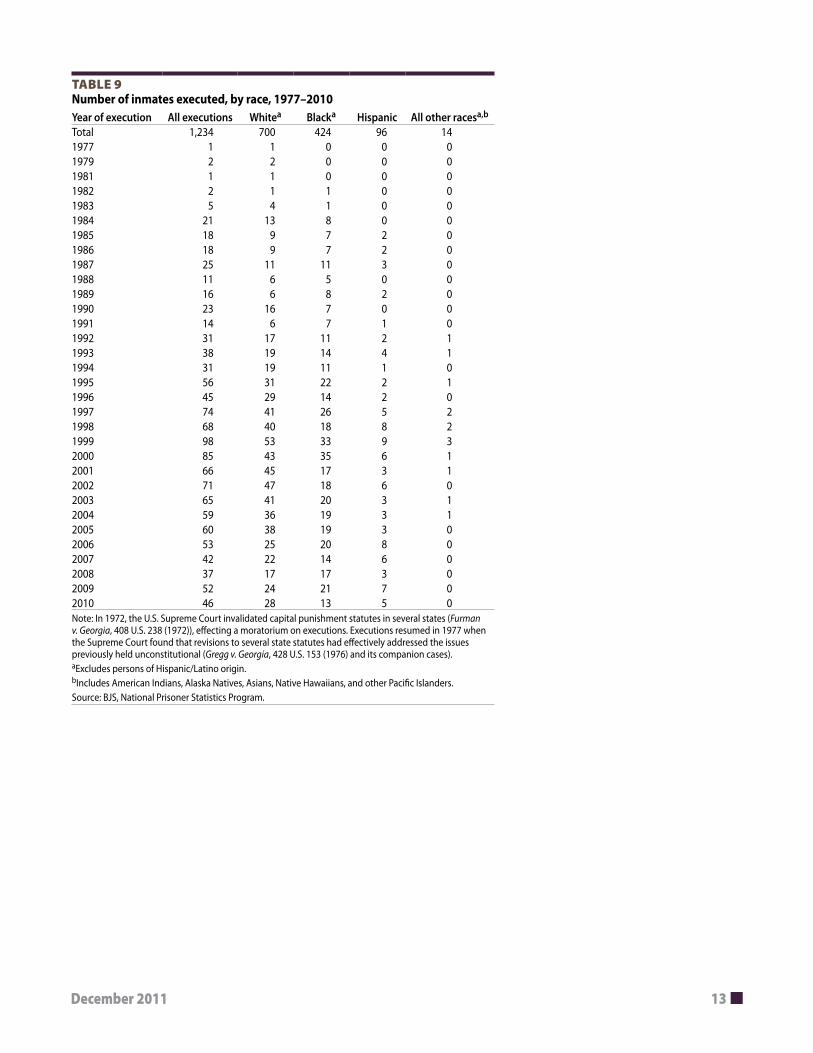
Table 9 Number of inmates executed, by race, 1977–2010Year of execution All executions Whitea Blacka Hispanic All other racesa,b
Total 1,234 700 424 96 141977 1 1 0 0 01979 2 2 0 0 01981 1 1 0 0 01982 2 1 1 0 01983 5 4 1 0 01984 21 13 8 0 01985 18 9 7 2 01986 18 9 7 2 01987 25 11 11 3 01988 11 6 5 0 01989 16 6 8 2 01990 23 16 7 0 01991 14 6 7 1 01992 31 17 11 2 11993 38 19 14 4 11994 31 19 11 1 01995 56 31 22 2 11996 45 29 14 2 01997 74 41 26 5 21998 68 40 18 8 21999 98 53 33 9 32000 85 43 35 6 12001 66 45 17 3 12002 71 47 18 6 02003 65 41 20 3 12004 59 36 19 3 12005 60 38 19 3 02006 53 25 20 8 02007 42 22 14 6 02008 37 17 17 3 02009 52 24 21 7 02010 46 28 13 5 0Note: In 1972, the U.S. Supreme Court invalidated capital punishment statutes in several states (Furman v. Georgia, 408 U.S. 238 (1972)), effecting a moratorium on executions. Executions resumed in 1977 when the Supreme Court found that revisions to several state statutes had effectively addressed the issues previously held unconstitutional (Gregg v. Georgia, 428 U.S. 153 (1976) and its companion cases).aExcludes persons of Hispanic/Latino origin.bIncludes American Indians, Alaska Natives, Asians, Native Hawaiians, and other Pacific Islanders. Source: BJS, National Prisoner Statistics Program.

14 Capital Punishment, 2010 - Statistical Tables
Table 10 Executions, by state and method, 1977–2010Jurisdiction Number executed Lethal injection Electrocution Lethal gas Hanging Firing squad
U.S. total 1,234 1,060 157 11 3 3Federal 3 3 0 0 0 0Alabama 49 25 24 0 0 0Arizona 24 22 0 2 0 0Arkansas 27 26 1 0 0 0California 13 11 0 2 0 0Colorado 1 1 0 0 0 0Connecticut 1 1 0 0 0 0Delaware 14 13 0 0 1 0Florida 69 25 44 0 0 0Georgia 48 25 23 0 0 0Idaho 1 1 0 0 0 0Illinois 12 12 0 0 0 0Indiana 20 17 3 0 0 0Kentucky 3 2 1 0 0 0Louisiana 28 8 20 0 0 0Maryland 5 5 0 0 0 0Mississippi 13 9 0 4 0 0Missouri 67 67 0 0 0 0Montana 3 3 0 0 0 0Nebraska 3 0 3 0 0 0Nevada 12 11 0 1 0 0New Mexico 1 1 0 0 0 0North Carolina 43 41 0 2 0 0Ohio 41 41 0 0 0 0Oklahoma 94 94 0 0 0 0Oregon 2 2 0 0 0 0Pennsylvania 3 3 0 0 0 0South Carolina 42 35 7 0 0 0South Dakota 1 1 0 0 0 0Tennessee 6 5 1 0 0 0Texas 464 464 0 0 0 0Utah 7 4 0 0 0 3Virginia 108 78 30 0 0 0Washington 5 3 0 0 2 0Wyoming 1 1 0 0 0 0Note: In 1972, the U.S. Supreme Court invalidated capital punishment statutes in several states (Furman v. Georgia, 408 U.S. 238 (1972)), effecting a moratorium on executions. Executions resumed in 1977 when the Supreme Court found that revisions to several state statutes had effectively addressed the issues previously held unconstitutional (Gregg v. Georgia, 428 U.S. 153 (1976) and its companion cases).Source: BJS, National Prisoner Statistics Program.

December 2011 15
Table 11 Number of persons executed, by jurisdiction, 1930–2010Jurisdiction Since 1930 Since 1977
U.S. total 5,093 1,234Texas 761 464Georgia 414 48New York 329 0North Carolina 306 43California 305 13Florida 239 69Ohio 213 41South Carolina 204 42Virginia 200 108Alabama 184 49Mississippi 167 13Louisiana 161 28Pennsylvania 155 3Oklahoma 154 94Arkansas 145 27Missouri 129 67Kentucky 106 3Illinois 102 12Tennessee 99 6New Jersey 74 0Maryland 73 5Arizona 62 24Indiana 61 20Washington 52 5Colorado 48 1Nevada 41 12District of Columbia 40 0West Virginia 40 0Federal system 36 3Massachusetts 27 0Delaware 26 14Connecticut 22 1Oregon 21 2Utah 20 7Iowa 18 0Kansas 15 0Montana 9 3New Mexico 9 1Wyoming 8 1Nebraska 7 3Idaho 4 1Vermont 4 0South Dakota 2 1New Hampshire 1 0Note: Statistics on executions under civil authority have been collected by the federal government annually since since 1930. These data exclude 160 executions carried out by military authorities between 1930 and 1961.Source: BJS, National Prisoner Statistics Program.

16 Capital Punishment, 2010 - Statistical Tables
Tab
le 1
2 Pr
ison
ers
unde
r sen
tenc
e of
dea
th o
n D
ecem
ber 3
1, 2
010,
by
juri
sdic
tion
and
yea
r of s
ente
ncin
g
Juri
sdic
tion
Year
of s
ente
nce
for p
riso
ners
und
er s
ente
nce
of d
eath
, 12/
31/2
010
Und
er
sent
ence
of
deat
h,
12/3
1/10
Aver
age
num
ber
of y
ears
und
er
sent
ence
of d
eath
as
of 1
2/31
/10
1974
– 19
82
1983
– 19
8419
85–
1986
1987
– 19
8819
89–
1990
1991
– 19
9219
93–
1994
1995
– 19
9619
97–
1998
1999
– 20
0020
01–
2002
2003
– 20
0420
05–
2006
2007
– 20
0820
0920
10To
tal
108
9611
315
116
222
124
230
932
129
922
423
323
422
411
710
43,
158
13.1
Calif
orni
a36
2928
4254
5652
7464
7338
3239
2929
2469
914
.6Fl
orid
a32
1613
2722
3936
2726
3217
1826
3116
1439
214
.8Te
xas
106
210
1021
1321
2540
4249
2326
98
315
11.4
Ariz
ona
54
411
912
137
71
112
1212
149
133
12.5
Geo
rgia
50
45
510
78
2011
35
59
30
100
14.0
Nev
ada
47
56
54
416
77
03
34
24
8115
.8Te
nnes
see
46
95
66
17
115
107
32
31
8615
.7A
laba
ma
31
46
97
1620
2717
1313
2722
97
201
10.9
Mis
siss
ippi
30
00
44
76
66
93
42
24
6012
.1Pe
nnsy
lvan
ia2
616
1716
1726
1918
1915
912
138
221
514
.6Ke
ntuc
ky1
33
20
34
14
52
13
00
234
15.2
Mis
sour
i1
12
10
41
77
34
45
72
049
11.4
Idah
o1
02
11
21
20
01
21
00
216
14.6
Ark
ansa
s1
00
01
37
56
53
12
52
142
11.9
Ohi
o0
914
1011
118
1919
913
108
81
715
714
.5M
aryl
and
03
00
00
01
10
00
00
00
5:
Sout
h Ca
rolin
a0
30
03
02
36
56
97
82
256
9.5
Okl
ahom
a0
11
21
12
59
116
118
112
071
9.6
Mon
tana
01
00
01
00
00
00
00
00
2:
Loui
sian
a0
03
41
34
1318
137
55
33
284
12.1
Uta
h0
01
11
11
20
10
00
10
09
:N
ebra
ska
00
10
00
02
02
11
21
11
129.
1N
orth
Car
olin
a0
01
02
828
3425
2211
89
42
415
812
.6In
dian
a0
00
10
01
02
22
12
11
013
9.8
Conn
ectic
ut0
00
01
20
10
00
02
30
110
9.6
Ore
gon
00
00
03
24
55
34
32
03
3410
.2D
elaw
are
00
00
02
20
10
53
31
00
179.
9W
ashi
ngto
n0
00
00
11
12
02
00
00
18
:Fe
dera
l Sys
tem
00
00
00
22
44
612
138
43
586.
7So
uth
Dak
ota
00
00
00
10
10
00
00
00
2:
Colo
rado
00
00
00
01
00
00
01
01
3:
New
Mex
ico
00
00
00
01
00
10
00
00
2:
Virg
inia
00
00
00
00
01
12
32
00
9:
Kans
as0
00
00
00
00
02
21
21
08
:Ill
inoi
s0
00
00
00
00
00
53
51
115
4.3
Wyo
min
g0
00
00
00
00
00
10
00
01
:N
ew H
amps
hire
00
00
00
00
00
00
01
00
1:
Not
e: F
or th
ose
pers
ons
sent
ence
d to
dea
th m
ore
than
onc
e, th
e nu
mbe
rs a
re b
ased
on
the
mos
t rec
ent d
eath
sen
tenc
e.: N
ot c
alcu
late
d. A
relia
ble
aver
age
coul
d no
t be
gene
rate
d fr
om fe
wer
than
10
case
s.So
urce
: BJS
, Nat
iona
l Pris
oner
Sta
tistic
s Pr
ogra
m.

December 2011 17
Table 13Executions and other dispositions of inmates sentenced to death, by race and Hispanic origin, 1977–2010
Total under sentence of death 1977–2010b
Prisoners executed
Prisoners who received other dispositionsa
Race/Hispanic origin Number Percent of total Number Percent of totalTotal 7,879 1,234 15.7% 3,487 44.3%
Whitec 3,816 700 18.3% 1,710 44.8%Blackc 3,225 424 13.1 1,497 46.4Hispanic 715 96 13.4 231 32.3All other racesc,d 123 14 11.4 49 39.8Note: In 1972, the U.S. Supreme Court invalidated capital punishment statutes in several states (Furman v. Georgia, 408 U.S. 238 (1972)), effecting a moratorium on executions. Executions resumed in 1977 when the Supreme Court found that revisions to several state statutes had effectively addressed the issues previously held unconstitutional (Gregg v. Georgia, 428 U.S. 153 (1976) and its companion cases).aIncludes persons removed from a sentence of death because of statutes struck down on appeal, sentences or convictions vacated, commutations, or death by other than execution. bIncludes 5 persons sentenced to death prior to 1977 who were still under sentence of death on December 31, 2010; 374 persons sentenced to death prior to 1977 whose death sentence was removed between 1977 and December 31, 2010; and 7,500 persons sentenced to death between 1977 and 2010.cExcludes persons of Hispanic/Latino origin.dIncludes American Indians, Alaska Natives, Asians, Native Hawaiians, and other Pacific Islanders.Source: BJS, National Prisoner Statistics Program.

18 Capital Punishment, 2010 - Statistical Tables
Table 14 Prisoners sentenced to death and the outcome of sentence, by year of sentencing, 1973–2010
Number of prisoners removed from under sentence of deathAppeal or higher courts overturned
Year of sentence
Number sentenced to death Execution Other death
Death penalty statute Conviction Sentence
Sentence commuted
Other or unknown reasons
Number under sentence of death, 12/31/2010
Total, 1973-2010 8,221 1,234 436 522 850 1,618 369 34 3,1581973 42 2 0 14 9 8 9 0 01974 149 11 4 65 15 30 22 1 11975 298 6 5 171 24 67 21 2 21976 232 14 6 136 17 42 15 0 21977 137 19 5 40 26 33 7 0 71978 185 36 7 21 36 65 8 0 12
1979 151 28 15 2 28 59 6 1 121980 173 45 15 4 30 52 12 0 151981 223 57 15 0 42 81 12 1 151982 267 67 23 0 40 82 12 1 421983 252 68 24 1 29 70 15 2 431984 285 69 21 2 46 73 13 8 53
1985 261 50 14 1 43 88 13 4 481986 301 74 25 1 50 67 14 5 651987 287 56 27 7 45 75 8 7 621988 289 59 18 1 35 73 14 0 891989 256 44 19 0 33 60 13 1 861990 251 47 19 2 36 53 17 1 76
1991 268 42 13 2 37 61 11 0 1021992 286 45 19 0 28 54 21 0 1191993 287 64 21 3 21 42 15 0 1211994 313 69 12 10 34 52 15 0 1211995 312 59 20 6 19 42 13 0 1531996 315 41 17 4 21 61 15 0 156
1997 266 30 10 3 19 39 11 0 1541998 294 40 10 4 22 42 9 0 1671999 277 27 13 8 21 35 10 0 1632000 224 23 10 4 11 31 9 0 1362001 158 13 9 3 5 24 2 0 1022002 165 13 4 3 2 16 5 0 1222003 151 12 7 1 5 11 0 0 115
2004 139 2 0 1 5 12 1 0 1182005 139 1 4 0 3 8 0 0 1232006 125 1 2 0 5 5 1 0 1112007 120 0 2 2 7 1 0 0 1082008 121 0 1 0 1 3 0 0 1162009 118 0 0 0 0 1 0 0 1172010 104 0 0 0 0 0 0 0 104Note: In 1972, the U.S. Supreme Court invalidated capital punishment statutes in several states (Furman v. Georgia, 408 U.S. 238 (1972)), effecting a moratorium on executions. Executions resumed in 1977 when the Supreme Court found that revisions to several state statutes had effectively addressed the issues previously held unconstitutional (Gregg v. Georgia, 428 U.S. 153 (1976) and its companion cases). Some inmates executed since 1977 or currently under sentence of death were sentenced prior to 1977. For those persons sentenced to death more than once, the numbers are based on the most recent death sentence.Source: BJS, National Prisoner Statistics Program.

December 2011 19
Table 15 Number sentenced to death and number of removals, by jurisdiction and reason for removal, 1973-2010
Number of removals, 1973-2010
JurisdictionTotal sentenced to death, 1973-2010 Executed Died
Sentence or conviction overturned
Sentence commuted
Other removals
Under sentence of death, 12/31/10
U.S. Total 8,221 1,234 436 2,990 369 34 3,158 Federal 69 3 0 7 1 0 58 Alabama 420 49 31 137 2 0 201 Arizona 293 24 16 112 7 1 133 Arkansas 113 27 3 39 2 0 42 California 951 13 77 147 15 0 699 Colorado 22 1 2 15 1 0 3 Connecticut 12 1 0 3 0 0 10 Delaware 56 14 0 25 0 0 17 Florida 992 69 58 453 18 2 392 Georgia 322 48 17 147 9 1 100 Idaho 42 1 3 19 3 0 16 Illinois 307 12 15 97 156 12 15 Indiana 100 20 4 55 6 2 13 Kansas 12 0 0 4 0 0 8 Kentucky 83 3 6 38 2 0 34 Louisiana 240 28 6 114 7 1 84 Maryland 53 5 3 36 4 0 5 Massachusetts 4 0 0 2 2 0 0 Mississippi 192 13 5 111 0 3 60 Missouri 182 67 10 54 2 0 49 Montana 15 3 2 6 2 0 2 Nebraska 33 3 4 12 2 0 12 Nevada 152 12 15 40 4 0 81 New Hampshire 1 0 0 0 0 0 1 New Jersey 52 0 3 33 8 8 0 New Mexico 28 1 1 19 5 0 2 New York 10 0 0 10 0 0 0 North Carolina 532 43 21 302 8 0 158 Ohio 409 41 20 173 18 0 157 Oklahoma 350 94 13 168 4 0 71 Oregon 60 2 2 22 0 0 34 Pennsylvania 401 3 26 151 6 0 215 Rhode Island 2 0 0 2 0 0 0 South Carolina 205 42 6 98 3 0 56 South Dakota 5 1 1 1 0 0 2 Tennessee 222 6 16 107 5 2 86 Texas 1,049 464 41 173 55 1 315 Utah 27 7 1 9 1 0 9 Virginia 150 108 6 15 11 1 9 Washington 39 5 1 25 0 0 8 Wyoming 12 1 1 9 0 0 1
Percent of inmatessentenced to death, 1973-2010 100% 15.0% 5.3% 36.4% 4.5% 0.4% 38.4%
Note: In 1972, the U.S. Supreme Court invalidated capital punishment statutes in several states (Furman v. Georgia, 408 U.S. 238 (1972)), effecting a moratorium on executions. Executions resumed in 1977 when the Supreme Court found that revisions to several state statutes had effectively addressed the issues previously held unconstitutional (Gregg v. Georgia, 428 U.S. 153 (1976) and its companion cases). Some inmates executed since 1977 or currently under sentence of death were sentenced prior to 1977. For those persons sentenced to death more than once, the numbers are based on the most recent death sentence.Source: BJS, National Prisoner Statistics Program.

U.S. Department of Justice Office of Justice Programs Bureau of Justice Statistics Washington, DC 20531
Official Business Penalty for Private Use $300
PRESORTED STANDARDPOSTAGE & FEES PAID
DOJ/BJSPermit No. G-91
Office of Justice Programs • Innovation • Partnerships • Safer Neighborhoods • http://www.ojp.gov
The Bureau of Justice Statistics is the statistical agency of the U.S. Department of Justice. James P. Lynch is director.
This report was written by Tracy L. Snell. Paul Guerino and James J. Stephan verified the report.
Lorelle Dennis and Garry L. Smith carried out the data collection and processing under the supervision of Heather C. West and Stephen G. Simoncini, Criminal Justice Statistics Branch, Governments Division, Census Bureau, U.S. Department of Commerce. Data collection and processing was completed with assistance from Steve Bittner, Colette R. Heiston, and Christopher Alaura.
Jill Thomas edited the report, Barbara Quinn produced the report, and Jayne Robinson prepared the report for final printing under the supervision of Doris J. James.
December 2011, NCJ 236510
The full text of each report is available in PDF and ASCII formats on the BJS website at www.bjs.gov. Tables are also available in PDF and CSV formats. Related datasets are made available on the National Archive of Criminal Justice Data website at http://www.icpsr.umich.edu/icpsrweb/NACJD/index.jsp.
NCJ236510