trading success principles floor trader pivots · 2016-04-06 · floor trader pivots as many of you...
TRANSCRIPT

Trading Success Principles
Floor Trader Pivots
Learning to Profit from Futures Trading with an Unfair Advantage!
™2.0

Floor Trader PIVOTS
As many of you already are aware, there is no secret or mystery behind what floor pivots are. I will show
you how I personally use them in my own trading and how it ties in beautifully with the E-Mini Success
Formula’s overall trading methodology.
Pivots are simply support and resistance levels that are calculated by floor traders using a
mathematical formula and are one of the most effective and simplest position entry (and exit) techniques
you can use.
Pivots have been around a long time and are readily available to all retail traders. Unfortunately, many
traders are not using pivots correctly; therefore, I want to show you not only the correct way to use them
for maximum effectiveness, but how I use them personally.
The Best Markets to Use the ‘Floor Trader Pivot Points’ Are:
E-Mini S&P (ES) futures contract
Mini-sized Dow (YM) futures contract
E-Mini NASDAQ (NQ) futures contract
E-Mini Russell (ER) futures contract
I also like to use the pivots on the corresponding stock index ETF’s via the SPY, DIA, QQQQ, and IWM –
along with some individual stocks.
Trading Success Principles
Floor Trader Pivots
© Trading Concepts, Inc. 2
What you also must remember is that pivot points are price-based (as opposed to indicator-based).
By the time most indicators (i.e. MACD, Stochastics, or RSI) generate a buy or a sell signal, the
market move is more than likely not only already under way, but also almost over.
By following the pivot points and knowing where they are, you will be getting into a trade well before the
indicator-based traders do.
This is especially true on choppy range-based days; on these types of days, the indicator-based
traders often get buy signals at (or near) the top of a move, and they often get sell signals near the
lows. I, on the other hand, typically will be closing out a position and looking for the next trade setup
when the indicator-based traders are getting their heads handed to them.
Floor pivots also can be used to help determine what type of trading day it’s going to be simply by looking
at how the markets react to the pivot levels once they reach them.
Let me quickly explain how this works on both trending and choppy range-based trading days.
Trading Success Principles
Floor Trader Pivots
© Trading Concepts, Inc. 3

Trending Days:
The market typically will move to a pivot level, then either:
(1) consolidates for 10 to 20 minutes and then continues to move in the direction of the trend, or
(2) blows right through these numbers without any hesitation.
On these types of days, it is best to wait for the market to move through the pivot level and then look to
(potentially) buy or sell the first pullback to that pivot level.
Choppy Range-Based Days:
The market usually will move up to a pivot level and either move back down off that level
immediately or just consolidate near that level before drifting back in the direction from which the market
originally came.
A lot of traders get whipsawed during these types of trading days and end up losing money. The
pivots are set up to be faded on these types of days and are one of the few profitable ways to
trade these narrow range, low volume, trading days.
Trading Success Principles
Floor Trader Pivots
© Trading Concepts, Inc. 4

Floor Pivot FormulasThe PIVOT Calculations and How They Look on a Chart:
(R stands for RESISTANCE, and S stands for SUPPORT)
R3: R1 + (High – Low)
R2: Pivot + (High – Low)
R1: 2 X Pivot – Low
PIVOT: (High + Low + Close)/3
S1: 2 X Pivot – High
S2: Pivot – (High-Low)
S3: S1 – (High – Low)
Trading Success Principles
Floor Trader Pivots
5

Getting Accurate HIGH, LOW, and
CLOSE Data for the Pivot Numbers
Simply obtain the previous trading session’s (9:30am ET to 4:15pm ET) HIGH, LOW, and CLOSE to
figure out these pivot levels. Use the settlement price for the CLOSE in this calculation.
If any of you are unsure of the previous trading session’s settlement price (the CLOSE), you can check it
for yourself on the ES, NQ, and YM at www.cmegroup.com; go to Equity Index and select the appropriate
Index Futures Contract and then look under the Prior Settle column. For the TF, you can go to
www.theice.com and find the Russell 2000 Settle price under Featured Products.
One way to make it even easier to get accurate HIGH, LOW, and CLOSE data is simply to set up a daily
chart with the markets of your choice.
For example, TradeStation users simply input the continuous data symbols, such as @ES.D, @NQ.D,
@YM.D and @TF.D (the ‘D’ stands for day session only 9:30am ET to 4:15pm ET).
To help make it even easier, I had software developed that automatically plots these floor pivots on my
charts each trading day. If you are interested in using this software to help make it easier for you too, simply
go to: www.tradingconceptsinc.com. The software I had created for this is called the TCI Floor Pivots.
Trading Success Principles
Floor Trader Pivots
© Trading Concepts, Inc. 6

A Quick Note Relating to These Pivots:
It is pretty rare for a stock index futures contract to reach the Daily R3 or S3 pivot levels. Many
bigger market rallies or selloffs reach these R3 and/or S3 levels, but many times, these levels
become the HIGH or LOW (or very near the HIGH or near the LOW) of the Day.
Using the floor trader pivots also will help you become more disciplined by the simple fact that you
already will have these pivot levels calculated before the market opens each day.
This will allow you to see in advance where potential support and resistance should occur during
the trading day. So, in respect to these floor pivots, you potentially will be able to place exact entries,
stops, or targets before a trade is even entered (assuming they line up with some of the other
trading strategies you are learning in this mentoring program).
Trading Success Principles
Floor Trader Pivots
© Trading Concepts, Inc. 7

Why Floor PIVOTS Work and
How They Can Help Give You an Edge in Your Trading
I would say the biggest reason why floor pivot support and resistance numbers work so well is simply
because a lot of traders (on and off the floor) watch these levels and use them in their trading –
therefore making this a self-fulfilling prophecy.
Alright, here are three other reasons why floor trader pivots tend to work so well:
1) As many of you know, floor traders in the pits look to scalp the market during the day, and one of the
trading tools they use is the floor pivots. Floor Traders use these pivot levels to base their entries
(and exits) and also to help gauge market price action.
2) Another reason these pivot levels work so well has to do with the majority of inexperienced traders off
the floor. Many traders rely (solely) on a bunch of technical ‘indicators’ for their trading decisions,
therefore, they oftentimes are getting in and out of their trades too late.
3) The overreliance on technical indicators by the majority of traders is definitely what helps the floor
pivots work so well. The bottom line is that price action is pure. Please remember, because all
market technical indicators are lagging, they all are the wrong indicators. Therefore, pivots are a
powerful tool because they are part of price action.
I hope you can see by now why Floor Trader PIVOTS can help give you an edge in your trading and how
they can be extremely useful in your overall trading plan.
Trading Success Principles
Floor Trader Pivots
8

How PIVOTS Can Work Beautifully in Conjunction
with Fibonacci Retracements
Since we already have discussed Fibonacci retracements, I’m sure you probably can guess how the
pivots can be used in conjunction with the retracements.
You’re right if you answered with the word… “Confluence!”
What I’m talking about here is when you draw your Fibonacci levels from various time frames (i.e. 3
minute, 30 minute, 60 minute, daily, and weekly charts), you can then take these Fibonacci levels
(confluence areas) and see if the pivot levels fall within these Fibonacci price zones.
Once you start to see these various support and resistance price levels (i.e. pivots and Fibonacci levels)
coming together, these areas can be very powerful buy and sell areas in which to take potential trades in
the market.
Let’s take a look at a few examples to show you what I’m talking about here.
Trading Success Principles
Floor Trader Pivots
© Trading Concepts, Inc. 9
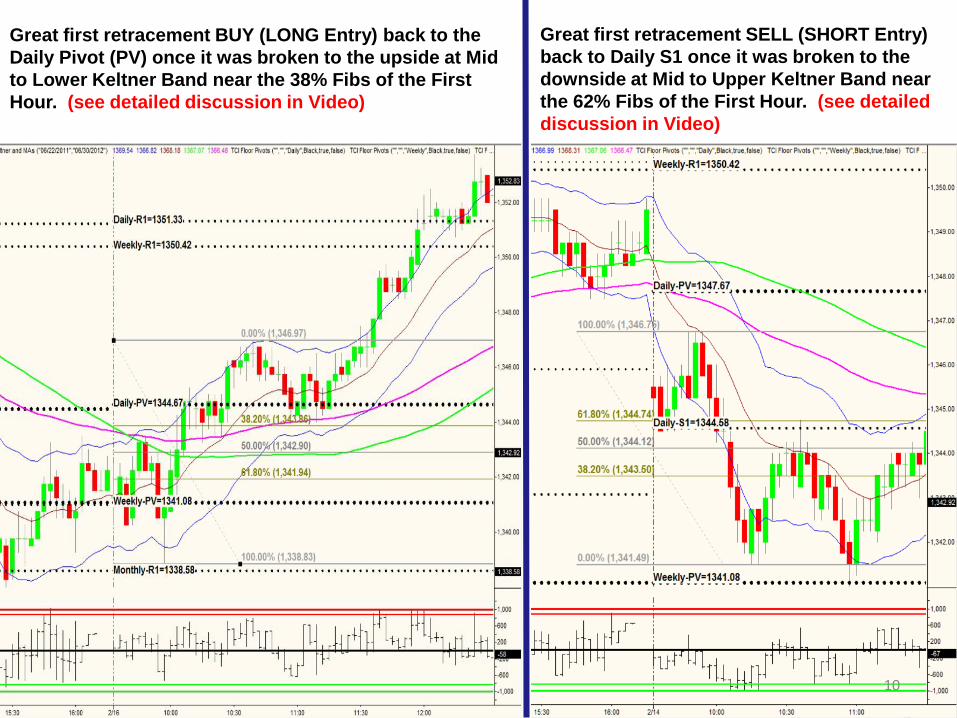
Great first retracement SELL (SHORT Entry)
back to Daily S1 once it was broken to the
downside at Mid to Upper Keltner Band near
the 62% Fibs of the First Hour. (see detailed
discussion in Video)
Great first retracement BUY (LONG Entry) back to the
Daily Pivot (PV) once it was broken to the upside at Mid
to Lower Keltner Band near the 38% Fibs of the First
Hour. (see detailed discussion in Video)
10

Trending Days:
The market typically will move to a pivot level, then either:
(1) consolidates for 10 to 20 minutes and then continues to move in the direction of the trend, or
(2) blows right through these numbers without any hesitation.
On these types of days, it is best to wait for the market to move through the pivot level and then look to
(potentially) buy or sell the first pullback to that pivot level.
11

Monthly R1 acted as SUPPORT holding the LOW of the Day.
Daily Pivot (PV) acted as great SUPPORT once broken to the upside and set up a beautiful First
Retracement LONG Entry at Mid to Lower Keltner Band.
Once Daily R1 was broken to the upside, it then acted as SUPPORT to further confirm continuation of the
UP Trend. (see detailed discussion in Video)
12
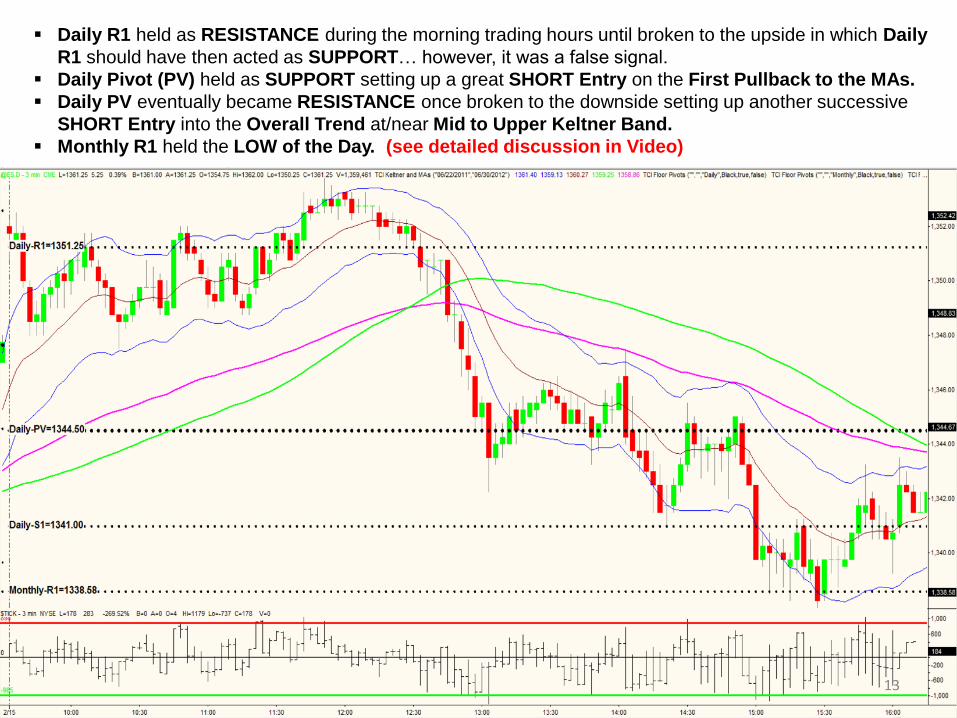
Daily R1 held as RESISTANCE during the morning trading hours until broken to the upside in which Daily
R1 should have then acted as SUPPORT… however, it was a false signal.
Daily Pivot (PV) held as SUPPORT setting up a great SHORT Entry on the First Pullback to the MAs.
Daily PV eventually became RESISTANCE once broken to the downside setting up another successive
SHORT Entry into the Overall Trend at/near Mid to Upper Keltner Band.
Monthly R1 held the LOW of the Day. (see detailed discussion in Video)
13

Daily S1 set up a great SHORT Entry on the First Pullback at Mid to Upper Keltner Band.
Daily S2 and Monthly R1 in confluence acted as SUPPORT (twice) and held the LOW of the Day.
Market rallied quickly off Monthly R1 in late afternoon trading all the way to the Daily Pivot (PV).
Daily PV ended up holding the HIGH of the Day. (see detailed discussion in Video)
14
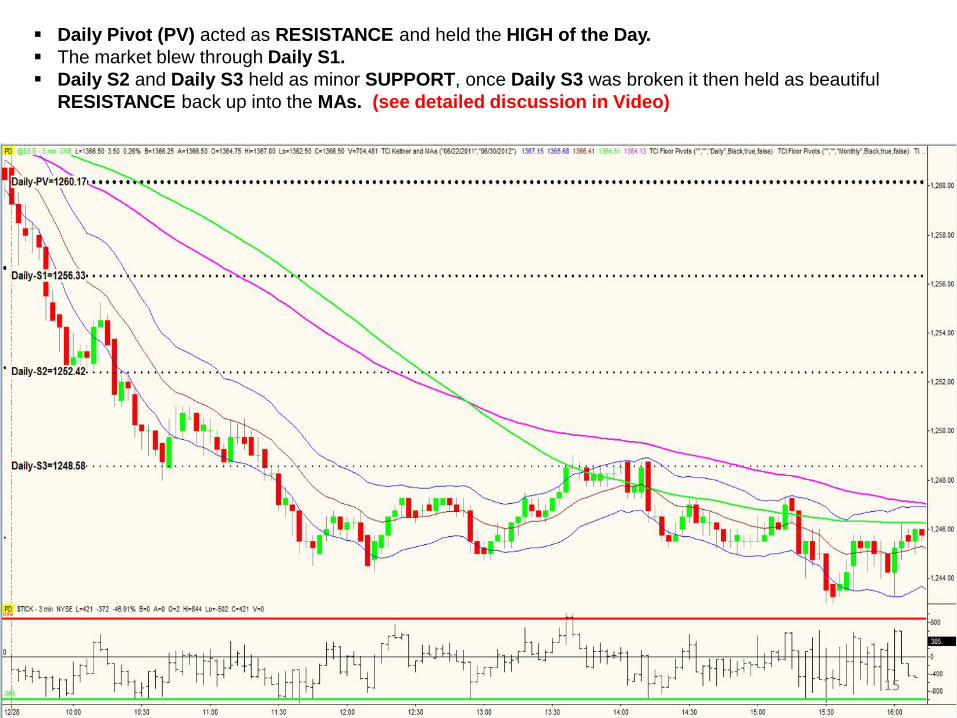
Daily Pivot (PV) acted as RESISTANCE and held the HIGH of the Day.
The market blew through Daily S1.
Daily S2 and Daily S3 held as minor SUPPORT, once Daily S3 was broken it then held as beautiful
RESISTANCE back up into the MAs. (see detailed discussion in Video)
15

Daily S1 held the LOW of the Day.
Daily Pivot (PV) acted as RESISTANCE once broken to the downside.
Daily Pivot (PV) then acted as SUPPORT once broken to the upside setting up a great LONG Entry at Mid
to Lower Keltner Band. (see detailed discussion in Video)
16

Monthly Pivot (PV) and Daily Pivot (PV) in confluence acting as RESISTANCE near the HIGH of the Day.
Daily S1 acted as SUPPORT mid-day until broken to the downside after the First Pullback to the MAs at
Time of Day when you would expect a Resumption of the Trend. (see detailed discussion in Video)
17

Monthly Pivot (PV) and Daily R1 initially held as SUPPORT right out of the gate.
Daily Pivot (PV) acted as RESISTANCE once broken to the downside and provided a great SHORT Entry
at Mid to Upper Keltner Band near the MAs at a Time of Day when you would expect a Resumption of
the Trend. (see detailed discussion in Video)
18

Daily S1 acting as RESISTANCE near the HIGH of the Day.
Daily S2 acting as RESISTANCE just above Mid to Upper Keltner Band once broken to the downside and
again as RESISTANCE at a Time of Day when you would expect a Resumption of the Trend.
Daily S3 held as LOW of the Day. (see detailed discussion in Video)
19

Daily S1 acted as great SUPPORT holding near the LOW of the Day.
Daily Pivot (PV) acted as RESISTANCE back up into the MAs.
Daily PV then acted as great SUPPORT once broken to the upside. (see detailed discussion in Video)
20

Choppy Range-Based Days:
The market usually will move up to a pivot level and either move back down off that level immediately
or just consolidate near that level before drifting back in the direction from which the market originally
came.
A lot of traders get whipsawed during these types of trading days and end up losing money. The
pivots are set up to be faded on these types of days and are one of the few profitable ways to
trade these narrow range, low volume, trading days.
21

Daily Pivot (PV) held the LOW of the Day.
Daily R1 acted as RESISTANCE and held the HIGH of the Day. (see detailed discussion in Video)
22

Daily R1 held as SUPPORT once it was broken to the upside and set up a great LONG Entry at Mid to
Lower Keltner Band.
Daily R2 acted as RESISTANCE and held as the HIGH of the Day. (see detailed discussion in Video)
23

Monthly Pivot (PV) and Daily R1 in confluence acting as RESISTANCE near the HIGH of the Day.
Daily Pivot acting as SUPPORT near the LOW of the Day. (see detailed discussion in Video)
24

Daily R1 held the HIGH of the Day (twice).
Daily Pivot (PV) held as major SUPPORT (twice) once broken to the upside.
(see detailed discussion in Video)
25

Let’s Quickly Sum up the Floor Pivots
One of the major reasons why the floor pivots work so well is because so many traders on and off the
floor use them, therefore creating a self-fulfilling prophecy (similar to Fibonacci retracements).
Price action is pure, and these pivot levels are part of price action. Traders that rely on technical
indicators will chase the market when the market already has moved halfway to three-quarters of the
move, whereas those of us who use these floor pivots as part of our overall trading plan already will
be in and will be ready to exit the market with a profit.
So, since none of us wants to get in and out of the daily market cycles too late – therefore piling up losses
by consistent whipsaws – we need to use the price action of pivot levels in our overall trading plan (as
you’ve seen in these examples). Having these pivot levels at your disposal before the open each
trading day will help greatly in your overall trading success.
Trading Success Principles
Floor Trader Pivots
© Trading Concepts, Inc. 26

No claim is made by the Trading Concepts, Inc. that the Futures trading
strategies shown here will result in profits and will not result in losses.
Futures trading may not be suitable for all recipients of this Training
Program. All comments, trading strategies, techniques, concepts and
methods shown within our Course are not and should not be construed as
an offer to buy or sell Futures Contracts – they are opinions based on
market observation and years of experience. Therefore, the thoughts
expressed are not guaranteed to produce profits in any way. All Opinions
are subject to change without notice. Each Futures trader/investor is
responsible for his/her own actions, if any. Your purchase of the Trading
Concepts Comprehensive EMINI SUCCESS FORMULA™ 2.0 Mentoring
Program constitutes your agreement to this disclaimer and exempts
Trading Concepts from any liability or litigation.
© Trading Concepts, Inc. 27

All rights reserved.
This Training Program, or parts thereof, may not be
reproduced in any form without the prior written
permission of Trading Concepts, Inc.
© Trading Concepts, Inc. 28