trade price continuation patterns - algorithmic … price...trade price continuation patterns thomas...
TRANSCRIPT

http://NeverLossTrading.com Page 1
Trade Price Continuation Patterns
Thomas Barmann of NeverLossTrading ….click to watch our presentation.
A trading system supports you in predicting the potential price move of an asset into the short- or
longer-term future. There are pre-stages and continuation-stages of price moves that can be
detected and portrait into the future by using mathematical equations. Financial markets are
complex and thus, simple mathematical models, e.g. moving-average-based systems or those
that are form-fitting the future development into a pre-defined-price-pattern (Elliott Wave), will
only give you a random chance of being on the right side of the trade.
Nature is expressing itself in complex systems. Take a look at a school of fish how it produces a
combining and releasing structure of constant movement.
Combining Structure of a School of Fish Releasing Structure of a School of Fish
So far we found no mathematical algorithms to describe or predict the formation of a school of
fish from an outside-in-perspective. If you are serious in understanding complex behaviors, you
need to look at the basic inter-correlations of the individual system interactors (individual units
interacting with each other), rather than the system itself.
Example: the crowd follows the leaders.
The financial markets represent a complex structure of interactors, where most, and in particular
the transactions we want to focus on, take place in a market: A medium that allows buyers and
sellers of a specific good or service to interact in order to facilitate an exchange. The price that
individuals pay during the transaction is determined by supply and demand.
As a consequence, a change in supply or demand will trigger a price change, which is
recordable and can be followed. This principle accounts for the transactions and price finding in
the key financial markets: Stock Market, Commodities, Treasuries, and Currencies.
Following this principle, we found ways to identify changes in supply and demand that indicate
setups, which lead with a high probability to a directional price move.
Today, we want to focus on our introductory system to algorithmic- or activity based trading:
TradeColors.com and demonstrate how you can predict the future price move of an asset with

http://NeverLossTrading.com Page 2
a high probability by following a price continuation pattern, portrait in an opposite candle color
sequence of two-same-color-candles.
“Trading now is made for me, counting colors one-two-three”
TradeColors.com Candle Color Sequence
With the help of an activity based algorithms, we paint the candles that belong to and upside
price move in blue and the ones belonging to a downside price move in red.
Your long-term goal as a trader or investor is to enter directional price moves at key turning
points; hence, we start entering a trade at the following conditions:
Short Entry:
After a blue candle or a sequence of blue candles, when two red candles are painted:
You enter a trade, when the low of the second red candle is surpassed.
Long Entry:
After a red candle or a sequence of red candles, when two blue candles are painted:
You enter a trade, when the high of the second red candle is surpassed.
In our first example, we take a popular stock: AAPL and see how it performed in its recent price
development according to the TradeColors.com conditions.

http://NeverLossTrading.com Page 3
The most recent daily chart for AAPL looks as follows:
Let us investigate the above chart from the left to right, checking for setups that fulfill our trade
entry rules:
A new set of two-same-color-candles with the high of a blue sequence surpassed in the
price development of next candle.
A new set of a red-candle-color-sequence, where the low is surpassed in the price
development of the next candle.
Background: When an institutional price move happens, market makers and other market
participants recognize a change in supply or demand and react by confirming the direction – and
we go with the price move - or by other institutions not buying or selling into the move and we
stay out of a directional trade by not getting our trade entry condition confirmed.

http://NeverLossTrading.com Page 4
AAPL Daily Chart: First Confirmed Trade-Color-Sequence Highlighted in Orange
We found our first trade setup sequence on May 15th, 2015 (highlighted by the orange rectangle)
and it was validated by the May 18th candle surpassing the high of the prior candle. From there,
we move on and see:
http://NeverLossTrading.com Page 5
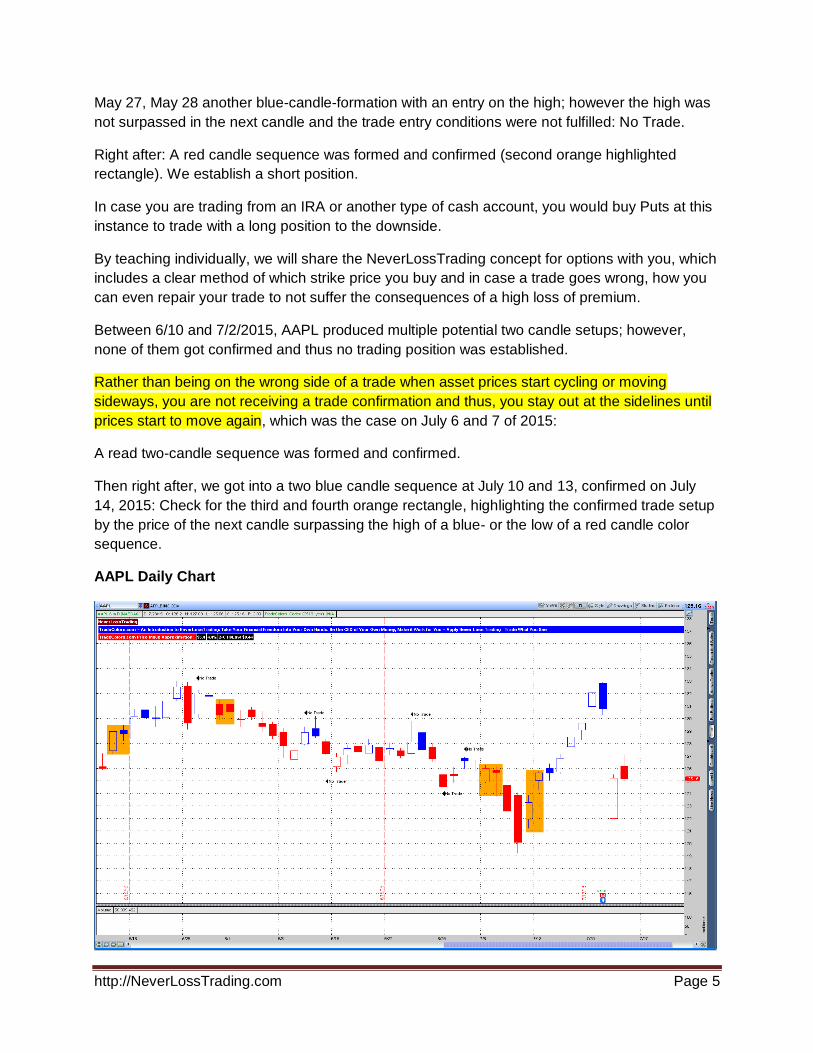
May 27, May 28 another blue-candle-formation with an entry on the high; however the high was
not surpassed in the next candle and the trade entry conditions were not fulfilled: No Trade.
Right after: A red candle sequence was formed and confirmed (second orange highlighted
rectangle). We establish a short position.
In case you are trading from an IRA or another type of cash account, you would buy Puts at this
instance to trade with a long position to the downside.
By teaching individually, we will share the NeverLossTrading concept for options with you, which
includes a clear method of which strike price you buy and in case a trade goes wrong, how you
can even repair your trade to not suffer the consequences of a high loss of premium.
Between 6/10 and 7/2/2015, AAPL produced multiple potential two candle setups; however,
none of them got confirmed and thus no trading position was established.
Rather than being on the wrong side of a trade when asset prices start cycling or moving
sideways, you are not receiving a trade confirmation and thus, you stay out at the sidelines until
prices start to move again, which was the case on July 6 and 7 of 2015:
A read two-candle sequence was formed and confirmed.
Then right after, we got into a two blue candle sequence at July 10 and 13, confirmed on July
14, 2015: Check for the third and fourth orange rectangle, highlighting the confirmed trade setup
by the price of the next candle surpassing the high of a blue- or the low of a red candle color
sequence.
AAPL Daily Chart

http://NeverLossTrading.com Page 6
Summary:
Following the TradeColors.com concept, we had four positive trades on AAPL in a period of
two months and six potential trade setups that mostly would have resulted in a loss, which we
were not dragged into by the trade entry conditions not being fulfilled.
This defines how to enter a trade; however a good trading system besides clearly rule based
entries, provides you with clearly defined exit rules. TradeColors.com lets us differentiate:
Target-1: For the momentum based trader, exiting after a pre-defined price move.
Target-2: Expected maximum price move for the momentum- and trend trader.
Trailing Stop: Catching a longer-term price move by trailing the stop or adjustment level (not
covered in this publication).
Stop: Exiting or adjusting the trade, when the price reaches a pre-defined price point.
In this article, we focus on momentum based trading: Let us go back in time, to the first trade on
May 15th 2015: The top left corner of our trading chart contains a dashboard with the following
information:
TradeColors.com Dashboard or Price Move Approximator
The first number represents the expected price move to target-1: $2.11, which would give you a
1.7% return on cash.
Next, we take the target-2 price information from 2-C Hi/Low = $2.33, which is an approximation
for the maximum expected price move. The second target is defined by the difference of the
absolute high – low of the two candle color sequence.
We highlight bot targets as blue dashed lines on the chart.
When you compare the two numbers, the expected- and maximum expected price move are
very close to each other, which is usually not the case. You will see in the actual price
development, why having this information was very crucial to harvest at the full potential of the
price move and not getting stopped for a lower return in the duration of the move.
To give the price an adequate wiggle room to come to target, the stop or trade adjustment line is
defined by subtracting 20% of the price move approximation from the low of the second blue
candle.
Stop/Adjustment Calculation: Trade candle low ($128.21) – 0.2 x $2.11 = $127.79
The stop or price-adjustment-level is put as a red dashed line on the chart.
A trading system shall deliver repetitive trade setups with defined entries, defined positive exits
and defined stop- or trade adjustment levels. Let us check how things worked out:

http://NeverLossTrading.com Page 7
AAPL Price Target and Stop/Adjustment Level for the Trade
When signing up for our mentorship, you will receive computer programs to support you in
getting all those calculations done in seconds. Before we go there, let us give you the details:
For the trade entry, we add 2% of the price move approximation (four cents) to the high of the
trade initiation candle. Following this principle, allows you to auto-deliver your order as Buy-
Stop-OCO, with no need for you to sit in front of your computer at market opening.
Buy-Stop: $129.49 + 2% of $2.11 = $129.53 (you only trade when the price reaches this level)
Target-1: $130.60
Stop/Adjustment: $127.79
Reward: 1.6% on cash.
Risk: 1.3% on cash; however, you can learn to reduce the risk drastically by applying trade
adjustment methods.
In your 4-hours of individual training, we leave it up to you to decide if you want to learn to
operate with trade adjustment methods or rather focus on exiting the trade at the stop. There are
advantages and disadvantages to both ways of trading and we share the financial and time
based models to give you the background for a sound decision making.
Making your life easy, we share the following model with you, where you just add the trade
candle information.

http://NeverLossTrading.com Page 8
Trade Evaluation Model for TradeColors.com Setups
After you populated three entry fields, you are getting a feedback on the trade setup you picked,
including a calculation for a potential positioning size in relation to your overall account holding:
in this cases $13,989 for stock trading or $1,908, when trading with a Call options.
How did the trade pan out? The following chart will show: The price for AAPL moved right
to the approximated target-lines and then reversed.
Why was did this happen?
Institutional sell orders increased the supply side of the trade and prices dropped.
Key Findings:
- Directional price moves do not last forever.
- The momentum trading to target-1 has a higher probability for success.
- The method of trailing stops to target-2 was not explained yet.
- We choose our position size according to the reward/risk level by using the above model.
- Target-1 shall be reached in next 1-3 candles, which gives you another hint, for a time
based exit, if your target is not reached after five same color candles.
- When you trade for shorter-term targets, you are in need for a trade finder: giving you
stocks with the favored price setup.
- Similar models and concept are available for Futures and FOREX Trading.
TradeColors.com Odds Ratio and Position Sizing
Risky Trades: 1/2-Lot or not Trade; Usual Setups: 1-Lot; Favorable Setups: 2-Lots; Home Run Setups: 4-Lots.
Stock Trade Evaluation Option Trade Evaluation
Stock Symbol AAPL Input Stock Symbol AAPL Auto Selected from Stock Setup
Trade Direction up Select Put or Call Option Call Auto Selected from Stock Setup
Price Direction In Price Containment Area Select Time to Expiration (days) 35 Input
Delta (enter positive values) 0.38 Input
Approximated Price Move 2.11$ Input Price for the Option 1.06$ Calculated
Trade Candle High 129.49$ Input Bid/Ask Spread 0.02$ Calculated
Trade Candle Low 128.21$ Input
Entry Price 129.53$ Calculated
Target-1 (no hindrance) 131.60$ Calculated
Stop or Adjustment Price 127.79$ Calculated Critical Share Price Point (Stop) 127.79$ Calculated
Option Price at Target 1.83$ Calculated
Price Move to Target 2.07$ Calculated Estimated Reward/Contract 72% Calculated
Price Move to Stop 1.74$ Calculated Approximated Risk/Contract 78% Calculated
Risk/Unit 1.3% Calculated Reward/Risk Ratio 0.9:1 Calculated
Stock Trade Evaluation Results Option Trade Evaluation Results
Odds Evaluation Cleared Risk Management Option Price Evaluation Acceptable
SPU Evaluation Check Your Stop Placement: Seems Tight Time Evaluation Enough Time
Odds Ratio 1.8:1 Odds Ratio 1.4:1 1.4
Potential Lot Size 1-Lot; however, on lower returns Potential Lot Size 1-Lot
Lot Equation Lot Equation
Account Size 70,000$ Input Dedicated Option Budget 10,000$ Input
Assumed Active Positions to Hold 5 Input Assumed Active Positions to Hold 5 Input
Average Lot Size (calculated): 14,000$ Calculated Average Lot Size 2,000$ Calculated
1-Lot; however, on lower returns of AAPL equates to: 108 Shares 1-Lot of AAPL equates to: 18 Contracts
Investment Amount: 13,989$ Calculated Investment Amount 1,908$ Calculated
Trade Reward at 108 Shares 223$ 1.6% Trade Reward at 18 Contracts 1,378$ 72.2%
Trade Risk at 108 Shares 188$ 1.3% Trade Risk at 18 Contracts 1,479$ 77.5%

http://NeverLossTrading.com Page 9
AAPL First Trade, May 18 – 21, 2015
How to stay engaged by finding similar trades?
We know your pain of finding high probability trade setups; hence, we are offering three
solutions:
A) Subscription to the referring NLT Alert ($99 for the TradeColors.com Alert).
B) Scans with NLT Top-Line
C) Watch List Evaluation with TradeColors.com
The TradeColors.com watch list with indicators is the new addition, helping you to evaluate
your preferred assets, highlighting potential trade setups: Up-Sequence as +1 and Down
Sequence: -1.
A simple click on the column allows you to filter assets, which triggered a two candle color
sequence. The above table shows one daily and one 1-hour signal for the observed currencies:
In the chosen Focus Currency list, the Canadian Dollar Future showed a one-hour short signal
setup, pointed out by a -1 in the first column. On a daily basis, the pair GBP/USD and the future
for the British Pound show a short signal.
http://NeverLossTrading.com Page 10
When you sign up with us, we program up to four individual time frames for you to filter for
assets with our TradeColors.com candle sequence.
Taking a look at a Focus Stock List
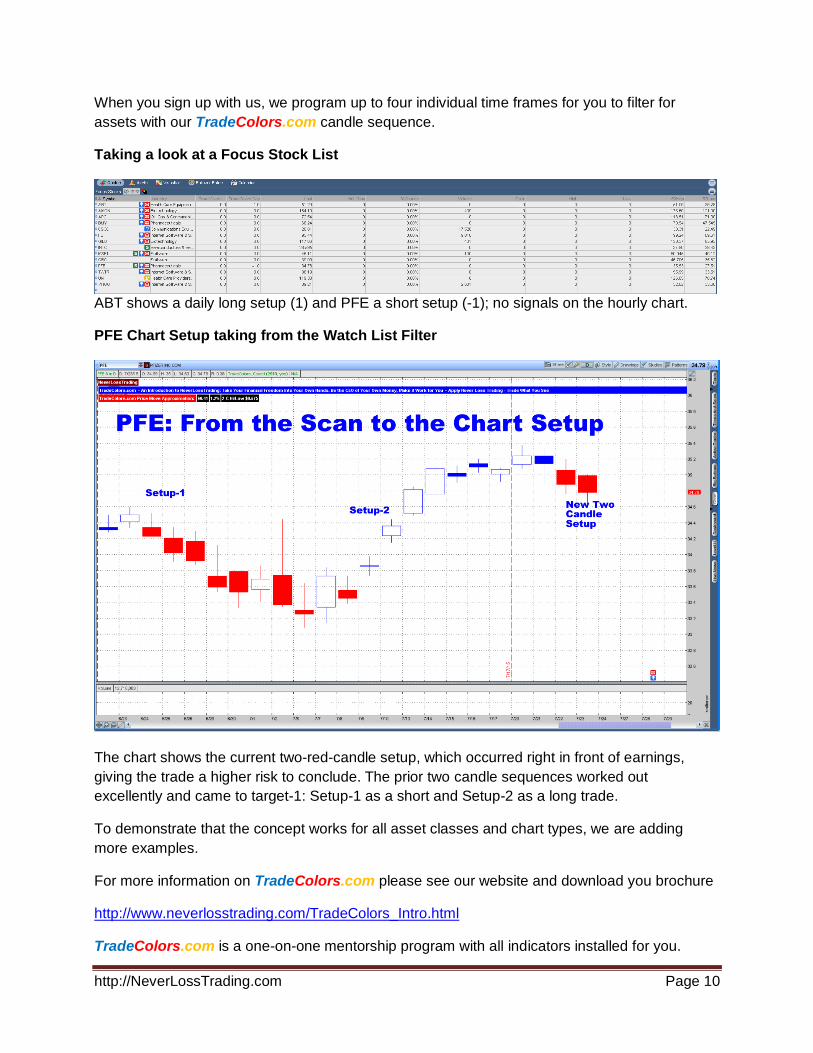
ABT shows a daily long setup (1) and PFE a short setup (-1); no signals on the hourly chart.
PFE Chart Setup taking from the Watch List Filter
The chart shows the current two-red-candle setup, which occurred right in front of earnings,
giving the trade a higher risk to conclude. The prior two candle sequences worked out
excellently and came to target-1: Setup-1 as a short and Setup-2 as a long trade.
To demonstrate that the concept works for all asset classes and chart types, we are adding
more examples.
For more information on TradeColors.com please see our website and download you brochure
http://www.neverlosstrading.com/TradeColors_Intro.html
TradeColors.com is a one-on-one mentorship program with all indicators installed for you.

http://NeverLossTrading.com Page 11
Additional examples, showing you the concept works for all asset classes and chart setups:
EUR/USD Daily Chart
EUR/USD on a 1-Hour Chart

http://NeverLossTrading.com Page 12
EUR/USD 1600-Tick Chart: Showing multiple trades in a very short period of time
You surely see the power of such system in helping you by making sound trading decisions.
In addition, TradeColors.com allows you to upgrade to NLT Top-Line or NLT HF, getting your
paid tuition fully accounted and discounted from the sales price of the upgrade.
Bellow, a quick comparison of the two different systems:
Combined with the TradeColors.com comes a one-month free subscription to the NLT
Continuation Pattern Alert = TradeColors.com Alert, where we spell out trade potentials for
stocks, futures and FOREX pairs, helping you to find your preferred trade setups at ease. When
http://NeverLossTrading.com Page 13
the 30-day-trial-period is over, you can sign up to the NLT Continuation Pattern Alerts =
TradeColors.com alerts, on a month-to-month basis for a fee of $99.
“Trading now is made for me, counting colors one-two-three”
“Take out the high or take out the low, this is the direction, I will go”
Do you feel, you can follow such rules?
Long: Buy at a Specified Price Level, when the HIGH of the second blue color candle is surpassed by the price development of the next candle.
Short: Sell at a Specified Price Level, when the LOW of the second red color candle is surpassed by the price development of the next candle.
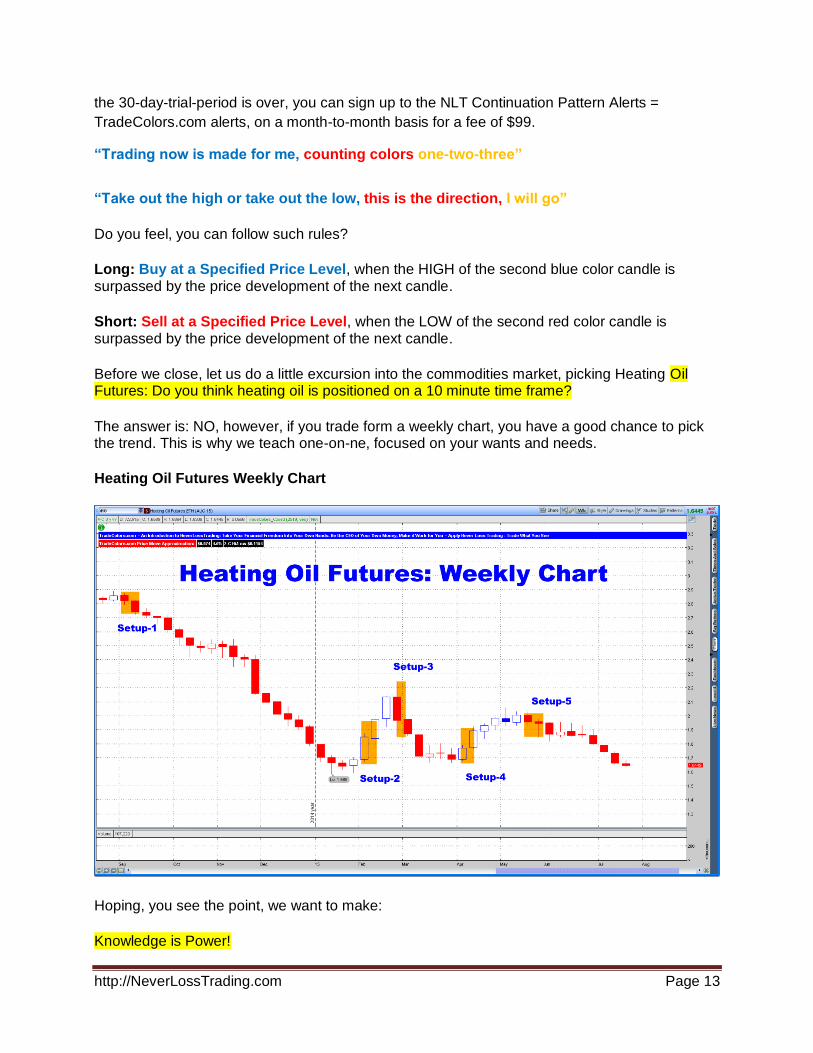
Before we close, let us do a little excursion into the commodities market, picking Heating Oil Futures: Do you think heating oil is positioned on a 10 minute time frame?
The answer is: NO, however, if you trade form a weekly chart, you have a good chance to pick the trend. This is why we teach one-on-ne, focused on your wants and needs.
Heating Oil Futures Weekly Chart
Hoping, you see the point, we want to make:
Knowledge is Power!

http://NeverLossTrading.com Page 14
If you are already a TradeColors.com user and you want to add the new features: Watch List Indicators, Position Sizing Model, Price Move Approximator and an hour of training to your account, you can do so for a fee of $497.
Sign up or schedule your personal consulting hour:
Call: +1 866 455 4520 or [email protected]
If you are not yet part of our trading tips and free webinars, please sign up here and we keep you up-to-date….sign up here.
Watch our exciting online presentation Trading Price Continuation Patterns…click here.
We are looking forward to hearing back from you,
Good trading,
Thomas Barmann
NeverLossTrading
A Division of Nobel Living, LLC
401 E. Las Olas Blvd. – Suite 1400
Fort Lauderdale, FL 33301
Disclaimer
This publication is designed to provide accurate and authoritative information in regard to the subject matter covered. It is sold with the understanding
that the publisher is not engaged in rendering legal, financial advice, accounting, or other professional service. If legal advice or other expert assistance
is required, the services of a competent professional person should be sought.
Following the rules of the SEC (Security Exchange Commission), we advise all readers that it should not be assumed that present or future
performance of applying NeverLossTrading (a division of Nobel Living, LLC) would be profitable or equal the performance of our examples. The reader
should recognize that the risk of trading securities, stocks, options, futures can be substantial. Customers must consider all relevant risk factors,
including their own personal financial situation before trading. In our teaching of NeverLossTrading, in our books, newsletters, webinars and our
involvement in the Investment Clubs, neither NOBEL Living, LLC, the parent company of NeverLossTrading, nor any of the speakers, staff or members
act as stockbrokers, broker dealers, or registered investment advisers. We worked out trading concepts we use on a daily basis and share them
through education with our readers, members and clients.