trade credit financial distress
DESCRIPTION
fianaceTRANSCRIPT

An Empirical Analysis of the Effectof Financial Distress on Trade Credit
Carlos A. Molina and Lorenzo A. Preve∗
This paper studies the use of supplier’s trade credit by firms in financial distress. Trade creditrepresents a large portion of firms’ short-term financing and plays an important role in financialdistress. We find that firms in financial distress use a significantly larger amount of trade credit tosubstitute for alternative sources of financing. Firms that are smaller, with less market power, andwith more unique products tend to use more trade credit financing when in distress. We also findthat firms that significantly increase their trade payables when in financial distress, experience anadditional drop of at least 11% in sales and profitability growth over the previously documented21% average drop for financially troubled firms.
When firms enter financial distress, their ability to raise financing is severely curtailed asthe fear of default prevents investors from extending additional financing. Trade credit, thefinancing provided by suppliers in commercial transactions, is a usual source of short-termfinancing and is largely employed by corporations.1 Previous research has indicated that tradecredit substitutes for financial credit when the latter is unavailable. Meltzer (1960) reports thattrade credit increases under tight monetary conditions, while Petersen and Rajan (1997) find anincrease in the use of trade credit by smaller firms with weaker banking relations. Love, Preve,and Sarria-Allende (2007) determine that trade credit increases during widespread economicfinancial crises. Interestingly enough, however, the literature states that firms in financial distressare likely to experience problems with their suppliers. Baxter (1967) indicates that financiallydistressed firms may have difficulty obtaining trade credit. Altman (1984) finds that suppliers maybe reluctant to sell their products to distressed firms “except under fairly significant restrictionsand higher costs, e.g. cash on delivery.” Andrade and Kaplan (1998) report that one-third of thedistressed firms in their sample reported difficulties with their suppliers.2 None of these papers,however, quantifies the effect of financial distress on trade credit.
In this paper, we seek to: 1) analyze the effect of financial distress on the use of trade creditas a substitute for alternative sources of financing, 2) quantify the effect of increasing the use of
We would like to thank William G. Christie (Editor), an anonymous referee, Andres Almazan, Vipin Agrawal, Gary W.Emery, Jay Hartzell, Ross Jennings, Bob Mooradian, Bob Parrino, Ramesh Rao, Sheridan Titman, Roberto Wessels,and seminar participants at the University of Texas at Austin, IAE—Universidad Austral, the University of Texas at SanAntonio, IESA, Universidad Torcuato Di Tella, the 2009 FMA meeting, and the 2010 World Finance Conference. Theremaining errors are our own. This paper is derived from Lorenzo Preve’s dissertation at the University of Texas at Austin,and was previously circulated under the title “Financial Distress and Trade Credit: an Empirical Analysis.”
∗Carlos A. Molina is a Professor at Instituto de Estudios Superiores de Administracion (IESA), Caracas, Venezuela.Lorenzo A. Preve is a Professor at IAE Business School at the Universidad Austral, Buenos Aires, Argentina.1 In 1994, there was $1.94 in trade credit for each $1 in short-term debt in the US economy. Moreover, De Blasio (2005)reports that Italy employs a greater use of trade credit, representing 25% of Italian firms’ assets.2 The business press also discusses this issue. Kimberley Blanton’s article in The Boston Globe on Thursday, December 4,1997 (City Edition) cites: “. . . the Chapter 11 filing in US Bankruptcy Court in Boston by Waltham-based Molten Metalwas triggered when suppliers refused to extend additional credit to the company, which had already slowed payment of itsbills.” [Copyright 1997 – Globe Newspaper Company – The Boston Globe – December 4, 1997, Thursday, City Edition].
Financial Management • Spring 2012 • pages 187 - 205

188 Financial Management � Spring 2012
trade credit on the costs of financial distress, and 3) study the firms’ characteristics that increasethe probability of additional use of trade credit when encountering financial distress.
Our results suggest that firms in financial distress use a significantly larger amount of tradecredit than healthy ones. This result is robust to different specifications. To increase our under-standing regarding the role of trade credit in financial distress, we investigate whether there is asubstitution of trade credit for other sources of financing. More specifically, we measure tradecredit as a part of the firm’s asset financing and study its effects relative to equity and financialdebt when firms enter financial distress. We determine that, in general, firms in financial distresssubstitute financial debt and equity with supplier’s trade credit, consistent with Atanasova (2007)who finds that credit constrained firms tend to use more trade credit to replace bank credit.
We also measure the effect of greater use of trade credit financing on the performance of firmsin financial distress. Given that trade credit is an expensive source of financing, we expect firmsin financial distress, using more trade credit to finance their operations, to show an additionaldrop in performance reflecting this higher cost.3 Our results confirm the weaker performance offirms in financial distress documented in the literature, but they also demonstrate a significantlylarger drop in performance when the firm significantly increases its use of trade credit as asource of financing (Altman, 1984; Opler and Titman, 1994; Andrade and Kaplan, 1998). Afirm that experiences financial distress will have a drop in operating income of 28% (a drop insales of 21%), but if the firm increases its trade credit financing by an amount larger than the95th percentile of the sample, operating income will drop an additional 11% (sales will dropan extra 14%). The results obtained using stock returns, as a measure of performance, are alsoconsistent. In other words, increases in trade credit account for more than one-third of the dropin performance of firms in financial distress. These results complement the ones presented byMolina and Preve (2009) that measured the effect on performance for firms that decrease the useof trade receivables in financial distress.
In addition, we provide evidence to identify whether the increase in trade credit observed forfirms in financial distress is due to an increase in the offer of credit from suppliers or to anincrease in the demand of credit from the distressed firm. More specifically, we investigate thecross-sectional differences of the effects of financial distress on trade credit using the theoreticalframework provided by the theories of trade credit. Schwartz (1974), Emery (1984), Smith (1987),Biais and Gollier (1997), Frank and Maksimovic (2005), and Cunat (2007) find that firms withbetter access to financial credit will utilize it instead of the more expensive trade credit. Burkartand Ellingsen (2004) suggest that suppliers increase trade credit financing to their clients becausethe goods they sell, being less deployable than cash, constitute better collateral. Biais and Gollier(1997) and Smith (1987) posit the asymmetry in the cost of assessing buyers’ creditworthinessas an explanation for the existence of trade credit. Suppliers are in a better position than financialcreditors to assess the creditworthiness of more obscure or unique firms.
We examine these issues by separating firms according to several characteristics that act as aproxy to these theories of trade credit. We first split the sample according to firm size that acts asa proxy for the quality of management, corporate governance, the quality of reported information,opaqueness, and access to financial credit. In addition, we use a subsample of retail firms as theycommercialize easily deployable finished goods that are quickly converted into cash and cannotbe repossessed by the suppliers. Consistent with previous arguments, we find that the impact offinancial distress on trade credit is significantly and economically less important for larger firms.Moreover, for retailers, these firms are less likely to substitute financial debt for trade credit.
3 A usual condition reported in the literature is 2/10 net 30, whose annual cost exceeds 40% (Wilner, 2000; Ng, Smith,and Smith, 1999).
Molina & Preve � Effect of Financial Distress on Trade Credit 189
These results suggest that firms will tend to use financial credit whenever possible and use tradecredit when other sources of financing are unavailable implying that trade credit ranks lower thanother traditional sources of financing in the pecking order of financing choices. Furthermore,these results imply that an increase in trade credit in financial distress is not a first-best solution.Rather, firms in financial distress choose it as a less than optimal solution that might have animportant associated cost.
Our paper contributes to the literature that examines how financial distress affects the decisionsof firms by examining the impact of their use of supplier’s credit.4 We also explicitly provide anestimate for the cost of increasing the use of trade credit financing when firms face financialdistress that aids in understanding its associated costs. In addition, our paper contributes to thetrade credit literature by providing empirical evidence for some of the theories of trade credit ina situation where the client is in financial distress.
The remainder of the paper proceeds as follows. Section I presents the data and providesselected summary statistics. Section II discusses the effects of financial distress on trade credit.Section III analyzes the costs derived from using more trade credit financing in financial distress,while Section IV studies the cross sectional variations of the use of trade credit in financialdistress. Finally, Section V presents our conclusions and the implications of these results, alongwith some ideas for future research.
I. Data
The sample considers firms in Compustat for which trade credit data is available from 1978to 2000. We drop all firms with net sales lower than $1 million and firms that do not reportpositive cost of goods sold. We also discard all companies in the banking, insurance, real estate,and trading industries (standard industrial classifications [SICs] between 6000 and 6999) and thenonclassifiable establishments (SICs between 9995 and 9999).5 The total number of firm-yearobservations for which our dependent variable is present from 1978 to 2000 is around 120,000.Missing observations in other variables diminish the number of observations in our regressions.We have been conservative in our approach to removing outliers so we do not affect the evidenceof firms in financial distress. We eliminated only the most extreme observations in each variable.6
Table I presents some selected descriptive statistics of our data set reporting the mean, standarddeviation, and the 25th, 50th, and 75th percentiles of the main variables used throughout thepaper.
II. The Effect of Financial Distress on Trade Credit Financing
In this section, we analyze the behavior of trade credit when firms enter financial distress. Weestimate the following model:
(TPay/CGS)it = αi + β financial distressit−1+γ Xit + εit. (1)
4 For a complete literature review regarding the financial distress literature, see Senbet and Seward (1995).5 The financial industries eliminated correspond to SIC codes between 6000 and 6999, and 9995 and 9999, and Famaand French (1997) industry numbers 44, 45, 46, and 47. For Fama and French’s (1997) 48-industry classification see:http://mba.tuck.dartmouth.edu/pages/faculty/ken.french/.6 We alternatively followed Hadi’s (1992, 1994) method to treat our outliers with no change in our results.

190 Financial Management � Spring 2012
Table I. Summary Statistic
The sample consists of 85,727 firm-year observations in the base case that includes firms from Compustatthat have trade payables data available from 1978 to 2000. The data excludes SICs 6,000-6,999 and 9,995-9,999. Net Sales and Total Assets are in US$ millions. Trade Credit on Cost of Goods Sold is the ratio oftrade payables on the daily cost of goods sold, measured in days. Trade Receivables on Sales is the ratio oftrade receivables over daily sales and is measured in days. Trade Credit on Total Assets is the ratio of tradepayables to total assets. Financial Distresst−1 is a dummy variable equal to one if the firm is in distress att−1 according to the Asquith et al.’s (1994) definition. Financial Leverage is the ratio of the book valueof total debt to the book value of debt plus the book value of equity. The book value of equity is equal toTotal Assets – Total Liabilities – Preferred Stocks + Deferred Taxes + Convertible Debt. Sales Growth isthe growth of sales. Years in Financial Distress counts the number of years that a firm is in distress, and ismeasured only in those cases in which a firm enters distress at some point in time during the time span ofthe research period.
Mean Percentile Percentile Percentile Standard25 50 75 Deviation
Net sales (MM US$) 1,388.09 43.10 143.76 610.45 6,251.34Total assets (MM US$) 1,536.51 39.81 127.77 581.80 7,266.12Trade credit on CGS (days) 55.26 25.20 38.60 59.44 69.45Trade receivables on sales (days) 59.27 35.12 53.81 74.30 45.67Trade credit on total assets 0.10 0.04 0.08 0.12 0.08Financial distresst−1 0.11 0.00 0.00 0.00 0.32Financial leverage 0.25 0.09 0.24 0.38 0.19Sales growth 0.25 0.01 0.11 0.25 1.27Years in financial distress 0.57 0.00 0.00 1.00 1.18
TPay/CGS is the ratio of trade payables to cost of goods sold, measured in days, and definedas: TPay/CGS = (trade payables/cost of goods sold) × 360. αi is a vector of dummy variables,financial distress is a dummy variable equal to one if the firm is in financial distress in a particularyear, and zero otherwise, and X is a matrix of controls.
We define financial distress with the measure used by Asquith, Gertner, and Sharfstein (1994)based on a coverage ratio. A firm is considered to be in financial distress if its coverage ratio(defined as earnings before interest, taxes, depreciations and amortization (EBITDA)/interestexpenses) is less than one for two consecutive years or if it is below 0.8 in any given year. Firmsin financial distress are identified with the dummy variable defined above. To allow financialdistress to have effects on trade credit, we use the first lag of the dummy variable.7
Our model includes a matrix of control variables. We use control variables for size and salesgrowth. Larger firms and firms that are in industries in which they can choose among a largenumber of clients are likely to enforce their market power in a trade relation and enjoy a bar-gaining advantage (Wilner, 2000). Firms that experience a sharp increase or decrease in sales forexogenous reasons may experience a change in their trade payables. They may be perceived as arapidly growing client by the suppliers and this might induce a positive bias in their incentives
7 As in Molina and Preve (2009), we test alternative definitions of financial distress. Specifically, we use a definitionthat classifies a firm in financial distress if Financial Distress = 1 and the firm is in the two top deciles of leverage forits industry in that year. This definition is more likely to capture firms in distress because of high leverage. Additionally,we identify those firms classified in default according to the rating measures of Standard & Poors (S&P). Re-runningEquation (1) under these alternative definitions of distress does not affect the results (results available upon request).

Molina & Preve � Effect of Financial Distress on Trade Credit 191
to offer more trade credit, or the opposite may be true in the case of steep declines in sales. Weuse the log of Assets or the Log of Sales as size controls. We define sales growth as (Salest –Salest−1)/Salest−1.
We estimate Equation (1) using both fixed effects and pooled ordinary least squares (OLS)models.8 The results are available in Table II, Panel A. Column (1) reports the results for the fixedeffects model. The coefficient on the dummy variable for firms in financial distress is positiveand significant, implying that financially distressed firms use, on average, 5.2 more days to repaytheir trade payables than when they were not in financial distress. We also notice that growingfirms tend to use more days to repay their suppliers, consistent with our prior expectations. InColumn (2), we include, as additional controls, the number of years the firm spends in financialdistress and its squared value. The results in Column (2) suggest that financing to firms infinancial distress grows during the time in distress. Every additional year that the firm stays infinancial distress, tends to further slow its payments to suppliers.
Columns (3) and (4) of Panel A, repeat the analysis of the first two columns using a pooledOLS model. In this model, the results are even stronger. The positive coefficient for the financialdistress dummy suggests that firms in financial distress use, on average, 17.5 extra days of tradecredit from suppliers than firms with no financial problems. Under this alternative specification,every year in distress adds extra trade credit, but this effect weakens with time in distress.
Note that we scale trade payables by cost of goods sold (CGS). The usual choices to scalethis variable in the literature are CGS or total assets. Under normal business conditions, bothmeasures are adequate and derive similar results. In the case of firms entering financial distress,however, we prefer to use CGS instead of assets. The main reason for this choice is that tradepayables are generated by CGS and not by assets. Trade payables are generated by the firm’spurchases on credit to suppliers, which are typically unobservable in large databases and usuallyreplaced by CGS as a proxy. When a firm enters financial distress, in some cases, it faces adecrease in sales, purchases, and CGS that generates a decrease in trade payables. This mechanicalcorrelation is what we capture with our choice of dependent variable. Alternatively, asset behaviorin financial distress is less predictable. Some firms might sell assets, while others may elect toretain them. In any case, CGS and total assets for firms in our sample do not change significantlyaround the financial distress event alleviating any concern regarding our dependent variableconstruction.
The results in Panel A are not implying that suppliers voluntarily offer to extend longer termsof trade credit to financially distressed clients. The evidence suggests that whether the supplieroffers additional days to pay the bill or the client “stretches” the payments, the days takento repay suppliers increase for financially distressed clients. This result is consistent with thefindings in Hill, Kelly, and Highfield (2010) who report that firms in financial distress tend tobe more aggressive in their working capital management, collecting faster from clients, keepingless inventory, and stretching payments to suppliers. An alternative possible interpretation of theresults in this panel is that it could be the case that firms in financial distress accumulate debt withsuppliers by just not paying them anymore. This, in turn, may cause the supplier to stop supplyingthem as a response. We only use short-term payables in our definition of trade payables excludinglong-term payables and payables under litigation for late payment. One can argue that the resultsare caused by a mechanical decrease of sales and the cost of goods sold (the denominator) in
8 The pooled OLS model includes Fama and French (1997) industry dummies and year dummies. The standard errorsin these models are White’s (1980) heteroskedasticity-consistent, and are clustered by firm in the pooled OLS model toallow for an unspecified correlation between observations of the same firm in different years.

192 Financial Management � Spring 2012
Tab
leII.
Tra
de
Cre
dit
and
Fin
anci
alD
istr
ess
Thi
sta
ble
repo
rts
regr
essi
ons
oftr
ade
cred
iton
afi
nanc
ial
dist
ress
dum
my
and
cont
rols
for
diff
eren
tsp
ecif
icat
ions
.In
Pane
lA
,we
test
the
effe
ctof
fina
ncia
ldi
stre
sson
trad
ecr
edit
.The
depe
nden
tvar
iabl
eis
the
rati
oof
Tra
dePa
yabl
esto
the
Dai
lyC
osto
fG
oods
Sol
d(T
Pay/
CG
S)
inte
rpre
ted
asa
mea
sure
ofda
ysof
fina
ncin
gre
ceiv
edfr
omsu
ppli
ers.
The
fina
ncia
ldis
tres
sdu
mm
y(F
inan
cial
Dis
tres
s t−1
)is
equa
lto
one
ifth
efi
rmis
indi
stre
ssat
t−1
acco
rdin
gto
the
Asq
uith
etal
.’s(1
994)
defi
niti
on.
Yea
rsin
Fina
ncia
lD
istr
ess
coun
tsho
wm
any
year
sth
efi
rmha
ssp
ent
infi
nanc
ial
dist
ress
.W
eco
nsid
erit
inli
near
and
quad
rati
cte
rms.
Sal
esG
row
thm
easu
res
the
firs
tdif
fere
nce
insa
les
scal
edby
sale
s.L
ogA
sset
san
dL
ogS
ales
are
the
natu
rall
ogof
tota
lass
ets
and
sale
s,re
spec
tivel
y.In
Pane
lB
,we
test
the
subs
titu
tion
effe
ctbe
twee
ntr
ade
cred
itan
dot
her
alte
rnat
ive
sour
ces
offi
nanc
ing.
The
depe
nden
tva
riab
les
are:
1)T
Pay/
Ath
atm
easu
res
the
trad
ecr
edit
scal
edby
asse
ts,2
)T
Pay/
Eth
atm
easu
res
trad
ecr
edit
onth
ebo
okva
lue
ofeq
uity
,and
3)T
Pay/
FD
that
mea
sure
str
ade
cred
iton
the
book
valu
eof
fina
ncia
lde
bt.
The
sam
ple
isth
efu
llsa
mpl
efr
omC
ompu
stat
from
1980
to20
00.
Reg
ress
ions
inC
olum
ns[1
],[2
],[5
],[7
],an
d[9
]co
nsid
erfi
rmfi
xed
effe
cts.
Reg
ress
ions
inC
olum
ns[3
],[4
],[6
],[8
],an
d[1
0]ar
ePo
oled
OL
Sm
odel
scl
uste
red
byfi
rms,
incl
udin
gFa
ma
and
Fren
ch(1
997)
indu
stry
dum
mie
s.A
llre
gres
sion
sin
clud
ea
cons
tant
;coe
ffic
ient
sar
eno
trep
orte
dto
save
spac
e.A
bsol
ute
t-va
lues
are
inpa
rent
hese
sbe
low
each
coef
fici
ent.
Pan
elA
.Tes
tin
gth
eE
ffec
to
fF
inan
cial
Pan
elB
.Tes
tin
gS
ub
stit
uti
on
bet
wee
nT
rad
eC
red
itan
dD
istr
ess
on
Tra
de
Cre
dit
Oth
erS
ou
rces
of
Fin
anci
ng
[1]
[2]
[3]
[4]
[5]
[6]
[7]
[8]
[9]
[10]
TP
ay/C
GS
TP
ay/C
GS
TP
ay/C
GS
TP
ay/C
GS
TP
ay/A
TP
ay/A
TP
ay/E
TP
ay/E
TP
ay/F
DT
Pay
/FD
Fina
ncia
ldis
tres
s t−1
5.21
∗∗∗
3.71
∗∗∗
17.4
8∗∗∗
10.5
5∗∗∗
0.01
∗∗∗
0.02
∗∗∗
0.15
∗∗∗
0.24
∗∗∗
0.01
∗∗∗
0.01
∗∗∗
(12.
74)
(8.1
4)(2
0.95
)(1
3.70
)(1
6.38
)(1
5.92
)(2
7.44
)(2
4.49
)(8
.48)
(9.9
1)S
ales
grow
th2.
05∗∗
∗2.
47∗∗
∗8.
48∗∗
∗9.
54∗∗
∗0.
01∗∗
∗0.
01∗∗
∗0.
01∗
0.01
0.01
∗∗0.
01(5
.63)
(6.6
8)(1
1.05
)(1
2.34
)(2
5.07
)(7
.27)
(1.9
1)(0
.62)
(1.9
9)(0
.68)
Yea
rsin
fina
ncia
ldis
tres
s1.
16∗∗
∗5.
33∗∗
∗
(4.3
6)(9
.58)
Yea
rsin
fina
ncia
ldis
tres
s20.
05−0
.40∗∗
∗
(1.5
1)(4
.86)
Log
asse
ts0.
250.
40∗
(1.1
6)(1
.81)
Log
sale
s0.
01∗∗
0.02
∗∗∗
−0.0
1∗∗∗
(2.5
6)(1
1.15
)(4
5.32
)
(Con
tinu
ed)

Molina & Preve � Effect of Financial Distress on Trade Credit 193
Tab
leII.
Tra
de
Cre
dit
and
Fin
anci
alD
istr
ess
(Co
nti
nu
ed)
Pan
elA
.Tes
tin
gth
eef
fect
of
Fin
anci
alD
istr
ess
Pan
elB
.Tes
tin
gS
ub
stit
uti
on
bet
wee
nT
rad
eC
red
itan
do
nT
rad
eC
red
ito
ther
sou
rces
of
fin
anci
ng
[1]
[2]
[3]
[4]
[5]
[6]
[7]
[8]
[9]
[10]
Obs
erva
tion
s85
,727
85,7
2785
,727
85,7
2786
,335
86,3
3585
,409
85,4
0976
,308
76,3
08R
-squ
ared
0.70
0.70
0.15
0.15
0.78
0.16
0.55
0.07
0.65
0.20
Adj
.R2
0.66
0.66
0.15
0.15
0.74
0.16
0.47
0.07
0.59
0.20
Nfi
rms
12,0
1812
,018
12,0
8011
,951
11,1
56M
odel
F.E
ffec
tsF.
Eff
ects
P.O
LS
P.O
LS
F.E
ffec
tsP.
OL
SF.
Eff
ects
P.O
LS
F.E
ffec
tsP.
OL
SS
ubsa
mpl
eF
ull
Ful
lF
ull
Ful
lF
ull
Ful
lF
ull
Ful
lF
ull
Ful
lD
umm
ies
Firm
sFi
rms
Indu
stri
esIn
dust
ries
Firm
sIn
dust
ries
Firm
sIn
dust
ries
Firm
sIn
dust
ries
Clu
ster
ing
Firm
sFi
rms
Firm
sFi
rms
Firm
s
∗∗∗ S
igni
fica
ntat
the
0.01
leve
l.∗∗
Sig
nifi
cant
atth
e0.
05le
vel.
∗ Sig
nifi
cant
atth
e0.
10le
vel.

194 Financial Management � Spring 2012
financial distress. This is not likely to be the case as trade credit (our numerator) is also generatedby sales, so the potential mechanical effect is absorbed by the model.9
Under the US law, firms in Chapter 11 are allowed to obtain debtor in possession financing(DIP) from financial institutions. This gives new financial debtors special seniority in case ofliquidation, similar to the one obtained by the suppliers. The existence of DIP could mitigate ourresults as it is possible that several of the firms in the sample enter Chapter 11 while they arecategorized as in financial distress during the time of our study, obtain DIP, and replace tradecredit by special financial credit. This is not a major concern, however, since the effect producedby DIP financing is opposite of our results.
We run several robustness checks on this model. First, we restrict the sample of distressed firmsby dropping those who stay in financial distress for more than five years. In addition, since firmsmay enter into financial distress more than once, we classify firms according to the number oftimes they enter financial distress during the sample time. We estimate Equation (1) on severalrestricted samples: 1) firms that do not stay in financial distress more than five years, 2) firmsthat entered financial distress only once, 3) twice, 4) three, and 5) four times. The results (notreported, but available upon request) do not demonstrate significant differences from the onesreported in our paper.
After Meltzer (1960) demonstrated that under a stricter monetary policy, trade credit increasesin the economy, one might wonder whether there are differences in the behavior of distressed firmsin financial distress during different time frames. To address this point, we re-run Equation (1)using year dummies. Moreover, we partition the sample into two subsamples covering the periods1980-1990 and 1991-2000. In addition, we run the pooled OLS on Equation (1) on each individualyear of the sample. The results, though not reported in the paper, but available upon request,suggest that the supplier’s support of firms in financial distress was not a matter of a single periodof time, but was steady and present throughout the sample period.
The results in Panel A confirm that firms in distress use more trade credit from suppliers. Thismodel, however, is unable to explain whether firms in financial distress increase their use oftrade credit to substitute for other sources of capital that are unavailable to them in their currentfinancial situation. To specifically address this point, we build three new variables that we useas the dependent variable. We scale trade payables on total assets and construct a variable calledTPay/A (i.e., trade payables/total assets). Similarly, we scale trade payables on the book value ofequity and on total financial debt and construct TPay/E (i.e., trade payables/book value of equity),and TPay/FD (i.e., trade payables/total financial debt), respectively.10
The results are reported in Table II Panel B. Columns (6) and (7) present the results usingTPay/A as the dependent variable with fixed effects and pooled OLS models, respectively. Thepositive coefficients for the financial distress dummy indicate that firms in financial distressincrease the use of trade payables in their capital structure. More specifically, firms in financialdistress increase trade credit in their capital structure by almost 1% more than when they werefinancially stable (i.e., in the fixed effects model) and by more than 2% when compared to othernondistressed firms (i.e., in the pooled OLS). Note that this is a relative increase since it ismeasured relative to other sources of financing. Therefore, it is meaningful even though firms
9 Note that by scaling trade payables on the cost of goods sold, we are taking into account the level of the sales thatgenerate the trade payables (through the cost of goods sold). This specification rules out by construction the possibilityof capturing old payables of firms that are no longer operating.10 The use of TPay/A as the dependent variable serves as a robustness check to our original model. One may argue thatour dependent variable in the base case (TPay/CGS) might be biased in financial distress since firms might sell less,decreasing the CGS and resulting in a mechanically higher coefficient of trade credit. The fact that our results hold evenwhen Trade Payables is scaled by Assets is reassuring.

Molina & Preve � Effect of Financial Distress on Trade Credit 195
in financial distress have been known to participate in the fire sale of assets as noted by Pulvino(1998), among others.
In Columns (7) and (8), we use TPay/E as the dependent variable to allow for the measurementof the substitution effect of trade credit with respect to equity. The positive and significantcoefficients on the financial distress dummy suggest that the level of trade payables increasesfaster than the book value of equity in financially distressed firms. One possible explanation forthis result is that firms in financial distress incur losses that diminish the book value of equity. Inthat case, the ratio tends to rise. The results demonstrate, however, that the level of trade creditdoes not decrease at the same speed, resulting in an increase in trade credit relative to equity inthe firm’s capital structure.
Finally, in Columns (9) and (10) of the panel, we consider the substitution effect between tradepayables and financial debt by using TPay/FD as the dependent variable in the model. The resultsare similar to those reported in the first four columns of the table. The positive coefficient on thedummy identifying firms in financial distress suggests that financial debt is replaced by tradepayables in the financially distressed firm’s capital structure. This is fully consistent with theintuition of this paper and confirms the findings in Atanasova (2007), using a different analyticalframework. We define financial debt as the sum of the book value of short-term and long-termdebt. Unfortunately, the data are not detailed enough to allow a more comprehensive study of thesubstitution between suppliers and banks for firms in distress, but is enough to allow us to beconfident that, on average, firms in financial distress use suppliers’ credit to replace other formsof financing. In sum, the results in Panel B provide support for the hypothesis that trade creditacts as a substitute for the other sources of financing for firms in financial distress.
III. The Cost of Increasing Trade Credit Financing
We now estimate the cost of increasing trade credit financing for firms in financial distress. Ithas been argued that trade credit is an expensive source of financing. The implied annual cost inthe typical “2-10 Net 30” commercial condition is above 40%.11 If financially distressed firmsuse this more expensive source of financing, it is likely that they will experience some drop inperformance. In this section, we empirically estimate this effect. Specifically, we look at howmuch of the drop in performance by firms in financial distress is caused by the increase in tradepayables financing.
To empirically estimate the cost of increasing trade payables when firms are in financialdistress, we regress proxies for firm performance on a dummy for financial distress, a dummyfor significant increases in trade payables, and their cross effect. The cross effect of the twodummies (financial distress and the significant rise in the use of trade payables) measures themarginal effect of a rise in trade credit financing on the performance of a firm in financial distress.Quantifying this marginal effect allows us to measure the cost of financial distress caused by anincrease in the use of trade credit.
We borrow the following model for firm performance from Opler and Titman (1994):
Performancei,t−2→t = δ + β1financial distressi,t−1 + β2 (increase TPay/CGS)i,t−2→t
+β3((increase TPay/CGS)i,t−2→t∗financial distressi,t−1) + γ Xi,t−2 + εi t .
(2)
11 See Wilner (2000) and Ng et al. (1999) for a more detailed explanation. Two recent papers cast some doubt regardingthis higher cost. Giannetti, Burkart, and Ellingsen (2010) find that several of the firms in their sample seem to be receivingcheap trade credit, and Miwa and Ramseyer (2008), using data from Japanese firms in the 1960s, report that trade creditand bank credit have about the same cost.

196 Financial Management � Spring 2012
We consider three different proxies for firm performance (Performancei,t−2→t ) adjusted byindustry medians, and use four control variables (Xi,t−2). Firm performance is measured over atwo-year period, from t−2 to t, and the controls are measured at t−2.
To measure financial distress, we use the first lag (at t−1) of the dummy measuring financialdistress as in the previous section. We measure the increase in trade credit financing by creating adummy that is equal to one if the firm exhibits a significant increase in trade payables, normalizedby the cost of goods sold and measured in days (increaseTpay/CGS)i,t−2→t .
We consider an increase to be significant if the firm raises its use of trade payables by an amountthat is larger than the 95th percentile in its industry. Alternatively, we also use the 90th percentile.Because we can expect different increases for firms in different industries, we measure the rise intrade payables by comparing it to trade payables variations of firms in the same industry. We alsocompute the percentiles using the entire sample as a robustness check. To be consistent with thetiming of the other variables, we measure the rise in trade payables in the same two-year periodthat we use for firm performance (from t−2 to t). The cross effect of the rise in trade payablesand financial distress measures the additional effect on firm performance. This setup is also usedin Molina and Preve (2009).
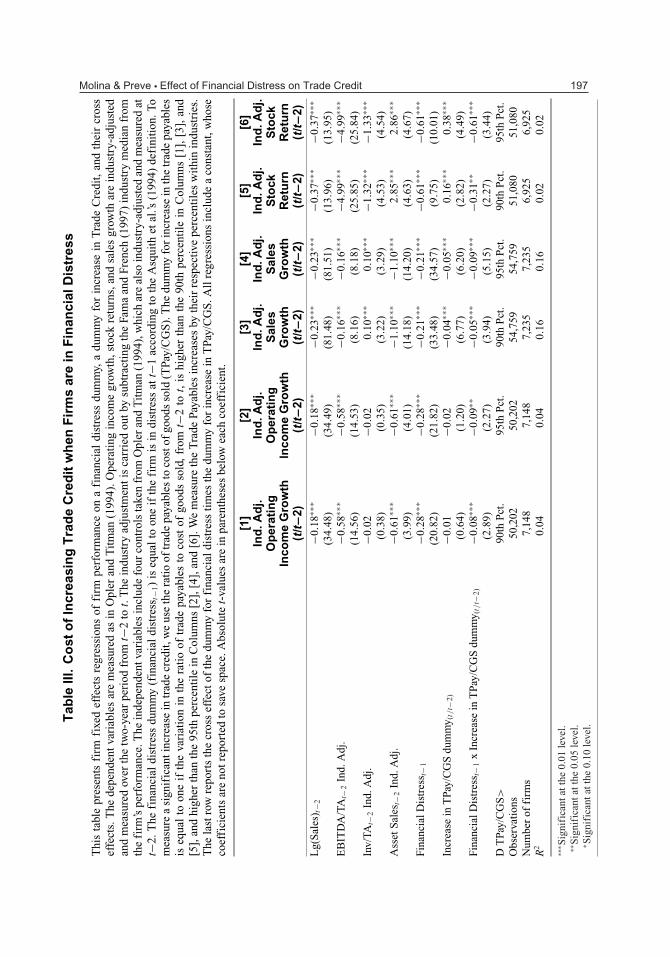
The results are reported in Table III. Note that we have fewer observations than in the previoustables because, following Opler and Titman (1994), we limit ourselves to industries with at leastfour firms to carry the necessary industry adjustments. We also drop firms with sales growth,operating income growth, or equity returns in excess of 200%. In addition, we lose one year ofdata as we need two lags to build the performance variables in these regressions. The reportedregressions include firm fixed effects.
We find that while all firms in financial distress experience drops in performance (the coeffi-cients on the financial distress dummy are negative and significant in all regressions), this dropis significantly larger when there is an important increase in trade credit financing. In fact, thesum of the coefficients on the increase in the trade payables dummy and the interaction term isnegative in all cases. This result is consistent through different measures of performance, and it isalso robust to considering the significance of the rise in trade payables with respect to the entiresample, rather than only to the firm’s respective industry (results not reported). The magnitudeof the effect of a rise in trade payables on firm performance is economically important.
A firm that experiences financial distress will have a drop in operating income of 28%. Ifthis firm also increases its trade payables by an amount larger than the 95th percentile (90thpercentile) of the firm’s industry, its operating income will drop by an additional 11% (9%).12
Similarly, when we measure performance with the sales growth or with stock returns, we observea drop of 21% and 61% in performance for firms in financial distress, with an additional drop of14% and 23%, respectively, when the firm in distress increases its use of trade payables financingto the 95th industry percentile (9% and 15% when they increase the use of trade credit to the 90%of the industry percentile). These results are comparable with those in Opler and Titman (1994).Overall, we find that a firm that is in financial distress and significantly increases their tradepayables reports a total drop in operating income, sales, and stock returns of up to 39%, 35%, and84%, respectively.13 Our results suggest that about one-third of this drop in performance is due tothe increase in trade credit financing, which supports the importance of trade credit managementfor firms in financial trouble.
12 To obtain these percentages, we need to add the coefficients in the dummy that identifies firms that significantlyincrease trade credit and the interaction term (with financial distress).13 If we increase the use of trade credit above 90% of the industry percentile, these numbers change to 37%, 30% and76%, respectively.
Molina & Preve � Effect of Financial Distress on Trade Credit 197
Tab
leIII
.C
ost
of
Incr
easi
ng
Tra
de
Cre
dit
wh
enF
irm
sar
ein
Fin
anci
alD
istr
ess
Thi
sta
ble
pres
ents
firm
fixe
def
fect
sre
gres
sion
sof
firm
perf
orm
ance
ona
fina
ncia
ldi
stre
ssdu
mm
y,a
dum
my
for
incr
ease
inT
rade
Cre
dit,
and
thei
rcr
oss
effe
cts.
The
depe
nden
tva
riab
les
are
mea
sure
das
inO
pler
and
Tit
man
(199
4).O
pera
ting
inco
me
grow
th,s
tock
retu
rns,
and
sale
sgr
owth
are
indu
stry
-adj
uste
dan
dm
easu
red
over
the
two-
year
peri
odfr
omt−
2to
t.T
hein
dust
ryad
just
men
tis
carr
ied
outb
ysu
btra
ctin
gth
eFa
ma
and
Fren
ch(1
997)
indu
stry
med
ian
from
the
firm
’spe
rfor
man
ce.T
hein
depe
nden
tvar
iabl
esin
clud
efo
urco
ntro
lsta
ken
from
Opl
eran
dT
itm
an(1
994)
,whi
char
eal
soin
dust
ry-a
djus
ted
and
mea
sure
dat
t−2.
The
fina
ncia
ldi
stre
ssdu
mm
y(f
inan
cial
dist
ress
t−1)
iseq
ual
toon
eif
the
firm
isin
dist
ress
att−
1ac
cord
ing
toth
eA
squi
thet
al.’s
(199
4)de
fini
tion
.To
mea
sure
asi
gnif
ican
tinc
reas
ein
trad
ecr
edit
,we
use
the
rati
oof
trad
epa
yabl
esto
cost
ofgo
ods
sold
(TPa
y/C
GS
).T
hedu
mm
yfo
rin
crea
sein
the
trad
epa
yabl
esis
equa
lto
one
ifth
eva
riat
ion
inth
era
tio
oftr
ade
paya
bles
toco
stof
good
sso
ld,
from
t−2
tot,
ishi
gher
than
the
90th
perc
enti
lein
Col
umns
[1],
[3],
and
[5],
and
high
erth
anth
e95
thpe
rcen
tile
inC
olum
ns[2
],[4
],an
d[6
].W
em
easu
reth
eT
rade
Paya
bles
incr
ease
sby
thei
rre
spec
tive
perc
enti
les
wit
hin
indu
stri
es.
The
last
row
repo
rts
the
cros
sef
fect
ofth
edu
mm
yfo
rfi
nanc
iald
istr
ess
tim
esth
edu
mm
yfo
rin
crea
sein
TPa
y/C
GS
.All
regr
essi
ons
incl
ude
aco
nsta
nt,w
hose
coef
fici
ents
are
notr
epor
ted
tosa
vesp
ace.
Abs
olut
et-
valu
esar
ein
pare
nthe
ses
belo
wea
chco
effi
cien
t.
[1]
[2]
[3]
[4]
[5]
[6]
Ind
.Ad
j.In
d.A
dj.
Ind
.Ad
j.In
d.A
dj.
Ind
.Ad
j.In
d.A
dj.
Op
erat
ing
Op
erat
ing
Sal
esS
ales
Sto
ckS
tock
Inco
me
Gro
wth
Inco
me
Gro
wth
Gro
wth
Gro
wth
Ret
urn
Ret
urn
(t/t−2
)(t
/t−2
)(t
/t−2
)(t
/t−2
)(t
/t−2
)(t
/t−2
)L
g(S
ales
) t−2
−0.1
8∗∗∗
−0.1
8∗∗∗
−0.2
3∗∗∗
−0.2
3∗∗∗
−0.3
7∗∗∗
−0.3
7∗∗∗
(34.
48)
(34.
49)
(81.
48)
(81.
51)
(13.
96)
(13.
95)
EB
ITD
A/T
At−
2In
d.A
dj.
−0.5
8∗∗∗
−0.5
8∗∗∗
−0.1
6∗∗∗
−0.1
6∗∗∗
−4.9
9∗∗∗
−4.9
9∗∗∗
(14.
56)
(14.
53)
(8.1
6)(8
.18)
(25.
85)
(25.
84)
Inv/
TAt−
2In
d.A
dj.
−0.0
2−0
.02
0.10
∗∗∗
0.10
∗∗∗
−1.3
2∗∗∗
−1.3
3∗∗∗
(0.3
8)(0
.35)
(3.2
2)(3
.29)
(4.5
3)(4
.54)
Ass
etS
ales
t−2
Ind.
Adj
.−0
.61∗∗
∗−0
.61∗∗
∗−1
.10∗∗
∗−1
.10∗∗
∗2.
85∗∗
∗2.
86∗∗
∗
(3.9
9)(4
.01)
(14.
18)
(14.
20)
(4.6
3)(4
.67)
Fina
ncia
lDis
tres
s t−1
−0.2
8∗∗∗
−0.2
8∗∗∗
−0.2
1∗∗∗
−0.2
1∗∗∗
−0.6
1∗∗∗
−0.6
1∗∗∗
(20.
82)
(21.
82)
(33.
48)
(34.
57)
(9.7
5)(1
0.01
)In
crea
sein
TPa
y/C
GS
dum
my (
t/t−
2)−0
.01
−0.0
2−0
.04∗∗
∗−0
.05∗∗
∗0.
16∗∗
∗0.
38∗∗
∗
(0.6
4)(1
.20)
(6.7
7)(6
.20)
(2.8
2)(4
.49)
Fina
ncia
lDis
tres
s t−1
xIn
crea
sein
TPa
y/C
GS
dum
my (
t/t−
2)−0
.08∗∗
∗−0
.09∗∗
−0.0
5∗∗∗
−0.0
9∗∗∗
−0.3
1∗∗−0
.61∗∗
∗
(2.8
9)(2
.27)
(3.9
4)(5
.15)
(2.2
7)(3
.44)
DT
Pay/
CG
S>
90th
Pct
.95
thP
ct.
90th
Pct
.95
thP
ct.
90th
Pct
.95
thP
ct.
Obs
erva
tion
s50
,202
50,2
0254
,759
54,7
5951
,080
51,0
80N
umbe
rof
firm
s7,
148
7,14
87,
235
7,23
56,
925
6,92
5R
20.
040.
040.
160.
160.
020.
02
∗∗∗ S
igni
fica
ntat
the
0.01
leve
l.∗∗
Sig
nifi
cant
atth
e0.
05le
vel.
∗ Sig
nifi
cant
atth
e0.
10le
vel.

198 Financial Management � Spring 2012
It could be argued that the rise in payables is not exogenous, and that this increase can bea proxy for the extent to which firms are distressed. To address this concern, we examine theeffect of a rise in trade payables in a subsample that only considers firms in financial distress.The results (not reported) persist. Firms in financial distress that significantly drop their tradereceivables experience an additional decrease in performance of 14%−16%, depending upon theperformance measure considered.
IV. Cross Sectional Variations of the Response of Trade Creditto Financial Distress
In Section II, we explored the response of the use of trade credit on financial distress. Becauseinformation regarding the terms of trade credit is unavailable, we can only estimate the reducedform for the quantity of trade credit outstanding at the firm level. Therefore, we cannot estimatethe firm’s actual demand for trade credit. In other words, we are unable to disentangle whether thehigher level of trade credit is due to a greater demand from the distressed firm or from a highersupply from its suppliers. To learn more about the rationale behind this change in trade payables,we use the firm’s characteristics that, according to previous theories of trade credit, shouldexplain the cross-sectional variations observed in the data. Then, we use these characteristics tostudy the response of trade payables to financial distress. First, we split the sample on differentpartitions (subgroups) of the data according to the relevant firm characteristics. We then considerthe interaction terms of the specific firms’ characteristics with the dummy identifying firms infinancial distress, estimating the following model:
T Cit = γi +β1financial distressit−1 +β2Cit +β3 (financial distressi t−1 × Cit)+β4 Xit +εit, (3)
where C is a variable that captures a firm or industry characteristic. It enters the model alone andis interacted with the dummy for financial distress, Financial Distresst−1.
A. The Importance of the Size and Market Power of the Firms
Several theories of trade credit predict that given the high cost of trade credit, whenever afirm is allowed to find financial credit, it will use it to replace trade credit (Petersen and Rajan,1995,1997; Frank and Maksimovic, 2005; Cunat, 2007). A similar view is held by Biais andGollier (1997), who develop a theory that relies on the asymmetry in the cost of acquiringinformation about the buyer’s creditworthiness as an incentive for suppliers to finance firms withlower access to financial credit. According to this theory, suppliers are assumed to be in a betterposition than financial creditors to assess the creditworthiness of their clients, so they shouldhave a greater incentive to finance them.
The size of the firm provides a good setting for an empirical discussion of this topic. Largerfirms are assumed to have better management and corporate governance, to generate morereliable information, to be followed by a larger number of analysts, and to have greater liquidityon the trading floor. These factors should lead to greater access to financing. According tothis assumption, larger firms should use less trade credit than smaller ones. We can extend thisintuition and expect larger firms to use less trade credit from suppliers when they are in financialdistress, if they can obtain financial credit. In other words, the effect of financial distress on tradepayables should be less important for large firms that have better sources of financing.

Molina & Preve � Effect of Financial Distress on Trade Credit 199
Table IV. Trade Credit, Financial Distress, and Firm Size
This table reports firm fixed effects regressions of trade credit on a financial distress dummy and a control,first dividing the sample according to firm size (Columns [1] and [2]) and then including the cross effect ofsize and financial distress (Columns [3]–[6]). The dependent variables are: 1) TPay/CGS that measures tradecredit scaled by daily cost of goods sold, which should be interpreted as “days of trade payables,” 2) TPay/Ameasuring the trade credit scaled by assets, 3) TPay/E that calculates trade credit on the book value ofequity, and 4) TPay/FD that measures trade credit on the book value of financial debt. The financial distressdummy (Financial Distresst−1) is equal to one if the firm is in distress at t−1 according to the Asquith et al.’s(1994) definition. Sales Growth measures the first difference in sales scaled by sales. Column [1] reportsthe results for the Large subsample, considering firms with sales above the median of the total sample.Column [2] presents the results for the Small subsample, considering firms with sales below the medianof the total sample. The models in Columns [3]–[6] include the cross effect of Large Firms ∗ FinancialDistresst−1, where Large Firms is a dummy variable that identifies firms whose sales were above the medianof their industry in the year prior to entering into financial distress. Large Firms is automatically droppedfrom the fixed effects model as it is time invariant. The sample is the full sample from Compustat from1980 to 2000. TROUBLE is the subsample of firms that enter financial distress at some time in the sampletime. Regressions on Columns [3]–[6] are run on the TROUBLE subsample since the Large Firms dummyonly considers firms that enter financial distress. The Hausman test in Row [a] tests the difference in theFinancial Distresst−1 coefficient of the Large subsample (Column [1]) with respect to the Small subsample(Column [2]). t-stats in the OLS specification are clustered by firms and are based on robust standard errors.All regressions include a constant, whose coefficients are not reported to save space. Absolute t-values arein parentheses below each coefficient.
[1] [2] [3] [4] [5] [6]TPay/ TPay/ TPay/ TPay/ TPay/ TPay/CGS CGS CGS A E FD
Financial distresst−1 1.54∗∗∗ 5.87∗∗∗ 5.77∗∗∗ 0.01∗∗∗ 0.16∗∗∗ 0.01∗∗∗
(2.63) (9.78) (9.24) (13.01) (17.24) (4.86)Sales growth 4.73∗∗∗ 1.14∗∗ 2.24∗∗∗ 0.01∗∗∗ −0.02∗∗ 0.01
(10.21) (1.98) (4.13) (15.80) (2.37) (0.64)Large firms∗financial distresst−1 – – −3.25∗∗∗ −0.01∗∗∗ −0.02 −0.01∗
– – (3.32) (6.09) (1.15) (1.69)Hausman test [a] – 2.58 – – – –p-Value – (0.00) – – – –Observations 46,861 38,866 34,677 34,961 34,551 30,060R2 0.76 0.70 0.62 0.71 0.45 0.59Adj. R2 0.72 0.63 0.57 0.67 0.38 0.53Model F. Effects F. Effects F. Effects F. Effects F. Effects F. EffectsSample Large Small Trouble Trouble Trouble Trouble
∗∗∗Significant at the 0.01 level.∗∗Significant at the 0.05 level.∗Significant at the 0.10 level.
First, we split the data set into large and small firms. A firm is considered large if its salesare larger or equal to the median of its industry in any given year and small otherwise. Wethen estimate a fixed effects model on Equation (1) on both subsamples of firms. The results inColumns (1) and (2) of Table IV suggest that both large and small firms use more trade creditfrom suppliers when in financial distress. The coefficients for the dummy identifying financiallydistressed firms are positive and significant in both subsamples. The financial distress coefficient,however, is significantly smaller for large firms when compared to small firms. Large firms delay

200 Financial Management � Spring 2012
their payments to suppliers by 1.5 days when in financial distress, while smaller ones presentdelays of more than 5 days. The Hausman test indicates that this difference is significant with ap-value of 0.00.14
These results suggest that the size of the firm plays an important role in the use of trade credit infinancial distress. It could be argued, however, that the size of a firm can be affected by financialdistress. It has been reported that firms entering financial distress tend to reduce their size dueto decreasing sales and market share or because of asset sales (Opler and Titman, 1994; Altman,1985; Pulvino, 1998). To circumvent this potential criticism, we use a different specification tostudy the effect of size. We compute the size of the firm at the last prefinancial distress year,and generate a dummy named “PRE_SIZE” that is equal to one if the firm was large at theprefinancial distress time, and zero otherwise. We use this dummy alone and interacted withfinancial distresst−1 in the estimation of Equation (3). Note that by construction, this model onlyconsiders those firms that enter financial distress in the time span considered in the paper. Thus,the sample becomes mechanically restricted.15 This specification allows us to study the effect offinancial distress on trade credit in firms that were large before entering in financial distress.
In Column (3) of Table IV, we run the model on the full sample, but include a cross effect of sizewith financial distress. The results are consistent with the ones reported throughout this section.The financial distress coefficient is positive and similar to our base case, while the coefficientof the interaction term is negative. These results suggest that firms that enter financial distressincrease their use of trade payables by 5.77 days, but this increase in trade payables is 3.25 dayslower when the firm is large. In other words, a large firm increases, on average, its use of tradepayables by 2.52 days when in financial distress, while the average firm, with less financingoptions, extends its trade payables by 5.77 days. These results, consistent with the trade credittheories, imply that larger firms rely less on financing from suppliers when entering financialdistress than their smaller counterparts.
In addition, we test the effect of size on the substitution effect between trade credit and othersources of capital discussed above. We estimate a fixed effects model on Equation (3) using thedummy variable that identifies firms that were large prior entering financial distress. The resultsare reported in the last three columns of Table IV. We see that larger firms have less substitution(trade credit vs. other sources of financing) than smaller ones. Moreover, in the cases of assetsand financial debt, Columns (4) and (6), the increase in use of trade credit is almost canceledfor large firms.16 Overall, these results imply that substitution is significantly weaker for largerfirms, confirming the results reported above.
Overall, the results using size as a firm characteristic tend to suggest that firms that are able tosecure financing from other sources (i.e., not trade credit) tend to utilize it more readily beforetapping into trade credit. It could be that firms prefer financial credit as it is cheaper or it may bethat they do not want to stretch their payments to suppliers unless it is absolutely necessary. The
14 In a more formal test of these differences, we include a dummy variable identifying large firms, alone and interactedwith all the variables in the model, in a single regression. We perform an F-test of joint significance of the size dummyand its interactions. The test rejects the null of non-significance with p-values of 0.00. Moreover, its interaction withfinancial distress is negative and significant at the 1% level (−5.3 days). These results are not reported, but availableupon request.15 In this specification, we dropped the firms that remain in financial distress for more than five years. Including them,however, does not change the results in a significant way.16 Additionally, if we estimate Equation (1) using TPay/A, TPay/E, and TPay/FD as dependent variables and split thesample by size, we find that both large and small firms demonstrate evidence of the substitution effect we find inSection II, but all the coefficients for large firms are smaller (about half) than the ones for small firms, implying a largersubstitution effect for small firms.

Molina & Preve � Effect of Financial Distress on Trade Credit 201
results in this section seem to suggest that firms consider trade credit to be lower in the peckingorder of financing.
B. The Case of Retailers; Deployable Assets as Collateral for Suppliers
Some theories of trade credit (Burkart and Ellingsen, 2004) state that when the products soldby the firm are not deployable, they can be used as collateral from suppliers to secure tradecredit. The characteristics of firms in the retail industry provide a nice setting to extend ourknowledge about the behavior of trade credit during financial distress. Retailers buy productsand generally sell them without further manipulation, keeping them in inventory for a veryshort time. Products are sold and converted into cash relatively quickly. According to the theory,retailers should get less trade credit from suppliers because their goods are highly deployableand, as such, less valuable as collateral to suppliers as they are subject to moral hazards by thedebtor. This problem should be magnified in financial distress, as the incentive to divert cashbecomes greater. These characteristics are also subject to a different interpretation. Deployablegoods, and especially the large generation of cash by retailers, constitute liquid collateral forfinancial credit.17 Therefore, retailers would be in a better position to obtain bank financing evenin financial distress. Consequently, we should expect retailers to use less trade credit than otherfirms.
We define retailers as firms that operate in the Fama and French (1997) industry number41 (DNUMS 5000 to 5190 from Compustat) and identify them with a dummy variable namedRETAIL. We estimate the model in Equation (1) on two subsamples, retailers and nonretailers,to study the effect of financial distress on retailers’ trade credit from suppliers. The results arefound in Table V, Columns (1) and (2). We only report the results of the fixed effects model. Theresults indicate that retailers do not increase their trade credit when they are in financial distress,when compared to the 5.5 days increase for nonretailers.18 We then consider the framework ofEquation (3) to test of the effect of financial distress on retailers’ trade credit. We use the RETAILdummy alone and interacted with financial distresst−1. The results presented in Column (3) ofTable V confirm that retailers in financial distress do not increase their use of trade payables,consistent with the results in Column (1). The coefficients for Financial Distresst−1 and for thecross effect of the RETAIL dummy and financial distresst−1 cancel each other out. This resultseems to support the intuition that firms with cash and deployable goods have an advantage inobtaining financial credit when they are in financial distress.19
We additionally study the effect of financial distress on retailers with high-market share. Asa proxy for market power, we use the measure of the retailer’s market share in the year beforeentering financial distress. This setting reduces our sample size as it only considers retailers thatenter financial distress during the time span of this paper. The results are noted in Column (4)of Table V. The coefficient on the term that identifies high-market share, financially distressedretailers is negative and significant suggesting that more dominant retailers tend to decrease theuse of trade payables during financial distress.
17 Pledging cash inflows is common practice in industries with a large generation of cash. An example of this is the pledgeof cash inflows of tolls collected from highways as collateral for financing a project. This pledge is relatively easier forfinancial institutions than for suppliers.18 The results of the pooled OLS, not reported, indicate that that both retailers and nonretailers use more trade creditwhen in financial distress. However, the difference is great. Retailers increase their payables by less than 7 days, whilenonretailers exhibit an average increase of almost 20 days.19 The results need to be interpreted with some caution. We are using an industry to proxy for firm characteristics, andthis proxy may be imperfect or polluted by other variables that may introduce a bias into the results.

202 Financial Management � Spring 2012
Table V. Trade Credit and Financial Distress in Retail Firms
This table reports firm fixed effects regressions of trade credit on a financial distress dummy and a control,first dividing the sample between retailers and nonretailers (Columns [1] and [2]), then including the crosseffect of the RETAIL dummy and financial distress (Column [3]), and additionally considering a dummyfor distressed retailers with high market share. The dependent variable is the ratio of Trade Payables onCost of Goods Sold (TPay/CGS). The financial distress dummy (Financial Distresst−1) is equal to one if thefirm is in distress at t−1 according to the Asquith et al.’s (1994) definition. Sales Growth measures the firstdifference in sales scaled by sales. RETAIL is a dummy variable that identifies the firm as a retailer. Wedefine retailers as firms that operate in the Fama & French (1997) industry number 41 (DNUMS 5000–5190from Compustat). The regression in Column [1] considers firms with a RETAIL dummy equal to one, andthe regression in Column [2] considers firms with a RETAIL dummy equal to zero (nonretailers). RETAIL ∗
Financial Distresst−1 is an interaction term that identifies retailers in financial distress. The model in Column(4) includes a dummy that identifies retailers whose market share was higher than the median of its industryin the year prior to entering into financial distress (High Market Share Pre Financial Distress). This variableis dropped by the fixed effects model, but its interaction with Financial Distresst−1 is captured by the variableDistressed Retailers with high Market Share. The sample is the full sample from Compustat from 1980 to2000. All regressions include a constant, whose coefficients are not reported to save space. Absolute t-valuesare in parentheses below each coefficient.
[1] [2] [3] [4]TPay/CGS TPay/CGS TPay/CGS TPay/CGS
Financial distresst−1 −0.18 5.52∗∗∗ 5.51∗∗∗ 0.97(0.19) (12.83) (13.13) (0.70)
Sales growth 5.31∗∗∗ 1.92∗∗∗ 2.02∗∗∗ 5.05∗∗
(4.91) (5.07) (5.56) (2.42)RETAIL 53.84
(0.60)RETAIL∗financial distresst−1 −5.91∗∗∗
(3.17)Distressed retailers with high −15.49∗∗
market share (2.52)Observations 5,379 80,348 85,727 2,051R2 0.78 0.70 0.70 0.68Adj. R2 0.74 0.65 0.66 0.64Model F. Effects F. Effects F. Effects F. EffectsSubsample Retailers Nonretailers Full sample Trouble, retailers
∗∗∗Significant at the 0.01 level.∗∗Significant at the 0.05 level.∗Significant at the 0.10 level.
These results seem to suggest that those firms that are unable to secure alternative sources offinancing may elect to obtain suppliers’ trade credit. However, if they can avoid doing so, theywill try to do so. The results in the last two sections imply that the effect of financial distress ontrade payables is not equal across all firms.
V. Conclusions
We have examined the effect of financial distress on the amount of supplier’s trade credit.Using standard panel data techniques on 20 years of US corporate data, we find strong evidence

Molina & Preve � Effect of Financial Distress on Trade Credit 203
suggesting that financially distressed firms use more trade credit from suppliers than healthyones. These results are consistent with Petersen and Rajan (1997) who, on a different data set,find that firms with less access to financial credit use more trade credit. The results also implythat supplier’s trade credit is used as an alternative source of financing when firms enter financialdistress.
Because trade credit is an expensive source of financing, it is reasonable to expect that firmsin financial distress increasing its use incur extra costs that diminishes their performance. Usinga model similar to Molina and Preve (2009), we estimate the cost of financial distress for firmsthat significantly increase their use of trade credit when they enter financial distress. We confirmthe drop in performance for firms in financial distress reported in the literature, but we add to itby identifying the extra cost of financial distress for firms increasing the use of trade credit. Ingeneral, we can state that a significant portion of the costs of financial distress (about one-third)can be explained by the increase in use of suppliers’ trade credit.
To understand the reasons behind the increase in trade credit for firms in financial distress(i.e., disentangling between a supply and a demand effect), we identify several firm and industrycharacteristics that, according to the previous literature, should explain the cross-sectional varia-tions in the level of trade credit. We find that smaller and less dominant firms increase their useof suppliers’ trade credit when in financial distress significantly more so than larger firms. Thisfinding is consistent with the theory that larger and more dominant firms use financial creditinstead of more expensive trade credit. It is also consistent with the greater propensity for largerand more dominant firms to use debtor-in-possession financing in “Chapter 11.” An alternativeinterpretation is that smaller firms generate less information and their creditworthiness is moredifficult to assess. Therefore, suppliers have an informational advantage that allows them to lendmoney to their financially distressed clients.
We also find that retailers use less trade credit than nonretailers when they are in financialdistress. This is consistent with the predictions of Burkhart and Ellingsen (2004) regarding thepossibility of repossessing and reselling the goods sold, but it can also be explained by the factthat retailers generate more cash constituting better collateral for financial creditors.
These results suggest that firms seem to prefer financial credit over trade credit. Trade credit ischiefly used in those situations in which financial credit is difficult to obtain. The results of thispaper support the idea that financial credit rates higher than trade credit in the “pecking order”of financing sources.20
The fact that firms in financial distress report problems with suppliers does not mean thatsuppliers are not extending their trade credit terms to help finance financially distressed firms.Firms in financial distress are forced into bankruptcy when they fail to satisfy their agreementwith their suppliers. This is consistent with the results that suppliers support financially distressedfirms (as long as they foresee an acceptable probability of survival of the buyer), and force themto bankruptcy when they lose confidence.
This paper adds to two streams of the literature, trade credit, and financial distress. First,it examines the effects of financial distress on trade credit and uses several of the establishedtheories of trade credit to disentangle whether this increase in trade credit is a demand or asupply effect. Moreover, it identifies and measures a cost of financial distress that has not beenconsidered before. Firms in financial distress use more trade credit from suppliers, which isexpensive and adds to the costs of financial distress. In summary, this paper represents a furtherstep toward a more precise and comprehensive determination of the mechanics of trade credit
20 It is worth mentioning, however, that Biais and Malecot (1996) report a heavy use of trade credit in France wheresuppliers do not get anything in the case of bankruptcy of the debtor.
204 Financial Management � Spring 2012
and working capital management, and on the effects of financial distress in the day-to-day firmdecision-making process.
References
Altman, E., 1984, “A Further Investigation on the Bankruptcy Cost Question,” Journal of Finance 39,1067-1089.
Andrade, G. and S. Kaplan, 1998, “How Costly is Financial (Not Economic) Distress? Evidence from HighlyLeveraged Transactions that Became Distressed,” Journal of Finance 53, 1443-1493.
Asquith, P., R. Gertner, and D. Sharfstein, 1994, “Anatomy of a Financial Distress: An Examination ofJunk-Bond Issuers,” Quarterly Journal of Economics 109, 625-658.
Atanasova, C., 2007, “Access to Institutional Finance and the Use of Trade Credit,” Financial Management36, 49-67.
Baxter, N.D., 1967, “Leverage, Risk of Ruin and the Cost of Capital,” Journal of Finance 22, 395-403.
Biais, B. and C. Gollier, 1997, “Trade Credit and Credit Rationing,” Review of Financial Studies 10, 903-937.
Biais, B. and J.F. Malecot, 1996, “Incentives and Efficiencies in the French Bankruptcy Process,” WorldBank PSD Occasional Paper, 23.
Burkart, M. and T. Ellingsen, 2004, “In-Kind Finance: A Theory of Trade Credit,” American EconomicReview 94, 569-590.
Cunat, V., 2007, “Trade Credit: Suppliers as Debt Collectors and Insurance Providers,” Review of FinancialStudies 20, 491-527.
De Blasio, G., 2005, “Does Trade Credit Substitute Bank Credit? Evidence from Firm-Level Data,” EconomicNotes 34, 85-112.
Emery, G., 1984, “A Pure Financial Explanation for Trade Credit,” Journal of Financial and QuantitativeAnalysis 19, 271-285.
Fama, E.F. and K.R. French, 1997, “Industry Cost of Equity,” Journal of Financial Economics 43, 153-193.
Frank, M. and V. Maksimovic, 2005, “Trade Credit, Collateral, and Adverse Selection,” University ofMaryland and University of Minnesota Working Paper. Available at SSRN: http://ssrn.com/abstract =87868 or doi:10.2139/ssrn.87868.
Giannetti, M., M. Burkart, and T. Ellingen, 2011, “What You See is What You Lend? Explaining TradeCredit Contracts,” Review of Financial Studies 24, 1261-1298.
Hadi, A.S., 1992, “Identifying Multiple Outliers in Multivariate Data,” Journal of the Royal StatisticalSociety Series B54, 761-771.
Hadi, A.S., 1994, “A Modification of a Method for the Detection of Outliers in Multivariate Samples,”Journal of the Royal Statistical Society Series B56, 393-396.
Hill, M.D., G.W. Kelly, and M.J. Highfield, 2010, “Net Operating Working Capital Behavior: A First Look,”Financial Management 39, 783-805.
Love, I., L.A. Preve, and V. Sarria-Allende, 2007, “Trade Credit and Bank Credit: Evidence from RecentFinancial Crises,” Journal of Financial Economics 83, 453-469.
Meltzer, A.H., 1960, “Mercantile Credit, Monetary Policy, and Size of Firms,” Review of Economics andStatistics 42, 429-437.
Molina & Preve � Effect of Financial Distress on Trade Credit 205
Miwa, Y. and J.M. Ramseyer, 2008, “The Implications of Trade Credit for Bank Monitoring: SuggestiveEvidence,” Journal of Economics and Management Strategy 17, 317-343.
Molina, C.A. and L.A. Preve, 2009, “Trade Receivables Policy of Distressed Firms and its Effect on theCosts of Financial Distress,” Financial Management 38, 663-686.
Ng, C.K., J.K. Smith, and R.L. Smith, 1999, “Evidence on the Determinants of Trade Credit Used inInterfirm Trade,” Journal of Finance 54, 1109-1129.
Opler, T.C. and S. Titman, 1994, “Financial Distress and Corporate Performance,” Journal of Finance 49,1015-1040.
Petersen, M.A., and R.G. Rajan, 1997, “Trade Credit: Theories and Evidence,” Review of Financial Studies10, 661-691.
Petersen, M.A. and R.G. Rajan, 1995, “The Effect of Credit Market Competition on Lending Relationships,”Quarterly Journal of Economics 110, 407-443.
Pulvino, T., 1998, “Do Asset Fire Sales Exist? An Empirical Investigation of the Commercial AircraftTransactions,” Journal of Finance 53, 939-978.
Schwartz, R.A., 1974, “An Economic Model of Trade Credit,” Journal of Financial and QuantitativeAnalysis 9, 643-657.
Senbet, L.W. and J.K. Seward, 1995, “Financial Distress, Bankruptcy and Reorganization,” in R. Jarrow, V.Maksimovic, and W.T. Ziemba, Eds., Handbook in OR and MS, Vol. 9, Elsevier Science, Amsterdam,Netherlands.
Smith, J.K., 1987, “Trade Credit and Informational Asymmetry,” Journal of Finance 42, 863-872.
White, H., 1980, “A Heteroskedasticity-Consistent Covariance Matrix Estimator and a Direct Test forHeteroskedasticity,” Econometrica 48, 817-830.
Wilner, B., 2000, “The Exploitation of Relationships in Financial Distress: The Case of Trade Credit,”Journal of Finance 55, 153-178.