tracking data to improve financial performance
TRANSCRIPT

P E R F O R M A N C E B E N C H M A R K I N G T O O L K I T
F O R R U R A L H E A LT H C E N T E R S
Tracking Data to Improve Financial Performance

1 | Performance Benchmarking Toolkit for Rural Health Centers: Tracking Data to Improve Financial Performance © 2021, Capital Link
H E A L T H C E N T E R F I N A N C I A L P E R F O R M A N C E A N A L Y T I C S
During this period of rapid industry transformation, it is increasingly important for health centers to measure and monitor organizational data to inform financial management decisions and demonstrate value. Applying data analysis tools helps leaders more effectively track performance, engage staff, understand key drivers, and incorporate operational insights to position the health center for financial sustainability and continued success.
Historical financial and operational data, when put into a comparative context, are signposts on the path to financial stability. The key components of the data analytics process can be simplified as follows:
TRACK BENCHMARK MONITOR ADJUST
This toolkit provides guidance for rural health centers in applying these concepts to better understand and improve their health center’s financial performance. Benefits of Benchmarking
Health center performance is impacted by many internal and external factors. Performance benchmarking is beneficial because it supports the factors that lead to long-term financial sustainability, as illustrated in the model at right.
This toolkit recommends methods of tracking and benchmarking financial and operational data in order to strengthen operational performance. Strategies for impacting clinical outcomes and patient satisfaction are beyond the scope of this resource, although these performance areas become increasingly important to health centers’ financial sustainability as they transform from volume-based to value-based reimbursement.
The suggested metrics in this toolkit are not intended to offer simple solutions to the challenges of complex, interconnected operational models but rather are intended to facilitate more detailed analysis and discussion with key stakeholders of your health center.
B E N C H M A R K I N G B E N E F I T S
Productive Teams
Stable Operations
High Staff and Patient Satisfaction
Quality Outcomes/ Access/Depth of Care
Financial Sustainability

2 | Performance Benchmarking Toolkit for Rural Health Centers: Tracking Data to Improve Financial Performance © 2021, Capital Link
Health centers should regularly monitor 12-15 performance measures using data available from financial statements, practice management systems, and Uniform Data System (UDS) reporting. However, each organization should adapt this model to track the statistics most relevant for its own performance goals and objectives.
W H A T M E T R I C S S H O U L D I T R A C K ?
F E E - F O R - S E R V I C E P A Y M E N T E N V I R O N M E N T
The following financial and operational metrics are relevant in a fee-for-service model, where volume of visits drives revenue generation.
K E Y F I N A N C I A L A N D O P E R AT I O N A L M E T R I C S
W HY T H I S I S I M P O R TA N T F O R M U L A
FINANCIAL HEALTH (CORPORATE LEVEL)
Operating Margin Assesses overall strength of business model; margins are typically small but need to be positive
Change in Operating Net AssetsTotal Operating Revenue
Bottom Line MarginShows whether performance is dependent upon large capital grants and/or other sources of non-operating revenue
Change in Net AssetsTotal Operating Revenue
Personnel-Related Expense as Percent of Revenue Consumes 70-75% of revenues; key driver of financial performance
(Salaries and Related Expenses + Fringes and Payroll Taxes +
Professional/Contracted/Consultant Fees)Total Operating Revenue
Days in Net Patient Accounts Receivable Reflects effectiveness of financial management, which starts with collecting money efficiently
Net Patient Accounts ReceivableNet Patient Service Revenue / 360
Days Cash on HandMeasures cash management and whether there is enough liquidity to keep operations running smoothly
(Unrestricted Cash + Investments)(Total Operating Expenses
- Depreciation) / 360
PRODUCTIVITY AND FINANCIAL OPERATIONS (PRODUCE FOR EACH SERVICE AREA)
Provider Productivity (Visits)Visit productivity is the basis for revenue generation [in a fee-for-service environment]
Provider VisitsProvider FTEs
Mid-level Productivity (Visits)Visit productivity is the basis for revenue generation [in a fee-for-service environment]
Mid-Level VisitsMid-Level FTEs
Cost (and Revenues) per VisitUnderstand how your visit costs and revenues are changing over time. Do your revenues exceed cost?
Total Expenses (or Revenues) Total Visits
Visit Growth RatesAssess how quickly visits are growing.More visits drive higher revenues in a fee-for-service environment
(Total Visits Current Period)- (Total Visits in Prior Period)Total Visits in Prior Period

3 | Performance Benchmarking Toolkit for Rural Health Centers: Tracking Data to Improve Financial Performance © 2021, Capital Link
V A L U E - B A S E D P A Y M E N T E N V I R O N M E N T
W H A T M E T R I C S S H O U L D I T R A C K ?
As health centers transition to value-based reimbursement more focused on outcomes, the following metrics become increasingly important. Track these metrics in addition to the financial and operational metrics described under a Fee-For-Service business model.
PRODUCTIVITY AND FINANCIAL OPERATIONS (PRODUCE FOR EACH SERVICE AREA)
Clinical Provider Productivity (Patients) Becomes more important in transition to patient-centered care models
PatientsClinical Provider FTEs
Clinical Team Productivity Productive team-based care depends on integrated staff and program planning
Total PatientsTotal Clinical Staff FTEs
Cost per Patient Understanding and managing costs is critical as reimbursement methodologies change
Total ExpensesTotal Patients
Revenues per Patient Revenues per patient must exceed expenses per patient to ensure financial sustainability
Total RevenuesTotal Patients
STAFFING AND UTILIZATION (PRODUCE FOR EACH SERVICE AREA)
Clinical Support Staff Ratio How does your team composition track with productivity?
Clinical Support Staff FTEsProvider FTEs
Non-Clinical Staff Ratio Strategic balancing of personnel costs is key for financial sustainability
Total Facility and Non-ClinicalSupport Staff
Total FTEs
Patient Growth Rates Are patients growing faster than visits? Is demand growing?
(Total Patients) Current Period - (Total Patients) in Prior Period)
Total Patients in Prior Period
K E Y F I N A N C I A L A N D O P E R AT I O N A L M E T R I C S
W HY T H I S I S I M P O R TA N T F O R M U L A

4 | Performance Benchmarking Toolkit for Rural Health Centers: Tracking Data to Improve Financial Performance © 2021, Capital Link
01
M A K I N G D A T A M E A N I N G F U L T H R O U G H B E N C H M A R K I N G
Benchmarking Considerations
Since health centers are mission-driven, financial benchmarks must be considered in the context of other non-profit industries. Extremely high margins or liquidity do not necessarily support long-term sustainability if programs and services are compromised in the short run. Health center leaders need to carefully assess their own performance objectives within the context of their organizational mission and evaluate results accordingly.
For meaningful comparative analysis, it is important to calculate selected performance metrics compared to peers and industry benchmarks or standards. Health centers should also be consistent with their own internal calculations so that period-to-period internal analysis is relevant.
Identifying appropriate health center peer groups and benchmarks as well as finding comparative performance data can be challenging, but consider the resources listed on the following page.
Benchmarking is the process of evaluating data by comparison with a standardized reference point, allowing health center leadership to better interpret performance results and make management decisions accordingly. Metrics aid in decision-making by revealing trends or indicators for deeper analysis.
AGAINST YOURSELF
AGAINST YOUR PEERS
WHAT CAN YOU COMPARE YOUR
PERFORMANCE TO?
AGAINST INDUSTRY
STANDARDS
Budget to actualsPeriod-to-period trending
High performers Industry guidelinesPayer contractual targets
Local, regional, state, nationalClinic type, size, location
5 | Performance Benchmarking Toolkit for Rural Health Centers: Tracking Data to Improve Financial Performance © 2021, Capital Link
M A K I N G D A T A M E A N I N G F U L T H R O U G H B E N C H M A R K I N G
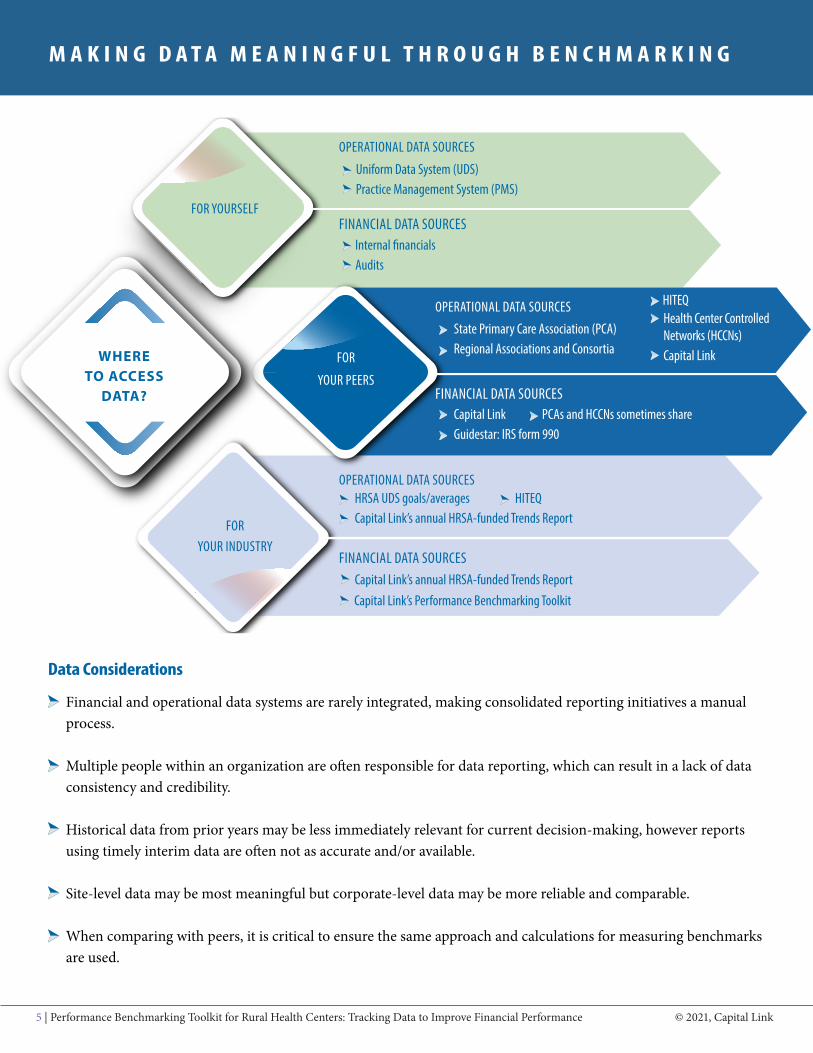
Data Considerations
Financial and operational data systems are rarely integrated, making consolidated reporting initiatives a manual process.
Multiple people within an organization are often responsible for data reporting, which can result in a lack of data consistency and credibility.
Historical data from prior years may be less immediately relevant for current decision-making, however reports using timely interim data are often not as accurate and/or available.
Site-level data may be most meaningful but corporate-level data may be more reliable and comparable.
When comparing with peers, it is critical to ensure the same approach and calculations for measuring benchmarks are used.
01
WHERE TO ACCESS
DATA?
FOR YOURSELF
FOR YOUR INDUSTRY
FOR
YOUR PEERS
FINANCIAL DATA SOURCESInternal financialsAudits
OPERATIONAL DATA SOURCES
Uniform Data System (UDS)Practice Management System (PMS)
FINANCIAL DATA SOURCESCapital Link’s annual HRSA-funded Trends Report
OPERATIONAL DATA SOURCESHRSA UDS goals/averagesCapital Link’s annual HRSA-funded Trends Report
HITEQ
OPERATIONAL DATA SOURCES
State Primary Care Association (PCA)Regional Associations and Consortia
Health Center Controlled Networks (HCCNs) Capital Link
HITEQ
FINANCIAL DATA SOURCESCapital Link Guidestar: IRS form 990
PCAs and HCCNs sometimes share
Capital Link’s Performance Benchmarking Toolkit

6 | Performance Benchmarking Toolkit for Rural Health Centers: Tracking Data to Improve Financial Performance © 2021, Capital Link
W H A T T O C O M P A R E P E R F O R M A N C E T O ?
*Calculated by Capital Link with available financial audits and UDS data as of 2019. Productivity measures are for Medical Services only.
This worksheet provides Capital Link’s recommended metrics and targets, along with the latest rural medians and space to fill in your own health center’s targets and current results. Contact http://caplink.org/contact-form for an Excel version of this worksheet (provided free to Federally Qualified Health Centers).
PRODUCTIVITY AND FINANCIAL OPERATIONS (PRODUCE FOR EACH SERVICE AREA)
Clinical ProviderProductivity (Patients) N/A 807
Clinical Team Productivity (Patients) N/A 279
Cost per Patient N/A $944
Revenue per Patient N/A $989
STAFFING AND UTILIZATION
Clinical Support Staff Ratio N/A 1.8
Non-Clinical Staff Ratio N/A 37%
Patient Growth Rate N/A 3%
C A P I TA L L I N K TA R G E T
R U R A L 2019 M E D I A N*
H E A LT H C E N T E R
TA R G E TS( S E T BY C E N T E R )
C U R R E N T YE A R H E A LT H
C E N T E R R E S U LTS
FINANCIAL HEALTH (CORPORATE LEVEL)
Operating Margin >3% 3.0%
Bottom Line Margin >3% 4.1%
Personnel-RelatedExpense as Percent of Revenue
<70% 72.0%
Days in Net Patient Accounts Receivable
<60 Days 38
Days Cash on Hand >45 Days 75
PRODUCTIVITY AND FINANCIAL OPERATIONS (PRODUCE FOR EACH SERVICE AREA)
Provider Productivity (Visits) N/A 2,605
Mid-level Productivity (Visits) N/A 2,355
Cost per Visit N/A $250
Revenue per Visit N/A $262
Visit Growth Rate N/A 6%
F E E - F O R - S E R V I C E
V A L U E - B A S E D

7 | Performance Benchmarking Toolkit for Rural Health Centers: Tracking Data to Improve Financial Performance © 2021, Capital Link
Monitoring Performance Through Visual Dashboards
While a detailed data analysis and comparisons across a variety of key metrics are helpful, health centers may wish to monitor a more limited set of indicators in a graphical format by using a dashboard.
Some software packages used by health centers offer dashboard reporting modules, including those that are attached to practice management systems that track detailed clinical and operational measures. Dashboards from financial and accounting software, when available, can be helpful but are not usually linked to operational or utilization data sources. Whether the goal is financial sustainability or continued growth, health centers must look for ways to integrate raw data from various sources into visually compelling reports that will allow clinic leadership to routinely monitor ongoing performance.
W H A T D O E S I T M E A N ?
K E Y S T E P S : C R E A T I N G F I N A N C I A L A N D O P E R A T I O N A L P E R F O R M A N C E D A S H B O A R D S
CHOOSE YOUR FINANCIAL AND OPERATIONAL
METRICS
MATCH YOUR REPORTING OBJECTIVES
TO YOUR AVAILABLE DATA SOURCES
EXPLORE YOUR AVAILABLE
REPORTING TOOLS
IDENTIFY YOUR
AUDIENCE
Limit what you are tracking regardless of the audience (10-12 metrics)Stay consistent with your ratio definitions and calculations
Annual results are often most reliable: Audits, UDS, etc.Monthly/quarterly data better support real-time decision making: PMS systems, interim financials, etc.Reporting frequency also depends on data needs of target audience (boards of directors vs. executive management vs. clinic managers)
If dashboard software is not available, look to Microsoft Excel as a relatively easy tool for charting performance resultsDashboards typically require an investment of time to set up, but then templates are efficient to run for routine reporting
Dashboards are more effective if you tailor them for the intended audienceConsider data fluency; clinic boards of directors need more limited, priority information while clinic managers want more detail

8 | Performance Benchmarking Toolkit for Rural Health Centers: Tracking Data to Improve Financial Performance © 2021, Capital Link
Revenue Cycle Management (RCM): Better billing and collections means more revenues. Net Patient Services Revenues comprise 65% of revenues for health centers nationally.
Revenue maximization starts with the front desk; ensure staff is well trained and motivated for patient enrollment in appropriate insurance programs and collection of minimum visit payments.
Routinely monitor key revenue cycle metrics, including registration and scheduling efficiency. Several RCM best practices benchmarks are listed below.
Closely monitor changes in payer mix and reimbursement rates as these drive the operating budget. Ensure staff are trained to bill and collect from all sources.
Consider outsourcing aspects of collections processes as a way to increase revenue and decrease related administrative costs. Many RCM contractors will provide a no-cost analysis of potential revenue enhancements.
R E V E N U E S30%
M A X I M I Z I N G R E V E N U E S
Grants/Contracts Revenues:Most health centers generate 30% of overall revenues from this source.
Determine if there are opportunities to secure additional grant or fundraising income to support program expenses.
This source often shows greater variability over time, so plan accordingly.
T Y P I C A L H E A L T H C E N T E R R E V E N U E M I X
30%65%
5%
Net Patient Service Revenues
Contributions/Other
Grants Including Section 330
R C M B E S T P R A C T I C E S G U I D E L I N E S
Cash Collections at Check-in Rate:
75-80%
Registrar Registration Rate: 40/day
Schedule Occupancy Rate:
95% Capacity
Pre-Registration Rate: >98% Insurance
Verification Rate: >98%

9 | Performance Benchmarking Toolkit for Rural Health Centers: Tracking Data to Improve Financial Performance © 2021, Capital Link
M A N A G I N G E X P E N S E S
When benchmarking tools indicate a potential weakness in one or more specific areas, management should further analyze the reasons and take action as appropriate. It is important to align revenues and expenses with organizational priorities to ensure financial sustainability. Leaders should closely monitor the key revenue and expense categories and adjust controllable items in the short-term while reviewing major longer term and/or strategic changes.
Employment Expenses:Personnel-related costs, including benefits and contracted services comprise 75% of overall health center expenses
E X P E N S E S
Supplies and Services Expenses:Represent 10-15% of costs for a typical center
Group purchasing programs (GPOs) are a no-cost membership option that provide savings on many products and services — often in the range of 10-20% per line item. Most programs will provide a free analysis to identify potential savings.
Facilities Expenses:Comprise 5-10% of costs for a typical center
Take advantage of creative, low-cost financing sources available to health centers to fund capital expansion or renovations projects. Some financing programs can even provide project equity to reduce debt. Given current market conditions, consider refinancing opportunities to reduce interest expense.
75% EMPLOYMENT
SUPPLIES AND SERVICES
FACILITIES5 -10%
10 -15%
Health insurance is one of the organization’s highest costs — review options for higher deductibles (even if self-funded/ subsidized by the health center, this strategy often saves money).
Evaluate the balance between salaries and benefits to ensure it is reflective of the demographics and priorities of your staff.
Monitor clinical services — track the volume of referrals and patient satisfaction with services on an annual basis to determine at what point in-house services are more cost-effective.
Consider support services — as the size and number of sites grows, monitor the cost and benefit of utilizing outside resources to maintain facilities and handle similar activities.
T Y P I C A L H E A LT H C E N T E R C O S T S T R U C T U R E

10 | Performance Benchmarking Toolkit for Rural Health Centers: Tracking Data to Improve Financial Performance © 2021, Capital Link
A N A L Y Z E A N D A D J U S T : R E V E N U E A N D E X P E N S E S
Health center managers often focus on productivity as the key driver of financial performance. However, productivity is a function of many operational dynamics, most notably the inter-connections between staffing, process, and facility. Real improvement, particularly for team-based care models, often requires addressing these three performance drivers simultaneously.
Staffing:Staffing plans must strategically utilize each member of the team in ways that support the team-based care model
G O A L S
Increase the number of patients that each individual provider can effectively manage by finding the right mix of support staff that best meets the needs of your patients, particularly given the growing shortage of providers. Increase breadth and depth of services offered to those patients to improve outcomes and minimize overall healthcare costs.
S T R A T E G I E S
For each site, determine and monitor the type and number of staff required to support the desired program utilizing the chosen model in the available facility.
Develop team productivity targets based on industry benchmarks and regularly track progress toward achieving those goals.
Share results in a public forum as increased incentive to improve performance.
11 | Performance Benchmarking Toolkit for Rural Health Centers: Tracking Data to Improve Financial Performance © 2021, Capital Link
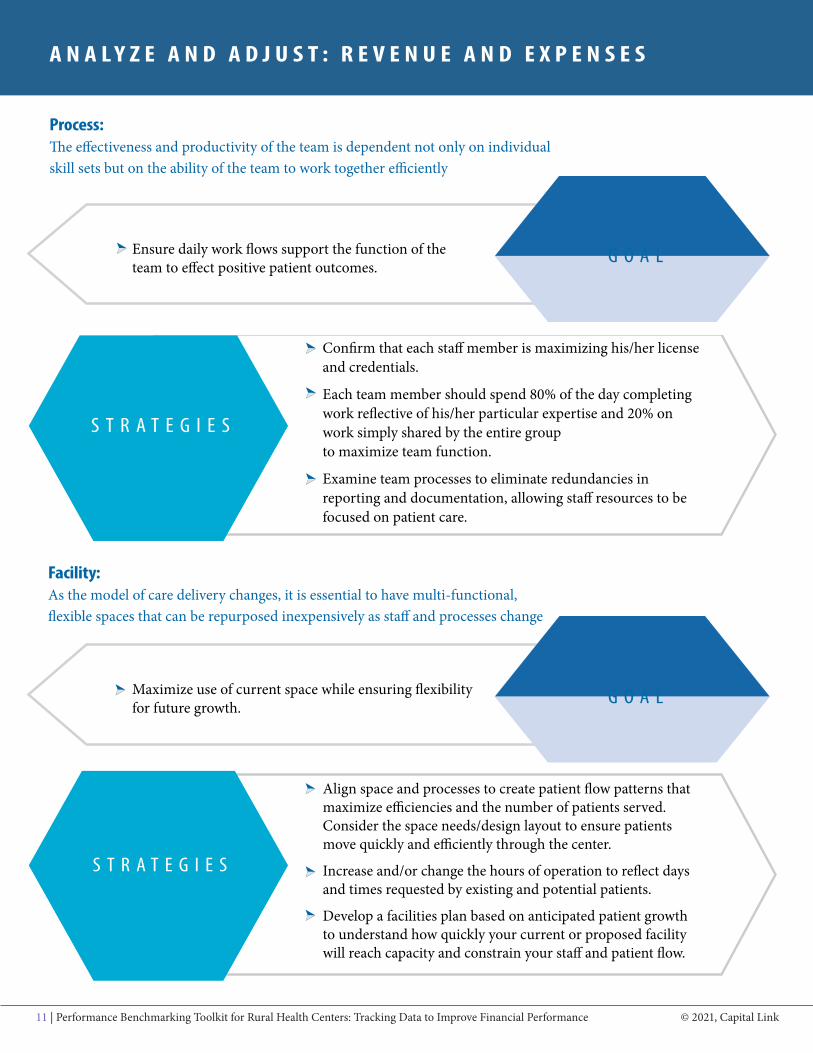
Process:The effectiveness and productivity of the team is dependent not only on individual skill sets but on the ability of the team to work together efficiently
Facility: As the model of care delivery changes, it is essential to have multi-functional, flexible spaces that can be repurposed inexpensively as staff and processes change
A N A L Y Z E A N D A D J U S T : R E V E N U E A N D E X P E N S E S
G O A LEnsure daily work flows support the function of the team to effect positive patient outcomes.
S T R A T E G I E S
Confirm that each staff member is maximizing his/her license and credentials.
Each team member should spend 80% of the day completing work reflective of his/her particular expertise and 20% on work simply shared by the entire group to maximize team function.
Examine team processes to eliminate redundancies in reporting and documentation, allowing staff resources to be focused on patient care.
Maximize use of current space while ensuring flexibility for future growth.
S T R A T E G I E S
Align space and processes to create patient flow patterns that maximize efficiencies and the number of patients served. Consider the space needs/design layout to ensure patients move quickly and efficiently through the center.
Increase and/or change the hours of operation to reflect days and times requested by existing and potential patients.
Develop a facilities plan based on anticipated patient growth to understand how quickly your current or proposed facility will reach capacity and constrain your staff and patient flow.
G O A L

12 | Performance Benchmarking Toolkit for Rural Health Centers: Tracking Data to Improve Financial Performance © 2021, Capital Link
W E B R E S O U R C E S
National Association of Community Health Centers’ Research and Data
U.S. Department of Health and Human Services, Data
U.S. Dept of Health & Human Services, Clinical and Financial Measures
Office of Statewide Health Planning and Development, Healthcare Data
Health Center Resource Clearinghouse
W E B I N A R S
Rural America: The Current State of Health Care Access
Sustaining and Increasing Access to Care in Rural Communities Learning Collaborative
Developing a Community Health Center Capital Project Plan and Budget
Part One Part Two
Developing a Business Plan and Financial Forecast for a Health Center Capital Project
Financial and Operational Benchmarking Trends and Techniques
P U B L I C A T I O N S
Hallmarks of High Performance: Exploring Relationships betweeen Clinical, Financial and Operations Excellence at America’s Health CentersCapital Link
FQHC Roles and Opportunities Related to Rural Hospital Distress and ClosureCapital Link
The Financial Impact of COVID-19 on Rural Federally Qualified Health CentersCapital Link and National Association of Community Health Centers
Rural Federally Qualified Health Centers Financial and Operational Performance Analysis 2016-2019Capital Link
California Community Health Centers: Financial and Operational Performance Analysis, 2016-2019; and Performance Benchmarking Toolkit for California Health CentersCapital Link
Federally Qualified Health Centers: Financial and Operational Performance Analysis, 2016-2019Capital Link
Cost Per Visit: Measuring Health Center Performance Capital Link and National Association of Community Health Centers
High-Performance Community Health Centers: Learning, Measuring, and Achieving Capital Link
A D D I T I O N A L R E S O U R C E S

13 | Performance Benchmarking Toolkit for Rural Health Centers: Tracking Data to Improve Financial Performance © 2021, Capital Link
This resource was supported by the Health Resources and Services Administration (HRSA) of the U.S. Department of Health and Human Services (HHS) under cooperative agreement number U30CS09741, Training and Technical Assistance National Cooperative Agreement (NCA) for $1.275 million with 0% of the total NCA project financed with non-federal sources. This information or content and conclusions are those of the author and should not be construed as the official position or policy of, nor should any endorsements be inferred by HRSA, HHS, or the U.S. Government.
A B O U T C A P I T A L L I N K
Capital Link is a national, non-profit organization that has worked with hundreds of community health centers and Primary Care Associations for over 25 years to plan for sustainability and growth, access capital, improve and optimize operations and financial management, and articulate value. Established through the health center movement, Capital Link is dedicated to strengthening health centers—financially and operationally—in a rapidly changing marketplace. For more information, visit us at www.caplink.org.
A C K N O W L E D G E M E N T