tracking 2003 act -tested high school graduates: college ... · pdf filetracking 2003...
TRANSCRIPT

*050202120* Rev 1
Tracking 2003 ACT®-Tested High School Graduates: College Readiness, Enrollment, and Long-Term Success
Justine Radunzel Julie Noble
April 2012
ACT Research Report Series
2012 (2)

For additional copies, write: ACT Research Report Series P.O. Box 168 Iowa City, IA 52243-0168
© 2012 by ACT, Inc. All rights reserved.

Tracking 2003 ACT®-Tested High School Graduates: College Readiness, Enrollment, and Long-Term Success
Justine Radunzel Julie Noble


ii
Abstract
This study examined the relationships between multiple measures of college readiness
and success in college. Outcomes included enrollment in college immediately after high school,
retention in college, and degree completion. College readiness indicators at time of high school
graduation included ACT® scores and Benchmark attainment, high school coursework taken, and
grade point average. College success was also evaluated by early readiness indicators,
individually and in combination, from grade 8 through grade 11/12.
The primary data sources for the study consisted of all ACT-tested 2003 high school
graduates (for enrollment) and a stratified random sample of 24,850 of these high school
graduates who immediately enrolled in college in fall 2003 (for retention and degree
completion). Over 5,000 of the enrolled students had also participated in EXPLORE® and
PLAN®. Results were disaggregated by institution type.
The results of this study demonstrate the importance of college readiness for enrollment
in college and for persistence to timely degree completion. This study also documents the
benefits of a longitudinal assessment system for monitoring students’ readiness early and often.
A longitudinal system provides an infrastructure to intervene and better prepare students for
college and career, before they graduate from high school.

iii
Acknowledgments
The authors thank Ty Cruce for assembling the National Student Clearinghouse data, Jeff Allen
and Kurt Burkum for their helpful comments and suggestions on earlier drafts of this report, and
Cathy Lacina for her help on preparing this report.

Tracking 2003 ACT-Tested High School Graduates: College Readiness, Enrollment, and Long-Term Success
Introduction
Students must be prepared to compete in today’s highly technology-based economy,
where many well-paying jobs now being created require at least some postsecondary education
training, or the skills and knowledge equivalent to those expected of first-year college students.
Most students aspire to at least some college study, but discrepancies exist between their
educational aspirations and the coursework they complete in high school. In 2007-08, over one-
third of all college freshmen had entered college underprepared and needed to take at least one
remedial course (Aud, Hussar, Kena, Bianco, Frohlich, Kemp, & Tahan, 2011). Because
remedial courses are typically not credit-bearing courses, taking remedial coursework delays
completing education programs. In fact, according to Adelman (2004), 70% of students who take
one or more remedial reading courses fail to earn a college degree or certificate within eight
years of enrolling.
As a result, states, districts, and schools are increasingly implementing policies to help
improve the college and career readiness of their high school graduates. Forty-five states have
formally adopted the Common Core State Standards (National Governors Association Center for
Best Practices & Council of Chief State School Officers, 2011). Some states, districts, and
schools have implemented additional college readiness assessments, such as those that comprise
ACT’s longitudinal assessment system, to monitor early and often student’s progress towards
becoming college and career ready and to increase their awareness of, preparation for, and access
to higher education (ACT, 2009a).
Tests from ACT’s longitudinal assessment system include EXPLORE (taken in grade 8
or 9), PLAN (taken in grade 10), and the ACT (taken in grade 11 or 12) that measure educational
2
achievement in four content areas (English, mathematics, reading, and science). All three tests
are supported by ACT’s College Readiness Standards and share a common score scale. Each test
also has its own set of College Readiness Benchmarks, allowing student progress toward college
and career readiness to be tracked across time. The ACT College Readiness Benchmarks are the
minimum ACT test scores required for students to have a high probability of success in first-
year, credit-bearing college courses—English Composition, College Algebra, social sciences
courses, and Biology (Allen & Sconing, 2005).
Historically, numerous research studies have consistently demonstrated that college
readiness indicators, such as ACT scores, mathematics and science coursework taken in high
school, and high school grade point average (GPA), predict both early college success, as
measured by first-year college GPA, and first-to-second year retention (ACT, 2010a; Allen,
Robbins, Casillas, & Oh, 2008; Noble & Radunzel, 2007; Noble & Sawyer, 2002; Robbins,
Allen, Casillas, Peterson, & Le, 2006). In particular, ACT has found that students who meet the
ACT College Readiness Benchmarks are more likely to
enroll in college the fall following high school graduation;
persist to the second year at the same institution;
achieve a grade of B or higher in first-year college courses; and
achieve a 2.0 or higher, or 3.0 or higher, first-year college GPA (ACT, 2010a).
In addition, students who meet the English Benchmark are less likely to take remedial English,
and students who meet the Mathematics Benchmark are less likely to take remedial mathematics.
More recent studies have examined relationships between college readiness and long-
term college outcomes, including degree completion. One such study, conducted by Noble &
Radunzel (2007), found that students who met the ACT College Readiness Benchmarks had

3
higher college success rates over time, including degree completion rates, than students who did
not meet the Benchmarks. The study also found higher college success rates for students with
higher high school GPAs (compared to those with lower GPAs) and students who had taken
higher-level high school mathematics or science coursework (compared to those not taking
higher-level courses).
Unfortunately, gaps exist in college success rates across racial/ethnic and family income
groups. College enrollment rates have been found to be higher for Asian American and White
students, than for African American, American Indian, and Hispanic students (ACT, 2010a).
Higher college enrollment rates have also been found for higher-income students than for lower-
income students (Aud et al., 2011). And, of students who enroll in college, substantial numbers
do not persist to a college degree, especially students from underrepresented racial/ethnic
minority groups and those from families with lower annual incomes (ACT, 2010a; Snyder &
Dillow, 2011). However, multiple studies (ACT, 2010a; Noble & Radunzel, 2007; Adelman,
2006; Cabrera, Burkum, & La Nasa, 2005) have demonstrated that these gaps in college
enrollment, retention, and degree completion rates narrow substantially among students who are
academically prepared and ready for postsecondary education.
In the past, most ACT studies on these topics were based on convenience samples of data
from institutions or states that participated in various ACT research services or partnerships.
Based on the available data sources, these studies focused primarily on degree completion from
the institutions in which students initially enrolled. In this study, we extend our previous research
by examining these relationships for a nationally representative sample of ACT-tested high
school graduates. We also track degree completion from any institution, so that degrees earned
by transfer students are also counted. Moreover, we examine the use of early college readiness
4
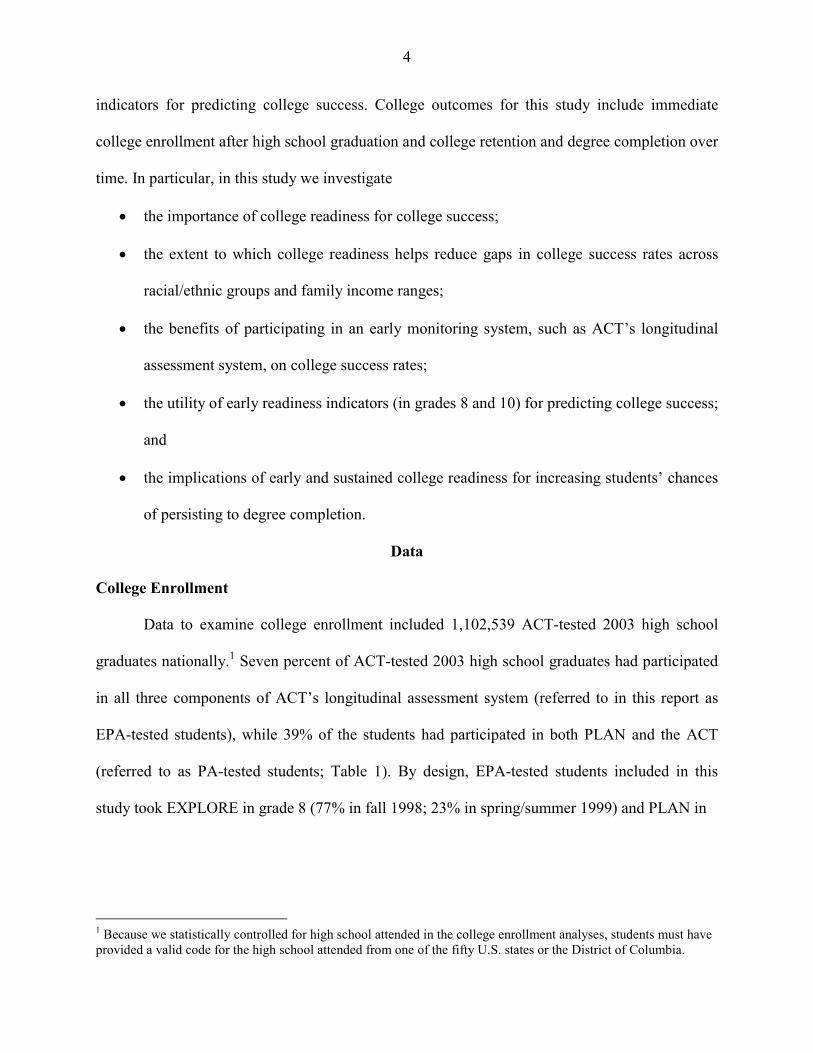
indicators for predicting college success. College outcomes for this study include immediate
college enrollment after high school graduation and college retention and degree completion over
time. In particular, in this study we investigate
the importance of college readiness for college success;
the extent to which college readiness helps reduce gaps in college success rates across
racial/ethnic groups and family income ranges;
the benefits of participating in an early monitoring system, such as ACT’s longitudinal
assessment system, on college success rates;
the utility of early readiness indicators (in grades 8 and 10) for predicting college success;
and
the implications of early and sustained college readiness for increasing students’ chances
of persisting to degree completion.
Data
College Enrollment
Data to examine college enrollment included 1,102,539 ACT-tested 2003 high school
graduates nationally.1 Seven percent of ACT-tested 2003 high school graduates had participated
in all three components of ACT’s longitudinal assessment system (referred to in this report as
EPA-tested students), while 39% of the students had participated in both PLAN and the ACT
(referred to as PA-tested students; Table 1). By design, EPA-tested students included in this
study took EXPLORE in grade 8 (77% in fall 1998; 23% in spring/summer 1999) and PLAN in
1 Because we statistically controlled for high school attended in the college enrollment analyses, students must have provided a valid code for the high school attended from one of the fifty U.S. states or the District of Columbia.

5
grade 10 (99.6% in fall 2000; 0.4% in spring 2001).2 Enrollment information was obtained from
the National Student Clearinghouse (NSC). Immediate enrollment was defined as enrolling in
college the fall following high school graduation (i.e., fall 2003).
Table 1
EPA Participation Group Sample Sizes by College Outcome
EPA participation group Enrollment
Retention and degree completion
No. (Pct.) No. (Pct.) EXPLORE/PLAN/ACT (EPA) 80,988 (7%) 5,276 (21%) PLAN/ACT (PA), no EXPLORE 345,970 (31%) 8,438 (34%) ACT only 675,581 (61%) 11,136 (45%)
Note. Enrollment analyses based on entire cohort of ACT-tested 2003 high school graduates and retention and degree completion analyses based on a random sample of those who immediately enrolled in college. No. = number; Pct. = percent.
College Retention over Time and Degree Completion
Data used to examine college retention over time and degree completion included 24,850
ACT-tested 2003 high school graduates who enrolled in college in fall 2003. This group of
students comprised a stratified random sample of all ACT-tested 2003 high school students who
enrolled in college the fall following high school graduation and who had provided their gender,
race/ethnicity, and family income range. Students who had taken EXPLORE or PLAN under
extended time were not included in the sampling frame.
We focused on students who enrolled in college immediately after high school; they
constitute the majority of incoming freshmen (U.S. Department of Education, 2002). Some
researchers suggest that it may not be appropriate to combine results for delayed enrollees and
2 A majority of 1998-1999 EXPLORE-tested students nationally tested in grade 8 and 2000-2001 PLAN-tested students nationally tested in grade 10 (90% and 92%, respectively). Only 2% of 1998-1999 EXPLORE-tested students tested in grade 9, while the remaining 8% tested in earlier grades primarily for talent search purposes. Only 3% of 2000-2001 PLAN-tested students tested in grade 11, 4% in grade 9, and the remaining 1% in other grades.

6
results for those who enroll in college immediately after high school, due to achievement,
demographic, and college outcome differences between these students, as well as numerous
possible reasons for students delaying or immediately enrolling into college (Horn, Cataldi, &
Sikora, 2005). Of ACT-tested 2003 high school graduates nationally, 7% delayed college
enrollment until the fall of 2004.
For this study, we oversampled EPA-tested and PA-tested only students, as well as
African American and Hispanic students to ensure sufficient sample sizes to address the study
objectives related to these groups of students. Oversampling of racial/ethnic minority groups
depended on EPA participation group and Benchmark attainment. Twenty-one percent of the
students in this sample were EPA-tested students, while 55% were PA-tested students (Table 1).
We obtained follow-up data on all students in the sample through fall 2010 from the NSC.
For retention and degree completion, weighted analyses were used to account for the
oversampling of certain student groups and to ensure that the results would be representative of
those for the entire population. The weights were calculated as the proportion in the population
divided by the proportion in the sample (Table 2). Because analyses were conducted separately
by institution type, as well as for EPA- and PA-tested students, the weights used in the analyses
were normalized so that the sum of the weights would equal the number of students included in
the analyses.

7
Table 2
Weights for Random Sample of ACT-Tested 2003 High School Graduates who Immediately Enrolled in College
EPA group Race/ethnicity
Sample (n = 24,850)
Population (N = 595,088) Weights
Met all 4
Did not meet all
4 Met all 4
Did not meet all
4 Met all 4
Did not meet all
4 ACT-tested only
African American 58 1,489 1,318 41,118 0.95 1.15 Hispanic 104 746 2,222 21,301 0.89 1.19 All other 8,739 283,958 1.36
PA-tested only
African American 59 777 828 15,911 0.59 0.86 Hispanic 90 407 1,205 7,346 0.56 0.75 All other 7,105 174,615 1.03
EPA-tested
African American 35 471 190 3,222 0.23 0.29 Hispanic 51 201 281 1,413 0.23 0.29 All other 4,518 40,160 0.37
Note. Sampling for African American and Hispanic students was stratified by EPA participation and by whether all four of the ACT Benchmarks were met. Sampling for all other racial/ethnic groups was stratified by EPA participation only. PA = PLAN/ACT; EPA = EXPLORE/PLAN/ACT.
Analyses were done separately by institution type, where type was determined at time of
initial enrollment.3 Seventy-six percent of the students in the sample enrolled in a four-year
institution in fall 2003 (18,860 four-year students from 1,119 four-year institutions; 5,990 two-
year students from 603 two-year institutions). This four-year enrollment rate was consistent with
that seen for students from the entire ACT-tested 2003 graduating class who immediately
enrolled in college the fall following high school graduation.
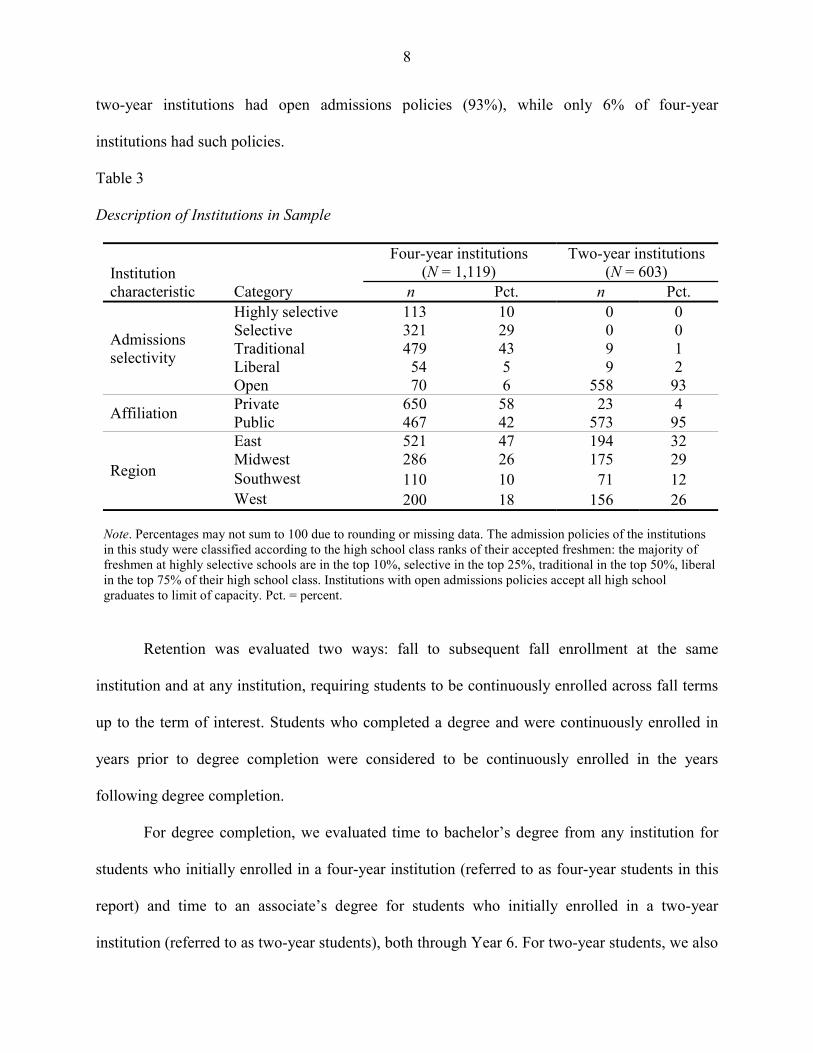
Compared to two-year institutions, a higher percentage of four-year institutions were
private institutions and were from the Eastern region of the U.S. (Table 3). The vast majority of
3 For students enrolled in multiple institutions during their first term, only one institution was included in the analyses. The selection of the institution was based on the institution from which the highest degree was earned and the greatest number of fall terms enrolled at the institution. In the sample, less than 1% of the students were initially enrolled in more than one institution (150 students enrolled at both a 2- and 4-year institution, 63 students enrolled at two 4-year institutions, and 26 students enrolled at two 2-year institutions).
8
two-year institutions had open admissions policies (93%), while only 6% of four-year
institutions had such policies.
Table 3
Description of Institutions in Sample
Institution characteristic Category
Four-year institutions (N = 1,119)
Two-year institutions (N = 603)
n Pct. n Pct.
Admissions selectivity
Highly selective 113 10 0 0 Selective 321 29 0 0 Traditional 479 43 9 1 Liberal 54 5 9 2 Open 70 6 558 93
Affiliation Private 650 58 23 4 Public 467 42 573 95
Region
East 521 47 194 32 Midwest 286 26 175 29 Southwest 110 10 71 12 West 200 18 156 26
Note. Percentages may not sum to 100 due to rounding or missing data. The admission policies of the institutions in this study were classified according to the high school class ranks of their accepted freshmen: the majority of freshmen at highly selective schools are in the top 10%, selective in the top 25%, traditional in the top 50%, liberal in the top 75% of their high school class. Institutions with open admissions policies accept all high school graduates to limit of capacity. Pct. = percent.
Retention was evaluated two ways: fall to subsequent fall enrollment at the same
institution and at any institution, requiring students to be continuously enrolled across fall terms
up to the term of interest. Students who completed a degree and were continuously enrolled in
years prior to degree completion were considered to be continuously enrolled in the years
following degree completion.
For degree completion, we evaluated time to bachelor’s degree from any institution for
students who initially enrolled in a four-year institution (referred to as four-year students in this
report) and time to an associate’s degree for students who initially enrolled in a two-year
institution (referred to as two-year students), both through Year 6. For two-year students, we also

9
examined time to an associate’s or bachelor’s degree to account for students who transferred
from a two- to a four-year institution without having earned an associate’s degree.4 Otherwise,
transfer students were treated the same as other students in this study (i.e., all students were
categorized according to the type of institution in which they initially enrolled). Time to degree
completion was calculated in months by subtracting the degree completion date from the initial
college enrollment date divided by 30.5 days.
College Readiness Indicators and Student Demographics
Data for the college readiness indicators and student demographics were obtained primarily
from the ACT student record. If students took the ACT more than once, only the most recent
ACT record was used. College readiness indicators included
meeting/exceeding the ACT College Readiness Benchmarks in English, Mathematics,
Reading, or Science;
number of ACT Benchmarks met;
ACT Composite score;
taking a core curriculum in high school;5
high school mathematics coursework taken (beyond Algebra I, Geometry, and Algebra II;
Algebra I, Geometry, and Algebra II; or less than Algebra I, Geometry, and Algebra II);
high school science coursework taken (Biology only; Biology and Chemistry; or Biology,
Chemistry, and Physics); and
high school GPA (HSGPA of 3.50 or higher; 3.00 to 3.49; less than 3.00).6
4 We did not evaluate associate’s degree completion rates for students who transferred from a four- to a two-year institution. However, the percentage of four-year students who earned an associate’s degree in six years was relatively small (5%). 5 The core curriculum, as described in A Nation at Risk (National Commission on Excellence in Eduation, 1983), includes at least 4 years of English and at least 3 years each of mathematics, social studies, and natural sciences (4-3-3-3).

10
For EPA-tested students, the college readiness indicators examined included:
meeting/exceeding the EXPLORE and PLAN College Readiness Benchmarks (by subject area
and by number met; individually and in combination labeled as combined EXPLORE/PLAN
Benchmark attainment), EXPLORE and PLAN Composite scores, and combined
EXPLORE/PLAN/ACT Benchmark attainment. Similarly, for all PA-tested students
(irrespective of whether student had participated in EXPLORE), we also included
meeting/exceeding the PLAN College Readiness Benchmarks, PLAN Composite scores, and
combined PLAN/ACT Benchmark attainment. Results for PA-tested students were in general
agreement with the results for EPA-tested students. We therefore only present results for EPA-
tested students in this report.
Scores range from 1 to 25 for EXPLORE, 1 to 32 for PLAN, and 1 to 36 for the ACT.
The Composite score is the rounded arithmetic average of the four subject area scores. The ACT
College Readiness Benchmarks correspond to scores of 18, 22, 21, and 24 on the ACT English,
Mathematics, Reading, and Science tests, respectively. Students who meet the Benchmark have
approximately a 50% chance of earning a B or better and approximately a 75% chance of earning
a C or better in the corresponding college course or courses (ACT, 2010b). In addition to the
Benchmarks for the ACT test, there are corresponding EXPLORE and PLAN Benchmarks
(Table 4) for use by students who take these programs in the eighth and tenth grades,
respectively, to gauge their progress in becoming ready for college (ACT, 2010b).
6 The categories used for HSGPA were approximately based on the tertiles of the distribution for all ACT-tested 2003 high school graduates.

11
Table 4
EXPLORE, PLAN, and ACT College Readiness Benchmarks
College course or course area
Test
EXPLORE grade 8
PLAN grade 10
ACT
English Composition English 13 15 18 College Algebra Mathematics 17 19 22 Social sciences Reading 15 17 21 Biology Science 20 21 24
High school coursework and GPAs were based on students' self-reports of their
coursework taken in 23 specific courses in English, mathematics, social studies, and science and
the grades earned in these courses.
Student demographic characteristics included
gender;
race/ethnicity (African American, Asian, Hispanic, White, and Other/Multiracial);7 and
family income range (less than $30,000, $30,000 to $60,000, and more than $60,000).
Where racial/ethnic comparisons involved smaller numbers of students, we compared
underrepresented minority students to White students. Underrepresented minority students
included African American, American Indian, and Hispanic students.
Method
For the college enrollment analyses, we estimated hierarchical logistic models that
accounted for high school attended. Weighted hierarchical logistic models were estimated to
predict retention and degree completion. These latter models accounted for initial postsecondary
institution attended. Hierarchical models account for students clustered within high schools or
postsecondary institutions. In all cases, we estimated random intercept models (in which the
7 American Indian/Alaskan Native students were included in the analyses. However, due to the small number of these students, individual results for this group are not reported.

12
intercepts, but not the slopes, were allowed to vary across institutions).8 Separate models were
developed for each type of institution (2- or 4-year institutions) by year for retention (years 2 to
4) and degree completion (years 4 to 6). Hierarchical logistic models were run in SAS 9.2 using
the GLIMMIX procedure. The estimated college success rates from these models can be
interpreted as the typical rates across high schools (for enrollment) or typical rates across two- or
four-year institutions (for retention and degree completion).
To estimate college success rates by college readiness indicators, models included one or
more college readiness indicators as predictors.9 For example, one-predictor models were used to
estimate college success rates for individual college readiness indicators using the fixed effects
parameter estimates. Three-predictor models were developed for EPA-tested students to estimate
college success rates by combined EXPLORE/PLAN/ACT Benchmark attainment. College
success rates by individual subject Benchmark attainment were estimated by including test
scores in the models as continuous predictors and then calculating a weighted average of college
success rates across students by whether or not the Benchmark was met. This estimation
approach was also used for Composite scores, the number of Benchmarks met, and HSGPA.
Models were not only developed for the overall sample of students, but also by gender,
race/ethnicity, and family income range by including the student demographic characteristic as
predictor(s) in the models. Interaction terms between the college readiness indicators and student
demographic characteristics were examined, but these interactions were generally not found to
be statistically significant at the 0.01 significance level. 8 In prior research based on retention and degree completion data that included complete freshman cohorts for the institutions, we found that the slopes for the college readiness indicators also varied across institutions. In this study the variability in the intercepts was significantly different from zero, but this was not the case for the slopes. This result is likely partially explained by the smaller institutional sample sizes in this study (based on a stratified random sample of immediately enrolled ACT-tested graduates and not complete freshman cohorts for the institutions). For consistency, random intercept models were also used for college enrollment. 9 In this study, we did not evaluate complex models. The primary goal of this study was to estimate college success rates by individual college readiness indicators.

13
Some students did not respond to high school coursework and grade items, as well as to
the family income range item, when they completed the ACT registration materials. Multiple
imputation was used to estimate missing values for the entire ACT-tested 2003 graduating class;
17% of students had missing HSGPA and 22% of students had missing family income range.
Corresponding missing percentages for the random sample of enrolled students were 8% for
HSGPA and 0% for family income range (based on sampling frame used for the latter). Five data
sets were imputed. For a few predictors, models were developed for all five imputed data sets; no
differences of practical significance in average estimated success rates were found across the
data sets. The results reported here are therefore those based only on the initial imputed data set.
One limitation to the NSC degree data was that for about 1,800 students only the degree
date and the awarding institution were provided, and not the actual type of degree that was
earned.10 Rather than excluding these students from the analyses, we implied the type of degree
based on the following information: type of awarding institution, status of whether a prior, less
advanced degree was earned, and the time to degree completion from the initial college start
date.11 The typical total enrolled time (adjusted and unadjusted for level of enrollment) and
typical time to degree completion (including and excluding summer terms) were comparable
between students with known degrees and those with implied degrees.
10 There were ~1,200 students with an unknown degree type from a four-year institution without a bachelor’s or graduate degree (such as a master’s degree) and ~600 students with an unknown degree type from a two-year institution without an associate’s degree. There were other students with bachelor’s or associate’s degrees who also had unknown degrees, but in these cases the unknown degrees were ignored. It was not uncommon in these cases for the known and unknown degree dates to be similar. 11 For students who had not earned any prior, less advanced degrees, unknown degrees from four-year institutions were classified as a bachelor’s degree if the degree was earned in 44 or more months, associate’s degree if the degree was earned in 24 to 44 months, or a certificate degree if the degree was earned in less than 24 months. Unknown degrees from two-year institutions were classified as one of the latter two degree types using the same time frames as those used for the unknown four-year degrees.

14
Results
Description of Study Samples
Tables 5 and 6 contain descriptive statistics on the student demographic characteristics
and college readiness indicators, respectively, for the overall sample of 2003 high school
graduates, as well as weighted statistics for the random sample of immediately enrolled students
disaggregated by institution type. The student demographic and college readiness percentages for
the students included in the college enrollment analyses in this study were comparable to those
previously reported for the entire ACT-tested 2003 high school graduating class (ACT, 2003).
Only about one in five of the students (21%) met all four of the ACT Benchmarks.
Table 5
Description of Student Demographics by Study Samples
Student demographic characteristic Level/value
2003 HS graduates
(N = 1,102,539)
Four-year students
(N = 18,860)
Two-year students
(N = 5,990)
n Pct. n Wgt. Pct. n
Wgt. Pct.
Race/ethnicity
Underrepresented Minority 205,889 19 3,556 18 1,176 19
African American 121,121 11 2,189 10 700 11 Hispanic 73,234 7 1,196 6 403 6 White 776,149 70 14,135 77 4,464 75 Asian 37,435 3 667 4 155 3
Gender Male 479,583 43 7,977 42 2,712 45 Female 617,805 56 10,883 58 3,278 55
Family income
< $30,000 257,030 23 3,632 19 1,664 28 $30,000-$60,000 389,772 35 6,450 34 2,469 41 > $60,000 455,737 41 8,778 47 1,857 31
Note. For the two- and four-year student samples, the percentages reported are weighted percentages. Underrepresented minority students included African American, American Indian, and Hispanic students. Percentages may not sum to 100 due to rounding, missing data, or categories that were not used in this study. The sample of ACT-tested 2003 high school graduates included in the college enrollment analyses included only students who provided a valid high school code from one of the fifty U.S. states or the District of Columbia. HS = high school; Wgt. = weighted; Pct. = percent.

15
Table 6
Description of College Readiness Indicators by Study Samples
College readiness indicator Level/value
2003 HS graduates
(N = 1,102,539)
Four-year students
(N = 18,860)
Two-year students
(N = 5,990)
n Pct. n Wgt. Pct. n
Wgt. Pct.
ACT English Benchmark
Not met 353,689 32 3,537 19 2,754 47 Met 748,850 68 15,323 81 3,236 53
ACT Mathematics Benchmark
Not met 658,285 60 8,956 47 4,647 78 Met 444,254 40 9,904 53 1,343 22
ACT Reading Benchmark
Not met 527,084 48 6,907 37 3,815 64 Met 575,455 52 11,953 63 2,175 36
ACT Science Benchmark
Not met 813,705 74 12,065 65 5,213 87 Met 288,834 26 6,795 35 777 13
Number of ACT Benchmarks met
0 290,126 26 2,647 14 2,328 40 1 194,413 18 3,094 16 1,353 22 2 218,525 20 3,994 21 1,222 20 3 171,970 16 3,607 19 614 10 All 4 227,505 21 5,518 29 473 8
ACT Composite score range
1 to 18 373,399 34 3,760 20 2,970 50 19 to 21 253,019 23 4,389 24 1,583 26 22 to 24 215,447 20 4,429 23 923 15 25 to 27 148,874 14 3,557 19 407 6 28 to 36 111,800 10 2,725 14 107 2
Core curriculum Noncore 408,879 37 5,162 28 2,751 47 Core 693,660 63 13,698 72 3,239 53
HS math course sequence
< Alg I, Geom, Alg II 160,567 15 1,310 7 1,219 21
Alg I, Geom, Alg II 376,423 34 5,876 32 2,631 44
> Alg I, Geom, Alg II 511,525 46 10,919 57 1,879 30
HS science course sequence
Bio 216,067 20 2,315 12 1,695 27 Bio & Chem 530,669 48 9,694 52 2,876 48 Bio, Chem, & Phys 262,755 24 5,605 29 930 16
HSGPA < 3.00 373,986 34 4,121 22 2,910 49 3.00 to 3.49 319,084 29 5,430 29 1,754 30 > = 3.50 409,469 37 9,309 49 1,326 22
Note. For the two- and four-year student samples, the percentages reported are weighted percentages. Percentages may not sum to 100 due to rounding, missing data, or categories that were not used in this study. HS = high school; Wgt. = weighted; Pct. = percent; HSGPA = high school grade point average; Alg = Algebra; Geom = Geometry; Bio = Biology; Chem = Chemistry; Phys = Physics.

16
In general, the immediately enrolled sample had similar student demographic and college
readiness characteristics as those of students in the entire ACT-tested 2003 high school
graduating class who immediately enrolled in college (percentages not shown). This finding also
held true when disaggregated by institution type. The one characteristic that differed slightly
between the sample and the population of immediately enrolled students was annual family
income: Proportionately fewer higher-income students were sampled, but by only three
percentage points for both four- and two-year students. Compared to undergraduate enrollment
totals at two- and four-year postsecondary institutions (Knapp, Kelly-Reid, & Whitmore, 2006),
the percentages of females in our weighted samples of enrolled students were within 1
percentage point for both institution types, but the percentages of underrepresented minority
students in our samples were lower (by 4 percentage points for four-year institutions and by 11
percentage points for two-year institutions).12
Compared to two-year students, four-year students were more likely to meet the ACT
College Readiness Benchmarks, to earn a higher ACT Composite score, to take a core
curriculum, to take higher-level mathematics and science coursework in high school, and to earn
a higher HSGPA (Table 6). In addition, four-year students were more likely to have a higher
family income range and slightly more likely to be female (Table 5).
Across high schools, 68% of ACT-tested 2003 high school students typically enrolled in
college the fall following high school graduation.13 Table 7 provides a summary of the estimated
12 Results compared to total undergraduate enrollment in fall 2004 using data from the Integrated Postsecondary Education Data System (IPEDS). Similar enrollment total breakdowns by institution type were not readily available for fall 2003. For underrepresented minority percentages from IPEDS, we excluded students with unknown race/ethnicity and those classified as nonresident aliens. Our sample of two-year ACT-tested students is likely a more homogenous group of students than the IPEDS sample of undergraduate students attending two-year postsecondary institutions. 13 Based on the random intercept models, the variability in the intercepts was significantly different from zero, which suggests that college enrollment rates varied across high schools.

17
retention and degree completion rates by year for both two- and four-year students, after
accounting for variability across institutions.
Table 7
Estimated Retention and Degree Completion Rates by Year for Two- and Four-Year Students
College outcome Four-year students Two-year students Retention to the same institution 1st to 2nd year 77 61 1st to 3rd year 64 30 1st to 4th year 57 14 Retention to any institution 1st to 2nd year 90 74 1st to 3rd year 82 56 1st to 4th year 75 44 Degree completion Bachelor’s degree Associate’s degree Year 2 < 1 7 Year 3 1 15 Year 4 35 19 Year 5 55 23 Year 6 61 24
Note. Estimates were based on weighted hierarchical logistic models. Degree completion rates by year 7 were 65% for four-year students (bachelor’s degree) and 26% for two-year students (associate’s degree).
For both two- and four-year students, rates associated with retention to the same
institution decreased at a faster rate over time than those associated with retention to any
institution (Table 7). Two-year students had much lower retention and degree completion rates
than four-year students. The typical rates for completing a bachelor’s degree at a four-year
institution increased from 35% by year 4 to 61% by year 6. Rates for completing an associate’s
degree were relatively low, with only 15% of two-year students completing an associate’s degree
by year 3 and about one in four completing an associate’s degree by year 6 (24%). In
comparison, the six-year rate for completing an associate’s degree or a bachelor’s degree for
students initially enrolled in a two-year institution was 37%.
18
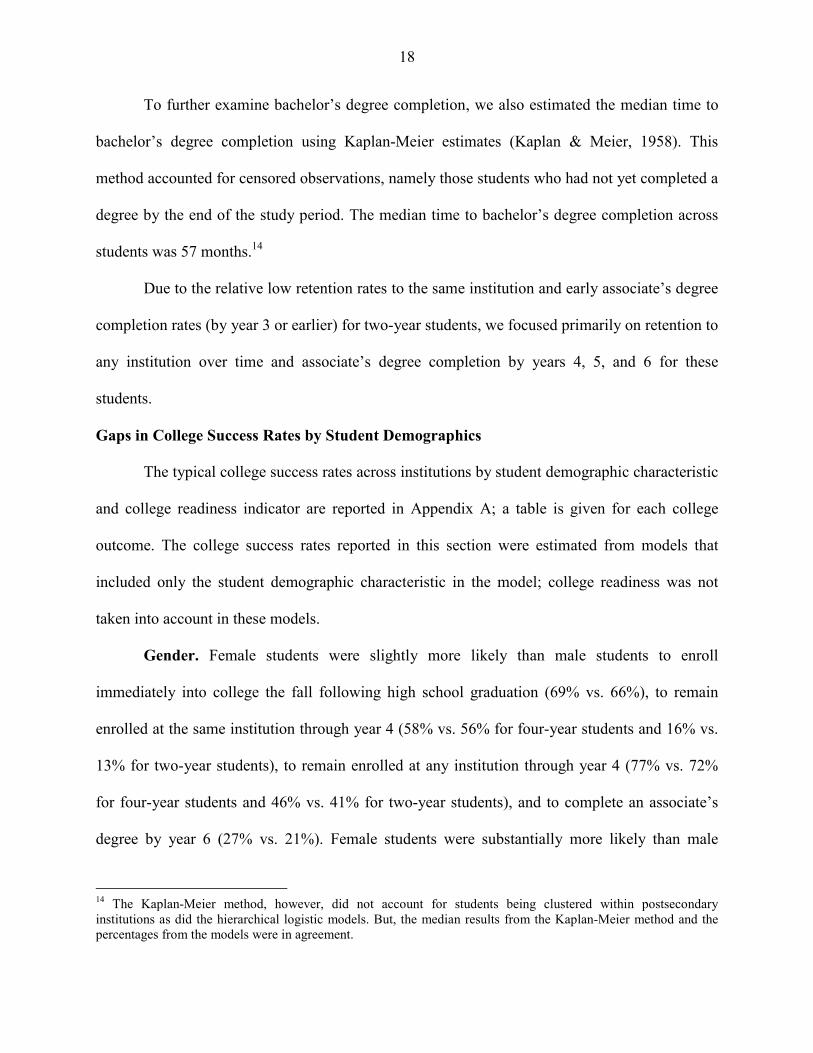
To further examine bachelor’s degree completion, we also estimated the median time to
bachelor’s degree completion using Kaplan-Meier estimates (Kaplan & Meier, 1958). This
method accounted for censored observations, namely those students who had not yet completed a
degree by the end of the study period. The median time to bachelor’s degree completion across
students was 57 months.14
Due to the relative low retention rates to the same institution and early associate’s degree
completion rates (by year 3 or earlier) for two-year students, we focused primarily on retention to
any institution over time and associate’s degree completion by years 4, 5, and 6 for these
students.
Gaps in College Success Rates by Student Demographics
The typical college success rates across institutions by student demographic characteristic
and college readiness indicator are reported in Appendix A; a table is given for each college
outcome. The college success rates reported in this section were estimated from models that
included only the student demographic characteristic in the model; college readiness was not
taken into account in these models.
Gender. Female students were slightly more likely than male students to enroll
immediately into college the fall following high school graduation (69% vs. 66%), to remain
enrolled at the same institution through year 4 (58% vs. 56% for four-year students and 16% vs.
13% for two-year students), to remain enrolled at any institution through year 4 (77% vs. 72%
for four-year students and 46% vs. 41% for two-year students), and to complete an associate’s
degree by year 6 (27% vs. 21%). Female students were substantially more likely than male
14 The Kaplan-Meier method, however, did not account for students being clustered within postsecondary institutions as did the hierarchical logistic models. But, the median results from the Kaplan-Meier method and the percentages from the models were in agreement.

19
students to complete a bachelor’s degree in a timely manner (40% vs. 27% by year 4 and 64%
vs. 57% by year 6).
Race/ethnicity. Asian and White students had the highest college enrollment rates, while
Hispanic students had the lowest college enrollment rates (ranging from 59% to 70%; Table A-
1). At four-year institutions, first-to-second year retention rates to the same institution were
somewhat comparable across racial/ethnic groups (within 4 percentage points for White,
Hispanic, and African American students; Table A-2). However, by year 4, differences in
retention rates among the racial/ethnic groups increased (to 6 percentage points for Hispanic
students and 11 percentage points for African American students, compared to White students).
For four-year students, racial/ethnic differences in retention rates to any college were slightly
higher than those noted for retention to the same college (by 1 to 2 percentage points). At two-
year institutions, Hispanic students had retention rates to any college through year 4 that were
comparable to those for White and Asian students and higher retention rates to the same college
than those for White students (Tables A-2 and A-3). African American students at two-year
institutions had the lowest retention rates to any institution (30% vs. 46% for White students at
year 4).
For students who immediately enrolled at four-year institutions, bachelor’s degree
completion rates were higher for White students and Asian students than for Hispanic students
and African American students (by 10 to 11 percentage points for Hispanic students and 18 to 19
percentage points for African American students by year 6; Figure 1 and Table A-4). For those
who initially enrolled at two-year institutions, associate’s degree completion rates were higher
for White students than for the other racial/ethnic groups (by 5 to 11 percentage points by year

20
6). This latter finding was also seen for the percentages of two-year students completing an
associate’s or bachelor’s degree (by 7 to 20 percentage points by year 6).
45
1521
63
18
34
53
2129
64
26
41
0
20
40
60
80
100
Bachelor's degree Associate's degree Associate's or bachelor'sdegree
Four-year students Two-year students
Perc
ent
African American Asian Hispanic White Figure 1. Six-year degree completion rates by race/ethnicity.
Family income range. Higher-income students were more likely than lower-income
students to enroll immediately in college in fall 2003 (74% vs. 60%), to remain enrolled at the
same institution through year 4 for four-year students (62% vs. 49%), to remain enrolled at any
institution through year 4 (81% vs. 65% for four-year students and 51% vs. 36% for two-year
students), and to complete a bachelor’s degree by year 6 for four-year students (69% vs. 49%).
Gaps in retention rates across family income groups generally increased over time. This finding
is illustrated in Figure 2 for four-year students.
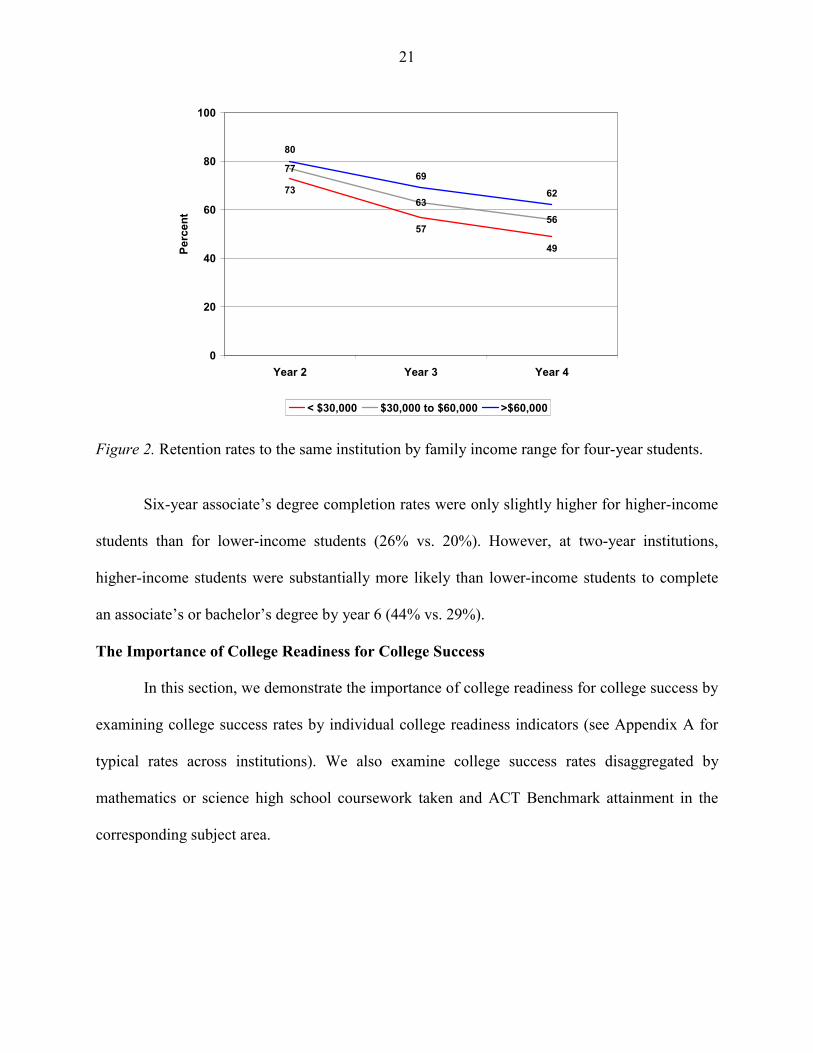
21
73
57
49
77
63
56
80
69
62
0
20
40
60
80
100
Year 2 Year 3 Year 4
Perc
ent
< $30,000 $30,000 to $60,000 >$60,000
Figure 2. Retention rates to the same institution by family income range for four-year students.
Six-year associate’s degree completion rates were only slightly higher for higher-income
students than for lower-income students (26% vs. 20%). However, at two-year institutions,
higher-income students were substantially more likely than lower-income students to complete
an associate’s or bachelor’s degree by year 6 (44% vs. 29%).
The Importance of College Readiness for College Success
In this section, we demonstrate the importance of college readiness for college success by
examining college success rates by individual college readiness indicators (see Appendix A for
typical rates across institutions). We also examine college success rates disaggregated by
mathematics or science high school coursework taken and ACT Benchmark attainment in the
corresponding subject area.

22
ACT College Readiness Benchmarks. As the number of Benchmarks met increased,
estimated success rates generally increased.15 In particular, students who met all four of the ACT
College Readiness Benchmarks were more likely than students who did not meet any of the
Benchmarks to
enroll immediately in college the fall following high school graduation (by 25 percentage
points (79% vs. 54%); Table A-1);
remain enrolled at the same institution for four-year students (by 16 percentage points at
year 2 (84% vs. 68%) and 26 percentage points at year 4 (69% vs. 43%); Table A-2);
remain enrolled at any institution for two-year students (by 13 percentage points at year 2
(83% vs. 70%) and 21 percentage points at year 4 (59% vs. 38%); Table A-3);
earn a bachelor’s degree by years 4, 5, and 6 for four-year students (by 31 to 34
percentage points (75% vs. 44% by year 6); Table A-4);
earn an associate’s degree by years 4, 5, and 6 for two-year students (by 12 to 13
percentage points (33% vs. 21% by year 6); Table A-4); and
earn an associate’s or bachelor’s degree for two-year students by year 6 (by 28
percentage points; (57% vs. 29%); data not shown in tables).
Moreover, students who met all four of the Benchmarks earned a bachelor’s degree in a more
timely manner than students who met none of the Benchmarks (time to degree completion,
medians were 47 months vs. more than 84 months, respectively).16
When typical success rates across institutions were examined by individual Benchmark
attainment, we found that success rates were generally higher for students who met the
15 The one exception was retention to the same institution for two-year students at years 3 and 4. 16 An actual median cannot be calculated for students who met none of the Benchmarks because only 47% of these students earned a bachelor’s degree by the end of year 7.

23
Benchmark than for students who did not meet the Benchmark (Tables A-1 to A-4).17 This
finding is illustrated in Figure 3 for the percentage of two-year students earning an associate’s or
bachelor’s degree by year 6. Across outcomes, the largest differences in success rates were
generally seen between students meeting and those not meeting the Benchmark in mathematics
or English. Differences in retention rates by individual ACT Benchmark attainment and by the
number of Benchmarks met generally increased over time.
2933 33 35
4553
4552
0
20
40
60
80
100
English Mathematics Reading ScienceACT College Readiness Benchmarks
Perc
ent
Not met Met Figure 3. Six-year associate’s or bachelor’s degree completion rates by ACT Benchmark attainment for two-year students.
ACT Composite score. As ACT Composite score increased, estimated success rates
increased for all the outcomes included in this study. This finding is illustrated across ACT
Composite scores for six-year degree completion rates (Figure 4) and for retention rates over
time for four-year students (Figure 5).
17 The exception was for retention to the same institution for two-year students at years 3 and 4.

24
0
10
20
30
40
50
60
70
80
90
100
7 11 15 19 23 27 31 35ACT Composite score
Perc
ent
Four-year students: Bachelor's degreeTwo-year students: Associate's degreeTwo-year students: Associate's or bachelor's degree
Figure 4. Six-year degree completion rates by ACT Composite score for two- and four-year students. Table A-5 in Appendix A contains the relevant estimated regression coefficients from the degree completion models shown here.
44
52
68
6053
7567
60
79
6773
83
7480
87
0
20
40
60
80
100
Year 2 Year 3 Year 4
Perc
ent
1 to 18 19 to 21 22 to 24 25 to 27 28 to 36
Figure 5. Retention rates to the same institution by ACT Composite score range for four-year students.

25
Students with a Composite score of 28 or higher had over a 60% chance of earning a
bachelor’s degree by year 4, while students with a Composite score of 18 or lower had less than
a 50% chance of earning a bachelor’s degree by year 6 (44%; Table A-4). The median time to
bachelor’s degree completion for four-year students with a Composite score of 28 or higher was
45 months. In comparison, the median time was more than 84 months for students with a
Composite score of 18 or lower.18 Moreover, the decline in retention rates from year 2 to year 4
was larger for students with lower ACT Composite scores. For instance, students with
Composite scores of 18 or lower had only about a 50% chance or lower of persisting to the same
four-year institution beyond year 2 (Figure 5).
High school coursework and high school GPA. College enrollment, retention, and degree
completion rates were higher for students who had
taken a core curriculum in high school compared to those who had not (by, at most, a
maximum of 12 percentage points across the outcomes);
taken high school mathematics coursework beyond Algebra I, Geometry, and Algebra II,
compared to those who had taken Algebra I, Geometry, and Algebra II (by, at most, 12
percentage points) or those who had taken less than these three courses (by, at most, 25
percentage points);
taken high school Biology, Chemistry, and Physics compared to those who had taken
Biology and Chemistry only (by, at most, 6 percentage points) or those who had taken
Biology only (by, at most, 19 percentage points); and
18 An actual median cannot be calculated for students with an ACT Composite score of 18 or lower because only 47% of these students earned a bachelor’s degree by the end of year 7.

26
earned a HSGPA of 3.50 or higher compared to those who earned a HSGPA between
3.00 to 3.49 (by, at most, 19 percentage points) or those who earned a HSGPA below 3.0
(by, at most, 37 percentage points).
The largest differences in college success rates by high school coursework and HSGPA were
generally seen for either college enrollment or completing a bachelor’s degree (Tables A-1 to A-
4). For instance, about one-half of four-year students with a HSGPA of 3.5 or higher earned a
bachelor’s degree by year 4, and three-fourths of them did so by year 6. In comparison, fewer
than 40% of students with a HSGPA lower than 3.0 earned a bachelor’s degree by year 6.
High school coursework and ACT Benchmark attainment combined. In the previous
section, we reported that college success rates were higher for students who had taken higher-
level mathematics and science coursework in high school. But, when we compared college
success rates by both high school coursework taken and Benchmark attainment in the same
subject area, we found that students who take higher-level coursework but do not meet the level
of preparation necessary for entry-level credit-bearing college coursework are less likely to
succeed in college than students who take fewer higher-level courses but do meet this level of
preparation. This finding is illustrated in Figure 6, where four-year students who took Algebra I,
Geometry, and Algebra II in high school and met the ACT Mathematics Benchmark had higher
bachelor’s degree completion rates than those who took mathematics coursework beyond
Algebra II but did not meet the Benchmark.19
19 We did not include students who took less than Algebra I, Geometry, and Algebra II in the figure since the number of students meeting the ACT Mathematics Benchmarks for this group was substantially smaller than the corresponding numbers for the other mathematics coursework groups.

27
30
49
57
48
6874
24
4349
41
6167
0
20
40
60
80
100
Year 4 Year 5 Year 6
Perc
ent
> Alg I, Geom, & Alg II/not met > Alg I, Geom, & Alg II/metAlg I, Geom, & Alg II/not met Alg I, Geom, & Alg II/met
Figure 6. Bachelor’s degree completion rates by high school mathematics coursework taken and ACT Mathematics Benchmark attainment for four-year students. Solid lines are for those who met the Benchmark and dashed lines are for those who did not meet the Benchmark. Alg = Algebra; Geom = Geometry.
Four-year students who took Biology and Chemistry in high school and met the ACT
Science Benchmark had higher retention rates over time than those who took Biology,
Chemistry, and Physics in high school but did not meet the ACT Science Benchmark (Figure 7).

28
58
65
7869
76
86
5562
7666
71
82
0
20
40
60
80
100
Year 2 Year 3 Year 4
Perc
ent
Bio, Chem, & Phys/not met Bio, Chem, & Phys/metBio & Chem/not met Bio & Chem/met
Figure 7. Retention rates to the same institution by high school science coursework taken and ACT Science Benchmark attainment for four-year students. Solid lines are for those who met the Benchmark and dashed lines are for those who did not meet the Benchmark. Bio = Biology; Chem = Chemistry; Phys = Physics.
These findings suggest that simply taking more courses is not enough to prepare students
for college-level coursework. High school courses taken must be of sufficient depth and rigor to
prepare students for college and career.
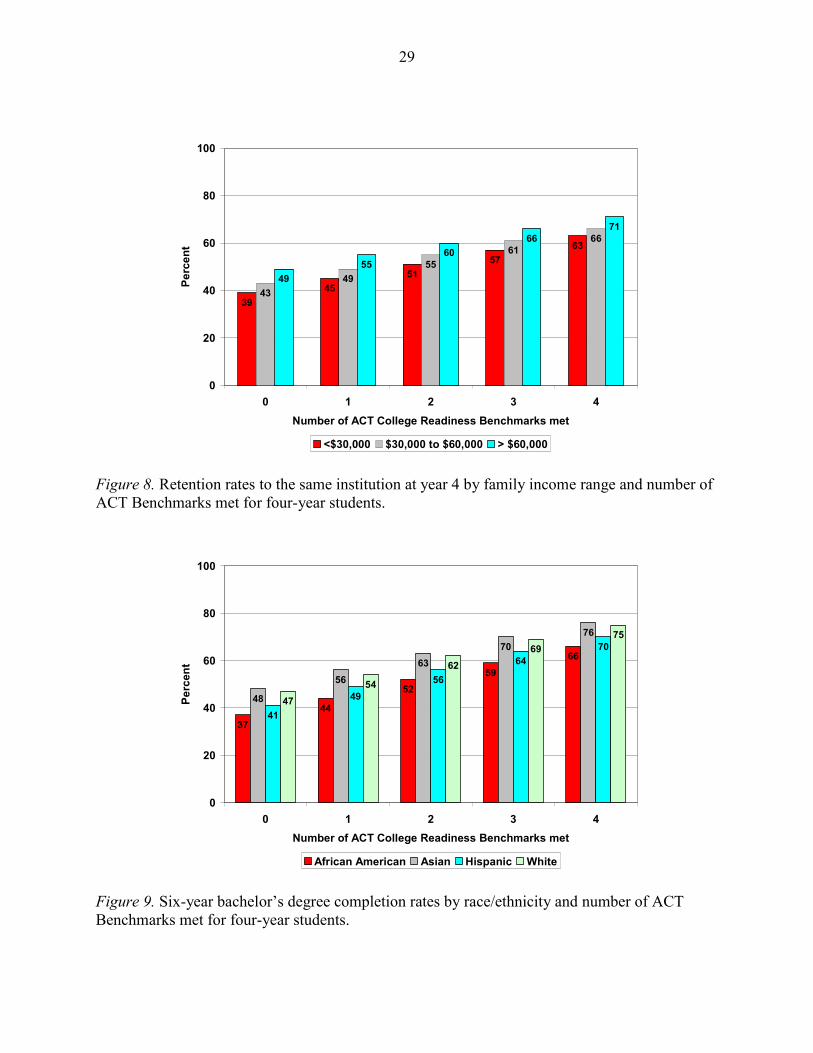
Student demographics. The relationships previously reported for all students held true
when examined by gender, race/ethnicity, and family income range. For example, for all student
demographic groups, as the number of Benchmarks met increased, college success rates also
increased (see Figure 8 for retention rates at year 4 by family income range and Figure 9 for six-
year bachelor’s degree completion rates by race/ethnicity). However, the relative position of each
family income range generally remained the same, regardless of the number of Benchmarks met.
This latter finding also held true across the racial/ethnic groups for some but not all of the
outcomes (i.e., for degree completion but not for college enrollment).
29
3945
5157
63
4349
5561
66
4955
6066
71
0
20
40
60
80
100
0 1 2 3 4Number of ACT College Readiness Benchmarks met
Perc
ent
<$30,000 $30,000 to $60,000 > $60,000 Figure 8. Retention rates to the same institution at year 4 by family income range and number of ACT Benchmarks met for four-year students.
3744
5259
66
48
5663
7076
41
4956
6470
4754
6269
75
0
20
40
60
80
100
0 1 2 3 4Number of ACT College Readiness Benchmarks met
Perc
ent
African American Asian Hispanic White
Figure 9. Six-year bachelor’s degree completion rates by race/ethnicity and number of ACT Benchmarks met for four-year students.

30
Section summary. College success rates were generally higher for college-ready
students from both two- and four-year institutions than for those not ready for college and career,
and held true when examined by gender, race/ethnicity, and family income range. In addition,
while taking the right courses in high school appeared to help improve college success rates,
Benchmark attainment was more important for college success.
College Readiness Reduces Racial/Ethnic and Family Income Gaps in College Success
Rates
It was previously shown that gaps exist in college success rates across racial/ethnic and
family income groups (see Appendix A and Figures 1 and 2). But, gaps in college readiness rates
also exist among these groups: underrepresented racial/ethnic minority students and lower-
income students were less likely than White and higher-income students, respectively, to be
academically prepared for college and career. In particular, they were less likely to
meet the ACT College Readiness Benchmarks;
earn a higher ACT Composite score;
take higher level mathematics coursework in high school; and
earn a higher HSGPA.
For example, for the ACT-tested 2003 high school graduating class, 58% of African American
students, 46% of Hispanic students, and 45% of lower-income students met none of the ACT
Benchmarks, compared to 19% of White students and 15% of higher-income students.
When college success rates were evaluated by both student demographic group and the
number of ACT College Readiness Benchmarks met, we found for all student demographic
groups that as the number of Benchmarks met increased, college success rates also increased (see
Figures 8 and 9). These results also suggested that college readiness helps reduce the

31
racial/ethnic and family income gaps in college success rates. Reductions in gaps were generally
smaller for two-year students than for four-year students.20 And, reductions in family income
gaps in college success rates were generally smaller than those for racial/ethnic gaps.
To illustrate, for retention to the same institution at year 4 for four-year students, the
overall difference in retention rates between family income groups was 13 percentage points
(62% vs. 49%; Figure 2). However, for the same students who met all four of the ACT College
Readiness Benchmarks, the difference in retention rates at year 4 was reduced by 5 percentage
points to a 8 percentage point difference (71% vs. 63%; Figure 8). For two-year students, the
income gap in retention rates at year 4 was reduced by only 2 percentage points (from 15 to 13
percentage points).
For six-year bachelor’s degree completion rates for four-year students, the overall
difference in rates between Hispanic and White students was 11 percentage points (53% vs.
64%; Figure 1) and 19 percentage points between African American and White students (45%
vs. 64%). However, for four-year students who met all four of the ACT College Readiness
Benchmarks, the difference in six-year bachelor’s degree completion rates was reduced by 6
percentage points to a 5 percentage point difference between Hispanic and White students (70%
vs. 75%; Figure 9) and reduced by 10 percentage points to a 9 percentage point difference
between African American and White students (66% vs. 75%). For two-year students, the gap in
the six-year associate’s or bachelor’s degree completion rate between underrepresented
racial/ethnic minority students and White students was reduced by 4 percentage points for those
who met 3 or 4 of the Benchmarks (from 17 to 13 percentage points).
20 For two-year college outcomes by racial/ethnic group and the number of ACT Benchmarks met, we compared racial/ethnic minority students and White students who met 3 to 4 of the ACT Benchmarks since the numbers of African American and Hispanic two-year students who met all four Benchmarks were relatively small (15 or fewer students).

32
College Success Rates for Students who Participated in an Early Monitoring System
ACT research has repeatedly shown that students benefit from participating in an early
monitoring system, such as that provided by EXPLORE, PLAN, and the ACT (ACT, in press;
ACT, 2009b). Results show that early monitoring (as measured by EXPLORE and PLAN) is
associated with increased educational achievement, college and career readiness, college
enrollment, and persistence to the second year of college. In addition, early monitoring appears
to encourage students to take more college-preparatory courses in high school and to promote
educational and career planning. In this section, we evaluate the benefits of this early monitoring
system on longer-term college outcomes.
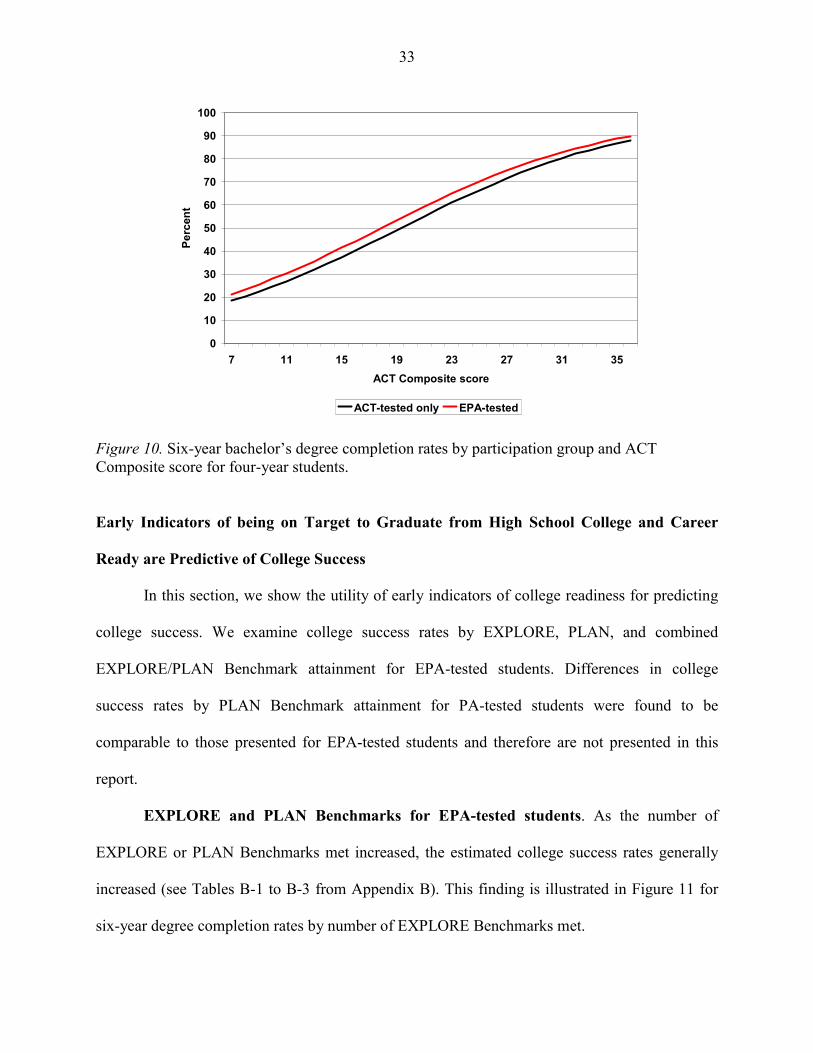
Estimated enrollment rates, retention rates at year 4 for four-year students, and six-year
bachelor’s degree completion rates for four-year students were higher for EPA-tested students
than for ACT-tested only students, after controlling for ACT Composite score. This finding is
illustrated in Figure 10 for six-year bachelor’s degree completion rates; six-year degree
completion rates were 2 to 4 percentage points higher for EPA-tested students. Differences of
similar magnitude among the early monitoring group were seen in retention rates at year 4 for
four-year students (by 2 to 4 percentage points), and larger differences were seen in immediate
enrollment rates (3 to 13 percentage points higher for EPA-tested students compared to ACT-
tested only students).21 For two-year students, there were no significant differences in college
success rates between the participation groups.
21 Larger differences among the EPA participation groups were seen for students with lower ACT Composite scores.
33
0
10
20
30
40
50
60
70
80
90
100
7 11 15 19 23 27 31 35ACT Composite score
Perc
ent
ACT-tested only EPA-tested Figure 10. Six-year bachelor’s degree completion rates by participation group and ACT Composite score for four-year students.
Early Indicators of being on Target to Graduate from High School College and Career
Ready are Predictive of College Success
In this section, we show the utility of early indicators of college readiness for predicting
college success. We examine college success rates by EXPLORE, PLAN, and combined
EXPLORE/PLAN Benchmark attainment for EPA-tested students. Differences in college
success rates by PLAN Benchmark attainment for PA-tested students were found to be
comparable to those presented for EPA-tested students and therefore are not presented in this
report.
EXPLORE and PLAN Benchmarks for EPA-tested students. As the number of
EXPLORE or PLAN Benchmarks met increased, the estimated college success rates generally
increased (see Tables B-1 to B-3 from Appendix B). This finding is illustrated in Figure 11 for
six-year degree completion rates by number of EXPLORE Benchmarks met.

34
43
1523
52
20
31
61
25
40
70
32
50
77
39
60
0
20
40
60
80
100
Bachelor's degree Associate's degree Associate's or bachelor'sdegree
Four-year students Two-year students
Perc
ent
0 1 2 3 4 Figure 11. Six-year bachelor’s degree completion rates by number of EXPLORE Benchmarks met.
For four-year students, over three-fourths of EPA-tested students who met all four of the
EXPLORE Benchmarks in grade 8 completed a bachelor’s degree within six years of enrolling in
college. In comparison, only 43% of EPA-tested students who did not meet any of the
EXPLORE Benchmarks did so. Two-year students who met all four of the EXPLORE
Benchmarks in grade 8 were nearly three times as likely as those who met none of the
Benchmarks in grade 8 to complete an associate’s degree (39% vs. 15%, respectively) or an
associate’s or bachelor’s degree (60% vs. 23%) by year 6.
College success rates were also higher for students who met the individual subject area
EXPLORE or PLAN Benchmarks than for students who did not meet the Benchmarks
(Appendix B). College success rates by EXPLORE and PLAN Benchmark attainment were
generally comparable to those by ACT Benchmark attainment.

35
EXPLORE or PLAN Composite score for EPA-tested students. Estimated college
success rates were higher for students with higher Composite scores than for students with lower
scores. This finding held true for both EXPLORE and PLAN Composite scores (see Figure 12
for bachelor’s degree completion rates across PLAN Composite scores for EPA-tested students).
0
10
20
30
40
50
60
70
80
90
100
7 11 15 19 23 27 31PLAN Composite score
Perc
ent
Year 4 Year 5 Year 6 Figure 12. Bachelor’s degree completion rates by PLAN Composite score for four-year EPA-tested students. Table B-4 in Appendix B contains the relevant regression coefficients for the degree completion models using EXPLORE or PLAN Composite score as the predictor for EPA-tested students.
Combined EXPLORE/PLAN Benchmark attainment for EPA-tested students.
Students who met all four Benchmarks in both grades 8 and 10 were substantially more likely
than students who did not meet any of the Benchmarks in grades 8 and 10 to
enroll immediately in college the fall following high school graduation (by 24 percentage
points (77% vs. 53%); Table B-1);
remain enrolled at the same institution for four-year students (by 20 percentage points at
year 2 (86% vs. 66%) and 35 percentage points at year 4 (74% vs. 39%); Table B-2);

36
remain enrolled at any institution for two-year students (by 20 percentage points at year 2
(85% vs. 65%) and 38 percentage points at year 4 (69% vs. 31%); Table B-2);
earn a bachelor’s degree by years 4, 5, and 6 for four-year students (by 42 to 44
percentage points (80% vs. 38% by year 6); Table B-3);
earn an associate’s degree by years 4, 5, and 6 for two-year students (by 25 to 29
percentage points (43% vs. 14% by year 6); Table B-3); and
earn an associate’s or bachelor’s degree for two-year students by year 6 (by 46
percentage points (66% vs. 20%)).
The largest differences in rates between these two groups of students were in degree
completion. In particular, over 50% of four-year students who met all four Benchmarks in both
grades 8 and 10 earned a bachelor’s degree (56%) by year 4, and nearly 50% of similar two-year
students earned an associate’s or bachelor’s degree (46%) by year 4. In comparison, for students
who met none of the Benchmarks in both grades, only 38% of four-year students and 20% of
two-year students did so by year 6.
Students who met 1 to 3 Benchmarks in both grades 8 and 10 also had higher college
success rates than those who met none of the Benchmarks in both grades, but they had lower
college success rates than students who met all four Benchmarks in both grades 8 and 10. This
finding is illustrated in Figure 13 for retention rates over time for four-year students.

37
39
47
66
78
6458
7477
86
0
20
40
60
80
100
Year 2 Year 3 Year 4
Perc
ent
Met 0/met 0 Met 1 to 3/met 1 to 3 Met 4/met 4
Figure 13. Retention rates to the same institution over time by combined EXPLORE/PLAN Benchmark attainment for EPA-tested four-year students.
When success rates were evaluated by combined EXPLORE/PLAN individual subject
Benchmark attainment, college success rates were found to be the highest for students who met
the Benchmarks in both grades 8 and 10 and lowest for students who did not meet the
Benchmarks in both grades. College success rates for students who did not meet the Benchmark
in grade 8 but did in grade 10 were similar to those seen for students who met the Benchmark in
grade 8 but did not in grade 10.22 This finding is illustrated in Figure 14 for six-year bachelor’s
degree completion rates for four-year students.
22 Across the subject areas, over 75% of the students in these two groups typically had EXPLORE and PLAN scores at or near the Benchmark (within 2 points).

38
39
5348
5852
6562
71
49
63 61
7268
7471
78
0
20
40
60
80
100
English Mathematics Reading Science
Perc
ent
Not met/not met Not met/met Met/not met Met/met
Figure 14. Six-year bachelor’s degree completion rates by combined EXPLORE/PLAN Benchmark attainment for four-year students.
And, students who met the Benchmark in grade 8 were substantially more likely to meet
the corresponding PLAN Benchmark in grade 10 than those who did not meet the EXPLORE
Benchmark in grade 8. This finding is illustrated in Figure 15 for all 2003 EPA-tested high
school graduates.

39
44
17
37
16
92
7681
60
0
20
40
60
80
100
English Mathematics Reading Science
Perc
ent m
et P
LAN
Ben
chm
ark
Did not meet EXPLORE Benchmark in grade 8Met EXPLORE Benchmark in grade 8
Figure 15. Percentages of students meeting PLAN Benchmarks in grade 10 by EXPLORE Benchmark attainment in grade 8 for 2003 EPA-tested high school graduates.
Student demographic groups. Across student demographic groups, college success
rates were higher for students who met individual EXPLORE or PLAN Benchmarks or greater
numbers of Benchmarks than for students who did not. We also found that students who were on
target in grades 8 and 10 to becoming college ready in all four subject areas were substantially
more likely to be successful in college than those who were not on target in either grade,
irrespective of demographic group considered.23 This finding is illustrated in Figure 16 for
college enrollment rates by combined EXPLORE/PLAN Benchmark attainment.
23 For some of the racial/ethnic groups, the number of students meeting all four Benchmarks in both grades 8 and 10 was small (<10). In these cases, we compared college success rates between underrepresented racial/ethnic minority students and White students.

40
5652
4753
4853
59
69
7872
7680
5451
7470
64
7165
717171 7377
807876
0
20
40
60
80
100
Male Female AfricanAmerican
Asian Hispanic White <$30,000 $30,000 to$60,000
> $60,000
Gender Race/ethnicity Family income range
Perc
ent
Met 0/met 0 Met 1 to 3/met 1 to 3 Met 4/met 4
Figure 16. College enrollment rates by combined EXPLORE/PLAN Benchmark attainment and student demographic group for EPA-tested students.
Section summary. College success rates were generally higher for students who were on
target in grades 8 and 10 for becoming college ready than for students who were not on target.
This result held true for both two- and four-year students and by gender, race/ethnicity, and
family income range. In addition, students who were on target in grade 8 were substantially more
likely to be on target in grade 10 for becoming college ready – this finding emphasizes the
importance of students being on track early (by grade 8).
Remaining on Target and Graduating from High School College and Career Ready
Improves College Success Rates
In this section, we examine college success rates by combined EXPLORE/PLAN/ACT
Benchmark attainment to evaluate the importance of remaining on target and graduating from
high school college and career ready. We also examine the likelihood of students meeting the

41
ACT Benchmark by early indicators of being on target to graduate from high school college and
career ready.
Combined EXPLORE/PLAN/ACT Benchmarks for EPA-tested students. Students
who met all four of the Benchmarks in grades 8, 10, and 11/12 were substantially more likely
than students who did not meet any of the EXPLORE, PLAN, and ACT Benchmarks to
enroll immediately in college the fall following high school graduation (by 27 percentage
points (78% vs. 51%); Appendix C, Table C-1);
remain enrolled at the same institution for four-year students (by 21 percentage points at
year 2 (86% vs. 65%) and 37 percentage points at year 4 (75% vs. 38%); Table C-2);
remain enrolled at any institution for two-year students (by 21 percentage points at year 2
(86% vs. 65%) and 40 percentage points at year 4 (71% vs. 31%); Table C-2);24
earn a bachelor’s degree by years 4, 5, and 6 for four-year students (by 45 to 47
percentage points (81% vs. 36% by year 6); Table C-3);
earn an associate’s degree by years 4, 5, and 6 for two-year students (by 27 to 31
percentage points (45% vs. 14% by year 6); Table C-3); and
earn an associate’s or bachelor’s degree for two-year students by year 6 (by 47
percentage points (67% vs. 20%)).
In addition, students who met 1 to 3 Benchmarks in grades 8, 10, and 11/12 had higher college
success rates than those who did not meet any of the Benchmarks in all three grades, but had
lower college success rates than students who met all four Benchmarks in all three grades.
Increases in the number of Benchmarks met between grades 10 and 11/12 were
associated with increases in the chances of EPA-tested students being successful in college. For 24 There were only 24 two-year students who met all four of the Benchmarks in grades 8, 10, and 11/12; these results should be interpreted with caution.

42
example, among students who met 0 to 2 Benchmarks in grades 8 and 10, those who met 3 to 4
ACT Benchmarks in grade 11/12 had higher college success rates than those who met 0 to 2 of
the Benchmarks in grade 11/12.25 This finding held true across college outcomes (Appendix C)
and is illustrated in Figure 17 for six-year degree completion rates. In particular, among students
who met 0 to 2 Benchmarks in grades 8 and 10, six-year bachelor’s degree completion rates were
17 percentage points higher for students who improved and met 3 to 4 ACT Benchmarks in
grade 11/12 compared to those who met 0 to 2 Benchmarks in grade 11/12 (67% vs. 50%).
50
19
30
67
28
40
0
20
40
60
80
100
Bachelor's degree Associate's degree Associate's or bachelor'sdegree
Four-year students Two-year students
Perc
ent
Met 0 to 2/met 0 to 2/met 0 to 2 Met 0 to 2/met 0 to 2/met 3 to 4
Figure 17. Six-year degree completion rates for EPA-tested students who met 0 to 2 Benchmarks in grades 8 and 10 by number of ACT Benchmarks met.
Moreover, for students who are on target early in grades 8 and 10, it is important for
these students to remain on track through grade 11/12. Figure 18 shows bachelor’s degree 25 We also considered an alternative grouping for the number of Benchmarks met (0 to 1, 2, 3 to 4) to further evaluate this finding. Among students who met 2 Benchmarks in grades 8 and 10, the estimated six-year bachelor’s degree completion rates for four-year students were 52% for students who met 0 to 1 Benchmark in grade 11/12, 61% for students who met 2 Benchmarks, and 69% for those who met 3 to 4 Benchmarks. The corresponding percentages for six-year associate’s or bachelor’s degree completion rates for two-year students were 39%, 42%, and 45%, respectively.

43
completion rates over time for four-year EPA-tested students who met 3 to 4 Benchmarks in
grades 8 and 10, but differed in Benchmark attainment at grade 11/12 (see Tables C-1 to C-3 in
Appendix C for the same comparison across outcomes). For these students, bachelor’s degree
completion rates were 13 to 15 percentage points higher for those who met 3 to 4 ACT
Benchmarks in grade 11/12, compared to those who met 0 to 2 ACT Benchmarks.
38
57
65
52
7278
0
20
40
60
80
100
Year 4 Year 5 Year 6
Perc
ent
Met 3 to 4/met 3 to 4/met 0 to 2 Met 3 to 4/met 3 to 4/met 3 to 4 Figure 18. Bachelor’s degree completion rates for four-year EPA-tested students who met 3 to 4 Benchmarks in grades 8 and 10 by number of ACT Benchmarks met.
When success rates were evaluated by combined EXPLORE/PLAN/ACT individual
subject Benchmark attainment, college success rates were generally highest for students who met
the Benchmark in grades 8, 10, and 11/12 and lowest for students who did not meet the
Benchmark in any grade. Moreover, among students who met the individual Benchmark in both
grades 8 and 10, students who remained on track and met the corresponding Benchmark in grade
11/12 had higher college success rates than students who did not. This finding was consistently
seen across college outcomes (Appendix C, Tables C-1 to C-3). Meeting the ACT Benchmark

44
appeared to be the most critical Benchmark to meet to improve students’ chances of being
successful in college. This finding is illustrated in Figure 19 for retention rates over time for
four-year EPA-tested students by combined EXPLORE/PLAN/ACT Mathematics Benchmark
attainment.
0
20
40
60
80
100
Year 2 Year 3 Year 4
Perc
ent
Not met/not met/not met Not met/not met/metNot met/met/not met Not met/met/metMet/not met/not met Met/not met/metMet/met/not met Met/met/met
Figure 19. Retention rates to the same institution by combined EXPLORE/PLAN/ACT Mathematics Benchmark attainment and year for four-year EPA-tested students.
However, students who were on target early beginning in eighth grade were the ones who
were the most likely to meet the ACT Benchmarks by the time they graduated from high school.
This finding is illustrated in Figure 20 for all 2003 EPA-tested high school graduates: Students
who met the EXPLORE Benchmark in grade 8 and PLAN Benchmark in grade 10 were
substantially more likely to meet the corresponding ACT Benchmark in grade 11/12 than those
who did not meet one or both of the EXPLORE and PLAN Benchmarks.

45
139
14 12
42
51
40
51
39 37
4548
8986
83 83
0
20
40
60
80
100
English Mathematics Reading Science
Perc
ent m
et A
CT
Ben
chm
ark
Not met/not met Not met/met Met/not met Met/met
Figure 20. Percentage of students meeting ACT Benchmarks by combined EXPLORE/PLAN Benchmark attainment for 2003 EPA-tested high school graduates.
Student demographic group. Across all student demographic groups, college success
rates were higher for students who met all four of the EXPLORE, PLAN, and ACT Benchmarks
than for students who did not meet any of the EXPLORE, PLAN, and ACT Benchmarks. This
result is illustrated in Figure 21 for six-year bachelor’s degree completion rates for four-year
EPA-tested students.

46
2934
2731
39
56
7782
37
27
68
5953
63
56
66
737977
83
75
0
20
40
60
80
100
Male Female Minority White <$30,000 $30,000 to$60,000
> $60,000
Gender Race/ethnicity Family income range
Perc
ent
Met 0/met 0/met 0 Met 1 to 3/met 1 to 3/met 1 to 3 Met 4/met 4/met 4
Figure 21. Six-year bachelor’s degree completion rates by combined EXPLORE/PLAN/ACT Benchmark attainment and student demographic group for four-year EPA-tested students. For some of the racial/ethnic minority groups, the number of students meeting all four of the EXPLORE, PLAN, and ACT Benchmarks was small (<10). Therefore, we compared minority students to White students.
Section summary. College success rates were generally highest for EPA-tested students
who were on target in grades 8 and 10 for becoming college and career ready and then graduated
from high school college and career ready. Rates were lowest for students who did not meet any
of the EXPLORE, PLAN, and ACT Benchmarks. This result held true for both two- and four-
year students, as well as by gender, race/ethnicity, and family income range. In addition, students
who were on target for becoming college ready in grades 8 and 10 were substantially more likely
to graduate from high school college and career ready, and students who graduated from high
school college and career ready were more likely to be successful in college than those who did
not.

47
Degree Completion Rates by Benchmark Attainment for All ACT-Tested High School
Graduates
The results shown earlier pertained to the group of students that postsecondary
institutions are generally interested in studying, namely high school graduates who enrolled in
college. Moreover, the results were disaggregated by institution type. However, college-ready
students are substantially more likely than students who are not ready to enroll immediately in
college. Thus, the results shown earlier are likely overestimates of those that would be seen for
all ACT-tested high school graduates.
To explore this issue, degree completion rates were estimated by Benchmark attainment,
as well as by Composite score, for all high school graduates using a sample of enrolled and non-
enrolled students. This sample included both the random sample of 24,850 immediately enrolled
students described earlier and a random sample of 2,944 ACT-tested 2003 high school graduates
who did not immediately enroll in college in fall 2003. For the latter sample, EPA-tested and PA-
tested only students were oversampled in similar ratios to those for the immediately enrolled
sample; we did not oversample certain racial/ethnic groups.
Some of the students from the latter sample delayed enrollment and thus had NSC
follow-up data available through fall 2010.26 Seven percent of these students earned either an
associate’s or bachelor’s degree by fall 2010. Weighted logistic regression models were used to
estimate degree completion rates for all ACT-tested high school graduates. Weights for the two
samples were calculated independently in a similar fashion to those previously described for the
immediately enrolled sample, but were normalized when combined together to account for
overrepresentation of the immediately enrolled students.
26 We assumed that students who did not match to NSC data did not enroll in college during the study time frame. This is a reasonable assumption given that NSC captures enrollment for 93% of all U.S. college students.

48
Table 8 contains estimated bachelor’s, and associate’s or bachelor’s, degree completion
rates for all ACT-tested high school graduates by ACT Benchmark attainment. Of students who
met none of the ACT Benchmarks, only 18% completed a bachelor’s degree and 25% completed
an associate’s or a bachelor’s degree within six years after graduating from high school. In
comparison, students who met all four ACT Benchmarks were nearly 3 to 4 times as likely to
complete a degree within the same six-year time period.
Table 8 Estimated College Degree Completion Rates by ACT Benchmark Attainment for Entire ACT-Tested 2003 High School Graduating Class
ACT Benchmark Level/value
Bachelor’s degree Associate’s or bachelor’s
degree Year 4 Year 5 Year 6 Year 4 Year 5 Year 6
English Not met 7 15 19 12 21 26 Met 27 42 49 32 48 54
Mathematics Not met 10 21 26 16 27 33 Met 35 53 60 40 58 65
Reading Not met 10 21 26 16 27 33 Met 30 46 52 35 51 57
Science Not met 14 26 32 20 32 39 Met 38 55 61 41 59 66
Number met
0 6 13 18 11 20 25 1 10 22 28 17 29 35 2 18 33 40 25 40 47 3 29 47 54 35 52 59 All 4 44 61 67 46 64 70
Note. Analyses based on a random sample of 27,792 ACT-tested 2003 high school graduates. Sample included immediately enrolled students, delayed enrolled students, and students who did not enroll in college.
In addition, ACT-tested high school graduates with higher ACT Composite scores had
higher chances of completing a bachelor’s degree (Figure 22). Bachelor’s degree completion
rates for all ACT-tested high school graduates were lower than those for students who
immediately enrolled in a four-year institution after high school graduation, in particular for

49
those who met none of the ACT Benchmarks, or those with lower ACT Composite scores
(compare the results in Table 8 to those in Table A-4 by Benchmark attainment and those in
Figure 22 to those in Figure 4 by Composite score).
0
10
20
30
40
50
60
70
80
90
100
7 11 15 19 23 27 31 35
ACT Composite score
Perc
ent
Year 4 Year 5 Year 6
Figure 22. Estimated bachelor’s degree completion rates by ACT Composite score for all ACT-tested high school graduates. Analyses based on a random sample of 27,792 ACT-tested 2003 high school graduates. Sample included immediately enrolled students, delayed enrolled students, and students who did not enroll in college. Table D-1 in Appendix D contains the relevant estimated regression coefficients for the degree completion models using ACT Composite scores as the predictor for all ACT-tested high school graduates, as well as the corresponding coefficients for the models using EXPLORE or PLAN Composite scores for EPA-tested graduates.
In Appendix D, we provide estimated degree completion rates by EXPLORE or PLAN
Benchmark attainment for all EPA-tested students. As was found for the immediately enrolled
sample, the estimated rates by EXPLORE or PLAN Benchmark attainment were somewhat
comparable to those by ACT Benchmark attainment. One limitation to the EXPLORE and PLAN
rates is that they are based on ACT-tested high school graduates. Some students may not persist
to high school graduation and/or not take the ACT; thus, these rates are likely overestimated

50
slightly compared to those for all EXPLORE-tested eighth-graders or PLAN-tested tenth-
graders.
Conclusions
In the first part of this study, we examined the relationships between college readiness
and college success from a national perspective. In particular, we examined college retention and
degree completion rates over time across college readiness indicators for a national NSC-
matched sample of ACT-tested 2003 high school graduates who enrolled in college in fall 2003.
The second part of this study focused on evaluating the benefits of early monitoring of college
readiness on long-term college success.
The Importance of College Readiness on College Success
The general conclusions from the first part of this study affirm those found in an earlier
ACT study (Noble & Radunzel, 2007), namely that typical college success rates for both two-
and four-year institutions are generally higher for college-ready students than for those not ready.
In particular, we found that students who met the individual ACT College Readiness
Benchmarks were substantially more likely than those who did not meet the Benchmarks to
enroll immediately in college the fall following high school graduation, to persist in college
through degree completion, and to earn a degree in a timely manner. Moreover, as the number of
ACT Benchmarks met increased, students’ likelihood of success also increased. For students
who initially enrolled in a two-year institution, these findings held true for all outcomes, except
for retention to the same institution at years 3 and 4. This exception is likely explained by the
result that college-ready students transferred to other institutions and completed a degree at
higher rates than students who were not ready for college and career, as evidenced by the higher

51
six-year associate’s or bachelor’s degree completion rates for these two-year students. College
success rates were also higher for students who
earned higher ACT Composite scores (compared to those with lower scores);
took a core curriculum in high school (compared to those who did not);
took higher-level mathematics and science coursework in high school (compared to those
who did not); and
earned higher high school GPAs (compared to those with lower GPAs).
We also found that simply taking higher-level high school coursework is insufficient to
guarantee that students will be successful in college. In particular, we found that students who
took higher-level mathematics and science coursework, but did not meet the level of
achievement in these areas necessary to be ready for credit-bearing, entry-level college
coursework, were less likely to persist over time to degree completion than those who took fewer
courses, but did meet this level of achievement.
In addition, consistent with findings from other studies (ACT, 2010a; Aud et al., 2011;
Snyder & Dillow, 2011), there were gaps in enrollment, retention, and degree completion rates
across racial/ethnic and family income groups. However, we saw that college readiness helps to
reduce these gaps. For example, the differences in six-year bachelor’s degree completion rates
between African American or Hispanic students and White students were reduced by more than
50% among those who had met all four of the ACT College Readiness Benchmarks. Reductions
in family income gaps in college success rates were generally smaller than those in the
racial/ethnic gaps. This finding suggests that it is very likely that non-academic issues, including
financial aid and needing to work while in college, are also important factors in college success.

52
One limitation to the degree data for this study was that we were not provided with the
actual degree type earned for all students with degrees. For these cases, we implied the type of
degree using the institution type of the awarding institution and the time to degree completion.
However, we found no differences in comparisons between students with known degrees and
those with implied degrees. In addition, six-year associate’s and bachelor’s degree completion
rates from this study were only slightly higher than those from another nationally representative
sample of two- and four-year students who began postsecondary education in 2003-04
(Skomsvold, Radford, & Berkner, 2011).27
This study primarily focused on retention and degree completion for students who
immediately enrolled in college, which is common in the higher education literature. For some
limited supplemental analyses, we also estimated degree completion rates for a representative
sample of ACT-tested high school graduates that included students who did and did not
immediately enroll in college. Degree completion rates by college readiness indicators from this
different perspective might be more meaningful to secondary educators.
The Importance of Early Monitoring of College Readiness on College Success
Our nation’s school systems are being encouraged to implement integrated, longitudinal
data-driven systems for early monitoring of college readiness (Achieve, 2009; Data Quality
Campaign, 2009; Partnership for Learning, 2010). For this study, we deliberately oversampled
EPA-tested students to document the benefits of participating in a longitudinal assessment
system on longer-term college outcomes and to examine the relationships between early
indicators of college readiness and college success. First, we found that EPA-tested students had
27 The six-year bachelor’s degree completion rate for four-year students from this study was 61%, compared to 59.5% for four-year students from the NCES study (Skomsvold et al, 2011). The six-year associate’s degree completion rate for two-year students from this study was 24%, compared to 15.5% for two-year students from the NCES study. A possible explanation for this difference is that we focused on ACT-tested students; the ACT is generally not required for admissions to two-year institutions.
53
higher immediate college enrollment rates than ACT-tested only students, and slightly higher
retention rates at year 4 and Bachelor degree completion rates by year 6. The latter two findings
were seen for four-year students only.
In conjunction with assessing student progress, EXPLORE, PLAN, and the ACT help
students plan for the future by providing information on careers that match their interests and
skills (through the Interest Inventory and World-of-Work map). Therefore, a plausible
explanation for these results is that early monitoring and intervening over time raises student’s
and parent’s awareness of the opportunities available to students after high school, along with
helping them to know how well students must perform academically to have a reasonable chance
of being successful in college or on the job. By encouraging students to think about possible
careers early on allows them to plan more effectively to take the academic courses they will need
to achieve their career goals.
The results related to the benefits of early monitoring from this study are in agreement
with two other recent ACT studies. In one of these studies (Radunzel, 2010), the researchers
found that EPA-tested students in Arkansas and Oklahoma (two states that administer
EXPLORE and PLAN on a state-funded voluntary basis) consistently outperformed ACT-tested
only students in these states; that is, they were more likely to enroll immediately in college, to
persist at the same institution, and to complete a degree. Differences in college success rates
among the EPA participation groups were smaller in this study than the earlier study that focused
on Arkansas and Oklahoma. The other study (ACT, in press) found that EPA-tested students
were more likely than ACT-tested only students to enroll immediately in college the fall
following high school graduation and remain enrolled at the same institution through year 2.
Differences in immediate college enrollment rates among the EPA participation groups found in
54
this study were similar to those reported in the earlier study. All three studies accounted for
student’s achievement level (either ACT Composite score or high school GPA).
We also demonstrated the utility of predicting college success rates by using early
indicators of being on target to graduate from high school college and career ready. In particular,
we found that students who met both the EXPLORE and PLAN Benchmarks had higher college
success rates than those who met one or none of the Benchmarks. Similar results were seen when
we examined the college success rates between those who met and did not meet the individual
EXPLORE or PLAN Benchmarks. In addition, as the number of EXPLORE or PLAN
Benchmarks met increased, college success rates also increased. These results provide further
validity evidence for the use of EXPLORE and PLAN Benchmarks as a means of evaluating
students’ early progress toward college readiness, so that timely interventions can be made when
necessary.
When we examined college success rates by combined EXPLORE/PLAN/ACT
Benchmark attainment, we found that students who were on target in grades 8 and 10 for
becoming college and career ready and then graduated from high school college and career ready
generally had the highest college success rates, and students who were not on target in grades 8
and 10 and did not graduate from high school college and career ready had the lowest rates. We
also showed examples where the chances of being successful in college appeared to
increase for students who showed improvements in the number of Benchmarks met
between grades 10 and 11/12, and
decrease for students who did not remain on target through grade 11/12.
One of the major findings from The Forgotten Middle (ACT, 2008) was that being on
target for college and career readiness in grade 8 puts students on a trajectory for success; that is,
55
if students are on target to be ready for college and career as early as grade 8, their chances of
being ready for college and career by high school graduation are substantially increased. In this
study, we found that students who were on target in grades 8 and 10 for becoming college ready
were substantially more likely than those who were not on target in both grades to graduate from
high school college and career ready. These findings emphasize the importance of students being
on track by grade 8 and support the use of a longitudinal assessment system to monitor early and
often student’s progress towards becoming college ready. Students who are college ready at the
time they graduate from high school are more likely than those who are not to persist beyond
their first year of college and to complete a degree in a timely manner.
Summary
This study provides additional evidence of the importance of college readiness for timely
degree completion for students attending either two- or four-year institutions and for reducing
gaps in college success rates across racial/ethnic and family income groups. The ACT College
Readiness Benchmarks are good indicators of whether students have acquired the knowledge and
skills to be successful in college. In addition, this study documents the utility of early monitoring
of readiness through EXPLORE and PLAN scores for increasing college enrollment and college
retention through degree completion.

56
57
References Achieve, Inc. (2009). Race to the Top: Accelerating college and career readiness in states: P-20
longitudinal data systems. Retrieved January 25, 2012 from http://www.achieve.org/files/RTTT-P20LongitudinalData.pdf.
ACT. (In press). Staying on target: The importance of monitoring student progress toward college and career readiness. Iowa City, IA: Author. ACT. (2010a). Mind the gaps: How college readiness narrows achievement gaps in college
success. Iowa City, IA: Author. ACT. (2010b). What are ACT’s college readiness benchmarks? Iowa City, IA: Author. ACT. (2009a). ACT’s College Readiness System: Meeting the challenge of a changing world.
Iowa City, IA: Author. ACT. (2009b). Readiness and success: Statewide implementation of EXPLORE and PLAN. Iowa
City, IA: Author. ACT. (2008). The forgotten middle: Ensuring that all students are on target for college and
career readiness before high school. Iowa City, IA: Author. ACT. (2003). ACT profile report–national: Graduating class 2003–national. Iowa City, IA: Author. Adelman, C. (2006). The toolbox revisited: Paths to degree completion from high school through
college. Washington, DC: U.S. Department of Education. Adelman, C. (2004). Principal indicators of student academic histories in postsecondary
education. Washington, DC: U.S. Department of Education. Allen, J., Robbins, S., Casillas, A., & Oh, I. (2008). Third-year college retention and transfer:
Effects of academic performance, motivation, and social connectedness. Research in Higher Education, 49(7), 647-664.
Allen, J., & Sconing, J. (2005). Using ACT Assessment scores to set benchmarks for college
readiness. (ACT Research Report No. 2005-3). Iowa City, IA: ACT, Inc. Aud, S., Hussar, W., Kena, G., Bianco, K., Frohlich, L., Kemp, J., & Tahan, K. (2011). The
condition of education 2011 (NCES 2011-033). Washington, DC: National Center for Education Statistics.

58
Cabrera, A.F., Burkum, K.R., & La Nasa, S.M. (2005). Pathways to a four-year degree: Determinants of transfer and degree completion (pp. 155-214). In Alan Seidman (Ed.). College student retention: A formula for success. ACE/Prager Series on Higher Education.
Data Quality Campaign. (2009). The next step: Using longitudinal data to improve student
success. Retrieved January 25, 2012 from http://www.dataqualitycampaign.org/files/NextStep.pdf.
Horn, L., Cataldi, E.F., & Sikora A. (2005). Waiting to attend college: Undergraduates who
delay their postsecondary enrollment. (NCES 2005-152). Washington, DC: National Center for Education Statistics.
Kaplan, E.L., & Meier, P. (1958). Nonparametric estimation from incomplete observations.
Journal of the American Statistical Association, 53, 457-481. Knapp, L.G., Kelly-Reid, J.E., and Whitmore, R.W. (2006). Enrollment in postsecondary
institutions, fall 2004; graduation rates, 1998 & 2001 cohorts; and financial statistics, fiscal year 2004. (NCES 2006-155). Washington, DC: National Center for Education Statistics.
National Commission on Excellence in Education. (1983). A nation at risk: The imperative for
educational reform. Washington, DC: U.S. Department of Education. National Governors Association Center for Best Practices & Council of Chief State School
Officers. (2011). Common Core State Standards Initiative: In the States. Retrieved January 17, 2012 from http://www.corestandards.org/in-the-states.
Noble, J., & Radunzel, J. (2007, June). College readiness = college success beyond the first
year. Paper presented at the Annual Forum of the Association for Institutional Research, Kansas City, Missouri.
Noble, J., & Sawyer, R. (2002). Predicting different levels of academic success in college using
high school GPA and ACT Composite score. (ACT Research Report No. 2002-4). Iowa City, IA: ACT, Inc.
Partnership for Learning. (2010, July). Building a robust data system in Washington: How
effective use of data can improve instruction and student achievement. Retrieved from http://www.partnership4learning.org/files/7.20.2010%20Data%20Systems.pdf.
Radunzel, J. (2010). The benefits of EPAS participation on college success in Arkansas and
Oklahoma. Unpublished manuscript. Robbins, S., Allen, J., Casillas, A., Peterson, C., & Le, H. (2006). Unraveling the differential
effects of motivational and skills, social, and self-management measures from traditional predictors of college outcomes. Journal of Educational Psychology, 98, 598–616.

59
Skomsvold, P., Radford, A.W., & Berkner, L. (2011). Web tables—Six-year attainment,
persistence, transfer, retention, and withdrawal rates of students who began postsecondary education in 2003-04 (NCES 2011-152). Washington, DC: National Center for Education Statistics.
Snyder, T.D., & Dillow, S.A. (2011). Digest of Education Statistics 2010 (NCES 2011-015).
Washington, DC: National Center for Education Statistics. U.S. Department of Education, National Center for Education Statistics. (2002). The condition of
education 2002. (NCES 2002-025). Washington, DC: U.S. Government Printing Office.

60

61
Appendix A Table A-1 College Enrollment Rates by Student Characteristics
Characteristic Level/value Enrollment rate Demographic characteristic
Race/ethnicity
African American 64 Hispanic 59 White 70 Asian 70
Gender Male 66 Female 69
Family income < $30,000 60 $30,000-$60,000 68 > $60,000 74
College readiness indicator ACT English Benchmark
Not met 57 Met 73
ACT Mathematics Benchmark
Not met 62
Met 78
ACT Reading Benchmark
Not met 61 Met 74
ACT Science Benchmark
Not met 65 Met 78
Number of ACT Benchmarks met
0 54 1 67 2 71 3 76 All 4 79
ACT Composite score range
1 to 18 57 19 to 21 67 22 to 24 73 25 to 27 79 28 to 36 84
Core curriculum Noncore 60 Core 72
HS math course sequence
< Alg I, Geom, Alg II 50 Alg I, Geom, Alg II 66 > Alg I, Geom, Alg II 75
HS science course sequence
Bio 56 Bio & Chem 71 Bio, Chem, & Phys 75

62
Table A-1 (cont.)
Characteristic Level/value Enrollment rate
HSGPA < 3.00 55 3.00 to 3.49 69 > = 3.50 77
Note. HS = high school; Alg = Algebra; Geom = Geometry; Bio = Biology; Chem = Chemistry; Phys = Physics; HSGPA = high school grade point average.

63
Table A-2 College Retention Rates to the Same Institution by Student Characteristics and Year for Two- and Four-Year Students
Characteristic Level/value
Four-year students Two-year students Year
2 Year
3 Year
4 Year
2 Year
3 Year
4 Demographic characteristic
Race/ethnicity
African American 74 57 48 56 25 12 Hispanic 77 62 53 66 38 17 White 78 66 59 61 29 14 Asian 81 70 62 69 39 14
Gender Male 75 62 56 60 27 13 Female 79 66 58 62 32 16
Family income < $30,000 73 57 49 60 30 15 $30,000-$60,000 77 63 56 61 30 15 > $60,000 80 69 62 63 29 14
College readiness indicator ACT English Benchmark
Not met 69 53 45 59 31 15 Met 80 68 61 63 29 13
ACT Mathematics Benchmark
Not met 72 56 49 60 30 15
Met 83 73 67 65 29 12
ACT Reading Benchmark
Not met 73 58 51 61 31 15 Met 80 69 62 62 29 13
ACT Science Benchmark
Not met 75 61 53 61 30 15 Met 83 73 66 65 28 12
Number of ACT Benchmarks met
0 68 51 43 60 31 17 1 72 58 50 61 30 16 2 77 64 56 63 29 14 3 81 69 63 64 28 13 All 4 84 75 69 65 27 13
ACT Composite score range
1 to 18 68 52 44 60 31 16 19 to 21 75 60 53 62 29 14 22 to 24 79 67 60 64 29 13 25 to 27 83 73 67 65 28 12 28 to 36 87 80 74 67 27 11
Core curriculum Noncore 73 60 52 60 30 15 Core 79 67 60 63 29 14
HS math course sequence
< Alg I, Geom, Alg II 66 48 41 57 27 15 Alg I, Geom, Alg II 74 60 52 61 31 15 > Alg I, Geom, Alg II 81 69 62 64 30 13

64
Table A-2 (cont.)
Characteristic Level/value
Four-year students Two-year students Year
2 Year
3 Year
4 Year
2 Year
3 Year
4
HS science course sequence
Bio 70 54 46 59 27 15 Bio & Chem 78 65 58 62 31 14 Bio, Chem, & Phys 81 69 62 64 33 15
HSGPA < 3.00 66 48 40 57 28 13 3.00 to 3.49 77 63 55 64 30 13 > = 3.50 84 75 68 69 31 14
Note. HS = high school; Alg = Algebra; Geom = Geometry; Bio = Biology; Chem = Chemistry; Phys = Physics; HSGPA = high school grade point average.
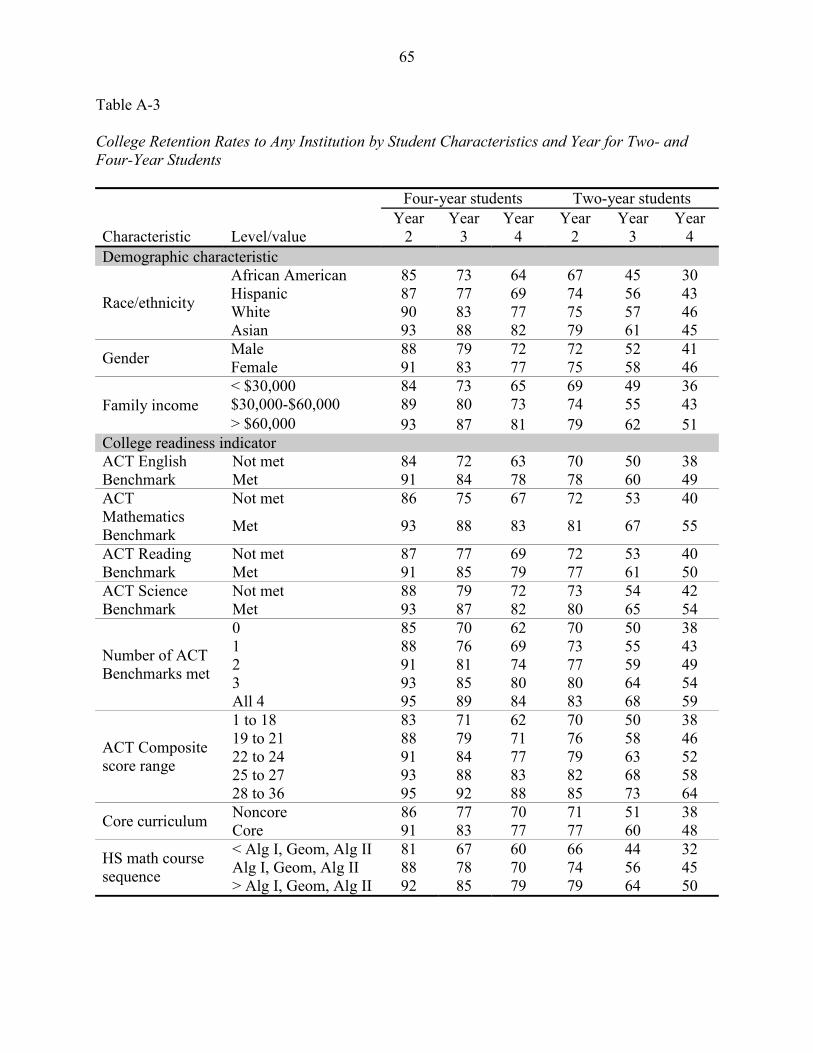
65
Table A-3 College Retention Rates to Any Institution by Student Characteristics and Year for Two- and Four-Year Students
Characteristic Level/value
Four-year students Two-year students Year
2 Year
3 Year
4 Year
2 Year
3 Year
4 Demographic characteristic
Race/ethnicity
African American 85 73 64 67 45 30 Hispanic 87 77 69 74 56 43 White 90 83 77 75 57 46 Asian 93 88 82 79 61 45
Gender Male 88 79 72 72 52 41 Female 91 83 77 75 58 46
Family income < $30,000 84 73 65 69 49 36 $30,000-$60,000 89 80 73 74 55 43 > $60,000 93 87 81 79 62 51
College readiness indicator ACT English Benchmark
Not met 84 72 63 70 50 38 Met 91 84 78 78 60 49
ACT Mathematics Benchmark
Not met 86 75 67 72 53 40
Met 93 88 83 81 67 55
ACT Reading Benchmark
Not met 87 77 69 72 53 40 Met 91 85 79 77 61 50
ACT Science Benchmark
Not met 88 79 72 73 54 42 Met 93 87 82 80 65 54
Number of ACT Benchmarks met
0 85 70 62 70 50 38 1 88 76 69 73 55 43 2 91 81 74 77 59 49 3 93 85 80 80 64 54 All 4 95 89 84 83 68 59
ACT Composite score range
1 to 18 83 71 62 70 50 38 19 to 21 88 79 71 76 58 46 22 to 24 91 84 77 79 63 52 25 to 27 93 88 83 82 68 58 28 to 36 95 92 88 85 73 64
Core curriculum Noncore 86 77 70 71 51 38 Core 91 83 77 77 60 48
HS math course sequence
< Alg I, Geom, Alg II 81 67 60 66 44 32 Alg I, Geom, Alg II 88 78 70 74 56 45 > Alg I, Geom, Alg II 92 85 79 79 64 50

66
Table A-3 (cont.)
Characteristic Level/value
Four-year students Two-year students Year
2 Year
3 Year
4 Year
2 Year
3 Year
4
HS science course sequence
Bio 83 72 63 69 47 36 Bio & Chem 91 83 76 76 59 47 Bio, Chem, & Phys 91 85 79 79 65 51
HSGPA < 3.00 83 69 59 68 47 35 3.00 to 3.49 91 82 75 78 60 47 > = 3.50 94 89 85 83 68 57
Note. HS = high school; Alg = Algebra; Geom = Geometry; Bio = Biology; Chem = Chemistry; Phys = Physics; HSGPA = high school grade point average.

67
Table A-4 Degree Completion Rates by Student Characteristics and Year for Two- and Four-Year Students
Characteristic Level/value
Four-year students (bachelor’s degree)
Two-year students (associate’s degree)
Year 4
Year 5
Year 6
Year 4
Year 5
Year 6
Demographic characteristic
Race/ethnicity
African American 21 39 45 12 14 15 Hispanic 27 45 53 16 20 21 White 38 58 64 22 25 26 Asian 36 54 63 14 16 18
Gender Male 27 49 57 17 19 21 Female 40 58 64 22 25 27
Family income < $30,000 25 42 49 16 20 20 $30,000-$60,000 33 52 59 21 24 26 > $60,000 41 62 69 21 24 26
College readiness indicator ACT English Benchmark
Not met 19 38 45 16 19 20 Met 41 60 66 23 26 28
ACT Mathematics Benchmark
Not met 26 44 51 18 21 22
Met 46 66 72 27 30 31
ACT Reading Benchmark
Not met 25 45 53 18 21 22 Met 42 61 67 23 26 28
ACT Science Benchmark
Not met 30 50 57 19 22 23 Met 47 66 72 26 29 31
Number of ACT Benchmarks met
0 18 37 44 16 19 21 1 25 45 52 19 22 23 2 33 53 60 22 25 26 3 42 62 68 25 28 29 All 4 52 69 75 29 31 33
ACT Composite score range
1 to 18 19 37 44 16 19 20 19 to 21 28 49 56 21 24 25 22 to 24 37 58 65 24 28 29 25 to 27 48 67 73 29 32 34 28 to 36 61 77 81 34 37 39
Core curriculum Noncore 30 49 55 17 20 22 Core 37 57 64 22 25 26
HS math course sequence
< Alg I, Geom, Alg II 22 38 44 15 17 19 Alg I, Geom, Alg II 30 49 55 19 22 24 > Alg I, Geom, Alg II 40 60 67 24 27 28

68
Table A-4 (cont.)
Characteristic Level/value
Four-year students (bachelor’s degree)
Two-year students (associate’s degree)
Year 4
Year 5
Year 6
Year 4
Year 5
Year 6
HS science course sequence
Bio 23 42 48 18 21 22 Bio & Chem 36 56 63 21 24 25 Bio, Chem, & Phys 38 59 66 23 26 28
HSGPA < 3.00 15 32 39 13 16 17 3.00 to 3.49 29 52 59 22 25 27 > = 3.50 48 69 75 31 34 36
Note. Bachelor’s degree completion rates for four-year students and associate’s degree completion rates for two-year students. HS = high school; Alg = Algebra; Geom = Geometry; Bio = Biology; Chem = Chemistry; Phys = Physics; HSGPA = high school grade point average.

69
Table A-5 Estimated Intercepts and Slopes from Degree Completion Models Using ACT Composite Score as the Predictor by Degree Type and Year for Two- and Four-Year Students
Degree type Year Estimated coefficient Intercept Slope
Bachelor’s degree (4-year students)
4 -3.80 0.14 5 -2.67 0.13 6 -2.29 0.13
Associate’s degree (2-year students)
4 -2.84 0.07 5 -2.55 0.07 6 -2.46 0.07
Associate’s or bachelor’s degree (2-year students)
4 -3.04 0.09 5 -2.91 0.11 6 -2.79 0.12

70

71
Appendix B Table B-1 College Enrollment Rates by EXPLORE, PLAN, and Combined EXPLORE/PLAN Benchmark Attainment for EPA-Tested Students
Predictor Level/value Enrollment rate EXPLORE Benchmark attainment (grade 8)
English Not met 60 Met 71
Mathematics Not met 65 Met 74
Reading Not met 63 Met 73
Science Not met 67 Met 77
Number met
0 56 1 64 2 70 3 75 All 4 76
PLAN Benchmark attainment (grade 10)
English Not met 60 Met 71
Mathematics Not met 65 Met 75
Reading Not met 64 Met 72
Science Not met 67 Met 76
Number met
0 56 1 64 2 70 3 74 All 4 77
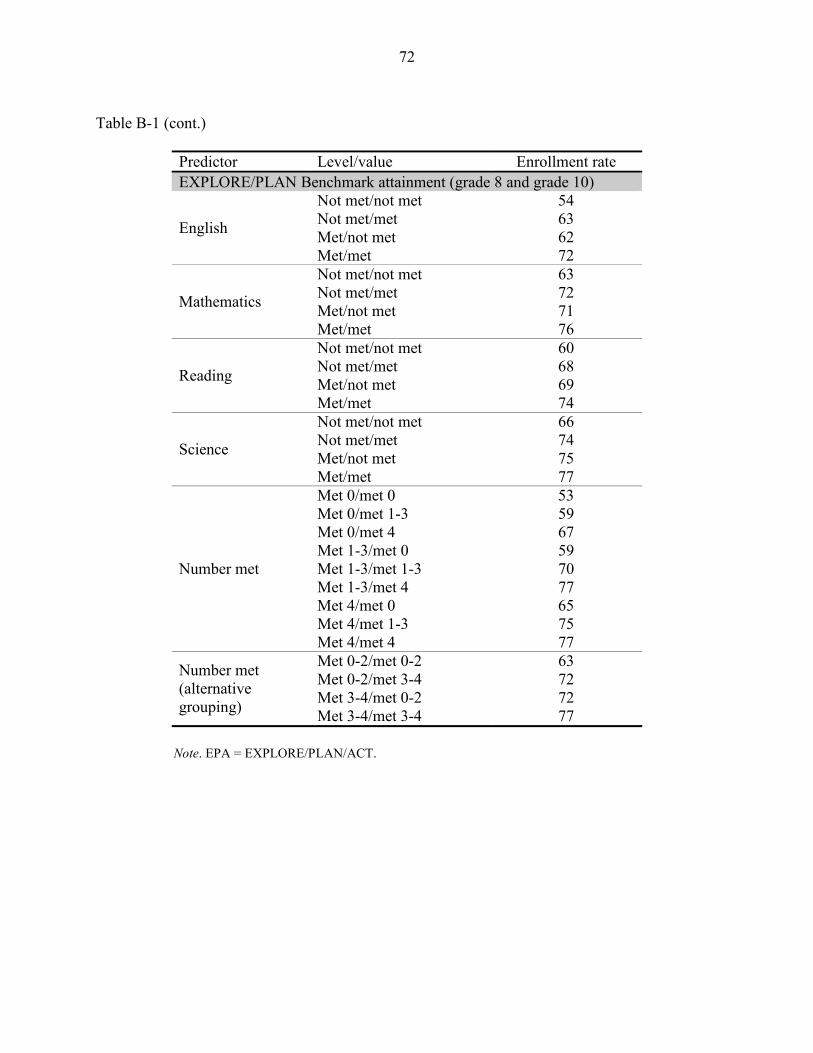
72
Table B-1 (cont.)
Predictor Level/value Enrollment rate EXPLORE/PLAN Benchmark attainment (grade 8 and grade 10)
English
Not met/not met 54 Not met/met 63 Met/not met 62 Met/met 72
Mathematics
Not met/not met 63 Not met/met 72 Met/not met 71 Met/met 76
Reading
Not met/not met 60 Not met/met 68 Met/not met 69 Met/met 74
Science
Not met/not met 66 Not met/met 74 Met/not met 75 Met/met 77
Number met
Met 0/met 0 53 Met 0/met 1-3 59 Met 0/met 4 67 Met 1-3/met 0 59 Met 1-3/met 1-3 70 Met 1-3/met 4 77 Met 4/met 0 65 Met 4/met 1-3 75 Met 4/met 4 77
Number met (alternative grouping)
Met 0-2/met 0-2 63 Met 0-2/met 3-4 72 Met 3-4/met 0-2 72 Met 3-4/met 3-4 77
Note. EPA = EXPLORE/PLAN/ACT.

73
Table B-2
College Retention Rates by EXPLORE, PLAN, and Combined EXPLORE/PLAN Benchmark Attainment for EPA-Tested Two- and Four-Year Students
Benchmark Level/value
Four-year students (to same institution)
Two-year students (to any institution)
Year 2
Year 3
Year 4
Year 2
Year 3
Year 4
EXPLORE Benchmark attainment (grade 8)
English Not met 71 54 47 69 52 37 Met 80 68 63 76 59 49
Mathematics Not met 75 60 54 72 54 42 Met 83 72 67 79 65 56
Reading Not met 75 60 53 70 53 40 Met 81 70 65 78 62 53
Science Not met 77 63 57 73 56 44 Met 84 76 71 82 69 61
Number met
0 69 50 43 66 48 35 1 74 57 50 71 54 42 2 78 64 58 76 60 50 3 82 70 65 80 65 57 All 4 85 76 72 83 70 65
PLAN Benchmark attainment (grade 10)
English Not met 72 54 46 69 53 39 Met 80 68 63 75 59 48
Mathematics Not met 75 60 53 72 54 42 Met 83 72 68 80 67 59
Reading Not met 75 60 53 70 53 40 Met 81 70 64 77 62 52
Science Not met 77 63 57 73 56 44 Met 84 74 70 82 69 64
Number met
0 68 50 43 67 48 34 1 73 57 50 71 54 41 2 78 64 58 76 60 50 3 82 70 65 79 66 58 All 4 85 76 72 83 71 66
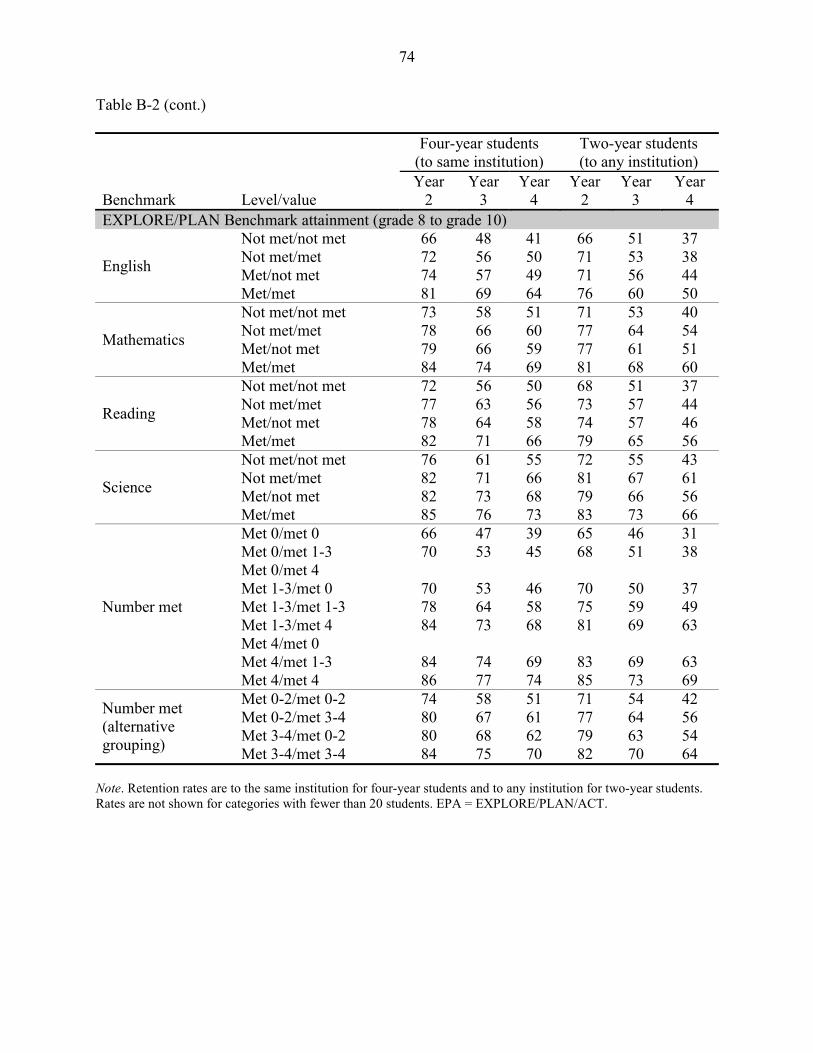
74
Table B-2 (cont.)
Benchmark Level/value
Four-year students (to same institution)
Two-year students (to any institution)
Year 2
Year 3
Year 4
Year 2
Year 3
Year 4
EXPLORE/PLAN Benchmark attainment (grade 8 to grade 10)
English
Not met/not met 66 48 41 66 51 37 Not met/met 72 56 50 71 53 38 Met/not met 74 57 49 71 56 44 Met/met 81 69 64 76 60 50
Mathematics
Not met/not met 73 58 51 71 53 40 Not met/met 78 66 60 77 64 54 Met/not met 79 66 59 77 61 51 Met/met 84 74 69 81 68 60
Reading
Not met/not met 72 56 50 68 51 37 Not met/met 77 63 56 73 57 44 Met/not met 78 64 58 74 57 46 Met/met 82 71 66 79 65 56
Science
Not met/not met 76 61 55 72 55 43 Not met/met 82 71 66 81 67 61 Met/not met 82 73 68 79 66 56 Met/met 85 76 73 83 73 66
Number met
Met 0/met 0 66 47 39 65 46 31 Met 0/met 1-3 70 53 45 68 51 38 Met 0/met 4 Met 1-3/met 0 70 53 46 70 50 37 Met 1-3/met 1-3 78 64 58 75 59 49 Met 1-3/met 4 84 73 68 81 69 63 Met 4/met 0 Met 4/met 1-3 84 74 69 83 69 63 Met 4/met 4 86 77 74 85 73 69
Number met (alternative grouping)
Met 0-2/met 0-2 74 58 51 71 54 42 Met 0-2/met 3-4 80 67 61 77 64 56 Met 3-4/met 0-2 80 68 62 79 63 54 Met 3-4/met 3-4 84 75 70 82 70 64
Note. Retention rates are to the same institution for four-year students and to any institution for two-year students. Rates are not shown for categories with fewer than 20 students. EPA = EXPLORE/PLAN/ACT.
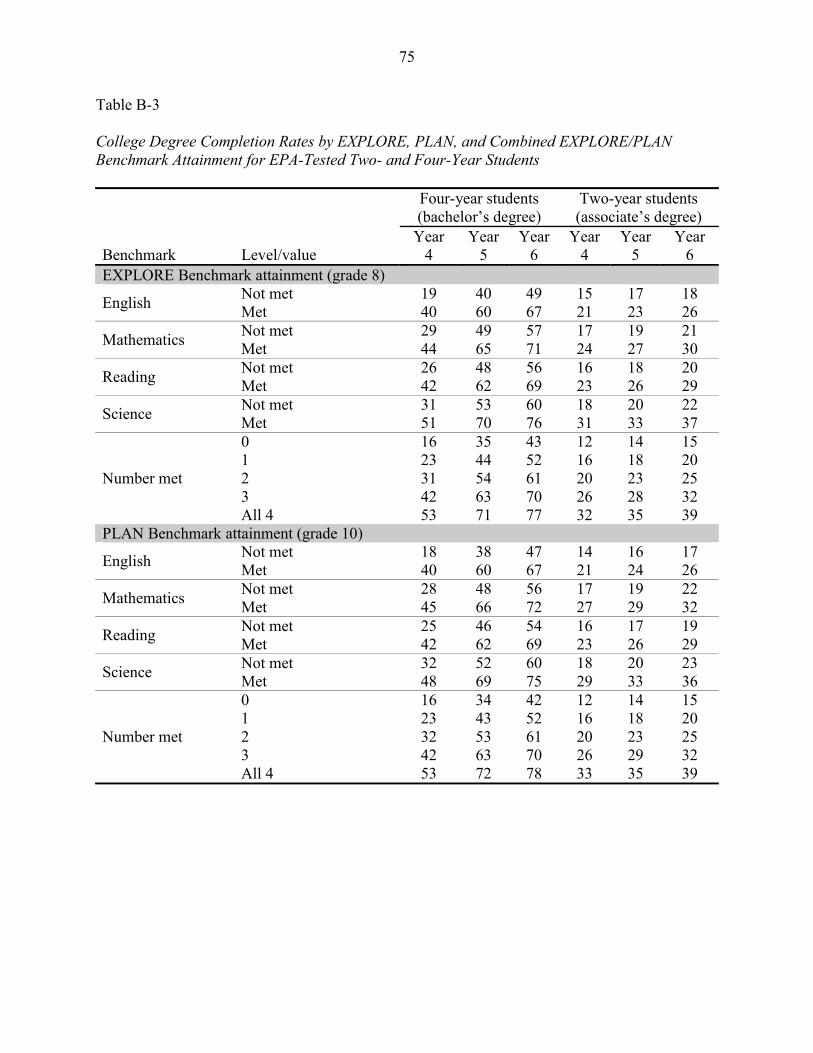
75
Table B-3 College Degree Completion Rates by EXPLORE, PLAN, and Combined EXPLORE/PLAN Benchmark Attainment for EPA-Tested Two- and Four-Year Students
Benchmark Level/value
Four-year students (bachelor’s degree)
Two-year students (associate’s degree)
Year 4
Year 5
Year 6
Year 4
Year 5
Year 6
EXPLORE Benchmark attainment (grade 8)
English Not met 19 40 49 15 17 18 Met 40 60 67 21 23 26
Mathematics Not met 29 49 57 17 19 21 Met 44 65 71 24 27 30
Reading Not met 26 48 56 16 18 20 Met 42 62 69 23 26 29
Science Not met 31 53 60 18 20 22 Met 51 70 76 31 33 37
Number met
0 16 35 43 12 14 15 1 23 44 52 16 18 20 2 31 54 61 20 23 25 3 42 63 70 26 28 32 All 4 53 71 77 32 35 39
PLAN Benchmark attainment (grade 10)
English Not met 18 38 47 14 16 17 Met 40 60 67 21 24 26
Mathematics Not met 28 48 56 17 19 22 Met 45 66 72 27 29 32
Reading Not met 25 46 54 16 17 19 Met 42 62 69 23 26 29
Science Not met 32 52 60 18 20 23 Met 48 69 75 29 33 36
Number met
0 16 34 42 12 14 15 1 23 43 52 16 18 20 2 32 53 61 20 23 25 3 42 63 70 26 29 32 All 4 53 72 78 33 35 39

76
Table B-3 (cont.)
Benchmark Level/value
Four-year students (bachelor’s degree)
Two-year students (associate’s degree)
Year 4
Year 5
Year 6
Year 4
Year 5
Year 6
EXPLORE/PLAN Benchmark attainment (grade 8 to grade 10)
English
Not met/not met 13 29 39 13 14 15 Not met/met 21 43 52 17 19 20 Met/not met 20 40 49 14 17 19 Met/met 41 62 68 22 24 27
Mathematics
Not met/not met 24 44 53 16 18 20 Not met/met 36 58 65 25 27 29 Met/not met 35 56 63 22 24 27 Met/met 48 68 74 28 29 33
Reading
Not met/not met 21 40 48 14 15 17 Not met/met 30 54 62 19 22 24 Met/not met 30 53 61 19 21 24 Met/met 45 65 71 25 28 31
Science
Not met/not met 28 49 58 17 19 22 Not met/met 43 66 71 26 30 33 Met/not met 47 65 72 28 30 33 Met/met 54 73 78 36 37 40
Number met
Met 0/met 0 13 30 38 11 12 14 Met 0/met 1-3 17 38 46 13 15 16 Met 0/met 4 Met 1-3/met 0 19 37 45 13 15 18 Met 1-3/met 1-3 32 54 61 20 22 25 Met 1-3/met 4 47 69 74 29 32 34 Met 4/met 0 Met 4/met 1-3 49 68 74 30 33 38 Met 4/met 4 56 74 80 36 39 43
Number met (alternative grouping)
Met 0-2/met 0-2 23 44 52 16 18 20 Met 0-2/met 3-4 35 59 66 24 26 28 Met 3-4/met 0-2 37 56 65 23 26 30 Met 3-4/met 3-4 50 70 76 31 34 37
Note. Bachelor’s degree completion rates for four-year students and associate’s degree completion rates for two-year students. Rates are not shown for categories with fewer than 20 students. EPA = EXPLORE/PLAN/ACT.
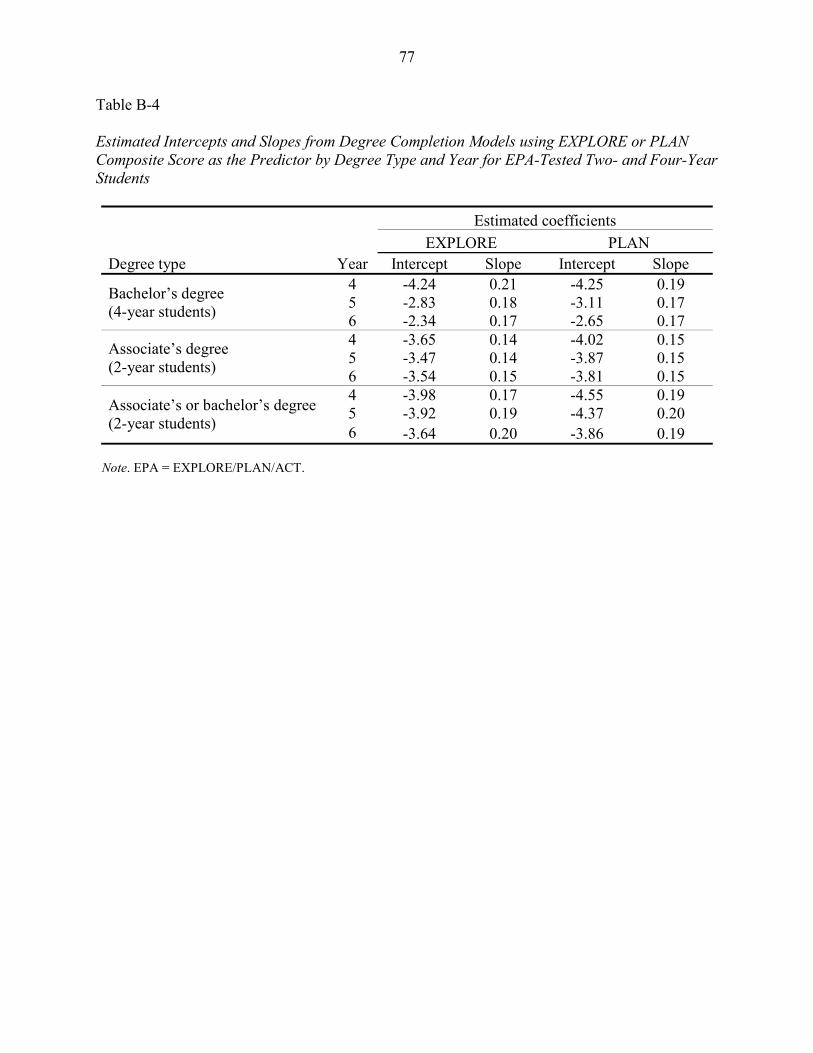
77
Table B-4 Estimated Intercepts and Slopes from Degree Completion Models using EXPLORE or PLAN Composite Score as the Predictor by Degree Type and Year for EPA-Tested Two- and Four-Year Students
Degree type Year
Estimated coefficients EXPLORE PLAN
Intercept Slope Intercept Slope
Bachelor’s degree (4-year students)
4 -4.24 0.21 -4.25 0.19 5 -2.83 0.18 -3.11 0.17 6 -2.34 0.17 -2.65 0.17
Associate’s degree (2-year students)
4 -3.65 0.14 -4.02 0.15 5 -3.47 0.14 -3.87 0.15 6 -3.54 0.15 -3.81 0.15
Associate’s or bachelor’s degree (2-year students)
4 -3.98 0.17 -4.55 0.19 5 -3.92 0.19 -4.37 0.20 6 -3.64 0.20 -3.86 0.19
Note. EPA = EXPLORE/PLAN/ACT.

78
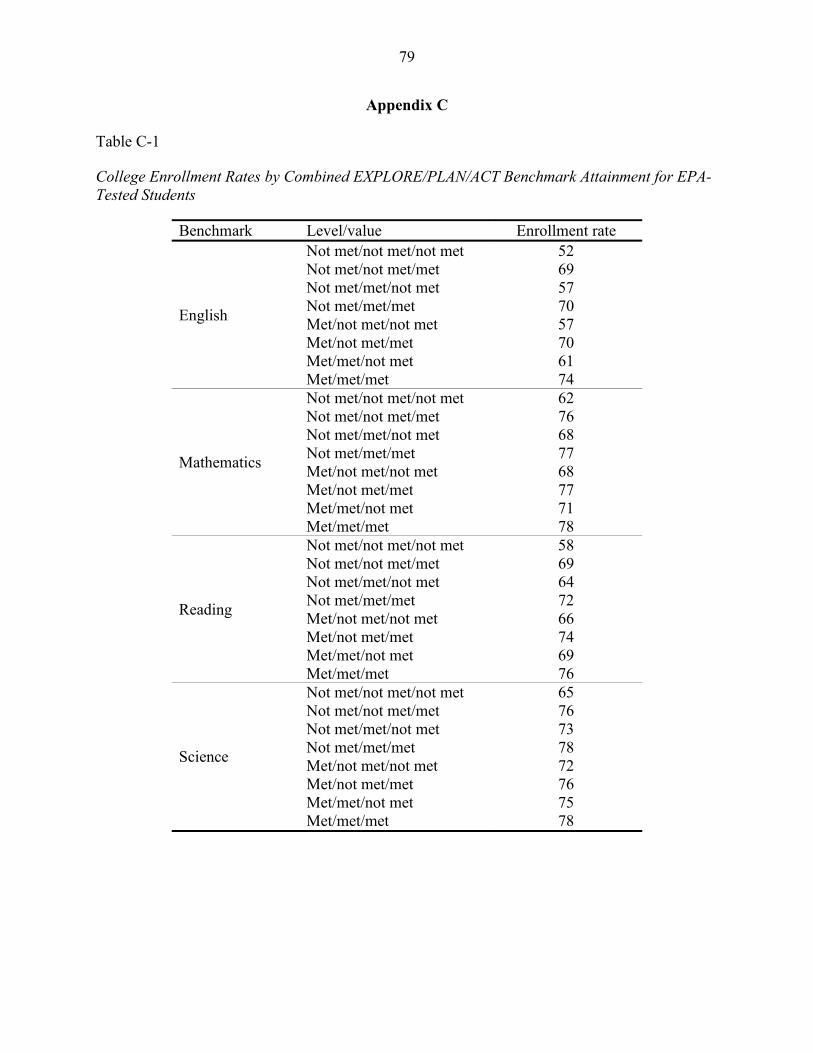
79
Appendix C Table C-1 College Enrollment Rates by Combined EXPLORE/PLAN/ACT Benchmark Attainment for EPA-Tested Students
Benchmark Level/value Enrollment rate
English
Not met/not met/not met 52 Not met/not met/met 69 Not met/met/not met 57 Not met/met/met 70 Met/not met/not met 57 Met/not met/met 70 Met/met/not met 61 Met/met/met 74
Mathematics
Not met/not met/not met 62 Not met/not met/met 76 Not met/met/not met 68 Not met/met/met 77 Met/not met/not met 68 Met/not met/met 77 Met/met/not met 71 Met/met/met 78
Reading
Not met/not met/not met 58 Not met/not met/met 69 Not met/met/not met 64 Not met/met/met 72 Met/not met/not met 66 Met/not met/met 74 Met/met/not met 69 Met/met/met 76
Science
Not met/not met/not met 65 Not met/not met/met 76 Not met/met/not met 73 Not met/met/met 78 Met/not met/not met 72 Met/not met/met 76 Met/met/not met 75 Met/met/met 78

80
Table C-1 (cont.)
Benchmark Level/value Enrollment rate
Number met
Met 0/met 0/met 0 51 Met 0/met 1-3/met 1-3 67 Met 1-3/met 1-3/met 0 57 Met 1-3/met 1-3/met 1-3 72 Met 1-3/met 1-3/met 4 79 Met 1-3/met 4/met 4 79 Met 4/met 4/met 1-3 75 Met 4/met 4/met 4 78
Number met (alternative grouping)
Met 0-2/met 0-2/met 0-2 62 Met 0-2/met 0-2/met 3-4 75 Met 0-2/met 3-4/met 0-2 69 Met 0-2/met 3-4/met 3-4 76 Met 3-4/met 0-2/met 0-2 70 Met 3-4/met 0-2/met 3-4 76 Met 3-4/met 3-4/met 0-2 72 Met 3-4/met 3-4/met 3-4 78
Note. Only selected categories are shown for results by combined EXPLORE/PLAN/ACT Benchmark attainment for number met. EPA = EXPLORE/PLAN/ACT.

81
Table C-2 College Retention Rates by Combined EXPLORE/PLAN/ACT Benchmark Attainment for EPA-Tested Two- and Four-Year Students
Benchmark Level/value
Four-year students (to same institution)
Two-year students (to any institution)
Year 2
Year 3
Year 4
Year 2
Year 3
Year 4
English
Not met/not met/not met 64 45 39 65 50 35 Not met/not met/met 74 56 49 Not met/met/not met 68 50 43 68 52 35 Not met/met/met 77 61 55 76 58 45 Met/not met/not met 68 51 44 68 49 38 Met/not met/met 79 63 56 77 63 52 Met/met/not met 70 54 46 70 53 40 Met/met/met 82 70 65 78 62 53
Mathematics
Not met/not met/not met 71 55 48 70 52 38 Not met/not met/met 81 69 64 81 67 58 Not met/met/not met 75 59 53 74 59 47 Not met/met/met 81 71 66 82 71 64 Met/not met/not met 76 61 54 76 60 49 Met/not met/met 83 72 66 82 68 59 Met/met/not met 77 63 57 76 61 51 Met/met/met 85 76 72 83 71 65
Reading
Not met/not met/not met 71 54 47 68 50 36 Not met/not met/met 78 66 58 73 56 47 Not met/met/not met 73 59 53 72 55 40 Not met/met/met 79 67 60 77 62 51 Met/not met/not met 75 59 53 72 56 45 Met/not met/met 80 68 62 76 59 49 Met/met/not met 77 62 57 76 61 51 Met/met/met 83 73 68 81 67 58
Science
Not met/not met/not met 75 59 52 72 55 42 Not met/not met/met 81 70 64 79 64 56 Not met/met/not met 80 66 62 80 66 60 Not met/met/met 85 76 70 78 65 61 Met/not met/not met 80 70 65 79 65 54 Met/not met/met 83 76 72 84 71 62 Met/met/not met 82 70 66 Met/met/met 86 78 74 82 74 66

82
Table C-2 (cont.)
Benchmark Level/value
Four-year students (to same institution)
Two-year students (to any institution)
Year 2
Year 3
Year 4
Year 2
Year 3
Year 4
Number met
Met 0/met 0/met 0 65 46 38 65 46 31 Met 0/met 1-3/met 1-3 73 56 48 71 54 41 Met 1-3/met 1-3/met 0 69 51 44 69 53 42 Met 1-3/met 1-3/met 1-3 77 64 57 76 60 50 Met 1-3/met 1-3/met 4 85 76 70 83 69 61 Met 1-3/met 4/met 4 86 77 72 Met 4/met 4/met 1-3 83 73 69 Met 4/met 4/met 4 86 78 75 86 75 71
Number met (alternative grouping)
Met 0-2/met 0-2/met 0-2 72 56 49 71 53 41 Met 0-2/met 0-2/met 3-4 81 69 62 79 62 51 Met 0-2/met 3-4/met 0-2 76 61 55 75 62 54 Met 0-2/met 3-4/met 3-4 83 72 66 81 67 60 Met 3-4/met 0-2/met 0-2 77 63 57 77 61 52 Met 3-4/met 0-2/met 3-4 83 73 68 83 67 58 Met 3-4/met 3-4/met 0-2 79 66 61 79 66 60 Met 3-4/met 3-4/met 3-4 85 76 72 84 72 66
Note. Retention rates are to the same institution for four-year students and to any institution for two-year students. Only selected categories are shown for results by combined EXPLORE/PLAN/ACT Benchmark attainment for number met. Rates are not shown for categories listed in the table with fewer than 20 students. EPA = EXPLORE/PLAN/ACT.
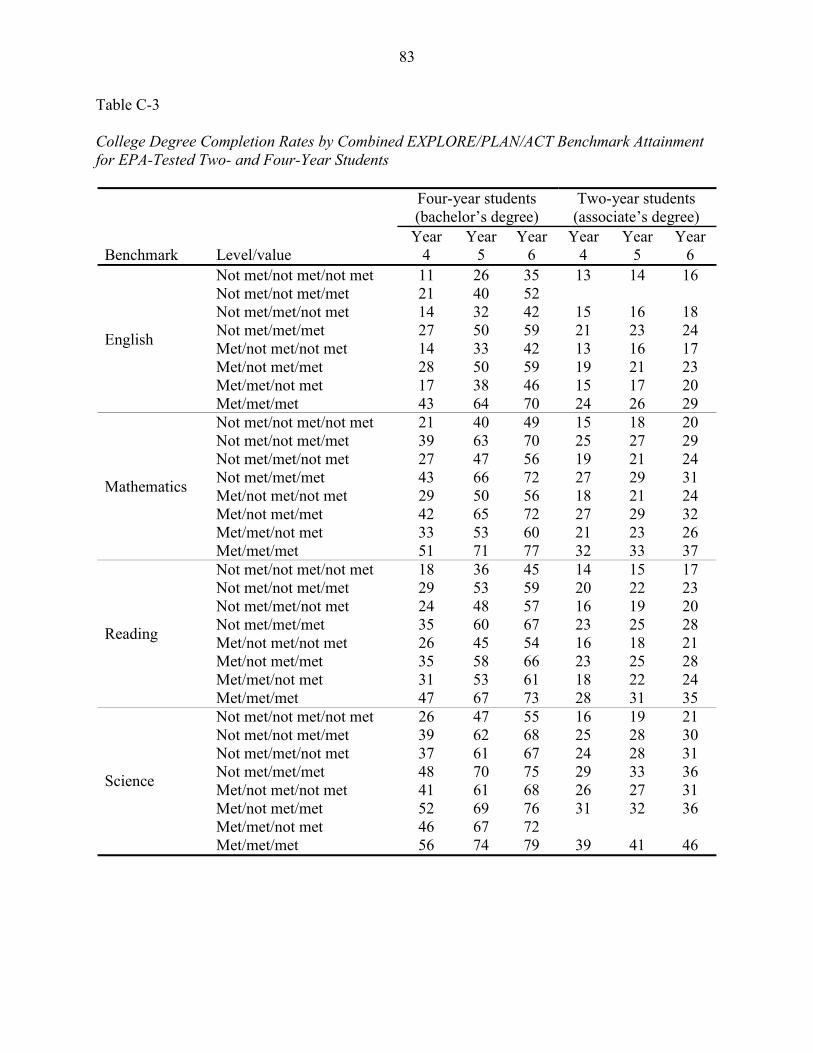
83
Table C-3 College Degree Completion Rates by Combined EXPLORE/PLAN/ACT Benchmark Attainment for EPA-Tested Two- and Four-Year Students
Benchmark Level/value
Four-year students (bachelor’s degree)
Two-year students (associate’s degree)
Year 4
Year 5
Year 6
Year 4
Year 5
Year 6
English
Not met/not met/not met 11 26 35 13 14 16 Not met/not met/met 21 40 52 Not met/met/not met 14 32 42 15 16 18 Not met/met/met 27 50 59 21 23 24 Met/not met/not met 14 33 42 13 16 17 Met/not met/met 28 50 59 19 21 23 Met/met/not met 17 38 46 15 17 20 Met/met/met 43 64 70 24 26 29
Mathematics
Not met/not met/not met 21 40 49 15 18 20 Not met/not met/met 39 63 70 25 27 29 Not met/met/not met 27 47 56 19 21 24 Not met/met/met 43 66 72 27 29 31 Met/not met/not met 29 50 56 18 21 24 Met/not met/met 42 65 72 27 29 32 Met/met/not met 33 53 60 21 23 26 Met/met/met 51 71 77 32 33 37
Reading
Not met/not met/not met 18 36 45 14 15 17 Not met/not met/met 29 53 59 20 22 23 Not met/met/not met 24 48 57 16 19 20 Not met/met/met 35 60 67 23 25 28 Met/not met/not met 26 45 54 16 18 21 Met/not met/met 35 58 66 23 25 28 Met/met/not met 31 53 61 18 22 24 Met/met/met 47 67 73 28 31 35
Science
Not met/not met/not met 26 47 55 16 19 21 Not met/not met/met 39 62 68 25 28 30 Not met/met/not met 37 61 67 24 28 31 Not met/met/met 48 70 75 29 33 36 Met/not met/not met 41 61 68 26 27 31 Met/not met/met 52 69 76 31 32 36 Met/met/not met 46 67 72 Met/met/met 56 74 79 39 41 46

84
Table C-3 (cont.)
Benchmark Level/value
Four-year students (bachelor’s degree)
Two-year students (associate’s degree)
Year 4
Year 5
Year 6
Year 4
Year 5
Year 6
Number met
Met 0/met 0/met 0 12 28 36 11 13 14 Met 0/met 1-3/met 1-3 19 43 51 15 17 18 Met 1-3/met 1-3/met 0 19 35 44 15 18 19 Met 1-3/met 1-3/met 1-3 31 53 61 21 23 26 Met 1-3/met 1-3/met 4 47 70 76 30 31 35 Met 1-3/met 4/met 4 51 73 79 Met 4/met 4/met 1-3 50 68 75 Met 4/met 4/met 4 57 75 81 38 40 45
Number met (alternative grouping)
Met 0-2/met 0-2/met 0-2 22 42 50 15 18 19 Met 0-2/met 0-2/met 3-4 34 60 67 23 24 28 Met 0-2/met 3-4/met 0-2 29 51 59 21 25 26 Met 0-2/met 3-4/met 3-4 41 66 72 28 29 32 Met 3-4/met 0-2/met 0-2 32 51 59 22 25 28 Met 3-4/met 0-2/met 3-4 44 65 72 28 30 35 Met 3-4/met 3-4/met 0-2 38 57 65 26 30 32 Met 3-4/met 3-4/met 3-4 52 72 78 33 36 40
Note. Bachelor’s degree completion rates for four-year students and associate’s degree completion rates for two-year students. Only selected categories are shown for results by combined EXPLORE/PLAN/ACT Benchmark attainment for number met. Rates are not shown for categories listed in table with fewer than 20 students. EPA = EXPLORE/PLAN/ACT.
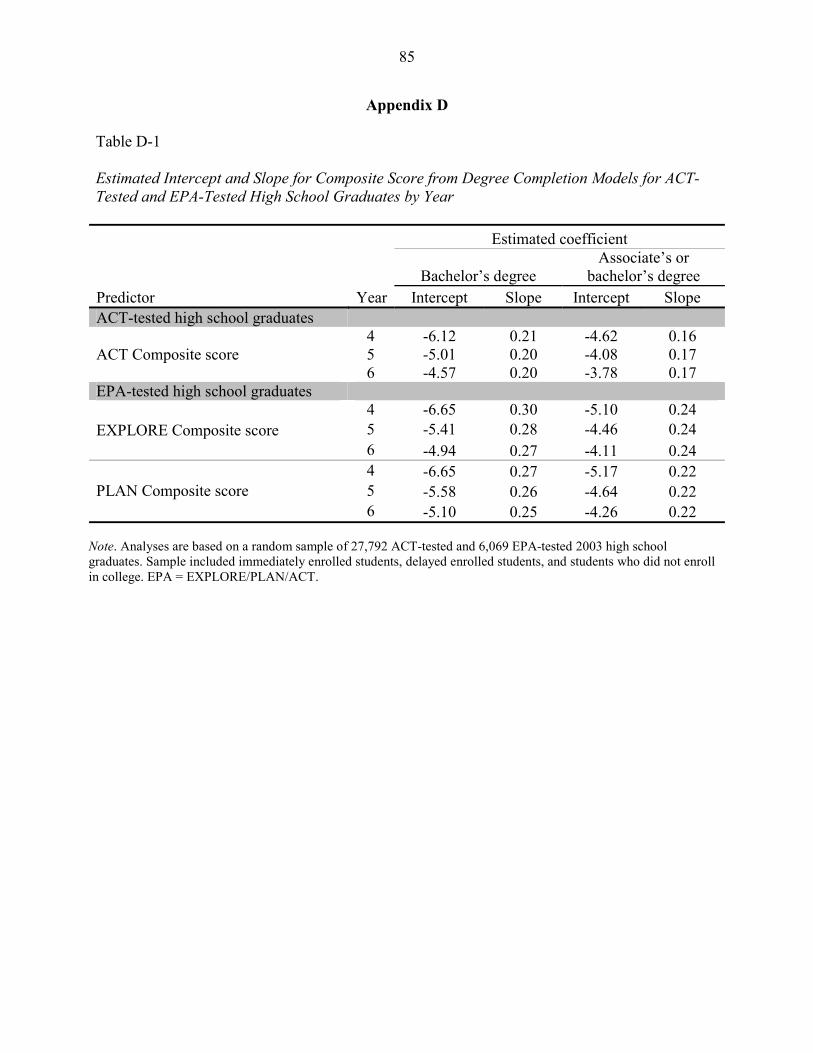
85
Appendix D Table D-1 Estimated Intercept and Slope for Composite Score from Degree Completion Models for ACT-Tested and EPA-Tested High School Graduates by Year Estimated coefficient
Predictor YearBachelor’s degree
Associate’s or bachelor’s degree
Intercept Slope Intercept Slope ACT-tested high school graduates
ACT Composite score 4 -6.12 0.21 -4.62 0.16 5 -5.01 0.20 -4.08 0.17 6 -4.57 0.20 -3.78 0.17
EPA-tested high school graduates
EXPLORE Composite score 4 -6.65 0.30 -5.10 0.24 5 -5.41 0.28 -4.46 0.24 6 -4.94 0.27 -4.11 0.24
PLAN Composite score 4 -6.65 0.27 -5.17 0.22 5 -5.58 0.26 -4.64 0.22 6 -5.10 0.25 -4.26 0.22
Note. Analyses are based on a random sample of 27,792 ACT-tested and 6,069 EPA-tested 2003 high school graduates. Sample included immediately enrolled students, delayed enrolled students, and students who did not enroll in college. EPA = EXPLORE/PLAN/ACT.

86
Table D-2 Estimated College Degree Completion Rates by EXPLORE Benchmark Attainment for EPA-Tested High School Graduates
EXPLORE Benchmark Level/value
Bachelor’s degree Associate’s or
bachelor’s degree Year
4 Year
5 Year
6 Year
4 Year
5 Year
6
English Not met 7 16 20 12 22 27 Met 24 40 45 30 45 51
Mathematics Not met 13 24 29 19 30 36 Met 32 49 55 36 54 59
Reading Not met 11 22 27 17 28 34 Met 28 44 50 33 49 55
Science Not met 16 29 34 22 35 41 Met 40 58 63 44 62 67
Number met
0 5 12 16 10 18 22 1 9 20 25 15 27 32 2 17 32 38 23 38 45 3 28 46 52 34 51 57 All 4 44 61 66 46 64 69
Note. Analyses are based on a random sample of 6,069 EPA-tested 2003 high school graduates. Sample included immediately enrolled students, delayed enrolled students, and students who did not enroll in college. EPA = EXPLORE/PLAN/ACT.

87
Table D-3 Estimated College Degree Completion Rates by PLAN Benchmark Attainment for EPA-Tested High School Graduates
PLAN Benchmark Level/value
Bachelor’s degree Associate’s or
bachelor’s degree Year
4 Year
5 Year
6 Year
4 Year
5 Year
6
English Not met 6 14 18 11 20 25 Met 24 40 45 30 45 51
Mathematics Not met 13 24 29 18 30 36 Met 33 51 56 38 55 61
Reading Not met 10 21 26 16 27 33 Met 27 44 49 33 49 54
Science Not met 16 29 34 22 35 41 Met 37 55 60 41 59 64
Number met
0 5 11 15 9 17 21 1 9 19 24 15 26 32 2 16 31 37 23 38 44 3 28 46 52 34 51 57 All 4 44 62 67 47 64 69
Note. Analyses are based on a random sample of 6,069 EPA-tested 2003 high school graduates. Sample included immediately enrolled students, delayed enrolled students, and students who did not enroll in college. EPA = EXPLORE/PLAN/ACT.


*050202120* Rev 1
Tracking 2003 ACT®-Tested High School Graduates: College Readiness, Enrollment, and Long-Term Success
Justine Radunzel Julie Noble
April 2012
ACT Research Report Series
2012 (2)