trace elements leaching from organic soils stabilized...
TRANSCRIPT

Trace Elements Leaching from OrganicSoils Stabilized with High Carbon Fly Ash
Jacob J. Sauer1; Craig H. Benson, F.ASCE2; Ahmet H. Aydilek, M.ASCE3; and Tuncer B. Edil, F.ASCE4
Abstract: Leaching of four trace elements [cadmium (Cd), chromium (Cr), selenium (Se), and silver (Ag)] from soft organic soils stabilizedwith high carbon fly ashes (HCFAs) was assessed using water leach tests (WLTs) and column leach tests (CLTs) on soil alone, fly ashalone, and soil-fly ash mixtures. Concentrations from the WLTs on soil-fly ash mixtures were lower than concentrations from the WLTson fly ash alone, and were controlled more by the fly ash than the soil. However, dilution calculations based on tests on soil alone and fly ashalone were unreliable. Thus, leaching assessments should be conducted directly on soil-fly ash mixtures. Leaching patterns from the CLTsfollowed first-flush and lagged-response patterns with comparable frequency, although first-flush patterns were more common with fly ashwith higher calcium oxide content. Cd and Cr exhibited first-flush leaching more frequently, Ag a lagged-response pattern more frequently,and Se exhibited first-flush or lagged-response patterns with similar frequency. The hydrogen ion concentration (pH) had a strong effect onleaching concentrations, with lower concentrations of Ag and Cd and higher concentrations of Cr at a higher pH. Peak concentrations of Agand Cd for flow-through conditions can conservatively be estimated as 50 times the WLT concentration, whereas a factor of 100 should beapplied for Cr and Se for organic soil-HCFA mixtures. DOI: 10.1061/(ASCE)GT.1943-5606.0000653. © 2012 American Society of CivilEngineers.
CE Database subject headings: Soils; Fly ash; Trace elements; Leaching.
Author keywords: Organic soil; Fly ash; Coal combustion products; CCPs; Stabilization; Trace elements; Leaching; Sustainability.
Introduction
Fly ash is a silt-size particulate collected by air pollution controlsystems at coal-fired electric power plants. Approximately 24%of fly ash is used in production of Portland cement (PC) or inPC concrete (Benson et al. 2010). However, some fly ashes containsignificant amounts of unburned carbon and cannot be used as aconcrete additive because of interactions with air entrainmentagents. These high carbon fly ashes (HCFAs) generally are dis-posed in landfills (Hodges and Keating 1999). However, manyHCFAs have cementitious properties that may be useful in otherapplications. For example, Edil et al. (2006) and Tastan et al.(2011) indicate that HCFAs can be effective in stabilizing soft or-ganic soils, which can be difficult to stabilize with conventionalcementing agents (Clare and Sherwood 1954, 1956; Hamptonand Edil 1998; Tremblay et al. 2002).
In situ stabilization of soft soils using cementitious fly ashhas become attractive because of factors such as construction
expediency, cost, and interest in sustainable construction (Ferguson1993; Sridharan et al. 1997; Edil et al. 2006; Tastan et al. 2011).Stabilizing the soil in place reduces damage to the landscape asso-ciated with conventional construction methods, which involves re-moval and transport of large volumes of soft soil and replacementwith crushed rock from quarries. Eliminating removal and replace-ment of soft soil also reduces the carbon and energy footprint as-sociated with highway construction. However, the potential forenvironmental impacts, such as groundwater contamination be-cause of leaching of trace elements, is a concern when fly ashis used in soil stabilization (Bin-Shafique et al. 2006; Li et al.2007).
This study was conducted to evaluate leaching of four trace el-ements [silver (Ag), cadmium (Cd), chromium (Cr), and selenium(Se)] from three soft organic soils stabilized with high carbon flyashes. All three soils are encountered as soft subgrades during high-way construction in Wisconsin. Ag, Cd, Cr, and Se were selectedbecause they are regulated by the Wisconsin Administrative Codewhen coal fly ash is used in confined geotechnical applications,such as subgrade stabilization with an overlying pavement. Theseelements also differ in solubility and mobility. Cr and Se typicallyare in oxyanion complexes that are soluble and mobile at neutral oralkaline hydrogen ion concentration (pH). Ag and Cd typically arecations that are less soluble and mobile, particularly at higher pH(Smith 2007).
Batch water leach tests (WLTs) and column leach tests (CLTs)were conducted on the soils and soil-fly ash mixtures. Results ofthese tests are used to evaluate leaching patterns, relationships be-tween concentrations from batch tests used for regulatory applica-tions and those from column tests that correspond to more realisticflow-through conditions, and peak concentrations that might be en-countered in subgrade stabilization applications. Potential impactsto groundwater are also discussed.
1Project Engineer, Golder Associates, 44 Union Blvd., Ste 300,Lakewood, CO 80228. E-mail: [email protected]
2Wisconsin Distinguished Professor and Chair of Geological Engineer-ing and Director, Recycled Materials Resource Center, Univ. of Wisconsin,Madison, WI 53706. E-mail: [email protected]
3Associate Professor, Dept. of Civil and Environmental Engineering,Univ. of Maryland, College Park, MD 20742 (corresponding author).E-mail: [email protected]
4Professor of Geological Engineering and Research Director, RecycledMaterials Resource Center, Univ. of Wisconsin, Madison, WI 53706.E-mail: [email protected]
Note. This manuscript was submitted on February 16, 2011; approvedon November 1, 2011; published online on November 3, 2011. Discussionperiod open until January 1, 2013; separate discussions must be submittedfor individual papers. This paper is part of the Journal of Geotechnical andGeoenvironmental Engineering, Vol. 138, No. 8, August 1, 2012.©ASCE, ISSN 1090-0241/2012/8-968–980/$25.00.
968 / JOURNAL OF GEOTECHNICAL AND GEOENVIRONMENTAL ENGINEERING © ASCE / AUGUST 2012
J. Geotech. Geoenviron. Eng. 2012.138:968-980.
Dow
nloa
ded
from
asc
elib
rary
.org
by
Wis
cons
in U
niv
Of
Mad
ison
on
08/1
7/12
. For
per
sona
l use
onl
y. N
o ot
her
uses
with
out p
erm
issi
on. C
opyr
ight
(c)
201
2. A
mer
ican
Soc
iety
of
Civ
il E
ngin
eers
. All
righ
ts r
eser
ved.
Materials
Coal Fly Ash
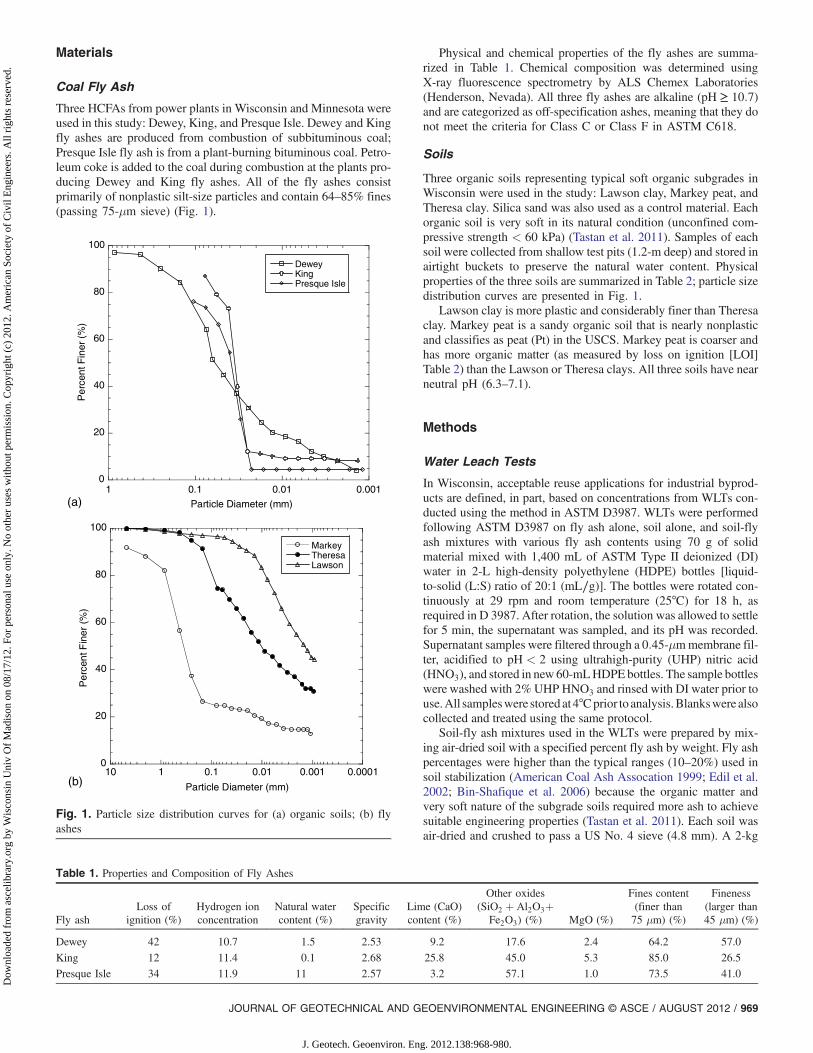
Three HCFAs from power plants in Wisconsin and Minnesota wereused in this study: Dewey, King, and Presque Isle. Dewey and Kingfly ashes are produced from combustion of subbituminous coal;Presque Isle fly ash is from a plant-burning bituminous coal. Petro-leum coke is added to the coal during combustion at the plants pro-ducing Dewey and King fly ashes. All of the fly ashes consistprimarily of nonplastic silt-size particles and contain 64–85% fines(passing 75-μm sieve) (Fig. 1).
Physical and chemical properties of the fly ashes are summa-rized in Table 1. Chemical composition was determined usingX-ray fluorescence spectrometry by ALS Chemex Laboratories(Henderson, Nevada). All three fly ashes are alkaline (pH ≥ 10:7)and are categorized as off-specification ashes, meaning that they donot meet the criteria for Class C or Class F in ASTM C618.
Soils
Three organic soils representing typical soft organic subgrades inWisconsin were used in the study: Lawson clay, Markey peat, andTheresa clay. Silica sand was also used as a control material. Eachorganic soil is very soft in its natural condition (unconfined com-pressive strength < 60 kPa) (Tastan et al. 2011). Samples of eachsoil were collected from shallow test pits (1.2-m deep) and stored inairtight buckets to preserve the natural water content. Physicalproperties of the three soils are summarized in Table 2; particle sizedistribution curves are presented in Fig. 1.
Lawson clay is more plastic and considerably finer than Theresaclay. Markey peat is a sandy organic soil that is nearly nonplasticand classifies as peat (Pt) in the USCS. Markey peat is coarser andhas more organic matter (as measured by loss on ignition [LOI]Table 2) than the Lawson or Theresa clays. All three soils have nearneutral pH (6.3–7.1).
Methods
Water Leach Tests
In Wisconsin, acceptable reuse applications for industrial byprod-ucts are defined, in part, based on concentrations from WLTs con-ducted using the method in ASTM D3987. WLTs were performedfollowing ASTM D3987 on fly ash alone, soil alone, and soil-flyash mixtures with various fly ash contents using 70 g of solidmaterial mixed with 1,400 mL of ASTM Type II deionized (DI)water in 2-L high-density polyethylene (HDPE) bottles [liquid-to-solid (L∶S) ratio of 20∶1 (mL∕g)]. The bottles were rotated con-tinuously at 29 rpm and room temperature (25°C) for 18 h, asrequired in D 3987. After rotation, the solution was allowed to settlefor 5 min, the supernatant was sampled, and its pH was recorded.Supernatant samples were filtered through a 0:45-μmmembrane fil-ter, acidified to pH < 2 using ultrahigh-purity (UHP) nitric acid(HNO3), and stored in new 60-mLHDPEbottles. The sample bottleswere washed with 2% UHP HNO3 and rinsed with DI water prior touse.All sampleswere stored at4°Cprior to analysis.Blankswere alsocollected and treated using the same protocol.
Soil-fly ash mixtures used in the WLTs were prepared by mix-ing air-dried soil with a specified percent fly ash by weight. Fly ashpercentages were higher than the typical ranges (10–20%) used insoil stabilization (American Coal Ash Assocation 1999; Edil et al.2002; Bin-Shafique et al. 2006) because the organic matter andvery soft nature of the subgrade soils required more ash to achievesuitable engineering properties (Tastan et al. 2011). Each soil wasair-dried and crushed to pass a US No. 4 sieve (4.8 mm). A 2-kg
0
20
40
60
80
100
0.0010.010.11
DeweyKingPresque Isle
Per
cent
Fin
er (
%)
Particle Diameter (mm)(a)
0
20
40
60
80
100
0.00010.0010.010.1110
MarkeyTheresaLawson
Per
cent
Fin
er (
%)
Particle Diameter (mm)(b)
Fig. 1. Particle size distribution curves for (a) organic soils; (b) flyashes
Table 1. Properties and Composition of Fly Ashes
Fly ashLoss of
ignition (%)Hydrogen ionconcentration
Natural watercontent (%)
Specificgravity
Lime (CaO)content (%)
Other oxides(SiO2 þ Al2O3þ
Fe2O3) (%) MgO (%)
Fines content(finer than75 μm) (%)
Fineness(larger than45 μm) (%)
Dewey 42 10.7 1.5 2.53 9.2 17.6 2.4 64.2 57.0
King 12 11.4 0.1 2.68 25.8 45.0 5.3 85.0 26.5
Presque Isle 34 11.9 11 2.57 3.2 57.1 1.0 73.5 41.0
JOURNAL OF GEOTECHNICAL AND GEOENVIRONMENTAL ENGINEERING © ASCE / AUGUST 2012 / 969
J. Geotech. Geoenviron. Eng. 2012.138:968-980.
Dow
nloa
ded
from
asc
elib
rary
.org
by
Wis
cons
in U
niv
Of
Mad
ison
on
08/1
7/12
. For
per
sona
l use
onl
y. N
o ot
her
uses
with
out p
erm
issi
on. C
opyr
ight
(c)
201
2. A
mer
ican
Soc
iety
of
Civ
il E
ngin
eers
. All
righ
ts r
eser
ved.

sample of soil and fly ash was blended on a tray, and DI water wasadded to the mixture using a spray bottle; therefore, the mixture hada water content 2% dry of standard Proctor optimum water content.These mixtures were sealed in plastic bags and allowed to cure in amoisture-controlled environment for 7 days prior to testing.
Column Tests
CLTs were conducted on soils alone and soil-fly ash mixtures toassess leaching under flow-through conditions that resemble fieldconditions more closely. CLTs were also conducted on specimens
Table 2. Physical Properties of Soils
Soil
Loss ofignition(%)
Hydrogenion
concentrationLiquidlimit
Plasticityindex
Clayfraction(< 2 μm)
(%)Specificgravity
Finescontent
(< 75 μm)(%)
Naturalwatercontent(%)
Optimumwatercontent(%)
Maximumdry unitweight(kN∕m3)
Unconfinedcompressivestrength(kPa)
USCSDesignation
Lawson 5 6.9 50 19 55 2.58 79 28 28 13.3 57 OL-OH
Markey 27 6.3 53 1 14 2.23 19 57 46 10.3 15 Pt
Theresa 6 7.1 31 8 37 2.57 47 20 21 15.2 36 SM-OL
Sand 0 7.5 Nonplastic Nonplastic 0 2.65 0 — — — — SP
Table 3. Hydrogen Ion Concentration and Concentrations of Cadmium, Chromium, Selenium, and Silver from Water Leach Tests on Soils, Fly Ashes, andSoil-Fly Ash Mixtures
Soil Fly ash Fly ash content (%)Leachate hydrogenion concentration
Metal concentration (μg∕L)
Cadmium Chromium Selenium Silver
Lawson Dewey 20 9.9 0.8 2.8 30.6 < 2:5
30 10.0 < 0:2 1.4 < 10 < 2:5
40 10.2 < 0:2 4.8 < 10 < 2:5
King 20 11.3 < 0:2 1.8 < 10 < 2:5
30 11.0 0.9 7.3 11.5 < 2:5
40 11.2 < 0:2 5.3 < 10 < 2:5
Presque Isle 20 9.2 1.0 1.2 38.7 < 2:5
30 9.5 1.1 1.9 44.4 < 2:5
40 9.4 < 0:2 1.2 < 10 < 2:5
Markey Dewey 20 8.2 < 0:2 < 1:0 20.8 < 2:5
30 8.6 < 0:2 < 1:0 26.5 < 2:5
40 8.6 < 0:2 < 1:0 < 10 < 2:5
King 20 9.6 < 0:2 1.1 < 10 < 2:5
30 10.0 0.4 27.9 21.9 < 2:5
40 10.5 < 0:2 3.9 < 10 < 2:5
Presque Isle 20 8.5 < 0:2 < 1:0 18.4 < 2:5
30 9.2 < 0:2 < 1:0 30.4 < 2:5
40 8.9 < 0:2 < 1:0 12.0 < 2:5
Theresa Dewey 20 9.4 < 0:2 < 1:0 < 10 < 2:5
30 10.2 < 0:2 7.0 < 10 < 2:5
40 9.7 < 0:2 1.5 < 10 < 2:5
King 20 11.3 < 0:2 9.4 < 10 < 2:5
30 11.6 0.3 50.4 23.7 < 2:5
40 11.4 < 0:2 14.8 < 10 < 2:5
Presque Isle 20 9.7 < 0:2 < 1:0 < 10 < 2:5
30 10.1 < 0:2 4.1 12.4 2.7
40 9.9 < 0:2 1.2 < 10 < 2:5
Lawson None 0 8.0 < 0:2 < 1:0 < 10 < 2:5
Markey 0 8.2 < 0:2 < 1:0 < 10 < 2:5
Theresa 0 9.1 0.3 < 1:0 17.6 < 2:5
None Dewey 100 10.7 0.4 12.8 22.8 6.6
King 100 11.4 < 0:2 59.9 31.5 3.6
Presque Isle 100 11.9 0.5 16.5 165.0 < 2:5
U.S. EPA maximum contaminant level 5.0 100.0 50.0 50
Wisconsin NR 538 25.0 5,000.0 250.0 250
Note: Concentrations exceeding maximum contaminant levels are in bold font. Wisconsin drinking water limits are the same as the U.S. EPA maximumcontaminant levels for drinking water standards. Wisconsin limits were used for silver, because the U.S. EPA does not list a maximum contaminant level forsilver. NR 538 is the maximum allowable concentrations for reuse of fly ash in confined fill applications in Wisconsin.
970 / JOURNAL OF GEOTECHNICAL AND GEOENVIRONMENTAL ENGINEERING © ASCE / AUGUST 2012
J. Geotech. Geoenviron. Eng. 2012.138:968-980.
Dow
nloa
ded
from
asc
elib
rary
.org
by
Wis
cons
in U
niv
Of
Mad
ison
on
08/1
7/12
. For
per
sona
l use
onl
y. N
o ot
her
uses
with
out p
erm
issi
on. C
opyr
ight
(c)
201
2. A
mer
ican
Soc
iety
of
Civ
il E
ngin
eers
. All
righ
ts r
eser
ved.

of clean sand mixed with 30% fly ash to simulate a fly ash mixturewhere sorption by soil solids is negligible.
All soils were air-dried and crushed to pass the US No. 4(4.8-mm) sieve. Fly ash was hand-mixed with the dry soil, andthe blend was sprayed with DI water to achieve a water content 2%dry of standard Proctor optimum water content. Moistened soil-flyash mixtures were compacted in a mold (102 mmdiameter ×116 mm tall) using standard Proctor energy 1 h after mixing to sim-ulate the delay between mixing and compaction that is common inthe field (Ferguson 1993; Edil et al. 2002). After compaction, thespecimens were extruded from the mold, sealed in plastic wrap, andcured for 7 days at 21°C and 100% humidity.
CLTs were conducted in general conformance with ASTMD4874; except a flexible wall permeameter was employed as de-scribed in Bin-Shafique et al. (2002). Flow was oriented upward,the effective confining pressure was 15 kPa, and the hydraulic gra-dient was maintained between 7 and 10. These gradients are largerthan typically encountered in the field (∼1), but were required to
conduct the tests in a reasonable time frame. Creek and Shackelford(1992) showed that leaching of trace elements from fly ash is in-dependent of the hydraulic gradient. However, for some materials(e.g., bottom ash from solid waste incinerators), the release of traceelements can be affected by the gradient (e.g., Wehrer and Totsche2008). The effect of gradient should be addressed when applyingthe findings from column tests to a field condition.
The influent was a 0.1-M LiBr solution prepared with ASTMType II DI water, which was used to simulate a salt-laden percolatesimilar to that encountered in northern regions where salt is appliedto roadways for deicing (Bin-Shafique et al. 2006). LiBr was usedbecause both Li and Br are uncommon in subgrades and fly ashes,and Li has a lower preference for sorption compared with the traceelements of concern in this study (Cd, Se, Ag, and Cr). The influentwas exposed to the atmosphere to permit equilibrium with atmos-pheric CO2 prior to testing.
Leachate from each column was collected in sealed Teflon blad-ders that were emptied after approximately 30–60 mL of flow had
0.0
0.2
0.4
0.6
0.8
1.0
1.2
0.0 0.2 0.4 0.6 0.8 1.0 1.2
Obs
erve
d W
LT C
once
ntra
tion
(µg/
L)
Diluted WLT Concentration (µg/L)
1:1
0
10
20
30
40
50
60
0 10 20 30 40 50 60
Obs
erve
d W
LT C
once
ntra
tion
(µg/
L)
Diluted WLT Concentration (µg/L)
1:1
0
10
20
30
40
50
60
0 10 20 30 40 50 60
Obs
erve
d W
LT C
once
ntra
tion
(µg/
L)
Diluted WLT Concentration (µg/L)
1:1
0.0
0.5
1.0
1.5
2.0
2.5
3.0
0.0 0.5 1.0 1.5 2.0 2.5 3.0
Obs
erve
d W
LT C
once
ntra
tion
(µg/
L)
Diluted WLT Concentration (µg/L)
1:1
(a) (b)
(c) (d)
Fig. 2. Comparison of water leach test leachate concentrations and diluted concentrations of (a) cadmium; (b) chromium; (c) selenium; (d) Ag
JOURNAL OF GEOTECHNICAL AND GEOENVIRONMENTAL ENGINEERING © ASCE / AUGUST 2012 / 971
J. Geotech. Geoenviron. Eng. 2012.138:968-980.
Dow
nloa
ded
from
asc
elib
rary
.org
by
Wis
cons
in U
niv
Of
Mad
ison
on
08/1
7/12
. For
per
sona
l use
onl
y. N
o ot
her
uses
with
out p
erm
issi
on. C
opyr
ight
(c)
201
2. A
mer
ican
Soc
iety
of
Civ
il E
ngin
eers
. All
righ
ts r
eser
ved.

accumulated (∼0:1 pore volumes). This leachate was filtered andacidified to pH < 2 using UHP HNO3 and stored in HDPE samplebottles with no headspace at 4°C.
Chemical Analysis
Analyses for Cd, Cr, Se, and Ag in solution were conductedby inductively coupled plasma optical emission spectroscopy(ICP-OES) in accordance with EPA Standard Method 200.7 usinga Thermo Jarrell Ash ICAP 61E Trace Analyzer or a Perkin ElmerOptima 4300 DV ICP-OES with an AS 90 Plus autosampler.Blanks were run every 10–20 analyses, and the calibration wasverified every 10 analyses. A reagent blank was tested every 20samples and a spiked sample was analyzed every 10 samples.The limits of detection for the ICP analyses were as follows: Cd(0.2 or 0:7 μg∕L), Ag (0.8 or 2:5 μg∕L), Cr (1.0 or 1:7 μg∕L), andSe (4.0 or 10 μg∕L) (Thermo Jarrell Ash or Perkin Elmer).
Results of Water Leach Tests
Leachate Concentrations
Cd, Cr, Se, and Ag concentrations and leachate pH for all WLTs areshown in Table 3 along with U.S. EPA or Wisconsin maximumcontaminant levels (MCLs) for drinking water (whichever islower), and the maximum concentrations in Section NR538 ofthe Wisconsin Administrative Code for reuse of fly ash in confinedgeotechnical applications. All concentrations are below both of thelimits, except for Se concentrations from Presque Isle fly, whichexceed MCLs.
Leachate pHs for the soil-fly ash mixtures prepared with Kingash are highest because of the higher lime content of King ash.Leachate pHs for mixtures prepared with the Dewey and PresqueIsle ashes are comparable. Mixtures prepared with the Markey peathad the lowest leachate pHs of all mixtures, which may be becauseof buffering from the organic matter in the Markey peat. LeachatepHs for the tests on fly ash alone ranged from 10.7 to 11.9. Thehighest and lowest pHs are associated with Presque Isle and Deweyashes, which have the highest and lowest trioxide (SiO2 þ Al2O3þFe2O3) contents.
Concentrations of Cd and Ag for the soil-fly ash mixtures werevery low, with Cd being below the detection limit for 78% of themixtures and Ag being below the detection limit for 96% of themixtures. Moreover, when Cd and Ag were detected, the concen-trations were very low (< 1:1 μg∕L for Cd, < 2:7 μg∕L for Ag).The relatively low concentrations of Cd and Ag are attributed totheir low solubility at an elevated pH (Kosson et al. 2009), as wellas their high propensity for sorption onto the ash and soil solids.
Higher concentrations were obtained for Cr and Se, with the Seconcentrations being the highest. Nevertheless, concentrations be-low the detection limit for Cr were obtained for 30% of the mixturesand for Se for 56% of the mixtures. The highest concentrations ofSe generally were obtained from mixtures prepared with the Pre-sque Isle ash, which had the highest Se concentrations in the WLTsconducted on fly ash alone.
Lower concentrations were obtained from the WLTs on the soilsalone, and in most cases concentrations from WLTs on the soilswere below detection limits. The exceptions are for Theresasoil, which had Cd (0:3 μg∕L) and Se (17:6 μg∕L) above detectionlimits. Leachate pHs for the soils ranged between 8.0 and 9.1.
Dilution Calculations
Linear dilution calculations are sometimes applied to WLT data toaccount for the decrease in concentration anticipated by blending a
byproduct with soil. Bin-Shafique et al. (2006) showed that dilutioncalculations can be misleading for inorganic soils stabilized withlow carbon ashes, and attributed the errors to the nonlinear variationof pH with fly ash content. A similar analysis was made for the soil-fly ash mixtures using the data in Table 3. Diluted concentrationswere calculated as linear mass-weighted concentrations using con-centrations from the WLTs on the soil alone and the fly ash alone.
Actual concentrations for soil-fly ash mixtures are comparedwith the diluted concentrations in Fig. 2. There is virtually no cor-respondence between the diluted and actual concentrations. Thereis also no systematic under- or overestimation of concentrationfrom the dilution calculation. These findings, and those in Bin-Shafique et al. (2006), indicate that dilution calculations shouldnot be used to determine leachate concentrations for soil-fly ashmixtures.
Fly Ash Content, Hydrogen Ion Concentration, andLeachate Concentration
The relationship between leachate pH and fly ash content fromthe WLTs is shown in Fig. 3. Leachate pH is higher for thesoil-fly ash mixtures than the soils alone, and lower than the pHof the ash alone, but is relatively insensitive to the fly ash content.Bin-Shafique et al. (2006) showed greater sensitivity of pH to thefly ash content for inorganic soils, but the authors used fly ashcontents between 10 and 20%, whereas higher fly ash contents(20–40%) were used in this study to provide the additional cement-ing needed to stabilize organic soils (Tastan et al. 2011). The
6
7
8
9
10
11
12
13
MarkeyTheresaLawson
pH
pH (FA)
= 10.7
6
7
8
9
10
11
12
13
MarkeyTheresaLawson
0 20 40 60 80 100
0 20 40 60 80 100
pH
pH (FA)
= 11.4
6
7
8
9
10
11
12
13
0 20 40 60 80 100
MarkeyTheresaLawson
pH
Fly Ash Content (%)
pH (FA)
= 11.9
(a)
(b)
(c)
Fig. 3. Leachate hydrogen ion concentration from water leach tests onsoil-fly ash mixtures containing (a) Dewey; (b) King; (c) Presque Islefly ash
972 / JOURNAL OF GEOTECHNICAL AND GEOENVIRONMENTAL ENGINEERING © ASCE / AUGUST 2012
J. Geotech. Geoenviron. Eng. 2012.138:968-980.
Dow
nloa
ded
from
asc
elib
rary
.org
by
Wis
cons
in U
niv
Of
Mad
ison
on
08/1
7/12
. For
per
sona
l use
onl
y. N
o ot
her
uses
with
out p
erm
issi
on. C
opyr
ight
(c)
201
2. A
mer
ican
Soc
iety
of
Civ
il E
ngin
eers
. All
righ
ts r
eser
ved.
abundance of fly ash in the specimens tested in this study may havemasked a relationship between pH and fly ash content.
pH of leachate from mixtures prepared with Markey peat wasalways lower than mixtures prepared with Theresa clay for anygiven fly ash type and fly ash content, with Lawson clay generallyfalling in between. Markey peat also had a lower paste pH than bothLawson and Theresa soils (pH 6.3 versus 6.9 and 7.1, Table 2). Thelower paste pH and WLT leachate pH for the Markey peat may bebecause of organic acids in the Markey peat, which has muchhigher organic matter content compared with the other two organicsoils.
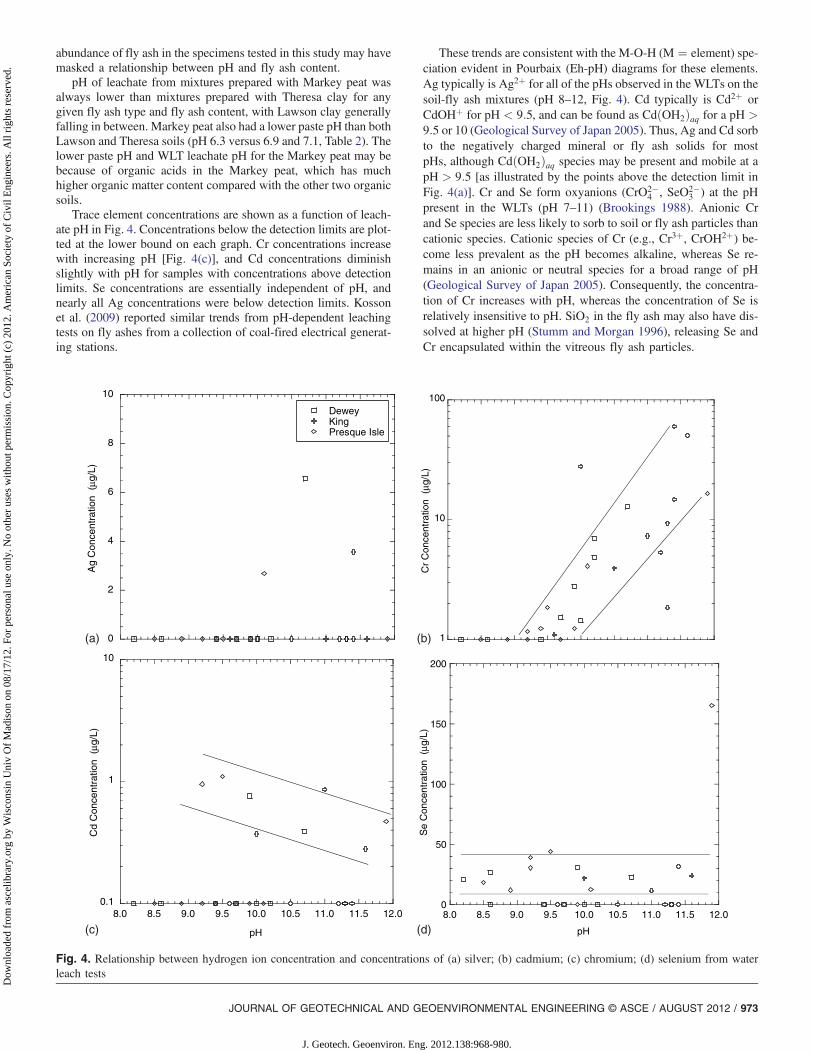
Trace element concentrations are shown as a function of leach-ate pH in Fig. 4. Concentrations below the detection limits are plot-ted at the lower bound on each graph. Cr concentrations increasewith increasing pH [Fig. 4(c)], and Cd concentrations diminishslightly with pH for samples with concentrations above detectionlimits. Se concentrations are essentially independent of pH, andnearly all Ag concentrations were below detection limits. Kossonet al. (2009) reported similar trends from pH-dependent leachingtests on fly ashes from a collection of coal-fired electrical generat-ing stations.
These trends are consistent with the M-O-H (M ¼ element) spe-ciation evident in Pourbaix (Eh-pH) diagrams for these elements.Ag typically is Ag2þ for all of the pHs observed in the WLTs on thesoil-fly ash mixtures (pH 8–12, Fig. 4). Cd typically is Cd2þ orCdOHþ for pH < 9:5, and can be found as CdðOH2Þaq for a pH >9:5 or 10 (Geological Survey of Japan 2005). Thus, Ag and Cd sorbto the negatively charged mineral or fly ash solids for mostpHs, although CdðOH2Þaq species may be present and mobile at apH > 9:5 [as illustrated by the points above the detection limit inFig. 4(a)]. Cr and Se form oxyanions (CrO2�
4 , SeO2�3 ) at the pH
present in the WLTs (pH 7–11) (Brookings 1988). Anionic Crand Se species are less likely to sorb to soil or fly ash particles thancationic species. Cationic species of Cr (e.g., Cr3þ, CrOH2þ) be-come less prevalent as the pH becomes alkaline, whereas Se re-mains in an anionic or neutral species for a broad range of pH(Geological Survey of Japan 2005). Consequently, the concentra-tion of Cr increases with pH, whereas the concentration of Se isrelatively insensitive to pH. SiO2 in the fly ash may also have dis-solved at higher pH (Stumm and Morgan 1996), releasing Se andCr encapsulated within the vitreous fly ash particles.
0
2
4
6
8
10
DeweyKingPresque Isle
Ag
Con
cent
ratio
n (
µg/L
)
1
10
100
Cr
Con
cent
ratio
n (
µg/L
)
0.1
1
10
8.0 8.5 9.0 9.5 10.0 10.5 11.0 11.5 12.0
Cd
Con
cent
ratio
n (
µg/L
)
pH
0
50
100
150
200
8.0 8.5 9.0 9.5 10.0 10.5 11.0 11.5 12.0
Se
Con
cent
ratio
n (
µg/L
)
pH
(a) (b)
(c) (d)
Fig. 4. Relationship between hydrogen ion concentration and concentrations of (a) silver; (b) cadmium; (c) chromium; (d) selenium from waterleach tests
JOURNAL OF GEOTECHNICAL AND GEOENVIRONMENTAL ENGINEERING © ASCE / AUGUST 2012 / 973
J. Geotech. Geoenviron. Eng. 2012.138:968-980.
Dow
nloa
ded
from
asc
elib
rary
.org
by
Wis
cons
in U
niv
Of
Mad
ison
on
08/1
7/12
. For
per
sona
l use
onl
y. N
o ot
her
uses
with
out p
erm
issi
on. C
opyr
ight
(c)
201
2. A
mer
ican
Soc
iety
of
Civ
il E
ngin
eers
. All
righ
ts r
eser
ved.

Soil Properties and Leachate Concentrations
Organic matter content (as LOI) and plasticity index (PI) distin-guish the soils and can be indicators of mobility. LOI is a measureof the organic content of the soil, which may alter mobility of traceelements by providing sorption sites or by providing dissolved or-ganic carbon for complication of trace elements. The PI is a mea-sure of clay content and clay type, and sorption of cationic speciesis expected to increase as PI increases (Bin-Shafique et al. 2006).However, neither LOI or the PI had a systematic effect on WLTconcentrations (Figs. 5 and 6). This suggests that the WLT concen-trations are controlled primarily by the ash, and to a lesser extent bythe properties of their fine-textured soils.
Results of Column Leach Tests
Analysis of Leaching Patterns
CLTs were conducted on soil-fly ash mixtures and soils alone toassess leaching under flow-through conditions. Fly ash-sand mix-tures were also tested to simulate mixtures with minimal sorptiononto soil solids.
Two leaching patterns were observed during the study, first-flush and lagged-response, as illustrated by the examples shownin Fig. 7. First-flush leaching is characterized by high initial con-centrations followed by monotonically decreasing concentrationswith increasing pore volumes of flow (PVF) [Fig. 7(a)], whereaslagged response refers to an increasing concentration that reachesa peak and then decreases [Fig. 7(b)]. Because approximately 0.1PVF was required to obtain a leachate sample for analysis, none ofthe samples precisely represent the initial first-flush effluent con-centration (i.e., PVF ¼ 0). Tests that had the highest concentrationin the first sample collected were considered to follow the first-flush leaching pattern.
The CLT data are summarized in Table 4 in terms of peak con-centration, PVF to reach peak concentration, and type of leachingpattern. Ag reached a peak concentration after 2.7 pore volumes offlow on average, and Se, Cd, and Cr tended to reach peak concen-trations within the first two pore volumes of flow (average PVFs of1.1, 1.2, and 1.6, respectively).
Of the 60 elution curves that were obtained, 16 exhibited first-flush leaching and 15 exhibited lagged-response leaching. The re-maining elution curves did not follow either pattern, because toofew data points (none in some cases) were above detection limitsto define a leaching pattern (Table 4). Mixtures with inconclusive
0.0
0.5
1.0
1.5
2.0
2.5
3.0
0 5 10 15 20 25 30
LawsonMarkeyTheresa
Con
cent
ratio
n (µ
g/L)
0.1
1
10
100
0 5 10 15 20 25 30
Con
cent
ratio
n (µ
g/L)
0.0
0.2
0.4
0.6
0.8
1.0
1.2
0 5 10 15 20 25 30
Con
cent
ratio
n (µ
g/L)
Loss On Ignition (%)
1
10
100
0 5 10 15 20 25 30
Con
cent
ratio
n (µ
g/L)
Loss On Ignition (%)
(a) (b)
(c) (d)
Fig. 5. Relationship between loss on ignition of soil fraction and concentrations of (a) silver; (b) cadmium; (c) chromium; and (d) selenium fromwater leach tests
974 / JOURNAL OF GEOTECHNICAL AND GEOENVIRONMENTAL ENGINEERING © ASCE / AUGUST 2012
J. Geotech. Geoenviron. Eng. 2012.138:968-980.
Dow
nloa
ded
from
asc
elib
rary
.org
by
Wis
cons
in U
niv
Of
Mad
ison
on
08/1
7/12
. For
per
sona
l use
onl
y. N
o ot
her
uses
with
out p
erm
issi
on. C
opyr
ight
(c)
201
2. A
mer
ican
Soc
iety
of
Civ
il E
ngin
eers
. All
righ
ts r
eser
ved.

leaching patterns are considered to pose minimal impact to ground-water because the detection limits used were below the MCLs.
Leaching patterns observed from the CLTs are summarized inTable 5, with respect to soil, fly ash, and element. Each soil had acomparable number of cases with first-flush and lagged-responseleaching. Mixtures with Lawson clay had more cases (11) in whichthe elution pattern was inconclusive, which may reflect greater pro-pensity for sorption by the higher PI Lawson clay. Soils mixed withDewey fly ash and soils alone were equally likely to have first-flushor lagged-response leaching patterns. Mixtures containing King flyash typically showed first-flush leaching, whereas none of the mix-tures on Presque Isle fly ash exhibited a first-flush leaching pattern.Presque Isle has the lowest CaO content and King has the highestCaO content, which suggests that CaO content affects leachingbehavior.
Evaluation of leaching patterns by element indicates that Cd andCr typically follow a first-flush pattern (Table 5) when a pattern isdiscernible (three of four discernible cases for Cd, seven of eight forCr). Ag mostly exhibited a lagged-response leaching pattern (six ofseven discernible cases), and Se had a comparable number of first-flush and lagged-response patterns (Table 5). The pattern does notappear to be related to ionic form; both Cd and Cr primarily exhibit
a first-flush pattern even though Cd was likely present in cationicspecies and Cr in anionic species, and Se exhibited a lagged re-sponse pattern and was likely present in anionic species. Differen-ces in the solubility or location of the oxides containing theseelements probably had greater influence on the timing of theirrelease.
The first-flush and lagged-response leaching patterns are similarto those reported by others. Creek and Shackelford (1992) indicatethat first-flush patterns are typical of elements with higher chargedensity (including Cd and Cr), and Bin-Shafique et al. (2006) andMorar et al. (2008) report a first-flush pattern for leaching of Cd,Cr, Ag, and Se from soil-fly ash mixtures prepared with inorganicclays and sand. Edil et al. (1992) observed first-flush and lagged-response leaching patterns from CLTs conducted on fly ash aloneand fly ash-sand mixtures; the authors concluded that leachingbehavior is controlled by changes in solubility with changes inpH and alkalinity.
Soils versus Soil-Fly Ash Mixtures
Comparison of peak concentrations from the CLTs on soils andsoil-fly ash mixtures (Table 4) shows that the likely ionic form(cationic versus anionic) affects whether peak concentrations are
0.0
0.2
0.4
0.6
0.8
1.0
1.2
0 5 10 15 20
LawsonMarkeyTheresa
Con
cent
ratio
n (µ
g/L)
Plasticity Index
0.1
1
10
100
0 5 10 15 20
Con
cent
ratio
n (µ
g/L)
Plasticity Index
5
10
15
20
25
30
35
40
45
0 5 10 15 20
Con
cent
ratio
n (µ
g/L)
Plasticity Index
0.0
0.5
1.0
1.5
2.0
2.5
3.0
0 5 10 15 20
Con
cent
ratio
n (µ
g/L)
Plasticity Index
(a) (b)
(c) (d)
Fig. 6. Relationship between plasticity index of soil fraction and concentrations of (a) silver; (b) cadmium; (c) chromium; (d) selenium from waterleach tests
JOURNAL OF GEOTECHNICAL AND GEOENVIRONMENTAL ENGINEERING © ASCE / AUGUST 2012 / 975
J. Geotech. Geoenviron. Eng. 2012.138:968-980.
Dow
nloa
ded
from
asc
elib
rary
.org
by
Wis
cons
in U
niv
Of
Mad
ison
on
08/1
7/12
. For
per
sona
l use
onl
y. N
o ot
her
uses
with
out p
erm
issi
on. C
opyr
ight
(c)
201
2. A
mer
ican
Soc
iety
of
Civ
il E
ngin
eers
. All
righ
ts r
eser
ved.

higher from the soil alone or the soil-fly ash mixture. Cd and Ag,which are expected to be in cationic form and to have low solubilityat a higher pH, typically were eluted at a higher concentration fromthe soils alone (lower pH) than the soil-fly ash mixtures (higherpH). In, contrast, Cr and Se, which are expected to be oxyanionsand are soluble at an elevated pH, are eluted at higher concentra-tions from soil-fly ash mixtures than from soil alone in all but onecase (Lawson clay mixed with Dewey ash).
This behavior can be attributed primarily to the increase in pHincurred when fly ash is added to the soil. The ash may have alsoprovided additional sorption sites for Ag and Cd. The only excep-tions are Cd and Ag leached from some of the soil-fly ash mixturesprepared with Presque Isle ash, which had lower pH than the mix-tures prepared with other ashes (Table 3).
The mixtures with sand further illustrate the role of pH in theelution of trace elements likely to be in cationic and anionic forms.Leachate from the mixtures prepared with sand tended to have a pHthat was two or more pH units higher than mixtures prepared withthe organic soils (the mixtures with sand and Presque Isle ash wereexceptions). As shown in Table 4, Cd was not detected in the leach-ate from the sand-fly mixtures, and Cr and Se were eluted at con-siderably higher concentrations. The Ag data are an exception. Agconcentrations in leachate from the sand-fly ash mixtures are higherthan the soil-fly ash mixtures prepared with the Dewey and King flyashes. This may reflect the lower sorptive capacity of the sand par-ticles relative to the clay particles.
The elution curve in Fig. 8 illustrates this effect for Se elutionfrom Theresa clay, a Theresa clay-King ash mixture, and a sand-King ash mixture. Se concentrations are consistently highest fromthe sand-King ash blend and lowest from Theresa clay alone. Thefine organic soils have an important buffering effect, which reducesthe pH and concentration of the most prevalent trace elements, Crand Se.
Comparison of Water Leach Test and Column LeachTest Concentrations
Fig. 9 compares the peak concentrations from the CLTs with theconcentrations from the WLTs. The concentrations found in theleachate from the CLTs typically exceed the concentrations fromthe WLTs. The CLTs yield higher concentrations because of thelower L:S ratio in CLTs relative to WLTs (≈0:2 versus 20), as wellas a lower pH in the CLT.
Bin-Shafique et al. (2006) report that peak concentrations fromCLTs on soil-fly ash mixtures can be estimated conservatively bymultiplying WLTs by a scaling factor (50 for Cd and Ag, 10 for Crand Se) for mixtures of inorganic soils and fly ashes. These scalingfactors generally are conservative for Cd and Ag, as shown inFig. 9(a) (one point for Cd is an exception), but are not conservativefor Cr and Se. A scaling factor of 100∶1 is more appropriate for Crand Se for these mixtures of organic soil and HCFAs.
In general, the CLTs are the preferred method to assess leachingfrom soil-fly ash mixtures. The lower L∶S ratio and laminar flow ina CLT more closely resemble field conditions compared with theaggressive agitation and high L∶S ratio in WLT. Consequently, datafrom the CLTs are preferred over data from the WLTs when con-ducting environmental assessments.
Practical Implications for Groundwater Quality
The CLT concentrations represent concentrations reaching ground-water only if the groundwater table is in direct contact with the baseof a stabilized layer. In many roadways, the groundwater table isdeeper, and processes such as sorption, diffusion, dispersion, anddilution between the base of the pavement and the groundwatertable reduce concentrations.
Bin-Shafique et al. (2002) conducted a modeling study to sim-ulate leaching of contaminants from pavement layers constructedwith byproducts and transport to the groundwater table using a var-iably saturated model of flow and transport. The model was vali-dated using data from field lysimeter studies. Their findingsindicate that the maximum concentration decreases with increasingdepth to the groundwater table. In particular, the maximum concen-tration 1 m below the byproduct layer typically is 20% of the peakconcentration at the base of the byproduct layer and 10% of thepeak concentration when the groundwater is 5 m below the by-product layer.
Estimated concentrations at a groundwater table 1 and 5 m be-low the stabilized layer are shown in Table 6. These concentrationswere computed by applying 10 and 20% factors to the peak CLTconcentrations in Table 4. The concentrations at 1 and 5 m belowthe stabilized layer are typically below the MCLs. The exceptionsare the Cr concentrations for mixtures of Lawson clay with the lessalkaline Presque Isle fly ash (both depths), and Se concentrationsfor the King ash mixed with the Lawson and Theresa clays (1 mdepth). For these cases, a more detailed analysis could be con-ducted to obtain a more precise assessment of potential impactsto groundwater at a point of compliance. Methods to conduct suchanalyses are described in Li et al. (2007).
Summary and Conclusions
This study investigated leaching of Cd, Cr, Se, and Ag from softorganic soils stabilized with HCFAs using WLTs and CLTs. Testswere performed on three organic soils and three fly ashes. The soilsrepresent typical organic clays and peats in Wisconsin. The three
0
1000
2000
3000
4000
5000
6000
0 2 4 6 8 10 12 14
Effl
uent
Con
cent
ratio
n (µ
g/L)
Pore Volumes of Flow
ChromiumSand & 30% King Ash
Points on axisbelow detection limit
(a)
0
20
40
60
80
100
120
0 2 4 6 8 10
Effl
uent
Con
cent
ratio
n (µ
g/L)
Pore Volumes of Flow
SeleniumTheresa & 30% Presque Isle Ash
Points on axis are below detection limit
(b)
Fig. 7. Typical patterns observed in elution curves from column leachtests: (a) first-flush; (b) lagged response
976 / JOURNAL OF GEOTECHNICAL AND GEOENVIRONMENTAL ENGINEERING © ASCE / AUGUST 2012
J. Geotech. Geoenviron. Eng. 2012.138:968-980.
Dow
nloa
ded
from
asc
elib
rary
.org
by
Wis
cons
in U
niv
Of
Mad
ison
on
08/1
7/12
. For
per
sona
l use
onl
y. N
o ot
her
uses
with
out p
erm
issi
on. C
opyr
ight
(c)
201
2. A
mer
ican
Soc
iety
of
Civ
il E
ngin
eers
. All
righ
ts r
eser
ved.

Tab
le4.
Peak
EffluentC
oncentratio
nsof
Cadmium,C
hrom
ium,S
elenium,and
SilverforC
olum
nLeach
Tests,HydrogenIonConcentratio
natPeak
Concentratio
n,Num
bero
fPoreVolum
esof
Flow
toReach
the
Peak
Concentratio
n,andLeachingPattern
Soil
Flyash
Cadmium
Silver
Chrom
ium
Selenium
Peak
concentration
(μg∕
L)
Pore
volumes
offlow
topeak
Pattern
Peak
concentration
(μg∕
L)
Pore
volumes
offlow
topeak
Pattern
Peak
concentration
(μg∕
L)
Pore
volumes
offlow
topeak
Pattern
Peak
concentration
(μg∕
L)
Peak
volumes
offlow
topeak
Pattern
Law
son
None
0.42
0.20
First-flushpattern
3.2
0.9
Laggedresponse
pattern
<1:7
—Inconclusive
pattern
6.1
2.0
Inconclusive
pattern
Dew
ey<
0:40
—Inconclusive
pattern
2.4
0.1
Inconclusive
pattern
3.1
0.10
Inconclusive
pattern
6.1
0.3
Inconclusive
pattern
King
<0:40
—Inconclusive
pattern
<0:8
—Inconclusive
pattern
3.1
0.20
First-flushpattern
734
0.3
Laggedresponse
pattern
Presque
Isle
0.85
1.00
Inconclusive
pattern
61.7
1.4
Laggedresponse
pattern
660
4.10
Inconclusive
pattern
213
4.1
Inconclusive
pattern
Markey
None
4.00
0.23
First-flushpattern
1.7
3.2
Inconclusive
pattern
2.9
5.24
Inconclusive
pattern
67.2
4.0
Laggedresponse
pattern
Dew
ey0.66
1.40
Inconclusive
pattern
8.6
1.2
Laggedresponse
pattern
23.6
0.20
First-flushpattern
162
0.1
First-flushpattern
King
1.70
0.50
First-flushpattern
<0:8
—Inconclusive
pattern
3.2
0.50
First-flushpattern
135
1.2
Laggedresponse
pattern
Presque
Isle
<0:40
—Inconclusive
pattern
2.3
3.5
Inconclusive
pattern
<1:7
—Inconclusive
pattern
140
0.4
Laggedresponse
pattern
Theresa
None
29.20
1.30
Laggedrespon
se
pattern
17.7
0.1
First-flushpattern
3.1
7.40
Inconclusive
pattern
29.3
0.4
First-flushpattern
Dew
ey1.50
0.24
Inconclusive
pattern
7.1
4.4
Laggedresponse
pattern
123.0
0.24
First-flushpattern
81.1
0.53
Laggedresponse
pattern
King
0.41
4.30
Inconclusive
pattern
6.1
1.7
Inconclusive
pattern
470.0
0.40
First-flushpattern
836
0.4
First-flushpattern
Presque
Isle
<0:40
—Inconclusive
pattern
24.0
6.4
Laggedresponse
pattern
<1:7
—Inconclusive
pattern
113
1Laggedresponse
pattern
Sand
Dew
ey<
0:40
—Inconclusive
pattern
22.6
6.5
Laggedresponse
pattern
295.0
0.30
First-flushpattern
133
0.3
First-flushpattern
King
<0:40
—Inconclusive
pattern
2.4
3.9
Inconclusive
pattern
5,590.0
0.40
First-flushpattern
2,760
0.4
First-flushpattern
Presque
Isle
<0:40
—Inconclusive
pattern
3.0
1.2
Inconclusive
pattern
630.35
Laggedresponse
pattern
145
0.35
Laggedresponse
pattern
U.S.EPA
maxim
um
contam
inantlevels
5μg
∕L50
μg∕L
100μg
∕L50
μg∕L
Wisconsin
NR
538
25μg
∕L250μg
∕L500μg
∕L250μg
∕L
Note:
Concentratio
nsexceedingmaxim
umcontam
inantlevelsarein
bold
font.M
axim
umcontam
inantlevelsarebasedon
theU.S.E
PAstandardsor
Wisconsin
standardsifno
maxim
umcontam
inantlevelis
stipulated
bytheU.S.EPA
.
JOURNAL OF GEOTECHNICAL AND GEOENVIRONMENTAL ENGINEERING © ASCE / AUGUST 2012 / 977
J. Geotech. Geoenviron. Eng. 2012.138:968-980.
Dow
nloa
ded
from
asc
elib
rary
.org
by
Wis
cons
in U
niv
Of
Mad
ison
on
08/1
7/12
. For
per
sona
l use
onl
y. N
o ot
her
uses
with
out p
erm
issi
on. C
opyr
ight
(c)
201
2. A
mer
ican
Soc
iety
of
Civ
il E
ngin
eers
. All
righ
ts r
eser
ved.

fly ashes are representative of high carbon fly ashes in Wisconsin,with carbon contents greater than 6%.
The following conclusions were obtained from the study:• Concentrations of Ag, Cd, Cr, and Se from the WLTs on mix-
tures of organic soil and HCFAs tend to be very low (belowMCLs). In most (≥ 78%) cases, Cd and Ag are below commondetection limits. Cr and Se tend to have higher concentrations,but also are frequently (≥ 30% cases) below common detectionlimits.
• Leaching tests should be conducted on soil-fly ash mixtures toassess concentrations to be eluted from mixtures. Concentra-tions computed from dilution calculations, based on concentra-tions from tests on soil and fly ash alone, are unreliable andshould not be used.
• Leachate concentrations and pH from mixtures of organic soiland HCFAs are not sensitive to LOI or the PI of the organic soilor the fly ash content of the mixture. Leachate concentrationsappear to be controlled more by the characteristics of the ashand to a lesser extent by the properties of the organic soil.Fly ash content is not influential because of the relatively highfly ash dosages (20–40%) typically required to stabilize organ-ic soils.
• First-flush and lagged-response leaching patterns are equallycommon for mixtures of organic soil and HCFAs, althoughfirst-flush patterns are more common for mixtures prepared withfly ashes with a higher CaO content. Cd and Cr exhibit first-flush patterns more frequently, Ag exhibits lagged-responsepatterns more frequently, and Se exhibits both patterns withcomparable frequency. However, no pattern could be detectedin at least 50% of the cases because concentrations were belowMCLs and detection limits.
• pH has a strong effect on leachate concentrations. Ag and Cdtypically are cationic species that are less prevalent with an in-creasing pH, although Cd can form uncharged complexes abovepH 9.5. Cr and Se typically are oxyanion species that are pre-valent regardless of pH (Se) or increasingly prevalent with pH(Cr). Consequently, Ag and Cd can be eluted at higher concen-trations from soil alone relative to more alkaline soil-fly ashmixtures, whereas Cr and Se are eluted at higher concentrations
Table 5. Number of Occurrences of First-Flush, Lagged-Response, and Inconclusive Leaching Patterns from Column Leach Tests Based on Soil, Fly Ash,and Element
Leachingpattern
Soil Fly ash Element
Lawson Markey Theresa Sand Dewey King Presque Isle None Cadmium Chromium Selenium Silver
First-flush 2 5 5 4 5 7 0 4 3 7 5 1
Lagged-response 3 4 5 3 4 2 6 3 1 1 7 6
Inconclusive 11 7 6 5 7 7 10 5 11 7 3 8
0
500
1000
1500
2000
2500
3000
0 2 4 6 8 10 12 14
Sand & 30% King ashTheresa clay & 30% King ashTheresa clay
Se
Con
cent
ratio
n (µ
g/L)
Pore Volumes of Flow
Fig. 8. Selenium elution curves from column leach tests on Theresasoil, Theresa soil mixed with 30% King fly ash, and sand mixed with30% King fly ash
0.1
1
10
100
0.1 1 10 100
CdAg
CLT
Con
cent
ratio
n (µ
g/L)
WLT Concentration (µg/L)
1:1
50:1
(a)
100:1
1
10
100
1,000
10,000
1 10 100 1,000 10,000
CrSe
CLT
Con
cent
ratio
n (µ
g/L)
WLT Concentration (µg/L)
1:1
10:1
(b)
100:1
Fig. 9. Comparison of peak effluent concentrations of (a) cadmium andsilver and (b) chromium and selenium from the column leach tests andthe water leach tests concentration
978 / JOURNAL OF GEOTECHNICAL AND GEOENVIRONMENTAL ENGINEERING © ASCE / AUGUST 2012
J. Geotech. Geoenviron. Eng. 2012.138:968-980.
Dow
nloa
ded
from
asc
elib
rary
.org
by
Wis
cons
in U
niv
Of
Mad
ison
on
08/1
7/12
. For
per
sona
l use
onl
y. N
o ot
her
uses
with
out p
erm
issi
on. C
opyr
ight
(c)
201
2. A
mer
ican
Soc
iety
of
Civ
il E
ngin
eers
. All
righ
ts r
eser
ved.

from more alkaline soil-fly ash mixtures. The higher abundanceof Cr and Se in fly ash also contributes to the higher concen-trations observed in mixtures compared with soil alone.
• Concentrations from the CLTs typically are higher than concen-trations in leachate from theWLTs. The peak CLT concentrationfor Ag and Cd can be conservatively estimated as 50 times theWLT concentration. For Cr and Se, the peak CLT concentrationcan be conservatively estimated as 100 times the WLT concen-tration. This scale factor for Cr and Se is 10 times higher thanpreviously reported for inorganic soils stabilized with fly ash.
• Peak groundwater concentrations predicted by applying reduc-tion factors from transport analyses that account for dilution andattenuation in the vadose zone generally were below the MCLsprovided that the stabilized layer is at least 1 m above thegroundwater table. Exceptions exist for Cr and Se, whichmay require additional analysis.
Acknowledgments
The State of Wisconsin Solid Waste Research Program (SWRP),the Recycled Materials Resource Center (RMRC), and the U.S.National Science Foundation (Grant No. CMS-0343079) providedfinancial support for this study. Alliant Energy, Xcel Energy, andWe Energies provided the fly ashes used in the study. The findingsand opinions in this report are solely those of the authors. Endorse-ment by SWRP, RMRC, NSF or the fly ash suppliers is not impliedand should not be assumed.
References
American Coal Ash Association. (1999). Soil and pavement base stabili-zation with self-cementing coal fly ash, American Coal Ash Associa-tion, Alexandria, VA.
Benson, C., Edil, T., Lee, J., and Bradshaw, S. (2010). “Quantifyingthe benefits of using coal combustion products in sustainable construc-tion.” Rep. No. 1020552, Electric Power Research Institute, PaloAlto, CA.
Bin-Shafique, S., Benson, C., and Edil, T. (2002). “Leaching of heavymetals from fly ash stabilized soils used in highway pavements.”Geo Eng. Rep. No. 02-14, Dept. of Civil and Environmental Engineer-ing, Univ. of Wisconsin-Madison, Madison, WI.
Bin-Shafique, S., Benson, C., Edil, T., and Hwang, K. (2006). “Leachateconcentrations from water leach and column leach tests on fly-ash sta-bilized soil.” Environ. Eng. Sci., 23(1), 53–65.
Brookings, D. G. (1988). Eh-pH diagrams for geochemistry, Springer-Verlag, Berlin.
Clare, K., and Sherwood, P. (1954). “Effect of organic matter on setting ofsoil-cement mixtures.” J. Appl. Chem., 4(11), 625–630.
Clare, K., and Sherwood, P. (1956). “Further studies on the effect of organicmatter on setting of soil-cement mixtures.” J. Appl. Chem., 6(8),317–324.
Creek, D. N., and Shackelford, C. D. (1992). “Permeability and leachingcharacteristics of fly ash liner materials.” Transp. Res. Rec., 1345,74–83.
Edil, T. B., Acosta, H., and Benson, C. H. (2006). “Stabilizing soft fine-grained soils with fly ash.” J. Mater. Civ. Eng., 18(2), 283–294.
Edil, T. B., Benson, C. H., Bin Shafique, S., Tanyu, B. F., Kim, W. H., andSenol, A. (2002). “Field evaluation of construction alternatives forroadway over soft subgrade.” Geo Eng. Rep. No. 02-04, Dept. of Civiland Environmental Engineering, Univ. of Wisconsin-Madison,Madison, WI.
Edil, T. B., Sandstrom, L. K., and Berthouex, P. M. (1992). “Interaction ofinorganic leachate with compacted pozzolanic fly-ash.” J. Geotech.Eng., 118(9), 1410–1430.
Ferguson, G. (1993). “Use of self-cementing fly ashes as a soil stabilizationagent.” Fly ash for soil improvement, Geotechnical Special PublicationNo. 36, ASCE, New York, 1–14.T
able
6.Peak
Concentratio
nsObservedfrom
Colum
nLeach
TestsandEstim
ated
Concentratio
nsafter1and5m
ofMigratio
nfrom
aFly-Ash-Stabilized
SoilLayer
Based
onBin
Shafique
etal.(2002)
Soil
FlyAsh
Cadmium
Chrom
ium
Selenium
Silver
Peak
column
leachtest
Conc.
(μg∕
L)
Est.Conc.
at1m
(μg∕
L)
Est.Conc.
at5m
(μg∕
L)
Peak
column
leachtest
Conc.
(μg∕
L)
Est.Conc.
at1m
(μg∕
L)
Est.Conc.
at5m
(μg∕
L)
Peak
column
leachtest
Conc.
(μg∕
L)
Est.Conc.
at1m
(μg∕
L)
Est.Conc.
at5m
(μg∕
L)
Peak
column
leachtest
Conc.
(μg∕
L)
Est.Conc.
at1m
(μg∕
L)
Est.Conc.
at5m
(μg∕
L)
Law
son
Dew
ey<
0:40
——
3.1
0.6
0.3
6.1
1.2
0.60
2.4
0.5
0.2
King
<0 :40
——
3.1
0.6
0.3
734.0
146.8
73.40
<0:8
——
PresqueIsle
0.85
0.2
0.1
660.0
132.0
66.0
213.0
42.6
21.30
61.7
12.3
6.2
Markey
Dew
ey0.66
0.1
0.1
23.6
4.7
2.4
162.0
32.4
16.20
8.6
1.7
0.9
King
1.70
0.3
0.2
3.2
0.6
0.3
135.0
27.0
13.50
<0:8
——
PresqueIsle
<0:4
——
<1:7
——
140.0
28.0
14.00
2.3
0.5
0.2
Theresa
Dew
ey1.50
0.3
0.2
123.0
24.6
12.3
81.1
16.2
8.11
7.1
1.4
0.7
King
0.41
0.1
0.0
470.0
94.0
47.0
836.0
167.2
83.60
6.1
1.2
0.6
PresqueIsle
<0:40
——
<1:7
——
113.0
22.6
11.30
24.0
4.8
2.4
Maxim
umcontam
inantlevel
5μg
∕L50
μg∕L
100μg
∕L50
μg∕L
Note:Concentratio
nsexceedingmaxim
umcontam
inantlevelsarein
bold
font.W
isconsin
NR538lim
itsarethesameas
theU.S.E
PAmaxim
umcontam
inantlevelsford
rinkingwaterstandards.Wisconsin
limits
wereused
forsilver,becauseU.S.EPA
does
notlistamaxim
umcontam
inantlevelforsilver.
JOURNAL OF GEOTECHNICAL AND GEOENVIRONMENTAL ENGINEERING © ASCE / AUGUST 2012 / 979
J. Geotech. Geoenviron. Eng. 2012.138:968-980.
Dow
nloa
ded
from
asc
elib
rary
.org
by
Wis
cons
in U
niv
Of
Mad
ison
on
08/1
7/12
. For
per
sona
l use
onl
y. N
o ot
her
uses
with
out p
erm
issi
on. C
opyr
ight
(c)
201
2. A
mer
ican
Soc
iety
of
Civ
il E
ngin
eers
. All
righ
ts r
eser
ved.

Geological Survey of Japan. (2005). “Atlas of Eh-pH diagrams.” Open FileRep. No. 419, National Institute of Advance Industrial Science andTechnology, Tokyo.
Hampton, M. B., and Edil, T. B. (1998). “Strength gain of organic groundwith cement-type binders.” Soil improvement for big digs, GeotechnicalSpecial Publication No. 81, A. Maher, and D. Yang, eds., ASCE,New York, 135–148.
Hodges, W. K., and Keating, R. W. (1999). “Maryland power plant researchprogram promotes the beneficial use of coal combustion products.”Proc., 30th Int. Symp. on Use and Management of Coal CombustionProducts, Center for Applied Energy Research, Univ. of Kentucky,Lexington, KY, 78.1–78.10.
Kosson, D., Sanchez, F., Kariher, P., Turner, L., Delapp, R., and Seignette,P. (2009). “Characterization of coal combustion residues from electricutilities—leaching and characterization data.” Rep. EPA-600/R-09/151,Office of Research and Development, U.S. EPA, Research TrianglePark, NC.
Li, L., Benson, C., Edil, T., and Hatipoglu, B. (2007). “Groundwater im-pacts from coal ash in highways.” Water Resour. Manage., 159(4),151–163.
Morar, D., Aydilek, A. H., Seagren, E. A., and Demirkan, M. M. (2008).
“Release of inorganic and organic contaminants from fly ash amendedpermeable reactive barriers.” Envir. Geotech. Rep. 08-01, Dept. of Civiland Environmental Engineering, Univ. of Maryland-College Park,College Park, MD.
Smith, K. (2007). “Strategies to predict metal mobility in surficial miningenvironments.” Understanding and responding to hazardous substan-ces at mine sites in the western United States, J. V. DeGraff, ed.,The Geological Society of America, 25–46.
Sridharan, A., Prashanth, J. P., and Sivapullaiah, P. V. (1997). “Effect of flyash on the unconfined compressive strength of black cotton soil.”Ground Improv., 1(3), 169–175.
Stumm, W., and Morgan, J. J. (1996). Aquatic chemistry, Wiley, New York.Tastan, E. O., Edil, T. B., Benson, C. H., and Aydilek, A. H. (2011).
“Stabilization of organic soils with fly ash.” J. Geotech. Geoenviron.Eng., 137(9), 819–833.
Tremblay, H., Duchesne, J., Locat, J., and Lerouil, S. (2002). “Influence ofthe nature of organic compounds on fine soil stabilization with cement.”Can. Geotech. J., 39(3), 535–546.
Wehrer, M., and Totsche, K. U. (2008). “Effective rates of heavy metalrelease from alkaline wastes—Quantified by column outflow experi-ments and inverse simulations.” J. Contam. Hydrol., 101(1–4), 53–66.
980 / JOURNAL OF GEOTECHNICAL AND GEOENVIRONMENTAL ENGINEERING © ASCE / AUGUST 2012
J. Geotech. Geoenviron. Eng. 2012.138:968-980.
Dow
nloa
ded
from
asc
elib
rary
.org
by
Wis
cons
in U
niv
Of
Mad
ison
on
08/1
7/12
. For
per
sona
l use
onl
y. N
o ot
her
uses
with
out p
erm
issi
on. C
opyr
ight
(c)
201
2. A
mer
ican
Soc
iety
of
Civ
il E
ngin
eers
. All
righ
ts r
eser
ved.