alternative tests for durability of cement stabilized … tests for... · alternative tests for...
TRANSCRIPT
LTRCLTRCLouisiana Transportation Research Center
Alternative Tests for Durability of Cement
Stabilized Low Plasticity Soils
Presentation to Louisiana Engineering Conference
February 2007
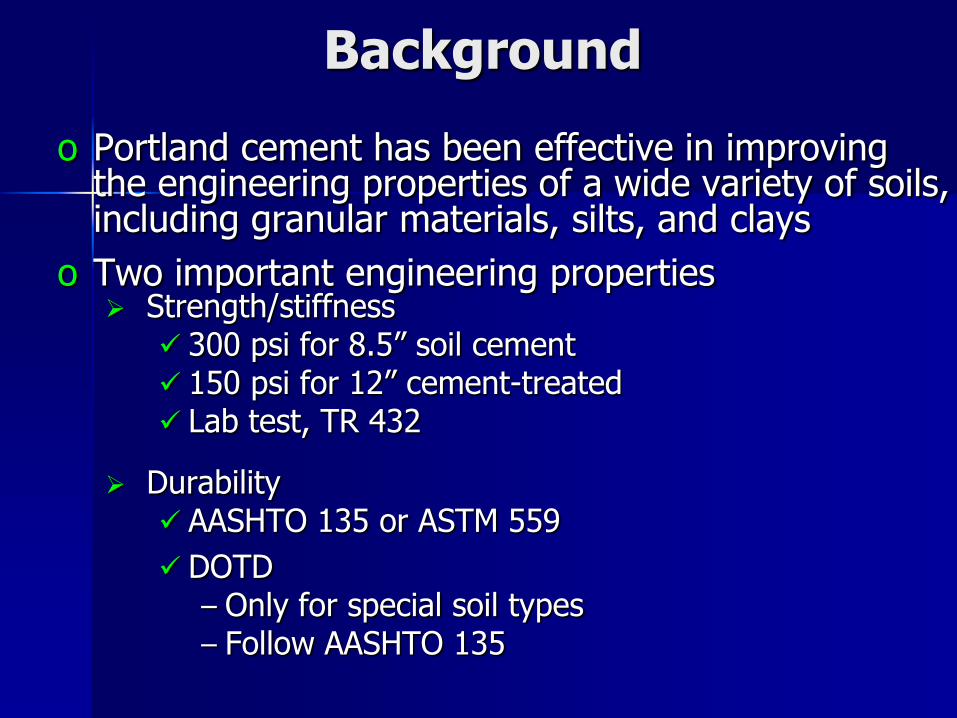
Background
o Portland cement has been effective in improving the engineering properties of a wide variety of soils, including granular materials, silts, and clays
o Two important engineering properties Strength/stiffness
300 psi for 8.5” soil cement 150 psi for 12” cement-treated Lab test, TR 432
Durability AASHTO 135 or ASTM 559
DOTD– Only for special soil types– Follow AASHTO 135
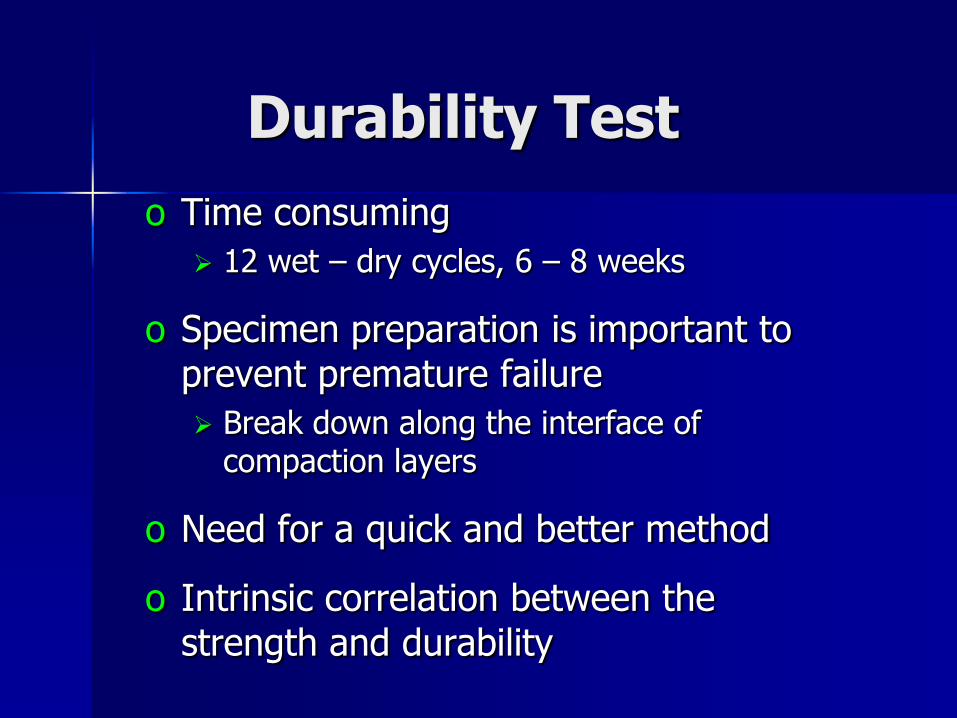
Durability Test
o Time consuming
12 wet – dry cycles, 6 – 8 weeks
o Specimen preparation is important to prevent premature failure
Break down along the interface of compaction layers
o Need for a quick and better method
o Intrinsic correlation between the strength and durability

Strength vs. Durability(from Portland Cement Association)
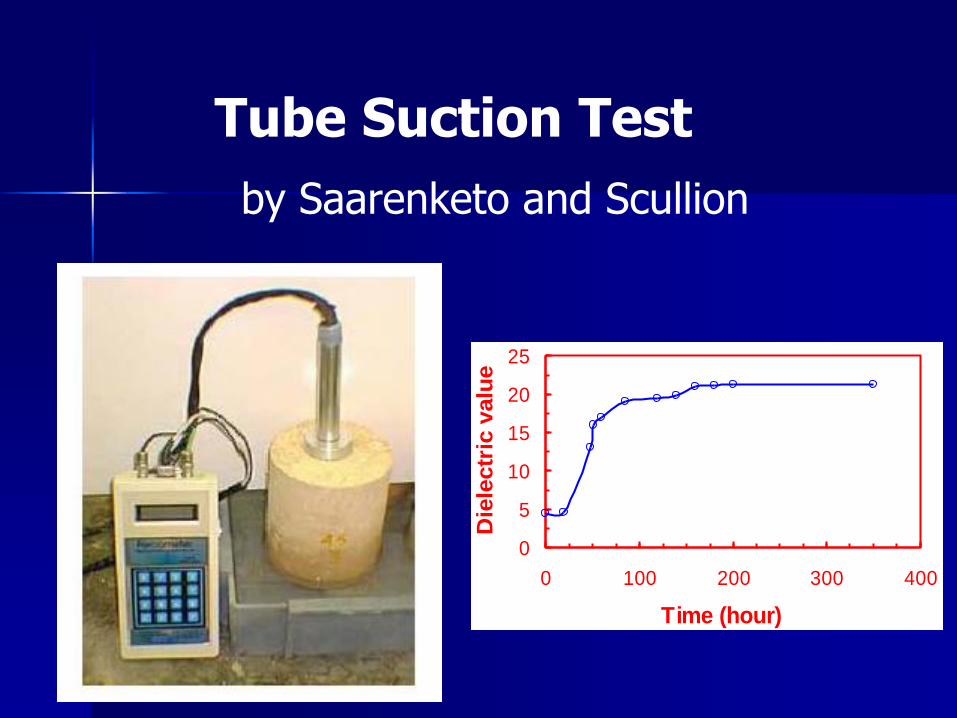
Tube Suction Test
by Saarenketo and Scullion
0
5
10
15
20
25
0 100 200 300 400
Time (hour)
Die
lectr
ic v
alu
e
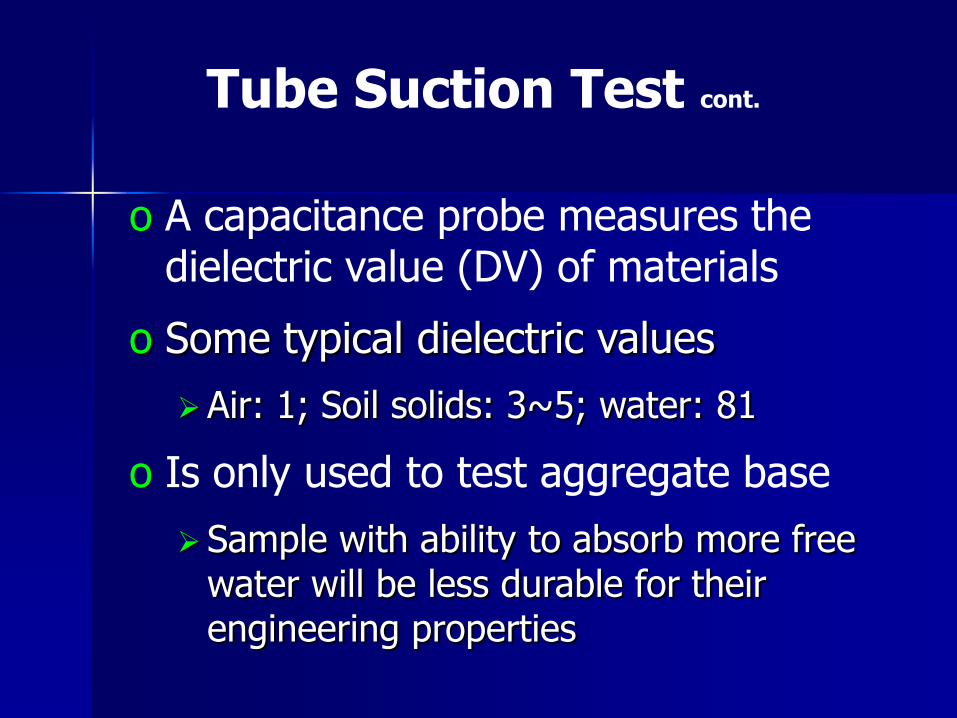
Tube Suction Test cont.
o A capacitance probe measures the dielectric value (DV) of materials
o Some typical dielectric values
Air: 1; Soil solids: 3~5; water: 81
o Is only used to test aggregate base
Sample with ability to absorb more free water will be less durable for their engineering properties

Tube Suction Test cont.
o Good: maximum DV less than 10
o Marginal: maximum DV ranging from 10 to 16
o Poor: maximum DV larger than 16
o Short test period: less than 2 weeks
Base Aggregate
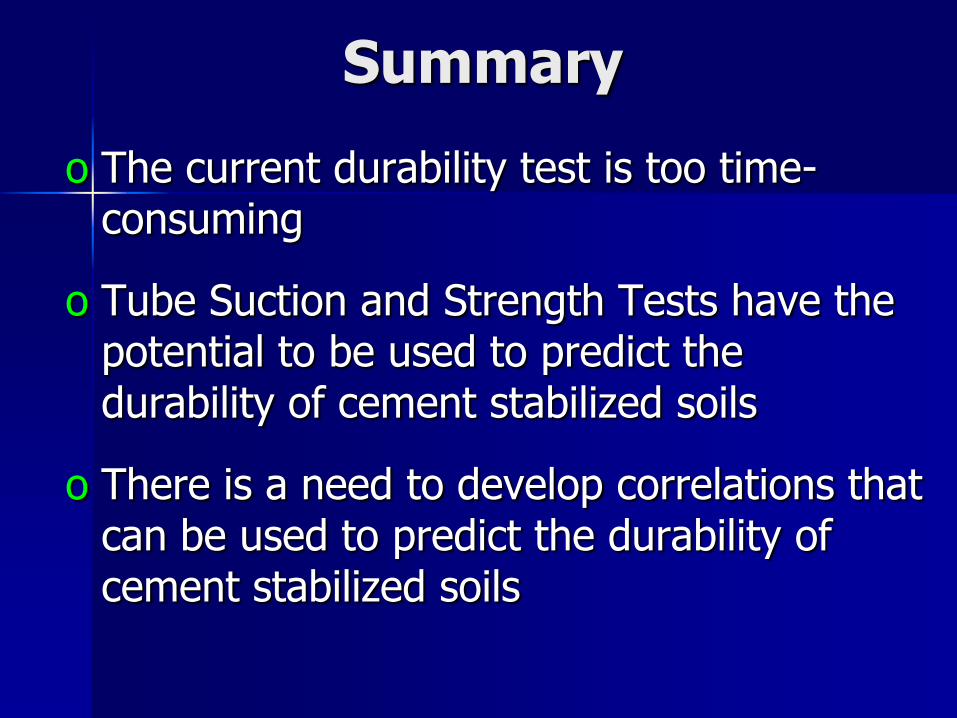
Summary
o The current durability test is too time-consuming
o Tube Suction and Strength Tests have the potential to be used to predict the durability of cement stabilized soils
o There is a need to develop correlations that can be used to predict the durability of cement stabilized soils
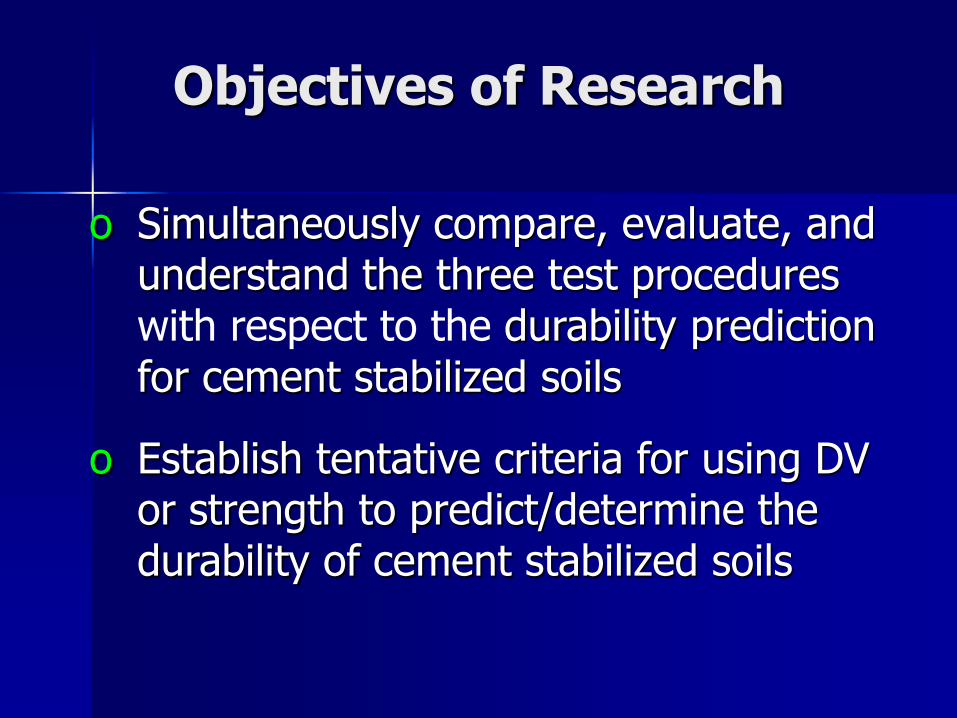
Objectives of Research
o Simultaneously compare, evaluate, and understand the three test procedureswith respect to the durability prediction for cement stabilized soils
o Establish tentative criteria for using DV or strength to predict/determine the durability of cement stabilized soils
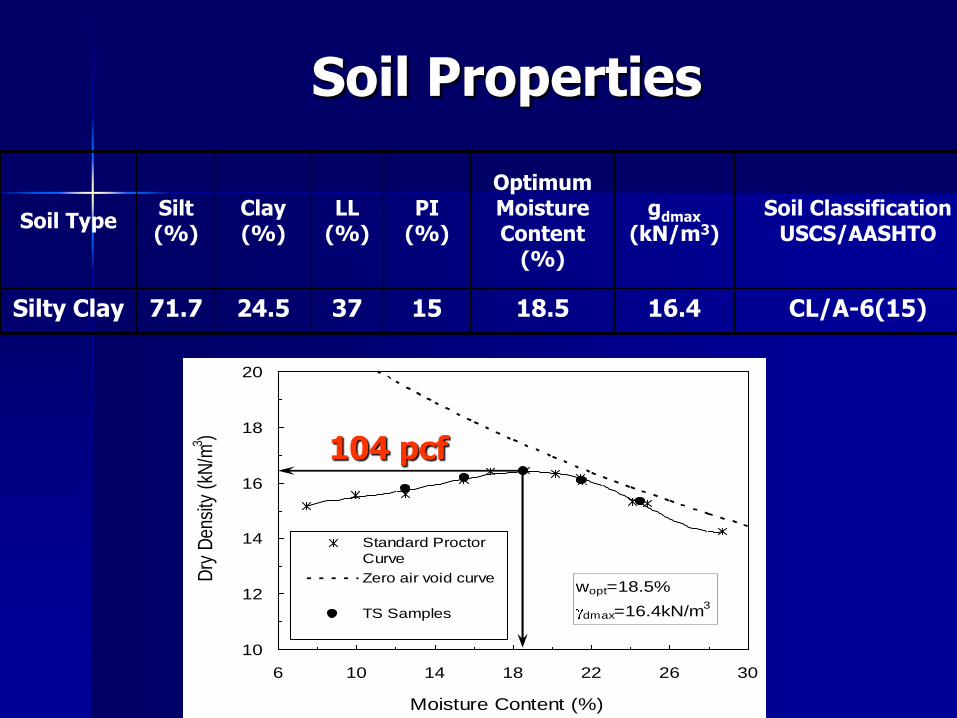
Soil Properties
10
12
14
16
18
20
6 10 14 18 22 26 30
Moisture Content (%)
Dry
Den
sity
(kN
/m3 )
Standard Proctor
Curve
Zero air void curve
TS Samples
wopt=18.5%
dmax=16.4kN/m3
Soil TypeSilt (%)
Clay (%)
LL (%)
PI (%)
Optimum Moisture Content
(%)
gdmax
(kN/m3)Soil Classification
USCS/AASHTO
Silty Clay 71.7 24.5 37 15 18.5 16.4 CL/A-6(15)
104 pcf

Planned Test Factorial
Molding moisture content
Cement content
(%)
Dry unit weight
(kN/m3/pcf)Planned tests
15.5%2.54.56.5 8.5
10.512.5
16.4/104Wetting-drying
durability
Tube suction
7-day UCS
18.5% 16.4/104
21.5% 16.4/104
24.5% 15.5/98.3

Tube Suction Test
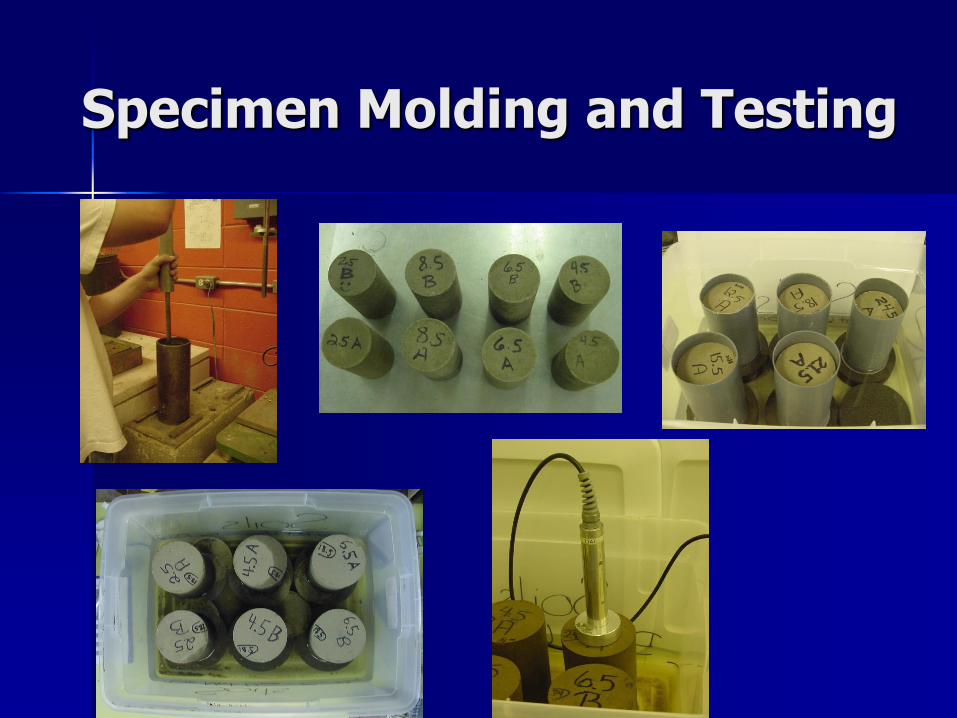
Specimen Molding and Testing
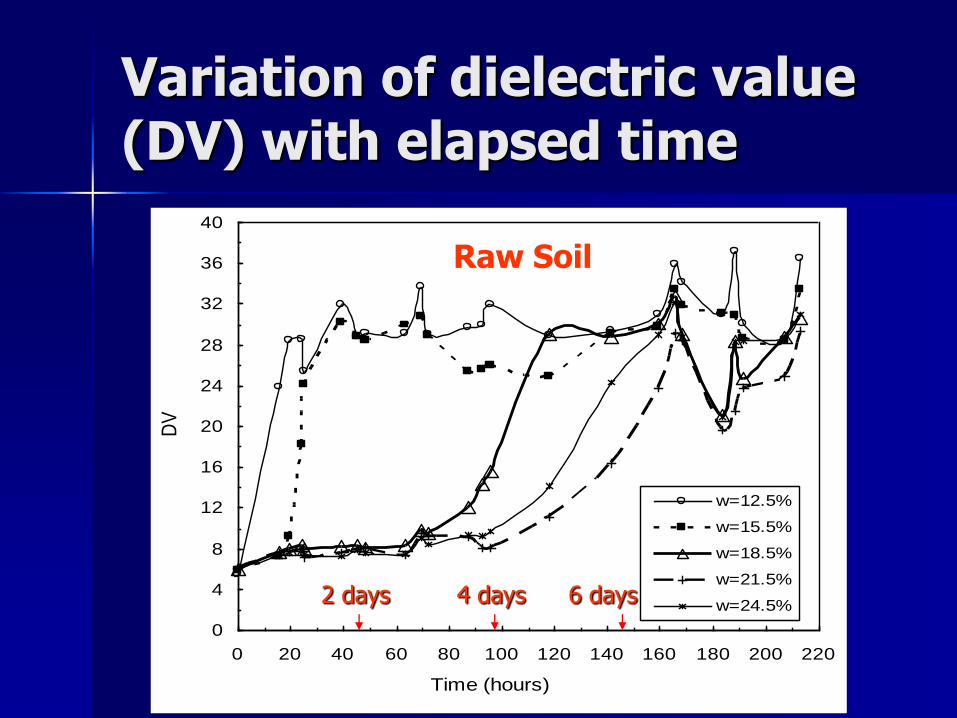
Variation of dielectric value (DV) with elapsed time
0
4
8
12
16
20
24
28
32
36
40
0 20 40 60 80 100 120 140 160 180 200 220
Time (hours)
DV
w=12.5%
w=15.5%
w=18.5%
w=21.5%
w=24.5%
Raw Soil
2 days 4 days 6 days

0 50 100 150 200Time (hour)
0
4
8
12
16
20
24
28
32
36
Die
lect
ric
Va
lue
Legend: wm = molding water content
2.5% cement
4.5% cement
6.5% cement
8.5% cement
10.5% cement
12.5% cement
0 50 100 150 200Time (hour)
0
4
8
12
16
20
24
28
32
36
Die
lect
ric
Va
lue
0 50 100 150 200Time (hour)
0
4
8
12
16
20
24
28
32
36
Die
lect
ric
Va
lue
0 50 100 150 200Time (hour)
0
4
8
12
16
20
24
28
32
36
Die
lect
ric
Va
lue
(a) wm=15.5% (b) wm=18.5%
(c) wm=21.5% (d) wm=24.5%
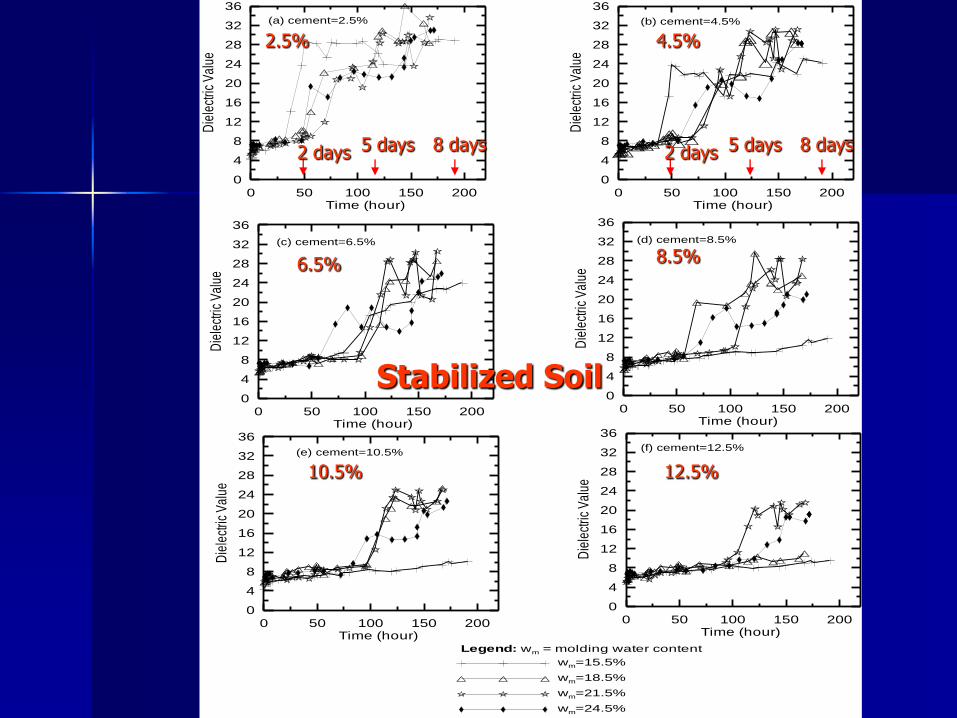
Stabilized Soil
2 days 5 days2 days2 days 8 days 2 days 8 days5 days
15.5%18.5%
21.5% 24.5%
0 50 100 150 200Time (hour)
0
4
8
12
16
20
24
28
32
36
Die
lect
ric V
alue
Legend: wm = molding water content
wm=15.5%
wm=18.5%
wm=21.5%
wm=24.5%
0 50 100 150 200Time (hour)
0
4
8
12
16
20
24
28
32
36
Die
lect
ric V
alue
0 50 100 150 200Time (hour)
0
4
8
12
16
20
24
28
32
36D
iele
ctric
Val
ue
0 50 100 150 200Time (hour)
0
4
8
12
16
20
24
28
32
36
Die
lect
ric V
alue
(a) cement=2.5% (b) cement=4.5%
(c) cement=6.5% (d) cement=8.5%
0 50 100 150 200Time (hour)
0
4
8
12
16
20
24
28
32
36
Die
lect
ric V
alue
0 50 100 150 200Time (hour)
0
4
8
12
16
20
24
28
32
36
Die
lect
ric V
alue
(e) cement=10.5%(f) cement=12.5%
Stabilized Soil
2 days 8 days5 days 2 days 8 days5 days
2.5% 4.5%
6.5% 8.5%
10.5% 12.5%

Influence Factors on Max DV
0
5
10
15
20
25
30
35
40
0 2 4 6 8 10 12 14
Cement, %
Max D
V
15.5% moisture
18.5% moisture
21.5% moisture
24.5% moisture

Observation
o Both molding moisture content and cement content affect the specimen’s ability to absorb free water
o Increase of cement usage delayed moisture intrusion and reduced free moisture in cement stabilized soils
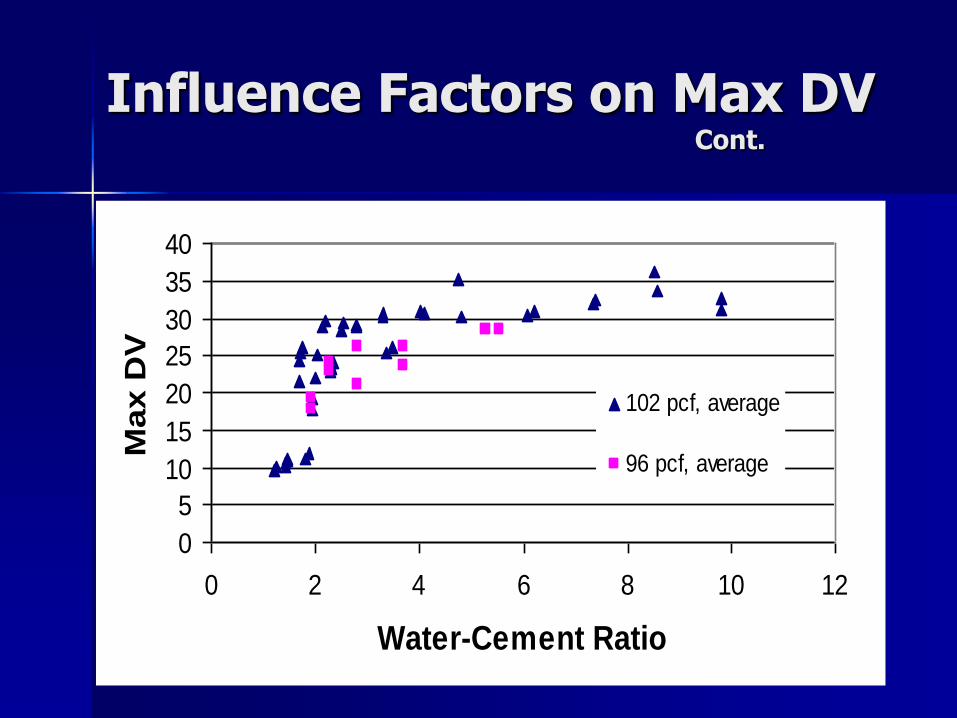
Influence Factors on Max DVCont.
0
5
10
15
20
25
30
35
40
0 2 4 6 8 10 12
Water-Cement Ratio
Max D
V
102 pcf, average
96 pcf, average

Influence Factors on TS UCS
0
100
200
300
400
500
600
0 2 4 6 8 10 12 14
Cement, %
TS
UC
S, p
si
15.5% moisture
18.5% moisture
21.5% moisture
24.5% moisture
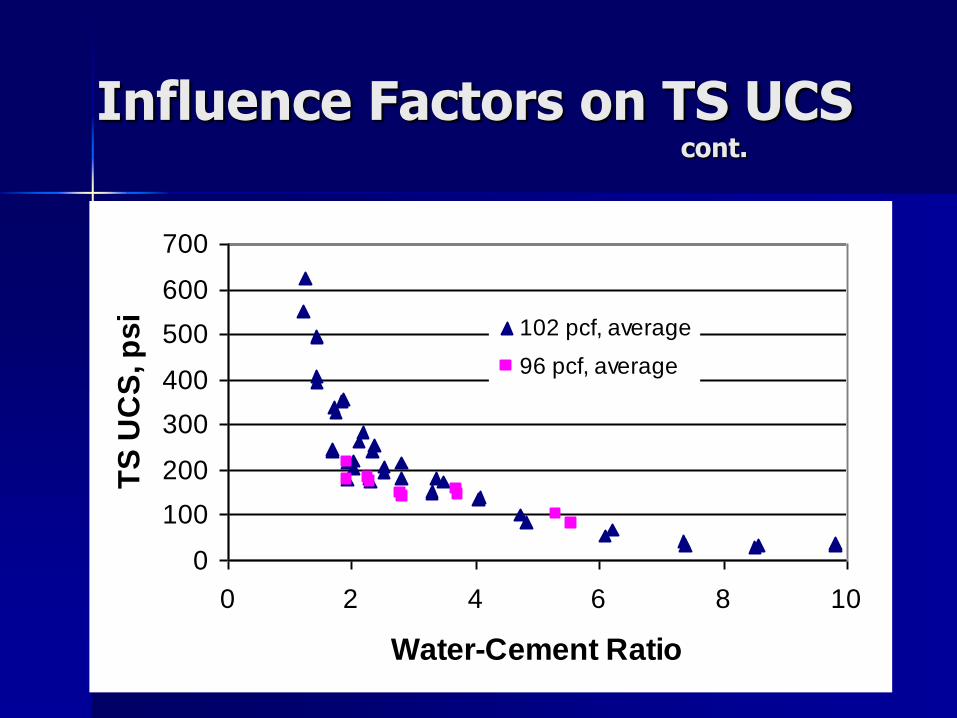
Influence Factors on TS UCS cont.
0
100
200
300
400
500
600
700
0 2 4 6 8 10
Water-Cement Ratio
TS
UC
S, p
si
102 pcf, average
96 pcf, average
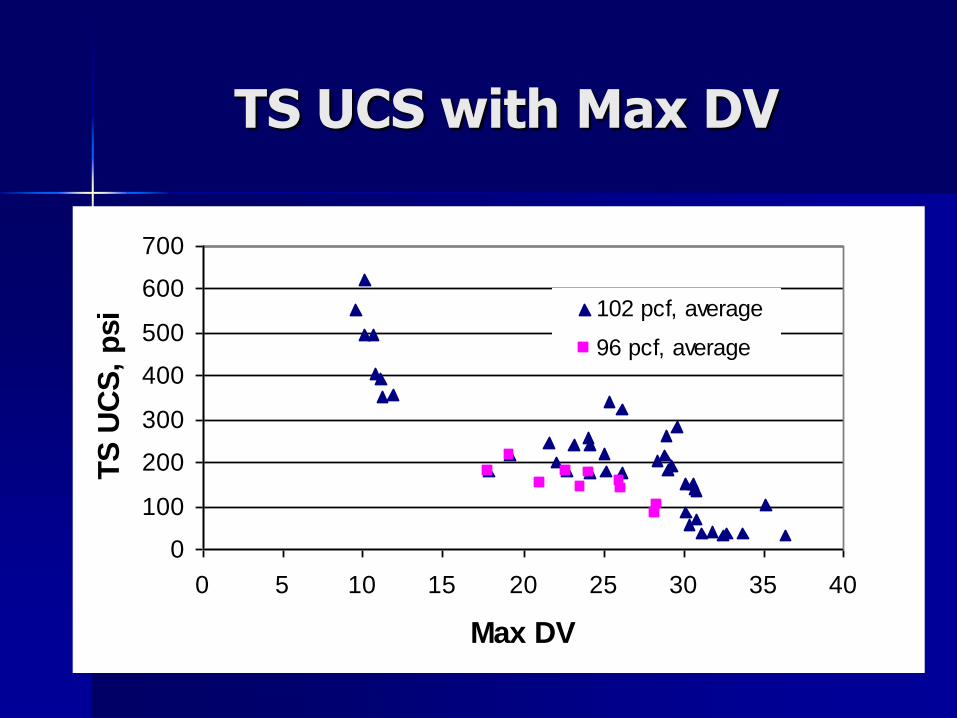
TS UCS with Max DV
0
100
200
300
400
500
600
700
0 5 10 15 20 25 30 35 40
Max DV
TS
UC
S,
psi 102 pcf, average
96 pcf, average

Seven (7) Day UCS
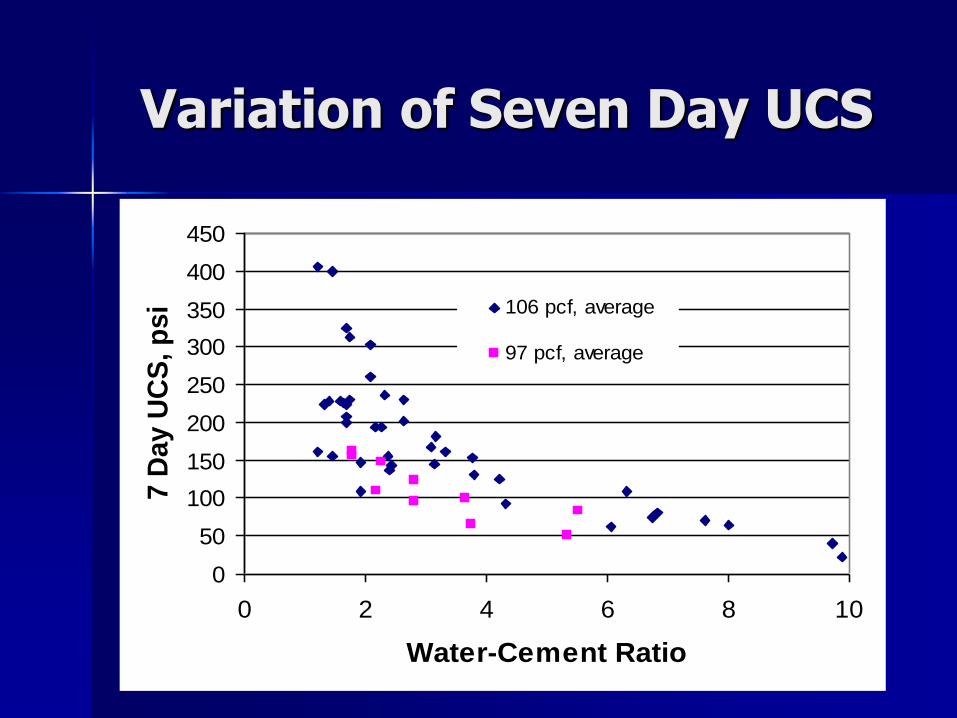
Variation of Seven Day UCS
0
50
100
150
200
250
300
350
400
450
0 2 4 6 8 10
Water-Cement Ratio
7 D
ay U
CS
, p
si 106 pcf, average
97 pcf, average
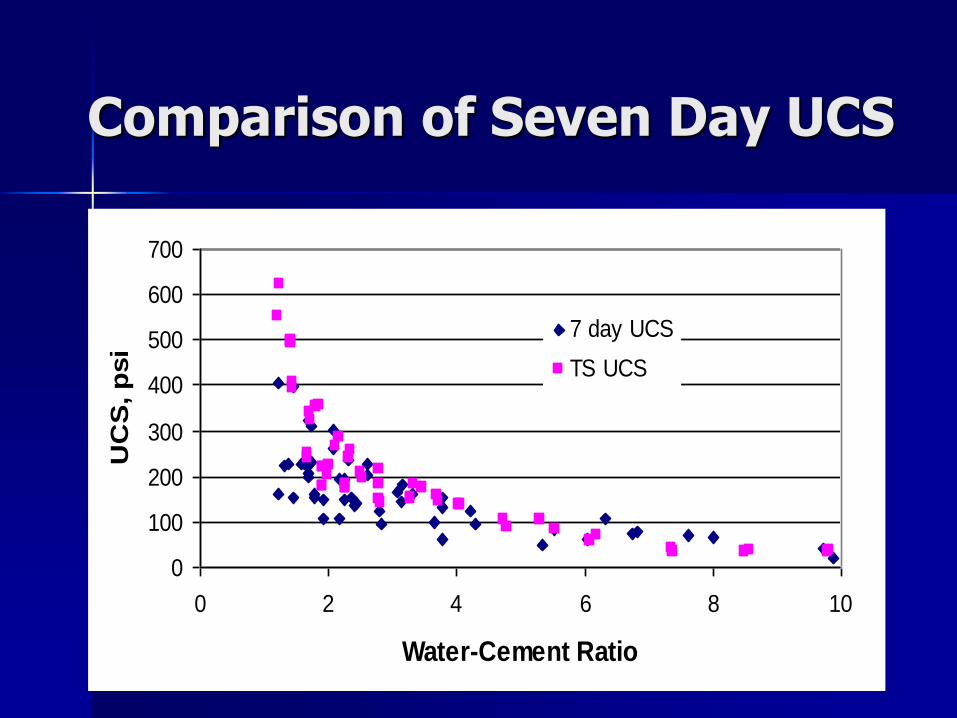
Comparison of Seven Day UCS
0
100
200
300
400
500
600
700
0 2 4 6 8 10
Water-Cement Ratio
UC
S, p
si
7 day UCS
TS UCS

Durability Test

Variation of Soil Cement Loss
0
5
10
15
20
25
30
35
40
45
0 2 4 6 8 10 12 14
Cement Content, %
So
il C
em
en
t L
os
s, % 15.5%, average
18.5%, average
21.5%, average
24.5%, average
A-6, 7%

Observation
o Soil cement loss is well correlated with cement content, but its strength and Max DV is not
o Soil cement loss is not a good indicator for the variation of strength and ability to absorb free water
o Is soil cement loss the best indicator for the durability of cement stabilized soils ?

Durability Prediction
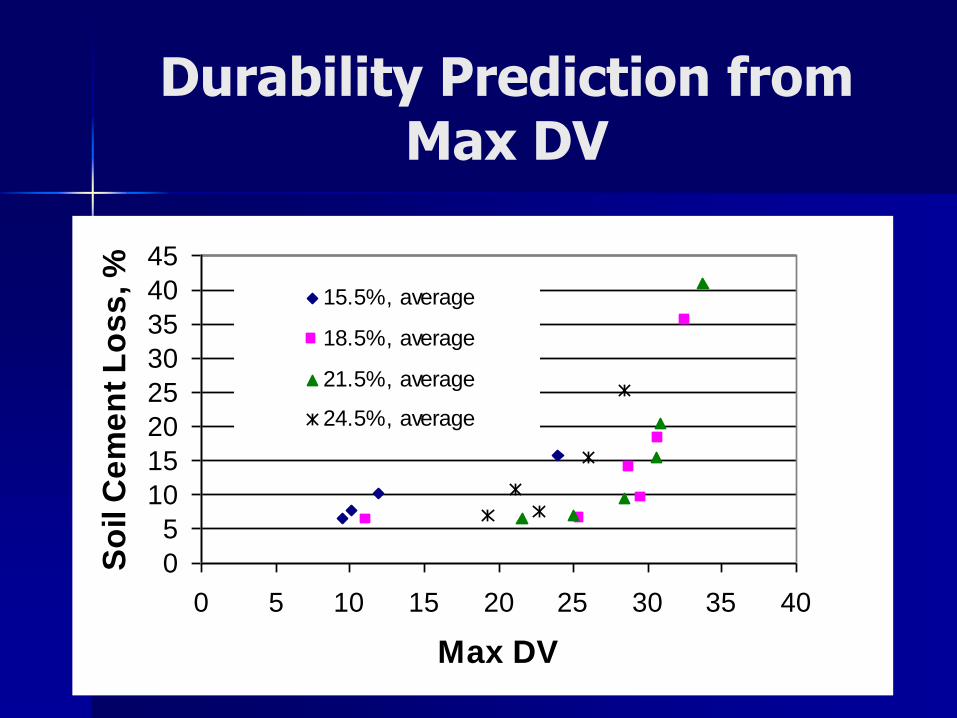
Durability Prediction from Max DV
0
5
10
15
20
25
30
35
40
45
0 5 10 15 20 25 30 35 40
Max DV
So
il C
em
en
t L
os
s, %
15.5%, average
18.5%, average
21.5%, average
24.5%, average

Durability Prediction from Max DV cont.
y = 0.1287x + 3.1743
R2 = 0.9441
0
5
10
15
20
25
30
35
40
45
50
0 50 100 150 200 250 300 350
Maximum DV * Water Cement Ratio
So
il ce
me
nt lo
ss (
%) testing data
95% low er
95% upper
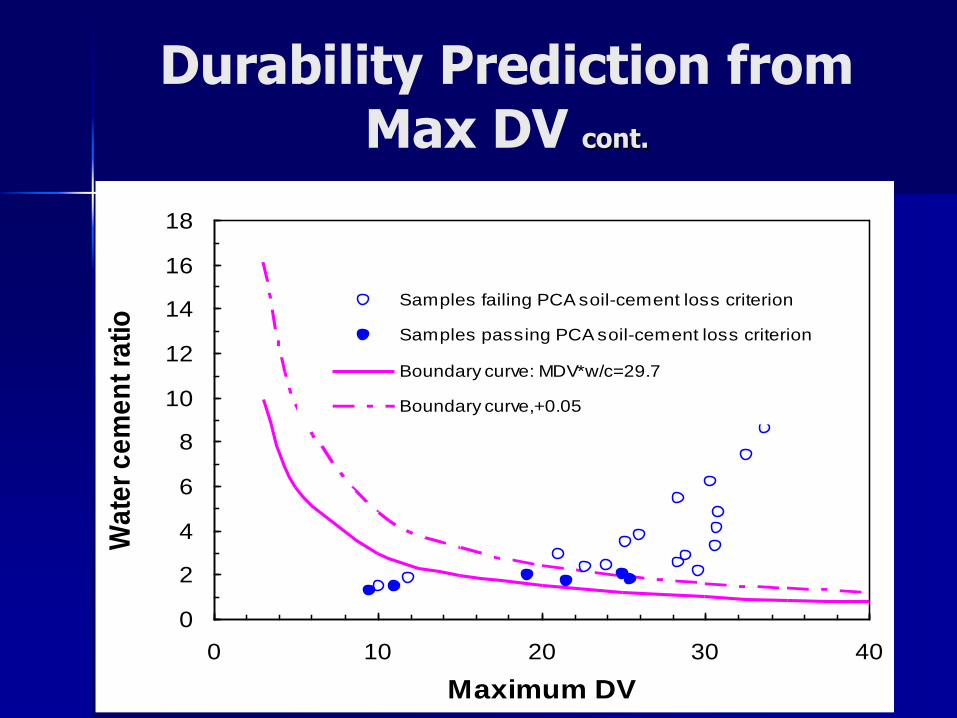
Durability Prediction from Max DV cont.
0
2
4
6
8
10
12
14
16
18
0 10 20 30 40
Maximum DV
Wa
ter
ce
me
nt
rati
o
Samples failing PCA soil-cement loss criterion
Samples passing PCA soil-cement loss criterion
Boundary curve: MDV*w/c=29.7
Boundary curve,+0.05
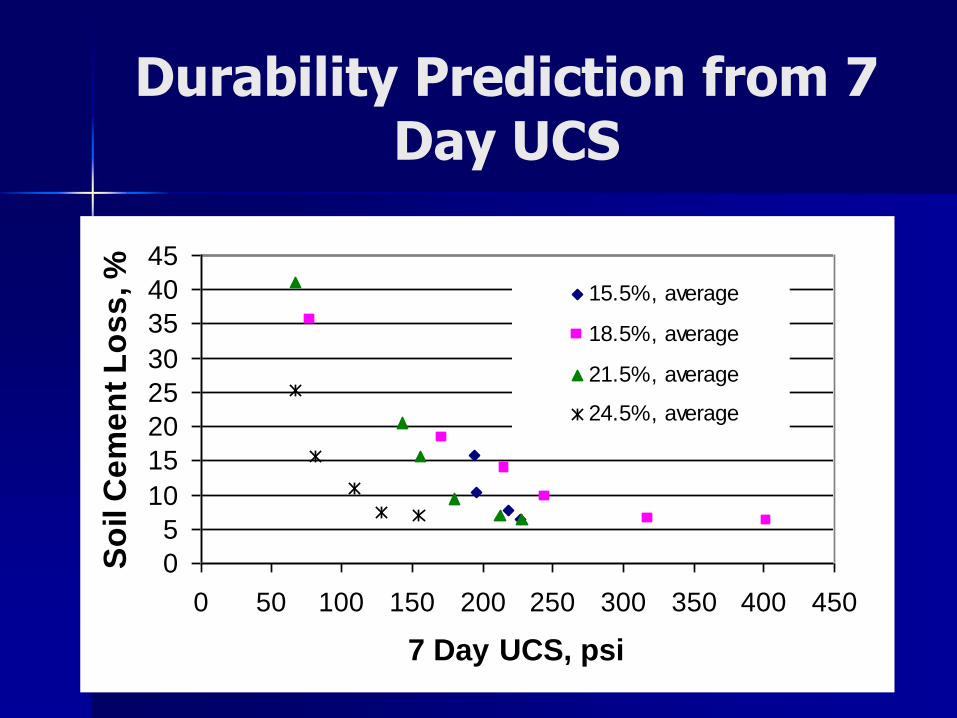
Durability Prediction from 7 Day UCS
0
5
10
15
20
25
30
35
40
45
0 50 100 150 200 250 300 350 400 450
7 Day UCS, psi
So
il C
em
en
t L
os
s, %
15.5%, average
18.5%, average
21.5%, average
24.5%, average
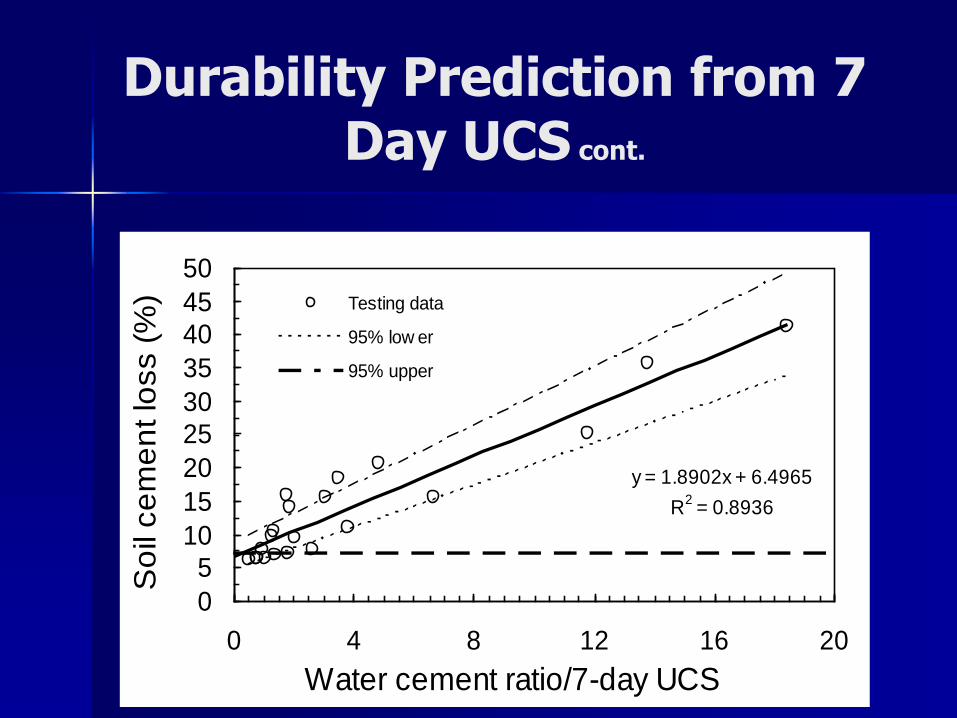
Durability Prediction from 7 Day UCS cont.
y = 1.8902x + 6.4965
R2 = 0.8936
0
5
10
15
20
25
30
35
40
45
50
0 4 8 12 16 20
Water cement ratio/7-day UCS
So
il ce
me
nt lo
ss (
%) Testing data
95% low er
95% upper
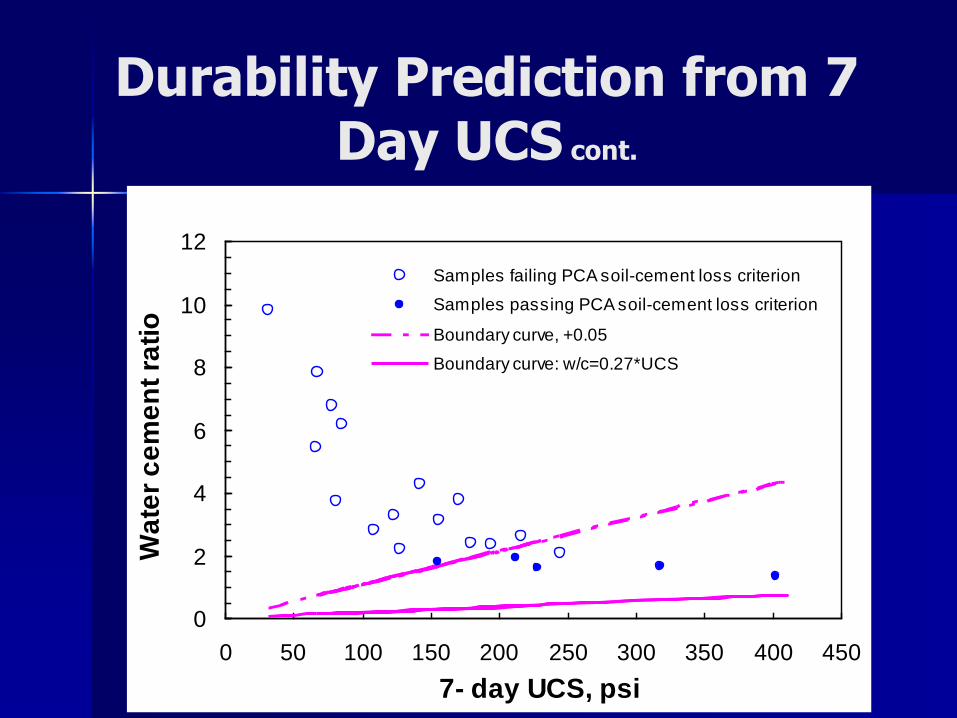
Durability Prediction from 7 Day UCS cont.
0
2
4
6
8
10
12
0 50 100 150 200 250 300 350 400 450
7- day UCS, psi
Wa
ter
ce
me
nt
rati
o
Samples failing PCA soil-cement loss criterion
Samples passing PCA soil-cement loss criterion
Boundary curve, +0.05
Boundary curve: w/c=0.27*UCS

Conclusion
o Good correlations exist among the maximum DV, 7-day UCS, and soil-cement mass loss.
o Therefore, the water susceptibility for cement stabilized soils can be evaluated and predicted by these methods
Tube Suction
7-day UCS
Durability test
Conclusion - cont.
o The water-cement ratio of cement-stabilized soil had a significant influence on the maximum DV and 7-day UCS
o The dry unit weight of cement-stabilized soil could cause variations in the maximum DV and 7-day UCS
Recommendation
Since primarily CL material was used, additional soil types should be tested to improve these charts for future use in design and construction

Question ?