trab/2ftrab/2o a normal breast epithelium supplemental figure 1 iii iii iv 105 84 50 35 29 18...
TRANSCRIPT

TRAB/2F TRAB/2O
A Normal Breast EpitheliumSupplemental Figure 1
i ii
iii iv
10584
503529
18
TRAB/2F TRAB/2O
+ - + - GFs
BM.W.
None=0 <1% =1 1-10% =2
10-33% =3 66-100% =533-66% =4
Negative=0 Low=1
Medium=2 High=3
Frequency of Elafin-Positive Cells
Staining Intensity of Elafin-Positive Cells
C
D
B
Ba
sal-l
ike
HE
R2
+
Lu
min
al A
Lu
min
al B
No
rma
l
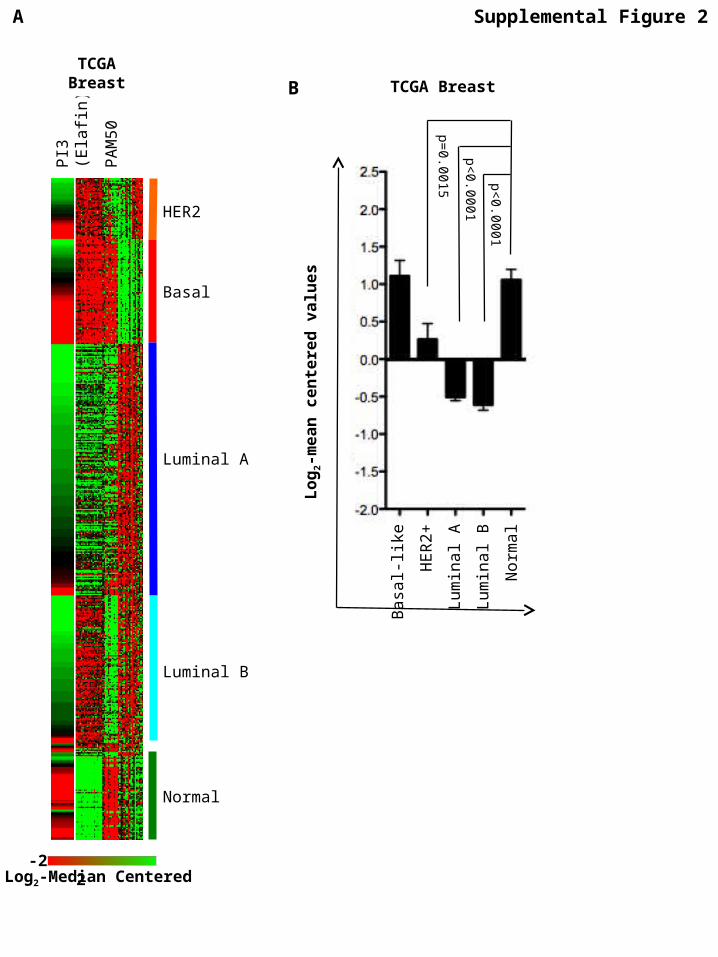
TCGA Breast
p=0.0015
p<0.0001
p<0.0001
Lo
g2-
me
an
ce
nte
red
va
lue
s
PA
M5
0
Normal
Luminal B
Luminal A
Basal
HER2
PI3
(E
lafin
)TCGA Breast
Supplemental Figure 2A
-2 2Log2-Median Centered
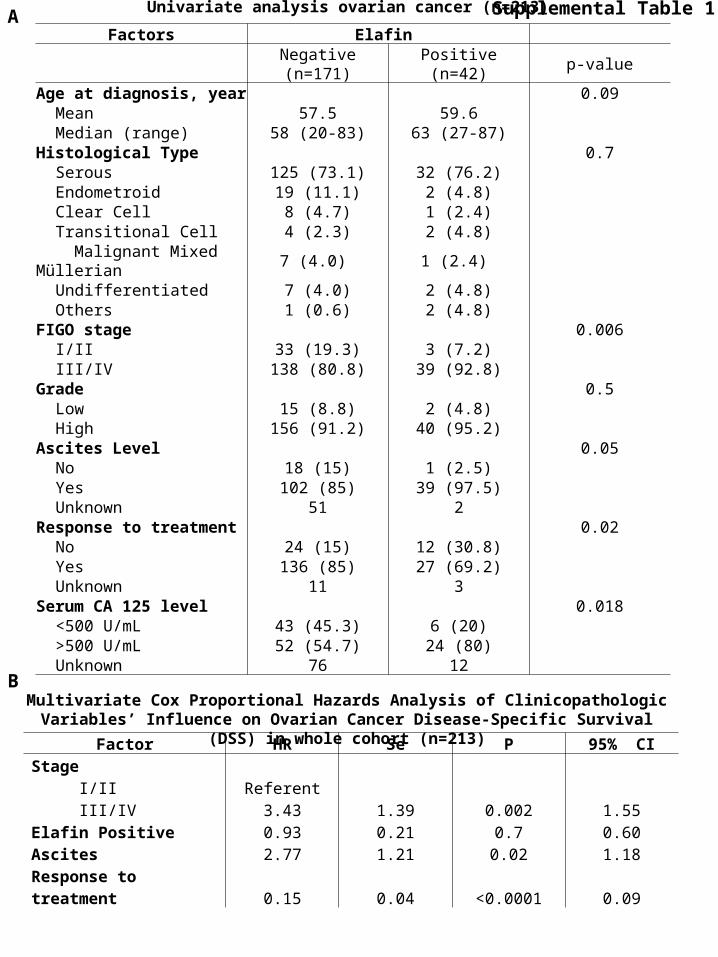
Factors Elafin Negative (n=171) Positive (n=42) p-valueAge at diagnosis, year 0.09
Mean 57.5 59.6Median (range) 58 (20-83) 63 (27-87)
Histological Type 0.7Serous 125 (73.1) 32 (76.2)Endometroid 19 (11.1) 2 (4.8)Clear Cell 8 (4.7) 1 (2.4)Transitional Cell 4 (2.3) 2 (4.8)
Malignant Mixed Müllerian
7 (4.0) 1 (2.4)
Undifferentiated 7 (4.0) 2 (4.8)Others 1 (0.6) 2 (4.8)
FIGO stage 0.006I/II 33 (19.3) 3 (7.2)III/IV 138 (80.8) 39 (92.8)
Grade 0.5Low 15 (8.8) 2 (4.8)High 156 (91.2) 40 (95.2)
Ascites Level 0.05No 18 (15) 1 (2.5)Yes 102 (85) 39 (97.5)Unknown 51 2
Response to treatment 0.02No 24 (15) 12 (30.8)Yes 136 (85) 27 (69.2)Unknown 11 3
Serum CA 125 level 0.018<500 U/mL 43 (45.3) 6 (20)>500 U/mL 52 (54.7) 24 (80)Unknown 76 12
Univariate analysis ovarian cancer (n=213) Supplemental Table 1
Factor HR Se P 95% CIStage
I/II ReferentIII/IV 3.43 1.39 0.002 1.55
Elafin Positive 0.93 0.21 0.7 0.60Ascites 2.77 1.21 0.02 1.18Response to treatment 0.15 0.04 <0.0001 0.09
Multivariate Cox Proportional Hazards Analysis of Clinicopathologic Variables’ Influence on Ovarian Cancer Disease-Specific Survival (DSS) in whole cohort (n=213)
A
B