tox-42: 1,3-diphenylguanidine (casrn 102-06-7)
TRANSCRIPT

National Toxicology Program Toxicity Report Series
Number 42
NTP Technical Report on Toxicity Studies of
1,3-Diphenylguanidine (CAS No. 102-06-7)
Administered in Feed to F344/N Rats and B6C3F Mice1
Richard D. Irwin, Ph.D., Study Scientist National Toxicology Program
Post Office Box 12233 Research Triangle Park, NC 27709
NIH Publication 95-3933 September 1995
United States Department of Health and Human Services Public Health Service
National Institutes of Health

Note to the Reader
The National Toxicology Program (NTP) is made up of four charter agencies of the United States Department of Health and Human Services (DHHS):
the National Cancer Institute (NCI) of the National Institutes of Health; the National Institute of Environmental Health Sciences (NIEHS) of the National Institutes of Health; the National Center for Toxicological Research (NCTR) of the Food and Drug Administration; and the National Institute for Occupational Safety and Health (NIOSH) of the Centers for Disease Control.
In July 1981, the Carcinogenesis Bioassay Testing Program was transferred from NCI to NIEHS. NTP coordinates the relevant Public Health Service programs, staff, and resources that are concerned with basic and applied research and with biological assay development and validation.
NTP develops, evaluates, and disseminates scientific information about potentially toxic and hazardous chemicals. This knowledge is used for protecting the health of the American people and for the primary prevention of disease.
NTP designs and conducts studies to characterize and evaluate the toxicologic potential of selected chemicals in laboratory animals (usually two species, rats and mice). Chemicals selected for NTP toxicology studies are chosen primarily on the bases of human exposure, level of production, and chemical structure. Selection per se is not an indicator of a chemical's toxic potential.
The studies described in this toxicity study report were performed under the direction of NIEHS and were conducted in compliance with NTP laboratory health and safety requirements. These studies met or exceeded all applicable federal, state, and local health and safety regulations. Animal care and use were in accord and compliance with the Public Health Service Policy on Humane Care and Use of Animals.
Single copies of this report are available without charge, while supplies last, from the NTP Central Data Management (telephone number 919/541-3419).
NTP Central Data Management NIEHS
Post Office Box 12233 Research Triangle Park, NC 27709
National Toxicology Program Toxicity Report Series
Number 42
NTP Technical Report on Toxicity Studies of
1,3-Diphenylguanidine (CAS No. 102-06-7)
Administered in Feed to F344/N Rats and B6C3F Mice1
Richard D. Irwin, Ph.D., Study Scientist National Toxicology Program
Post Office Box 12233 Research Triangle Park, NC 27709
NIH Publication 95-3933 September 1995
United States Department of Health and Human Services Public Health Service
National Institutes of Health

2 1,3-DIPHENYLGUANIDINE, NTP TOXICITY REPORT NUMBER 42
CONTRIBUTORS This NTP report on the toxicity studies of 1,3-diphenylguanidine is based primarily on 2-week studies conducted in June and July 1989 and on 13-week studies that began in February 1990 and ended in June 1990 at Microbiological Associates, Inc., Bethesda, MD.
National Toxicology Program Evaluated experiment, interpreted results, and reported findings
Richard D. Irwin, Ph.D., Study Scientist John R. Bucher, Ph.D. Leo T. Burka, Ph.D. Rajendra S. Chhabra, Ph.D. Michael R. Elwell, D.V.M., Ph.D. Joel Mahler, D.V.M. Bernard A. Schwetz, D.V.M., Ph.D. Gregory S. Travlos, D.V.M. Kristine L. Witt, M.S.
Oak Ridge Associated Universities
Microbiological Associates, Inc. Principal contributors
Louis T. Mulligan, Ph.D. Martin L. Wenk, Ph.D.
Principal Investigators Lucas H. Brennecke, D.V.M. Lynda L. Pippin, D.V.M. Gregory S. Travlos, D.V.M.
NTP Pathology Review Evaluated slides and prepared pathology report
John C. Seely, D.V.M., Chair Pathco, Inc.
Joel Mahler, D.V.M. National Toxicology Program
Experimental Pathology Laboratories, Inc. Provided pathology quality assessment
William F. MacKenzie, D.V.M., M.S.
Environmental Health Research and Testing, Inc. Provided sperm morphology and vaginal cytology evaluation
Dushyant K. Gulati, Ph.D. Teresa Cocanougher, B.A. Susan Russell, B.A.
Analytical Sciences, Inc. Provided statistical analyses
Steven Seilkop, M.S. Janet L. Teague, M.S.
Biotechnical Services, Inc. Provided toxicity report preparation
C. Michael Bailey, B.S. Pharm., Principal Investigator
Chad J. Fitz, M.A. Terry L. Rhoades, B.S. Suzanne M. Swift, B.S.

3 1,3-DIPHENYLGUANIDINE, NTP TOXICITY REPORT NUMBER 42
PEER REVIEW
The draft report on the toxicity studies of 1,3-diphenylguanidine was evaluated in March 1994 by the reviewers listed below. These reviewers serve as independent scientists, not as representatives of any institution, company, or governmental agency. In this capacity, reviewers determine if the design and conditions of these NTP studies are appropriate and ensure that this toxicity study report presents the experimental results and conclusions fully and clearly.
Paul T. Bailey, Ph.D. Gary P. Carlson, Ph.D. Stonybrook Laboratories Department of Pharmacology and Toxicology Princeton, NJ Purdue University
West Lafayette, IN

4 1,3-DIPHENYLGUANIDINE, NTP TOXICITY REPORT NUMBER 42
TABLE OF CONTENTS ABSTRACT . . . . . . . . . . . . . . . . . . . . . . . . . . . . . . . . . . . . . . . . . . . . . . . . . . . . . . . . . . . . . . . . . . . . . . . . . . . . . 5
INTRODUCTION . . . . . . . . . . . . . . . . . . . . . . . . . . . . . . . . . . . . . . . . . . . . . . . . . . . . . . . . . . . . . . . . . . . . . . . . . 9 Physical Properties, Production, Use, and Exposure . . . . . . . . . . . . . . . . . . . . . . . . . . . . . . . . . . . . . . . . . 9 Absorption, Disposition, Metabolism, and Excretion . . . . . . . . . . . . . . . . . . . . . . . . . . . . . . . . . . . . . . . . 10 Toxicity . . . . . . . . . . . . . . . . . . . . . . . . . . . . . . . . . . . . . . . . . . . . . . . . . . . . . . . . . . . . . . . . . . . . . . . . . . . . 11 Study Rationale and Design . . . . . . . . . . . . . . . . . . . . . . . . . . . . . . . . . . . . . . . . . . . . . . . . . . . . . . . . . . . . 14
MATERIALS ANDMETHODS . . . . . . . . . . . . . . . . . . . . . . . . . . . . . . . . . . . . . . . . . . . . . . . . . . . . . . . . . . . . . . . 15 Procurement and Characterization of 1,3-Diphenylguanidine . . . . . . . . . . . . . . . . . . . . . . . . . . . . . . . . . 15 Dose Formulations . . . . . . . . . . . . . . . . . . . . . . . . . . . . . . . . . . . . . . . . . . . . . . . . . . . . . . . . . . . . . . . . . . . 15 Toxicity Study Designs . . . . . . . . . . . . . . . . . . . . . . . . . . . . . . . . . . . . . . . . . . . . . . . . . . . . . . . . . . . . . . . 16 Genetic Toxicity Studies . . . . . . . . . . . . . . . . . . . . . . . . . . . . . . . . . . . . . . . . . . . . . . . . . . . . . . . . . . . . . . 22 Statistical Methods . . . . . . . . . . . . . . . . . . . . . . . . . . . . . . . . . . . . . . . . . . . . . . . . . . . . . . . . . . . . . . . . . . . 23 Quality Assurance . . . . . . . . . . . . . . . . . . . . . . . . . . . . . . . . . . . . . . . . . . . . . . . . . . . . . . . . . . . . . . . . . . . 24
RESULTS . . . . . . . . . . . . . . . . . . . . . . . . . . . . . . . . . . . . . . . . . . . . . . . . . . . . . . . . . . . . . . . . . . . . . . . . . . . . . . 25 2-Week Feed Study in F344/N Rats . . . . . . . . . . . . . . . . . . . . . . . . . . . . . . . . . . . . . . . . . . . . . . . . . . . . . 25 13-Week Feed Study in F344/N Rats . . . . . . . . . . . . . . . . . . . . . . . . . . . . . . . . . . . . . . . . . . . . . . . . . . . . 27 2-Week Feed Study in B6C3F Mice1 . . . . . . . . . . . . . . . . . . . . . . . . . . . . . . . . . . . . . . . . . . . . . . . . . . . . . 33 13-Week Feed Study in B6C3F Mice1 . . . . . . . . . . . . . . . . . . . . . . . . . . . . . . . . . . . . . . . . . . . . . . . . . . . . 35 Genetic Toxicity Studies . . . . . . . . . . . . . . . . . . . . . . . . . . . . . . . . . . . . . . . . . . . . . . . . . . . . . . . . . . . . . . 37
DISCUSSION . . . . . . . . . . . . . . . . . . . . . . . . . . . . . . . . . . . . . . . . . . . . . . . . . . . . . . . . . . . . . . . . . . . . . . . . . . . . 39
REFERENCES . . . . . . . . . . . . . . . . . . . . . . . . . . . . . . . . . . . . . . . . . . . . . . . . . . . . . . . . . . . . . . . . . . . . . . . . . . . 43
APPENDIXES Appendix A Organ Weights and Organ-Weight-to-Body-Weight Ratios . . . . . . . . . . . . . . . . . . . . A-1
Appendix B Hematology and Clinical Chemistry Results . . . . . . . . . . . . . . . . . . . . . . . . . . . . . . . . B-1
Appendix C Reproductive Tissue Evaluations and Estrous Cycle Characterization . . . . . . . . . . . . . . . . . . . . . . . . . . . . . . . . . . . . . . . C-1
Appendix D Genetic Toxicology . . . . . . . . . . . . . . . . . . . . . . . . . . . . . . . . . . . . . . . . . . . . . . . . . . .D-1

5 1,3-DIPHENYLGUANIDINE, NTP TOXICITY REPORT NUMBER 42
ABSTRACT
1,3-Diphenylguanidine
Molecular Formula C H N13 13 3
CAS Number 102-06-7 Molecular Weight 211.26 Synonyms Diphenylguanidine
DPG Melaniline N,N -Diphenylguanidine sym-Diphenylguanidine Vulkazit
1,3-Diphenylguanidine (DPG) has been used as a primary and secondary accelerator in the
vulcanization of rubber. Exposure to 1,3-diphenylguanidine may occur as a result of dermal
contact during rubber manufacture or from contact with the finished products. DPG is poorly
absorbed through skin. Therefore, to evaluate the toxicity associated with systemic exposure, 2
week and 13-week toxicology studies were conducted by administering DPG in feed to groups of
male and female F344/N rats and B6C3F mice. Genetic toxicity was also evaluated in Salmonella1
typhimurium and in the micronucleus erythrocyte assay in peripheral blood from male and female
mice.
During 2-week studies, rats and mice received feed containing 0, 250, 500, 750, 1,500, or 3,000
ppm 1,3-diphenylguanidine. All rats and mice survived to the end of the study. Feed consumption
and mean body weights of groups of rats that received 750, 1,500, or 3,000 ppm were lower than
controls. No compound-related gross lesions were observed at the end of the study. The final
mean body weight of female mice that received 3,000 ppm was 6% lower than the controls at the

6 1,3-DIPHENYLGUANIDINE, NTP TOXICITY REPORT NUMBER 42
end of the study; however, no other effects attributable to chemical exposure were observed in
mice. Based on these results the same exposure concentrations (0, 250, 500, 750, 1,500, and
3,000 ppm) were selected for the 13-week study; because of the poor palatability of the 750 ppm
or higher dosed feed in rats, concentrations greater than 3,000 ppm were not considered
appropriate.
Six male rats and all female rats that received feed containing 3,000 ppm died or were killed
moribund before the end of the 13-week study. Final mean body weights and feed consumption
of male and female rats that received 1,500 or 3,000 ppm were lower than controls throughout
the study. The values of several hematologic parameters were significantly different from the
controls in groups of rats that received 1,500 or 3,000 ppm; however, these differences were
attributable to reduced nutrient intake as a result of reduced feed consumption. Lower total serum
protein, cholesterol, triglyceride, and creatinine concentrations were also considered to be the
consequence of reduced nutrient intake. Alkaline phosphatase activity and bile acid concentrations
were greater than the controls in most groups exposed to DPG and were considered to be an
indication of cholestasis.
Secretory depletion of the seminal vesicles and prostate gland, epididymal hypospermia,
spermatogenic arrest, and significant reductions in the absolute weights of the prostate gland,
seminal vesicles, and testis were observed in male rats in the 3,000 ppm group. Uterine hypoplasia
characterized by a reduction in uterine size due to thinner and less developed endometrium was
observed in female rats that received diets containing 750 ppm or greater. The mean length of the
estrous cycle was greater in female rats that received 750 or 1,500 ppm feed than in the controls.
All mice survived to the end of the 13-week study. Mean body weights of males and females that
received feed containing 750, 1,500, or 3,000 ppm were lower than the controls. Reduced organ
weights relative to control for mice that received 1,500 or 3,000 ppm were related to low body
weights of these groups. In mice that received 3,000 ppm sperm motility was reduced and the
number of spermatid heads was greater than for control males, and the estrous cycle length in
females was longer than that of the controls.
1,3-Diphenylguanidine was tested for mutagenicity in Salmonella typhimurium strains TA98,
TA100, TA1535, and TA1537 with and without S9 metabolic activation enzymes. No mutagenic

7 1,3-DIPHENYLGUANIDINE, NTP TOXICITY REPORT NUMBER 42
activity was observed in the absence of S9. With S9, positive responses were observed in strains
TA98 and TA100, and an equivocal response was observed in strain TA1537. Results of a
peripheral blood micronucleus test in B6C3F mice were concluded to be negative in males and1
equivocal in females.
In summary, consumption of feed containing 1,3-diphenylguanidine for 2 weeks or 13 weeks was
not associated with any histologic response which could be attributed to chemical exposure.
Instead the observed changes were indicative of reduced nutrient intake and are consistent with
similar changes observed in other studies of feed restricted rats and mice.

8 1,3-DIPHENYLGUANIDINE, NTP TOXICITY REPORT NUMBER 42

9 1,3-DIPHENYLGUANIDINE, NTP TOXICITY REPORT NUMBER 42
INTRODUCTION
Physical Properties, Production, Use, and Exposure
1,3-Diphenylguanidine is a white solid that melts at 148 to 150 C. It is soluble in organic
solvents such as ethanol, chloroform, or carbon tetrachloride but is sparingly soluble in water.
1,3-Diphenylguanidine has been used as a primary accelerator in the vulcanization of rubber and
as a secondary accelerator for sulfur-containing compounds such as thiazoles, sulfenamides, and
thiurams. Depending on the specific application, the concentration of 1,3-diphenylguanidine may
vary from 0.25% to 2.0% by weight. (Kirk-Othmer, 1982; Merck Index, 1983). Rubber containing
1,3-diphenylguanidine has been used in footwear, tires, and molded goods. Domestic production
of 1,3-diphenylguanidine was not reported by the United States International Trade Commission
(USITC) for the years 1981 to 1988 (USITC, 1988), and there is currently no known domestic
production of the compound.
According to a National Occupational Exposure Survey conducted by the National Institute for
Occupational Safety and Health (NIOSH) from 1981 to 1983, an estimated 611 workers at 30
plants were potentially exposed to 1,3-diphenylguanidine (NIOSH, 1990). All of these individuals
were employed in the manufacture of rubber and miscellaneous plastic products as blending
machine operators, molding and casting machine operators, chemical technicians, or unspecified
workers (48 individuals). 1,3-Diphenylguanidine and several other chemicals used in rubber
manufacturing cause a form of contact dermatitis referred to as “rubber itch,” which is observed
most often in workers involved in pigment blending, mixing, milling, and extrusion (Williamset
al., 1985).
Exposure to 1,3-diphenylguanidine may also occur as a result of contact with finished rubber
products. Buxtonet al. (1983) reported that a number of patients undergoing regular hemodialysis
gave positive patch tests for several rubber chemicals, including 1,3-diphenylguanidine.
10 1,3-DIPHENYLGUANIDINE, NTP TOXICITY REPORT NUMBER 42
Absorption, Disposition, Metabolism, and Excretion
Shah et al. (1985) found that 1,3-diphenylguanidine was poorly absorbed through the skin of rats. 14In this study, 0.3 µmole [ C]-labeled 1,3-diphenylguanidine in acetone was applied to the clipped
skin of Sprague-Dawley rats. After 30 minutes, only 0.1% of the applied DPG had been absorbed,
and after 120 hours, only 10% of the DPG had been absorbed. Absorption was characterized as
a first-order process with a half-time of 33.6 days. Absorbed material was distributed throughout
the body, with peak concentrations being attained approximately 6 hours after dosing, at which
time the highest concentrations of radioactivity were present in the liver, kidney, and intestine.
Within 5 days, 61% of the absorbed dose had been eliminated in the urine and 27% had been
eliminated in the feces. During the first 72 hours after dosing, approximately 50% of the
radioactivity in the urine was in the form of the parent compound, while 50% was in the form of
a single metabolite; 96 hours after dosing, all urinary radioactivity was in the form of the
metabolite. No parent compound was identified in the feces, and all radioactivity was in the form
of two metabolites that differed from the urinary metabolite.
1,3-Diphenylguanidine disposition in male F344 rats was examined by Ioannou and Matthews 14(1984). After oral or intravenous administration, [ C]-labeled 1,3-diphenylguanidine-derived
radioactivity was rapidly distributed throughout the body, with the highest concentration occurring
in the liver at all time points examined. Radioactivity peaked in the liver approximately 45 minutes
after intravenous administration and was rapidly cleared from all tissues so that the total body
burden 24 hours after dosing was 10% of that at 15 minutes. Clearance was biphasic, with the
initial rapid phase accounting for the major portion of the dose. Approximately equal amounts of
radioactivity were eliminated in the feces and urine; however, in rats in which the common bile
duct had been cannulated, 75% of the administered DPG appeared in bile within 6 hours after
dosing, which is consistent with significant enterohepatic recycling of material excreted in bile.
The majority of the radioactivity found in bile (95%) was in the form of a single metabolite.
Incubation of this metabolite with -glucuronidase yielded a metabolite identical to the major fecal
metabolite, which accounted for 95% of the radioactivity eliminated in the feces. Radioactivity in
the urine was in the form of the parent compound (28%), two major metabolites (37%) and (34%),
and a minor metabolite (3%). Incubation of the major urinary metabolite with -glucuronidase
also yielded a metabolite that was identical to the major fecal metabolite.
11 1,3-DIPHENYLGUANIDINE, NTP TOXICITY REPORT NUMBER 42
Toxicity
ANIMAL TOXICITY
The acute toxicity of 1,3-diphenylguanidine has been evaluated in rats, mice, and rabbits (Table
1). The similarity of LD50 values among the three species for the oral route of exposure suggests
that the absorption, distribution, and metabolism of 1,3-diphenylguanidine may be similar across
species.
The toxicity of 1,3-diphenylguanidine has been evaluated in 2-week and 13-week studies. Ina
2-week repeated dose toxicity study in Sprague-Dawley rats, groups of five rats per sex received
0, 300, 500, 800, 1,500, or 3,000 ppm 1,3-diphenylguanidine in the diet (Monsanto Company,
unpublished). Two males and three females that received 3,000 ppm died before the end of the
study. Exposure-related decreases in mean body weights, body weight gains, and feed
consumption were observed in all exposed groups. The lower absolute organ weights that were
observed in groups receiving 500 ppm or greater were considered a consequence of lower body
weight gains. No histopathology was conducted in this study.
During a 13-week toxicity study, groups of 15 Sprague-Dawley rats per sex received 0, 50, 150,
or 500 ppm 1,3-diphenylguanidine in the diet (Monsanto Company, unpublished). One male that
received 500 ppm and one control female died before the end of the study. Mean body weights,
body weight gains, and feed consumption were reduced in groups that received 500 ppm. nI
addition, after 6 and 13 weeks of exposure, urine volume was decreased and specific gravity was
increased in groups receiving 500 ppm. There were no gross or microscopic histologic lesions that
could be attributed to 1,3-diphenylguanidine exposure.

12 1,3-DIPHENYLGUANIDINE, NTP TOXICITY REPORT NUMBER 42
TABLE 1 Summary of Selected Animal Toxicity Data for 1,3-Diphenylguanidine
Route Species of Exposure LD50 (mg/kg) Reference
Rat Oral 323 NTP, 1988
Oral 350 Monsanto, 1986
Oral 375 NTP, 1988
Mouse Oral 258 NTP, 1988
Rabbit Oral 246 NTP, 1988
Dermal >794 Monsanto, 1986
TERATOLOGY AND REPRODUCTIVE TOXICITY
The teratogenicity of 1,3-diphenylguanidine was evaluated in a study in which ICR mice received
0, 0.25, 1, 4, or 10 mg/kg by gavage on gestation Days 0 to 18 (Yasuda and Tanimura, 1980). All
animals were necropsied on the 18th day of pregnancy. No maternal toxicity was observed. The
mean number of implants was reduced in dams that received 10 mg/kg. However, there were no
significant differences between treated and control groups in the percentage of dead fetuses,
average litter size, sex ratio, or mean body weights. The incidence of external or skeletal
abnormalities in treated groups was similar to that of the control group.
In studies performed by Bempong and Hall (1983), male Syrian golden hamsters and C57BL/J6
× DBA2 mice were administered 0, 4, or 8 mg 1,3-diphenylguanidine per kg body weight in
acidified drinking water daily for up to 15 weeks. After approximately 4 weeks of exposure, the
incidence of abnormal sperm was increased in exposed hamsters and mice. In addition, reduced
sperm counts and decreased testis weights were observed in mice exposed ot
1,3-diphenylguanidine for 5 weeks or longer. Histologic examination of the testes of exposed mice
revealed irregularly shaped seminiferous tubules with no defined basement membrane, a loss of
interstitial cells, and reduced numbers of spermatids and spermatozoa in the tubule lumens.
Bempong and Hall (1983) also investigated the reproductive effects of 1,3-diphenylguanidine in
C57BL/J6 × DBA2 mice. In this study, male mice were exposed to 0, 4, or 8 mg
1,3-diphenylguanidine per kg body weight in acidified drinking water daily for about 13 weeks;

13 1,3-DIPHENYLGUANIDINE, NTP TOXICITY REPORT NUMBER 42
beginning on Day 7 of exposure, males were mated weekly with untreated virgin females.
Exposure to 1,3-diphenylguanidine for 4 weeks did not significantly reduce fertility indices or
induce dominant lethal effects in mice. However, after 5 weeks of exposure, fertility indices and
the number of implants per pregnant mouse were significantly decreased in exposed groups, and
the number of dead fetuses per pregnancy was significantly increased.
®In a recent study by Koëter et al. (1992), male Swiss (CD-1 ) mice were administered
1,3-diphenylguanidine by gavage at doses of 0, 0.06, 0.25, 1, 4, or 16 mg/kg per day for 8 weeks
prior to mating. At the end of the dosing period, approximately 50% of the males from the control
and 16 mg/kg groups were randomly selected and evaluated for sperm morphology; the remaining
males in the control, 4, and 16 mg/kg groups were mated with unexposed females. No differences
in weight gain, clinical observations, or organ weights were observed between the control group
and any of the treated groups (0.06, 0.25, 1, 4, and 16 mg/kg). Microscopic examination of the
testes of mice in the control and 16 mg/kg groups did not reveal any treatment-related
abnormalities. In addition, the fertility and reproductive performance of males exposed to
1,3-diphenylguanidine were similar to those of the control group.
GENETIC TOXICITY
1,3-Diphenylguanidine is chemically related to the aromatic amides which can be nitrosated to
potentially mutagenic metabolites. 1,3-Diphenylguanidine was weakly mutagenic inSalmonella
typhimurium strains TA98 and TA100 when testing was performed in the presence of induced
hamster liver S9 (Mortelmans et al., 1986). A preincubation protocol was used in this assay, and
effective concentrations were generally at the 100 µg/plate level and higher. PublishedSalmonella
data indicate an absence of mutagenic activity in tests using induced rat liver S9 enzymes (Rannug
et al., 1984; Crebelli et al., 1985); this enzyme mix is apparently less effective than
hamster-derived enzymes in producing mutagenic metabolites of 1,3-diphenylguanidine
(Mortelmans et al., 1986). Bempong and Mantley (1985) reported that 1,3-diphenylguanidine (at
concentrations below 36 µg/plate) was mutagenic in Salmonella in the absence of S9; however,
the report did not contain sufficient data or protocol detail for a critical evaluation of the results.
No increases were observed in the frequency of gene mutations at the HGPRT locus in Chinese
hamster V79 cells treated with up to 500 µg/mL 1,3-diphenylguanidine, with and without S9
14 1,3-DIPHENYLGUANIDINE, NTP TOXICITY REPORT NUMBER 42
(Donner et al., 1983). However, the S9 source used in this study was induced rat liver, and the use
of this enzyme mix may not have been appropriate for the chemical. Chromosomal damage was
reportedly detected in Vicia faba root tip cells exposed to 5 or 10 µg/mL 1,3-diphenylguanidine
(Bempong and McCoy, 1972). However, this latter study presented insufficient information for
a critical interpretation of the results.
Data derived from the testing of structurally related compounds showed no evidence of
mutagenicity. Negative results were obtained in Salmonella mutation tests for
N,N -bis(2-methylphenyl)guanidine (CAS No. 97-39-2) (Rannug et al., 1984), carbanilide
(CAS No. 102-07-8) (Zeiger et al., 1988), and thiocarbanilide (CAS No. 102-08-9) (Haworthet
al., 1983); all testing was performed with and without S9. In addition, no induction of sex-linked
recessive lethal mutations occurred in germ cells of male Drosophila melanogasteradministered
thiocarbanilide by feeding (1,000 ppm) or by injection (100 ppm) (Zimmeringet al., 1985).
Study Rationale and Design
1,3-Diphenylguanidine was nominated for toxicity testing by the National Cancer Institute because
of the potential for human exposure to the compound, the lack of adequate data to characterize the
toxicity of diarylguanidines as a chemical class, and the possibility that 1,3-diphenylguanidine could
be converted to a strong mutagen by nitrosation. This report presents the results of 2-week and
13-week feed studies in rats and mice and mutagenicity studies in Salmonella typhimuriumand
in the micronucleus erythrocyte assay in peripheral blood from male and female mice.
15 1,3-DIPHENYLGUANIDINE, NTP TOXICITY REPORT NUMBER 42
MATERIALS ANDMETHODS
Procurement and Characterization of 1,3-Diphenylguanidine
1,3-Diphenylguanidine was obtained in one lot (Lot 239474) from Fluka Chemical, Inc.
(Ronkonkoma, NY). Identity and purity analyses were performed by Midwest Research Institute
(MRI, Kansas City, MO). The chemical, an off-white, grayish powder, was identified as
1,3-diphenylguanidine by infrared, ultraviolet/visible, and nuclear magnetic resonance
spectroscopy; the spectra were consistent with the structure of 1,3-diphenylguanidine and an
available literature reference (Sadtler Standard Spectra). The determined melting point of the
chemical was also consistent with an available literature reference (Merck Index, 1983).
The results of elemental analyses for carbon, hydrogen, and nitrogen agreed with theoretical values.
Karl Fischer analysis indicated a water content of 0.05% ± 0.03%, and functional group titration
indicated a purity of 98.9% ± 0.6%. Analysis by thin-layer chromatography indicated a major spot,
a minor impurity, and a trace impurity by one solvent system and a major spot, three minor
impurities, and a trace impurity by a second solvent system. High performance liquid
chromatography (HPLC) indicated one impurity with an area of 0.2% relative to the major peak.
The cumulative analytical data indicated an overall purity of approximately 99%.
Accelerated stability studies of the bulk chemical were also performed by MRI. Analyses with
HPLC indicated that the bulk chemical was stable for 2 weeks at temperatures up to 25 C when
stored protected from light; some evidence of decomposition was noted in the chemical sample
stored at 60 C. At the study laboratory, the bulk chemical was stored at 5 C protected from light
and moisture; reanalyses by the study laboratory using HPLC indicated no detectable
decomposition of the bulk chemical.
Dose Formulations
For the 2-week and 13-week studies, 1,3-diphenylguanidine was mixed with NIH-07 Open
Formula Diet (Zeigler Brothers, Inc., Gardners, PA) in powder form. A premix was prepared for
each exposure concentration by mixing a weighed amount of 1,3-diphenylguanidine in a 6-L
16 1,3-DIPHENYLGUANIDINE, NTP TOXICITY REPORT NUMBER 42
beaker with an equal weight of feed. The premix was then blended with a weighed amount of feed
in a twin-shell blender for 15 minutes, with the intensifier bar on for the first 5 minutes.
Homogeneity analyses of a 250 ppm 1,3-diphenylguanidine feed mixture were conducted at MRI;
analyses with HPLC indicated a maximum variation in concentration of 1.6% among three
sampling points. Analyses conducted by the study laboratory on feed mixtures of
1,3-diphenylguanidine with reverse-phase HPLC confirmed the homogeneity of the mixtures.
The stability of 1,3-diphenylguanidine feed mixtures was evaluated by HPLC. These analyses
indicated that a 30 ppm 1,3-diphenylguanidine feed mixture was stable for 3 weeks when stored
in the dark at 5 C, and a feed mixture of 250 ppm 1,3-diphenylguanidine was stable for 3 weeks
in the dark at 20 C. Analyses of 250 ppm feed mixtures after 7 and 14 days of storage in the
dark at 20 C indicated minor (2.8% and 5.2% respectively) but statistically significant chemical
losses at both time points. These small differences were attributed to analytical variation. Both
the 30 and 250 ppm feed mixtures showed significant losses of 1,3-diphenylguanidine (6% and
11% respectively) after 1 day of storage under animal room conditions. Feeders were changed
daily, 7 days per week in the 2-week and 13-week studies.
The feed mixtures used in the 2-week and 13-week studies were stored in plastic bags or jars in
the dark at 20 C and were discarded 3 weeks after preparation. The study laboratory
periodically analyzed the 1,3-diphenylguanidine feed mixtures by reverse-phase HPLC. All feed
mixtures administered to animals were within 10% of the target concentrations. The results of a
referee analysis performed by MRI on a 500 ppm 1,3-diphenylguanidine feed mixture prepared
at the start of the 13-week studies were in agreement with the study laboratory results.
Toxicity Study Designs
BASE STUDIES
Male and female F344/N rats and B6C3F mice used in the 2-week and 13-week studies were1
obtained from Taconic Farms (Germantown, NY) and were approximately 4 weeks old at receipt.
The animals were quarantined for 11 to 15 days and were 6 to 7 weeks old when the studies began.
At the end of the 13-week studies, blood samples were collected from five sentinel rats and five
control mice per sex, and the sera were analyzed for antibody titers to rodent viruses (Boorman et

17 1,3-DIPHENYLGUANIDINE, NTP TOXICITY REPORT NUMBER 42
al., 1986; Rao et al., 1989a,b); all results were negative. Additional details concerning study
design and performance are listed in Table 2.
In the 2-week studies, groups of five male and five female rats and mice were administered 0, 250,
500, 750, 1,500, or 3,000 ppm 1,3-diphenylguanidine in feed that was available ad libitum. The
exposure levels selected for the 13-week studies were based on the results of the 2-week studies.
In the 13-week studies, groups of 10 male and 10 female rats and mice were administered 0, 250,
500, 750, 1,500, or 3,000 ppm 1,3-diphenylguanidine in feed that was available ad libitum.
Additional rats (10 males and 10 females per exposure group) were used in a supplemental clinical
pathology study.
During the 2-week and 13-week studies, rats were housed five per cage and mice were housed
individually. Animal rooms were maintained at 69 to 75 F and 35% to 65% relative humidity,
with 12 hours of fluorescent light per day and approximately 10 air changes per hour. Feed and
water were availablead libitum. Because of the limited stability of the 1,3-diphenylguanidine feed
mixtures, feeders were changed daily, 7 days per week, throughout the 2-week and 13-week
studies.
Complete necropsies were performed on all animals in the 2-week and 13-week base studies. For
rats and mice, the heart, right kidney, liver, lungs, ovaries, prostate gland, seminal vesicles, spleen,
right testis, and thymus were removed and weighed. Organs and tissues were examined for gross
lesions and fixed in 10% neutral buffered formalin. Tissues to be examined microscopically were
trimmed, embedded in paraffin, sectioned, and stained with hematoxylin and eosin.
In the 2-week studies, histopathologic examinations were performed on all tissues with gross
lesions. In the 13-week studies, complete histopathologic examinations were performed on all rats
and mice in the 0 and 3,000 ppm groups, on all rats in the 1,500 ppm groups, and on all animals
that died early. Gross lesions and selected tissues were examined in the lower exposure groups.
Tissues examined microscopically are listed in Table 2.
Upon completion of the laboratory pathologist's histologic evaluation, the slides, paraffin blocks,
and residual wet tissues were sent to the NTP Archives for inventory, slide/block match, and wet

18 1,3-DIPHENYLGUANIDINE, NTP TOXICITY REPORT NUMBER 42
tissue audit. The slides, individual animal data records, and pathology tables were sent to an
independent pathology laboratory where quality assessment was performed. Results were
reviewed and evaluated by the NTP Pathology Working Group (PWG); the final diagnoses
represent a consensus of contractor pathologists and the PWG. Details of these review procedures
have been described by Maronpot and Boorman (1982) and Boormanet al. (1985).
SUPPLEMENTAL EVALUATIONS
Clinical Pathology
In the 13-week study in rats, hematology and clinical chemistry evaluations were performed on 10
male and 10 female supplemental rats per group at Days 5 and 21 and on base-study rats at study
termination (Week 13). For these evaluations, rats were anesthetized with CO , and blood samples2
were collected from the retroorbital sinus. Samples for hematology analysis were placed in tubes
containing potassium EDTA, and samples for clinical chemistry evaluations were placed in similar
tubes devoid of anticoagulant. The latter samples were allowed to clot at room temperature; the
samples were then centrifuged and serum was removed.
All automated hematologic determinations were made with a Serono-Baker 9000 automated cell
counter (Serono-Baker Diagnostics, Allentown, PA); the parameters evaluated are listed in Table
2. Manual hematocrit determinations were made using a Damon/IEC microcapillary reader
(International Equipment Company, Needham Heights, MA). Differential leukocyte counts were
determined from blood films stained with a modified Wright's stain in an Ames Hema-Tek II slide
stainer, (Miles Laboratory, Ames Division, Elkhart, IN), and methemoglobin was measured with
an IL CO-Oximeter 282 (Instrumentation Laboratory, Inc., Lexington, MA). Smears for
reticulocyte determination were stained with freshly prepared methylene blue.
All clinical chemistry parameters were determined on a Serono-Baker Encore II chemistry system.
Reagents for total bile acid determinations were obtained from Nyegeard and Company
Diagnostics (Oslo, Norway); reagents for all other clinical chemistry determinations were obtained
from Serono-Baker Diagnostics. The clinical chemistry parameters evaluated are listed in Table 2.

19 1,3-DIPHENYLGUANIDINE, NTP TOXICITY REPORT NUMBER 42
Sperm Motility and Vaginal Cytology Evaluations
At the end of the 13-week studies, vaginal cytology and sperm motility evaluations were performed
on all base-study rats in the 0, 500, 750, and 1,500 ppm groups and all mice in the 0, 250, 750, and
3,000 ppm groups. The parameters evaluated are listed in Table 2. Methods were those outlined
in the National Toxicology Program's Technical Protocol for Sperm Morphology and Vaginal
Cytology Evaluation in Toxicity Testing for Rats and Mice (NTP, 1987). Beginning 12 days prior
to sacrifice, the vaginal vaults of 10 females from each exposure group were lavaged, and the
aspirated lavage fluid and cells were stained with toluidine blue. Relative numbers of leukocytes,
nucleated epithelial cells, and large squamous epithelial cells were determined and used to
ascertain estrous cycle stage (i.e., diestrus, proestrus, estrus, or metestrus).
Sperm motility was evaluated at necropsy in the following manner. The left testis and epididymis
were weighed. The tail of the epididymis (cauda epididymis) was then removed from the corpus
epididymis and weighed. Test yolk (rats) or Tyrode's buffer (mice) was applied to slides, and a
small incision was made at the distal border of the cauda epididymis. The sperm effluxing from
the incision were dispersed in the buffer on the slides, and the numbers of motile and nonmotile
spermatozoa were counted for five fields per slide by two observers.
Following completion of sperm motility estimates, each left cauda epididymis was placed in
buffered saline solution. Caudae were finely minced and swirled, and the tissue was incubated and
then heat fixed. Sperm density was then determined microscopically with the aid of a
hemacytometer. To quantify spermatogenesis, testicular spermatid head count was determined by
removing the tunica albuginea and homogenizing the left testis in 10% dimethyl sulfoxide in
phosphate-buffered saline. Homogenization-resistant spermatid nuclei were counted using a
hemacytometer.
20 1,3-DIPHENYLGUANIDINE, NTP TOXICITY REPORT NUMBER 42
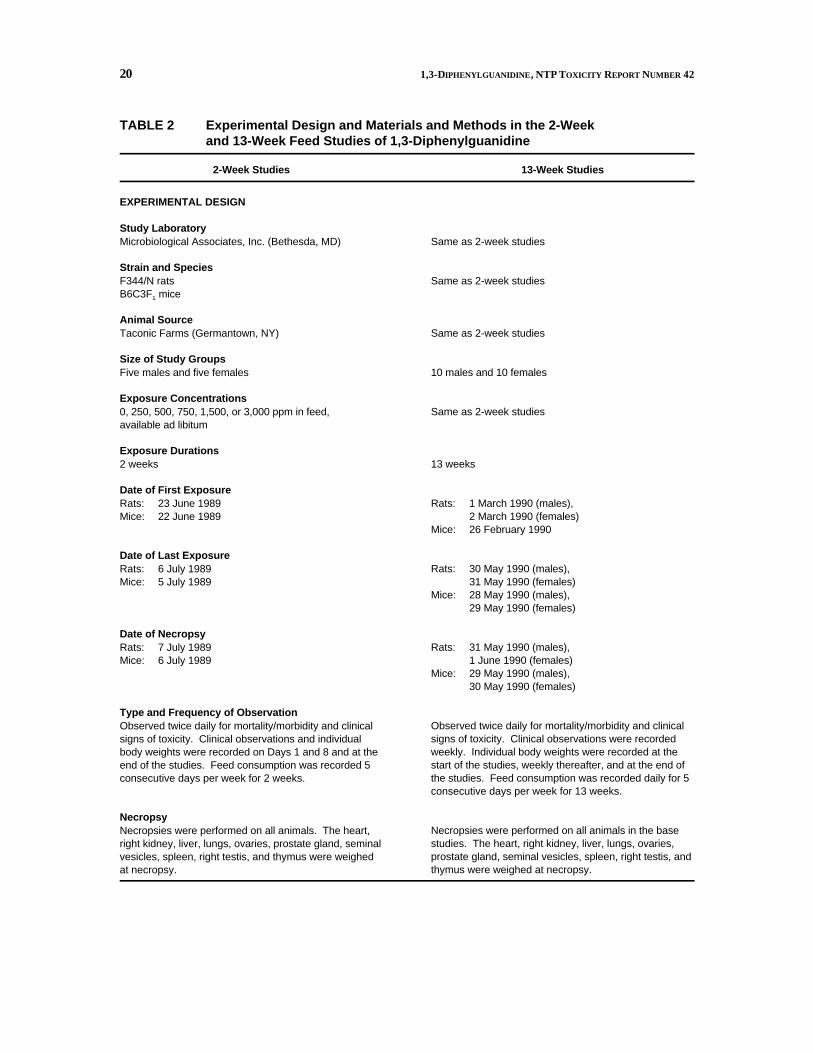
TABLE 2 Experimental Design and Materials and Methods in the 2-Week and 13-Week Feed Studies of 1,3-Diphenylguanidine
2-Week Studies 13-Week Studies
EXPERIMENTAL DESIGN
Study Laboratory Microbiological Associates, Inc. (Bethesda, MD)
Strain and Species F344/N rats B6C3F mice1
Animal Source Taconic Farms (Germantown, NY)
Size of Study Groups Five males and five females
Exposure Concentrations 0, 250, 500, 750, 1,500, or 3,000 ppm in feed, available ad libitum
Exposure Durations 2 weeks
Date of First Exposure Rats: 23 June 1989 Mice: 22 June 1989
Date of Last Exposure Rats: 6 July 1989 Mice: 5 July 1989
Date of Necropsy Rats: 7 July 1989 Mice: 6 July 1989
Type and Frequency of Observation Observed twice daily for mortality/morbidity and clinical signs of toxicity. Clinical observations and individual body weights were recorded on Days 1 and 8 and at the end of the studies. Feed consumption was recorded 5 consecutive days per week for 2 weeks.
Necropsy Necropsies were performed on all animals. The heart, right kidney, liver, lungs, ovaries, prostate gland, seminal vesicles, spleen, right testis, and thymus were weighed at necropsy.
Same as 2-week studies
Same as 2-week studies
Same as 2-week studies
10 males and 10 females
Same as 2-week studies
13 weeks
Rats: 1 March 1990 (males), 2 March 1990 (females)
Mice: 26 February 1990
Rats: 30 May 1990 (males), 31 May 1990 (females)
Mice: 28 May 1990 (males), 29 May 1990 (females)
Rats: 31 May 1990 (males), 1 June 1990 (females)
Mice: 29 May 1990 (males), 30 May 1990 (females)
Observed twice daily for mortality/morbidity and clinical signs of toxicity. Clinical observations were recorded weekly. Individual body weights were recorded at the start of the studies, weekly thereafter, and at the end of the studies. Feed consumption was recorded daily for 5 consecutive days per week for 13 weeks.
Necropsies were performed on all animals in the base studies. The heart, right kidney, liver, lungs, ovaries, prostate gland, seminal vesicles, spleen, right testis, and thymus were weighed at necropsy.

21 1,3-DIPHENYLGUANIDINE, NTP TOXICITY REPORT NUMBER 42
TABLE 2 Experimental Design and Materials and Methods in the 2-Week and 13-Week Feed Studies of 1,3-Diphenylguanidine (continued)
2-Week Studies 13-Week Studies
Histopathologic Examinations Histopathologic examinations were performed on all tissues showing gross lesions.
Clinical Pathology Studies None
Sperm Motility and Vaginal Cytology Evaluations None
Histopathologic examinations were performed on all rats and mice in the control and 3,000 ppm groups, all rats in the 1,500 ppm groups, and all animals that died early. The following tissues were examined: adrenal glands, brain (three sections), esophagus, femur with marrow, gallbladder (mice only), gross lesions, heart, intestines (large: cecum, colon, rectum; small: duodenum, jejunum, ileum), kidneys, liver, lung/mainstem bronchi, lymph nodes (mandibular, mesenteric), mammary gland with adjacent skin, nasal cavity and turbinates (three sections), ovaries, pancreas, parathyroid glands, pituitary gland, preputial or clitoral glands, prostate gland, salivary glands, skin, spleen, spinal cord/sciatic nerve (rats only), stomach (forestomach and glandular stomach), testes (with epididymis and seminal vesicle), thigh muscle (rats only), thymus, thyroid glands, trachea, urinary bladder, uterus, and vagina (females in vaginal cytology studies only). For rats, the uterus and prostate gland were examined in the lower exposure groups; for mice, no tissues were designated for examination in the lower exposure groups.
Hematology and clinical chemistry evaluations were performed on 10 supplemental-study rats per sex and exposure level at Days 5 and 21 and on base-study rats at study termination (Week 13). Hematology parameters evaluated included: automated and manual hematocrit (Hct), hemoglobin (Hgb), erythrocytes (RBCs), reticulocytes, nucleated erythrocytes, mean cell volume (MCV), mean cell hemoglobin (MCH), mean cell hemoglobin concentration (MCHC), platelets, leukocyte (WBC) count and differential, and methemoglobin. Clinical chemistry parameters evaluated included: urea nitrogen (UN), creatinine, total protein, albumin, total and direct bilirubin, cholesterol, triglycerides, alkaline phosphatase (AP), alanine aminotransferase (ALT), creatine kinase (CK), sorbitol dehydrogenase (SDH), and bile acids.
Sperm motility and vaginal cytology evaluations were performed on base-study rats in the 0, 500, 750, and 1,500 ppm groups and mice in the 0, 250, 750, and 3,000 ppm groups. Males were evaluated for necropsy body and reproductive tissue weights and spermatozoal data. Females were evaluated for necropsy body weight, estrous cycle length, and the percent of cycle spent in the various stages.

22 1,3-DIPHENYLGUANIDINE, NTP TOXICITY REPORT NUMBER 42
TABLE 2 Experimental Design and Materials and Methods in the 2-Week and 13-Week Feed Studies of 1,3-Diphenylguanidine (continued)
2-Week Studies 13-Week Studies
ANIMAL MAINTENANCE
Time Held Before Study Rats: 15 days Mice: 13 days
Rats: Mice:
14 to 15 days 11 days
Age When Study Began 6½ to 7 weeks 6 to 7 weeks
Age at Necropsy 8½ to 9 weeks 19 to 20 weeks
Method of Animal Distribution Animals were distributed randomly into groups of approximately equal initial mean body weights.
Same as 2-week studies
Diet NIH-07 Open Formula Diet (Zeigler Brothers, Inc., Gardners, PA) in powder form and drinking water (Washington Suburban Sanitary Commission Potomac Plant) available ad libitum.
Same as 2-week studies
Animal Room Environment Rats were housed five per cage and mice were housed individually. Temperature was maintained at 69 to 75 F and relative humidity at 35% to 65%, with at least 10 air changes per hour. Fluorescent light was provided for 12 hours per day.
Same as 2-week studies
Genetic Toxicity Studies
SALMONELLA TYPHIMURIUM TEST PROTOCOL
Testing was performed as reported by Mortelmans et al. (1986). 1,3-Diphenylguanidine was sent
to the laboratory as a coded aliquot. It was incubated with theSalmonella typhimurium tester
strains (TA98, TA100, TA1535, and TA1537) either in buffer or S9 mix (metabolic activation
enzymes and cofactors from Aroclor 1254-induced male Sprague-Dawley rat or Syrian hamster
liver) for 20 minutes at 37 C. Top agar supplemented withl-histidine and d-biotin was added,
and the contents of the tubes were mixed and poured onto the surfaces of minimal glucose agar
plates. Histidine-independent mutant colonies arising on these plates were counted following
2 days incubation at 37 C.
Each trial consisted of triplicate plates of concurrent positive and negative controls and of at least
five doses of 1,3-diphenylguanidine. High dose was limited by experimental design to 10,000
µg/plate. All assays were repeated.

23 1,3-DIPHENYLGUANIDINE, NTP TOXICITY REPORT NUMBER 42
PERIPHERAL BLOOD MICRONUCLEUS TEST PROTOCOL
A modification of the technique described by MacGregor et al. (1990) was used. At the
termination of the 13-week toxicity study, blood was obtained from male and female mice and
smears were immediately prepared and fixed in absolute methanol. The methanol-fixed slides
were stained with acridine orange and coded. The frequency of micronuclei was determined in
2,000 normochromatic erythrocytes (NCEs) in each of 5 animals per dose group. The criteria of
Schmid (1976) were used in defining micronuclei.
Statistical Methods
ANALYSIS OF CONTINUOUS VARIABLES
For the 13-week studies, two approaches were employed to assess the significance of pairwise
comparisons between exposed and control groups in the analysis of continuous variables. Organ
and body weight data, which are approximately normally distributed, were analyzed using the
parametric multiple comparisons procedures of Williams (1971, 1972) or Dunnett (1955). Clinical
chemistry, hematology, spermatid, and spermatozoal data, which typically have skewed
distributions, were analyzed using the nonparametric multiple comparisons methods of Shirley
(1977) or Dunn (1964). Jonckheere's test (Jonckheere, 1954) was used to assess the significance
of dose-response trends and to determine whether a trend-sensitive test (Williams, Shirley) was
more appropriate for pairwise comparisons than a test capable of detecting departures from
monotonic dose response (Dunnett, Dunn). If the P-value from Jonckheere's test was greater than
or equal to 0.10, Dunn's or Dunnett's test was used rather than Shirley's or Williams' test.
The outlier test of Dixon and Massey (1951) was employed to detect extreme values. No value
selected by the outlier test was eliminated unless it was at least twice the next largest value or at
most half of the next smallest value. The extreme values chosen by the statistical test were subject
to approval by NTP personnel. In addition, values indicated by the laboratory report as being
inadequate due to technical problems were eliminated from the analysis.

24 1,3-DIPHENYLGUANIDINE, NTP TOXICITY REPORT NUMBER 42
ANALYSIS OF VAGINAL CYTOLOGY DATA
Because the data are proportions (the proportion of the observation period that an animal was in
a given estrous stage), an arcsine transformation was used to bring the data into closer
conformance with normality assumptions. Treatment effects were investigated by applying a
multivariate analysis of variance (Morrison, 1976) to the transformed data to test for the
simultaneous equality of measurements across dose levels.
ANALYSIS OF MUTAGENICITY IN SALMONELLA TYPHIMURIUM
A positive response in the Salmonella typhimurium assay was defined as a reproducible,
dose-related increase in histidine-independent (revertant) colonies in any one strain/activation
combination. An equivocal response was defined as an increase in revertants that was not dose
related, not reproducible, or of insufficient magnitude to support a determination of mutagenicity.
A negative response was obtained when no increase in revertant colonies was observed following
chemical treatment. There was no minimum percentage or fold increase required for a chemical
to be judged positive or weakly positive.
ANALYSIS OF PERIPHERAL BLOOD MICRONUCLEUS DATA
The frequency of micronucleated PCEs was analyzed by a statistical software package (ILS, 1990)
that employed a one-tailed trend test across dose groups and a t-test for pairwise comparisons of
each dose group to the concurrent control.
Quality Assurance
The animal studies of 1,3-diphenylguanidine were performed in compliance with United States
FDA Good Laboratory Practices regulations (21 CFR, Part 58). The Quality Assurance Unit of
Microbiological Associates, Inc., performed audits and inspections of protocols, procedures, data,
and reports throughout the course of the studies.

25 1,3-DIPHENYLGUANIDINE, NTP TOXICITY REPORT NUMBER 42
RESULTS
2-Week Feed Study in F344/N Rats
All rats survived to the end of the 2-week study (Table 3). The final mean body weights and body
weight gains of males and females exposed to 1,500 or 3,000 ppm 1,3-diphenylguanidine were
notably less than those of the control groups (Table 3). During the second week of the study,
clinical signs of toxicity were observed in males and females in the 3,000 ppm groups and included
ruffled fur and thin appearance.
TABLE 3 Survival, Body Weight, Feed Consumption, and Compound Consumption Data for F344/N Rats in the 2-Week Feed Study of 1,3-Diphenylguanidine
Dose (ppm) Survival1
Mean Body Weight (grams) Initial Final Change
Final Weight Relative to
Controls (%) 2
Average Feed Consumption3
(g/day)
Average Dose3
(mg/kg/day)
MALE
0 250 500 750
1,500 3,000
5/5 5/5 5/5 5/5 5/5 5/5
165 165 165 164 163 161
224 232 230 219 202 170
59 67 65 55 39 9
104 103 98 90 76
20.6 19.3 19.3 17.7 15.5 10.9
22 45 64
121 200
FEMALE
0 250 500 750
1,500 3,000
5/5 5/5 5/5 5/5 5/5 5/5
116 113 117 110 112 115
144 141 143 137 134 120
28 28 26 27 22 5
98 99 95 93 83
12.5 12.3 11.9 11.4 10.8 6.2
23 44 65
127 166
1 Number surviving at 2 weeks/number of animals per group. 2 (Exposure group mean/control group mean) x 100. 3 Average of individual consumption values for Days 6 and 13.

26 1,3-DIPHENYLGUANIDINE, NTP TOXICITY REPORT NUMBER 42
During the first week of the study rats exposed to 3,000 ppm consumed 35% less feed than
controls and the final mean body weights of these groups remained the same or decreased slightly
from their initial values. During the second study week, feed consumption by the 3,000 ppm
groups increased relative to controls and body weight gains increased but the final mean body
weights remained lower than controls. Feed consumption and final mean body weights of groups
receiving 750 or 1,500 ppm were also lower than the controls during both study weeks; however,
animals in these groups gained weight continuously during the study.
The pattern of organ weight changes observed during the 2-week study was not indicative of
chemical-related toxicity (data on file at NIEHS). Absolute organ weights of male rats that
received 3,000 ppm were uniformly lower than controls due to the markedly reduced final mean
body weights of this group. Ovarian weights of females that received 750 or 1,500 ppm were
lower than controls, however final mean body weights of both groups were also lower than the
controls. Relative liver weights of males that received 500 or 1,500 ppm and relative kidney
weight of females that received 750 ppm were greater than those of the controls but the influences
were small in magnitude, not exposure related, and not considered biologically meaningful.
No gross lesions associated with exposure to 1,3-diphenylguanidine were observed in male or
female rats. No microscopic examination was conducted.
Because of the absence of chemical associated toxicity, exposure concentrations selected for the
13-week study were the same as those used in the 2-week study. Although lower body weights
and feed consumption were observed in the 3,000 ppm groups, animals in these groups began to
eat and gained weight during the second week of the study.
27 1,3-DIPHENYLGUANIDINE, NTP TOXICITY REPORT NUMBER 42
13-Week Feed Study in F344/N Rats
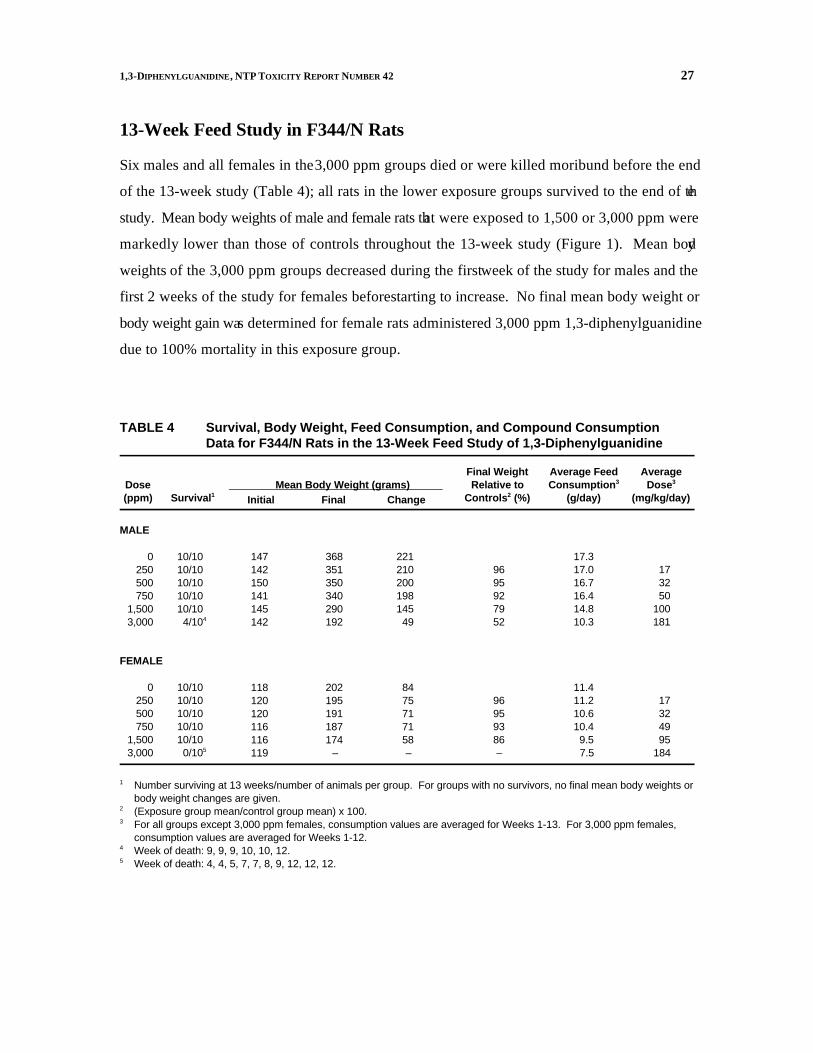
Six males and all females in the 3,000 ppm groups died or were killed moribund before the end
of the 13-week study (Table 4); all rats in the lower exposure groups survived to the end of the
study. Mean body weights of male and female rats that were exposed to 1,500 or 3,000 ppm were
markedly lower than those of controls throughout the 13-week study (Figure 1). Mean body
weights of the 3,000 ppm groups decreased during the first week of the study for males and the
first 2 weeks of the study for females before starting to increase. No final mean body weight or
body weight gain was determined for female rats administered 3,000 ppm 1,3-diphenylguanidine
due to 100% mortality in this exposure group.
TABLE 4 Survival, Body Weight, Feed Consumption, and Compound Consumption Data for F344/N Rats in the 13-Week Feed Study of 1,3-Diphenylguanidine
Dose (ppm) Survival1
Mean Body Weight (grams) Initial Final Change
Final Weight Relative to
Controls (%) 2
Average Feed Consumption3
(g/day)
Average Dose3
(mg/kg/day)
MALE
0 250 500 750
1,500 3,000
10/10 10/10 10/10 10/10 10/10 4/104
147 142 150 141 145 142
368 351 350 340 290 192
221 210 200 198 145 49
96 95 92 79 52
17.3 17.0 16.7 16.4 14.8 10.3
17 32 50
100 181
FEMALE
0 250 500 750
1,500 3,000
10/10 10/10 10/10 10/10 10/10 0/105
118 120 120 116 116 119
202 195 191 187 174
–
84 75 71 71 58 –
96 95 93 86 –
11.4 11.2 10.6 10.4 9.5 7.5
17 32 49 95
184
1 Number surviving at 13 weeks/number of animals per group. For groups with no survivors, no final mean body weights or body weight changes are given.
2 (Exposure group mean/control group mean) x 100. 3 For all groups except 3,000 ppm females, consumption values are averaged for Weeks 1-13. For 3,000 ppm females,
consumption values are averaged for Weeks 1-12. 4 Week of death: 9, 9, 9, 10, 10, 12. 5 Week of death: 4, 4, 5, 7, 7, 8, 9, 12, 12, 12.

28 1,3-DIPHENYLGUANIDINE, NTP TOXICITY REPORT NUMBER 42
FIGURE 1 Body Weights of F344/N Rats Administered 1,3-Diphenylguanidine
in Feed for 13 Weeks

29 1,3-DIPHENYLGUANIDINE, NTP TOXICITY REPORT NUMBER 42
Clinical signs of toxicity were noted primarily in rats in the 1,500 and 3,000 ppm groups beginning
at Week 2. The majority of rats in these groups appeared thin and had ruffled fur, with
discolorations of the tail, ears, and scrotum or vaginal area. Salivation, hypoactivity, and
convulsions and seizures were also observed in some male and female rats in these groups, and
abnormal posture (staggering) was noted in most males and females. Other clinical signs observed
in these groups included hyperactivity, hunched posture, ptosis, ataxia, dyspnea, and bristly hair.
Average feed consumption decreased as exposure concentrations increased above 500 ppm with
feed consumption 34% to 40% less than the controls during the 13-week study period in males and
females that received 3,000 ppm (Table 4). During the first week of the study feed consumption
by groups receiving 3,000 ppm were 57% and 63% lower than control for males and females
respectively, indicating poor palatability at this exposure concentration.
Organ weights for groups receiving 750 ppm or greater were significantly lower than those of the
controls and were the result of low body weights and low feed consumption by these groups rather
than a specific toxic response to 1,3-diphenylguanidine (Table A1).
In general, changes in hematology parameters were limited to rats receiving 1,500 and 3,000 ppm
(Table B1). A mild polycythemia occurred at Day 5 in the 3,000 ppm male and female rats, and
to a lesser extent in the 1,500 ppm females. This was indicated by greater erythrocyte counts,
hematocrit values, and hemoglobin concentrations than controls and would be consistent with a
relative polycythemia related to dehydration and hemoconcentration. There were slightly lower
reticulocyte counts at Day 5 in 3,000 ppm male and female rats and 1,500 ppm females. Other
changes in hematology parameters were minor, sporadic, and did not suggest a treatment effect.
Changes in clinical chemistry parameters occurred primarily in the 1,500 and 3,000 ppm groups,
although some minor changes were observed in other groups (Tables 5 and B2). Greater alkaline
phosphatase activity and bile acid concentration than controls occurred in an exposure-related
manner in male and female rats. Males exhibited greater increases in activity and at earlier time
periods. By Week 13, alkaline phosphatase activity and bile acid concentration were greater than
the controls in all groups of exposed rats; these changes are consistent with cholestasis. The lack
of an increase of alkaline phosphatase activity in groups that received 3,000 ppm was probably

30 1,3-DIPHENYLGUANIDINE, NTP TOXICITY REPORT NUMBER 42
related to inanition and a decreased contribution of the intestinal fraction of alkaline phosphatase
to the total serum activity. Total protein, creatinine, cholesterol, and triglyceride concentrations
in the 1,500 and 3,000 ppm groups were lower than the controls and these differences are
consistent with inanition.
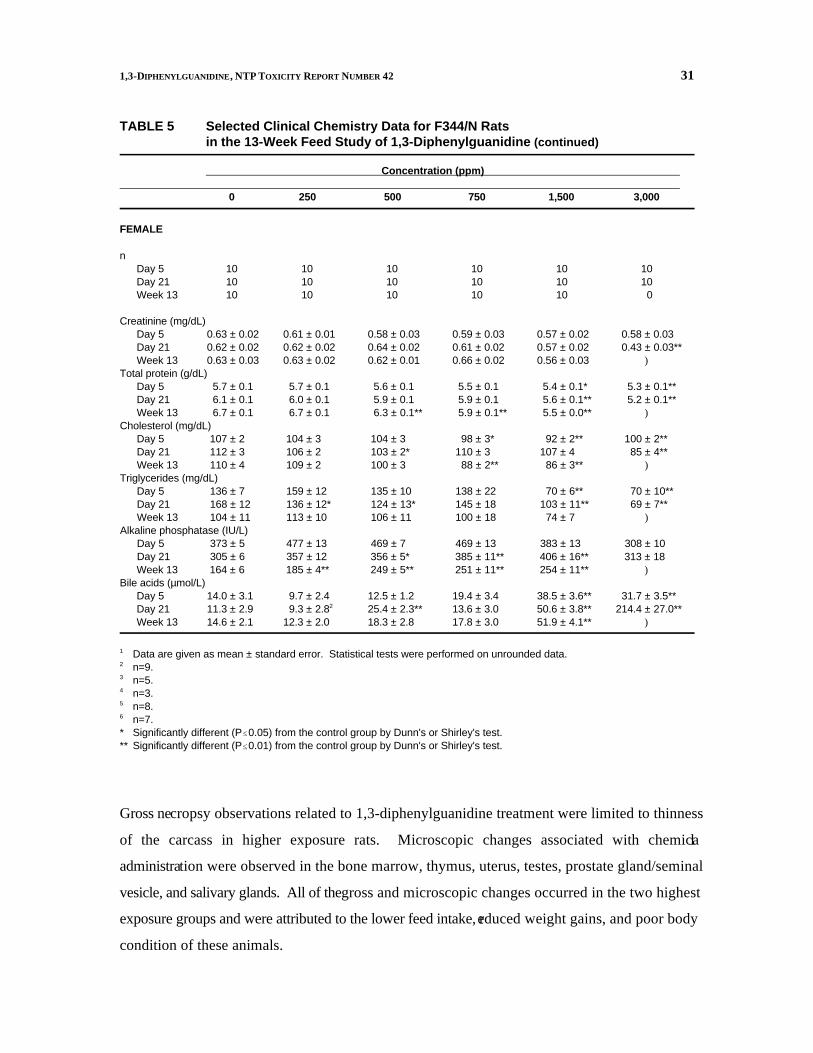
TABLE 5 Selected Clinical Chemistry Data for F344/N Rats in the 13-Week Feed Study of 1,3-Diphenylguanidine1
Concentration (ppm)
0 250 500 750 1,500 3,000
MALE
n Day 5 10 10 10 10 10 10 Day 21 10 10 10 10 10 10 Week 13 10 10 10 10 10 4
Creatinine (mg/dL) Day 5 0.68 ± 0.02 0.62 ± 0.03 0.68 ± 0.01 0.63 ± 0.03 0.65 ± 0.02 0.58 ± 0.01** Day 21 0.80 ± 0.03 0.75 ± 0.02 0.78 ± 0.03 0.76 ± 0.02 0.75 ± 0.02 0.65 ± 0.03** Week 13 0.69 ± 0.02 0.68 ± 0.02 0.65 ± 0.02 0.64 ± 0.02 0.62 ± 0.03* 0.60 ± 0.04*
Total protein (g/dL) Day 5 6.1 ± 0.1 6.0 ± 0.1 6.0 ± 0.1 6.1 ± 0.1 6.1 ± 0.1 5.9 ± 0.1 Day 21 6.4 ± 0.1 6.2 ± 0.1 6.2 ± 0.1 6.2 ± 0.1 6.0 ± 0.1** 5.6 ± 0.1** Week 13 6.8 ± 0.1 6.8 ± 0.1 6.8 ± 0.1 6.7 ± 0.1 6.5 ± 0.1* 5.8 ± 0.2**
Cholesterol (mg/dL) Day 5 100 ± 4 100 ± 2 100 ± 3 91 ± 2* 91 ± 2 92 ± 3 Day 21 93 ± 2 90 ± 2 87 ± 2 88 ± 2 88 ± 2 94 ± 5 Week 13 88 ± 2 87 ± 3 91 ± 2 88 ± 2 78 ± 1** 70 ± 2**
Triglycerides (mg/dL) Day 5 197 ± 11 227 ± 10 197 ± 7 210 ± 9 201 ± 12 105 ± 13** Day 21 316 ± 21 308 ± 19 294 ± 20 301 ± 17 239 ± 26* 133 ± 25** Week 13 237 ± 17 239 ± 17 241 ± 21 262 ± 24 210 ± 18 72 ± 9*
Alkaline phosphatase (IU/L) Day 5 535 ± 17 640 ± 10 710 ± 11** 693 ± 12** 729 ± 11** 517 ± 19 Day 21 391 ± 7 452 ± 6 506 ± 12**2 528 ± 24** 537 ± 21**2 376 ± 18 Week 13 199 ± 7 258 ± 8** 282 ± 7** 291 ± 9** 359 ± 11** 349 ± 31**
Bile acids (µmol/L) Day 5 4.9 ± 1.52 5.0 ± 1.1 6.5 ± 1.2 6.6 ± 1.4 23.6 ± 2.8**2 37.7 ± 4.0** Day 21 5.4 ± 2.33 1.3 ± 0.34 6.4 ± 1.93 7.6 ± 3.93 17.8 ± 4.5*5 75.2 ± 15.4**2
Week 13 5.1 ± 0.8 12.0 ± 1.9**5 13.8 ± 2.4** 11.1 ± 2.5*6 22.8 ± 3.0** 36.0 ± 1.7**4
1,3-DIPHENYLGUANIDINE, NTP TOXICITY REPORT NUMBER 42 31
TABLE 5 Selected Clinical Chemistry Data for F344/N Rats in the 13-Week Feed Study of 1,3-Diphenylguanidine (continued)
Concentration (ppm)
0 250 500 750 1,500 3,000
FEMALE
n Day 5 10 10 10 10 10 10 Day 21 10 10 10 10 10 10 Week 13 10 10 10 10 10 0
Creatinine (mg/dL) Day 5 0.63 ± 0.02 0.61 ± 0.01 0.58 ± 0.03 0.59 ± 0.03 0.57 ± 0.02 0.58 ± 0.03 Day 21 0.62 ± 0.02 0.62 ± 0.02 0.64 ± 0.02 0.61 ± 0.02 0.57 ± 0.02 0.43 ± 0.03** Week 13 0.63 ± 0.03 0.63 ± 0.02 0.62 ± 0.01 0.66 ± 0.02 0.56 ± 0.03 )
Total protein (g/dL) Day 5 5.7 ± 0.1 5.7 ± 0.1 5.6 ± 0.1 5.5 ± 0.1 5.4 ± 0.1* 5.3 ± 0.1** Day 21 6.1 ± 0.1 6.0 ± 0.1 5.9 ± 0.1 5.9 ± 0.1 5.6 ± 0.1** 5.2 ± 0.1** Week 13 6.7 ± 0.1 6.7 ± 0.1 6.3 ± 0.1** 5.9 ± 0.1** 5.5 ± 0.0** )
Cholesterol (mg/dL) Day 5 107 ± 2 104 ± 3 104 ± 3 98 ± 3* 92 ± 2** 100 ± 2** Day 21 112 ± 3 106 ± 2 103 ± 2* 110 ± 3 107 ± 4 85 ± 4** Week 13 110 ± 4 109 ± 2 100 ± 3 88 ± 2** 86 ± 3** )
Triglycerides (mg/dL) Day 5 136 ± 7 159 ± 12 135 ± 10 138 ± 22 70 ± 6** 70 ± 10** Day 21 168 ± 12 136 ± 12* 124 ± 13* 145 ± 18 103 ± 11** 69 ± 7** Week 13 104 ± 11 113 ± 10 106 ± 11 100 ± 18 74 ± 7 )
Alkaline phosphatase (IU/L) Day 5 373 ± 5 477 ± 13 469 ± 7 469 ± 13 383 ± 13 308 ± 10 Day 21 305 ± 6 357 ± 12 356 ± 5* 385 ± 11** 406 ± 16** 313 ± 18 Week 13 164 ± 6 185 ± 4** 249 ± 5** 251 ± 11** 254 ± 11** )
Bile acids (µmol/L) Day 5 14.0 ± 3.1 9.7 ± 2.4 12.5 ± 1.2 19.4 ± 3.4 38.5 ± 3.6** 31.7 ± 3.5** Day 21 11.3 ± 2.9 9.3 ± 2.82 25.4 ± 2.3** 13.6 ± 3.0 50.6 ± 3.8** 214.4 ± 27.0** Week 13 14.6 ± 2.1 12.3 ± 2.0 18.3 ± 2.8 17.8 ± 3.0 51.9 ± 4.1** )
1 Data are given as mean ± standard error. Statistical tests were performed on unrounded data. 2 n=9. 3 n=5. 4 n=3. 5 n=8. 6 n=7. * Significantly different (P 0.05) from the control group by Dunn's or Shirley's test. ** Significantly different (P 0.01) from the control group by Dunn's or Shirley's test.
Gross necropsy observations related to 1,3-diphenylguanidine treatment were limited to thinness
of the carcass in higher exposure rats. Microscopic changes associated with chemical
administration were observed in the bone marrow, thymus, uterus, testes, prostate gland/seminal
vesicle, and salivary glands. All of the gross and microscopic changes occurred in the two highest
exposure groups and were attributed to the lower feed intake, reduced weight gains, and poor body
condition of these animals.

32 1,3-DIPHENYLGUANIDINE, NTP TOXICITY REPORT NUMBER 42
In the thymus, lymphoid depletion and necrosis were present in several 3,000 ppm females which
were found dead or were killed in moribund condition. Depletion of hematopoietic cells in the
femoral bone marrow was also variably present in the 3,000 ppm females which died early. Both
of these lesions are common in moribund animals and are not considered to be direct toxic effects
of chemical administration.
An exposure-related effect in the uterus of females was characterized by an overall reduction in
size and was diagnosed as hypoplasia. This finding occurred with greater incidence and severity
in the three highest exposure groups. In general, this change was attributed to poor body condition
and delayed development due to lower feed consumption; the younger age of those females which
died or were killed during the study may have been a reason for the smaller size of the uterus.
Several lesions were noted sporadically in the reproductive organs of 3,000 ppm males. In two
of ten 3,000 ppm males, lower numbers of mature spermatozoa were present in the seminiferous
tubules than in the controls; lower numbers of spermatozoa were also noted in the epididymal
tubules than in the controls. Secretory depletion of the prostate gland and seminal vesicles was
observed in several 3,000 ppm males; this difference was characterized by alveolar size smaller
than controls and smaller amounts of secretory material within the lumen. Decreased
spermatogenesis and secretory depletion of the accessory sex glands were considered secondary
to poor body condition. In the salivary glands of several 3,000 ppm males and females, a change
diagnosed as cytologic alteration was observed, characterized by smaller size and increased
basophilia of the secretory acini. This change was interpreted to be a reflection of physiological
atrophy due to reduced feed intake. No specific cause of death could be determined for the early
death animals from the 3,000 ppm groups.
Evaluation of male reproductive tissues in groups that received 500, 750, or 1,500 ppm revealed
a significant reduction in sperm motility in 1,500 ppm males (Table C1). Among 750 and 1,500
ppm group females the length of the estrous cycle was greater than the controls (Table C2).

33 1,3-DIPHENYLGUANIDINE, NTP TOXICITY REPORT NUMBER 42
2-Week Feed Study in B6C3F Mice1
All mice survived to the end of the 2-week study (Table 6). The final mean body weight of female
mice in the 3,000 ppm group was 6% lower than the controls; final mean body weights of other
exposed groups were similar to controls. Clinical signs of toxicity were observed in a few female
mice during the latter part of the study; one female in the 1,500 ppm group appeared thin, and one
female each in the 750 and 3,000 ppm groups had hunched posture and appeared thin. As shown
in Table 6, the average amounts of feed consumed by females in the 750 and 1,500 ppm groups
were slightly lower than the control value; the average amounts of feed consumed by all other
exposed groups were similar to control values.
TABLE 6 Survival, Body Weight, Feed Consumption, and Compound Consumption Data for B6C3F Mice in the 2-Week Feed Study of 1,3-Diphenylguanidine1
Dose (ppm) Survival1
Mean Body Weight (grams) Initial Final Change
Final Weight Relative to
Controls (%) 2
Average Feed Consumption3
(g/day)
Average Dose3
(mg/kg/day)
MALE
0 5/5 22.1 24.1 2.0 3.9
250 500 750
1,500 3,000
5/5 5/5 5/5 5/5 5/5
22.1 22.2 22.5 22.5 22.1
24.4 24.7 24.3 24.0 24.0
2.3 2.5 1.8 1.5 1.9
101 102 101 100 100
4.6 4.5 4.3 4.2 4.5
48 92
133 266 573
FEMALE
0 250 500 750
1,500 3,000
5/5 5/5 5/5 5/5 5/5 5/5
18.7 18.2 18.3 18.3 18.4 18.4
21.5 21.2 20.9 21.1 20.6 20.3
2.8 3.0 2.6 2.8 2.2 1.9
99 97 98 96 94
4.7 4.3 4.6 4.1 4.0 4.6
53 112 150 303 691
1 Number surviving at 2 weeks/number of animals per group. 2 (Exposure group mean/control group mean) x 100. 3 Average of individual consumption values for Days 6 and 13.
34 1,3-DIPHENYLGUANIDINE, NTP TOXICITY REPORT NUMBER 42
Only a few significant organ weight changes were observed (data on file at NIEHS). Absolute and
relative liver weights of males and females in the 1,500 and 3,000 ppm groups were lower than
those of the control groups, and the relative heart weight of females in the 500 ppm group was
greater than that of the control group.
No gross or microscopic lesions related to 1,3-diphenylguanidine exposure were observed in male
or female mice.
Because of the absence of chemical related toxicity in this study, the exposure concentrations
selected for the 13-week study in mice were the same as those administered in the 2-week study.
35 1,3-DIPHENYLGUANIDINE, NTP TOXICITY REPORT NUMBER 42
13-Week Feed Study in B6C3F Mice1
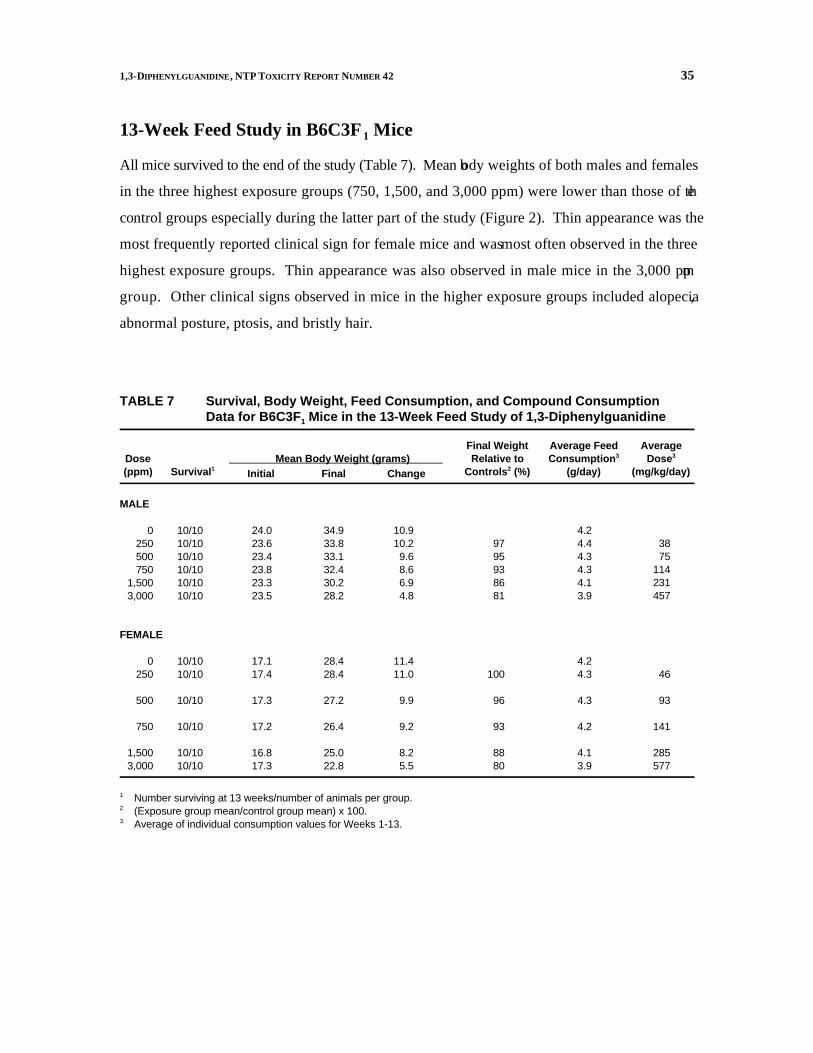
All mice survived to the end of the study (Table 7). Mean body weights of both males and females
in the three highest exposure groups (750, 1,500, and 3,000 ppm) were lower than those of the
control groups especially during the latter part of the study (Figure 2). Thin appearance was the
most frequently reported clinical sign for female mice and was most often observed in the three
highest exposure groups. Thin appearance was also observed in male mice in the 3,000 ppm
group. Other clinical signs observed in mice in the higher exposure groups included alopecia,
abnormal posture, ptosis, and bristly hair.
TABLE 7 Survival, Body Weight, Feed Consumption, and Compound Consumption Data for B6C3F Mice in the 13-Week Feed Study of 1,3-Diphenylguanidine1
Dose (ppm) Survival1
Mean Body Weight (grams) Initial Final Change
Final Weight Relative to
Controls (%) 2
Average Feed Consumption3
(g/day)
Average Dose3
(mg/kg/day)
MALE
0 250 500 750
1,500 3,000
10/10 10/10 10/10 10/10 10/10 10/10
24.0 23.6 23.4 23.8 23.3 23.5
34.9 33.8 33.1 32.4 30.2 28.2
10.9 10.2 9.6 8.6 6.9 4.8
97 95 93 86 81
4.2 4.4 4.3 4.3 4.1 3.9
38 75
114 231 457
FEMALE
0 250
10/10 10/10
17.1 17.4
28.4 28.4
11.4 11.0 100
4.2 4.3 46
500 10/10 17.3 27.2 9.9 96 4.3 93
750 10/10 17.2 26.4 9.2 93 4.2 141
1,500 3,000
10/10 10/10
16.8 17.3
25.0 22.8
8.2 5.5
88 80
4.1 3.9
285 577
1 Number surviving at 13 weeks/number of animals per group. 2 (Exposure group mean/control group mean) x 100. 3 Average of individual consumption values for Weeks 1-13.

36 1,3-DIPHENYLGUANIDINE, NTP TOXICITY REPORT NUMBER 42
FIGURE 2 Body Weights of B6C3F1 Mice Administered 1,3-Diphenylguanidine in Feed for 13 Weeks

37 1,3-DIPHENYLGUANIDINE, NTP TOXICITY REPORT NUMBER 42
The average amounts of feed consumed by males and females in all exposed groups were similar
to the average amounts consumed by the control groups (Table 7).
Significantly lower absolute organ weights and greater relative organ weights than controls were
observed for several organs in the 1,500 or 3,000 ppm groups (Table A2). These differences are
not indicative of a specific toxic response but appear to be the result of the lower body weights of
these groups.
No treatment-related gross or microscopic lesions were observed in male or female mice exposed
to 1,3-diphenylguanidine.
Evaluation of male reproductive tissue from animals revealed greater numbers of spermatid heads
and lower sperm motility than in the controls in the 3,000 ppm group. In females, estrous cycle
length in the 3,000 ppm group was greater than controls (Tables C3 and C4).
Genetic Toxicity Studies
1,3-Diphenylguanidine (1 to 10,000 µg/plate) was mutagenic in Salmonella typhimuriumstrains
TA98 and TA100 in the presence of induced hamster or rat liver S9 (Mortelmans et al., 1986;
Table D1), and an equivocal response was obtained in strain TA1537 with rat liver S9. No
indication of mutagenic activity was noted in the absence of S9.
The frequency of micronucleated normochromatic erythrocytes was determined in peripheral blood
samples obtained from male and female mice administered 1,3-diphenylguanidine in dosed feed
for 90 days. No effect was noted in male mice, but in females, a significant increase in
micronucleated normochromatic erythrocytes was noted in the 750 ppm group (Table D2).
Because the trend test for the female data did not yield a significant P value (P>0.025) and the
increase in micronucleated normochromatic erythrocytes was noted in only one exposure group,
the female mouse data were judged to be equivocal.
39 1,3-DIPHENYLGUANIDINE, NTP TOXICITY REPORT NUMBER 42
DISCUSSION
1,3-Diphenylguanidine (DPG) is used extensively as both a primary and secondary accelerator in
the vulcanization of rubber prepared for the manufacture of tires, footwear, and other molded
products. Human exposure to DPG may occur as a result of dermal contact, inhalation of
particulates, or unintended oral ingestion. Although DPG has been reported to cause contact
dermatitis, it is poorly absorbed through skin. DPG is easily absorbed through the gastrointestinal
tract, and in the present studies it was administered orally in feed to characterize the toxicity
resulting from systemic exposure.
During 2-week studies, rats and mice received feed containing 0, 250, 500, 750, 1,500, or 3,000
ppm DPG. These exposure levels were selected on the basis of acute toxicity data which reported
an oral LD50 values of 300 to 500 mg/kg for rats and 200 to 300 mg/kg for mice. In an
unpublished prechronic study conducted by the Monsanto Company, administration of 3,000 ppm
in the feed for two weeks resulted in the death of 5 rats; no histopathology was conducted, so the
cause of death could not be determined for these animals.
Consumption of feed containing 1,3-diphenylguanidine for 2 weeks was not associated with any
organ specific toxicity in either rats or mice. Lower feed consumption indicative of poor
palatability, especially during the first week of the study, was observed among groups of rats that
received feed containing 750, 1,500, or 3,000 ppm. This resulted in body weights and organ
weights that were lower than the controls particularly for groups that received 3,000 ppm. During
the second week of the study, feed consumption and mean body weights of the 3,000 ppm group
began to increase. Groups of mice that received feed containing 1,3-diphenylguanidine for 2
weeks exhibited only minimal effects of chemical exposure. The final mean body weight of
females that received 3,000 ppm was 6% lower than that of the controls and the mean weight gain
by this group was 32% lower than the weight gain of controls; however, final mean body weights
of other groups were similar to the controls.
The same range of exposure concentrations used in the 2-week studies was selected for the 13
week studies for both rats and mice. The indications of poor palatability of feed containing 3,000
ppm precluded the use of higher concentrations for rats. During the second week of the 2-week
40 1,3-DIPHENYLGUANIDINE, NTP TOXICITY REPORT NUMBER 42
study rats in the 3,000 ppm groups began to consume more feed and gained weight; therefore, it
was judged that over the duration of a 13-week study the body weights could possibly recover
nearly to control body weights. Mice that received 3,000 ppm exhibited only minimally toxic
responses in the 2-week study; however, a doubling of the highest exposure to 6,000 ppm would
probably have resulted in poor palatability and was considered too high for the 13-week study.
During the 13-week study, feed consumption by rats in the 1,500 and 3,000 ppm groups was lower
than in controls and resulted in low body weights and low absolute organ weights. Sixteen rats
receiving 3,000 ppm died or were killed moribund. The lesions present in these animals were
those frequently associated with low body weights and reduced feed consumption; no organ
specific toxicity attributable to 1,3-diphenylguanidine exposure was apparent.
The values of several hematology parameters measured on Day 5 for the 1,500 and 3,000 ppm
groups were consistent with general dehydration, most likely the result of lower water intake
associated with the markedly lower feed consumption of these groups during the first week of the
study. Significantly lower total serum protein, cholesterol, and triglycerides values were observed
in these groups, consistent with lower feed consumption. Alkaline phosphatase activity and bile
acid concentration were significantly greater than the controls for several groups of males and
females, especially at the Day 21 and Week 13 sampling points. High serum concentrations of
normal bile constituents are frequently associated with reduced bile formation and/or flow
(cholestasis). In the absence of chemical-related lesions in the liver which might impair bile
formation, the observation of cholestasis in the groups receiving the highest exposures is probably
associated with lower nutrient and water intake.
Many of the hematology and clinical chemistry differences observed in the present study in F344/N
rats are similar to observations made by Levin et al. (1993) in Sprague-Dawley rats in which feed
was restricted to 25%, 50%, or 75% of control body weights for 15 days. These differences
include reduced organ weights, hematologic differences indicative of hemoconcentration, lower
platelet counts, and greater serum activity of alkaline phosphatase (bile acid concentration was not
measured), lower total serum protein and cholesterol.

41 1,3-DIPHENYLGUANIDINE, NTP TOXICITY REPORT NUMBER 42
In the 13-week study sperm motility of male rats that received 1,500 ppm was significantly lower
than for the controls. Depletion of the prostate gland, hypospermia, and spermatogenic arrest, as
well as significant reductions in the absolute weights of the prostate gland, seminal vesicles, and
testis were observed in male rats that received 3,000 ppm. Chapinet al. (1993a) examined the
effect of feed restriction on reproductive function in Sprague-Dawley rats and observed similar
changes in males in which feed was restricted to 70% of control body weight. In addition, Levin
et al. (1993) noted that mild testicular degeneration was observed in the severely feed restricted
groups.
Uterine hypoplasia, characterized by a reduction in uterine size due to thinner and less developed
endometrium, was observed in female rats in the 750 ppm or greater groups. In addition the mean
length of the estrous cycle in female rats that received 1,500 ppm was significantly greater than the
controls. Although the uterine hypoplasia is probably a consequence of reduced feed consumption
in the 750 ppm or greater groups, Chapin et al. (1993a) observed that feed restriction caused
transient increases in the length of the estrous cycle in Sprague-Dawley rats. Although this
suggests a potential chemical-specific effect, the data from the present study do not allow a more
definitive conclusion.
Consumption of feed containing 1,3-diphenylguanidine for 13 weeks was associated with low body
weights, reduced feed consumption, and low organ weights in the 1,500 and 3,000 ppm groups
of mice but there were no gross or microscopic lesions attributable to chemical exposure.
At the end of the 13-week exposure period, the number of spermatid heads per gram of testis in
the 3,000 ppm group of male mice was greater than the controls but the sperm density (per gram
of cauda) and sperm motility in the 3,000 ppm group were lower than the controls. The
concentration of spermatid heads in the testis is a measure of the ability of the testis to produce
sperm while the density of sperm in the epididymis is a measure of the release of sperm by the
testis. The increase in the number of spermatid heads in the testis coupled with a lower number
of sperm in the epididymis suggests that 1,3-diphenylguanidine does not impair the sperm
formation in the testis but may affect the release of sperm into the epididymis.

42 1,3-DIPHENYLGUANIDINE, NTP TOXICITY REPORT NUMBER 42
®In Swiss (CD-1 ) mice feed restricted to 70% of control body weight for 15 weeks, Chapin et al.
(1993b) observed lower numbers of testicular spermatids and lower epididymal sperm density than
the controls; however, these measures were not reduced by restriction to 80% or 90% of control
body weight. In the present study mean body weights of male mice in the 3,000 ppm group were
generally between 80% to 90% of control and mean feed consumption for the study was 93% of
control. Although this suggests a potential chemical-related effect, the response to feed restriction ®in male B6C3F mice may differ somewhat from that of male Swiss (CD-1) mice. 1
The length of the estrous cycle in female mice that received 3,000 ppm 1,3-diphenylguanidine was
longer than that of the controls. Chapinet al. (1993b) observed a similar lengthening of the estrous ®cycle in female Swiss (CD-1 ) mice restricted to 70% or 80% of control body weight. Therefore,
the lengthening of the estrous cycle observed in the 3,000 ppm group appears to be a consequence
of the low body weights and reduced feed consumption of this group rather than a chemical-related
effect.
Bempong and Hall (1983) reported significantly lower testicular weight, sperm count, and greater
numbers of morphologically anomalous sperm in male mice (C57BL/J6 X DBA) and hamsters2
given 4 or 8 mg 1,3-diphenylguanidine per kg body weight per day ad libitum in drinking water
acidified with 0.25% acetic acid for 15 weeks. Testis weights in the 8 mg/kg group were lower
than the controls after 5 weeks of chemical exposure. Unfortunately no water consumption or
body weight data were reported so it is unclear whether water or feed consumption was reduced
in this study. In the present studies male mice in the 3,000 ppm group ingested an average of 457
mg of 1,3-diphenylguanidine per kg body weight per day during the 13-week study; however, testis
weight and sperm density were slightly but not significantly lower than those of the controls. Since
mice received a significantly greater exposure to 1,3-diphenylguanidine in the present study than
in the study by Bempong and Hall, it is difficult to reconcile the different outcomes of the two
studies without more information.
In summary, consumption of feed containing 1,3-diphenylguanidine for 2 weeks or 13 weeks was
not associated with any histologic response that could be attributed to chemical exposure. Instead
the observed changes were indicative of reduced nutrient intake and are consistent with similar
changes observed in other studies of feed restricted rats and mice.

43 1,3-DIPHENYLGUANIDINE, NTP TOXICITY REPORT NUMBER 42
REFERENCES
BEMPONG, M. A., AND HALL, E. V. (1983). Reproductive toxicology of 1,3-diphenylguanidine: Analysis
of induced sperm abnormalities in mice and hamsters and reproductive consequences in mice. J.
Toxicol. Environ. Health 11, 869-878.
BEMPONG, M. A., AND MCCOY, R. (1972). Cytostaticity and mutagenicity of 1,3-diphenylguanidine.
Newslett. Environ. Mutagen. Soc. 5, 28-31.
BEMPONG, M. A., AND MANTLEY, R. (1985). Body fluid analysis of 1,3-diphenylguanidine fo r
mutagenicity as detected by Salmonella strains. J. Environ. Pathol. Toxicol. Oncol. 6, 293-302.
BOORMAN, G. A., MONTGOMERY, C. A., JR., EUSTIS, S. L., WOLFE, M. J., MCCONNELL, E. E., AND
HARDISTY, J. F. (1985). Quality assurance in pathology for rodent carcinogenicity studies. I n
Handbook of Carcinogen Testing (H. A. Milman and E. K. Weisburger, Eds.), pp. 345-357. Noyes
Publications, Park Ridge, NJ.
BOORMAN, G. A., HICKMAN, R. L., DAVIS, G. W., RHODE, L. S., WHITE, N. W., GRIFFIN, T. A., MAYO,
J., AND HAMM, T. E., JR. (1986). Serological titers to murine viruses in 90-day and 2-year studies.
In Complications of Viral and Mycoplasmal Infections in Rodents to Toxicology Research and
Testing (T. E. Hamm, Jr., Ed.), pp. 11-23. Hemisphere, New York.
BUXTON, P. K., GOING, S. M., HUNTER, J. A., AND WINNEY, R. J. (1983). Allergic reaction to rubber
chemicals in hemodialysis equipment. Br. J. Chem. Res. Educ. 287, 1513-1514.
CHAPIN, R. E., GULATI, D. K., BARNES, L. H., AND TEAGUE, J. L. (1993a). The effects of feed restriction
on reproductive function in Sprague-Dawley rats. Fundam. Appl. Toxicol., 20, 23-29.
CHAPIN, R. E., GULATI, D. K., FAIL, P. A., HOPE, E., RUSSEL, S. R., HEINDEL, J. J., GEORGE, J. D.,
GRIZZLE, T. B., AND TEAGUE, J. L. (1993b). The effects of feed restriction on reproductive function
in Swiss CD-1 mice. Fundam. Appl. Toxicol. 20, 15-22.

44 1,3-DIPHENYLGUANIDINE, NTP TOXICITY REPORT NUMBER 42
CODE OF FEDERAL REGULATIONS (CFR), 21, Part 58. Good Laboratory Practice for Nonclinica l
Laboratory Studies.
CREBELLI, R., PAOLETTI, A., FALCONE, E., AQUILINA, G., FABRI, G., AND CARERE, A. (1985).
Mutagenicity studies in a tyre plant: in vitro activity of workers' urinary concentrates and ra w
materials. Br. J. Ind. Med. 42, 481-487.
DIXON, W., AND MASSEY, F. (1951). Introduction to Statistical Analysis, 1st ed., pp. 145-147.
McGraw-Hill, New York.
DONNER, M., HUSGAFVEL-PURSIAINEN, K., JENSSEN, D., AND RANNUG, A. (1983). Mutagenicity of
rubber additives and curing fumes. Scand. J. Work Environ. Health 9 (Suppl. 2), 27-37.
DUNN, O. J. (1964). Multiple comparisons using rank sums. Technometrics 6, 241-252.
DUNNETT, C. W. (1955). A multiple comparison procedure for comparing several treatments with a
control. J. Am. Stat. Assoc. 50, 1095-1121.
HAWORTH, S., LAWLOR, T., MORTELMANS, K., SPECK, W., AND ZEIGER, E. (1983). Salmonella
mutagenicity test results for 250 chemicals. Environ. Mutagen. 5, 3-142.
IOANNOU, Y. M., AND MATTHEWS, H. B. (1984). Absorption, distribution, metabolism, and excretion
of 1,3-diphenylguanidine in the male F344 rat. Fundam. Appl. Toxicol. 4, 22-29.
JONCKHEERE, A. R. (1954). A distribution-free k-sample test against ordered alternatives. Biometrika
41, 133-145.
KIRK-OTHMER ENCYCLOPEDIA OF CHEMICAL TECHNOLOGY (1982). 3rd ed., Vol. 20, John Wiley and
Sons, New York.
KOËTER, H. B., RÉGNIER, J.-F., AND VAN MARWIJK, M. W. (1992). Effect of oral administration of
1,3-diphenylguanidine on sperm morphology and male fertility in mice. Toxicology 71, 173-179.

45 1,3-DIPHENYLGUANIDINE, NTP TOXICITY REPORT NUMBER 42
LEVIN, S., SEMLER, D., AND RUBEN Z. (1993). Effects of two weeks of feed restriction on some common
toxicologic parameters in Sprague-Dawley rats. Toxicol. Pathol. 21(1), 1-14.
MACGREGOR, J. T., WEHR, C. M., HENIKA, P. R., AND SHELBY, M. D. (1990). The in vivo erythrocyte
micronucleus test: Measurement at steady state increases assay efficiency and permits integration
with toxicity studies. Fundam. Appl. Toxicol. 14, 513-522.
MARONPOT,R. R., AND BOORMAN, G. A. (1982). Interpretation of rodent hepatocellular proliferative
alterations and hepatocellular tumors in chemical safety assessment. Toxicol. Pathol. 10, 71-80.
THE MERCK INDEX (1983). 10th ed. (M. Windholz, Ed.), p. 486. Merck and Company, Rahway, NJ.
MONSANTO COMPANY (1986). Report: Material safety data for DPG accelerator. St. Louis, MO.
MORRISON, D. F. (1976). Multivariate Statistical Methods, pp. 170-179. McGraw-Hill, New York.
MORTELMANS, K., HAWORTH, S., LAWLOR, T., SPECK, W., TAINER, B., AND ZEIGER, E. (1986).
Salmonella mutagenicity tests: II. Results from the testing of 270 chemicals. Environ. Mutagen.
8 (Suppl. 7), 1-119.
NATIONAL INSTITUTE FOR OCCUPATIONAL SAFETY AND HEALTH (NIOSH) (1990). National
Occupational Exposure Survey (1981 to 1983), unpublished provisional data as of July 1, 1990 .
Cincinnati, OH.
NATIONAL TOXICOLOGY PROGRAM (NTP) (1987). Technical Protocol for Sperm Morphology an d
Vaginal Cytology Evaluations in Toxicity Testing for Rats and Mice, 10/31/82 version (update d
December 1987). Research Triangle Park, NC.
NATIONAL TOXICOLOGY PROGRAM (NTP) (1988). NTP executive summary of data for 1,3-diphenyl
guanidine. Research Triangle Park, NC.

46 1,3-DIPHENYLGUANIDINE, NTP TOXICITY REPORT NUMBER 42
RANNUG, A., RANNUG, U., AND RAMEL, C. (1984). Genotoxic effects of additives in syntheti c
elastomers with special consideration to the mechanism of act ion of thiurames and dithiocarbamates.
Prog. Clin. Biol. Res. 141, 407-419.
RAO, G. N., HASEMAN, J. K., AND EDMONDSON, J. (1989a). Influence of viral infections on body weight,
survival, and tumor prevalence in Fischer 344/NCr rats on two-year studies. Lab. Anim. Sci. 39,
389-393.
RAO, G. N., PIEGORSCH, W. W., CRAWFORD, D. D., EDMONDSON, J., AND HASEMAN, J. K. (1989b).
Influence of viral infections on body weight, survival, and tumor prevalence of B6C3F (C57BL/6N1
× C3H/HeN) mice in carcinogenicity studies. Fundam. Appl. Toxicol. 13, 156-164.
SADTLER STANDARD SPECTRA. IR No. 1337, NMR No. 97M, UV No. 396. Sadtler Researc h
Laboratories, Philadelphia, PA.
SCHMID, W. (1976). The micronucleus test for cytogenetic analysis. In Chemical Mutagens. Principles
and Methods for Their Detection, Vol. 4 (A. Hollaender, Ed.), pp. 31-53. Plenum Press, New York.
SHAH, P. V., SUMLER, M. R., IOANNOU, Y. M., FISHER, H. L., AND HALL, L. L. (1985). Dermal
absorption and disposition of 1,3-diphenylguanidine in rats. J. Toxicol. Environ. Health 15, 623
633.
SHIRLEY, E. (1977). A non-parametric equivalent of Williams' test for contrasting increasing dose levels
of a treatment. Biometrics 33, 386-389.
UNITED STATES INTERNATIONAL TRADE COMMISSION (USITC) (1988). Synthetic Organic Chemicals:
Production and Sales, 1981-1988. U.S. Gov. Printing Office, Washington, DC.
WILLIAMS, D. A. (1971). A test for differences between treatment means when several dose levels are
compared with a zero dose control. Biometrics 27, 103-117.
WILLIAMS, D. A. (1972). The comparison of several dose levels with a zero dose control. Biometrics
28, 519-531.

47 1,3-DIPHENYLGUANIDINE, NTP TOXICITY REPORT NUMBER 42
WILLIAMS,T. M., HICKEY, J. L. S., AND BISHOP, C. C. (1985). Health hazard evaluation report HETA
83-196-1492, Goodyear Tire and Rubber Co., Gadsden, AL. Govt. Reports Announcements and
Index (GRA=I), Issue 21.
YASUDA, Y., AND TANIMURA, T. (1980). Effect of diphenylguanidine on development of mouse fetuses.
J. Environ. Pathol. Toxicol. 4, 451-456.
ZEIGER, E., ANDERSON, B., HAWORTH, S., LAWLOR, T., AND MORTELMANS, K. (1988). Salmonella
mutagenicity tests: IV. Results from the testing of 300 chemicals. Environ. Mol. Mutagen. 11
(Suppl. 12), 1-158.
ZIMMERING, S., MASON, J. M., VALENCIA, R., AND WOODRUFF, R. C. (1985). Chemical mutagenesis
testing in Drosophila. II. Results of 20 coded compounds tested for the National Toxicolog y
Program. Environ. Mutagen. 7, 87-100.

48 1,3-DIPHENYLGUANIDINE, NTP TOXICITY REPORT NUMBER 42
A-1 1,3-DIPHENYLGUANIDINE, NTP TOXICITY REPORT NUMBER 42
APPENDIX A
Organ Weights and Organ-Weight-to-Body-Weight Ratios
Table A1 Organ Weights and Organ-Weight-to-Body-Weight Ratios for F344/N Rats in the 13-Week Feed Study of 1,3-Diphenylguanidine . . . . . . . . . . . . . . . . . . . . . . . . . . . . . . . . A-2
Table A2 Organ Weights and Organ-Weight-to-Body-Weight Ratios for B6C3F Mice in the 13-Week Feed Study of 1,3-Diphenylguanidine . . . . . . . . . . . . . . . . . . . . . . . . . . . . . . . A-4 1
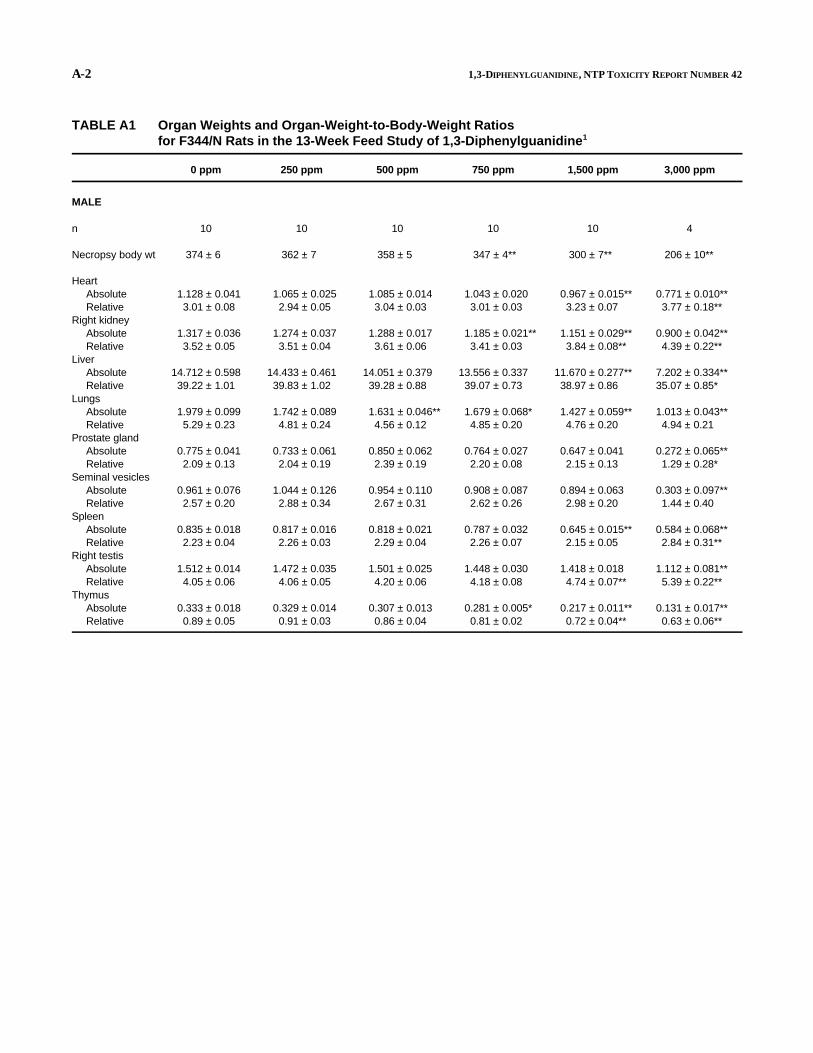
A-2 1,3-DIPHENYLGUANIDINE, NTP TOXICITY REPORT NUMBER 42
TABLE A1 Organ Weights and Organ-Weight-to-Body-Weight Ratios for F344/N Rats in the 13-Week Feed Study of 1,3-Diphenylguanidine1
0 ppm 250 ppm 500 ppm 750 ppm 1,500 ppm 3,000 ppm
MALE
n 10 10 10 10 10 4
Necropsy body wt 374 ± 6 362 ± 7 358 ± 5 347 ± 4** 300 ± 7** 206 ± 10**
Heart Absolute 1.128 ± 0.041 1.065 ± 0.025 1.085 ± 0.014 1.043 ± 0.020 0.967 ± 0.015** 0.771 ± 0.010** Relative 3.01 ± 0.08 2.94 ± 0.05 3.04 ± 0.03 3.01 ± 0.03 3.23 ± 0.07 3.77 ± 0.18**
Right kidney Absolute 1.317 ± 0.036 1.274 ± 0.037 1.288 ± 0.017 1.185 ± 0.021** 1.151 ± 0.029** 0.900 ± 0.042** Relative 3.52 ± 0.05 3.51 ± 0.04 3.61 ± 0.06 3.41 ± 0.03 3.84 ± 0.08** 4.39 ± 0.22**
Liver Absolute 14.712 ± 0.598 14.433 ± 0.461 14.051 ± 0.379 13.556 ± 0.337 11.670 ± 0.277** 7.202 ± 0.334** Relative 39.22 ± 1.01 39.83 ± 1.02 39.28 ± 0.88 39.07 ± 0.73 38.97 ± 0.86 35.07 ± 0.85*
Lungs Absolute 1.979 ± 0.099 1.742 ± 0.089 1.631 ± 0.046** 1.679 ± 0.068* 1.427 ± 0.059** 1.013 ± 0.043** Relative 5.29 ± 0.23 4.81 ± 0.24 4.56 ± 0.12 4.85 ± 0.20 4.76 ± 0.20 4.94 ± 0.21
Prostate gland Absolute 0.775 ± 0.041 0.733 ± 0.061 0.850 ± 0.062 0.764 ± 0.027 0.647 ± 0.041 0.272 ± 0.065** Relative 2.09 ± 0.13 2.04 ± 0.19 2.39 ± 0.19 2.20 ± 0.08 2.15 ± 0.13 1.29 ± 0.28*
Seminal vesicles Absolute 0.961 ± 0.076 1.044 ± 0.126 0.954 ± 0.110 0.908 ± 0.087 0.894 ± 0.063 0.303 ± 0.097** Relative 2.57 ± 0.20 2.88 ± 0.34 2.67 ± 0.31 2.62 ± 0.26 2.98 ± 0.20 1.44 ± 0.40
Spleen Absolute 0.835 ± 0.018 0.817 ± 0.016 0.818 ± 0.021 0.787 ± 0.032 0.645 ± 0.015** 0.584 ± 0.068** Relative 2.23 ± 0.04 2.26 ± 0.03 2.29 ± 0.04 2.26 ± 0.07 2.15 ± 0.05 2.84 ± 0.31**
Right testis Absolute 1.512 ± 0.014 1.472 ± 0.035 1.501 ± 0.025 1.448 ± 0.030 1.418 ± 0.018 1.112 ± 0.081** Relative 4.05 ± 0.06 4.06 ± 0.05 4.20 ± 0.06 4.18 ± 0.08 4.74 ± 0.07** 5.39 ± 0.22**
Thymus Absolute 0.333 ± 0.018 0.329 ± 0.014 0.307 ± 0.013 0.281 ± 0.005* 0.217 ± 0.011** 0.131 ± 0.017** Relative 0.89 ± 0.05 0.91 ± 0.03 0.86 ± 0.04 0.81 ± 0.02 0.72 ± 0.04** 0.63 ± 0.06**

A-3 1,3-DIPHENYLGUANIDINE, NTP TOXICITY REPORT NUMBER 42
TABLE A1 Organ Weights and Organ-Weight-to-Body-Weight Ratios for F344/N Rats in the 13-Week Feed Study of 1,3-Diphenylguanidine (continued)
0 ppm 250 ppm 500 ppm 750 ppm 1,500 ppm 3,000 ppm
FEMALE
n 10 10 10 10 10 0
Necropsy body wt 204 ± 4 200 ± 3 195 ± 3 191 ± 3** 177 ± 2** )
Heart Absolute 0.726 ± 0.017 0.708 ± 0.015 0.693 ± 0.009 0.671 ± 0.016* 0.628 ± 0.012** ) Relative 3.55 ± 0.07 3.54 ± 0.06 3.56 ± 0.07 3.52 ± 0.07 3.55 ± 0.05 )
Right kidney Absolute 0.743 ± 0.016 0.724 ± 0.0142 0.724 ± 0.021 0.691 ± 0.017 0.690 ± 0.021 ) Relative 3.64 ± 0.07 3.66 ± 0.072 3.71 ± 0.08 3.62 ± 0.04 3.89 ± 0.09* )
Liver Absolute 6.487 ± 0.090 6.520 ± 0.161 6.601 ± 0.150 5.922 ± 0.134* 5.614 ± 0.129** ) Relative 31.82 ± 0.67 32.66 ± 0.81 33.83 ± 0.53 31.03 ± 0.52 31.70 ± 0.53 )
Lungs Absolute 1.325 ± 0.039 1.188 ± 0.043 1.179 ± 0.049 1.212 ± 0.056 1.050 ± 0.030** ) Relative 6.51 ± 0.23 5.96 ± 0.25 6.05 ± 0.26 6.35 ± 0.29 5.93 ± 0.16 )
Ovaries Absolute 0.106 ± 0.005 0.106 ± 0.003 0.117 ± 0.007 0.093 ± 0.003 0.095 ± 0.004 ) Relative 0.52 ± 0.03 0.53 ± 0.01 0.60 ± 0.04 0.49 ± 0.02 0.54 ± 0.02 )
Spleen Absolute 0.461 ± 0.016 0.434 ± 0.015 0.480 ± 0.009 0.462 ± 0.009 0.458 ± 0.012 ) Relative 2.26 ± 0.08 2.17 ± 0.06 2.46 ± 0.04 2.42 ± 0.05 2.59 ± 0.06** )
Thymus Absolute 0.236 ± 0.008 0.219 ± 0.005 0.224 ± 0.008 0.227 ± 0.007 0.229 ± 0.012 ) Relative 1.15 ± 0.03 1.10 ± 0.02 1.15 ± 0.04 1.19 ± 0.04 1.29 ± 0.06 )
1 Organ weights and body weights are given in grams; relative organ weights (organ-weight-to-body-weight ratios) are given as mg organ weight/g body weight (mean ± standard error).
2 n=9. * Significantly different (P 0.05) from the control group by Dunnett's test. ** Significantly different (P 0.01) from the control group by Dunnett's test.

A-4 1,3-DIPHENYLGUANIDINE, NTP TOXICITY REPORT NUMBER 42
TABLE A2 Organ Weights and Organ-Weight-to-Body-Weight Ratios for B6C3F Mice in the 13-Week Feed Study of 1,3-Diphenylguanidine1
1
0 ppm 250 ppm 500 ppm 750 ppm 1,500 ppm 3,000 ppm
MALE
n 10 10 10 10 10 10
Necropsy body wt 35.9 ± 0.6 34.7 ± 0.7 34.4 ± 0.6 33.8 ± 0.6* 31.5 ± 0.5** 29.1 ± 0.3**
Heart Absolute 0.164 ± 0.002 0.164 ± 0.004 0.167 ± 0.005 0.157 ± 0.003 0.150 ± 0.003* 0.150 ± 0.003* Relative 4.58 ± 0.07 4.73 ± 0.09 4.88 ± 0.19 4.67 ± 0.08 4.78 ± 0.08 5.15 ± 0.11**
Right kidney Absolute 0.302 ± 0.008 0.305 ± 0.004 0.293 ± 0.007 0.290 ± 0.008 0.274 ± 0.009* 0.242 ± 0.004** Relative 8.43 ± 0.19 8.82 ± 0.15 8.51 ± 0.22 8.59 ± 0.25 8.72 ± 0.27 8.34 ± 0.13
Liver Absolute 1.614 ± 0.050 1.621 ± 0.068 1.760 ± 0.036 1.611 ± 0.055 1.640 ± 0.047 1.377 ± 0.041** Relative 44.98 ± 1.18 46.58 ± 1.30 51.19 ± 1.10** 47.73 ± 1.55 52.09 ± 0.85** 47.35 ± 1.33
Lungs Absolute 0.229 ± 0.007 0.234 ± 0.015 0.245 ± 0.012 0.245 ± 0.013 0.240 ± 0.013 0.250 ± 0.014 Relative 6.42 ± 0.26 6.74 ± 0.40 7.14 ± 0.39 7.27 ± 0.41 7.64 ± 0.42 8.62 ± 0.50**
Prostate gland Absolute 0.065 ± 0.007 0.061 ± 0.005 0.059 ± 0.006 0.073 ± 0.007 0.076 ± 0.0082 0.058 ± 0.005 Relative 1.81 ± 0.18 1.76 ± 0.16 1.70 ± 0.15 2.16 ± 0.21 2.38 ± 0.262 1.98 ± 0.16
Seminal vesicles Absolute 0.361 ± 0.018 0.318 ± 0.024 0.340 ± 0.015 0.318 ± 0.016 0.321 ± 0.015 0.259 ± 0.018** Relative 10.08 ± 0.55 9.19 ± 0.73 9.93 ± 0.55 9.42 ± 0.48 10.19 ± 0.44 8.91 ± 0.59
Spleen Absolute 0.075 ± 0.0032 0.074 ± 0.002 0.078 ± 0.001 0.075 ± 0.002 0.069 ± 0.002 0.069 ± 0.002 Relative 2.10 ± 0.062 2.14 ± 0.05 2.26 ± 0.06 2.24 ± 0.06 2.20 ± 0.04 2.39 ± 0.07**
Right testis Absolute 0.127 ± 0.004 0.132 ± 0.002 0.128 ± 0.003 0.128 ± 0.003 0.124 ± 0.005 0.120 ± 0.0032
Relative 3.54 ± 0.09 3.81 ± 0.09 3.73 ± 0.11 3.78 ± 0.09 3.93 ± 0.13* 4.16 ± 0.12**2
Thymus Absolute 0.047 ± 0.003 0.045 ± 0.003 0.046 ± 0.004 0.051 ± 0.005 0.047 ± 0.006 0.046 ± 0.002 Relative 1.31 ± 0.07 1.29 ± 0.09 1.32 ± 0.10 1.50 ± 0.14 1.48 ± 0.17 1.58 ± 0.06
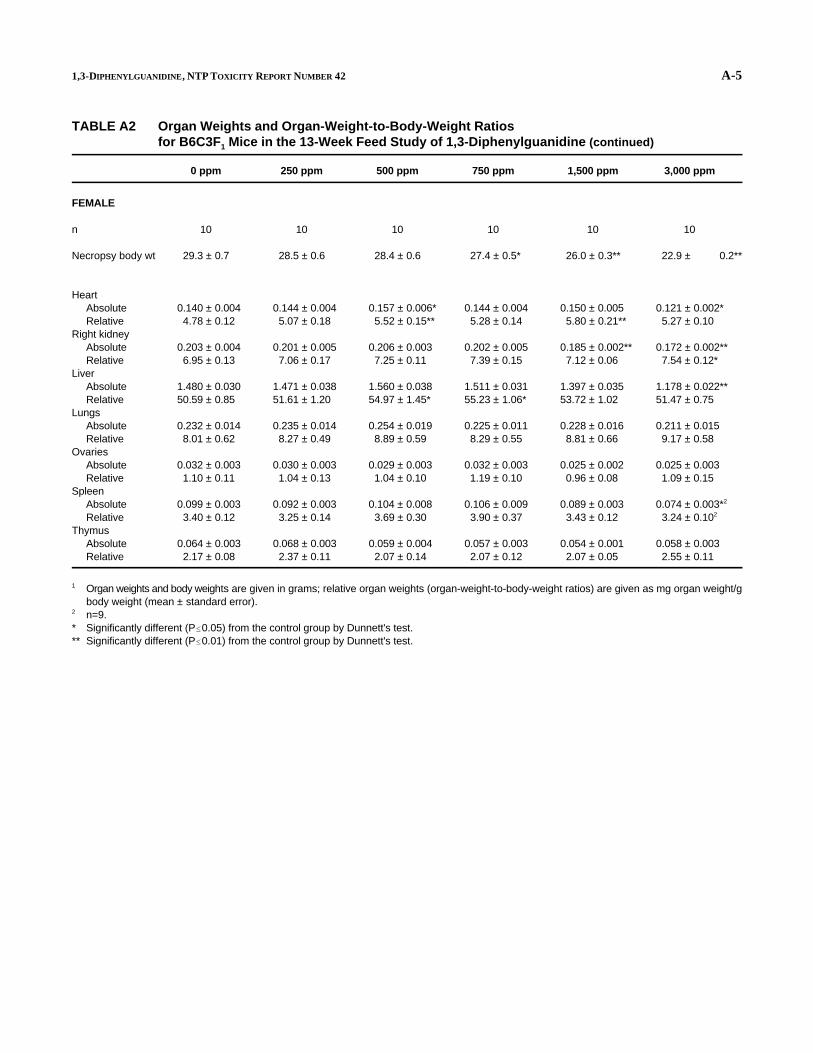
A-5 1,3-DIPHENYLGUANIDINE, NTP TOXICITY REPORT NUMBER 42
TABLE A2 Organ Weights and Organ-Weight-to-Body-Weight Ratios for B6C3F Mice in the 13-Week Feed Study of 1,3-Diphenylguanidine (continued)1
0 ppm 250 ppm 500 ppm 750 ppm 1,500 ppm 3,000 ppm
FEMALE
n 10 10 10 10 10 10
Necropsy body wt 29.3 ± 0.7 28.5 ± 0.6 28.4 ± 0.6 27.4 ± 0.5* 26.0 ± 0.3** 22.9 ± 0.2**
Heart Absolute 0.140 ± 0.004 0.144 ± 0.004 0.157 ± 0.006* 0.144 ± 0.004 0.150 ± 0.005 0.121 ± 0.002* Relative 4.78 ± 0.12 5.07 ± 0.18 5.52 ± 0.15** 5.28 ± 0.14 5.80 ± 0.21** 5.27 ± 0.10
Right kidney Absolute 0.203 ± 0.004 0.201 ± 0.005 0.206 ± 0.003 0.202 ± 0.005 0.185 ± 0.002** 0.172 ± 0.002** Relative 6.95 ± 0.13 7.06 ± 0.17 7.25 ± 0.11 7.39 ± 0.15 7.12 ± 0.06 7.54 ± 0.12*
Liver Absolute 1.480 ± 0.030 1.471 ± 0.038 1.560 ± 0.038 1.511 ± 0.031 1.397 ± 0.035 1.178 ± 0.022** Relative 50.59 ± 0.85 51.61 ± 1.20 54.97 ± 1.45* 55.23 ± 1.06* 53.72 ± 1.02 51.47 ± 0.75
Lungs Absolute 0.232 ± 0.014 0.235 ± 0.014 0.254 ± 0.019 0.225 ± 0.011 0.228 ± 0.016 0.211 ± 0.015 Relative 8.01 ± 0.62 8.27 ± 0.49 8.89 ± 0.59 8.29 ± 0.55 8.81 ± 0.66 9.17 ± 0.58
Ovaries Absolute 0.032 ± 0.003 0.030 ± 0.003 0.029 ± 0.003 0.032 ± 0.003 0.025 ± 0.002 0.025 ± 0.003 Relative 1.10 ± 0.11 1.04 ± 0.13 1.04 ± 0.10 1.19 ± 0.10 0.96 ± 0.08 1.09 ± 0.15
Spleen Absolute 0.099 ± 0.003 0.092 ± 0.003 0.104 ± 0.008 0.106 ± 0.009 0.089 ± 0.003 0.074 ± 0.003*2
Relative 3.40 ± 0.12 3.25 ± 0.14 3.69 ± 0.30 3.90 ± 0.37 3.43 ± 0.12 3.24 ± 0.102
Thymus Absolute 0.064 ± 0.003 0.068 ± 0.003 0.059 ± 0.004 0.057 ± 0.003 0.054 ± 0.001 0.058 ± 0.003 Relative 2.17 ± 0.08 2.37 ± 0.11 2.07 ± 0.14 2.07 ± 0.12 2.07 ± 0.05 2.55 ± 0.11
1 Organ weights and body weights are given in grams; relative organ weights (organ-weight-to-body-weight ratios) are given as mg organ weight/g body weight (mean ± standard error).
2 n=9. * Significantly different (P 0.05) from the control group by Dunnett's test. ** Significantly different (P 0.01) from the control group by Dunnett's test.

A-6 1,3-DIPHENYLGUANIDINE, NTP TOXICITY REPORT NUMBER 42

1,3-DIPHENYLGUANIDINE, NTP TOXICITY REPORT NUMBER 42 B-1
APPENDIX B
Hematology and Clinical Chemistry Results
Table B1
Table B2
Hematology Data for F344/N Rats in the 13-Week Feed Study of 1,3-Diphenylguanidine . . . . . . . . . . . . . . . . . . . . . . . . . . . . . . . . . . . . . . . . . . . . . . . . . . . . . . . . . . .
Clinical Chemistry Data for F344/N Rats in the 13-Week Feed Study of 1,3-Diphenylguanidine . . . . . . . . . . . . . . . . . . . . . . . . . . . . . . . . . . . . . . . . . . . . . . . . . . . . . . . . . . .
B-2
B-5
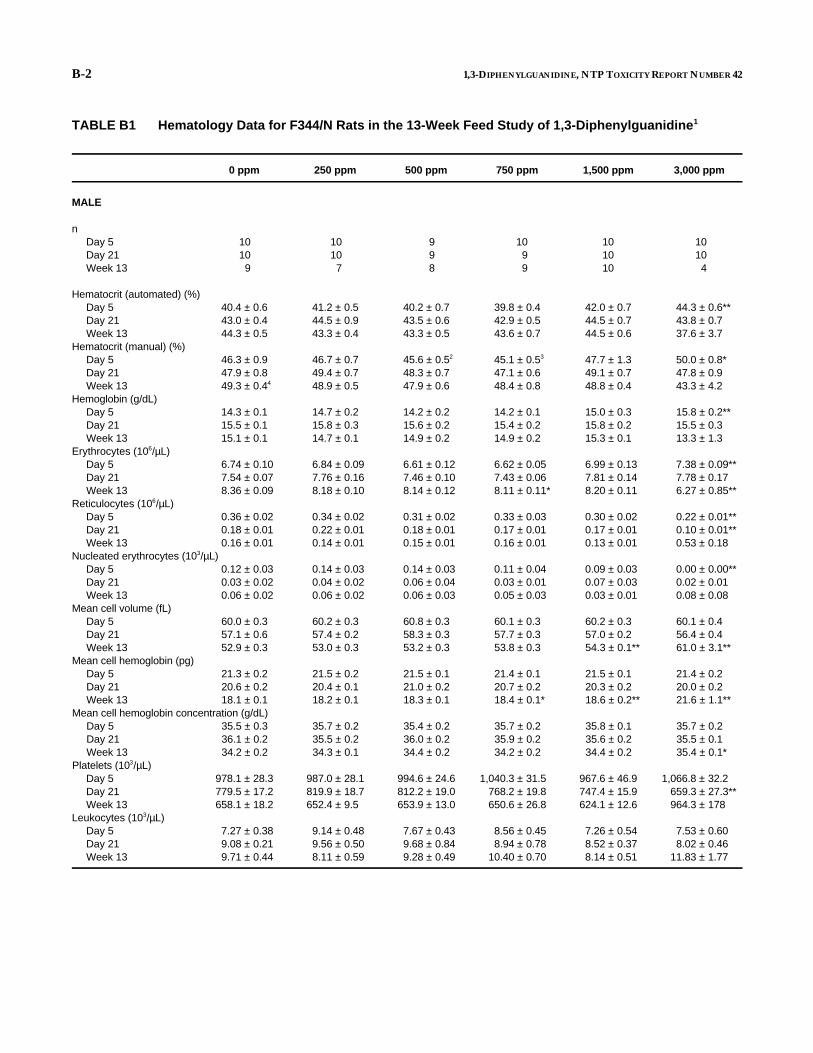
B-2 1,3-DIPHENYLGUANIDINE, NTP TOXICITY REPORT NUMBER 42
TABLE B1 Hematology Data for F344/N Rats in the 13-Week Feed Study of 1,3-Diphenylguanidine1
0 ppm 250 ppm 500 ppm 750 ppm 1,500 ppm 3,000 ppm
MALE
n Day 5 10 10 9 10 10 10 Day 21 10 10 9 9 10 10 Week 13 9 7 8 9 10 4
Hematocrit (automated) (%) Day 5 40.4 ± 0.6 41.2 ± 0.5 40.2 ± 0.7 39.8 ± 0.4 42.0 ± 0.7 44.3 ± 0.6** Day 21 43.0 ± 0.4 44.5 ± 0.9 43.5 ± 0.6 42.9 ± 0.5 44.5 ± 0.7 43.8 ± 0.7 Week 13 44.3 ± 0.5 43.3 ± 0.4 43.3 ± 0.5 43.6 ± 0.7 44.5 ± 0.6 37.6 ± 3.7
Hematocrit (manual) (%) Day 5 46.3 ± 0.9 46.7 ± 0.7 45.6 ± 0.52 45.1 ± 0.53 47.7 ± 1.3 50.0 ± 0.8* Day 21 47.9 ± 0.8 49.4 ± 0.7 48.3 ± 0.7 47.1 ± 0.6 49.1 ± 0.7 47.8 ± 0.9 Week 13 49.3 ± 0.44 48.9 ± 0.5 47.9 ± 0.6 48.4 ± 0.8 48.8 ± 0.4 43.3 ± 4.2
Hemoglobin (g/dL) Day 5 14.3 ± 0.1 14.7 ± 0.2 14.2 ± 0.2 14.2 ± 0.1 15.0 ± 0.3 15.8 ± 0.2** Day 21 15.5 ± 0.1 15.8 ± 0.3 15.6 ± 0.2 15.4 ± 0.2 15.8 ± 0.2 15.5 ± 0.3 Week 13 15.1 ± 0.1 14.7 ± 0.1 14.9 ± 0.2 14.9 ± 0.2 15.3 ± 0.1 13.3 ± 1.3
Erythrocytes (10 /µL)6
Day 5 6.74 ± 0.10 6.84 ± 0.09 6.61 ± 0.12 6.62 ± 0.05 6.99 ± 0.13 7.38 ± 0.09** Day 21 7.54 ± 0.07 7.76 ± 0.16 7.46 ± 0.10 7.43 ± 0.06 7.81 ± 0.14 7.78 ± 0.17 Week 13 8.36 ± 0.09 8.18 ± 0.10 8.14 ± 0.12 8.11 ± 0.11* 8.20 ± 0.11 6.27 ± 0.85**
Reticulocytes (10 /µL)6
Day 5 0.36 ± 0.02 0.34 ± 0.02 0.31 ± 0.02 0.33 ± 0.03 0.30 ± 0.02 0.22 ± 0.01** Day 21 0.18 ± 0.01 0.22 ± 0.01 0.18 ± 0.01 0.17 ± 0.01 0.17 ± 0.01 0.10 ± 0.01** Week 13 0.16 ± 0.01 0.14 ± 0.01 0.15 ± 0.01 0.16 ± 0.01 0.13 ± 0.01 0.53 ± 0.18
Nucleated erythrocytes (10 /µL)3
Day 5 0.12 ± 0.03 0.14 ± 0.03 0.14 ± 0.03 0.11 ± 0.04 0.09 ± 0.03 0.00 ± 0.00** Day 21 0.03 ± 0.02 0.04 ± 0.02 0.06 ± 0.04 0.03 ± 0.01 0.07 ± 0.03 0.02 ± 0.01 Week 13 0.06 ± 0.02 0.06 ± 0.02 0.06 ± 0.03 0.05 ± 0.03 0.03 ± 0.01 0.08 ± 0.08
Mean cell volume (fL) Day 5 60.0 ± 0.3 60.2 ± 0.3 60.8 ± 0.3 60.1 ± 0.3 60.2 ± 0.3 60.1 ± 0.4 Day 21 57.1 ± 0.6 57.4 ± 0.2 58.3 ± 0.3 57.7 ± 0.3 57.0 ± 0.2 56.4 ± 0.4 Week 13 52.9 ± 0.3 53.0 ± 0.3 53.2 ± 0.3 53.8 ± 0.3 54.3 ± 0.1** 61.0 ± 3.1**
Mean cell hemoglobin (pg) Day 5 21.3 ± 0.2 21.5 ± 0.2 21.5 ± 0.1 21.4 ± 0.1 21.5 ± 0.1 21.4 ± 0.2 Day 21 20.6 ± 0.2 20.4 ± 0.1 21.0 ± 0.2 20.7 ± 0.2 20.3 ± 0.2 20.0 ± 0.2 Week 13 18.1 ± 0.1 18.2 ± 0.1 18.3 ± 0.1 18.4 ± 0.1* 18.6 ± 0.2** 21.6 ± 1.1**
Mean cell hemoglobin concentration (g/dL) Day 5 35.5 ± 0.3 35.7 ± 0.2 35.4 ± 0.2 35.7 ± 0.2 35.8 ± 0.1 35.7 ± 0.2 Day 21 36.1 ± 0.2 35.5 ± 0.2 36.0 ± 0.2 35.9 ± 0.2 35.6 ± 0.2 35.5 ± 0.1 Week 13 34.2 ± 0.2 34.3 ± 0.1 34.4 ± 0.2 34.2 ± 0.2 34.4 ± 0.2 35.4 ± 0.1*
Platelets (10 /µL)3
Day 5 978.1 ± 28.3 987.0 ± 28.1 994.6 ± 24.6 1,040.3 ± 31.5 967.6 ± 46.9 1,066.8 ± 32.2 Day 21 779.5 ± 17.2 819.9 ± 18.7 812.2 ± 19.0 768.2 ± 19.8 747.4 ± 15.9 659.3 ± 27.3** Week 13 658.1 ± 18.2 652.4 ± 9.5 653.9 ± 13.0 650.6 ± 26.8 624.1 ± 12.6 964.3 ± 178
Leukocytes (10 /µL)3
Day 5 7.27 ± 0.38 9.14 ± 0.48 7.67 ± 0.43 8.56 ± 0.45 7.26 ± 0.54 7.53 ± 0.60 Day 21 9.08 ± 0.21 9.56 ± 0.50 9.68 ± 0.84 8.94 ± 0.78 8.52 ± 0.37 8.02 ± 0.46 Week 13 9.71 ± 0.44 8.11 ± 0.59 9.28 ± 0.49 10.40 ± 0.70 8.14 ± 0.51 11.83 ± 1.77
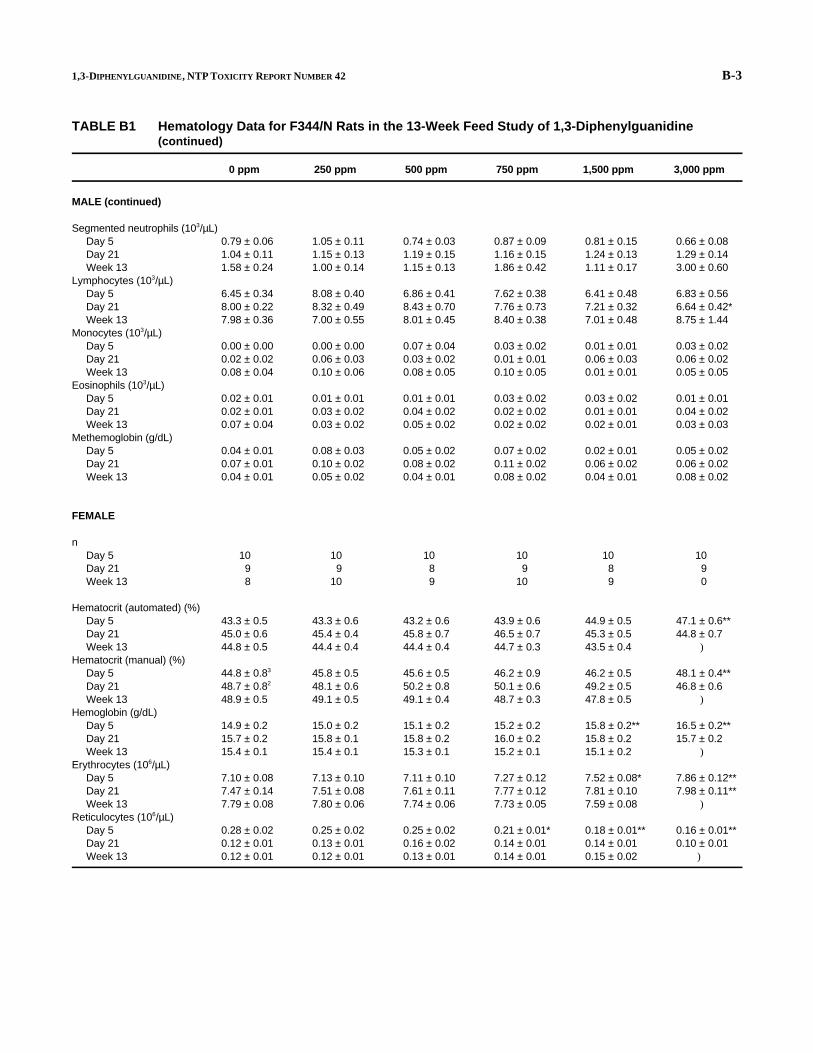
B-3 1,3-DIPHENYLGUANIDINE, NTP TOXICITY REPORT NUMBER 42
TABLE B1 Hematology Data for F344/N Rats in the 13-Week Feed Study of 1,3-Diphenylguanidine (continued)
0 ppm 250 ppm 500 ppm 750 ppm 1,500 ppm 3,000 ppm
MALE (continued)
3Segmented neutrophils (10 /µL)Day 5 0.79 ± 0.06 1.05 ± 0.11 0.74 ± 0.03 0.87 ± 0.09 0.81 ± 0.15 0.66 ± 0.08 Day 21 1.04 ± 0.11 1.15 ± 0.13 1.19 ± 0.15 1.16 ± 0.15 1.24 ± 0.13 1.29 ± 0.14 Week 13 1.58 ± 0.24 1.00 ± 0.14 1.15 ± 0.13 1.86 ± 0.42 1.11 ± 0.17 3.00 ± 0.60
3Lymphocytes (10 /µL)Day 5 6.45 ± 0.34 8.08 ± 0.40 6.86 ± 0.41 7.62 ± 0.38 6.41 ± 0.48 6.83 ± 0.56 Day 21 8.00 ± 0.22 8.32 ± 0.49 8.43 ± 0.70 7.76 ± 0.73 7.21 ± 0.32 6.64 ± 0.42* Week 13 7.98 ± 0.36 7.00 ± 0.55 8.01 ± 0.45 8.40 ± 0.38 7.01 ± 0.48 8.75 ± 1.44
3Monocytes (10 /µL)Day 5 0.00 ± 0.00 0.00 ± 0.00 0.07 ± 0.04 0.03 ± 0.02 0.01 ± 0.01 0.03 ± 0.02 Day 21 0.02 ± 0.02 0.06 ± 0.03 0.03 ± 0.02 0.01 ± 0.01 0.06 ± 0.03 0.06 ± 0.02 Week 13 0.08 ± 0.04 0.10 ± 0.06 0.08 ± 0.05 0.10 ± 0.05 0.01 ± 0.01 0.05 ± 0.05
3Eosinophils (10 /µL)Day 5 0.02 ± 0.01 0.01 ± 0.01 0.01 ± 0.01 0.03 ± 0.02 0.03 ± 0.02 0.01 ± 0.01 Day 21 0.02 ± 0.01 0.03 ± 0.02 0.04 ± 0.02 0.02 ± 0.02 0.01 ± 0.01 0.04 ± 0.02 Week 13 0.07 ± 0.04 0.03 ± 0.02 0.05 ± 0.02 0.02 ± 0.02 0.02 ± 0.01 0.03 ± 0.03
Methemoglobin (g/dL) Day 5 0.04 ± 0.01 0.08 ± 0.03 0.05 ± 0.02 0.07 ± 0.02 0.02 ± 0.01 0.05 ± 0.02 Day 21 0.07 ± 0.01 0.10 ± 0.02 0.08 ± 0.02 0.11 ± 0.02 0.06 ± 0.02 0.06 ± 0.02 Week 13 0.04 ± 0.01 0.05 ± 0.02 0.04 ± 0.01 0.08 ± 0.02 0.04 ± 0.01 0.08 ± 0.02
FEMALE
n Day 5 10 10 10 10 10 10 Day 21 9 9 8 9 8 9 Week 13 8 10 9 10 9 0
Hematocrit (automated) (%) Day 5 43.3 ± 0.5 43.3 ± 0.6 43.2 ± 0.6 43.9 ± 0.6 44.9 ± 0.5 47.1 ± 0.6** Day 21 45.0 ± 0.6 45.4 ± 0.4 45.8 ± 0.7 46.5 ± 0.7 45.3 ± 0.5 44.8 ± 0.7 Week 13 44.8 ± 0.5 44.4 ± 0.4 44.4 ± 0.4 44.7 ± 0.3 43.5 ± 0.4 )
Hematocrit (manual) (%) Day 5 44.8 ± 0.83 45.8 ± 0.5 45.6 ± 0.5 46.2 ± 0.9 46.2 ± 0.5 48.1 ± 0.4** Day 21 48.7 ± 0.82 48.1 ± 0.6 50.2 ± 0.8 50.1 ± 0.6 49.2 ± 0.5 46.8 ± 0.6 Week 13 48.9 ± 0.5 49.1 ± 0.5 49.1 ± 0.4 48.7 ± 0.3 47.8 ± 0.5 )
Hemoglobin (g/dL) Day 5 14.9 ± 0.2 15.0 ± 0.2 15.1 ± 0.2 15.2 ± 0.2 15.8 ± 0.2** 16.5 ± 0.2** Day 21 15.7 ± 0.2 15.8 ± 0.1 15.8 ± 0.2 16.0 ± 0.2 15.8 ± 0.2 15.7 ± 0.2 Week 13 15.4 ± 0.1 15.4 ± 0.1 15.3 ± 0.1 15.2 ± 0.1 15.1 ± 0.2 )
6Erythrocytes (10 /µL)Day 5 7.10 ± 0.08 7.13 ± 0.10 7.11 ± 0.10 7.27 ± 0.12 7.52 ± 0.08* 7.86 ± 0.12** Day 21 7.47 ± 0.14 7.51 ± 0.08 7.61 ± 0.11 7.77 ± 0.12 7.81 ± 0.10 7.98 ± 0.11** Week 13 7.79 ± 0.08 7.80 ± 0.06 7.74 ± 0.06 7.73 ± 0.05 7.59 ± 0.08 )
6Reticulocytes (10 /µL)Day 5 0.28 ± 0.02 0.25 ± 0.02 0.25 ± 0.02 0.21 ± 0.01* 0.18 ± 0.01** 0.16 ± 0.01** Day 21 0.12 ± 0.01 0.13 ± 0.01 0.16 ± 0.02 0.14 ± 0.01 0.14 ± 0.01 0.10 ± 0.01 Week 13 0.12 ± 0.01 0.12 ± 0.01 0.13 ± 0.01 0.14 ± 0.01 0.15 ± 0.02 )

B-4 1,3-DIPHENYLGUANIDINE, NTP TOXICITY REPORT NUMBER 42
TABLE B1 Hematology Data for F344/N Rats in the 13-Week Feed Study of 1,3-Diphenylguanidine (continued)
0 ppm 250 ppm 500 ppm 750 ppm 1,500 ppm 3,000 ppm
FEMALE (continued)
3Nucleated erythrocytes (10 /µL)Day 5 0.13 ± 0.03 0.07 ± 0.02 0.17 ± 0.07 0.05 ± 0.02 0.02 ± 0.01** 0.03 ± 0.02** Day 21 0.02 ± 0.01 0.02 ± 0.01 0.03 ± 0.02 0.04 ± 0.02 0.05 ± 0.03 0.01 ± 0.01 Week 13 0.06 ± 0.02 0.03 ± 0.02 0.14 ± 0.04 0.05 ± 0.02 0.13 ± 0.04 )
Mean cell volume (fL) Day 5 61.0 ± 0.2 60.8 ± 0.3 60.8 ± 0.4 60.4 ± 0.3 59.7 ± 0.3** 59.9 ± 0.2** Day 21 60.3 ± 0.4 60.4 ± 0.2 60.3 ± 0.4 59.8 ± 0.1 58.0 ± 0.4** 56.1 ± 0.2** Week 13 57.5 ± 0.1 56.9 ± 0.2 57.4 ± 0.2 57.8 ± 0.1 57.4 ± 0.1 )
Mean cell hemoglobin (pg) Day 5 21.0 ± 0.1 21.1 ± 0.1 21.3 ± 0.1 21.0 ± 0.1 21.0 ± 0.1 20.9 ± 0.2 Day 21 21.1 ± 0.2 21.0 ± 0.1 20.8 ± 0.1 20.6 ± 0.2 20.3 ± 0.1** 19.7 ± 0.1** Week 13 19.7 ± 0.1 19.7 ± 0.1 19.7 ± 0.1 19.7 ± 0.1 19.8 ± 0.1 )
Mean cell hemoglobin concentration (g/dL) Day 5 34.4 ± 0.2 34.7 ± 0.2 35.0 ± 0.1** 34.6 ± 0.1 35.3 ± 0.2** 35.0 ± 0.2** Day 21 35.0 ± 0.2 34.8 ± 0.2 34.4 ± 0.2 34.4 ± 0.4 35.0 ± 0.2 35.2 ± 0.2 Week 13 34.4 ± 0.2 34.7 ± 0.2 34.4 ± 0.2 34.1 ± 0.2 34.6 ± 0.2 )
3Platelets (10 /µL)Day 5 986.4 ± 40.8 957.9 ± 21.4 983.1 ± 30.4 1,000.6 ± 21.1 1,069.6 ± 31.1 1,043.9 ± 39.4 Day 21 737.9 ± 24.6 754.8 ± 12.7 773.4 ± 14.2 736.3 ± 24.5 759.3 ± 22.5 603.1 ± 22.0** Week 13 645.5 ± 9.7 646.8 ± 14.8 667.4 ± 11.9 673.7 ± 8.6* 762.2 ± 48.8** )
3Leukocytes (10 /µL)Day 5 11.61 ± 0.43 9.75 ± 0.44 9.95 ± 0.64 10.58 ± 0.47 10.27 ± 0.50 11.05 ± 0.85 Day 21 9.39 ± 0.32 9.28 ± 0.49 10.11 ± 0.49 9.71 ± 0.59 9.50 ± 0.34 8.23 ± 0.65 Week 13 6.39 ± 0.48 7.70 ± 0.30* 7.80 ± 0.51* 8.22 ± 0.44** 9.01 ± 0.31** )
3Segmented neutrophils (10 /µL)Day 5 1.40 ± 0.15 0.94 ± 0.09 1.05 ± 0.20 0.91 ± 0.16 0.87 ± 0.10 1.20 ± 0.23 Day 21 0.90 ± 0.12 1.14 ± 0.11 0.90 ± 0.17 1.26 ± 0.17 1.29 ± 0.20 1.24 ± 0.10 Week 13 1.19 ± 0.18 1.45 ± 0.12 1.32 ± 0.21 1.31 ± 0.12 1.02 ± 0.15 )
3Lymphocytes (10 /µL)Day 5 10.13 ± 0.37 8.76 ± 0.39 8.86 ± 0.56 9.66 ± 0.42 9.35 ± 0.45 9.78 ± 0.79 Day 21 8.39 ± 0.36 8.03 ± 0.39 9.06 ± 0.34 8.28 ± 0.49 8.03 ± 0.39 6.96 ± 0.59 Week 13 5.14 ± 0.40 6.22 ± 0.21* 6.34 ± 0.37* 6.86 ± 0.38** 7.88 ± 0.29** )
3Monocytes (10 /µL)Day 5 0.00 ± 0.00 0.01 ± 0.01 0.00 ± 0.00 0.00 ± 0.00 0.02 ± 0.01 0.02 ± 0.01 Day 21 0.06 ± 0.03 0.07 ± 0.03 0.08 ± 0.04 0.10 ± 0.02 0.14 ± 0.04 0.02 ± 0.02 Week 13 0.04 ± 0.04 0.05 ± 0.03 0.11 ± 0.04 0.04 ± 0.03 0.07 ± 0.03 )
3Eosinophils (10 /µL)Day 5 0.06 ± 0.02 0.04 ± 0.02 0.04 ± 0.02 0.01 ± 0.01 0.04 ± 0.02 0.04 ± 0.02 Day 21 0.06 ± 0.02 0.03 ± 0.02 0.06 ± 0.03 0.04 ± 0.02 0.04 ± 0.02 0.01 ± 0.01 Week 13 0.03 ± 0.02 0.01 ± 0.01 0.01 ± 0.01 0.03 ± 0.02 0.03 ± 0.02 )
Methemoglobin (g/dL) Day 5 0.03 ± 0.02 0.03 ± 0.02 0.05 ± 0.02 0.06 ± 0.02 0.03 ± 0.02 0.03 ± 0.02 Day 21 0.03 ± 0.01 0.08 ± 0.03 0.04 ± 0.02 0.07 ± 0.02 0.05 ± 0.04 0.06 ± 0.032
Week 13 0.07 ± 0.01 0.09 ± 0.02 0.07 ± 0.01 0.07 ± 0.01 0.11 ± 0.03 )
1 Data are given as mean ± standard error. Statistical tests were performed on unrounded data. 2 n=8. 3 n=9. 4 n=10. * Significantly different (P 0.05) from the control group by Dunn's or Shirley's test. ** Significantly different (P 0.01) from the control group by Shirley's test.

B-5 1,3-DIPHENYLGUANIDINE, NTP TOXICITY REPORT NUMBER 42
TABLE B2 Clinical Chemistry Data for F344/N Rats in the 13-Week Feed Study of 1,3-Diphenylguanidine1
0 ppm 250 ppm 500 ppm 750 ppm 1,500 ppm 3,000 ppm
MALE
n Day 5 10 10 10 10 10 10 Day 21 10 10 10 10 10 10 Week 13 10 10 10 10 10 4
Urea nitrogen (mg/dL) Day 5 21.6 ± 0.5 22.4 ± 0.3 21.3 ± 0.3 22.5 ± 0.4 22.2 ± 0.4 23.5 ± 0.8* Day 21 22.8 ± 0.5 23.0 ± 0.4 22.6 ± 0.5 23.6 ± 0.5 22.3 ± 0.8 21.8 ± 1.4 Week 13 21.2 ± 0.6 21.5 ± 0.3 21.4 ± 0.3 21.7 ± 0.8 22.3 ± 0.5 22.8 ± 1.3
Creatinine (mg/dL) Day 5 0.68 ± 0.02 0.62 ± 0.03 0.68 ± 0.01 0.63 ± 0.03 0.65 ± 0.02 0.58 ± 0.01** Day 21 0.80 ± 0.03 0.75 ± 0.02 0.78 ± 0.03 0.76 ± 0.02 0.75 ± 0.02 0.65 ± 0.03** Week 13 0.69 ± 0.02 0.68 ± 0.02 0.65 ± 0.02 0.64 ± 0.02 0.62 ± 0.03* 0.60 ± 0.04*
Total protein (g/dL) Day 5 6.1 ± 0.1 6.0 ± 0.1 6.0 ± 0.1 6.1 ± 0.1 6.1 ± 0.1 5.9 ± 0.1 Day 21 6.4 ± 0.1 6.2 ± 0.1 6.2 ± 0.1 6.2 ± 0.1 6.0 ± 0.1** 5.6 ± 0.1** Week 13 6.8 ± 0.1 6.8 ± 0.1 6.8 ± 0.1 6.7 ± 0.1 6.5 ± 0.1* 5.8 ± 0.2**
Albumin (g/dL) Day 5 4.1 ± 0.0 3.9 ± 0.0* 4.0 ± 0.0 3.9 ± 0.0** 4.0 ± 0.1 4.1 ± 0.1 Day 21 4.1 ± 0.1 4.0 ± 0.1 4.1 ± 0.0 4.1 ± 0.0 4.1 ± 0.0 3.8 ± 0.0** Week 13 4.1 ± 0.0 4.2 ± 0.1 4.2 ± 0.0 4.2 ± 0.1 4.1 ± 0.0 3.7 ± 0.1
Total bilirubin (mg/dL) Day 5 0.6 ± 0.0 0.6 ± 0.0 0.6 ± 0.0 0.6 ± 0.1 0.6 ± 0.0 0.4 ± 0.0** Day 21 0.9 ± 0.1 0.9 ± 0.0 0.9 ± 0.1 0.9 ± 0.0 0.7 ± 0.1 0.5 ± 0.1** Week 13 0.5 ± 0.0 0.6 ± 0.0 0.6 ± 0.0 0.6 ± 0.0 0.5 ± 0.0 0.5 ± 0.1
Direct bilirubin (mg/dL) Day 5 0.41 ± 0.04 0.44 ± 0.03 0.35 ± 0.03 0.38 ± 0.04 0.36 ± 0.05 0.24 ± 0.03** Day 21 0.67 ± 0.07 0.67 ± 0.05 0.70 ± 0.06 0.65 ± 0.03 0.47 ± 0.06* 0.33 ± 0.08**2
Week 13 0.37 ± 0.04 0.47 ± 0.04 0.40 ± 0.03 0.43 ± 0.04 0.37 ± 0.04 0.23 ± 0.033
Cholesterol (mg/dL) Day 5 100 ± 4 100 ± 2 100 ± 3 91 ± 2* 91 ± 2 92 ± 3 Day 21 93 ± 2 90 ± 2 87 ± 2 88 ± 2 88 ± 2 94 ± 5 Week 13 88 ± 2 87 ± 3 91 ± 2 88 ± 2 78 ± 1** 70 ± 2**
Triglycerides (mg/dL) Day 5 197 ± 11 227 ± 10 197 ± 7 210 ± 9 201 ± 12 105 ± 13** Day 21 316 ± 21 308 ± 19 294 ± 20 301 ± 17 239 ± 26* 133 ± 25** Week 13 237 ± 17 239 ± 17 241 ± 21 262 ± 24 210 ± 18 72 ± 9*
Alanine aminotransferase (IU/L) Day 5 35 ± 1 34 ± 1 32 ± 1 33 ± 1 35 ± 2 39 ± 2 Day 21 41 ± 2 37 ± 1 37 ± 1 42 ± 2 38 ± 2 41 ± 3 Week 13 42 ± 1 41 ± 2 40 ± 3 38 ± 1 39 ± 1 44 ± 6
Alkaline phosphatase (IU/L) Day 5 535 ± 17 640 ± 10 710 ± 11** 693 ± 12** 729 ± 11** 517 ± 19 Day 21 391 ± 7 452 ± 6 506 ± 12**4 528 ± 24** 537 ± 21**4 376 ± 18 Week 13 199 ± 7 258 ± 8** 282 ± 7** 291 ± 9** 359 ± 11** 349 ± 31**
Creatine kinase (IU/L) Day 5 338 ± 76 323 ± 105 261 ± 67 246 ± 42 250 ± 61 310 ± 63 Day 21 103 ± 94 107 ± 15 104 ± 144 110 ± 13 123 ± 15 117 ± 232
Week 13 153 ± 26 128 ± 264 131 ± 26 133 ± 14 146 ± 25 332 ± 113

B-6 1,3-DIPHENYLGUANIDINE, NTP TOXICITY REPORT NUMBER 42
TABLE B2 Clinical Chemistry Data for F344/N Rats in the 13-Week Feed Study of 1,3-Diphenylguanidine (continued)
0 ppm 250 ppm 500 ppm 750 ppm 1,500 ppm 3,000 ppm
MALE (continued)
Sorbitol dehydrogenase (IU/L) Day 5 27 ± 24 25 ± 1 25 ± 1 28 ± 2 27 ± 2 22 ± 12
Day 21 32 ± 3 25 ± 1 29 ± 1 28 ± 2 29 ± 1 22 ± 1 ** 4
Week 13 27 ± 1 28 ± 2 29 ± 3 26 ± 1 26 ± 1 24 ± 4 Bile acids (µmol/L)
Day 5 4.9 ± 1.54 5.0 ± 1.1 6.5 ± 1.2 6.6 ± 1.4 23.6 ± 2.8**4 37.7 ± 4.0** Day 21 5.4 ± 2.35 1.3 ± 0.33 6.4 ± 1.95 7.6 ± 3.95 17.8 ± 4.5*2 75.2 ± 15.4**4
Week 13 5.1 ± 0.8 12.0 ± 1.9**2 13.8 ± 2.4** 11.1 ± 2.5*6 22.8 ± 3.0** 36.0 ± 1.7**3
FEMALE
n Day 5 10 10 10 10 10 10 Day 21 10 10 10 10 10 10 Week 13 10 10 10 10 10 0
Urea nitrogen (mg/dL) Day 5 22.2 ± 0.5 22.6 ± 0.8 22.7 ± 0.4 21.1 ± 0.8 24.2 ± 0.6 21.0 ± 0.6 Day 21 22.1 ± 0.4 22.0 ± 0.6 21.9 ± 0.8 23.4 ± 0.6 23.9 ± 0.6 25.8 ± 1.0** Week 13 22.0 ± 0.7 22.9 ± 0.5 24.8 ± 0.8* 23.5 ± 0.8 22.9 ± 0.4 )
Creatinine (mg/dL) Day 5 0.63 ± 0.02 0.61 ± 0.01 0.58 ± 0.03 0.59 ± 0.03 0.57 ± 0.02 0.58 ± 0.03 Day 21 0.62 ± 0.02 0.62 ± 0.02 0.64 ± 0.02 0.61 ± 0.02 0.57 ± 0.02 0.43 ± 0.03** Week 13 0.63 ± 0.03 0.63 ± 0.02 0.62 ± 0.01 0.66 ± 0.02 0.56 ± 0.03 )
Total protein (g/dL) Day 5 5.7 ± 0.1 5.7 ± 0.1 5.6 ± 0.1 5.5 ± 0.1 5.4 ± 0.1* 5.3 ± 0.1** Day 21 6.1 ± 0.1 6.0 ± 0.1 5.9 ± 0.1 5.9 ± 0.1 5.6 ± 0.1** 5.2 ± 0.1** Week 13 6.7 ± 0.1 6.7 ± 0.1 6.3 ± 0.1** 5.9 ± 0.1** 5.5 ± 0.0** )
Albumin (g/dL) Day 5 3.8 ± 0.0 3.8 ± 0.1 3.8 ± 0.1 3.7 ± 0.0 3.7 ± 0.0 3.7 ± 0.1 Day 21 4.0 ± 0.0 4.0 ± 0.0 4.0 ± 0.0 4.0 ± 0.0 3.8 ± 0.0** 3.7 ± 0.1** Week 13 4.4 ± 0.1 4.4 ± 0.1 4.1 ± 0.0** 3.9 ± 0.0** 3.7 ± 0.0** )
Total bilirubin (mg/dL) Day 5 0.6 ± 0.0 0.7 ± 0.0 0.6 ± 0.1 0.6 ± 0.1 0.4 ± 0.0** 0.4 ± 0.0** Day 21 0.6 ± 0.0 0.6 ± 0.0 0.5 ± 0.0 0.6 ± 0.0 0.5 ± 0.0 0.5 ± 0.1 Week 13 0.5 ± 0.0 0.5 ± 0.0 0.5 ± 0.0 0.5 ± 0.0 0.5 ± 0.0 )
Direct bilirubin (mg/dL) Day 5 0.23 ± 0.02 0.31 ± 0.03 0.28 ± 0.044 0.30 ± 0.062 0.22 ± 0.025 0.20 ± 0.007
Day 21 0.32 ± 0.03 0.27 ± 0.03 0.25 ± 0.032 0.31 ± 0.044 0.23 ± 0.028 0.26 ± 0.065
Week 13 0.26 ± 0.024 0.27 ± 0.034 0.25 ± 0.02 0.28 ± 0.04 0.21 ± 0.014 ) Cholesterol (mg/dL)
Day 5 107 ± 2 104 ± 3 104 ± 3 98 ± 3* 92 ± 2** 100 ± 2** Day 21 112 ± 3 106 ± 2 103 ± 2* 110 ± 3 107 ± 4 85 ± 4** Week 13 110 ± 4 109 ± 2 100 ± 3 88 ± 2** 86 ± 3** )

B-7 1,3-DIPHENYLGUANIDINE, NTP TOXICITY REPORT NUMBER 42
TABLE B2 Clinical Chemistry Data for F344/N Rats in the 13-Week Feed Study of 1,3-Diphenylguanidine (continued)
0 ppm 250 ppm 500 ppm 750 ppm 1,500 ppm 3,000 ppm
FEMALE (continued)
Triglycerides (mg/dL) Day 5 136 ± 7 159 ± 12 135 ± 10 138 ± 22 70 ± 6** 70 ± 10** Day 21 168 ± 12 136 ± 12* 124 ± 13* 145 ± 18 103 ± 11** 69 ± 7** Week 13 104 ± 11 113 ± 10 106 ± 11 100 ± 18 74 ± 7 )
Alanine aminotransferase (IU/L) Day 5 32 ± 1 33 ± 1 32 ± 1 31 ± 1 36 ± 1* 43 ± 2** Day 21 31 ± 1 29 ± 1 30 ± 1 30 ± 1 38 ± 2** 66 ± 3** Week 13 38 ± 3 35 ± 2 33 ± 1 35 ± 1 39 ± 1 )
Alkaline phosphatase (IU/L) Day 5 373 ± 5 477 ± 13 469 ± 7 469 ± 13 383 ± 13 308 ± 10 Day 21 305 ± 6 357 ± 12 356 ± 5* 385 ± 11** 406 ± 16** 313 ± 18 Week 13 164 ± 6 185 ± 4** 249 ± 5** 251 ± 11** 254 ± 11** )
Creatine kinase (IU/L) Day 5 135 ± 184 158 ± 25 227 ± 33 163 ± 29 205 ± 302 280 ± 55* Day 21 226 ± 68 132 ± 15 104 ± 19 148 ± 424 132 ± 24 183 ± 466
Week 13 110 ± 14 89 ± 114 122 ± 18 113 ± 14 133 ± 20 ) Sorbitol dehydrogenase (IU/L)
Day 5 21 ± 1 20 ± 1 21 ± 1 19 ± 1 20 ± 1 22 ± 1 Day 21 23 ± 1 22 ± 1 20 ± 1 20 ± 1* 20 ± 1* 19 ± 1** Week 13 24 ± 1 23 ± 1 24 ± 1 22 ± 1 19 ± 1** )
Bile acids (µmol/L) Day 5 14.0 ± 3.1 9.7 ± 2.4 12.5 ± 1.2 19.4 ± 3.4 38.5 ± 3.6** 31.7 ± 3.5** Day 21 11.3 ± 2.9 9.3 ± 2.84 25.4 ± 2.3** 13.6 ± 3.0 50.6 ± 3.8** 214.4 ± 27.0** Week 13 14.6 ± 2.1 12.3 ± 2.0 18.3 ± 2.8 17.8 ± 3.0 51.9 ± 4.1** )
1 Data are given as mean ± standard error. Statistical tests were performed on unrounded data. 2 n=8. 3 n=3. 4 n=9. 5 n=5. 6 n=7. 7 n=2. 8 n=6. * Significantly different (P 0.05) from the control group by Dunn's or Shirley's test. ** Significantly different (P 0.01) from the control group by Dunn's or Shirley's test.

B-8 1,3-DIPHENYLGUANIDINE, NTP TOXICITY REPORT NUMBER 42

C-1 1,3-DIPHENYLGUANIDINE, NTP TOXICITY REPORT NUMBER 42
APPENDIX C
Reproductive Tissue Evaluations and Estrous Cycle Characterization
Table C1 Summary of Reproductive Tissue Evaluations in Male F344/N Rats in the 13-Week Feed Study of 1,3-Diphenylguanidine . . . . . . . . . . . . . . . . . . . . . . . . . . . . . . . . . . . . . . . C-2
Table C2 Summary of Estrous Cycle Characterization in Female F344/N Rats in the 13-Week Feed Study of 1,3-Diphenylguanidine . . . . . . . . . . . . . . . . . . . . . . . . . . . . . . . . . . . . . . . C-2
Table C3 Summary of Reproductive Tissue Evaluations in Male B6C3F Mice1
in the 13-Week Feed Study of 1,3-Diphenylguanidine . . . . . . . . . . . . . . . . . . . . . . . . . . . . . . . . . . . . . . . C-3
Table C4 Summary of Estrous Cycle Characterization in Female B6C3F Mice 1
in the 13-Week Feed Study of 1,3-Diphenylguanidine . . . . . . . . . . . . . . . . . . . . . . . . . . . . . . . . . . . . . . . C-3

C-2 1,3-DIPHENYLGUANIDINE, NTP Toxicity Report Number 42
TABLE C1 Summary of Reproductive Tissue Evaluations in Male F344/N Rats in the 13-Week Feed Study of 1,3-Diphenylguanidine1
Study Parameters 0 ppm 500 ppm 750 ppm 1,500 ppm
n 10 10 10 10
Weights (g) Necropsy body weight 374 ± 6 358 ± 5 347 ± 4** 300 ± 7** Left epididymis 0.480 ± 0.010 0.482 ± 0.009 0.496 ± 0.010 0.464 ± 0.008 Left cauda epididymis 0.196 ± 0.005 0.199 ± 0.005 0.198 ± 0.006 0.186 ± 0.004 Left testis 1.55 ± 0.02 1.56 ± 0.02 1.51 ± 0.03 1.48 ± 0.02
Spermatid measurements Spermatid heads (10 /g testis) 7 11.09 ± 0.68 10.46 ± 0.29 10.91 ± 0.44 10.84 ± 0.41 Spermatid heads (10 /testis) 7 17.14 ± 0.98 16.31 ± 0.40 16.50 ± 0.63 16.00 ± 0.54
Spermatid count (mean/10 mL suspension) -4 85.70 ± 4.90 81.55 ± 1.98 82.48 ± 3.13 80.00 ± 2.71
Epididymal spermatozoal measurements Motility (%) 94.76 ± 1.42 92.30 ± 1.76 87.34 ± 3.75 83.69 ± 2.77** Concentration (10 /g caudal epididymal tissue) 6 331.5 ± 33.2 259.0 ± 29.62 290.5 ± 26.3 598.2 ± 139
1 Data presented as mean ± standard error. Differences from the control group for epididymal, cauda epididymal, and testis weights, spermatid measurements, and sperm concentration are not significant by Dunn's test.
2 n=9. ** Significantly different (P 0.01) from the control group by Dunnett's test (necropsy body weight only) or Shirley's test.
TABLE C2 Summary of Estrous Cycle Characterization in Female F344/N Rats in the 13-Week Feed Study of 1,3-Diphenylguanidine1
Study Parameters 0 ppm 500 ppm 750 ppm 1,500 ppm
n 10 10 10 9
Necropsy body weight (g) 204 ± 4 195 ± 3 191 ± 3** 177 ± 2**2
Estrous cycle length (days) 4.95 ± 0.05 5.00 ± 0.00 6.00 ± 0.33** 5.67 ± 0.443
Estrous stages (% of cycle) Diestrus 38.2 38.2 44.5 41.8 Proestrus 14.5 19.1 16.4 15.5 Estrus 30.0 24.5 24.5 22.7 Metestrus 17.3 18.2 14.5 20.0
1 Necropsy body weights and estrous cycle lengths are presented as mean ± standard error. By multivariate analysis of variance, exposed groups do not differ significantly from the control group in the relative length of time spent in the estrous stages.
2 n=10. 3 Estrous cycle longer than 12 days or unclear in 1 of 10 animals. ** Significantly different (P 0.01) from the control group by Dunnett's test (necropsy body weight only) or Dunn's test.
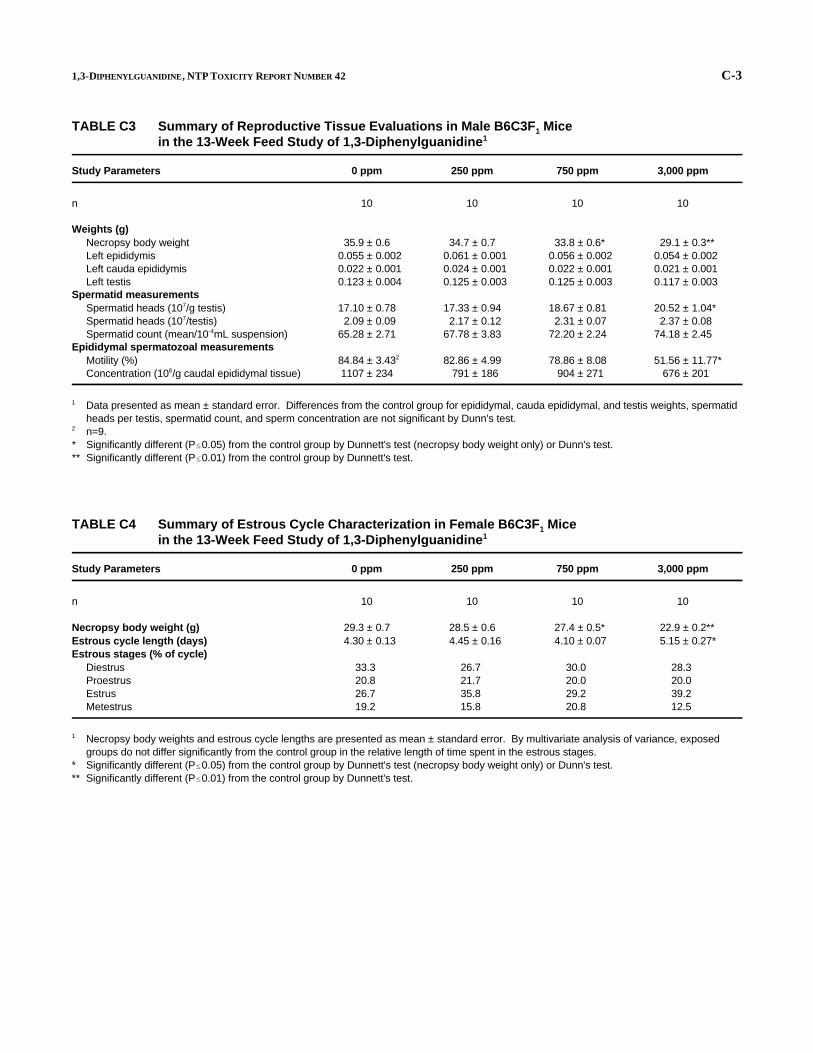
C-3
1
1,3-DIPHENYLGUANIDINE, NTP TOXICITY REPORT NUMBER 42
TABLE C3 Summary of Reproductive Tissue Evaluations in Male B6C3F Mice1
in the 13-Week Feed Study of 1,3-Diphenylguanidine1
Study Parameters 0 ppm 250 ppm 750 ppm 3,000 ppm
n 10 10 10 10
Weights (g) Necropsy body weight 35.9 ± 0.6 34.7 ± 0.7 33.8 ± 0.6* 29.1 ± 0.3** Left epididymis 0.055 ± 0.002 0.061 ± 0.001 0.056 ± 0.002 0.054 ± 0.002 Left cauda epididymis 0.022 ± 0.001 0.024 ± 0.001 0.022 ± 0.001 0.021 ± 0.001 Left testis 0.123 ± 0.004 0.125 ± 0.003 0.125 ± 0.003 0.117 ± 0.003
Spermatid measurements 7Spermatid heads (10 /g testis) 17.10 ± 0.78 17.33 ± 0.94 18.67 ± 0.81 20.52 ± 1.04* 7Spermatid heads (10 /testis) 2.09 ± 0.09 2.17 ± 0.12 2.31 ± 0.07 2.37 ± 0.08
-4Spermatid count (mean/10 mL suspension) 65.28 ± 2.71 67.78 ± 3.83 72.20 ± 2.24 74.18 ± 2.45 Epididymal spermatozoal measurements
Motility (%) 84.84 ± 3.432 82.86 ± 4.99 78.86 ± 8.08 51.56 ± 11.77* 6Concentration (10 /g caudal epididymal tissue) 1107 ± 234 791 ± 186 904 ± 271 676 ± 201
1 Data presented as mean ± standard error. Differences from the control group for epididymal, cauda epididymal, and testis weights, spermatid heads per testis, spermatid count, and sperm concentration are not significant by Dunn's test.
2 n=9. * Significantly different (P 0.05) from the control group by Dunnett's test (necropsy body weight only) or Dunn's test. ** Significantly different (P 0.01) from the control group by Dunnett's test.
TABLE C4 Summary of Estrous Cycle Characterization in Female B6C3F Mice1
in the 13-Week Feed Study of 1,3-Diphenylguanidine1
Study Parameters 0 ppm 250 ppm 750 ppm 3,000 ppm
n 10 10 10 10
Necropsy body weight (g) 29.3 ± 0.7 28.5 ± 0.6 27.4 ± 0.5* 22.9 ± 0.2** Estrous cycle length (days) 4.30 ± 0.13 4.45 ± 0.16 4.10 ± 0.07 5.15 ± 0.27* Estrous stages (% of cycle)
Diestrus 33.3 26.7 30.0 28.3 Proestrus 20.8 21.7 20.0 20.0 Estrus 26.7 35.8 29.2 39.2 Metestrus 19.2 15.8 20.8 12.5
Necropsy body weights and estrous cycle lengths are presented as mean ± standard error. By multivariate analysis of variance, exposed groups do not differ significantly from the control group in the relative length of time spent in the estrous stages.
* Significantly different (P 0.05) from the control group by Dunnett's test (necropsy body weight only) or Dunn's test. ** Significantly different (P 0.01) from the control group by Dunnett's test.

C-4 1,3-DIPHENYLGUANIDINE, NTP Toxicity Report Number 42
1,3-DIPHENYLGUANIDINE, NTP TOXICITY REPORT NUMBER 42 D-1
APPENDIX D
Genetic Toxicology
Table D1
Table D2
Mutagenicity of 1,3-Diphenylguanidine in Salmonella typhimurium . . . . . . . . . . . . . . . . . . . . . . . . . . .
Frequency of Micronucleated Erythrocytes in Peripheral Blood of Male and Female Mice Administered 1,3-Diphenylguanidine in Dosed Feed for 13 Weeks . . . . . . . . . . . . . . . . . . . . . . . . . . . . . . . . . . . . . . . . . . . . . . . . . . . . . . . .
D-2
D-6
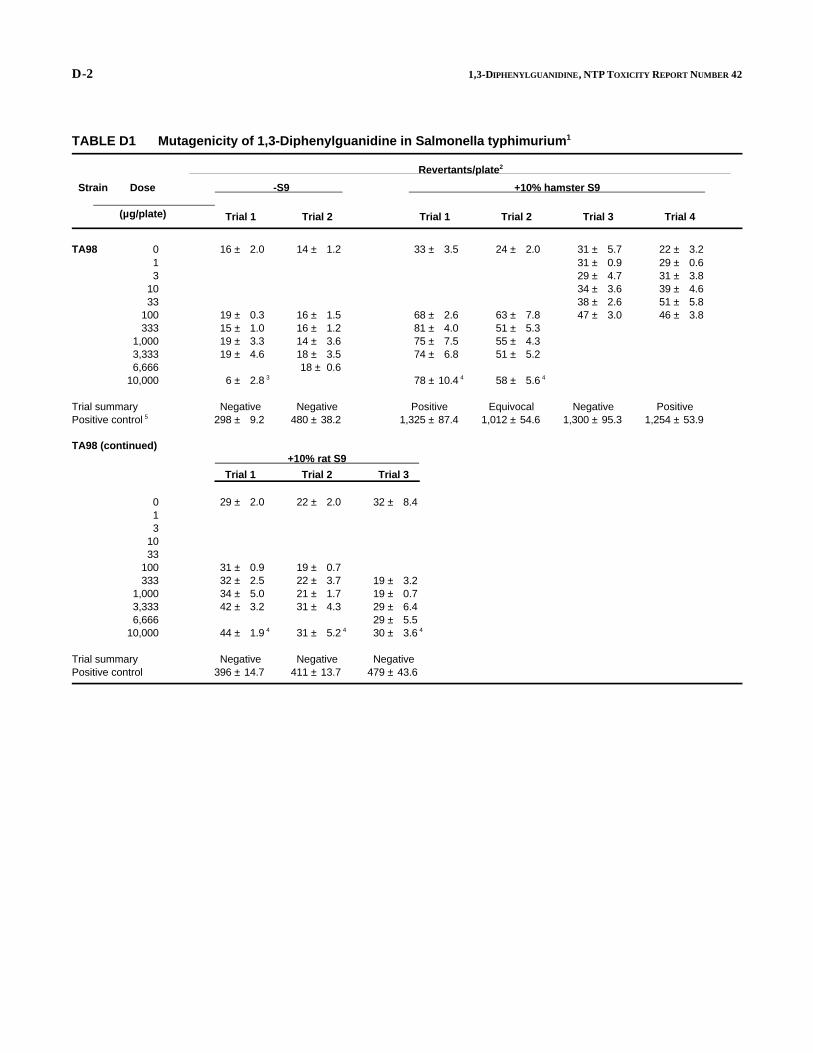
D-2 1,3-DIPHENYLGUANIDINE, NTP TOXICITY REPORT NUMBER 42
TABLE D1 Mutagenicity of 1,3-Diphenylguanidine in Salmonella typhimurium1
Strain Dose -S9
Revertants/plate2
+10% hamster S9
(µg/plate) Trial 1 Trial 2 Trial 1 Trial 2 Trial 3 Trial 4
TA98 0 1 3
10 33
100 333
1,000 3,333 6,666
10,000
16 ± 2.0 14 ± 1.2
19 ± 0.3 16 ± 1.5 15 ± 1.0 16 ± 1.2 19 ± 3.3 14 ± 3.6 19 ± 4.6 18 ± 3.5
18 ± 0.6 6 ± 2.8 3
33 ± 3.5 24 ± 2.0 31 ± 5.7 31 ± 0.9 29 ± 4.7 34 ± 3.6 38 ± 2.6
68 ± 2.6 63 ± 7.8 47 ± 3.0 81 ± 4.0 51 ± 5.3 75 ± 7.5 55 ± 4.3 74 ± 6.8 51 ± 5.2
78 ± 10.4 58 ± 5.64 4
22 ± 3.2 29 ± 0.6 31 ± 3.8 39 ± 4.6 51 ± 5.8 46 ± 3.8
Trial summary Positive control 5
Negative Negative 298 ± 9.2 480 ± 38.2
Positive Equivocal Negative 1,325 ± 87.4 1,012 ± 54.6 1,300 ± 95.3
Positive 1,254 ± 53.9
TA98 (continued) +10% rat S9
Trial 1 Trial 2 Trial 3
0 1 3
10 33
100 333
1,000 3,333 6,666
10,000
29 ± 2.0 22 ± 2.0
31 ± 0.9 19 ± 0.7 32 ± 2.5 22 ± 3.7 34 ± 5.0 21 ± 1.7 42 ± 3.2 31 ± 4.3
44 ± 1.9 31 ± 5.24 4
32 ± 8.4
19 ± 3.2 19 ± 0.7 29 ± 6.4 29 ± 5.5 30 ± 3.6 4
Trial summary Positive control
Negative Negative 396 ± 14.7 411 ± 13.7
Negative 479 ± 43.6

D-3 1,3-DIPHENYLGUANIDINE, NTP TOXICITY REPORT NUMBER 42
TABLE D1 Mutagenicity of 1,3-Diphenylguanidine in Salmonella typhimurium (continued)
Revertants/plate
Strain Dose -S9 +10% hamster S9
(µg/plate) Trial 1 Trial 2 Trial 1 Trial 2 Trial 3 Trial 4
TA100 0 1 3
10 33
100 333
1,000 3,333 6,666
10,000
146 ± 25.8
120 ± 13.8 88 ± 2.6
104 ± 7.2 122 ± 12.9
65 ± 25.1 3
96 ± 2.8
93 ± 7.4 96 ± 6.2
105 ± 17.0 94 ± 5.3 88 ± 5.2
110 ± 0.9
271 ± 10.2 269 ± 22.3 265 ± 16.3 260 ± 2.0
196 ± 11.5 4
120 ± 7.0
215 ± 31.3 201 ± 18.2 213 ± 23.6 177 ± 14.1
162 ± 20.1 4
114 ± 4.1 96 ± 8.7 94 ± 2.8
125 ± 6.7 150 ± 6.4 213 ± 15.3
95 ± 8.2 147 ± 3.2 157 ± 13.6 170 ± 3.8 231 ± 9.6 243 ± 15.5
Trial summary Positive control
Negative 378 ± 12.7
Negative 348 ± 10.4
Equivocal 1,408 ± 32.1
Equivocal 1,067 ± 33.1
Weakly Positive
1,641 ± 35.6 Positive
1,411 ± 31.3
TA100 (continued) +10% rat S9
Trial 1 Trial 2 Trial 3
0 1 3
10 33
100 333
1,000 3,333 6,666
10,000
117 ± 17.1
103 ± 3.8 98 ± 4.1
103 ± 8.5 137 ± 5.9
137 ± 6.6 4
110 ±
109 ± 111 ± 109 ± 154 ±
150 ±
7.3
0.0 8.1 3.2 0.9
8.0 4
124 ± 5.5
98 ± 9.3 81 ± 3.8 90 ± 9.6 96 ± 3.7
117 ± 13.9 4
Trial summary Positive control
Negative 546 ± 21.2
Equivocal 464 ± 5.2
Negative 664 ± 19.7

D-4 1,3-DIPHENYLGUANIDINE, NTP TOXICITY REPORT NUMBER 42
TABLE D1 Mutagenicity of 1,3-Diphenylguanidine in Salmonella typhimurium (continued)
Strain Dose (µg/plate) Trial 1
-S9
Trial 2 Trial 3
Revertants/plate
+10% hamster S9
Trial 1 Trial 2
+10% rat S9
Trial 1 Trial 2
TA1535 0 1 3
10 33
100 333
1,000 3,333 6,666
10,000
27 ± 1.2
35 ± 3.7 37 ± 2.9 34 ± 4.5 18 ± 6.7
0 ± 0.0 3
23 ± 4.0
31 ± 2.9 33 ± 3.8 33 ± 4.3 45 ± 9.5 47 ± 8.5
31 ± 4.2
19 ± 2.6
25 ± 0.9 29 ± 5.0 19 ± 9.6 11 ± 5.9
7 ± 1.2 7 ± 0.3
10 ± 4.4 9 ± 1.8 8 ± 2.1 9 ± 2.4
13 ± 2.5 7 ± 0.6 15 ± 1.5 9 ± 4.5
31 ± 1.2 12 ± 3.73 4
12 ± 0.3 9 ± 1.5
8 ± 2.0 9 ± 1.7 7 ± 1.2 7 ± 1.2 6 ± 0.3 8 ± 3.0 9 ± 3.2 5 ± 0.7
18 ± 5.8 10 ± 2.34 4
Trial summary Positive control
Negative 392 ± 7.5
Weakly Positive
366 ± 31.1 Negative
355 ± 40.6 Equivocal Negative
435 ± 25.0 452 ± 6.0 Negative Negative
168 ± 3.8 257 ± 29.8

D-5 1,3-DIPHENYLGUANIDINE, NTP TOXICITY REPORT NUMBER 42
TABLE D1 Mutagenicity of 1,3-Diphenylguanidine in Salmonella typhimurium (continued)
Strain Dose
Revertants/plate
-S9 +10% hamster S9
(µg/plate) Trial 1 Trial 2 Trial 1 Trial 2 Trial 3 Trial 4
TA1537 0 1 3
10 33
100 333
1,000 3,333 6,666
10,000
5 ± 1.5 3 ± 0.7 6 ± 1.2 5 ± 1.0 4 ± 1.7
6 ± 3.2 7 ± 2.3 7 ± 1.2 6 ± 0.6 7 ± 1.3 13 ± 2.9 5 ± 0.6 5 ± 0.9 6 ± 0.0 5 ± 0.3 7 ± 1.2 6 ± 1.3 8 ± 0.3 5 ± 1.5 7 ± 1.2 8 ± 2.3 10 ± 2.5 9 ± 2.3
4 ± 0.3 9 ± 2.7 29 ± 13.8 Toxic 10 ± 2.0 15 ± 5.9 43 ± 22.8 3 4 4 4
5 ± 1.2
9 ± 2.3 10 ± 3.8 10 ± 2.7 10 ± 2.1
9 ± 2.0 4
Trial summary Positive control
Equivocal Negative Negative Equivocal Equivocal 135 ± 32.9 241 ± 23.8 465 ± 40.4 422 ± 28.3 396 ± 9.5
Negative 72 ± 3.8
TA1537 (continued) +10% rat S9
Trial 1 Trial 2 Trial 3 Trial 4
0 1 3
10 33
100 333
1,000 3,333 6,666
10,000
7 ± 0.3 6 ± 1.5 11 ± 1.0 4 ± 0.3
8 ± 2.0 4 ± 0.7 7 ± 0.6 6 ± 0.9 5 ± 1.5 9 ± 2.0 8 ± 0.6 4 ± 0.7 5 ± 1.5 7 ± 1.2
10 ± 1.8 5 ± 1.2 10 ± 1.5 12 ± 1.3 7 ± 0.3 13 ± 2.4
14 ± 1.2 65 ± 14.7 10 ± 3.0 15 ± 0.04 4 4 4
Trial summary Positive control
Negative Equivocal Negative Equivocal 168 ± 8.5 160 ± 22.2 163 ± 7.4 385 ± 11.6
1 Study performed at Case Western Reserve University. The detailed protocol and these data are presented in Mortelmans et al. (1986); 0 µg/plate is the solvent control.
2 Revertants are presented as mean ± standard error from three plates. 3 Slight toxicity. 4 Precipitate on plate. 5 The positive controls in the absence of metabolic activation were 4-nitro-o-phenylenediamine (TA98), sodium azide (TA100 and TA1535), and
9-aminoacridine (TA1537). The positive control for metabolic activation with all strains was 2-aminoanthracene.

D-6 1,3-DIPHENYLGUANIDINE, NTP TOXICITY REPORT NUMBER 42
TABLE D2 Frequency of Micronucleated Erythrocytes in Peripheral Blood of Male and Female Mice Administered 1,3-Diphenylguanidine in Dosed Feed for 13 Weeks1
Dose Micronucleated NCEs/1,000 NCEs2 Number examined (ppm)
MALE 0 0.38 ± 0.13 4 250 0.70 ± 0.20 5 500 1.00 ± 0.27 5 750 1.20 ± 0.12 5
1,500 0.70 ± 0.20 5 3,000 1.30 ± 0.12 5
P=0.058
FEMALE 0 0.30 ± 0.12 5 250 1.00 ± 0.16 5 500 0.80 ± 0.20 5 750 1.40 ± 0.19* 5
1,500 1.20 ± 0.12 5 3,000 1.30 ± 0.20 5
P=0.0373
1 A detailed description of the protocol is found in MacGregor et al. (1990). Data are presented as mean ± standard error. 2 NCEs = normochromatic erythrocytes. Two thousand normochromatic erythrocytes were scored per animal. 3 Differences from the controls were significant by trend test (ILS, 1990). * Positive (P=0.005) by pairwise comparison to the control group with a trend test.

NTP TECHNICAL REPORTS ON TOXICITY STUDIES PRINTED AS OF SEPTEMBER 1995
Toxicity Chemical Report Number
1 Hexachloro-1,3-butadiene
2 n-Hexane
3 Acetone
4 1,2-Dichloroethane
5 Cobalt Sulfate Heptahydrate
6 Pentachlorobenzene
7 1,2,4,5-Tetrachlorobenzene
8 D & C Yellow No. 11
9 o-Cresol m-Cresol p-Cresol
10 Ethylbenzene
11 Antimony Potassium Tartrate
12 Castor Oil
13 Trinitrofluorenone
14 p-Chloro , , -Trifluorotoluene
15 t-Butyl Perbenzoate
16 Glyphosate
17 Black Newsprint Ink
18 Methyl Ethyl Ketone Peroxide
19 Formic Acid
20 Diethanolamine
21 2-Hydroxy-4-Methoxybenzophenone
22 N,N-Dimethylformamide
23 o-Nitrotoluene m-Nitrotoluene p-Nitrotoluene
24 1,6-Hexanediamine
25 Glutaraldehyde
26 Ethylene Glycol Ethers
27 Riddelliine
28 Tetrachlorophthalic Anhydride
29 Cupric Sulfate
30 Dibutyl Phthalate
31 Isoprene
Route of Exposure Publication Number
Dosed Feed 91-3120
Inhalation 91-3121
Drinking Water 91-3122
Drinking Water, Gavage 91-3123
Inhalation 91-3124
Dosed Feed 91-3125
Dosed Feed 91-3126
Dosed Feed 91-3127
Dosed Feed 92-3128
Inhalation 92-3129
Drinking Water, I.P. Inject. 92-3130
Dosed Feed 92-3131
Dermal, Dosed Feed 92-3132
Gavage (corn oil, a-CD) 92-3133
Gavage 92-3134
Dosed Feed 92-3135
Dermal 92-3340
Dermal 92-3341
Inhalation 92-3342
Drinking Water, Dermal 92-3343
Dosed Feed, Drinking Water 92-3344
Inhalation 93-3345
Dosed Feed 92-3346
Inhalation 93-3347
Inhalation 93-3348
Drinking Water 93-3349
Gavage 94-3350
Gavage 93-3351
Drinking Water, Dosed Feed 93-3352
Feed 95-3353
Inhalation 95-3354
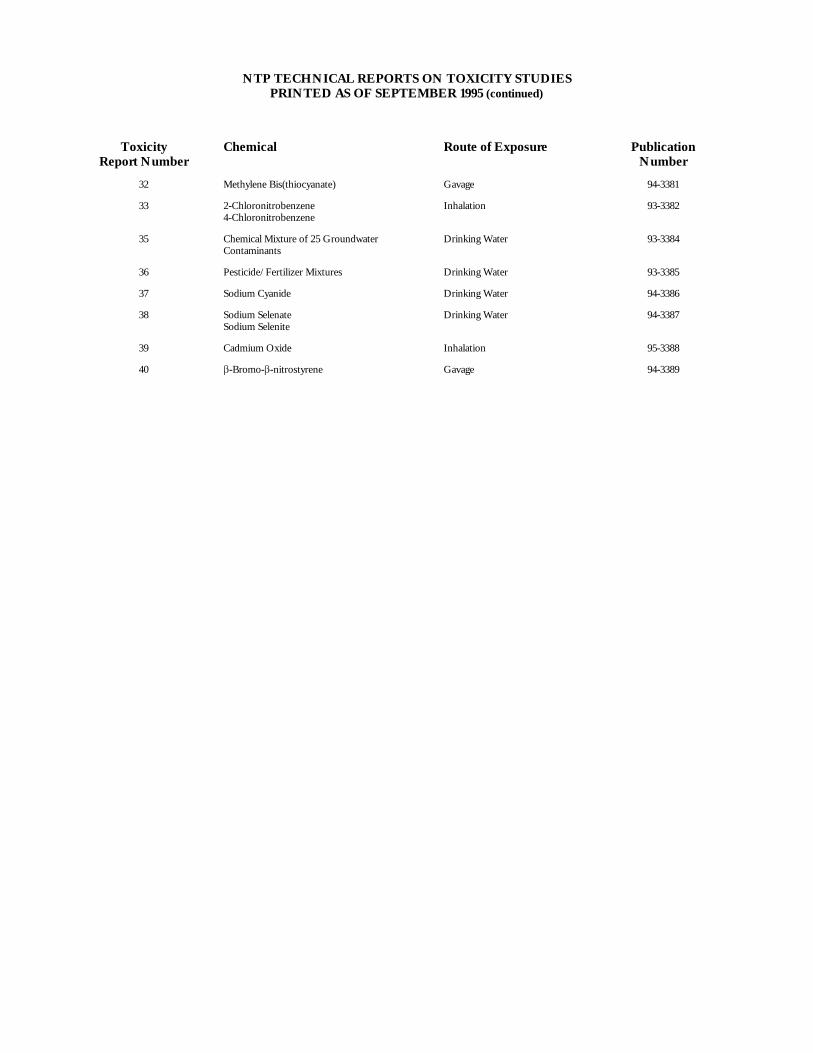
NTP TECHNICAL REPORTS ON TOXICITY STUDIES PRINTED AS OF SEPTEMBER 1995 (continued)
Toxicity Chemical Route of Exposure Publication Report Number Number
32 Methylene Bis(thiocyanate) Gavage 94-3381
33 2-Chloronitrobenzene Inhalation 93-3382 4-Chloronitrobenzene
35 Chemical Mixture of 25 Groundwater Drinking Water 93-3384 Contaminants
36 Pesticide/Fertilizer Mixtures Drinking Water 93-3385
37 Sodium Cyanide Drinking Water 94-3386
38 Sodium Selenate Drinking Water 94-3387 Sodium Selenite
39 Cadmium Oxide Inhalation 95-3388
40 -Bromo- -nitrostyrene Gavage 94-3389