township of ocean school district
TRANSCRIPT

T O W N S H I P O F O C E A N
SC H O O L DISTRICT
TOWNSHIP OF OCEAN
BOARD OF EDUCATION
OAKHURST , NEW JERSEY
COMPREHENSIVE ANNUAL FINANCIAL REPORT
FOR THE FISCAL YEAR ENDED JUNE 30, 2012

TOWNSHIP OF OCEAN SCHOOL DISTRICT
OAKHURST, NEW JERSEY
COMPREHENSIVE ANNUAL FINANCIAL REPORT
FOR THE FISCAL YEAR ENDED
JUNE 30, 2012
Prepared by Township of Ocean Board of Education
Finance Department

COMPREHENSIVE ANNUAL FINANCIAL REPORT OF THE TOWNSHIP OF OCEAN BOARD OF EDUCATION
FOR THE FISCAL YEAR ENDED JUNE 30, 2012
TABLE OF CONTENTS PAGE
INTRODUCTORY SECTION Letter of Transmittal ................................................................................................................. 1 – 5 Organizational Chart.................................................................................................................. 6 Roster of Officials ...................................................................................................................... 7 Consultants, Independent Auditors and Advisors ......................................................................... 8
FINANCIAL SECTION Independent Auditor’s Report .............................................................................................. 9 – 10 Required Supplementary Information – Part I Management’s Discussion and Analysis ................................................................................. 11 - 20 Basic Financial Statements A. District -wide Financial Statement s:
A-1 Statement of Net Assets .......................................................................................... 21 A-2 Statement of Activities ............................................................................................. 22
B. Fund Financial Statements: Governmental Funds:
B-1 Balance Sheet ......................................................................................................... 23 B-2 Statement of Revenues, Expenditures and Changes in Fund Balances ........................ 24 B-3 Reconciliation of the Statement of Revenues, Expenditures and
Changes in Fund Balances of Governmental Funds to the Statement of Activities ............................................................................................................. 25
Proprietary Funds:
B-4 Statement of Fund Net Assets .................................................................................. 26 B-5 Statement of Revenues, Expenses and Changes in Fund Net Assets ........................... 27 B-6 Statement of Cash Flows ......................................................................................... 28
Fiduciary Funds:
B-7 Statement of Fiduciary Net Assets ............................................................................ 29 B-8 Statement of Changes in Fiduciary Net Assets ........................................................... 30 Notes to the Basic Financial Statements ....................................................................... 31 – 49

COMPREHENSIVE ANNUAL FINANCIAL REPORT OF THE TOWNSHIP OF OCEAN BOARD OF EDUCATION
FOR THE FISCAL YEAR ENDED JUNE 30, 2012
TABLE OF CONTENTS (CONTINUED) PAGE
FINANCIAL SECTION (Continued) Required Supplementary Information – Part II C. Budgetary Comparison Schedules:
C-1 Budgetary Comparison Schedule – General Fund ....................................................... 50 – 57 C-1a Combining Schedule of Revenues, Expenditures, and Changes in
Fund Balance – Budget and Actual ........................................................................... N/A C-1b Budgetary Comparison Schedule – General Fund - Education Jobs Fund Program ........ 58 C-2 Budgetary Comparison Schedule – Special Revenue Fund .......................................... 59 Notes to the Required Supplementary Information C-3 Budget-to-GAAP Reconciliation .................................................................................. 60 Other Supplementary Information
D. School Based Budget Schedules:
D-1 Combining Balance Sheet ........................................................................................ N/A D-2 Blended Resource Fund – Schedule of Expenditures Allocated by
Resource Type - Actual ............................................................................................ N/A D-3 Blended Resource Fund – Schedule of Blended Expenditures –
Budget and Actual ................................................................................................... N/A E. Special Revenue Fund:
E-1-1b Combining Schedule of Program Revenues and Expenditures -- Special Revenue Fund – Budgetary Basis .................................................................. 61 - 63
E-2 Schedule of Preschool Education Aid Expenditures – Preschool – All Programs – Budgetary Basis .................................................................................... N/A
F. Capital Projects Fund:
F-1 Summary Schedule of Project Expenditures .............................................................. N/A F-2 Summary Schedule of Revenues, Expenditures, and
Changes in Fund Balance - Budgeta ry Basis .............................................................. N/A F-2a Schedule of Project Revenues, Expenditures, Project
Balance, and Project Status - Budgetary Basis ........................................................... N/A

COMPREHENSIVE ANNUAL FINANCIAL REPORT OF THE TOWNSHIP OF OCEAN BOARD OF EDUCATION
FOR THE FISCAL YEAR ENDED JUNE 30, 2012
TABLE OF CONTENTS (CONTINUED) PAGE
FINANCIAL SECTION (Continued)
G. Proprietary Funds:
Enterprise Fund: G-1 Combining Statement of Net Assets.......................................................................... N/A G-2 Combining Statement of Revenues, Expenses and Changes in Fund
Net Assets .............................................................................................................. N/A G-3 Combining Statement of Cash Flows ......................................................................... N/A
Internal Service Fund: G-4 Combining Statement of Net Assets.......................................................................... N/A G-5 Combining Statement of Revenues, Expenses and Changes in Fund
Net Assets .............................................................................................................. N/A G-6 Combining Statement of Cash Flows ......................................................................... N/A
H. Fiduciary Funds:
H-1 Combining Statement of Fiduciary Net Assets ........................................................... 64 H-2 Combining Statement of Changes in Fiduciary Net Assets .......................................... 65 H-3 Student Activity Agency Fund Schedule of Receipts and Disbursements ...................... 66 H-4 Payroll Agency Fund Schedule of Receipts and Disbursements ................................... 67
I. Long-Term Debt:
I-1 Schedule of Serial Bonds ......................................................................................... 68 I-2 Schedule of Obligations under Capital Lease ............................................................. 69 I-3 Debt Service Fund Budgetary Comparison Schedule .................................................. 70
STATISTICAL SECTION (UNAUDITED)
Introduction to the Statistical Section
Financial Trends
J-1 Net Assets by Component ........................................................................................ 71 J-2 Changes in Net Assets ............................................................................................. 72 - 73 J-3 Fund Balances – Governmental Funds ...................................................................... 74 J-4 Changes in Fund Balances – Governmental Funds ..................................................... 75 - 76 J-5 General Fund – Other Local Revenue by Source ........................................................ 77
Revenue Capacity
J-6 Assessed Value and Estimated Actual Value of Taxable Property – Township of Ocean ....... 78 J-6a Assessed Value and Estimated Actual Value of Taxable Property - Village of Loch
Arbour .................................................................................................................. 79 J-7 Direct and Overlapping Property Tax Rates ............................................................... 80 J-8 Principal Property Taxpayers – Township of Ocean .................................................... 81 J-8a Principal Property Taxpayers – Village of Loch Arbour ................................................ 82 J-9 Property Tax Levies and Collections .......................................................................... 83

COMPREHENSIVE ANNUAL FINANCIAL REPORT OF THE TOWNSHIP OF OCEAN BOARD OF EDUCATION
FOR THE FISCAL YEAR ENDED JUNE 30, 2012
TABLE OF CONTENTS (CONTINUE D) PAGE
STATISTICAL SECTION (UNAUDITED) (Continued) Debt Capacity J-10 Ratios of Outstanding Debt by Type ......................................................................... 84 J-11 Ratios of Net General Bonded Debt Outstanding ....................................................... 85 J-12 Direct and Overlapping Governmental Activities Debt ................................................ 86 J-13 Legal Debt Margin Information ................................................................................. 87 Demographics and Economic Information J-14 Demographic and Economic Statistics ....................................................................... 88 J-15 Principal Employers ................................................................................................. 89 Operating Information J-16 Full-Time Equivalent District Employees by Function/Program .................................... 90 J-17 Operating Statistics ................................................................................................. 91 J-18 School Building Information ..................................................................................... 92 J-19 Schedule of Allowable Maintenance Expenditures by School Facility ............................ 93 J-20 Insurance Schedule ................................................................................................. 94 - 96
SINGLE AUDIT SECTION
K-1 Report on Internal Control Over Financial Reporting and on Compliance and Other Matters Based on an Audit of Financial Statements Performed in Accordance with Government Auditing Standards ............................................................................................................... 97 - 98
K-2 Report on Compliance with Requirements That Could Have a Direct
and Material Effect on Each Major Program and on Internal Control Over Compliance in Accordance with OMB Circular A-133 and New Jersey OMB Circular 04-04 ...................................................................................... 99 - 100
K-3 Schedule of Expenditures of Federal Awards, Schedule A ........................................... 101 K-4 Schedule of Expenditures of State Financial Assistance, Schedule B ............................ 102 K-5 Notes to Schedules of Expenditures of Awards and Financial
Assistance .............................................................................................................. 103 - 104 K-6 Schedule of Findings and Questioned Costs Part I – Summary of Auditor’s Results ...................................................................... 105 - 106 Part II – Schedule of Financial Statement Findings .................................................... 107 Part III – Schedule of Federal Awards and State Financial Assistance
Findings and Questioned Costs ................................................................................ 108 K-7 Summary Schedule of Prior Audit Findings ................................................................ 109

INTRODUCTORY SECTION


TOWNSHIP OF OCEAN SCHOOL DISTRICTOrganizational Chart
June 30, 2012
BOARD OF EDUCATIONTreasurer of
School Monies Board Attorney
Assistant Superintendent
Curriculum
Assistant Superintendent Special Services
Director of Special Projects
Building Principals/Assistant Principals
Basic Skills andESL Teachers
Board Secretary/School Business Administrator
Assistant Board Secretary/Assistant School Business
Administrator
Bookkeeping
Data Processing Staff
Director of Facilities
Transportation Supervisor
Food Service Management Co.
Superintendent of Schools
School Psychologist
LDTC
Social Workers
Subject Area Supervisors
Guidance Counselors, Classroom Teachers,
Nurses, Building Support Staff
6

7
TOWNSHIP OF OCEAN BOARD OF EDUCATION Roster of Officials
June 30, 2012 Term Members of the Board of Education Expires Denise Parlamas , President 2012 Sean P. Moore, Vice President 2013 Robert V. Acerra, Sr. 2014 Joseph Hadden 2014 Richard H. Long 2014 Sylvia A. Sylvia 2013 Michael Beson 2012 Jim Dietrich 2012 Anne Marie Sparaco 2012 Gianna Kinhofer – Student Representative Eric Musto – Student Representative Other Officials John Lysko, Superintendent Kenneth Jannarone, Board Secreta ry/School Business Administrator George Stone, Assistant School Business Administrator Stephen Gallagher, Treasurer Michael J. Gross, Esq., Board Attorney Nathanya G. Simon, Esq., Special Counsel for Special Education

8
TOWNSHIP OF OCEAN BOARD OF EDUCATION Consultants, Independent Auditors and Advisors
June 30, 2012
Board Attorney
Kenny, Gross, Kovats, Campbell & Pruchnik Attorneys at Law
130 Maple Avenue Red Bank, NJ 07701
Board Auditor
Paduano, DiTommaso & Golda, LLC 220 Monmouth Road
PO Box 206 Oakhurst, NJ 07755
Official Depository
Sovereign Bank Monmouth Road
Oakhurst, NJ 07755
FINANCIAL SECTION

PADUANO, DITOMMASO
& GOLDA, LLC
Certified Public Accountants and Consultants
Independent Auditor’s Report The Honorable President and Members of the Board of Education Township of Ocean School District County of Monmouth Oakhurst, New Jersey 07755 We have audited the accompanying financial statements of the governmental activities, the business -type activities, each major fund and the aggregate remaining fund information of the Board of Education of the Township of Ocean School District, in the County of Monmouth, State of New Jersey, as of and for the fiscal year ended June 30, 2012, which collectively comprise the District’s basic financial statements as listed in the table of contents. These financial statements are the responsibility of the Township of Ocean Board of Education’s management. Our responsibility is to express opinions on these financial statements based on our audit. We conducted our audit in accordance with auditing standards generally accepted in the United States of America and the standards applicable to financial audits contained in Government Auditing Standards, issued by the Comptroller General of the United States; and audit requirements as prescribed by the Office of School Finance, Department of Education, State of New Jersey. Those standards require that we plan and perform the audit to obtain reasonable assurance about whether the financial statements are free of material misstatement. An audit includes examining, on a test basis, evidence supporting the amounts and disclosures in the financial statements. An audit also includes assessing the accounting principles used and significant estimates made by management, as well as evaluating the overall financial statement presentation. We believe that our audit provides a reasonable basis for our opinions. In our opinion, the financial statements referred to above present fairly, in all material respects, the respective financial position of the governmental activities, the business -type activities, each major fund and the aggregate remaining fund information of the Township of Ocean Board of Education, in the County of Monmouth, State of New Jersey, as of June 30, 2012, and the respective changes in financial position and cash flows, where applicable, thereof for the year then ended in conformity with accounting principles generally accepted in the United States of America. In accordance with Government Auditing Standards , we have also issued our report dated October 26, 2012 on our consideration of the Township of Ocean Board of Education's internal control over financial reporting and on our tests of its compliance with certain provisions of laws, regulations, contracts and grants agreements and other matters. The purpose of that report is to describe the scope of our testing of internal control over financial reporting and compliance and the results of that testing, and not to provide an opinion on the internal control over financial reporting or on compliance. That report is an integral part of an audit performed in accordance with Governmental Auditing Standards and should be considered in assessing the results of our audit.
9
PO Box 206, 220 Monmouth Road, Oakhurst, NJ 07755 732-531-4100 s Fax 732-531-4130 s www.pdgcpa.com

The Management’s Discussion and Analysis and Budgetary Comparison Schedule as detailed on the table of contents are not a required part of the basic financial statements but are supplementary information required by accounting principles generally accepted in the United States of America. We have applied certain limited procedures, which consisted principally of inquiries of management regarding the methods of measurement and presentation of the required supplementary information. However, we did not audit the information and express no opinion on it. Our audit was conducted for the purpose of forming opinions on the financial statements that collectively comprise the Township of Ocean Board of Education’s basic financial statements. The accompanying introductory section, and other supplementary information, such as the combining and individual fund financial statements, long-term debt schedules, and statistical tables are presented for purposes of additional analysis and are not a required part of the basic financial statements. The combining and individual fund financial statements and long-term debt schedules have been subjected to the auditing procedures applied in the audit of the basic financial statements and, in our opinion, are fairly stated in all material respects in relation to the basic financial statements taken as a whole. The introductory section and statistical tables have not been subjected to the auditing procedures applied in the audit of the basic financial statements and, accordingly, we express no opinion on them. The accompanying schedules of expenditures of federal awards and state financial assistance are presented for purposes of additional analysis as required by U.S. Office of Management and Budget Circular A-133, Audits of States, Local Governments, and Non-Profit Organizations ; and New Jersey OMB’s Circular 04-04, Single Audit Policy for Recipients of Federal Grants, State Grants and State Aid, respectively, and are not a required part of the basic financial statements. Such information has been subjected to the auditing procedures applied in the audit of the basic financial statements and, in our opinion, is fairly stated in all material respects in relation to the basic financial statements taken as a whole.
Paduano, DiTommaso & Golda, LLC Certified Public Accountant October 26, 2012 Licensed Public School Accountant #CS00164
10

REQUIRED SUPPLEMENTARY INFORMATION
PART I

TOWNSHIP OF OCEAN SCHOOL DISTRICT OAKHURST, NJ
MANAGEMENT’S DISCUSSION AND ANALYSIS FOR THE FISCAL YEAR ENDED JUNE 30, 2012
UNAUDITED
11
The management's discussion and analysis of the Township of Ocean School District's financial performance provides an overall review of the School District's financial activities for the fiscal year ended June 30, 2012. The intent of this discussion and analysis is to look at the School District's financial performance as a whole; readers should also review the basic annual financial statements and notes to enhance their understanding of the School District's financial performance. Certain comparative information between the current fiscal year (2011-2012) and the prior fiscal year (2010-2011) is presented in the Management’s Discussion and Analysis. Financial Highlights Key financial highlights for 2012 are as follows:
In total, net assets increased $4,446,163, which represents a 21 percent increase from 2011.
General revenues accounted for $67,258,600 in revenue or 87 percent of all revenues. Program specific revenues in the form of charges for services, operating grants and contributions, and capital grants and contributions accounted for $9,753,755 or 13 percent of total revenues of $77,012,355.
Total assets of governmental activities increased by $3,112,426 as cash and cash equivalents increased
by $3,723,848, receivables decreased by $122,435, and net capital assets decreased by $488,987. The decrease in net capital assets represents depreciation expense and the result of no material additions as there were no major capital projects completed in the fiscal year.
The School District had $72,566,193 in expenses; only $9,753,755 of these expenses was offset by program specific charges for services, grants or contributions. General revenues (primarily property taxes) of $67,258,600 were adequate to provide for these programs.
Among major funds, the General Fund had $69,846,212 in revenues and $67,420,774 in expenditures.
The General Fund's balance increased $2,582,734 from 2011.
Fund Balance for the General Fund as of the fiscal year end was $8,113,720. The undesignated portion of surplus was $4,163,161. Based on our calculation of excess surplus, the maximum of undesignated fund balance (2%) is $1,327,570. The excess $2,835,591 must be utilized for tax relief in the succeeding year’s budget.
The revenues for operating grants and contributi ons were recorded as an offset to expenses in this
current year rather than as a general revenue on Schedule A-2. Using this Comprehensive Annual Financial Report (CAFR) This annual report consists of a series of financial statements and notes to those statements. These statements are organized so the reader can understand the Township of Ocean School District as a financial whole, an entire operating entity. The statements then proceed to provide an increasingly detailed look at specific financial activi ties.

TOWNSHIP OF OCEAN SCHOOL DISTRICT OAKHURST, NJ
MANAGEMENT’S DISCUSSION AND ANALYSIS FOR THE FISCAL YEAR ENDED JUNE 30, 2012
UNAUDITED
12
The Statement of Net Assets and Statement of Activities provide information about the activities of the whole School District, presenting both an aggregate view of the School District's finances and a longer-term view of those finances. Fund financial statements provide the next level of detail. For governmental funds, these statements tell how services were financed in the short-term as well as what remains for future spending. The fund financial statements also look at the School District's most significant funds with all other non-major funds presented in total in one column. In the case of the Township of Ocean School District, the General Fund is by far the most significant fund. Reporting the School District as a Whole Statement of Net Assets and the Statement of Activities While this document contains the large number of funds used by the School District to provide programs and activities, the view of the School District as a whole looks at all financial transactions and asks the question, "How did we do financially during 2012?" The Statement of Net Assets and the Statement of Activities answer this question. These statements include all assets and liabilities using the accrual basis of accounting similar to the accounting used by most private-sector businesses. This basis of accounting takes into account all of the current year's revenues and expenses regardless of when cash is received or paid. These two statements report the School District's net assets and changes in those assets. This change in net assets is important because it tells the reader that, for the School District as a whole, the financial position of the School District has improved or diminished. The causes of this change may be the result of many factors, some financial and some not. Non-financial factors include the School District's property tax base, current laws in New Jersey restricting revenue growth, facility condition, required educational programs and other factors. In the Statement of Net Assets and the Statement of Activities, the School District reports two types of activities:
Governmental activities - All of the School District's programs and services are reported here including instruction, support services, operation and maintenance of plant facilities , pupil transportation and extracurricular activities.
Business -type activities - This service is provided on a charge for goods or services basis to recover the
expense of the goods or services provided. The Food Service fund is reported as a business activity. Reporting the School District's Most Significant Funds Fund Financial Statements The analysis of the School District's major funds begins on page 23. Fund financial reports provide detailed information about the School District's funds. The School District uses many funds to account for a multitude of financial transactions. The School District's governmental funds are the General Fund, Special Revenue Fund, Capital Projects Fund and Debt Service Fund.

TOWNSHIP OF OCEAN SCHOOL DISTRICT OAKHURST, NJ
MANAGEMENT’S DISCUSSION AND ANALYSIS FOR THE FISCAL YEAR ENDED JUNE 30, 2012
UNAUDITED
13
Governmental Funds The School Distri ct's activities are reported in governmental funds, which focus on how money flows into and out of those funds and the balances left at year-end available for spending in the future years. These funds are reported using an accounting method called modified accrual accounting, which measures cash and all other financial assets that can readily be converted to cash. The governmental fund statements provide a detailed short-term view of the School District's general government operations and the basic services it provides. Governmental fund information helps the reader determine whether there are more or fewer financial resources that can be spent in the near future to finance educational programs. The relationship (or differences) between governmental activiti es (reported in the Statement of Net Assets and the Statement of Activities) and governmental funds is reconciled in the financial statements. Proprietary Funds Proprietary funds include enterprise funds and fiduciary funds. The enterprise fund uses the same basis of accounting as business -type activities. Our School District uses the enterprise fund to report the Board's cafeteria operations. Fiduciary funds are used to account for assets held by the School District on behalf of others and include the Student Activities Fund, Payroll and Agency Funds, and the Unemployment Trust Fund. Long Term Debt A separate section is used to account for all Long Term Debt including detail of serial bonds payable and Obligations under Capital Leases. Notes to the Financial Statements The notes provide additional information that is essential to a full understanding of the data provided in the District -wide and fund financial statements. The notes to the financial statements can be found on pages 31 to 49 of this report. The School District as a Whole
Recall that the Statement of Net Assets provides the perspective of the School District as a whole. Net assets may serve over time as a useful indicator of a government's financial position. The School District 's financial position is the product of several financial transactions including the net results of activities, the acquisition and payment of debt, the acquisition and disposal of capital assets, and the depreciation of capital assets.

TOWNSHIP OF OCEAN SCHOOL DISTRICT OAKHURST, NJ
MANAGEMENT’S DISCUSSION AND ANALYSIS FOR THE FISCAL YEAR ENDED JUNE 30, 2012
UNAUDITED
14
Table 1 provides a summary of the School District's net assets for 2012 and 2011.
Table 1
Net Assets
Governmental Activities Business-type Activities
2012 2011 2012 2011
Assets
Current and other assets 10,626,155$ 7,024,742$ 119,642$ 411,127$
Capital assets 38,686,243 39,175,230 76,535 64,236
Total Assets 49,312,398 46,199,972 196,177 475,363
Liabilities
Long-term liabilities 17,416,468 19,745,997 - -
Current portion of long-term debt 2,868,838 2,879,755 - -
Other liabilities 3,434,106 2,475,753 154,612 385,442
Total Liabilities 23,719,412 25,101,505 154,612 385,442
Net Assets
Invested in capital assets, net of debt 20,862,685 18,865,230 76,535 64,236
Restricted 7,896,093 5,283,098 - -
Unrestricted (3,165,792) (3,049,861) (34,970) 25,685
Total Net Assets 25,592,986$ 21,098,467$ 41,565$ 89,921$
The District's combined net assets of $25,634,551 on June 30, 2012 results in an increase of 21 percent from the prior year.

TOWNSHIP OF OCEAN SCHOOL DISTRICT OAKHURST, NJ
MANAGEMENT’S DISCUSSION AND ANALYSIS FOR THE FISCAL YEAR ENDED JUNE 30, 2012
UNAUDITED
15
Table 2 shows the changes in net assets for fiscal year 2012 and 2011.
Table 2
Change In Net Assets
Governmental Activities Business-type Activities
2012 2011 2012 2011
Revenues
Program revenues:
Charge for services 288,168$ 283,329$ 710,173$ 689,179$
Operating grants and contributions 8,276,785 7,569,905 478,629 423,596
General revenues:
Property taxes 58,817,908 57,526,735 - -
Grants and entitlements 8,117,177 7,204,310 - -
Other 323,515 202,942 - 100,000
Total revenues 75,823,553 72,787,221 1,188,802 1,212,775
Program Expenses
Instruction 41,653,560 40,147,603 - -
Support services:
Pupils and instructional staff 12,526,403 12,244,979 - -
General and school administration and business services 5,550,115 5,418,202 - -
Operations and maintenance of facilities 6,786,929 7,004,447 - -
Pupil transportation 3,917,781 3,908,346 - -
Interest on debt 716,154 1,460,077 - -
Food service - - 1,237,158 1,192,783
Other 178,093 195,144 - -
Total expenses 71,329,035 70,378,798 1,237,158 1,192,783
Increase (decrease) in Net Assets 4,494,518$ 2,408,423$ (48,356)$ 19,992$
Net Assets - beginning 21,098,468 18,690,044 89,921 69,929
Net Assets - ending 25,592,986$ 21,098,467$ 41,565$ 89,921$
SOURCES OF REVENUES FOR FISCAL YEAR 2012
Charge for services 998,341$ Operating grants and contributions 8,755,414 Property taxes 58,817,908 Grants and entitlements 8,117,177 Other 323,515
77,012,355
Charge for services1.3%
Operating grants and contributions
11.4%
Property taxes76.4%
Grants and entitlements
10.5%
Other0.4%

TOWNSHIP OF OCEAN SCHOOL DISTRICT OAKHURST, NJ
MANAGEMENT’S DISCUSSION AND ANALYSIS FOR THE FISCAL YEAR ENDED JUNE 30, 2012
UNAUDITED
16
Governmental Activities The unique nature of property taxes in New Jersey creates the legal requirements to annually seek voter approval for the School District operations. Property taxes made up 76 percent of revenues for governmental activities for the Township of Ocean School District for fiscal year 2012 and 78 percent for fiscal year 2011. Property tax revenues increased by $1,291,173, which is a 2 percent increase over the prior year. The increase was needed to fund the additional expenditures associated with higher operating costs and a decrease in state aid. Federal and state grants accounted for another 11 percent of revenues. Total expenses for the fiscal year were $72,566,193.
EXPENSES FOR THE FISCAL YEAR 2012
Instruction 41,653,560 Pupils and instructional staff 12,526,403 General and school administration 5,550,115 Operations and maintenance of facilities 6,786,929 Pupil transportation 3,917,781 Interest on debt 716,154 Food service 1,237,158 Other 178,093
72,566,193 Instruction57.4%
Pupils and instructional staff
17.3%
General and school administration
7.6%
Operations and maintenance of
facilities9.4%
Pupil transportation5.4%
Interest on debt1.0%
Food service1.7%
Other0.2%
Program expenses include instruction that comprises 57 percent of total expenses. Support services comprise 40 percent of total expenses. Business -type Activities are included above. Revenues for the Food Service Fund totaled $1,188,802, which were comprised of charges for services in the amount of $710,173 and federal and state reimbursements in the amount of $478,629 . Total operating expenses totaled $1,237,158. The Statement of Activities shows the cost of program services and the charges for services and grants offsetting those services. Table 3 shows the total cost of services and the net cost of services. The net cost shows the financial burden that was placed on the District's taxpayers by each of these functions.

TOWNSHIP OF OCEAN SCHOOL DISTRICT OAKHURST, NJ
MANAGEMENT’S DISCUSSION AND ANALYSIS FOR THE FISCAL YEAR ENDED JUNE 30, 2012
UNAUDITED
17
Table 3
Total Cost of
Services 2012
Net Cost of
Services 2012
Total Cost of
Services 2011
Net Cost of
Services 2011
Instruction 41,653,560$ 35,231,584$ 40,147,603$ 34,720,068$
Support services:
Pupils and instructional staff 12,526,403 11,307,647 12,244,979 11,148,713
General and school administration
and business services 5,550,115 5,100,768 5,418,202 4,919,390
Operations and maintenance
of facilities 6,786,929 6,519,459 7,004,447 6,527,355
Pupil transportation 3,917,781 3,917,781 3,908,346 3,760,686
Interest and fiscal charges 716,154 529,448 1,460,077 1,273,808
Other 178,093 157,395 195,144 175,544
Total expenses 71,329,035$ 62,764,082$ 70,378,798$ 62,525,564$
Instruction expenses include activities directly dealing with the teaching of pupils and the interaction
between teacher and student, including extracurricular activities.
Pupils and instructional staff include the activities involved with assisting staff with the content and process of teaching to students, including curriculum and staff development.
General administrati on, school administration and business include expenses associated with
administrative and financial supervision of the district.
Operations and maintenance of facilities activities involve keeping the school grounds, buildings and equipment in an effect ive working condition.
Pupil transportation includes activities involved with the conveyance of students to and from school, as
well as to and from school activities, as provided by state law.
Interest and fiscal charges involve the transactions associated with the payment of interest and other related charges to debt of the School District.
Other includes special schools.
The dependence upon tax revenues is apparent. Over 99 percent of instruction activities are supported through taxes and other general revenues; for all activities general revenue support is 99.9 percent. The community, as a whole, is the primary support for the Township of Ocean School District.

TOWNSHIP OF OCEAN SCHOOL DISTRICT OAKHURST, NJ
MANAGEMENT’S DISCUSSION AND ANALYSIS FOR THE FISCAL YEAR ENDED JUNE 30, 2012
UNAUDITED
18
The School District's Funds Information about the School District's governmental funds starts on page 23. These funds are accounted for using the modified accrual basis of accounting. All governmental funds had total revenues of $75,699,230 and expenditures of $73,330,560. The net change in fund balance for the year was most significant in the General Fund, a decrease of $2,582,734. As demonstrated by the various statements and schedules included in the financial section of this report, the District continues to meet its responsibility for sound financial management. As the graph and table below illustrates, the largest portion of General fund expenditures is for salaries. The district is a service entity and as such is labor intensive.
Salaries and wages53.0%
Benefits22.5%
Purchased services6.9%
Tuition4.5%
Supplies3.6%
Capital outlay1.3%
Special revenue fund 3.5%
Debt service fund 4.6%
Other0.2%
Table 4
Expenditures by Object for the Fiscal Year Ended June 30,
2012 2011 % Change
Salaries and wages 38,895,603$ 38,042,075$ 2.24%
Benefits 16,491,100 15,192,995 8.54%
Purchased services 5,043,585 5,317,554 -5.15%
Tuition 3,287,086 3,205,753 2.54%
Supplies 2,611,359 2,165,587 20.58%
Capital outlay 939,993 251,967 273.06%
Special Revenue fund 2,572,878 3,027,878 -15.03%
Capital Projects fund - 86,685 -100.00%
Debt Service fund 3,336,908 3,342,332 -0.16%
Other 152,048 167,176 -9.05%
Total 73,330,560$ 70,800,002$ 3.57%
Expenditures have increased $2,530,558 or 3.57 percent from the prior year mostly due to capital outlay and increase in Fringe Benefits.

TOWNSHIP OF OCEAN SCHOOL DISTRICT OAKHURST, NJ
MANAGEMENT’S DISCUSSION AND ANALYSIS FOR THE FISCAL YEAR ENDED JUNE 30, 2012
UNAUDITED
19
General Fund Budgeting Highlights The School District's budget is prepared according to New Jersey law, and is based on accounting for certain transactions on a basis of cash receipts, disbursements, and encumbrances. The most significant budgeted fund is the General Fund. During the course of the fiscal 2012 year, the School District amended its General Fund budget as needed. The School District uses program based budgeting and the budgeting systems are designed to tightly control total program budgets but provide flexibility for program management. Revisions in the budget were made to recognize revenues and expenditures that were not anticipated and to prevent over expenditures in specific expense accounts. Significant revisions are noted below.
Salaries overall increased due to additional staff and anticipated wage increases that were accrued.
Capital outlay was increased during the year due to various projects that were needed that were not originally budgeted.
Transfers to other funds were decreased as there was no Board Contribution needed.
Capital Assets
At the end of the fiscal year 2012, the School District had $38,686,243 invested in land, buildings, furniture and equipment, and vehicles. Table 5 shows fiscal 2012 balances compared to 2011.
Capital assets decreased $488,987 from fiscal year 2011 to fiscal year 2012. The decrease in capital assets is due to depreciation expense. For more detailed information, please refer to the Notes to Financial Statements.
Debt Administration At June 30, 2012, the School District had $20,285,306 as outstanding debt. Of this amount $2,461,748 is for compensated absences, $123,558 is for capital leases payable, and the balance of $17,700,000 is for bonds for school construction. At June 30, 2012, the School District's overall legal debt margin was over $130 million. For more detailed information, please refer to the Notes to Financial Statements.
Table 5
Capital Assets (Net of Depreciation) at June 30,
2012 2011
Governmental Activities
Land 984,968$ 984,968$
Site improvements 1,910,696 1,910,696
Buildings and improvements 32,930,286 33,634,899
Machinery and equipment 2,860,293 2,644,667
38,686,243$ 39,175,230$

TOWNSHIP OF OCEAN SCHOOL DISTRICT OAKHURST, NJ
MANAGEMENT’S DISCUSSION AND ANALYSIS FOR THE FISCAL YEAR ENDED JUNE 30, 2012
UNAUDITED
20
For the Future The Township of Ocean School District is in very good financial condition presently. There are no major concerns other than budgeting limits with S1701 and the increased reliance on local property taxes. However, future finances are not without challenges as the community continues to grow and state funding is decreased. The Township of Ocean School District's budget for 2012-2013 was below the 2% cap on the tax levy. Therefore, there was no election or vote for the budget in April, 2012, as the district optioned to move the election of the board to November. The Township of Ocean is primarily a residential community, with very few ratables; thus the burden is focused on homeowners to foot the tax burden. The labor agreement for teachers, administrators, and several other employee groups has been negotiated through June 30, 2011. Each year of this contract will have an impact on the District's future operating budgets. As of June 30, 2012, a new contract has not been settled. The School District routinely monitors the rules and regulations of the No Child Left Behind federal legislation to assess and ensure financial compliance. The School District had approved and completed two capital improvement projects in 2009 for two schools The School District has completed all other capital improvement projects in the prior year. It is one of the School District's goals and a budget priority to continue to upgrade and maintain the school facilities. In conclusion, the Township of Ocean School District has committed itself to financial excellence for many years. In addition, the School District's system for financial planning, budgeting, and internal financial controls are well regarded. The School District plans to continue its sound fiscal management to meet the challenge of the future. Contacting the School District's Financial Management This financial report is designed to provide our citizens, taxpayers, investors and creditors with a general overview of the School District's finances and to show the School District's accountability for the money it receives. If you have questions about this report or need additional information, contact Kenneth Jannarone, School Business Administrator/Board Secretary at the Township of Ocean Board of Education, 163 Monmouth Road, Oakhurst, NJ 07755 or email [email protected].

BASIC FINANCIAL STATEMENTS
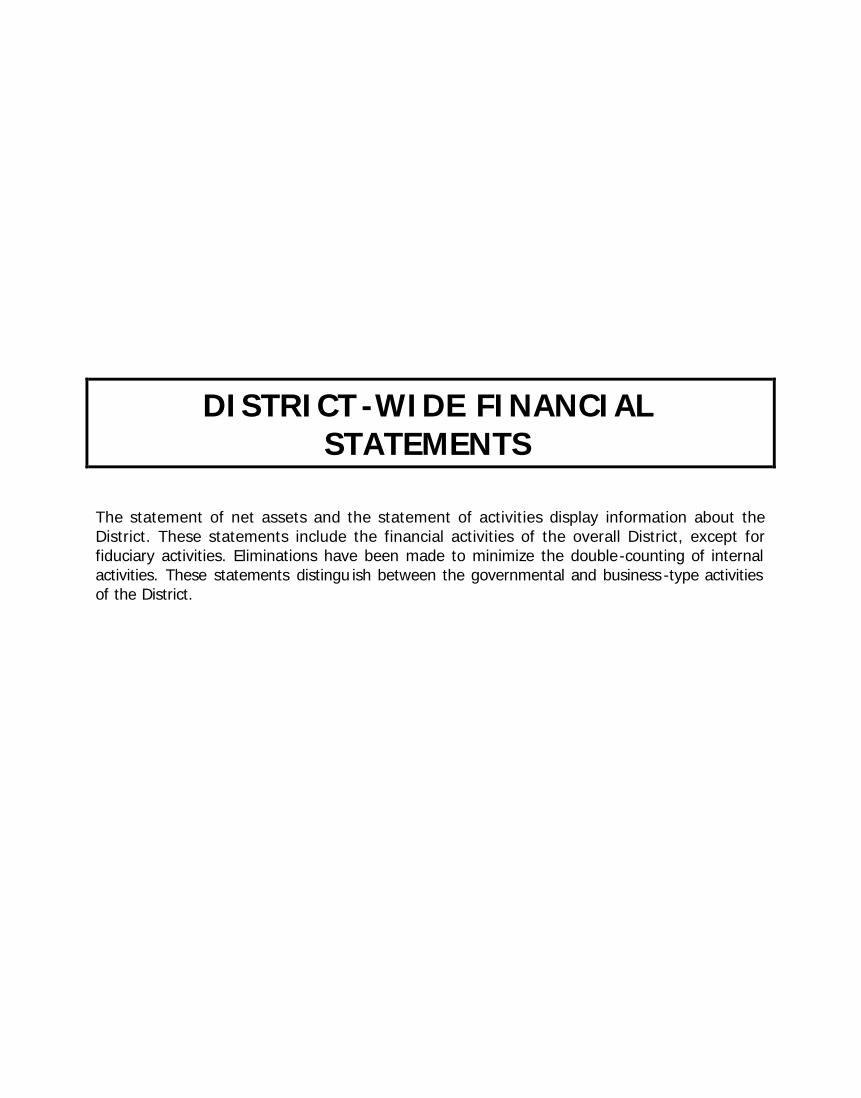
DISTRICT-WIDE FINANCIAL STATEMENTS
The statement of net assets and the statement of activities display information about the District. These statements include the financial activities of the overall District, except for fiduciary activities. Eliminations have been made to minimize the double-counting of internal activities. These statements distingu ish between the governmental and business -type activities of the District.

A-1
Governmental Business-type
Activities Activities Total
ASSETS
Cash and cash equivalents 7,880,612$ 86,778$ 7,967,390$
Receivables, net 143,603 18,273 161,876
Inventory - 14,591 14,591
Bond issuance costs 77,259 - 77,259
Restricted assets:
Cash and cash equivalents 2 - 2
Capital reserve account - cash 2,074,648 - 2,074,648
Intergovernmental receivable 450,031 - 450,031
Capital assets, net 38,686,243 76,535 38,762,778
Total assets 49,312,398 196,177 49,508,575
LIABILITIES
Accounts payable 1,517,382 139,502 1,656,884
Contracts payable 899,427 - 899,427
Bond premium 724,417 - 724,417
Accrued interest 274,515 - 274,515
Payable to state government 18,365 - 18,365
Interfund payable - - -
Unearned revenue - 15,110 15,110
Noncurrent liabilities:
Due within one year 2,868,838 - 2,868,838
Due beyond one year 17,416,468 - 17,416,468
Total liabilities 23,719,412 154,612 23,874,024
NET ASSETS
Invested in capital assets, net of related debt 20,862,685 76,535 20,939,220
Restricted for:
Other purposes 7,896,093 - 7,896,093
Unrestricted (3,165,792) (34,970) (3,200,762) Total net assets 25,592,986$ 41,565$ 25,634,551$
TOWNSHIP OF OCEAN BOARD OF EDUCATIONStatement of Net Assets
June 30, 2012
The accompanying Notes to Basic Financial Statements are an integral part of this statement.
21

A-2TOWNSHIP OF OCEAN BOARD OF EDUCATION
Statement of ActivitiesFor the Year Ended June 30, 2012
Net (Expense) Revenue andProgram Revenues Changes in Net Assets
OperatingCharges for Grants and Governmental Business-type
Functions/Programs Expenses Services Contributions Activities Activities Total
Governmental activities:Instruction:
Regular 31,201,908$ -$ 4,662,601$ (26,539,307)$ -$ (26,539,307)$ Special education 7,304,546 - 1,477,272 (5,827,274) - (5,827,274) Other special instruction 1,601,960 - 265,431 (1,336,529) - (1,336,529) Other instruction 1,545,146 - 16,672 (1,528,474) - (1,528,474)
Support services:Instruction 3,265,613 - - (3,265,613) - (3,265,613) Student and instruction related services 9,260,790 - 1,218,756 (8,042,034) - (8,042,034) School administrative services 2,943,430 - 335,023 (2,608,407) - (2,608,407) General administrative services 1,130,936 - 46,160 (1,084,776) - (1,084,776) Central services 1,329,042 - 68,164 (1,260,878) - (1,260,878) Administrative information technology 146,707 - - (146,707) - (146,707) Plant operations and maintenance 6,786,929 267,470 - (6,519,459) - (6,519,459) Pupil transportation 3,917,781 - - (3,917,781) - (3,917,781)
Special schools 156,620 20,698 - (135,922) - (135,922) Charter school 21,473 - - (21,473) - (21,473)
The accompanying Notes to Basic Financial Statements are an integral part of this statement.
22
Charter school 21,473 - - (21,473) - (21,473) Interest on long-term debt 716,154 - 186,706 (529,448) - (529,448)
Total governmental activities 71,329,035 288,168 8,276,785 (62,764,082) - (62,764,082)
Business-type activities:Food Service 1,237,158 710,173 478,629 - (48,356) (48,356)
Total business-type activities 1,237,158 710,173 478,629 - (48,356) (48,356)
Total primary government 72,566,193$ 998,341$ 8,755,414$ (62,764,082)$ (48,356)$ (62,812,438)$
General revenues: Property Taxes Levied for: General purposes 55,724,474$ -$ 55,724,474$ Debt service 3,093,434 - 3,093,434 Federal and State aid not restricted 8,117,177 - 8,117,177 Investment Earnings 13,824 - 13,824 Miscellaneous Income 291,709 - 291,709 Gain on disposal of capital assets 17,982 - 17,982 Transfers in(out) - - -
Total general revenues, special items, extraordinary items and transfers 67,258,600 - 67,258,600
Change in Net Assets 4,494,518 (48,356) 4,446,162
Net Assets—beginning 21,098,468 89,921 21,188,389
Net Assets—ending 25,592,986$ 41,565$ 25,634,551$
The accompanying Notes to Basic Financial Statements are an integral part of this statement.
22
The accompanying Notes to Basic Financial Statements are an integral part of this statement.
22

FUND FINANCIAL STATEMENTS
The Individual Fund statements and schedules present more detailed information for the individual fund in a format that segregates information by fund type.

B-1TOWNSHIP OF OCEAN BOARD OF EDUCATION
Balance SheetGovernmental Funds
June 30, 2012
Special Capital Debt TotalGeneral Revenue Projects Service Governmental
Fund Fund Fund Fund Funds
ASSETSCash and cash equivalents 7,177,944$ -$ -$ 2$ 7,177,946$ Receivables, net 17,184 - - - 17,184 Due from other funds 296,448 - - - 296,448 Receivables from other governments 126,419 450,031 - - 576,450 Restricted cash and cash equivalents 2,074,648 - - - 2,074,648
Total assets 9,692,643$ 450,031$ -$ 2$ 10,142,676$
LIABILITIES AND FUND BALANCESLiabilities:
Accounts payable 679,496$ 135,218$ -$ -$ 814,714$ Contracts payable 899,427 - - - 899,427 Interfund payable - 296,448 - - 296,448 Payable to state government - 18,365 - - 18,365
Total liabilities 1,578,923 450,031 - - 2,028,954
Fund balances:Restricted for:
Excess surplus - current year 2,835,591 - - - 2,835,591 Excess surplus - prior year - designated
for subsequent year's expenditures 1,843,948 - - - 1,843,948 Capital reserve 2,074,648 - - - 2,074,648 Debt service - - - - - Debt service - - - - -
Assigned to:Designated by the BOE for subsequent
year's expenditures 1,141,904 - - 2 1,141,906 Unassigned:
General fund 217,629 - - - 217,629 Total fund balances 8,113,720 - - 2 8,113,722
Total liabilities and fund balances 9,692,643$ 450,031$ -$ 2$
Amounts reported for governmental activities in the statement of net assets (A-1) are different because:
(647,158)
38,686,243
(20,559,821)
25,592,986$
The accompanying Notes to Basic Financial Statements are an integral part of this statement.23
Long-term liabilities, including bonds payable and accrued interest, are not due and payable in the
current period and, therefore, are not reported as liabilities in the funds.
Capital assets used in governmental activities are not financial resources and, therefore, are not
reported in the funds. The cost of the assets is $66,440,389 and the accumulated depreciation is
$27,754,146.
The premiums and costs associated with the issuance of the various bonds are reflected as income
and expense in the year the bonds are issued but are capitalized on the statement of net assets. The
bond premium net of bond issuance costs is $846,348 and accumulated amortization is $199,190.

B-2TOWNSHIP OF OCEAN BOARD OF EDUCATION
Statement of Revenues, Expenditures and Changes in Fund BalancesGovernmental Funds
For the Year Ended June 30, 2012
Special Capital Debt TotalGeneral Revenue Projects Service Governmental
Fund Fund Fund Fund Funds
REVENUES
Local sources:
Local tax levy 55,724,474$ -$ -$ 3,093,434$ 58,817,908$
Tuition charges 20,698 - - - 20,698
Rental fees 267,470 - - - 267,470
Interest earned on investments 13,824 - - - 13,824
Miscellaneous 185,368 - - - 185,368
Total - local sources 56,211,834 - - 3,093,434 59,305,268
State sources 13,262,710 543,906 - - 13,806,616
Federal sources 371,668 2,028,972 - 186,706 2,587,346
Total revenues 69,846,212 2,572,878 - 3,280,140 75,699,230
EXPENDITURES
Current:
Regular instruction 20,102,009 1,741,049 - - 21,843,058
Special education instruction 5,001,480 - - - 5,001,480
Other special instruction 1,071,086 - - - 1,071,086
School sponsored activities 1,218,492 - - - 1,218,492
Support services and undistributed costs:
Tuition 3,265,613 - - - 3,265,613
Student and instruction related services 6,017,308 578,023 - - 6,595,331
General administrative services 946,485 - - - 946,485
School administrative services 2,088,832 - - - 2,088,832
Central services and
administrative information technology 1,113,270 - - - 1,113,270
Plant operations and maintenance 5,835,371 - - - 5,835,371
Pupil transportation 3,151,643 - - - 3,151,643
Unallocated benefits 16,491,099 - - - 16,491,099
Special schools 156,620 - - - 156,620
Transfer to charter school 21,473 - - - 21,473
Debt service:
Principal - - - 2,610,000 2,610,000
Interest and other charges - - - 726,908 726,908
Capital outlay 939,993 253,806 - - 1,193,799
Total expenditures 67,420,774 2,572,878 - 3,336,908 73,330,560
Excess (Deficiency) of revenues
over expenditures 2,425,438 - - (56,768) 2,368,670
OTHER FINANCING SOURCES (USES)
Capital leases (non-budgeted) 139,314 139,314
Sale of Assets 17,982 - - - 17,982
Transfers in - - - - -
Transfers out - - - - -
Total other financing sources (uses) 157,296 - - - 157,296
Net change in fund balances 2,582,734 - - (56,768) 2,525,966
Fund balance - July 1 5,530,986 - - 56,770 5,587,756 Fund balance - June 30 8,113,720$ -$ -$ 2$ 8,113,722$
The accompanying Notes to Basic Financial Statements are an integral part of this statement.24

B-3TOWNSHIP OF OCEAN BOARD OF EDUCATION
Reconciliation of the Statement of Revenues, Expendituresand Changes in Fund Balances of Governmental Funds
to the Statement of ActivitiesFor the Year Ended June 30, 2012
Total net change in fund balances - governmental funds (from B-2) 2,525,966$
Amounts reported for governmental activities in the statement of activities (A-2) are different because:
Depreciation expense (1,682,787)$ Capital outlays 1,193,799 (488,988)
2,625,756
89,640
(139,314)
27,454
(145,996)
Change in net assets of governmental activities 4,494,518$
In the statement of activities, interest on long-term debt in the statement of
activities is accrued, regardless of when due. In the governmental funds, interest
is reported when due. The change in accrued interest is an addition in the
reconciliation.
In the statement of activities, certain operating expenses, e.g., compensated
absences (vacations) are measured by the amounts earned during the year. In
the governmental funds, however, expenditures for these items are reported in the
amount of financial resources used (paid). When the earned amount exceeds the
paid amount, the difference is a reduction in the reconciliation; when the paid
amount exceeds the earned amount the difference is an addition in the
reconciliation.
Capital outlays are reported in governmental funds as expenditures. However, in
the statement of activities, the cost of those assets is allocated over their
estimated useful lives as depreciation expense. This is the amount by which capital
outlays exceeded depreciation in the period.
Repayment of long-term debt, i.e. bond principal, is an expenditure in the
governmental funds, but the repayment reduces long-term liabilities in the
statement of net assets and is not reported in the statement of activities.
Bond premium and issuance costs are amortized over the lives of the bonds in the
statement of activities but are recorded as an addition from the proceeds from
sales of bonds in the government funds.
Proceeds from debt issues are a financing source in the governmental funds. They
are not revenue in the statement of activities; issuing debt increases long-term
liabilities in the statement of net assets.
The accompanying Notes to Basic Financial Statements are an integral part of this statement.
25

B-4TOWNSHIP OF OCEAN BOARD OF EDUCATION
Statement of Fund Net AssetsProprietary Funds
June 30, 2012
Business-type Activities Internal ServiceEnterprise Funds Funds
Food Service Fund Self-Insurance Activities
ASSETS
Current assets:
Cash and cash equivalents 86,778$ 702,668$
Other receivables 18,273 -
Inventories 14,591 -
Total current assets 119,642 702,668
##
Non-current assets:
Furniture, machinery and equipment 497,070 -
Less: accumulated depreciation (420,535) -
Total non-current assets 76,535 -
Total assets 196,177$ 702,668$
LIABILITIES
Current liabilities:
Accounts payable 139,502$ 702,668$
Prepaid school lunches 7,282 -
Deferred revenue 7,828 -
Total current liabilities 154,612 702,668
NET ASSETS
Invested in capital assets 76,535 -
Unrestricted (34,970) -
Total net assets 41,565 -
Total liabilities and net assets 196,177$ 702,668$
The accompanying Notes to Basic Financial Statements are an integral part of this statement.
26

B-5TOWNSHIP OF OCEAN BOARD OF EDUCATION
Statement of Revenues, Expenses and Changes in Fund Net AssetsProprietary Funds
For the Fiscal Year Ended June 30, 2012
Business-type Activities Internal ServiceEnterprise Funds Funds
Food Service Fund Self-Insurance Activities
Operating Revenues
Charges for services:
Daily sales - reimbursable program 369,461$ -$
Daily sales - non-reimbursable program 333,634 -
Special functions 7,078 -
Services provided to other funds - 2,262,000
Total operating revenues 710,173 2,262,000 ##
Operating Expenses
Cost of sales 680,153 -
Salaries 345,646 -
Employee benefits 103,846 2,262,000
Management fee 45,900 -
Insurance 48,098 -
Depreciation 13,515 -
Total operating expenses 1,237,158 2,262,000
Operating Income (loss) (526,985) -
Non-operating Revenues
State sources:
School lunch program 11,670 -
Breakfast program - -
Federal sources:
National school lunch program 345,125 -
Breakfast program 10,775 -
Special milk program 669 -
Food distribution program 64,490 -
Sodexho:
Food service guarantee 45,900 -
Total non-operating revenues 478,629 -
Change in Net Assets before transfers (48,356) -
Transfer In-general fund - -
Change in Net Assets (48,356) -
Total Net Assets - Beginning 89,921 -
Total Net Assets - Ending 41,565$ -$
The accompanying Notes to Basic Financial Statements are an integral part of this statement.
27

B-6TOWNSHIP OF OCEAN BOARD OF EDUCATION
Statement of Cash FlowsProprietary Funds
For the Fiscal Year Ended June 30, 2012
Business-type Activities Internal ServiceEnterprise Funds Funds
Food Service Fund Self-Insurance Activities
Cash Flows from Operating Activities
Receipts from customers and other funds 815,732$ 2,262,000$
Payments to employees (345,646) -
Payments for employee benefits (103,846) (2,078,012)
Payments to suppliers (895,653) -
###
Net cash provided by (used for) operating activities (529,413) 183,988
Cash Flows from Non-capital Financing Activities
State sources 11,670 -
Federal sources 402,469 -
Net cash provided by non-capital financing activities 414,139 -
Cash flows from Capital and Related Financing activities
Purchase of capital assets (25,814) -
Net cash used for capital and related
financing activities (25,814) -
Net Increase in Cash and Cash Equivalents (141,088) 183,988
Balance - Beginning of Year 227,866 518,680
Balance - End of Year 86,778$ 702,668$
Reconciliation of Operating Income (Loss) to Net Cash
Provided (Used) for Operating Activities:
Operating income (loss) (526,985)$ -$
Adjustments to reconcile operating income (loss) to net cash provided (used for) operating activities
Depreciation 13,515 -
Deferred revenue 64,490 -
(Increase) decrease in accounts receivable, net 143,018 -
(Increase) decrease in inventories 7,379 -
Increase (decrease) in accounts payable (235,577) 183,988
Increase/(decrease) in prepaid school lunches 591 -
Increase (decrease) in deferred revenue 4,156 -
Total adjustments (2,428) 183,988
Net Cash Provided by (Used for) Operating Activities (529,413)$ 183,988$
Noncash noncapital financing activities:
The Board of Education received $64,490 of food commodities from
the US Department of Agriculture for the year ended June 30, 2012.
The accompanying Notes to Basic Financial Statements are an integral part of this statement.
28

B-7TOWNSHIP OF OCEAN BOARD OF EDUCATION
Statement of Fiduciary Net AssetsFiduciary FundsJune 30, 2012
Unemployment
Compensation
Trust
Private Purpose
Scholarship
Fund Agency Fund
ASSETS
Cash and cash equivalents 329,813$ 35,096$ 1,602,175$
Total Assets 329,813 35,096 1,602,175$
LIABILITIES
Payroll deductions and withholdings 49,287 - 1,196,078$
Due to student groups - - 406,097
Total Liabilities 49,287 - 1,602,175$
NET ASSETS
Held in trust for unemployment claimsand other purposes 280,526$
Reserved for Scholarships 35,096$
The accompanying Notes to Basic Financial Statements are an integral part of this statement.
29

B-8TOWNSHIP OF OCEAN BOARD OF EDUCATIONStatement of Changes in Fiduciary Net Assets
Fiduciary FundsFor the Fiscal Year Ended June 30, 2012
Unemployment
Compensation
Trust
Private Purpose
Scholarship
Fund
ADDITIONS
Contributions:
Plan member 102,313$ -$
Scholarship donations - 7,434
Total Contributions 102,313 7,434
Investment Earnings:
Interest 106 -
Net Investment Earnings 106 -
Total Additions 102,419 7,434
DEDUCTIONS
Quarterly contribution reports & assessment 42,838 -
Unemployment claims 155,170 -
Scholarships awarded - 8,004
Total Deductions 198,008 8,004
Change in Net Assets (95,589) (570)
Net Assets - Beginning of Year 376,115 35,666
Net Assets - End of Year 280,526$ 35,096$
The accompanying Notes to Basic Financial Statements are an integral part of this statement.
30

NOTES TO THE BASIC FINANCIAL STATEMENTS

TOWNSHIP OF OCEAN BOARD OF EDUCATION Notes to the Basic Financial Statements
June 30, 2012
Continued 31
NOTE 1. SUMMARY OF SIGNIFICANT ACCOUNTING POLICIES The financial statements of the Board of Education (Board) of the Township of Ocean School District (District) have been prepared in conformity with accounting principles generally accepted in the United States of America (GAAP) as applied to governmental units. The Governmental Accounting Standards Board (GASB) is the accepted standard -setting body for establishing governmental accounting and financial reporting principles. The School district also applies Financial Accounting Standards Board (FASB) Statements and interpretations issued on or before November 30, 1989, to its governmental activities provided they do not conflict with or contradict GASB pronouncements. The District’s Proprietary Funds have elected not to apply the standards issued by FASB after November 30, 1989. The more significant of the Board's accounting policies are described below.
A. Reporting Entity The Board is an instrumentality of the State of New Jersey, established to function as an educational institution. The Board consists of elected officials and is responsible for the fiscal control of the District. A superintendent is appointed by the Board and is responsible for the administrative control of the District. The operations of the District include the elementary schools, intermediate school and high school located in Ocean Township, New Jersey.
The financial reporting entity consists of a) the primary government, b) organizations for which the primary government is financially accountable, and c) other organizations for which the nature and significance of their relationship with the primary government are such that exclusion would cause the reporting entity’s financial statements to be misleading or incomplete.
The definition of the reporting entity is based primarily on the notion of financial accountability. A primary government is financially accountable for the organizations that make up its legal entity. It is also financially accountable for legally separate organizations if its officials appoint a voting majority of an organization’s governing body and either it is able to impose its will on that organization or there is a potential for the organization to provide specific financial benefits to, or to impose specific financial burdens on, the primary government. A primary government may also be financially accountable for governmental organizations that are fiscally dependent on it.
The District, as the primary government for financial reporting entity purposes, has oversight responsibility and control over all activities related to the Township of Ocean Board of Education in Ocean Township, New Jersey. The District receives funding from local, state, and federal government sources and must comply with the requirements of these funding entities.
The District has no component units that are required to be included within the reporting entity, as set forth in Section 2100 of the GASB Codification of Governmental Accounting and Financial Reporting Standards.
B. District-Wide and Fund Financial Statements
The District -wide financial statements (i.e., the statement of net assets and the statement of activities) report information on all of the nonfiduciary activities of the District. For the most part, the effect of interfund activity has been removed from these statements. Governmental activities, which normally are supported by taxes and intergovernmental revenues, are reported separately from business -type activities, which rely to a significant extent on fees and charges for support.
The statement of activities demonstrates the degree to which the direct expenses of a given function or segment are offset by program revenues. Direct expenses are those that are clearly identifiable with a specific function. Program revenues include 1) charges to customers or applicants who purchase, use, or directly benefit from goods, service, or privileges provided by a given function and 2) grants and contributions that are restricted to meeting the operational or capital requirements of a particular function. Taxes and other items not properly included among program revenues are reported instead as general revenues.

TOWNSHIP OF OCEAN BOARD OF EDUCATION Notes to the Basic Financial Statements
June 30, 2012
Continued 32
NOTE 1. SUMMARY OF SIGNIFICANT ACCOUNTING POLICIES (continued) B. District -Wide and Fund Financial Statements (continued)
Separate financial statements are provided for governmental funds, proprietary funds, and fiduciary funds, even though the latter are excluded from the District -wide financial statements. Major individual governmental funds and the major individual enterprise fund are reported as separate columns in the fund financial statements. C. Measurement Focus, Basis of Accounting and Financial Statement Presentation The District -wide financial statements are reported using the economic resources measurement focus and the accrual basis of accounting, as are the proprietary fund and fiduciary fund financial statements. Revenues are recorded when earned and expenses are recorded when a liability is incurred, regardless of the timing of related cash flows. Property taxes are recognized as revenues in the year for which they are levied. Grants and similar items are recognized as revenues as soon as all eligibility requirements imposed by the provider have been met. Governmental fund financial statements are reported using the current financial resources measurement focus and the modified accrual basis of accounting. Revenues are recognized as soon as they are both measurable and available. Revenues are considered to be available when they are collectible within the current period or soon enough thereafter to pay liabilities of the current period. For this purpose, the District considers revenues to be available if they are collected within 60 days of the end of the current fiscal year. Expenditures generally are recorded when a liability is incurred, as under accrual accounting. However, debt service expenditures, as well as expenditures related to compensated absences and capital leases, are recorded only when payment is due. Property taxes, interest and state equalization monies associated with the current fiscal period are all considered to be susceptible to accrual and so have been recognized as revenues of the current fiscal year. The District has reported the following major government funds:
General Fund: The general fund is the general operating fund of the District and is used to account for all financial resources except those required to be accounted for in another fund. Special Revenue Fund: The District maintains one special revenue fund, primar ily consisting of government grants, for which the proceeds of specific revenue sources (other than fiduciary funds or major capital projects) are legally restricted to expenditures for specified purposes. Capital Projects Fund: The capital projects fund is used to account for financial resources to be used for the acquisition or construction of major capital facilities (other than those financed by proprietary funds.) Debt Service Fund: The debt service fund accounts for the resources accumulated and payment made for principal and interest on long-term general obligation debt of governmental funds.
The District reports the following major proprietary fund:
Enterprise (Food Service) Fund: The enterprise fund accounts for all revenues and expenses pertaining to cafeteria operations. This fund is utilized to account for operations that are financed and operated in a manner similar to private business enterprises. The stated intent is that the cost (i.e., expenses including depreciation and indirect costs) of providing goods and services to the students or other entities on a continuing basis are financed or recovered primarily through user charges. Internal Service Fund: The internal service fund may be used to report any activity that provides goods or services to other funds, departments or agencies of the primary entity on a cost–reimbursement basis. The school district accounts for risk management and health insurance costs provided to the Board of Education employees through the internal service fund.

TOWNSHIP OF OCEAN BOARD OF EDUCATION Notes to the Basic Financial Statements
June 30, 2012
Continued 33
NOTE 1. SUMMARY OF SIGNIFICANT ACCOUNTING POLICIES (continued) C. Measurement Focus, Basis of Accounting and Financial Statement Presentation (continued) Additionally, the District reports the following fiduciary fund types:
Trust and Agency Funds: The trust and agency funds are used to account for assets held by the District on behalf of outside parties, including other governments, or on behalf of other funds within the District.
Trust Funds: The unemployment compensation and private purpose scholarship funds are accounted for in essentially the same manner as governmental funds. The unemployment compensation fund is used to account for contribution from employees and interest earned on the balance as well as payments to the State for reimbursement of unemployment claims. The private purpose scholarship fund is an expendable trust whereby principal and interest may be spent. Agency Funds (Payroll and Student Activity Fund): Agency funds are used to account for the assets that the District holds on behalf of others as their agent. Agency funds are custodial in nature and do not involve measurement of results of operations.
As a general rule, the effect of interfund activity has been eliminated from the District -wide financial statements.
Amounts reported as program revenues include 1) charges to customers or applicants for goods, services or privileges provided, 2) operating grants and contributions, and 3) capital grants and contributions. Internally dedicated resources are reported as general revenues rather than as program revenues. Likewise, general revenues include all taxes.
The proprietary fund distinguishes operating revenues and expenses from nonoperating items. Operating revenues and expenses generally result from providing services and producing and delivering goods in connection with a proprietary fund’s principal ongoing operations. The principal operating revenues for the enterprise fund includes the cost of sales, administrative expenses, and depreciation on capital assets. All revenues and expenses not meeting this definition are reported as nonoperating revenues and expenses.
When both restricted and unrestricted resources are available for use, it is the District’s policy to use restricted resources first, then unrestricted resources as they are needed.
The District reports unearned revenue on its balance sheet. Unearned revenue arises when a potential revenue does not meet both the “measureable” and “available” criteria for recognition in the current period. Unearned revenue also arises when resources are received by the District before it has legal claim to them, as when federal assistance is received prior to the incurrence of qualifying expenditures. In subsequent periods, when both revenue recognition criteria are met, or when the District has a legal claim to the resources, the liability for unearned revenue is removed from the balance sheet and revenue is recognized.
Ad Valorem (Property) Taxes are susceptible to accrual as, under New Jersey State Statute, a municipality is required to remit to its school district the entire balance of taxes in the amount voted upon or certified prior to the end of the school year. The District records the entire approved tax levy as revenue (accrued) at the start of the fiscal year, since the revenue is both measurable and available. The District is entitled to receive moneys under the established payments schedule and the unpaid amount is considered to be an “accounts receivable.”
The following statutory dates are applicable to property taxes collected by the respective municipalities: Levy date January 1 Lien Date January 1 Due Dates: August 1, November 1, February 1, and May 1

TOWNSHIP OF OCEAN BOARD OF EDUCATION Notes to the Basic Financial Statements
June 30, 2012
Continued 34
NOTE 1. SUMMARY OF SIGNIFICANT ACCOUNTING POLICIES (continued) D. Budgets/Budgetary Control Annual appropriat ed budgets are prepared in the spring of each year for the general, special revenue, and debt service funds. The budgets are submitted to the county office for approval and are voted upon at the annual school election on the third Tuesday in April. Budgets, except for the special revenue fund, are prepared using the modified accrual basis of accounting. The legal level of budgetary control is established at line item accounts within each fund. Line item accounts are defined as the lowest (most specific) level of details as established pursuant to the minimum chart of accounts referenced in N.J.A.C. 6A:23. The over-expenditure in the general fund is due to the inclusion of the non-budgeted on-behalf payments made by the State of New Jersey as District expenditures. These amounts are offset by related revenues and as such do not represent budgetary over-expenditures. All budget amendments/transfers must be approved by School Board resolution. Budgetary transfers were made during the current year and were within allowable limits permitted by the State. The District did not deem them to be significant or unusual in nature. Formal budgetary integration into the accounting system is employed as a management control device during the year. For governmental funds there are no substantial differences between the budgetary -basis of accounting and GAAP with the exception of the legally mandated revenue recognition of the one or more June state aid payments for budgetary purposes only and the special revenue fund as noted below. Encumbrance accounting is also employed as an extension of formal budgetary integration in the governmental fund types. Unencumbered appropriations lapse at fiscal year-end. The accounting records of the special revenue fund are maintained on the grant accounting budgetary basis. The grant accounting budgetary basis differs from GAAP in that the grant accounting budgetary basis recognizes encumbrances as expenditures and also recognizes the related revenues, whereas the GAAP basis does not. Sufficient supplemental records are maintained to allow for the presentation of GAAP basis financial reports. E. Cash, Cash Equivalents and Investments Cash and cash equivalents consist of petty cash, amounts on deposit, money market accounts and short-term investments with original maturities of three months or less from date of acquisition. Investments are stated at fair value in accordance with Governmental Accounting Standards Board (GASB) Statement No. 31, “Accounting and Financial Reporting for Certain Investments and for External Investment Pools.” F. Interfund Receivable/Payable Interfund receivables/payables represent amounts that are owed, other than charges for goods or services rendered to/from a particular fund in the District and that are due within one year. G. Inventories Inventories that benefit future periods, other than those recorded in the enterprise fund, are recorded as expenditures during the year of purchase. Inventories in the enterprise fund are expensed using the consumption method. Enterprise fund inventories are valued at cost, which approximates market, using the first-in/first -out (FIFO) method. At June 30, 2012, the unused Food Donation Program commodities of $7,828 are reported as deferred revenue in the enterprise fund.
TOWNSHIP OF OCEAN BOARD OF EDUCATION Notes to the Basic Financial Statements
June 30, 2012
Continued 35
NOTE 1. SUMMARY OF SIGNIFICANT ACCOUNTING POLICIES (continued) H. Capital Assets Capital assets, which include land, property, plant and machinery and equipment and construction in progress, are reported in the applicable governmental or business-type activities columns in the District -wide financial statements. Capital assets are defined by the District as assets with an initial, individual cost of more than $2,000 and an estimated useful life in excess of two years. Such assets are recorded at historical cost or through estimation procedures performed by an independent appraisal company. Donated capital assets are valued at their estimated fair market value on the date of donation. The costs of normal maintenance and repairs that do not add to the value of the asset or materially extend assets’ lives are not capitalized. Property, plant and equipment of the District is depreciated using the straight -line method under the half-year convention. The following estimated useful lives are used to compute depreciation: Asset Class Estimated Useful Lives School building 50 Building improvements 20 Electrical/Plumbing 30 Vehicles 8 Office and computer equipment 5 – 10 Instructional equipment 10 Grounds equipment 15 In the fund financial statements, fixed assets used in governmental fund operations are accounted for as capital outlay expenditures of the governmental fund upon acquisition. Fixed assets are not capitalized and related depreciation is not reported in the fund financial statements. I. Compensated Absences The District accounts for compensated absences (e.g. unused vacation, sick leave) as directed by Governmental Accounting Standards Board No. 16 (GASB 16), “Accounting for Compensated Absences.” A liability for compensated absences attributable to service already rendered and not contingent on a specific event that is outside the control of the employer and employee is accrued as employees earn the right to the benefits. District employees are granted varying amounts of vacation and sick leave in accordance with the District’s personnel policies. Upon termination, employees are paid for accrued vacation. The District’s policy permits employees to accumulate unused sick leave and carry forward the full amount to subsequent years. Upon retirement, employees shall be paid by the District for the unused sick leave in accordance with the District’s agreement with the various employee unions. In the District -wide Statement of Net Assets , the liabilities whose average maturities are greater than one year are reported in two components – the amount due within one year and the amount due in more than one year. The liability for vested compensated absences of the proprietary fund types is recorded within those funds as the benefits accrue to employees. As of June 30, 2012, no material liability existed for compensated absences in the food service fund.

TOWNSHIP OF OCEAN BOARD OF EDUCATION Notes to the Basic Financial Statements
June 30, 2012
Continued 36
NOTE 1. SUMMARY OF SIGNIFICANT ACCOUNTING POLICIES (continued) J. Deferred Revenue
Deferred revenue arises when assets are recognized before revenue recognition criteria have been satisfied. Grants and entitlements received before the eligibility requirements are met are also recorded as deferred revenue.
K. Accrued Liabilities and Long-term Obligations
All payables, accrued liabilities, and long-term obligations are reported on the District -wide financial statements. In general, governmental fund payables and accrued liabilities that, once incurred, are paid in a timely manner and in full from current financial resources, are reported as obligations of the funds. However, contractually required pension contributions and compensated absences that are paid from governmental funds are reported as liabilities on the fund financial statements only to the extent that they are due for payment during the current year. Bonds are recognized as a liability on the fund financial statements when due. L. Unamortized Bond Premiums, Discounts and Bond Issuance Costs Premiums, discounts and bond issuance costs on the revenue bonds are amortized using the interest method, over the maturity of the related issue. M. Fund Balance Reporting The District has adopted GASB 54 as part of its fiscal year reporting. The intention of the GASB is to provide a more structured classification of fund balance and to improve the usefulness of fund balance reporting to the users of the District’s financial statements. The reporting standard establishes a hierarchy for fund balance classifications and the constraints imposed on the users of those resources. GASB 54 provides for two major types of fund balances, which are nonspendable and spendable. Non-spendable fund balances are balances that cannot be spent because they are not expected to be converted to cash or they are legally or contractually required to remain intact. Examples of this classification are prepaid items and principal (corpus) of an endowment fund. The District does not have any prepaid item or nonspendable funds related to endowments. In addition to the nonspendable fund balance, GASB 54 has provided a hierarchy of spendable fund balances, based on a hierarchy of spending constraints.
Restricted : fund balances that are constrained by external parties, constitutional provisions, or enabling legislation.
Committed : fund balances that contain self-imposed constraints for the government from its highest
level of decision making authority.
Assigned : fund balances that contain self-imposed constraints of the government to the used for a particular purpose.
Unassigned : fund balance of the general fund that is not constrained for any particular purpose.

TOWNSHIP OF OCEAN BOARD OF EDUCATION Notes to the Basic Financial Statements
June 30, 2012
Continued 37
NOTE 1. SUMMARY OF SIGNIFICANT ACCOUNTING POLICIES (continued) M. Fund Balance Reporting (continued) The Board of Education has classified its fund balances with the following hierarchy: Spendable : The Board of Education has classified the spendable fund balances as Restricted, Committed, Assigned and Unassigned and considered each to have been spent when expenditures are incurred.
Restricted for Excess Surplus and Capital Reserve: New Jersey School Districts are required to reserve fund balance of the general fund if they did not appropriate a required minimum amount as budgeted fund balance. The capital reserve account is used to accumulate funds for use as capital outlay expenditure s in subsequent fiscal years. The funds have been included in restricted category of fund balance. The restricted fund balances totaled $6,754,187 and represented $4,679,539 in excess surplus and $2,074,648 in capital reserve .
Assigned for School Operat ions and Capital Projects:
The School Board has set aside certain spendable fund balance for school operations and capital projects. At year end, the assigned fund balance is $1,141,906, of which $1,141,904 is for school operations and $2 is for debt service. The assigned fund balance for school operations includes $641,904 for outstanding encumbrances and $500,000 for appropriation of existing unassigned fund balance at year-end to be utilized toward tax relief in the next year’s budget.
Unassigned:
The unassigned fund balance for the General Fund is $217,629.
N. Calculation of Excess Surplus In accordance with N.J.S.A. 18A:7F-7, as amended, the designation for reserve fund balance – excess surplus is a required calculation pursuant to the New Jersey Comprehensive Education Improvement and Financing Act of 1996 (CEIFA). New Jersey school districts are required to reserve General Fund fund balance at the fiscal year end of June 30 if they did not appropriate a required minimum amount as budgeted fund balance in their subsequent years’ budget. The District has excess fund balance generated during the 2011 fiscal year in the amount of $2,835,591 which will be designated for tax relief in 2012-2013. O. Net Assets
Net assets represent the difference between assets and liabilities in the District -wide financial statements. Net assets invested in capital assets, net of related debt consists of capital assets, net of accumulated depreciation, reduced by the outstanding balance of any borrowing used for the acquisition, construction, or improvement of those assets. Net assets are reported as restricted when there are limitations imposed on their use either through the enabling legislation adopted by the School District or through external restrictions imposed by creditors, grantors, or laws or regulations of other governments. The School District’s policy is to first apply restricted resources when an expense is incurred for purposes for which both restricted and unrestricted net assets are available. P. Management Estimates The preparation of financial statements in conformity with accounting principles generally accepted in the United States requires management to make estimates and assumptions that affect the reported amounts of revenues and expenditures/exp enses during the reporting period. Actual results could differ from those estimates.
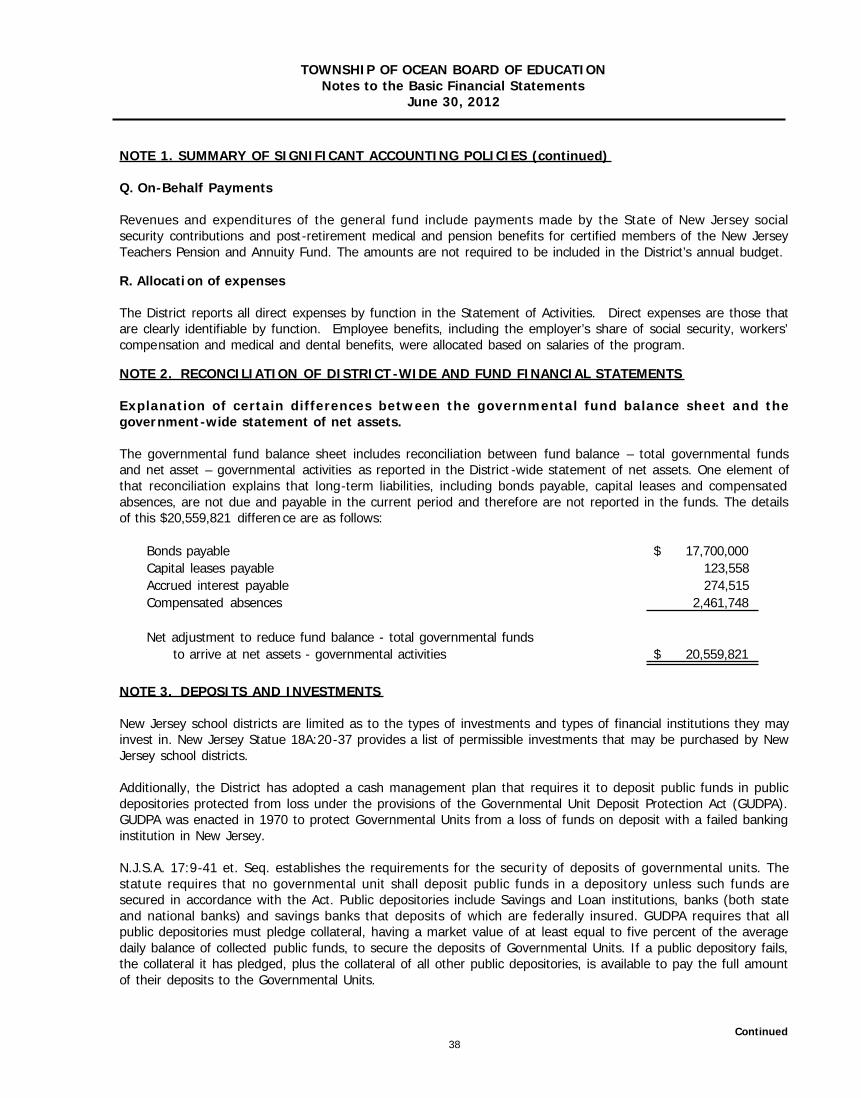
TOWNSHIP OF OCEAN BOARD OF EDUCATION Notes to the Basic Financial Statements
June 30, 2012
Continued 38
NOTE 1. SUMMARY OF SIGNIFICANT ACCOUNTING POLICIES (continued) Q. On-Behalf Payments Revenues and expenditures of the general fund include payments made by the State of New Jersey social security contributions and post-retirement medical and pension benefits for certified members of the New Jersey Teachers Pension and Annuity Fund. The amounts are not required to be included in the District’s annual budget.
R. Allocati on of expenses The District reports all direct expenses by function in the Statement of Activities. Direct expenses are those that are clearly identifiable by function. Employee benefits, including the employer’s share of social security, workers’ compensation and medical and dental benefits, were allocated based on salaries of the program.
NOTE 2. RECONCILIATION OF DISTRICT-WIDE AND FUND FINANCIAL STATEMENTS Explanation of certain differences between the governmental fund balance sheet and the government-wide statement of net assets. The governmental fund balance sheet includes reconciliation between fund balance – total governmental funds and net asset – governmental activities as reported in the District -wide statement of net assets. One element of that reconciliation explains that long-term liabilities, including bonds payable, capital leases and compensated absences, are not due and payable in the current period and therefore are not reported in the funds. The details of this $20,559,821 differen ce are as follows:
Bonds payable 17,700,000$
Capital leases payable 123,558
Accrued interest payable 274,515
Compensated absences 2,461,748
Net adjustment to reduce fund balance - total governmental funds
to arrive at net assets - governmental activities 20,559,821$
NOTE 3. DEPOSITS AND INVESTMENTS New Jersey school districts are limited as to the types of investments and types of financial institutions they may invest in. New Jersey Statue 18A:20-37 provides a list of permissible investments that may be purchased by New Jersey school districts. Additionally, the District has adopted a cash management plan that requires it to deposit public funds in public depositories protected from loss under the provisions of the Governmental Unit Deposit Protection Act (GUDPA). GUDPA was enacted in 1970 to protect Governmental Units from a loss of funds on deposit with a failed banking institution in New Jersey. N.J.S.A. 17:9-41 et. Seq. establishes the requirements for the securi ty of deposits of governmental units. The statute requires that no governmental unit shall deposit public funds in a depository unless such funds are secured in accordance with the Act. Public depositories include Savings and Loan institutions, banks (both state and national banks) and savings banks that deposits of which are federally insured. GUDPA requires that all public depositories must pledge collateral, having a market value of at least equal to five percent of the average daily balance of collected public funds, to secure the deposits of Governmental Units. If a public depository fails, the collateral it has pledged, plus the collateral of all other public depositories, is available to pay the full amount of their deposits to the Governmental Units.

TOWNSHIP OF OCEAN BOARD OF EDUCATION Notes to the Basic Financial Statements
June 30, 2012
Continued 39
NOTE 3. DEPOSITS AND INVESTMENTS (continued) Deposits New Jersey statutes require that school districts deposit public funds in public depositories located in New Jersey which are insured by the Federal Deposit Insurance Corporation, or by any other agency of the United States that insures deposits made in public depositories. School districts are also permitted to deposit public funds in the State of New Jersey Cash Management Fund (NJCMF), New Jersey Arbitrage Rebate Management Fund (NJARM) and M.B.I.A. Class. New Jersey statutes (GUDPA) require public depositories to maintain collateral for deposits of public funds that exceed depository insurance limits as follows:
The market value of the collateral must equal at least 5% of the average daily balance of collected public funds on deposit.
In addition to the above collateral requirements, if the public funds deposited exceed 75% of the capital funds of the depository, the depository must provide collateral having a market value at least equal to 100% of the amount exceeding 75%.
All collateral must be deposited with the Federal Reserve Bank of New York, the Federal Reserve Bank of Philadelphia, the Federal Home Loan Bank of New York, or a banking institution that is a member of the Federal Reserve System and has capital funds of not less than $25,000,000.
Operating cash, in the form of Negotiable Order of Withdrawal (“NOW”) accounts, is held in the District’s name by a commercial banking institution. At June 30, 2012, the carrying amount of the District’s deposits was $6,634,931 and the bank balance was $7,541,711 . The District also held $1,400 in petty cash at June 30, 2012. Based on levels of risk, $250,000 of the District’s cash deposits on June 30, 2012 were secured by federal depository insurance. The remaining bank balance of $6,384,931 was covered by the New Jersey Governmental Unit Deposit Protection Act (GUDPA). Pursuant to GASB Statement No. 40, “Deposit and Investment Risk Disclosures” (“GASB 40”), the District’s NOW accounts are profi led in order to determine exposure, if any, to Custodial Credit Risk (risk that, in the event of failure of the counterparty, the District would not be able to recover the value of its deposits or investment). Deposits are considered to be exposed to Custodial Credit Risk if they are: uncollateralized (securities not pledged to the depositor), collateralized with securities held by the pledging financial institution, or collateralized with securities held by the financial institution’s trust department or agent but not in the government’s name. At June 30, 2012, all of the District’s deposits were collateralized by securities held in its name and, accordingly, not exposed to custodial credit risk. The District does not have a policy for the management of custodial credit risk, other than depositing all its funds in banks covered by GUDPA. At least five percent of the District’s deposits were fully collateralized by funds held by financial institutions, but not in the name of the District. Due to the nature of GUDPA, further information is not available regarding the full amount that is collateralized.
Investments
New Jersey statutes permit the District to purchase the following types of securities:
a. Bonds or other obligations of the United States or obligations guaranteed by the United States.
b. Bond of any Federal Intermediate Credit Bank, Federal Home Loan Bank, Federal National Mortgage Agency or of any United States Bank for Cooperatives which have a maturity date not greater than twelve months from the date of purchase.

TOWNSHIP OF OCEAN BOARD OF EDUCATION Notes to the Basic Financial Statements
June 30, 2012
Continued 40
NOTE 3. DEPOSITS AND INVESTMENTS (continued) Investments (continued)
c. Bonds or other obligations of the School District.
d. New Jersey Cash Management Fund, New Jersey Arbitrage Rebate Management Fund and M.B.I.A. Class.
The Board of Education participates in the New Jersey Asset and Rebate Management Program which is a joint investment trust for local government units in the State of New Jersey. It was formed to make available comprehensive investment management, accounting and rebate calculation services for the issuers of tax exempt bonds and complies with all New Jersey statutes and regulations for the allowable investment of public funds. The Board participates in the joint investment account which provides a convenient method for local governments to pool funds for temporary investing. These investments consist of United States Treasury Bills and notes and other obligations guaranteed by the United States of America, Federal agency bonds and notes with a maturity not greater than 397 days, and fully collateralized repurchase agreements. The carrying amount and fair value as of June 30, 2012 was $2,616,264 . Custodial Credit Risk: Pursuant to GASB 40, the NJARM, a pooled investment, is exempt from custodial credit risk disclosure. The District does not have a policy for custodial credit risk. Credit Risk: The District does not have an investment policy regarding the management of credit risk. GASB 40 requires that disclosure be made as to the credit rating of all debt security investments except for obligations of the U.S. government or investments guaranteed by the U.S. government. The NJARM is rated AAAm by Standard and Poor’s. Interest Rate Risk: The District does not have policy to limit interest rate risk. The weighted average maturity of the NJARM portfolio at December 31, 2011, was 48 days. NOTE 4. RECEIVABLES Receivables at June 30, 2012, consisted of accounts (rent and tuition), accrued interest, interfund, intergovernmental, and property taxes. All receivables are considered collectible in full. A summary of the principal items of intergovernmental receivables are as follows:
Governmental Fund Government Wide
State Aid 105,516$ 106,045$
Federal Aid 431,236 448,256
Other 353,330 57,596
Gross Receivables 890,082 611,897
Less: Allowance for Uncollectibles - -
Total Receivables, net 890,082$ 611,897$
NOTE 5. RESTRICTED ASSETS The proceeds of the District’s bonds are classified as restricted assets (cash, cash equivalents and accounts receivables) as they are restricted to payments relating to the referendum projects in the capital projects fund, funds set aside in a capital reserve fund, and accounts receivable in the special revenue fund.

TOWNSHIP OF OCEAN BOARD OF EDUCATION Notes to the Basic Financial Statements
June 30, 2012
Continued 41
NOTE 6. CAPITAL ASSETS
The following schedule is a summarization of the governmental activities changes in capital assets for the year ended June 30, 2012:
Beginning Transfers or Transfers or EndingBalance Additions Retirements Balance
Governmental activities:Capital assets not being depreciated:
Land 984,968$ -$ -$ 984,968$ Construction in progress - - - -
Total capital assets not being depreciated 984,968 - - 984,968
Capital assets being depreciated:
Site improvements 1,910,696 - - 1,910,696 Building and building improvements 50,759,014 309,540 - 51,068,554 Machinery and equipment 12,000,963 884,260 409,052 12,476,171
Totals at historical cost 64,670,673 1,193,800 409,052 65,455,421
Less accumulated depreciation for:Building and improvements 17,124,115 1,014,153 - 18,138,268 Equipment 9,356,296 668,634 409,052 9,615,878
26,480,411 1,682,787 409,052 27,754,146
Total capital assets being depreciated, net of accumulated depreciation 38,190,262 (488,987) - 37,701,275
Government activity capital assets, net 39,175,230$ (488,987)$ -$ 38,686,243$
Depreciation expense was charged to functions/programs of the District as follows:
Instruction 946,712$ Student and instruction related services 209,770 General and business adminstrative services 71,806 Plant operations and maintenance 113,677 Pupil transportation 268,001 School administrative services 72,821
Total 1,682,787$
The following is a summary of the business -type capital assets for the year ended June 30, 2012:
Beginning Transfers or Transfers or EndingBalance Additions Retirements Balance
Business-type activities
Capital assets being depreciated: Equipment 471,256$ 25,814$ -$ 497,070$ Less accumulated depreciation 407,020 13,515 - 420,535
Enterprise fund capital assets, net 64,236$ 12,299$ -$ 76,535$

TOWNSHIP OF OCEAN BOARD OF EDUCATION Notes to the Basic Financial Statements
June 30, 2012
Continued 42
NOTE 7. LONG-TERM LIABILITIES Bonds Payable Bonds are authorized in accordance with State law by the voters of the municipality through referendums. All bonds are retired in serial installments within the statutory period of usefulness. Bonds issued by the Board are general obligation bonds. Principal and interest due on all serial bonds outstanding is as follows:
Fiscal YearEnding June 30, Principal Interest Total
2013 2,645,000 634,248 3,279,248 2014 2,690,000 554,442 3,244,442 2015 2,745,000 469,214 3,214,214 2016 1,265,000 369,367 1,634,367 2017 1,275,000 326,448 1,601,448
2018 -2022 6,565,000 841,902 7,406,902 2023 515,000 10,944 525,944
17,700,000$ 3,206,565$ 20,906,565$
Bonds Authorized But Not Issued As of June 30, 2012, the District had no authorized but not issued bonds. Capital Lease Payable The district is leasing equipment totaling $139,314 under capital leases. The capital lease is for a term of no more than five years. The following is a schedule of minimum lease payments under this capital lease and the present value of the net minimum lease payments at June 30, 2012.
Fiscal Year
Ended June 30, Amount
2013 31,222$
2014 31,222
2015 31,222
2016 31,222
2017 13,009
Total 137,897
Less: amount representing interest (14,339)
Present value of net minimum lease payments 123,558
Unamortized Bond Premium Unamortized bond premium, net of bond issuance costs, as of June 30, 2012 and 2011 is $647,158 and $736,798, respectively.

TOWNSHIP OF OCEAN BOARD OF EDUCATION Notes to the Basic Financial Statements
June 30, 2012
Continued 43
NOTE 7. LONG-TERM LIABILITIES (continued) Changes in Long-Term Liabilities
Balance
July 1, 2011 Increases Decreases
Balance
June 30, 2012
Amounts Due
within One
Year
Compensated absencespayable 2,315,752$ 237,036$ 91,040$ 2,461,748$ 198,189$
Serial bonds payable withinterest rates rangingfrom 4.10% to 4.875% 20,310,000 - 2,610,000 17,700,000 2,645,000
Capital lease payable withinterest rate of 4.98% - 139,314 15,756 123,558 25,649
22,625,752$ 376,350$ 2,716,796$ 20,285,306$ 2,868,838$
Compensated absences and capital lease liabilities are liquidated by expenditures charged to the general fund. Serial bonds payable are liquidated by expenditures charged to the debt service fund. NOTE 8. PENSION PLANS Plan Descriptions Substantially all of the Board’s employees participate in one of the following contributory defined benefit public employee retirement systems which have been established by the State statute: the Public Employees’ Retirement System (PERS) or the Teachers' Pension and Annuity Fund (TPAF). These systems are sponsored and administered by the State of New Jersey. The Teachers’ Pension and Annuity Fund Retirement System is considered a cost-sharing multiple -employer plan with a special funding situation, as under current statute, all employer contributions are made by the State of New Jersey on behalf of the Board and the system’s other related non-contributing employers. The Public Employees’ Retirement System is considered a cost-sharing multiple -employer plan. Teachers' Pension and Annuity Fund (TPAF) The Teachers' Pension and Annuity Fund was established as of January 1, 1955, under the provisions of N.J.S.A. 18A:66, to provide coverage including post-retirement health care to substantially all full-time public employees of the State. Membership is mandatory for such employees and vesting occurs after 10 years of service for pension benefits and 25 years for health care coverage. Members are eligible for retirement at age 55 with an annual benefit generally determined to be 1/55th of the average annual compensation for the highest three fiscal years’ compensation for each year of membership during years of creditable service. Early retirement is available for those under age 55 participating in TPAF with 25 or more years of credited service. Anyone who retires early and is under age 55 receives retirement benefits as calculated in the above mentioned formula but at a reduced rate (one quarter of one percent for each month the member lacks of attaining age 55).

TOWNSHIP OF OCEAN BOARD OF EDUCATION Notes to the Basic Financial Statements
June 30, 2012
Continued 44
NOTE 8. PENSION PLANS (continued) Public Employees' Retirement System (PERS) The Public Employees' Retirement System was established as of January 1, 1955, under the provisions of N.J.S.A. 43:15A, to provide coverage including post-retirement health care to substantially all full-time employees of the State or any county, municipality, school district, or public agency, provided the employee is not a member of another State-administered retirement system. Membership is mandatory for such employees and vesting occurs after 8 to 10 years of service and 25 years for health care coverage. Members are eligible for retirement at age 55 with an annual benefit generally determined to be 1/55th of the average annual compensation for the highest three fiscal years’ compensation for each year of membership during years of creditable service. Early retirement is available to those under age 55 with 25 or more years of credited service. Anyone who retires early and is under age 55 receives retirement benefits as calculated in the above formula, but at a reduced rate (one quarter of one percent for each month the member lacks of attaining age 55) The State of New Jersey, Department of the Treasury, Division of Pensions and Benefits, issues publicly available financial reports that include the financial statements and required supplementary information for TPAF and PERS. The financial reports may be obtained by writing to the State of New Jersey, Department of the Treasury, Division of Pensions and Benefits, P.O. Box 295, Trenton, New Jersey 08625-0295. Funding Policy
The contribution policy is set by New Jersey State statutes and contributions are required by active members and contributing employers. Plan member and employer contributions may be amended by State of New Jersey legislation. TPAF and PERS provide for employee contributions of five percent of employees’ annual compensation, as defined. Employers are required to contribute at an actuarially determined rate in both TPAF and PERS. The actuarially determined contribution includes funding for cost-of-living adjustments, noncontributory death benefits, and post-retirement medical premiums. Under current statute the Board is a non-contributing employer of the TPAF. The Board’s actuarially determined contributions to PERS for the years ended June 30, 2012, 2011 and 2010 were $861,400, $841,059 and $601,450, respectively, equal to the required contributions for each year. During the year ended June 30, 2012, the State of New Jersey contributed $2,975,741 to the TPAF for post-retirement medical benefits and normal costs of pension on behalf of the Board. Also, in accordance with N.J.S.A. 18A:66-66 the State of New Jersey reimbursed the Board $2,169,792 during the fiscal year ended June 30, 2012 for the employer’s share of social security contributions for TPAF members, as calculated on their base salaries. This amount has been included in the District -wide financial statements and the fund-based statements as revenues and expenditures in accordance with GASB Statement No. 24. NOTE 9. POST-RETIREMENT BENEFITS P.L. 1987, c. 384 and P.L. 1990, c. 6 required Teachers’ Pensions and Annuity Fund (TPAF) and Public Employees’ Retirement System (PERS), respectively, to fund post-retirement medical benefits for those State employees who retire after accumulating 25 years of credited service or on a disability retirement. P.L. 2007, c. 103 amended the law to eliminate the funding of post-retirement medical benefits through the TPAF and PERS. It created separate funds outside of the pension plans for the funding and payment of post-retirement medical benefits for retired State employees and retired educational employees. As of June 30, 2011, there were 93,323 retirees, statewide, receiving post-retirement medical benefits. The cost of these benefits is funded through contributions by the State in accordance with P.L. 1994, c. 62. Funding of post-retirement medical premiums changed from a pre-funding basis to a pay-as-you-go basis beginning in fiscal year 1994.

TOWNSHIP OF OCEAN BOARD OF EDUCATION Notes to the Basic Financial Statements
June 30, 2012
Continued 45
NOTE 9. POST-RETIREMENT BENEFITS (continued)
The State is also responsible for the cost attributable to P.L. 1992 c. 126, which provides free health benefits to members of PERS and the Alternate Benefit Program who retired from a board of education or county college with 25 years of service. The State paid $144 million toward Chapter 126 benefits for 15,709 eligible retired members in fiscal year 2011.
In June 2004, the Governmental Accounting Standards Board (GASB) issued Statement No. 45, Financial Reporting by Employers for Postemployment Benefits Other Than Pension . This statement established standards of accounting and financial reporting for other postemployment benefits (OPEB) expense/expenditures and related OPEB liabilities or OPEB assets, note disclosures and required supplementary information (RSI) in the financial reports of state and local government employers. Since the State of New Jersey pays OPEB benefits on behalf of the District and the State is recording the OPEB liability on its financial statements, this GASB does not apply to the District.
NOTE 10. RISK MANAGEMENT AND HEALTH INSURANCE
The District is exposed to various risks of loss related to torts; theft of, damage to, and destruction of assets; errors and omissions; injuries to employees ; and natural disaste rs.
Property and Liability Insurance
The District maintains commercial insurance coverage for property, liability, student accident and surety bonds and does not retain risk of loss. A complete schedule of insurance coverage can be found in the Statistical Section of this Comprehensive Annual Financial Report. There have been no significant reductions in insurance coverage from the prior year and no settlements that have exceeded insurance coverage for the last three years.
New Jersey Unemployment Compensation Insurance
The District has elected to fund its New Jersey Unemployment Compensation Insurance under the “Benefit Reimbursement Method.” Under this plan, the District is required to reimburse the New Jersey Unemployment Trust Fund for benefits paid to its former employees and charged to its account with the State. The District is billed quarterly for amounts due to the State. The table below is a summary of the district contributions, employee contributions, reimbursements to the state for benefits paid and the ending balance of the district’s trust fund for the current and previous two years:
Fiscal Year Interest
Employee
Contributions
Amount
Reimbursed Ending Balance
2011 - 2012 106$ 102,313$ (198,008)$ 280,526$ 2010 - 2011 598 99,232 (347,134) 376,115 2009 - 2010 1,608 114,204 (147,744) 623,419
Health Insurance
Beginning in the fiscal year 2009, the District began to self-insure for employee prescription plans. Costs associated with these risks are reported in the internal service fund.

TOWNSHIP OF OCEAN BOARD OF EDUCATION Notes to the Basic Financial Statements
June 30, 2012
Continued 46
NOTE 10. RISK MANAGEMENT AND HEALTH INSURANCE (continued) Health Insurance (continued) Liabilities for unpaid claims are based on recommendations by third-party administrator s. There have been no significant reductions in insurance coverage from coverage in prior years. The amounts of settlements have not exceeded insurance coverage in any of the past three fiscal years. The following schedule represents the changes in claims liability for the past three fiscal years for the District’s Self Insurance Program:
Beginning of
Fiscal-Year
Liability
Current-Year
Claims and
Changes in
Estimates Claims Payments
Balance at Fiscal
Year-End2011-12 $ 518,680 $ 2,262,000 $ (2,078,012) $ 702,668
2010-11 392,466 2,104,500 (1,978,286) 518,680 2009-10 333,086 2,102,469 (2,043,089) 392,466
NOTE 11. DEFERRED COMPENSATION The Board offers its employees a deferred compensation plan created in accordance with Internal Revenue Code Section 403(b). The plan, which is administered by various insurance companies, permits participants to defer a portion of their salary until future years. Amounts deferred under the plan are not available to employees until termination, retirement, death or unforeseeable emergency. The Board offers its employees a deferred compensation plan created in accordance with Internal Revenue Code Section 457. The plan permits participants to defer a portion of their salary until future years. All amounts of compensation deferred are held for the exclusive benefit of plan participants and beneficiaries. Amounts deferred under the plan are distributable upon separation from service, death or unforeseeable emergency. Participants’ rights under the plan are equal to the fair market value of the deferred account for each participant. The District has no liability for losses under the plan. The plan administrators are AXA- Equitable, ING- USA, Metropolitan Life, Ameriprise, and VALIC (Variable Annuity Life Insurance Co.). NOTE 12. INTERFUND RECEIVABLES, PAYABLES AND TRANSFERS As of June 30, 2012, the interfund receivables and payables that resulted from regularly recurring operational transfers are detailed below:
Due to the General Fund from the Special Revenue Fund to cover cash overdraft 296,448$

TOWNSHIP OF OCEAN BOARD OF EDUCATION Notes to the Basic Financial Statements
June 30, 2012
Continued 47
NOTE 12. INTERFUND RECEIVABLES, PAYABLES AND TRANSFERS (continued) The interfund between the capital projects fund and debt service fund represent interest earned on investments in the capital projects fund that must be transferred to the general fund The interfund between the general fund and the capital projects and special revenue funds represents loans between the funds. All interfunds are expected to be paid within one year.
There were no interfund transfers during the year.
NOTE 13. ECONOMIC DEPENDENCY The School District is dependent on the State of New Jersey for a substantial portion of its operating funds. Due to additional funding uncertainties at the State level, funding for school districts was reduced. The ultimate effect of possible reductions in funding on the District’s future operations is not yet determinable. NOTE 14. CONTINGENT LIABILITIES Litigation The Board is involved in a few claims incidental to its operations. In the opinion of the administration and legal counsel, the ultimate resolution of these matters will not have a material adverse effect on the financial position of the District. Grant Programs The School District participates in federal and state grant assistance programs. These programs are subject to program compliance audits by the grantors or their representatives. The School District is potentially liable for expenditures which may be disallowed pursuant to the terms of these grant programs. Management is not aware of any material items of noncompliance which would result in the disallowance of program expenditures. NOTE 15. CAPITAL RESERVE ACCOUNT A capital reserve account was established by the District by inclusion of $400,000 during 2000-2001 for the accumulation of funds for use as capital outlay expendit ures in subsequent fiscal years. The capital reserve account is maintained in the general fund and its activity is included in the general fund annual budget. Funds placed in the capital reserve account are restricted to capital projects in the District’s approved Long Range Facilities Plan (LRFP). Upon submission of the LRFP to the department, a district may increase the balance in the capital reserve by appropriating funds in the annual general fund budget certified for taxes or by transfer by Board resolution at year end (June 1 to June 30) of any unanticipated revenue or unexpended line-item appropriation amounts, or both. A district may also appropriate additional amounts when the express approval of the voters has been obtained either by a separate proposal at budget time or by a special question at one of the four special elections authorized pursuant to N.J.S.A 19:60-2. Pursuant to N.J.A.C. 6A:23A-14.1(g), the balance in the account cannot at any time exceed the local support costs of uncompleted capital projects in its approved LRFP.

TOWNSHIP OF OCEAN BOARD OF EDUCATION Notes to the Basic Financial Statements
June 30, 2012
Continued 48
NOTE 15. CAPITAL RESERVE ACCOUNT (continued) The activity of the capital reserve for the July 1, 2011 to June 30, 2012 fiscal year is as follows:
Beginning balance, July 1, 2011 1,575,305$
Interest earnings 343 Deposits (per Board resolution June 26, 2012) 950,000 Withdrawals Board resolution (per approved budget) (451,000)
Ending balance, June 30, 2012 2,074,648$
The June 30, 2012 LRFP balance of local support costs of uncompleted capital projects is $4,236,976. The withdrawals from the capital reserve were for use in a DOE approved facilities project, consistent with the district’s Long Range Facilities Plan. NOTE 16. DEFICIT FUND BALANCES As reflected on Exhibit A-1, Statement of Net Assets, a deficit in unrestricted net assets of $3,165,792 existed as of June 30, 2012 for governmental activities. The primary cause of this deficit is the District not recognizing the receivable for the last state aid payment and the recording of the long-term liability for compensated absences. In accordance with full accrual accounting, which is the basis of accounting for Exhibit A-1, Statement of Net Assets, such liabilities are required to be recorded in the period in which they are incurred. However, in accordance with the rules and regulations that govern the District in the formulation of their annual budget (see Note 1), compensated absences that relate to future services, or that are contingent on a specific event outside the control of the District and its employees, are funded in the period in which such services are rendered or in which such events take place. Therefore, this deficit in unrestricted net assets for governmental activities does not indicate that the District is facing financial difficulties. NOTE 17. FUND BALANCE APPROPRIATED
General Fund (Exhibit B-1)
Of the $8,113,720 General Fund balance in the fund financial statements at June 30, 2012, $641,904 is reserved for encumbrances, $2,835,591 is reserved as excess surplus in accordance with N.J.S.A. 18A:7F-7 ($1,843,948 of the total reserve for excess surplus has been appropriated and included as anticipated revenue for the year ending June 30, 2012); $2,074,648 has been reserved in the Capital Reserve Account, $500,000 has been appropriated and included as anticipated revenue for the year ending June 30, 2012; and $217,629 is unreserved and undesignated .
Debt Service Fund
Of the Debt Service Fund fund balance at June 30, 2012, $2 is reserved in accordance with N.J.S.A. 7F-41c(2). NOTE 18. RELATED ORGANIZATIONS Not included in the School Board’s financial statements are certain Parent-Teacher Associations (PTAs), Parent-Teacher -Student Associations (PTSAs) and athletic and band booster clubs. These agencies provide services to students and employees of the School Board, but are separate legal entities having sufficient autonomy in the management of the own affairs to distinguish them as separate from the administrative organization of the School Board. The School Board does not account for these entities as component units or joint ventures; it does not maintain an ongoing financial interest or have responsibility for these entities.

TOWNSHIP OF OCEAN BOARD OF EDUCATION Notes to the Basic Financial Statements
June 30, 2012
49
NOTE 20. SUBSEQUENT EVENT Management has reviewed and evaluated all events and transactions that occurred from June 30, 2012 through October 26, 2011, the date that the financial statements were issued, for possible disclosure and recognition in the financial statements. The following item occurred subsequent to June 30, 2012. The contract with the Township of Ocean Education Association expired on June 30, 2012. As of the date of the financial statements, a tentative memorandum of understanding has been reached but not ratified by either party.

REQUIRED SUPPLEMENTARY INFORMATION
PART II

BUDGETARY COMPARISON SCHEDULES
Budgetary Comparison Schedules provide a one-year comparison of original budget, budget transfers, final budget and actual information for the General Fund and Special Revenue Fund.
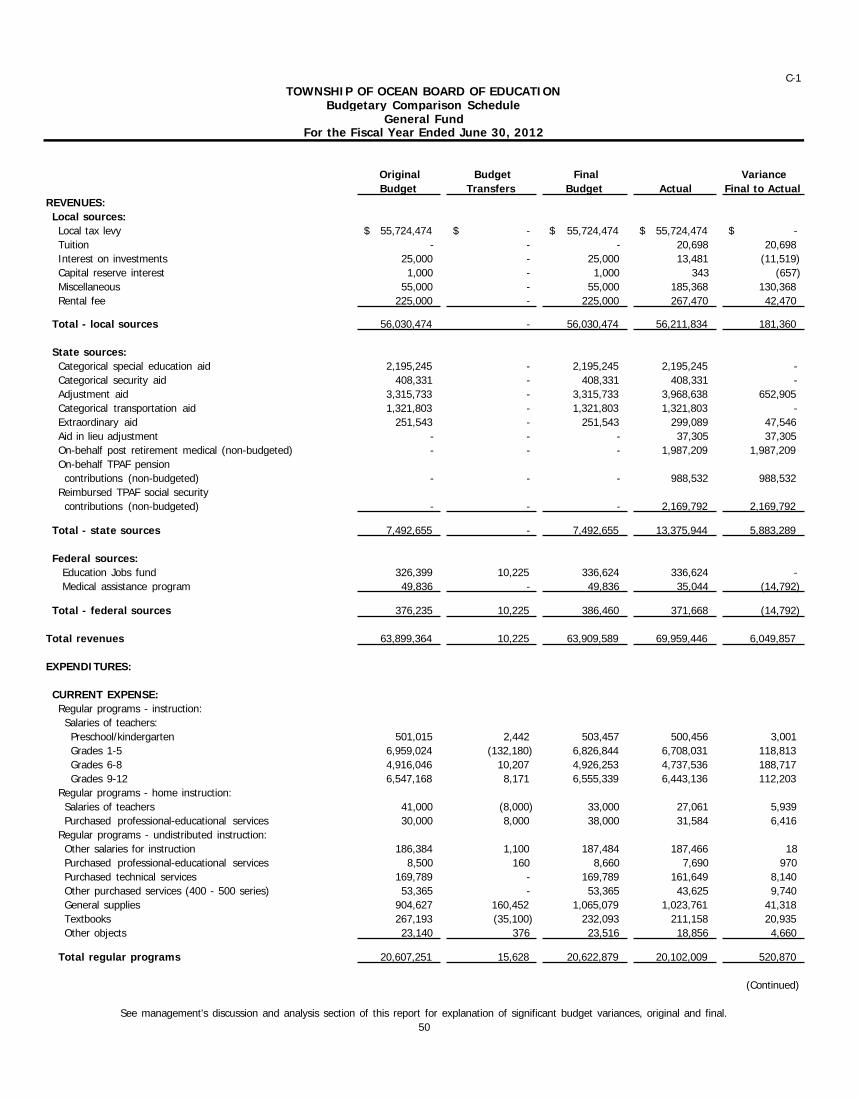
C-1
TOWNSHIP OF OCEAN BOARD OF EDUCATIONBudgetary Comparison Schedule
General FundFor the Fiscal Year Ended June 30, 2012
Original
Budget
Budget
Transfers
Final
Budget Actual
Variance
Final to Actual
REVENUES:
Local sources:
Local tax levy 55,724,474$ -$ 55,724,474$ 55,724,474$ -$
Tuition - - - 20,698 20,698
Interest on investments 25,000 - 25,000 13,481 (11,519)
Capital reserve interest 1,000 - 1,000 343 (657)
Miscellaneous 55,000 - 55,000 185,368 130,368
Rental fee 225,000 - 225,000 267,470 42,470
Total - local sources 56,030,474 - 56,030,474 56,211,834 181,360
State sources:
Categorical special education aid 2,195,245 - 2,195,245 2,195,245 -
Categorical security aid 408,331 - 408,331 408,331 -
Adjustment aid 3,315,733 - 3,315,733 3,968,638 652,905
Categorical transportation aid 1,321,803 - 1,321,803 1,321,803 -
Extraordinary aid 251,543 - 251,543 299,089 47,546
Aid in lieu adjustment - - - 37,305 37,305
On-behalf post retirement medical (non-budgeted) - - - 1,987,209 1,987,209
On-behalf TPAF pension
contributions (non-budgeted) - - - 988,532 988,532
Reimbursed TPAF social security
contributions (non-budgeted) - - - 2,169,792 2,169,792
Total - state sources 7,492,655 - 7,492,655 13,375,944 5,883,289
Federal sources:
Education Jobs fund 326,399 10,225 336,624 336,624 -
Medical assistance program 49,836 - 49,836 35,044 (14,792)
Total - federal sources 376,235 10,225 386,460 371,668 (14,792)
Total revenues 63,899,364 10,225 63,909,589 69,959,446 6,049,857
EXPENDITURES:
CURRENT EXPENSE:
Regular programs - instruction:
Salaries of teachers:
Preschool/kindergarten 501,015 2,442 503,457 500,456 3,001
Grades 1-5 6,959,024 (132,180) 6,826,844 6,708,031 118,813
Grades 6-8 4,916,046 10,207 4,926,253 4,737,536 188,717
Grades 9-12 6,547,168 8,171 6,555,339 6,443,136 112,203
Regular programs - home instruction:
Salaries of teachers 41,000 (8,000) 33,000 27,061 5,939
Purchased professional-educational services 30,000 8,000 38,000 31,584 6,416
Regular programs - undistributed instruction:
Other salaries for instruction 186,384 1,100 187,484 187,466 18
Purchased professional-educational services 8,500 160 8,660 7,690 970
Purchased technical services 169,789 - 169,789 161,649 8,140
Other purchased services (400 - 500 series) 53,365 - 53,365 43,625 9,740
General supplies 904,627 160,452 1,065,079 1,023,761 41,318
Textbooks 267,193 (35,100) 232,093 211,158 20,935
Other objects 23,140 376 23,516 18,856 4,660
Total regular programs 20,607,251 15,628 20,622,879 20,102,009 520,870
(Continued)
See management's discussion and analysis section of this report for explanation of significant budget variances, original and final.
50

C-1
TOWNSHIP OF OCEAN BOARD OF EDUCATIONBudgetary Comparison Schedule
General FundFor the Fiscal Year Ended June 30, 2012
Original
Budget
Budget
Transfers
Final
Budget Actual
Variance
Final to Actual
Special education - instruction:
Learning and/or language disabilities:
Salaries of teachers 1,024,244$ (4,774)$ 1,019,470$ 1,002,868$ 16,602$
Other salaries for instruction 242,814 (89,207) 153,607 145,813 7,794
Purchased professional-educational services - 6,440 6,440 6,440 -
General supplies 9,227 2,280 11,507 11,162 345
Textbooks 3,585 (1,480) 2,105 1,818 287
Total learning and/or language disabilities 1,279,870 (86,741) 1,193,129 1,168,101 25,028
Behavioral disabilities:
Salaries of teachers 388,009 1,897 389,906 388,906 1,000
Other salaries for instruction 44,530 (22,014) 22,516 22,515 1
General supplies 2,244 930 3,174 3,126 48
Textbooks 1,961 (1,960) 1 - 1
Total behavioral disabilities 436,744 (21,147) 415,597 414,547 1,050
Multiple disabilities:
Salaries of teachers 203,317 992 204,309 203,309 1,000
Other salaries for instruction 90,779 84,608 175,387 173,342 2,045
General supplies 5,666 1,220 6,886 6,382 504
Textbooks 2,216 1,180 3,396 3,347 49
Total multiple disabilities 301,978 88,000 389,978 386,380 3,598
Resource room:
Salaries of teachers 2,482,925 (48,474) 2,434,451 2,420,239 14,212
General supplies 10,556 80 10,636 10,383 253
Textbooks 30,164 (2,010) 28,154 25,536 2,618
Total resource room 2,523,645 (50,404) 2,473,241 2,456,158 17,083
Preschool disabilities - part-time:
Salaries of teachers 367,455 741 368,196 345,145 23,051
Other salaries for instruction 98,818 35,336 134,154 126,512 7,642
General supplies 7,894 (990) 6,904 4,099 2,805
Total preschool disabilities - part-time 474,167 35,087 509,254 475,756 33,498
Total special education - instruction 5,016,404 (35,205) 4,981,199 4,900,942 80,257
Basic skills/remedial - instruction:
Salaries of teachers 600,624 (17,542) 583,082 561,261 21,821
Other salaries for instruction 18,787 - 18,787 14,393 4,394
Other purchased services (400 - 500 series) 200 (200) - - -
General supplies 5,688 1,150 6,838 6,247 591
Total basic skills/remedial - instruction 625,299 (16,592) 608,707 581,901 26,806
(Continued)
See management's discussion and analysis section of this report for explanation of significant budget variances, original and final.
51

C-1
TOWNSHIP OF OCEAN BOARD OF EDUCATIONBudgetary Comparison Schedule
General FundFor the Fiscal Year Ended June 30, 2012
Original
Budget
Budget
Transfers
Final
Budget Actual
Variance
Final to Actual
Bilingual education - instruction:
Salaries of teachers 628,758$ (17,870)$ 610,888$ 586,130$ 24,758$
Other purchased services (400 - 500 series) 170 4 174 174 -
General supplies 5,042 - 5,042 3,419 1,623
Total bilingual education - instruction 633,970 (17,866) 616,104 589,723 26,381
School sponsored cocurricular activities - instruction:
Salaries 332,768 113 332,881 281,164 51,717
Purchased services (300 - 500 series) 31,095 - 31,095 30,660 435
Supplies and materials 10,775 (160) 10,615 1,942 8,673
Other objects 1,645 - 1,645 510 1,135
Transfers to cover deficit 5,000 - 5,000 2,000 3,000
Total school sponsored cocurricular
activities - instruction 381,283 (47) 381,236 316,276 64,960
School sponsored athletics - instruction:
Salaries 660,736 639 661,375 634,187 27,188
Purchased services (300 - 500 series) 161,435 (3,500) 157,935 135,724 22,211
Supplies and materials 59,463 3,500 62,963 55,393 7,570
Other objects 8,880 - 8,880 6,416 2,464
Transfers to cover deficit 77,250 - 77,250 70,496 6,754
Total school sponsored athletics - instruction 967,764 639 968,403 902,216 66,187
Total - instruction 28,231,971 (53,443) 28,178,528 27,393,067 785,461
Undistributed expenditures:
Instruction:
Tuition to other LEAs within state - regular - 20,000 20,000 6,023 13,977
Tuition to other LEAs within state - special 380,290 125,337 505,627 486,408 19,219
Tuition to county vocational school districts - regular 597,800 35,000 632,800 577,125 55,675
Tuition to county vocational school districts - special 61,700 11,300 73,000 66,500 6,500
Tuition to CSSD and regional day schools 55,150 2,590 57,740 57,740 -
Tuition to private schools for disabled within state 2,371,194 (264,959) 2,106,235 1,981,335 124,900
Tuition state facilities 35,250 55,232 90,482 90,482 -
Total undistributed expenditures - instruction 3,501,384 (15,500) 3,485,884 3,265,613 220,271
Attendance and social work services:
Salaries 78,002 383 78,385 78,384 1
Other purchased services - 300 300 118 182
Total attendance and social work services 78,002 683 78,685 78,502 183
Health services:
Salaries 434,306 2,131 436,437 436,435 2
Purchased professional and technical services 42,320 (1,300) 41,020 26,808 14,212
Supplies and materials 16,656 1,000 17,656 15,667 1,989
Total health services 493,282 1,831 495,113 478,910 16,203
(Continued)
See management's discussion and analysis section of this report for explanation of significant budget variances, original and final.
52

C-1
TOWNSHIP OF OCEAN BOARD OF EDUCATIONBudgetary Comparison Schedule
General FundFor the Fiscal Year Ended June 30, 2012
Original
Budget
Budget
Transfers
Final
Budget Actual
Variance
Final to Actual
Speech, occupational therapy, physical
therapy, related services:
Salaries 821,764$ 2,657$ 824,421$ 788,017$ 36,404$
Purchased professional-educational services 217,353 13,700 231,053 206,229 24,824
Supplies and materials 4,164 1,770 5,934 5,809 125
Other objects 1,000 - 1,000 460 540
Total speech, occupational therapy, physical
therapy, related services 1,044,281 18,127 1,062,408 1,000,515 61,893
Other support services - students - extra services:
Salaries 204,590 37,756 242,346 240,215 2,131
Total other support services - students - extra services 204,590 37,756 242,346 240,215 2,131
Other support services - guidance:
Salaries of other professional staff 990,297 3,954 994,251 984,603 9,648
Salaries of secretarial and clerical assistants 121,605 596 122,201 122,200 1
Other purchased services (400 - 500 series) 9,735 (1,000) 8,735 8,302 433
Supplies and materials 49,830 (212) 49,618 46,710 2,908
Other objects 5,965 1,212 7,177 5,891 1,286
Total other support services - guidance 1,177,432 4,550 1,181,982 1,167,706 14,276
Other support services - child study team:
Salaries of other professional staff 1,447,364 (214) 1,447,150 1,388,841 58,309
Salaries of secretarial and clerical assistants 64,852 5,170 70,022 69,571 451
Purchased professional-educational services 30,000 (4,700) 25,300 20,836 4,464
Other purchased professional and technical services 22,990 1,200 24,190 22,500 1,690
Other purchased services (400 - 500 series) 4,213 1,800 6,013 4,879 1,134
Supplies and materials 22,501 4,180 26,681 24,909 1,772
Other objects 5,100 - 5,100 4,163 937
Total other support services - child study team 1,597,020 7,436 1,604,456 1,535,699 68,757
Improvement of instructional services:
Salaries of supervisors of instruction 739,320 - 739,320 733,319 6,001
Salaries of other professional staff 90,500 6,145 96,645 96,645 -
Salaries of secretarial and clerical assistants 117,905 413 118,318 118,316 2
Other purchased services (400 - 500 series) 11,500 (3,000) 8,500 7,951 549
Supplies and materials 9,053 - 9,053 8,811 242
Other objects 3,000 - 3,000 2,945 55
Total improvement of instructional services 971,278 3,558 974,836 967,987 6,849
Educational media services/school library:
Salaries 414,230 1,624 415,854 393,404 22,450
Purchased professional and technical services 3,750 - 3,750 3,750 -
Other purchased services (400 - 500 series) 70 - 70 - 70
Supplies and materials 78,326 2,600 80,926 73,357 7,569
Other objects 13,402 (13,000) 402 100 302
Total educational media services/school library 509,778 (8,776) 501,002 470,611 30,391
(Continued)
See management's discussion and analysis section of this report for explanation of significant budget variances, original and final.
53

C-1
TOWNSHIP OF OCEAN BOARD OF EDUCATIONBudgetary Comparison Schedule
General FundFor the Fiscal Year Ended June 30, 2012
Original
Budget
Budget
Transfers
Final
Budget Actual
Variance
Final to Actual
Instructional Staff Training Services:
Salaries of other professional staff 62,000$ (1,250)$ 60,750$ 51,274$ 9,476$
Salaries of secretarial and clerical assistants 7,043 34 7,077 7,077 -
Purchased professional-educational services 5,500 (4,770) 730 725 5
Other purchased services (400 - 500 series) 23,150 4,180 27,330 18,086 9,244
Total instructional staff training services 97,693 (1,806) 95,887 77,162 18,725
Support services - general administration:
Salaries 459,946 3,123 463,069 457,369 5,700
Legal services 130,000 (14,000) 116,000 62,538 53,462
Audit fees 42,000 - 42,000 34,000 8,000
Architectural/Engineering services 10,000 21,000 31,000 10,005 20,995
Other purchased professional services 84,450 76,000 160,450 81,657 78,793
Purchased technical services 14,000 5,000 19,000 12,445 6,555
Communications/telephone 293,000 20,000 313,000 211,952 101,048
BOE other purchased professional services 500 1,600 2,100 702 1,398
Other purchased services (400 - 500 series) 66,000 (11,595) 54,405 17,784 36,621
General supplies 23,000 (4,100) 18,900 13,611 5,289
BOE in-house training/meeting supplies 2,500 2,500 5,000 4,187 813
Miscellaneous expenditures 51,500 (232) 51,268 39,585 11,683
BOE membership dues and fees 500 232 732 650 82
Total support services - general administration 1,177,396 99,528 1,276,924 946,485 330,439
Support services - school administration:
Salaries of principals/assistant principals 1,114,090 - 1,114,090 1,111,919 2,171
Salaries of other professional staff 209,400 - 209,400 209,400 -
Salaries of secretarial and clerical assistants 606,417 (4,188) 602,229 550,656 51,573
Purchased professional and technical services 1,400 - 1,400 - 1,400
Other purchased services (400 - 500 series) 214,341 (4,000) 210,341 149,157 61,184
Supplies and materials 55,581 (4,200) 51,381 45,070 6,311
Other objects 27,000 3,000 30,000 22,630 7,370
Total support services - school administration 2,228,229 (9,388) 2,218,841 2,088,832 130,009
Central services:
Salaries 499,869 1,648 501,517 494,064 7,453
Purchased professional services 77,745 20,543 98,288 64,490 33,798
Purchased technical services 84,000 2,000 86,000 61,561 24,439
Other purchased services (400 - 500 series) 38,050 (697) 37,353 24,284 13,069
Supplies and materials 19,498 (950) 18,548 8,423 10,125
Miscellaneous expenditures 8,490 - 8,490 5,331 3,159
Total central services 727,652 22,544 750,196 658,153 92,043
Administrative information technology:
Salaries 436,094 5,432 441,526 438,605 2,921
Other purchased services (400 - 500 series) 16,979 30,000 46,979 16,512 30,467
General supplies 2,000 - 2,000 - 2,000
Total administrative information technology 455,073 35,432 490,505 455,117 35,388
(Continued)
See management's discussion and analysis section of this report for explanation of significant budget variances, original and final.
54
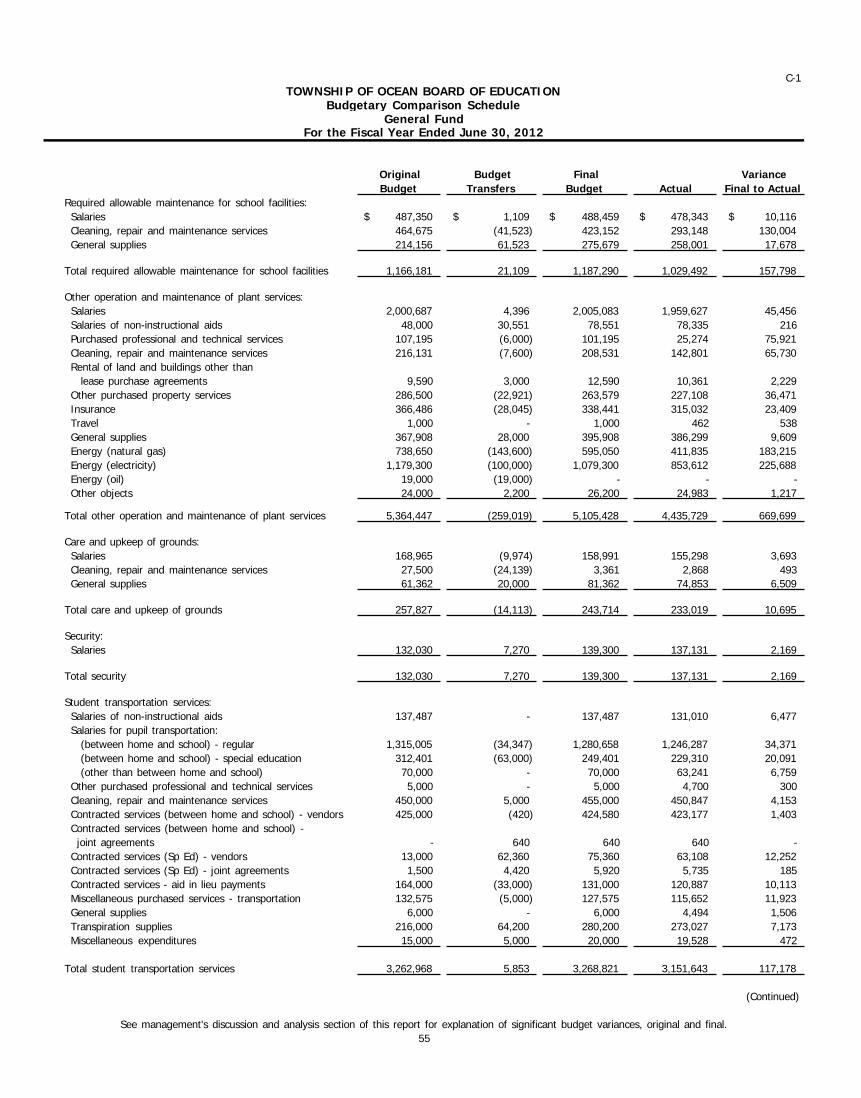
C-1
TOWNSHIP OF OCEAN BOARD OF EDUCATIONBudgetary Comparison Schedule
General FundFor the Fiscal Year Ended June 30, 2012
Original
Budget
Budget
Transfers
Final
Budget Actual
Variance
Final to Actual
Required allowable maintenance for school facilities:
Salaries 487,350$ 1,109$ 488,459$ 478,343$ 10,116$
Cleaning, repair and maintenance services 464,675 (41,523) 423,152 293,148 130,004
General supplies 214,156 61,523 275,679 258,001 17,678
Total required allowable maintenance for school facilities 1,166,181 21,109 1,187,290 1,029,492 157,798
Other operation and maintenance of plant services:
Salaries 2,000,687 4,396 2,005,083 1,959,627 45,456
Salaries of non-instructional aids 48,000 30,551 78,551 78,335 216
Purchased professional and technical services 107,195 (6,000) 101,195 25,274 75,921
Cleaning, repair and maintenance services 216,131 (7,600) 208,531 142,801 65,730
Rental of land and buildings other than
lease purchase agreements 9,590 3,000 12,590 10,361 2,229
Other purchased property services 286,500 (22,921) 263,579 227,108 36,471
Insurance 366,486 (28,045) 338,441 315,032 23,409
Travel 1,000 - 1,000 462 538
General supplies 367,908 28,000 395,908 386,299 9,609
Energy (natural gas) 738,650 (143,600) 595,050 411,835 183,215
Energy (electricity) 1,179,300 (100,000) 1,079,300 853,612 225,688
Energy (oil) 19,000 (19,000) - - -
Other objects 24,000 2,200 26,200 24,983 1,217
Total other operation and maintenance of plant services 5,364,447 (259,019) 5,105,428 4,435,729 669,699
Care and upkeep of grounds:
Salaries 168,965 (9,974) 158,991 155,298 3,693
Cleaning, repair and maintenance services 27,500 (24,139) 3,361 2,868 493
General supplies 61,362 20,000 81,362 74,853 6,509
Total care and upkeep of grounds 257,827 (14,113) 243,714 233,019 10,695
Security:
Salaries 132,030 7,270 139,300 137,131 2,169
Total security 132,030 7,270 139,300 137,131 2,169
Student transportation services:
Salaries of non-instructional aids 137,487 - 137,487 131,010 6,477
Salaries for pupil transportation:
(between home and school) - regular 1,315,005 (34,347) 1,280,658 1,246,287 34,371
(between home and school) - special education 312,401 (63,000) 249,401 229,310 20,091
(other than between home and school) 70,000 - 70,000 63,241 6,759
Other purchased professional and technical services 5,000 - 5,000 4,700 300
Cleaning, repair and maintenance services 450,000 5,000 455,000 450,847 4,153
Contracted services (between home and school) - vendors 425,000 (420) 424,580 423,177 1,403
Contracted services (between home and school) -
joint agreements - ` 640 640 640 -
Contracted services (Sp Ed) - vendors 13,000 ` 62,360 75,360 63,108 12,252
Contracted services (Sp Ed) - joint agreements 1,500 ` 4,420 5,920 5,735 185
Contracted services - aid in lieu payments 164,000 (33,000) 131,000 120,887 10,113
Miscellaneous purchased services - transportation 132,575 (5,000) 127,575 115,652 11,923
General supplies 6,000 - 6,000 4,494 1,506
Transpiration supplies 216,000 64,200 280,200 273,027 7,173
Miscellaneous expenditures 15,000 5,000 20,000 19,528 472
Total student transportation services 3,262,968 5,853 3,268,821 3,151,643 117,178
(Continued)
See management's discussion and analysis section of this report for explanation of significant budget variances, original and final.
55

C-1
TOWNSHIP OF OCEAN BOARD OF EDUCATIONBudgetary Comparison Schedule
General FundFor the Fiscal Year Ended June 30, 2012
Original
Budget
Budget
Transfers
Final
Budget Actual
Variance
Final to Actual Personal services - employee benefits:
Unallocated benefits:Group insurance 21,500$ -$ 21,500$ 17,445$ 4,055$ Social security contributions 897,000 (12,600) 884,400 771,250 113,150 Other retirement contribution - PERS 942,000 (80,600) 861,400 861,400 - Other retirement contribution - ERIP 41,000 - 41,000 34,971 6,029 Other retirement contribution - regular 6,000 12,600 18,600 18,517 83 Workmen's compensation 590,000 28,045 618,045 589,564 28,481 Health benefits 9,417,700 (190,000) 9,227,700 8,704,115 523,585 Tuition reimbursement 195,000 - 195,000 148,390 46,610 Other employee benefits 177,700 100,144 277,844 199,915 77,929
Total unallocated benefits 12,287,900 (142,411) 12,145,489 11,345,567 799,922
On-behalf contributions:Post retirement medical (non-budgeted) - - - 1,987,209 (1,987,209) On-behalf TPAF pension contributions (non-budgeted) - - - 988,532 (988,532) Reimbursed TPAF social security contributions (non-budgeted) - - - 2,169,792 (2,169,792)
Total on-behalf contributions - - - 5,145,533 (5,145,533) - - - - -
Total personal services - employee benefits 12,287,900 (142,411) 12,145,489 16,491,100 (4,345,611)
Total undistributed expenditures 36,734,443 (185,336) 36,549,107 38,909,621 (2,360,514)
Total general current expense 64,966,414 (238,779) 64,727,635 66,302,688 (1,575,053)
CAPITAL OUTLAY:Equipment:Regular programs - instruction:Grades 1-5 5,800 (5,800) - - - Grades 9-12 - 25,000 25,000 24,992 8
Undistributed expenditures:School-spons. & other instructional program - 10,000 10,000 9,504 496 General administration - 11,595 11,595 11,595 - School administration 187,883 (3,926) 183,957 183,956 1 Required maintenance school facilities 115,509 43,139 158,648 154,429 4,219 Custodial services - 44,295 44,295 44,213 82 Care and upkeep of grounds 82,825 (20,375) 62,450 62,450 - Student transportation-non-instructional equipment 90,000 (90,000) - - -
Total equipment 482,017 13,928 495,945 491,139 4,806
Facilities acquisition and construction services:Construction services - 837,524 837,524 266,969 570,555 Other objects 42,571 - 42,571 42,571 - Transfer to capital projects 451,000 (451,000) - - -
Total facilities acquisition and construction services 493,571 386,524 880,095 309,540 570,555
Assets acquired under capital leases (non-budgeted)School Administration - - - 139,314 (139,314)
Total capital outlay 975,588 400,452 1,376,040 939,993 436,047
(Continued)
See management's discussion and analysis section of this report for explanation of significant budget variances, original and final. 56

C-1
TOWNSHIP OF OCEAN BOARD OF EDUCATIONBudgetary Comparison Schedule
General FundFor the Fiscal Year Ended June 30, 2012
Original
Budget
Budget
Transfers
Final
Budget Actual
Variance
Final to Actual
SPECIAL SCHOOLS:
Summer school - instruction:
Salaries of teachers 83,702$ (11,355)$ 72,347$ 72,346$ 1$
Other salaries for instruction 58,963 5,929 64,892 64,891 1
Purchased professional and technical services 10,000 9,025 19,025 19,025 -
General supplies 2,500 (2,142) 358 358 -
Total summer school - instruction 155,165 1,457 156,622 156,620 2
Total special schools 155,165 1,457 156,622 156,620 2
Transfer of funds to Charter School 59,271 - 59,271 21,473 37,798
Total expenditures 66,156,438 163,130 66,319,568 67,420,774 (1,101,206)
Excess (deficiency) of revenues
over (under) expenditures (2,257,074) (152,905) (2,409,979) 2,538,672 4,948,651
Other financing sources (uses):
Operating transfers in:
Transfer from other funds - - - - -
Operating transfers out:
Transfer to Food Service Fund- Board Contribution - - - - -
Capital reserve transfer to capital projects fund - - - - -
Capital leases (non-budgeted) - - - 139,314 139,314
Sale of Assets - - - 17,982 17,982
Total other financing sources (uses) - - - 157,296 157,296
Excess (deficiency) of revenues and other financing
sources over (under) expenditures and other
financing sources (uses) (2,257,074) (152,905) (2,409,979) 2,695,968 5,105,947
Fund balance, July 1 6,527,693 - 6,527,693 6,527,693 -
Fund balance, June 30 4,270,619$ (152,905)$ 4,117,714$ 9,223,661$ 5,105,947$
Recapitulation
Restricted fund balance:
Capital reserve 2,074,648$
Excess surplus - designated for subsequent year's expenditures 1,843,948
Excess surplus - current year 2,835,591
Assigned fund balances:
Designated for subsequent year's expenditures 1,141,904
Unassigned fund balances 1,327,570
Reconciliation to governmental funds statements (GAAP) 9,223,661
Last state aid payment not recognized on GAAP basis (1,109,941)
Fund Balance per governmental funds (GAAP) 8,113,720$
See management's discussion and analysis section of this report for explanation of significant budget variances, original and final. 57

C-1b
TOWNSHIP OF OCEAN BOARD OF EDUCATION
Budgetary Comparison Schedule
General Fund
Education Jobs Fund Program - Budget and Actual
For the Fiscal Year Ended June 30, 2012
Variance
Original Budget Final Final to
Budget Transfers Budget Actual Actual
REVENUES:
Federal sources
Education Jobs Fund 326,399$ 10,225$ 336,624$ 336,624$ -$
Total Federal sources 326,399 10,225 336,624 336,624 -
Total Revenues 326,399$ 10,225$ 336,624$ 336,624$ -$
EXPENDITURES:
Special education - instruction
Multiple disabilities:
Other salaries for instruction 88,496$ (1,736)$ 86,760$ 86,760$ -$
Preschool disabilities - part-time:
Other salaries for instruction 29,823 19,359 49,182 49,182 -
Total Special education - instruction 118,319 17,623 135,942 135,942 -
Basic skills/remedial - instruction
Salaries for teachers 208,080 (107,542) 100,538 100,538 -
Total Basic skills/remedial - instruction 208,080 (107,542) 100,538 100,538 -
Undistributed expenditures - personal
services - employee benefits
Other employee benefits - 100,144 100,144 100,144 -
Total Undistributed expenditures - 100,144 100,144 100,144 -
Total Expenditures 326,399$ 10,225$ 336,624$ 336,624$ -$
See management's discussion and analysis section of this report for explanation of significant budget variances, original and final.
58

C-2TOWNSHIP OF OCEAN BOARD OF EDUCATION
Budgetary Comparison Schedule Special Revenue Fund
For the Fiscal Year Ended June 30, 2011
Variance
Original Budget Final Final to
Budget Transfers Budget Actual Actual
REVENUES:
State sources 498,299$ 63,972$ 562,271$ 543,906$ (18,365)$
Federal sources 1,412,096 355,597 1,767,693 1,707,938 (59,755)
Total Revenues 1,910,395 419,569 2,329,964 2,251,844 (78,120)
EXPENDITURES:
Instruction
Salaries of teachers 147,107 243,874 390,981 390,873 108
Other salaries for instruction 873,612 (336,469) 537,143 533,181 3,962
Purchased professional and technical services 38,642 22,681 61,323 61,038 285
General supplies 391,377 (329,707) 61,670 49,307 12,363
Textbooks 34,544 1,627 36,171 34,207 1,964
Miscellaneous purchased services 425,113 259,956 685,069 668,953 16,116
Total Instruction 1,910,395 (138,038) 1,772,357 1,737,559 34,798
Support Services
Salaries of secretaries and clerical assistants - 123,460 123,460 105,872 17,588
Other salaries - - - - -
Personal services - employee benefits - 81,930 81,930 81,929 1
Purchased professional-educational services - 317,736 317,736 294,033 23,703
Travel - 15,263 15,263 13,395 1,868
Supplies and materials - 19,218 19,218 19,056 162
Total Support Services - 557,607 557,607 514,285 43,322
Facilities Acquisition and Construction Services:
Instructional equipment - - - - -
Noninstructional equipment - - - - -
Total Facilities Acquisition and Construction Services - - - - -
Total Expenditures 1,910,395 419,569 2,329,964 2,251,844 78,120
Other Financing Sources (Uses)
Transfer in from general fund - - - - -
Transfer out to whole school reform (general fund) - - - - -
Total Other Financing Sources (Uses) - - - - -
- - - - -
Total Outflows 1,910,395 419,569 2,329,964 2,251,844 78,120
Excess (Deficiency) of Revenues Over (Under)
Expenditures and Other Financing Sources (Uses) -$ -$ -$ -$ -$
See management's discussion and analysis section of this report for explanation of significant budget variances, original and final.
59

NOTES TO THE REQUIRED SUPPLEMENTARY INFORMATION
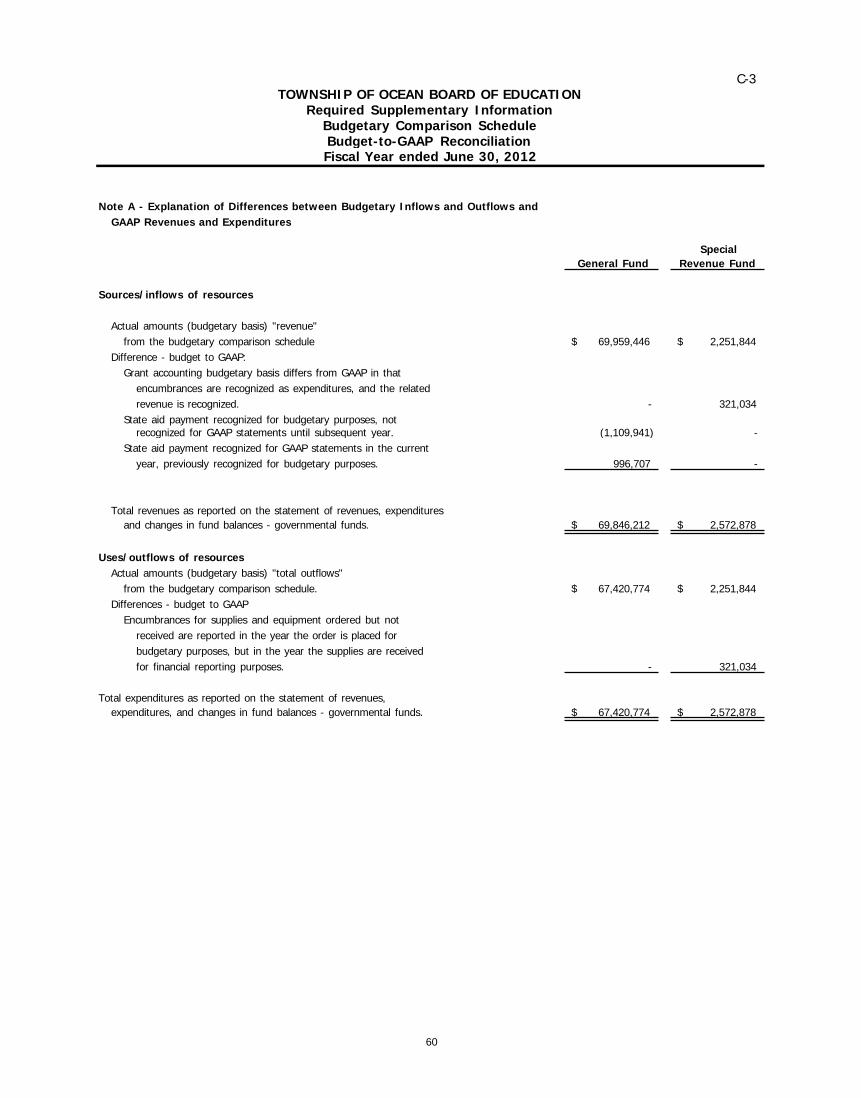
C-3TOWNSHIP OF OCEAN BOARD OF EDUCATION
Required Supplementary InformationBudgetary Comparison ScheduleBudget-to-GAAP ReconciliationFiscal Year ended June 30, 2012
Note A - Explanation of Differences between Budgetary Inflows and Outflows and
GAAP Revenues and Expenditures
General Fund
Special
Revenue Fund
Sources/inflows of resources
Actual amounts (budgetary basis) "revenue"
from the budgetary comparison schedule 69,959,446$ 2,251,844$
Difference - budget to GAAP:
Grant accounting budgetary basis differs from GAAP in that
encumbrances are recognized as expenditures, and the related
revenue is recognized. - 321,034
State aid payment recognized for budgetary purposes, notrecognized for GAAP statements until subsequent year. (1,109,941) -
State aid payment recognized for GAAP statements in the current
year, previously recognized for budgetary purposes. 996,707 -
Total revenues as reported on the statement of revenues, expenditures
and changes in fund balances - governmental funds. 69,846,212$ 2,572,878$
Uses/outflows of resources
Actual amounts (budgetary basis) "total outflows"
from the budgetary comparison schedule. 67,420,774$ 2,251,844$
Differences - budget to GAAP
Encumbrances for supplies and equipment ordered but not
received are reported in the year the order is placed for
budgetary purposes, but in the year the supplies are received
for financial reporting purposes. - 321,034
Total expenditures as reported on the statement of revenues,
expenditures, and changes in fund balances - governmental funds. 67,420,774$ 2,572,878$
60

OTHER SUPPLEMENTARY INFORMATION

SCHOOL BASED BUDGET SCHEDULES

SPECIAL REVENUE FUND DETAIL STATEMENTS
The Special Revenue Fund is used to account for the proceeds of specific revenue sources other than expendable trusts or major capital projects that are legally restricted for specific purposes.

E-1TOWNSHIP OF OCEAN BOARD OF EDUCATION
Special Revenue FundCombining Schedule of Program Revenues and Expenditures - Budgetary Basis
For the Fiscal Year Ended June 30, 2012
Total Total
I.D.E.A. Part B Title I Other Nonpublic
Regular Preschool Basic Special Projects Programs Totals
2010-2011 2011-2012 2011-2012 2010-2011 2011-2012 (Ex. E-1a) (Ex. E-1b) 2012
REVENUES:
State sources -$ -$ -$ -$ -$ -$ 543,906$ 543,906$
Federal sources 17,931 1,004,066 42,219 5,640 454,573 183,509 - 1,707,938
Total revenues 17,931$ 1,004,066$ 42,219$ 5,640$ 454,573$ 183,509$ 543,906$ 2,251,844$
EXPENDITURES:
Instruction:
Salaries of teachers -$ -$ -$ -$ 282,436$ 108,437$ -$ 390,873$
Other salaries for instruction - 491,471 41,710 - - - - 533,181
Purchased professional - educational services - 5,100 - - 1,736 2,820 - 9,656
Purchased professional - technical services - - - - - - 51,382 51,382
General supplies - 6,833 - 5,640 6,021 30,813 - 49,307
Textbooks - - - - - - 34,207 34,207 Textbooks - - - - - - 34,207 34,207
Miscellaneous purchased services - 210,636 - - - - 458,317 668,953
Total instruction - 714,040 41,710 5,640 290,193 142,070 543,906 1,737,559
Support services:
Salaries of secretarial
and clerical assistants 17,931 87,941 - - - - - 105,872
Other salaries - - - - - - - -
Personal services - employee benefits - - - - 65,850 16,079 - 81,929
Purchased professional - educational services - 185,415 509 - 97,104 1,000 - 284,028
Purchased professional - technical services - - - - - 10,005 - 10,005
Travel - 5,800 - - 1,426 6,169 - 13,395
Supplies and materials - 10,870 - - - 8,186 - 19,056
Total support services 17,931 290,026 509 - 164,380 41,439 - 514,285
Facilities acquisition and construction services:
Instructional equipment - - - - - - - -
Total expenditures 17,931$ 1,004,066$ 42,219$ 5,640$ 454,573$ 183,509$ 543,906$ 2,251,844$
6161

E1-a
TOWNSHIP OF OCEAN BOARD OF EDUCATION
Special Revenue Fund
Combining Schedule of Program Revenues and Expenditures - Budgetary Basis (Continued)
For the Fiscal Year Ended June 30, 2012
Title II, Part D
Enhancing Carry forward
Education to E-1
Title I Through Title III Title III Total Other
ARRA Technology Part A Immigrant Special
2010-2011 2010-2011 2011-2012 Carryover 2010-2011 2010-2011 2011-2012 2011-2012 Projects
REVENUES:
State sources -$ -$ -$ -$ -$ -$ -$ -$ -$
Federal sources 351 5,684 99,325 15,787 61 1,735 43,334 17,232 183,509
Total revenues 351$ 5,684$ 99,325$ 15,787$ 61$ 1,735$ 43,334$ 17,232$ 183,509$
EXPENDITURES:
Instruction:
Salaries of teachers -$ 1,980$ 63,955$ -$ -$ -$ 29,531$ 12,971$ 108,437$
Other salaries for instruction - - - - - - - - -
Purchased professional - educational services - - - - - - 2,820 - 2,820
Title II, Part A
Teacher and
Principal
Training & Recruiting
Purchased professional - educational services - - - - - - 2,820 - 2,820
Purchased professional - technical services - - - - - - - - -
General supplies - 2,727 5,345 15,407 - 275 3,098 3,961 30,813
Textbooks - - - - - - - - -
Miscellaneous purchased services - - - - - - - - -
Total instruction - 4,707 69,300 15,407 - 275 35,449 16,932 142,070
Support services:
Salaries of secretarial and
clerical assistants - - - - - - - - -
Other salaries - - - - - - - - -
Personal services - employee benefits - - 11,000 - - - 5,079 - 16,079
Purchased professional - educational services - - - - - - 1,000 - 1,000
Purchased professional - technical services - 975 9,030 - - - - - 10,005
Travel - - 4,183 380 - - 1,306 300 6,169
Supplies and materials 351 2 5,812 - 61 1,460 500 - 8,186
Total support services 351 977 30,025 380 61 1,460 7,885 300 41,439
Facilities acquisition and construction services:
Instructional equipment - - - - - - - - -
Total expenditures 351$ 5,684$ 99,325$ 15,787$ 61$ 1,735$ 43,334$ 17,232$ 183,509$
6262

E1-bTOWNSHIP OF OCEAN BOARD OF EDUCATION
Special Revenue FundCombining Schedule of Program Revenues and Expenditures - Budgetary Basis (Continued)
For the Fiscal Year Ended June 30, 2012
Carry forward
N.J. Nonpublic Handicapped Services Ch. 193 N.J. Nonpublic to E-1
Examination Auxiliary Services Total
and Corrective Supplemental Ch. 192 Nonpublic Nonpublic Home Nonpublic
Classification Speech Instruction Compensatory Nursing Textbooks Instruction Programs
REVENUES:
State sources 118,803$ 42,652$ 83,410$ 213,022$ 51,382$ 34,207$ 430$ 543,906$
Federal sources - - - - - - - -
Total revenues 118,803$ 42,652$ 83,410$ 213,022$ 51,382$ 34,207$ 430$ 543,906$
EXPENDITURES:
Instruction:
Salaries of teachers -$ -$ -$ -$ -$ -$ -$ -$
Other salaries for instruction - - - - - - - -
Purchased professional - educational services - - - - - - - -
Purchased professional - technical services - - - - 51,382 - - 51,382
General supplies - - - - - - - -
Textbooks - - - - - 34,207 - 34,207
Other purchased services 118,803 42,652 83,410 213,022 - - 430 458,317
Total instruction 118,803 42,652 83,410 213,022 51,382 34,207 430 543,906
Support services:
Salaries of secretarial -
and clerical assistants - - - - - - -
Other salaries - - - - - - - -
Personal services - employee benefits - - - - - - - -
Purchased professional - educational services - - - - - - - -
Purchased professional - technical services - - - - - - - -
Travel - - - - - - - -
Supplies and materials - - - - - - - -
Total support services - - - - - - - -
Facilities acquisition and construction services:
Instructional equipment - - - - - - - -
Total expenditures 118,803$ 42,652$ 83,410$ 213,022$ 51,382$ 34,207$ 430$ 543,906$
63

CAPITAL PROJECTS FUND DETAIL STATEMENTS
The Capital Projects Fund is used to account for the acquisition and construction of major capital facilities and equipment purchases other than those financed by proprietary funds.

PROPRIETARY FUNDS DETAIL STATEMENTS
Proprietary Funds are used to account for operations that are financed and operated in a manner similar to private business enterprises – where the intent of the district’s board is that the costs of providing goods or services be financed through user charges.
Food Service Fund – This fund provides for the operation of food service in all schools within the school district. Internal Service Fund – This fund provides for risk-financing activities such as self insurance.
THIS SECTION HAS ALREADY BEEN INCLUDED IN STATEMENTS B-4, B-5, B-6, B-7 and B-8

FIDUCIARY FUNDS DETAIL STATEMENTS
Fiduciary Funds are used to account for funds received by the School District for a specific purpose. Agency Funds are used to account for assets held by the School District as an agent for individuals, private organizations and other governments and/or other funds.
Student Activity Fund – This agency fund is used to account for student funds held at the schools. Payroll Fund – This agency fund is used to account for the payroll transactions of the School District.

H-1TOWNSHIP OF OCEAN BOARD OF EDUCATIONCombining Statement of Fiduciary Net Assets
Trust and Agency FundsJune 30, 2012
Trust Agency
Unemployment Private Total Student Total
Compensation Purpose Trust Fund Activity Payroll Agency Fund
ASSETS:
Cash and cash equivalents 329,813$ 35,096$ 364,909$ 406,097$ 1,196,078$ 1,602,175$
Total assets 329,813$ 35,096$ 364,909$ 406,097$ 1,196,078$ 1,602,175$
LIABILITIES
Payroll deductions and withholdings 49,287 - 49,287 -$ 1,196,078$ 1,196,078$
Due to student groups - - - 406,097 - 406,097
Total liabilities 49,287 - 49,287 406,097$ 1,196,078$ 1,602,175$
NET ASSETS
Reserved 280,526 35,096 315,622
Total net assets 280,526$ 35,096$ 315,622$
64

H-2TOWNSHIP OF OCEAN BOARD OF EDUCATION
Combining Statement of Changes in Fiduciary Net AssetsTrust Funds
For the Fiscal Year Ended June 30, 2012
Unemployment Private PurposeCompensation Scholarship Total
Trust Trust Trusts
ADDITIONS:
ContributionsPlan member 102,313$ -$ 102,313$ Other - 7,434 7,434
Total contributions 102,313 7,434 109,747
Investment earningsInterest 106 - 106
Net investment earnings 106 - 106
Total Additions 102,419 7,434 109,853
DEDUCTIONS:
Quarterly contribution reports 42,838 - 42,838 Unemployment claims 155,170 - 155,170 Scholarships awarded - 8,004 8,004
Total Deductions 198,008 8,004 206,012
Change in Net Assets (95,589) (570) (96,159)
Net Assets - Beginning of Year 376,115 35,666 411,781
Net Assets - End of Year 280,526$ 35,096$ 315,622$
65

H-3TOWNSHIP OF OCEAN BOARD OF EDUCATION
Student Activity Agency Fund Schedule of Receipts and DisbursementsFor the Fiscal Year Ended June 30, 2012
Balance Cash Cash Balance
July 1, 2011 Receipts Disbursements June 30, 2012
ELEMENTARY SCHOOLS:
Ocean Township Elementary 5,934$ 9,080$ 11,324$ 3,690$
Wayside Elementary 4,409 7,921 5,955 6,375
Wanamassa Elementary 8,055 8,630 7,359 9,326
Total elementary schools 18,398 25,631 24,638 19,391
INTERMEDIATE SCHOOL 63,460 78,262 85,231 56,491
HIGH SCHOOL 304,014 483,937 457,736 330,215
Total all schools 385,872$ 587,830$ 567,605$ 406,097$
66

H-4TOWNSHIP OF OCEAN BOARD OF EDUCATION
Payroll Agency FundSchedule of Receipts and DisbursementsFor the Fiscal Year Ended June 30, 2012
Balance Cash Cash Balance
July 1, 2011 Receipts Disbursements June 30, 2012
ASSETS:
Cash and cash equivalents 1,075,392$ 20,003,817$ 19,883,131$ 1,196,078$
Total assets 1,075,392$ 20,003,817$ 19,883,131$ 1,196,078$
LIABILITIES:
Payroll deductions and withholdings 1,075,392$ 20,003,817$ 19,883,131$ 1,196,078$
Total liabilities 1,075,392$ 20,003,817$ 19,883,131$ 1,196,078$
67

LONG-TERM DEBT SCHEDULES
The Long-Term Debt Schedules are used to reflect the outstanding principal balances of the general long-term liabilities of the School District. This includes serial bonds outstanding and obligations under capital leases.

I-1TOWNSHIP OF OCEAN BOARD OF EDUCATION
Long Term DebtSchedule of Serial Bonds
As of June 30, 2012
Date of Amount of Annual Maturities Interest Balance Balance
Issue Issue Issue Date Amount Rate July 1, 2011 Issued Retired June 30, 2012
School renovations and
additions 5/1/2009 8,275,000$ 6/1/2013 1,395,000$ 3.00% 5,705,000$ -$ 1,380,000$ 4,325,000$
(Refunding issue 1999) 6/1/2014 1,440,000 3.00%
6/1/2015 1,490,000 3.50%
School renovations
and additions 3/29/2002 14,642,000 - 850,000 - 850,000 -
School renovations and
additions 10/20/2010 8,585,000 3/1/2013 895,000 3.000% 8,540,000 - 40,000 8,500,000
(Refunding issue 2010) 3/1/2014 875,000 3.000%
3/1/2015 865,000 4.000%
3/1/2016 860,000 4.000%
3/1/2017 850,000 4.000%
3/1/2018 845,000 4.000%
3/1/2019 835,000 4.000%
3/1/2020 830,000 4.000%
3/1/2021 825,000 4.000%
3/1/2022 820,000 4.000%
School bonds -
Energy project 9/1/2007 6,113,000 9/1/2012 355,000 4.125% 5,215,000 - 340,000 4,875,000
9/1/2013 375,000 4.125%
9/1/2014 390,000 4.125%
9/1/2015 405,000 4.125%
9/1/2016 425,000 4.125%
9/1/2017 445,000 4.125%
9/1/2018 465,000 4.125%
9/1/2019 485,000 4.125%
9/1/2020 505,000 4.125%
9/1/2021 510,000 4.200%
9/1/2022 515,000 4.250%
20,310,000$ -$ 2,610,000$ 17,700,000$
68

I-2TOWNSHIP OF OCEAN BOARD OF EDUCATION
Long Term DebtSchedule of Obligations under Capital Lease
As of June 30, 2012
Description
Amount of
Original Issue
Balance
July 1, 2011
Issued Current
Year
Retired
Current Year
Balance
June 30, 2012
Savin Copiers 139,314$ -$ 139,314$ 15,756$ 123,558$
-$ 139,314$ 15,756$ 123,558$
69

I-3TOWNSHIP OF OCEAN BOARD OF EDUCATION
Debt Service FundBudgetary Comparison Schedule
For the Fiscal Year Ended June 30, 2012
Original
Budget
Budget
Transfers Final Budget Actual
Variance
Final to
Actual
REVENUES:
Local sources:
Local tax levy 3,093,434$ -$ 3,093,434$ 3,093,434$ -$
State sources:
Debt service aid - Type II 186,706 - 186,706 186,706 -
Total revenues 3,280,140 - 3,280,140 3,280,140 -
EXPENDITURES:
Regular debt service:
Interest 726,908 - 726,908 726,908 -
Redemption of principal 2,610,000 - 2,610,000 2,610,000 -
Total expenditures 3,336,908 - 3,336,908 3,336,908 -
(56,768) - (56,768) (56,768) -
Other financing sources (uses):
Operating transfers in (out) - - - - -
Refunding Bond Proceeds - - - - -
Premium on Sale of Bonds - - - - -
Payment to refunding bonds escrow agent - - - - -
Cost of issuance - - - - -
Total other financing sources (uses) - - - - -
(56,768) - (56,768) (56,768) -
Fund balances, July 1 56,770 - 56,770 56,770 -
Fund balances, June 30 2$ -$ 2$ 2$ -$
Recapitulation of Excess (Deficiency)
of Revenues Over (Under) Expenditures
Budgeted fund balance 56,768$ -$ 56,768$ 56,768$ -$
70
Excess (deficiency) of revenues over (under)
expenditures
Excess (deficiency) of revenues and other financing
sources over (under) expenditures

STATISTICAL SECTION
CONTENTS PAGE Financial Trends 71 - 77 These schedules contain trend information to help the reader understand how the
district’s financial performance and well being have changed over time. Revenue Capacity 78 - 83 These schedules contain information to help the reader assess the district’s most
significant local revenue source, the property tax. Debt Capacity 84 - 87 These schedules present information to help the reader assess the affordability of the
district’s current levels of outstanding debt and the district’s ability to issue additional debt in the future.
Demographic and Economic Information 88 - 89 These schedules offer demographic and economic indicators to help the reader
understand the environment within which the district’s financial activities take place. Operating Information 90 - 96 These schedules contain service and infrastructure data to help the reader
understand how the information in the district’s financial report relates to the services the district provides and the activities it performs.
Sources: Unless otherwise noted, the information in these schedules is derived from the comprehensive annual financial reports (CAFR) for the relevant year. The district implemented GASB Statement 34 in the fiscal year ending June 30, 2003; schedules presenting district -wide information include information beginning in that year.

J-1TOWNSHIP OF OCEAN BOARD OF EDUCATION
Net Assets by ComponentLast Ten Fiscal Years
Accrual Basis of AccountingUnaudited
June 30, 2012 June 30, 2011 June 30, 2010 June 30, 2009 June 30, 2008 June 30, 2007 June 30, 2006 June 30, 2005 June 30, 2004 June 30, 2003
Governmental activities
Invested in capital assets, net of related debt 20,862,685$ 18,865,230$ 17,705,236$ 15,953,571$ 12,398,864$ 13,212,935$ 12,141,494$ 10,977,152$ 6,416,013$ (7,457,953)$
Restricted 7,896,093 5,283,098 3,534,807 5,976,604 8,712,095 3,296,371 3,298,375 4,455,473 5,442,750 18,286,801
Unrestricted (3,165,792) (3,049,861) (2,549,999) (3,078,273) (2,223,231) 766,275 (890,211) (1,016,536) (172,013) (1,001,555)
Total governmental activities net assets 25,592,986$ 21,098,467$ 18,690,044$ 18,851,902$ 18,887,728$ 17,275,581$ 14,549,658$ 14,416,089$ 11,686,750$ 9,827,293$
Business-type activities
Invested in capital assets, net of related debt 76,535$ 64,236$ 77,390$ 92,319$ 109,160$ 126,232$ 139,309$ 136,124$ 151,912$ 120,997$
Restricted - - - - - - - - - -
Unrestricted (34,970) 25,685 (7,461) 17,751 (62,448) (31,374) (20,121) 8,992 16,470 67,722
Total business-type activities net assets 41,565$ 89,921$ 69,929$ 110,070$ 46,712$ 94,858$ 119,188$ 145,116$ 168,382$ 188,719$
District-wide
Invested in capital assets, net of related debt 20,939,220$ 18,929,466$ 17,782,626$ 16,045,890$ 12,508,024$ 13,339,167$ 12,280,803$ 11,113,276$ 6,567,925$ (7,336,956)$
Restricted 7,896,093 5,283,098 3,534,807 5,976,604 8,712,095 3,296,371 3,298,375 4,455,473 5,442,750 18,286,801
Unrestricted (3,200,762) (3,024,176) (2,557,460) (3,060,522) (2,285,679) 734,901 (910,332) (1,007,544) (155,543) (933,833)
Total district-wide net assets 25,634,551$ 21,188,388$ 18,759,973$ 18,961,972$ 18,934,440$ 17,370,439$ 14,668,846$ 14,561,205$ 11,855,132$ 10,016,012$
Source: District records
71

J-2TOWNSHIP OF OCEAN BOARD OF EDUCATION
Changes in Net AssetsLast Ten Fiscal Years
Accrual Basis of AccountingUnaudited
June 30, 2012 June 30, 2011 June 30, 2010 June 30, 2009 June 30, 2008 June 30, 2007 June 30, 2006 June 30, 2005 June 30, 2004 June 30, 2003
Expenses
Governmental activities
Instruction
Regular 31,201,908$ 30,672,356$ 30,869,776$ 29,853,090$ 31,403,830$ 30,493,052$ 28,727,656$ 27,139,122$ 25,943,765$ 24,188,808$
Special education 7,304,546 6,672,604 6,760,065 6,685,215 6,787,935 6,641,597 5,702,888 4,847,330 4,251,337 3,675,342
Other special education 1,601,960 1,345,531 1,988,821 2,017,043 2,062,716 1,688,817 1,608,853 1,544,172 1,007,814 1,074,177
Other instruction 1,545,146 1,457,112 1,455,524 1,397,145 1,536,734 1,506,792 1,459,389 1,738,116 1,787,225 1,784,615
Support Services
Instruction 3,265,613 3,992,315 3,434,045 3,292,240 2,971,655 2,396,367 2,482,940 2,157,695 2,296,703 2,237,581
Student & instruction related services 9,260,790 8,252,664 8,335,122 7,943,866 6,745,992 6,807,909 6,356,887 5,509,657 5,029,503 4,853,811
School administrative services 2,943,430 2,820,723 3,370,056 3,372,965 3,086,920 3,023,913 2,336,634 2,623,838 2,440,173 2,456,795
General administrative services 1,130,936 1,164,642 1,146,016 1,161,748 1,086,689 1,173,956 1,919,276 1,297,524 2,143,253 2,052,813
Central services 1,329,042 1,292,534 948,110 929,609 848,343 606,651 725,358 726,953 - -
Administrative information technology 146,707 140,303 609,867 288,517
Plant operations and maintenance 6,786,929 7,004,447 6,924,274 7,338,569 7,668,599 7,001,421 7,027,307 6,103,272 6,024,406 4,635,649
Pupil transportation 3,917,781 3,908,346 3,918,662 3,913,472 3,745,741 3,672,414 3,559,049 3,112,889 3,074,160 3,615,234
Special Schools 156,620 164,599 187,863 190,883 179,677 194,374 83,692 76,322 74,345 47,818
Charter schools 21,473 30,545 57,636 15,348 2,793 - - - - -
Interest on long-term debt 716,154 1,460,077 1,007,071 1,308,884 1,245,843 1,107,017 1,172,100 1,231,377 1,504,487 1,642,881
Total governmental activities expenses 71,329,035 70,378,798 71,012,908 69,708,594 69,373,467 66,314,280 63,162,029 58,108,267 55,577,171 52,265,524
Business-type activities:
Food service 1,237,158 1,192,783 1,141,723 1,132,607 1,105,399 1,077,716 1,105,246 1,140,614 1,075,571 1,022,070
Total business-type activities expense 1,237,158 1,192,783 1,141,723 1,132,607 1,105,399 1,077,716 1,105,246 1,140,614 1,075,571 1,022,070
Total district expenses 72,566,193$ 71,571,581$ 72,154,631$ 70,841,201$ 70,478,866$ 67,391,996$ 64,267,275$ 59,248,881$ 56,652,742$ 53,287,594$
Program Revenues
Governmental activities:
Charges for services:
Instruction (tuition) -$ -$ 24,968$ 53,793$ -$ 36,343$ 33,833$ 46,343$ 56,506$ 51,807$
Support services 267,470 263,729 227,401 194,755 174,100 - - - - -
Special schools 20,698 19,600 - 15,175 23,075 - - - - -
Operating grants and contributions 8,276,785 7,569,905 7,219,481 6,961,117 8,861,298 - - - 1,352,658 1,286,395
Total governmental activities program revenues 8,564,953 7,853,234 7,471,850 7,224,840 9,058,473 36,343 33,833 46,343 1,409,164 1,338,202
Business-type activities
Charges for services:
Food service 710,173 689,179 710,072 739,032 782,304 796,280 834,191 870,329 839,174 763,540
Operating grants and contributions 478,629 423,596 391,510 356,933 274,949 257,106 245,127 246,321 216,160 222,045
Total business-type activities program revenues 1,188,802 1,112,775 1,101,582 1,095,965 1,057,253 1,053,386 1,079,318 1,116,650 1,055,334 985,585 Total district program revenues 9,753,755$ 8,966,009$ 8,573,432$ 8,320,805$ 10,115,726$ 1,089,729$ 1,113,151$ 1,162,993$ 2,464,498$ 2,323,787$
(Continued)
72

J-2TOWNSHIP OF OCEAN BOARD OF EDUCATION
Changes in Net AssetsLast Ten Fiscal Years
Accrual Basis of AccountingUnaudited
June 30, 2012 June 30, 2011 June 30, 2010 June 30, 2009 June 30, 2008 June 30, 2007 June 30, 2006 June 30, 2005 June 30, 2004 June 30, 2003
Net (Expense) Revenue
Governmental activities (62,764,082)$ (62,525,564)$ (63,541,058)$ (62,483,754)$ (60,314,994)$ (66,277,937)$ (63,128,196)$ (58,061,924)$ (54,168,007)$ (50,927,322)$
Business-type activities (48,356) (80,008) (40,141) (36,642) (48,146) (24,330) (25,928) (23,964) (20,237) (36,485)
Total district-wide net expense (62,812,438)$ (62,605,572)$ (63,581,199)$ (62,520,396)$ (60,363,140)$ (66,302,267)$ (63,154,124)$ (58,085,888)$ (54,188,244)$ (50,963,807)$
General Revenues and Other Changes in Net Assets
Governmental activities
Property taxes levied for general purposes, net 55,724,474$ 54,408,683$ 52,051,910$ 50,344,384$ 49,485,090$ 47,642,573$ 44,143,259$ 42,722,698$ 39,841,709$ 36,923,133$
Taxes levied for debt service 3,093,434 3,118,052 3,111,333 2,583,653 2,213,751 2,844,064 2,767,546 2,669,748 2,596,041 2,474,755
Federal and state aid not restricted 8,117,177 7,204,310 8,105,252 9,334,996 9,481,032 17,700,801 15,879,559 14,974,249 13,232,697 11,515,606
Investment earnings 13,824 16,408 25,053 216,587 683,044 550,626 279,564 168,451 117,025 341,432
Transfers - (100,000) - (100,000) - - - - - -
Gain on disposal of capital assets 17,982 18,093 - - - - - - - -
Miscellaneous income 291,709 268,441 85,652 68,308 64,222 265,796 191,836 256,117 239,992 198,621
Total governmental activities 67,258,600 64,933,987 63,379,200 62,447,928 61,927,139 69,003,860 63,261,764 60,791,263 56,027,464 51,453,547
Business-type activities:
Investment earnings - - - - - - - 698 - -
Transfers - 100,000 - 100,000 - - - - - -
Total business-type activities - 100,000 - 100,000 - - - 698 - -
Total district-wide 67,258,600$ 65,033,987$ 63,379,200$ 62,547,928$ 61,927,139$ 69,003,860$ 63,261,764$ 60,791,961$ 56,027,464$ 51,453,547$
Change in Net Assets
Governmental activities 4,494,518$ 2,408,423$ (161,858)$ (35,826)$ 1,612,145$ 2,725,923$ 133,568$ 2,729,339$ 1,859,457$ 526,225$
Business-type activities (48,356) 19,992 (40,141) 63,358 (48,146) (24,330) (25,928) (23,266) (20,237) (36,485)
Total district 4,446,162$ 2,428,415$ (201,999)$ 27,532$ 1,563,999$ 2,701,593$ 107,640$ 2,706,073$ 1,839,220$ 489,740$
Source: District records
Note:
73
Central Services account classification was added beginning with the year ended June 30, 2005. Prior to June 30,
2005, Central Services was combined in School Administration Services.

J-3TOWNSHIP OF OCEAN BOARD OF EDUCATION
Fund Balances, Governmental FundsLast Ten Fiscal Years
Modified Accrual Basis of AccountingUnaudited
June 30, 2012 June 30, 2011 June 30, 2010 June 30, 2009 June 30, 2008 June 30, 2007 June 30, 2006 June 30, 2005 June 30, 2004 June 30, 2003
General Fund
Reserved 7,896,091$ 5,226,328$ 3,143,340$ 5,181,541$ 5,524,096$ 3,981,396$ 2,635,632$ 3,107,174$ 1,621,028$ 607,468$
Unreserved 217,629 304,658 366,564 657,209 944,332 839,919 743,859 1,415,253 1,698,256 1,949,151
Total general fund 8,113,720$ 5,530,986$ 3,509,904$ 5,838,750$ 6,468,428$ 4,821,315$ 3,379,491$ 4,522,427$ 3,319,284$ 2,556,619$
All Other Governmental Funds
Reserved -$ -$ 86,685$ -$ 1,840,890$ 21,038$ 28,637$ -$ 2,578,560$ 12,515,334$
Unreserved
Special revenue fund - - - - (5,522) (8,628) (7,419) (8,309) (5,522) (15,391)
Capital projects fund - - - 295,061 1,097,108 1,758,053 1,812,461 1,884,695 2,528,021 5,163,936
Debt service fund 2 56,770 94,781 2 1 1 1 1 1 63
Permanent fund - - - - - - - - - -
Total all other governmental funds 2$ 56,770$ 181,466$ 295,063$ 2,932,477$ 1,770,464$ 1,833,680$ 1,876,387$ 5,101,060$ 17,663,942$
Source: District records
74

J-4TOWNSHIP OF OCEAN BOARD OF EDUCATION
Changes in Fund Balances, Governmental FundsLast Ten Fiscal Years
Modified Basis of AccountingUnaudited
June 30, 2012 June 30, 2011 June 30, 2010 June 30, 2009 June 30, 2008 June 30, 2007 June 30, 2006 June 30, 2005 June 30, 2004 June 30, 2003
Revenues
Tax levy 58,817,908$ 57,526,735$ 55,163,243$ 52,928,037$ 51,698,841$ 50,486,637$ 46,910,805$ 45,392,446$ 42,437,750$ 39,397,888$
Tuition charges 20,698 19,600 24,968 68,967 23,075 36,343 33,833 46,343 56,506 51,807
Transportation fee - 8,840 - - - - - - - -
Interest earnings 13,824 16,408 25,053 216,587 683,044 550,626 279,564 168,451 117,025 341,432
Miscellaneous 452,838 402,607 267,337 532,621 238,322 265,796 191,836 256,117 239,992 198,621
State sources 13,806,616 12,275,813 13,113,096 14,640,564 16,885,039 16,371,322 14,368,278 13,611,036 13,275,454 11,724,479
Federal sources 2,587,346 2,498,402 2,211,637 1,655,549 1,457,291 1,329,479 1,511,281 1,363,213 1,309,900 1,079,521
Total revenue 75,699,230 72,748,405 70,805,334 70,042,325 70,985,612 69,040,203 63,295,597 60,837,606 57,436,627 52,793,748
Expenditures
Instruction
Regular Instruction 21,843,058 21,897,306 22,670,152 21,799,901 21,006,552 20,402,035 20,075,584 19,500,440 18,473,320 17,841,412
Special education instruction 5,001,480 4,582,938 4,781,510 4,707,955 4,306,544 4,210,778 3,809,545 3,328,671 2,904,914 2,600,277
Other special instruction 1,071,086 919,375 1,393,079 1,404,080 1,310,956 1,071,315 1,075,322 1,059,567 688,628 782,842
Other instruction 1,218,492 1,150,970 1,180,325 1,125,096 1,049,647 1,023,338 1,034,728 1,267,385 1,308,153 1,384,482
Support Services:
Instruction 3,265,613 3,992,315 3,434,045 3,292,240 2,971,655 2,396,367 2,482,940 2,157,695 2,296,703 2,237,582
Student & inst. related services 6,595,331 5,816,263 6,019,791 5,718,458 5,200,921 5,370,346 5,027,233 4,451,300 4,229,171 4,213,095
General & business administrative services 946,485 992,083 998,428 1,014,555 960,522 884,872 1,583,275 1,712,380 1,510,123 1,514,627
School administrative services 2,088,832 2,036,891 2,472,397 2,475,110 2,389,780 2,350,113 1,646,778 1,954,109 2,227,175 2,271,570
Central services 658,153 649,609 749,994 742,919 673,691 606,651 725,358 726,953 - -
Administrative information technology 455,117 437,484 476,244 228,003 - - - - - -
Plant operations and maintenance 5,835,371 6,134,451 6,078,561 6,453,715 6,725,919 6,154,093 6,300,025 5,403,522 5,294,190 4,301,129
Pupil transportation 3,151,643 3,115,311 3,134,340 3,113,502 2,979,135 2,900,206 2,743,880 2,347,673 2,322,209 2,186,221
Unallocated benefits 16,491,099 15,192,995 15,146,095 14,278,209 16,608,192 16,350,526 13,981,833 12,444,503 11,894,749 10,354,788
Special Schools 156,620 164,599 187,863 190,882 179,677 194,374 83,692 76,322 62,255 47,817
Transfer to Charter Schools 21,473 30,545 57,636 15,348 2,793 - - - 12,090 -
Capital outlay 1,193,799 344,535 1,024,887 2,700,609 5,009,751 902,517 1,306,501 3,758,868 13,653,196 3,713,252
Debt service:
Principal 2,610,000 2,530,000 2,420,000 2,343,000 1,865,000 1,725,000 1,585,000 1,425,000 1,285,000 1,130,000
Interest and other charges 726,908 812,332 1,022,430 1,421,769 1,048,751 1,119,064 1,182,546 1,244,748 1,311,103 1,344,755
Total expenditures 73,330,560 70,800,002 73,247,777 73,025,351 74,289,486 67,661,595 64,644,240 62,859,136 69,472,979 55,923,849
(continued)
75

J-4TOWNSHIP OF OCEAN BOARD OF EDUCATION
Changes in Fund Balances, Governmental FundsLast Ten Fiscal Years
Modified Basis of AccountingUnaudited
June 30, 2012 June 30, 2011 June 30, 2010 June 30, 2009 June 30, 2008 June 30, 2007 June 30, 2006 June 30, 2005 June 30, 2004 June 30, 2003
Excess (Deficiency) of revenues
over (under) expenditures 2,368,670$ 1,948,403$ (2,442,443)$ (2,983,026)$ (3,303,874)$ 1,378,608$ (1,348,643)$ (2,021,530)$ (12,036,352)$ (3,130,101)$
Other Financing sources (uses)
Capital leases (non-budgeted) 139,314 - - - - - 163,000 - 236,135 -
Proceeds from bonds - 8,585,000 - 8,275,000 6,113,000 - - - - -
Payments to refunding bond escrow - (9,199,528) - (8,459,066) - - - - - -
Premium on sale of bonds - 692,118 - - - - - - - -
Cost of issuance - (47,700) - - - - - - - -
Sale of assets 17,982 18,093 - - - - - - - -
Transfers in - 29,892 497,332 888,505 899,804 84,531 324,286 14,387 383,268 -
Transfers out - (129,892) (497,332) (988,505) (899,804) (84,531) (324,286) (14,387) (383,268) -
Total other financing sources (uses) 157,296 (52,017) - (284,066) 6,113,000 - 163,000 - 236,135 -
Net change in fund balances 2,525,966$ 1,896,386$ (2,442,443)$ (3,267,092)$ 2,809,126$ 1,378,608$ (1,185,643)$ (2,021,530)$ (11,800,217)$ (3,130,101)$
Debt service as a percentage of
noncapital expenditures 4.63% 4.74% 4.77% 5.35% 4.21% 4.26% 4.37% 4.52% 4.65% 4.74%
Source: District records
Note: Noncapital expenditures are total expenditures less capital outlay.
76
Central Service account classification was added beginning with year end June 30, 2005. Prior to June 30, 2005, Central

J-5TOWNSHIP OF OCEAN BOARD OF EDUCATIONGeneral Fund, Other Local Revenue by Source
Last Ten Fiscal YearsModified Accrual Basis of Accounting
Unaudited
Description June 30, 2012 June 30, 2011 June 30, 2010 June 30, 2009 June 30, 2008 June 30, 2007 June 30, 2006 June 30, 2005 June 30, 2004 June 30, 2003
Sale of energy 17,085$ 18,360$ -$ -$ -$ -$ -$ -$ -$ -$
Receipts from athletic fund - - - - - - - - - 48,032
Grant 31,628 44,149 - - - - - - - -
Facility charge 267,470 254,889 227,401 194,755 174,099 241,444 147,550 126,675 126,456 118,250
Prior year insurance refunds - - - - 10,071 - - 77,233 92,797 -
Prior year miscellaneous refunds 66,826 39,582 8,026 31,991 26,232 6,455 7,310 45,410 16,008 28,210
Sponsorship 27,950 30,950 23,950 22,000 23,650 3,000 22,100 - - -
Sale of assets 17,982 - - - - - - - - 1,474
Tuition 20,698 19,600 24,968 68,967 23,075 36,343 33,833 - - -
Transportation fees - 8,840 - - - 1,947 9,792 - - -
Interest 13,824 16,406 24,997 195,946 483,240 466,095 263,278 - - -
Miscellaneous - 147,717 - - - - - - - -
Rental fee - 254,889 - - - - - - - -
Cancellation of prior year checks - - - - - 7,271 - - - -
Shared services 38,939 11,141 - - - - - - - -
Miscellaneous 2,940 3,535 7,960 5,769 4,270 5,679 5,084 1,180 4,731 2,655
Total other local revenue 505,342$ 850,058$ 317,302$ 519,428$ 744,637$ 768,234$ 488,947$ 250,498$ 239,992$ 198,621$
Source: District Records
77

J-6TOWNSHIP OF OCEAN BOARD OF EDUCATION
Assessed Value and Estimated Actual Value of Taxable Property - Township of OceanLast Ten Years
Unaudited
Fiscal
Year
Ended
June 30, Vacant Land Residential Farm Reg.
Qualified
Farm Commercial Industrial Apartment
Total Assessed
Value
Less : Tax
Exempt
Property
Public
Utilities aNet Valuation
Taxable
Estimated Actual
(County
Equalized) Value
Total
Direct
School Tax
Rate b
2003 73,067,100 1,412,386,200 1,997,900 15,300 273,823,600 3,080,100 80,390,100 1,844,760,300 - 3,015,051 1,847,775,351 2,698,841,372 2.198
2004 65,608,100 1,439,899,400 1,997,900 15,300 290,703,100 3,080,100 80,062,700 1,881,366,600 - 2,595,697 1,883,962,297 3,178,708,458 2.315
2005 128,139,000 3,540,957,600 1,008,800 3,200 636,902,500 7,047,700 194,035,400 4,508,094,200 - 4,230,419 4,512,324,619 3,704,615,768 1.016
2006 137,653,400 3,557,304,600 1,008,800 3,200 646,551,200 7,047,700 192,513,400 4,542,082,300 - 3,737,125 4,545,819,425 4,751,591,624 1.065
2007 115,614,800 3,647,007,700 1,008,800 3,200 657,156,600 - 174,312,600 4,595,103,700 - 3,370,995 4,598,474,695 5,440,101,338 1.105
2008 108,809,100 3,701,801,300 1,008,800 3,200 650,095,600 - 174,312,600 4,636,030,600 - 3,335,276 4,639,365,876 5,821,430,884 1.105
2009 99,774,500 3,731,125,700 1,008,800 3,200 653,898,600 - 174,312,600 4,660,123,400 - 4,425,876 4,664,549,276 5,622,766,306 1.121
2010 94,206,500 3,405,982,600 864,200 3,000 646,389,100 - 167,082,500 4,314,527,900 - 5,730,952 4,320,258,852 5,535,729,615 1.263
2011 93,051,700 3,418,789,500 864,200 3,000 626,100,600 - 157,266,300 4,296,075,300 - 4,068,768 4,300,144,068 5,118,942,495 1.305
2012 88,166,100 3,427,805,400 864,200 3,000 613,228,750 - 157,266,300 4,287,333,750 - 4,391,570 4,291,725,320 4,803,080,497 1.331
Source: New Jersey's Monmouth County Board of Taxation Website
Note:
Reassessment occurs when the County Board of Taxation requests Treasury to order a reassessment
a Taxable Value of Machinery, Implements and Equipment of Telephone, Telegraph and Messenger System Companies
b Tax rates are per $100
Real property is required to be assessed at some percentage of true value (fair or market value) established by
the County board of taxation.
78

J-6aTOWNSHIP OF OCEAN BOARD OF EDUCATION
Assessed Value and Estimated Actual Value of Taxable Property - Village of Loch ArbourLast Ten Years
Unaudited
Fiscal Year
Ended
June 30, Vacant Land Residential Farm Reg.
Qualified
Farm Commercial Industrial Apartment
Total Assessed
Value
Less : Tax
Exempt
Property
Public
Utilities aNet Valuation
Taxable
Estimated
Actual (County
Equalized)
Value
Total Direct
School Tax
Rate b
2003 1,233,400 66,600,800 - - 3,576,000 - 263,400 71,673,600 - 79,424 71,753,024 71,567,466 0.418
2004 1,233,400 66,488,300 - - 3,576,000 - 263,400 71,561,100 - 60,715 71,621,815 84,719,953 0.419
2005 1,233,400 66,770,000 - - 3,576,000 - 263,400 71,842,800 - 48,774 71,891,574 98,997,671 0.417
2006 1,233,400 67,834,400 - - 3,576,000 - 263,400 72,907,200 - 31,547 72,938,747 137,889,910 0.412
2007 1,233,400 68,026,900 - - 3,598,900 - 263,400 73,122,600 - 24,272 73,146,872 179,473,339 0.410
2008 3,823,600 191,110,900 - - 9,058,600 - 803,200 204,796,300 - 68,604 204,864,904 187,038,594 0.410
2009 3,523,600 191,079,900 - - 9,058,600 - 803,200 204,465,300 - 72,171 204,537,471 172,470,574 0.146
2010 3,083,600 190,882,000 - - 8,278,600 - 753,200 202,997,400 - 91,363 203,088,763 194,726,874 0.871
2011 2,366,900 147,663,700 - - 6,483,900 - 587,300 157,101,800 - 77,150 157,178,950 195,940,278 1.320
2012 2,366,900 147,928,700 - - 6,483,900 - 587,300 157,366,800 - 63,558 157,430,358 181,236,975 1.390
Source: New Jersey's Monmouth County Board of Taxation Website
Note:
Reassessment occurs when the County Board of Taxation requests Treasury to order a reassessment
a Taxable Value of Machinery, Implements and Equipment of Telephone, Telegraph and Messenger System Companies
b Tax rates are per $100
Real property is required to be assessed at some percentage of true value (fair or market value) established by
each county board of taxation.
79

J-7TOWNSHIP OF OCEAN BOARD OF EDUCATION
Direct and Overlapping Property Tax RatesPer $100 of Assessed Valuation
Last Ten YearsUnaudited
Township of Ocean
Fiscal Year
Ended June 30, Basic Rate a
General
Obligation Debt
Service bTotal Direct
School Tax Rate
Township of
Ocean
Monmouth
County
2003 2.060 0.138 2.198 0.569 0.631 3.398
2004 2.173 0.142 2.315 0.564 0.642 3.521
2005 1.041 0.065 1.106 0.346 0.250 1.702
2006 1.002 0.063 1.065 0.296 0.313 1.674
2007 1.043 0.062 1.105 0.308 0.320 1.733
2008 1.058 0.047 1.105 0.308 0.320 1.733
2009 1.064 0.057 1.121 0.355 0.323 1.799
2010 1.200 0.063 1.263 0.428 0.350 2.041
2011 1.238 0.067 1.305 0.446 0.331 2.082
2012 1.261 0.070 1.331 0.456 0.324 2.111
Village of Loch Arbour
Fiscal Year
Ended June 30, Basic Rate a
General
Obligation Debt
Service bTotal Direct
School Tax Rate
Village of Loch
Arbour
Monmouth
County
2003 0.392 0.026 0.418 0.531 0.417 1.366
2004 0.393 0.026 0.419 0.550 0.441 1.410
2005 0.392 0.025 0.417 0.573 0.464 1.454
2006 0.388 0.024 0.412 0.595 0.569 1.576
2007 0.392 0.018 0.410 0.665 0.614 1.689
2008 0.392 0.018 0.410 0.614 0.665 1.689
2009 0.138 0.008 0.146 0.242 0.234 0.622
2010 0.827 0.044 0.871 0.280 0.260 1.411
2011 1.251 0.069 1.320 0.407 0.350 2.077
2012 1.318 0.072 1.390 0.404 0.335 2.129
Source: Borough Tax Collector
Note:
a
b Rates for debt service are based on each year's requirements.
N/A At the completion of the CAFR, this data was not available.
NJSA 18A:7F-5d limits the amount that the district can submit for a general fund tax levy . The levy when added to other
components of the district's net budget may not exceed the prebudget year net budget by more than the spending growth
limitation calculated as follows: the prebudget year net budget increased by the cost of living or 2.5 percent, whichever is
greater, plus any spending growth adjustments.
The district's basic tax rate is calculated from the A4F form which is submitted with the budget and the net valuation
taxable.
Township of Ocean Board of Education Direct Rate Overlapping RatesTotal Direct
and
Overlapping
Tax Rate
Township of Ocean Board of Education Direct Rate Overlapping Rates Total Direct
and
Overlapping
Tax Rate
80

J-8TOWNSHIP OF OCEAN BOARD OF EDUCATION
Principal Property Taxpayers - Township of OceanCurrent Year and Nine Years Ago
Unaudited
Taxable Assessed
Value
% of Total
District Net
Assessed Value
Seaview Square LLC c/o Linque Management 60,000,000$ 1.40%
Woodshire Apartments 48,393,500 1.13%
Ocean Seniors, LLC 23,987,300 0.56%
Westwood Oaks Associates 23,107,100 0.54%
Sears Roebuck & Co 22,517,600 0.52%
Cold Indian Springs Corp 20,046,600 0.47%
Gold Enterprises c/o Salem Management 19,222,700 0.45%
Continental Land Develeopers, LLC 16,453,000 0.38%
Hollywood Golf Club 15,398,300 0.36%
Sunset Arcadia Center, Inc. 11,970,000 0.28%
TOTAL 261,096,100$ 6.08%
Taxable Assessed
Value
% of Total
District Net
Assessed Value
Woodshire Apartments 22,198,000$ 0.82%
Equitable Insurance 18,489,400 0.69%
Continental Land Development 12,000,000 0.44%
Gold Enterprises 10,346,000 0.38%
Sears Roebuck & Co 9,643,000 0.36%
Cold Indian Springs Corp 9,174,000 0.34%
Westwood Oaks Associates 8,636,200 0.32%
Continental Enterprises 6,300,000 0.23%
Coolidge Cobblestone 6,100,000 0.23%
Hollywood Golf Club 4,961,500 0.18%
TOTAL 107,848,100$ 4.00%
Source: Municipal Tax Assessor
Note: Values are assessed at January 1 of the audit year.
2012
2003
81

J-8aTOWNSHIP OF OCEAN BOARD OF EDUCATION
Principal Property Taxpayers - Village of Loch ArbourCurrent Year and Nine Years Ago
Unaudited
Taxable Assessed
Value
% of Total
District Net
Assessed Value
Individual Taxpayer #1 3,848,300$ 2.44%
Individual Taxpayer #2 3,281,700 2.08%
Individual Taxpayer #3 2,439,700 1.55%
Individual Taxpayer #4 2,292,900 1.46%
Individual Taxpayer #5 2,149,000 1.37%
Individual Taxpayer #6 2,134,700 1.36%
Individual Taxpayer #7 2,112,200 1.34%
Individual Taxpayer #8 1,932,900 1.23%
Individual Taxpayer #9 1,919,700 1.22%
Individual Taxpayer #10 1,888,200 1.20%
TOTAL 23,999,300$ 15.24%
Taxable Assessed
Value
% of Total
District Net
Assessed Value
Individual Taxpayer #1 1,574,100$ 2.20%
Individual Taxpayer #2 1,295,900 1.81%
Individual Taxpayer #3 1,167,900 1.63%
Individual Taxpayer #4 1,047,200 1.46%
Individual Taxpayer #5 1,019,200 1.42%
Individual Taxpayer #6 955,500 1.34%
Individual Taxpayer #7 919,000 1.28%
Gabcar, LLC 899,400 1.26%
Individual Taxpayer #8 840,200 1.17%
Individual Taxpayer #9 804,300 1.12%
TOTAL 10,522,700$ 14.70%
Source: Municipal Tax Assessor
Note: Values are assessed at January 1 of the audit year.
2012
2003
82
J-9TOWNSHIP OF OCEAN BOARD OF EDUCATION
Property Tax Levies and CollectionsLast Ten Years
Unaudited
Township of Ocean
Collected within the Fiscal Year of the Levy a
Year Ended
December 31,
Total Tax Levy
for the Fiscal
Year Amount Percentage of Levy
Collections in
Subsequent
Years
2002 59,364,448$ 58,329,702$ 98.26% 912,150$
2003 65,625,858 64,506,190 98.29% 846,089
2004 69,049,665 68,000,796 98.48% 617,171
2005 73,725,327 73,122,126 99.18% 583,553
2006 79,255,476 78,085,541 98.52% 1,157,835
2007 82,714,716 81,708,783 98.78% 992,470
2008 86,385,299 85,283,363 98.72% 1,066,022
2009 88,023,874 86,814,442 98.63% 1,044,535
2010 90,987,168 89,327,065 98.18% 1,386,583
2011 92,386,823 91,065,596 98.57% N/A
Village of Loch Arbour
Collected within the Fiscal Year of the Levy a
Year Ended
December 31,
Total Tax Levy
for the Fiscal
Year Amount Percentage of Levy
Collections in
Subsequent
Years
2002 919,466$ 913,916$ 99.40% N/A
2003 980,146 975,176 99.49% N/A
2004 1,013,569 1,012,497 99.89% N/A
2005 1,053,140 1,052,966 99.98% N/A
2006 1,150,979 1,150,979 100.00% N/A
2007 1,237,939 1,237,987 100.00% N/A
2008 1,274,429 1,257,678 98.69% N/A
2009 1,966,149 1,941,374 98.74% N/A
2010 2,860,766 2,753,502 96.25% N/A
2011 3,271,613 3,239,312 99.01% N/a
Source: District records including the Certificate and Report of School Taxes (A4F form) from Municipal Tax Assessor.
a School taxes are collected by the Municipal Tax Collector. Under New Jersey State Statute, a municipality is required
to remit to the school district the entire property tax balance, in the amount voted upon or certified prior to the end
of the school year.
83

J-10TOWNSHIP OF OCEAN BOARD OF EDUCATION
Ratios of Outstanding Debt by TypeLast Ten Fiscal Years
Unaudited
Business-Type
Governmental Activities Activities
Year
Ended
June 30,
General
Obligation Bonds Capital Leases Capital Leases Total District
Percentage
of Personal
Income a Per Capita a
2003 29,517,000$ -$ -$ 29,517,000$ 2.40% 1,061
2004 28,232,000 739,785 - 28,971,785 2.19% 1,038
2005 26,807,000 - - 26,807,000 1.95% 957
2006 25,222,000 148,721 - 25,370,721 1.68% 904
2007 23,497,000 120,784 - 23,617,784 1.44% 829
2008 27,745,000 90,151 - 27,835,151 1.65% 977
2009 25,217,000 56,561 - 25,273,561 1.59% 888
2010 22,797,000 19,729 - 22,816,729 1.46% 829
2011 20,310,000 - - 20,310,000 N/A 738
2012 17,700,000 123,561 - 17,823,561 N/A N/A
Note: Details regarding the district's outstanding debt can be found in the notes to the financial statements.
a See Exhibit J-14 for personal income and population data. These ratios are calculated using personal income and
population for the prior calendar year. Data amounts are combined for the Township of Ocean and Village of Loch Arbour.
84

J-11TOWNSHIP OF OCEAN BOARD OF EDUCATIONRatio of Net General Bonded Debt Outstanding
Last Ten Fiscal YearsUnaudited
Township of Ocean
Year Ended
June 30,
General
Obligation
Bonds Deductions
Net General
Bonded Debt
Outstanding
Percentage
of Actual
Taxable
Value of
Property a
Net Bonded
Debt Per
Capita b
2003 28,780,967 - 28,780,967 1.56% 1,045.44
2004 27,499,329 - 27,499,329 1.46% 995.34
2005 26,085,762 - 26,085,762 0.58% 940.16
2006 24,510,740 - 24,510,740 0.54% 882.03
2007 22,746,506 - 22,746,506 0.49% 806.07
2008 26,912,650 - 26,912,650 0.58% 954.28
2009 24,420,143 - 24,420,143 0.52% 865.84
2010 22,076,615 - 22,076,615 0.51% 808.25
19,630,574 - 19,630,574 0.46% 718.57
17,047,401 - 17,047,401 0.40% N/A
Village of Loch Arbour
Year Ended
June 30,
General
Obligation
Bonds Deductions
Net General
Bonded Debt
Outstanding
Percentage
of Actual
Taxable
Value of
Property a
Net Bonded
Debt Per
Capita b
2003 736,033 - 736,033 1.03% 2,610.05
2004 732,671 - 732,671 1.02% 2,598.12
2005 721,238 - 721,238 1.00% 2,575.85
2006 711,260 - 711,260 0.98% 2,567.73
2007 750,494 - 750,494 1.03% 2,729.07
2008 832,350 - 832,350 0.41% 3,037.77
2009 796,857 - 796,857 0.39% 2,918.89
2010 720,385 - 720,385 0.35% 3,713.32
2011 679,426 - 679,426 0.43% 3,502.20
2012 652,599 - 652,599 0.41% N/A
Sources: Assessed valuations were provided by the Abstract of Ratables, Monmouth County Board of Taxation.
School district population data was provided by school district officials.
Note: Details regarding the District's outstanding debt can be found in the Notes to the Basic Financial Statements.
a See Exhibit J-6 for property tax data
b Population data can be found in Exhibit J-14
2011
2012
85

J-12TOWNSHIP OF OCEAN BOARD OF EDUCATION
Direct and Overlapping Government Activities DebtFor the Year Ended December 31, 2011
Unaudited
Debt Outstanding
Estimated
Percentage
Applicable a
Estimated Share
of Overlapping
Debt
Debt repaid with property taxes
Township of Ocean 24,179,322$ 100.000% 24,179,322$
Village of Loch Arbour 1,175,794 100.000% 1,175,794
Monmouth County General Obligation Debt 456,874,186 4.263% 19,476,547
Other debt -
Subtotal overlapping debt 44,831,663
Township of Ocean Board of Education Direct Debt 19,970,000
Total Direct and Overlapping Debt 64,801,663$
Sources: Assessed value data used to estimate applicable percentages provided by the Monmouth County Board of Taxation.
Debt outstanding data provided by each governmental unit.
Note:
a
Overlapping governments are those that coincide, at least in part, with the geographic boundaries of the District. This schedule
estimates the portion of the outstanding debt of those overlapping governments that is borne by the residents and businesses of
the District. This process recognizes that, when considering the District's ability to issue and repay long-term debt, the entire
debt burden borne by the residents and businesses should be taken into account. However this does not imply that every
taxpayer is a resident, and therefore responsible for repaying the debt, of each overlapping payment.
For debt repaid with property taxes, the percentage of overlapping debt applicable is estimated using taxable assessed property
values. Applicable percentages were estimated by determining the portion of another governmental unit's taxable value that is
within the district's boundaries and dividing it by each unit's total taxable value.
86

J-13TOWNSHIP OF OCEAN BOARD OF EDUCATION
Legal Debt Margin InformationFor The Last Ten Fiscal Years
Unaudited
Legal Debt Margin Calculation for Fiscal Year 2011
Equalized valuation basis
2012 4,984,317,472$
2011 5,314,882,773
2010 5,730,456,489 16,029,656,734$
Average equalized valuation of taxable property 5,343,218,911$
Debt limit (4% of average equalization value) 213,728,756 a
Total Net Debt Applicable to Limit 17,700,000 Legal debt margin 196,028,756$
Fiscal Year
2012 2011 2010 2009 2008 2007 2006 2005 2004 2003
Debt limit 213,728,756$ 204,231,014$ 233,788,839$ 232,310,414$ 220,233,676$ 190,838,595$ 159,420,312$ 131,045,645$ 105,694,523$ 97,816,789$
Total net debt applicable to limit 17,700,000 20,310,000 22,979,000 25,217,000 27,745,000 23,497,000 25,222,000 26,807,000 28,232,000 29,517,000
Legal debt margin 196,028,756$ 183,921,014$ 210,809,839$ 207,093,414$ 192,488,676$ 167,341,595$ 134,198,312$ 104,238,645$ 77,462,523$ 68,299,789$
Total net debt applicable to the limit
as a percentage of debt limit 8.28% 9.94% 9.83% 10.85% 12.60% 12.31% 15.82% 20.46% 26.71% 30.18%
Source: Equalized valuation bases were obtained from the Annual Report of the State of New Jersey,
Department of Treasury, Division of Taxation as posted on the Monmouth County Board of Taxation Website
Note: Debt amounts combined for Township of Ocean and Village of Loch Arbour
a Limit set by NJSA 18A:24-19 for a K through 12 district; other % limits would be applicable for other district types.
87

J-14TOWNSHIP OF OCEAN BOARD OF EDUCATION
Demographic and Economic StatisticsLast Ten Years
Unaudited
Township of Ocean
Year Population a
Personal
Income b
Per Capita
Personal
Income c
Unemployment
Rate d
2003 27,530 1,217,569,310$ 44,227$ 4.70%
2004 27,628 1,308,848,872 47,374 3.90%
2005 27,746 1,364,243,074 49,169 3.50%
2006 27,789 1,492,713,924 53,716 3.50%
2007 28,219 1,627,954,110 57,690 3.40%
2008 28,202 1,673,337,468 59,334 4.50%
2009 28,204 1,572,767,856 55,764 8.30%
2010 27,314 1,555,668,870 56,955 8.40%
2011 27,319 N/A N/A 8.80%
2012 N/A N/A N/A N/A
Village of Loch Arbour
Year Population a
Personal
Income b
Per Capita
Personal
Income c
Unemployment
Rate d
2003 282 12,472,014$ 44,227$ 4.70%
2004 282 13,359,468 47,374 3.70%
2005 280 13,767,320 49,169 6.20%
2006 277 14,879,332 53,716 6.30%
2007 275 15,864,750 57,690 5.70%
2008 274 16,257,516 59,334 7.40%
2009 273 15,223,572 55,764 11.90%
2010 194 11,049,270 56,955 12.00%
2011 194 N/A N/A 12.10%
2012 N/A N/A N/A N/A
Sources:
a
b Personal income has been estimated based upon the municipal population and per capita personal income presented.
c
d Unemployment data provided by the NJ Dept of Labor and Workforce Development.
N/A At the time of the CAFR completion, the data was not yet available.
Population information provided by the NJ Dept of Labor and Workforce Development. Estimate is based on July 1 of the audit
year.
Per capita personal income by municipality not available. The Per Capita Personal Income amounts presented represent the
figures available for Monmouth County, NJ as provided by the State of New Jersey, Department of Education, Division of Finance.
88

J-15TOWNSHIP OF OCEAN BOARD OF EDUCATION
Principal EmployersCurrent Year and Nine Years Ago
Unaudited
TOWNSHIP OF OCEAN
2012 2003
Employer Employees
Percentage of
Total Municipal
Employment Employees
Percentage of
Total Municipal
Employment
At the time of completion of the CAFR, this information was not available.
VILLAGE OF LOCH ARBOUR
2012 2003
Employer Employees
Percentage of
Total Municipal
Employment Employees
Percentage of
Total Municipal
Employment
Stress Management t/a McGillicuddy's 20 11.76% 0
Allenhurst Carcare 12 7.06% 4
Richard P. Nobile, DDS 5 2.94% 5
Village of Loch Arbour 5 2.94% 0
MT Kess, Inc. t/a Grateful Deli 4 2.35% 0
Provident Investors 2 1.18% 2
Loch Arbour Liquors, Inc. 1 0.59% 1
Gabcar, LLC 0 0.00% 15
49 27
Sources:
Village of Loch Arbour information provided by local tax assessor, based on information voluntarily provided by employers.
N/A - At the time of the completion of the CAFR, this information was not available.
89

J-16TOWNSHIP OF OCEAN BOARD OF EDUCATION
Full-time Equivalent District Employees by Function/ProgramLast Eight Fiscal Years
Unaudited
2012 2011 2010 2009 2008 2007 2006 2005
Function/Program
Instruction:
Regular 264.8 263.7 285.1 284.0 281.8 290.6 283.0 277.7
Special education 103.0 105.5 95.5 95.5 90.5 92.5 86.5 75.0
Other special education 35.5 27.6 51.6 54.5 55.0 49.1 49.6 55.5
Other instruction 3.0 3.0 3.0 3.0 3.0 3.0 3.0 8.0
Support Services:
Student and instruction related services 79.7 76.6 76.1 76.4 80.6 65.6 72.6 70.0
General Administration 7.0 7.0 8.0 8.0 8.0 8.0 8.0 8.0
School administration services 25.0 25.0 33.0 37.0 36.0 37.0 42.0 42.6
Central services 8.0 8.0 9.5 9.5 9.5 10.5 11.0 11.0
Administrative information technology 8.0 8.0 9.0 3.0 - - - -
Plant operations and maintenance 60.0 57.0 59.5 66.5 65.5 68.5 65.5 63.5
Pupil transportation 41.0 49.0 51.0 54.0 53.0 59.0 60.0 60.0
Total 635.0 630.4 681.3 691.4 682.9 683.8 681.2 671.3
Source: District records
Note: Schedule does not contain ten years of information as GASB 44 was
implemented during the fiscal year ending June 30, 2006.
90
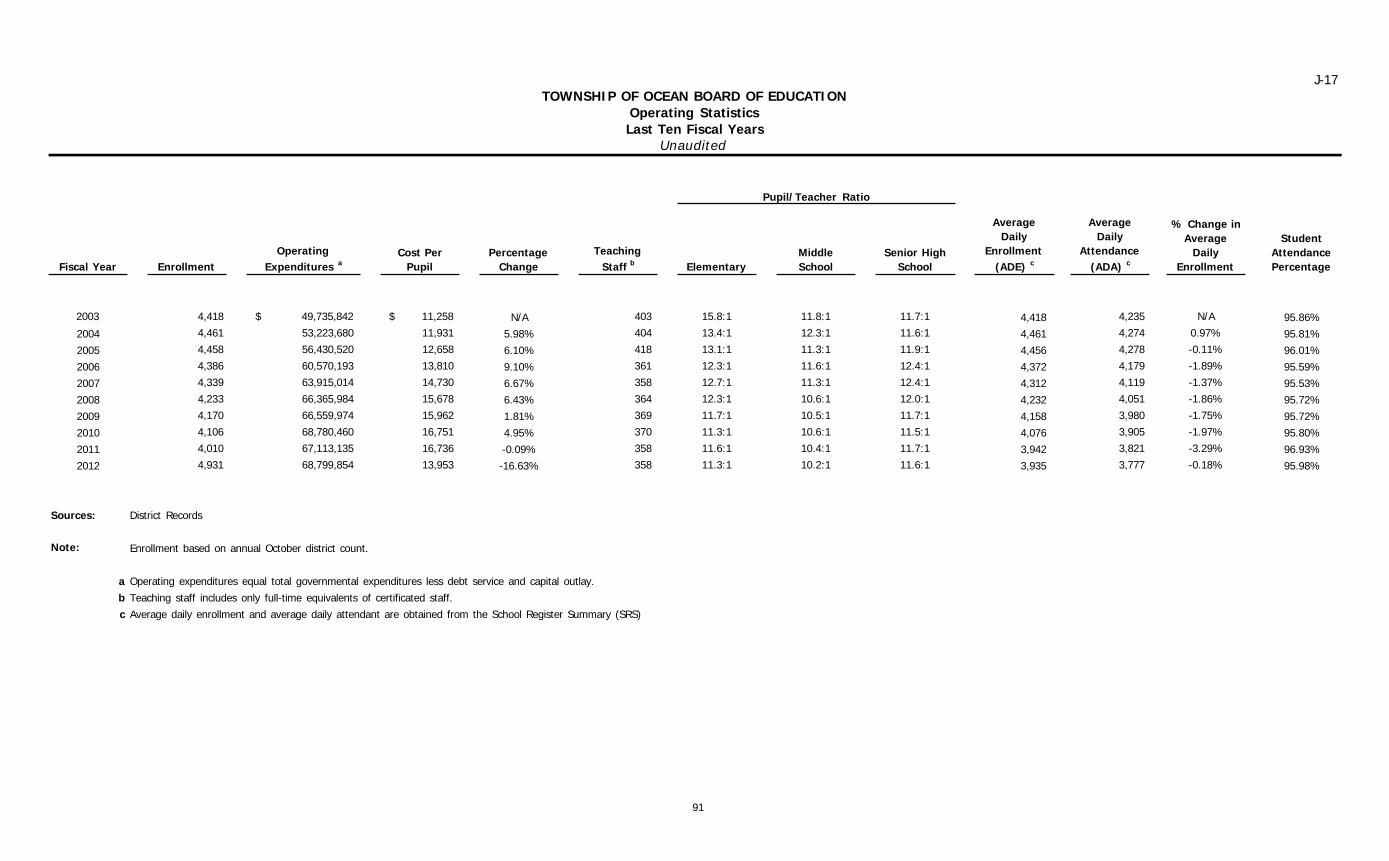
J-17TOWNSHIP OF OCEAN BOARD OF EDUCATION
Operating StatisticsLast Ten Fiscal Years
Unaudited
Fiscal Year Enrollment
Operating
Expenditures aCost Per
Pupil
Percentage
Change
Teaching
Staff b Elementary
Middle
School
Senior High
School
Average
Daily
Enrollment
(ADE) c
Average
Daily
Attendance
(ADA) c
% Change in
Average
Daily
Enrollment
Student
Attendance
Percentage
2003 4,418 $ 49,735,842 $ 11,258 N/A 403 15.8:1 11.8:1 11.7:1 4,418 4,235 N/A 95.86%
2004 4,461 53,223,680 11,931 5.98% 404 13.4:1 12.3:1 11.6:1 4,461 4,274 0.97% 95.81%
2005 4,458 56,430,520 12,658 6.10% 418 13.1:1 11.3:1 11.9:1 4,456 4,278 -0.11% 96.01%
2006 4,386 60,570,193 13,810 9.10% 361 12.3:1 11.6:1 12.4:1 4,372 4,179 -1.89% 95.59%
2007 4,339 63,915,014 14,730 6.67% 358 12.7:1 11.3:1 12.4:1 4,312 4,119 -1.37% 95.53%
2008 4,233 66,365,984 15,678 6.43% 364 12.3:1 10.6:1 12.0:1 4,232 4,051 -1.86% 95.72%
2009 4,170 66,559,974 15,962 1.81% 369 11.7:1 10.5:1 11.7:1 4,158 3,980 -1.75% 95.72%
2010 4,106 68,780,460 16,751 4.95% 370 11.3:1 10.6:1 11.5:1 4,076 3,905 -1.97% 95.80%
2011 4,010 67,113,135 16,736 -0.09% 358 11.6:1 10.4:1 11.7:1 3,942 3,821 -3.29% 96.93%
2012 4,931 68,799,854 13,953 -16.63% 358 11.3:1 10.2:1 11.6:1 3,935 3,777 -0.18% 95.98%
Sources: District Records
Note: Enrollment based on annual October district count.
a Operating expenditures equal total governmental expenditures less debt service and capital outlay.
b Teaching staff includes only full-time equivalents of certificated staff.
c Average daily enrollment and average daily attendant are obtained from the School Register Summary (SRS)
Pupil/Teacher Ratio
91

J-18TOWNSHIP OF OCEAN BOARD OF EDUCATION
School Building InformationLast Ten Fiscal Years
Unaudited
2012 2011 2010 2009 2008 2007 2006 2005 2004 2003
District Building
Elementary
Wanamassa Elementary School
Square feet 59,580 59,580 59,580 59,580 59,580 59,580 59,580 59,580 43,080 43,080
Capacity (students) 477 477 477 477 477 477 477 477 345 345
Enrollment 371 383 410 371 372 369 369 386 483 495
Ocean Township Elementary School
Square feet 76,160 76,160 76,160 76,160 76,160 76,160 76,160 76,160 72,160 72,160
Capacity (students) 609 609 609 609 609 609 609 609 577 577
Enrollment 459 473 446 461 469 477 466 506 619 609
Wayside Elementary School
Square feet 147,375 147,375 147,375 147,375 147,375 147,375 147,375 147,375 147,375 147,375
Capacity (students) 713 713 713 713 713 713 713 713 713 713
Enrollment 581 591 608 658 677 680 702 720 868 897
Middle School
Ocean Township Intermediate School
Square feet 257,400 257,400 257,400 257,400 257,400 257,400 257,400 257,400 192,400 192,400
Capacity (students) 1,951 1,951 1,951 1,951 1,951 1,951 1,951 1,951 1,459 1,459
Enrollment 1,284 1,284 1,323 1,314 1,292 1,363 1,412 1,424 1,106 1,115
High School
Ocean Township High School
Square feet 200,215 200,215 200,215 200,215 200,215 200,215 200,215 200,215 200,215 200,215
Capacity (students) 1,326 1,326 1,326 1,326 1,326 1,326 1,326 1,326 1,326 1,326
Enrollment 1,236 1,279 1,319 1,366 1,423 1,450 1,410 1,430 1,377 1,341
Number of Schools at June 30, 2012
Elementary = 3
Middle = 1
High =1
Source: District records.
Note: Increases in square footage and capacity are the result of additions. Enrollment is based on the annual October district count.
N/A: At the time of the completion of the CAFR, this data was not available. 92

J-19TOWNSHIP OF OCEAN BOARD OF EDUCATION
General FundSchedule of Allowable Maintenance Expenditures by School Facilities
Last Nine Fiscal YearsUnaudited
Undistributed Expenditures - Required
Maintenance for School Facilities
11-000-261-XXX Gross
Square Footage 2012 2011 2010 2009 2008 2007 2006 2005 2004
School facilities
Ocean Township Elementary School 76,160 94,390$ 93,678$ 81,679$ 92,484$ 95,160$ 108,159$ 122,998$ 74,010$ 83,199$
Ocean Township High School 200,215 391,314 319,582 307,507 294,898 257,241 238,305 324,152 227,661 209,613
Ocean Township Intermediate School 257,400 305,409 291,724 259,333 331,928 300,467 272,087 320,662 260,259 177,630
Wanamassa Elementary School 59,580 83,580 80,522 74,366 114,077 133,480 71,059 74,600 74,569 55,716
Wayside Elementary School 147,375 154,798 136,485 152,552 159,307 168,952 149,424 182,212 128,170 140,556
Total School Facilities 1,029,491 921,991 875,437 992,694 955,300 839,034 1,024,624 764,669 666,714
Grand Total 1,029,491$ 921,991$ 875,437$ 992,694$ 955,300$ 839,034$ 1,024,624$ 764,669$ 666,714$
Source: District Records
Required maintenance, defined in N.J.A.C 6:24, The Educational Facilities Construction and Financing Act, includes expenditures for systems
warranty purposes that are approved for repairs and replacements for the purpose of keeping a school facility open, comfortable and safe for
use or in its original condition, include repairs and replacements to a school facility's heating, lighting, ventilation, security and other fixtures
to keep the facility or fixtures in effective working condition. Required maintenance includes periodic or occasional inspection; adjustment,
lubrication, and cleaning (non-janitorial) of buildings or fixtures; replacement of parts; and other actions to assure continuing service and to
prevent breakdown.
93

J-20TOWNSHIP OF OCEAN BOARD OF EDUCATION
Insurance ScheduleJune 30, 2012
Unaudited
Coverage Deductible
Commercial Property - Monmouth Ocean Counties Shared Services Insurance Fund
Property
Blanket real and personal property, per occurrence 500,000,000$ 5,000$
Blanket building and personal property 50,000,000 5,000
Blanket valuable papers and records 10,000,000 5,000
Demolition and increased cost of construction, per occurrence 10,000,000
Fire department service charge 10,000
Arson rewards 10,000
Pollutant cleanup and removal 250,000
Flood
Zone (SFHA) A & V, per occurrence , per building/building contents 10,000,000 500,000
NJSBAIG annual aggregate 10,000,000
Accounts receivable, per occurance 250,000
All other zones, per occurrence/NJSBAIG annual aggregate 50,000,000 10,000
Earthquake, per occurrence/NJSBAIG annual aggregate 50,000,000
Terrorism, per occurrence/NJSBAIG annual aggregate 1,000,000
Electronic Data Processing
Blanket hardware/software, per occurrence 1,750,000 1,000
Coverage extensions:
Transit 25,000
Loss of income 10,000
Flood, per occurrence 1,000,000
Zones A & V, per building content 500,000
All other flood zones, per member/per occurrence 10,000
Equipment Breakdown
Combined single limit per accident for property damage and business income 100,000,000 5,000
Sublimits:
Off premises property damage 100,000
Extra expense 10,000,000
Service interruption 10,000,000
Perishable goods 500,000
Data restoration 100,000
Contingent business income 100,000
Demolition 1,000,000
Ordinance or law 1,000,000
Expediting expenses 500,000
Hazardous substances 500,000
Newly acquired locations - 60 days notice 250,000
Crime
Public employee dishonesty with faithful performance 1,000,000 1,000
Theft, Disappearance and destruction - loss of money & security on or off premises 25,000 500
Forgery & alteration 250,000 1,000
Computer fraud 1,000,000 1,000
Public officials bond - Board Treasurer 200,000 1,000
Comprehensive General Liability
Bodily injury and property damage, combined single limit 11,000,000
Bodily injury from products and completed operations, annual aggregate 11,000,000
Sexual abuse
Per occurrence 11,000,000
Annual pool aggregate 17,000,000
Personal injury and advertising injury, per occurrence/annual aggregate 11,000,000
Employee benefits liability, per occurrence/annual aggregate 11,000,000 1,000
Premises medical payments
Per accident 10,000
Limit per person 5,000
Terrorism, per occurrence/NJSBAIG annual aggregate 1,000,000
(continued)
94

J-20TOWNSHIP OF OCEAN BOARD OF EDUCATION
Insurance ScheduleJune 30, 2012
Unaudited
Coverage Deductible
Commercial Property - Monmouth Ocean Counties Shared Services Insurance Fund (continued)
Automobile, Liability
Any auto, combined single limit for bodily injury and property damage, per accident 11,000,000$
Uninsured/underinsured motorists
Symbol 6, Private passenger auto, combined single limit 1,000,000
Symbol 6, All other vehicles
Bodily injury per person 15,000
Bodily injury per accident 30,000
Property damage per accident 5,000
Symbol 5, Personal injury protection (including pedestrians) 250,000
Medical payments, private passenger vehicles 10,000
All other vehicles 5,000
Terrorism, per occurrence/NJSBAIG annual aggregate 1,000,000
Automobile, Physical Damage, Scheduled Vehicles Only
Symbol 7, Comprehensive 1,000$
Symbol 7, Collision 1,000
Symbol 7, Hired car physical damage, $75,000 limit 1,000
Environmental Impairment Liability - ACE American Insurance Company (NJSBAIG)
Limits of Liability, per "pollution condition"
Each school district 2,000,000
Aggregate, all "pollution conditions" 11,000,000
Self-insured retention per "pollution condition" 10,000
Workers Compensation - Monmouth Ocean Counties Shared Services Insurance Fund
Coverage A - Statutory
Limits of liability:
Bodily injury by accident, each accident 2,000,000
Bodily injury by disease, each employee 2,000,000
Bodily injury by disease, aggregate limit 2,000,000
School Leaders Errors and Omission - Monmouth Ocean Counties
Shared Services Insurance Fund
Coverage A
Limit of liability, each policy period, retro date July 1, 1986 11,000,000
Each Claim 15,000
Coverage B, Retro Date July 1, 1986
Limit of liability, each claim 100,000 15,000
Limit of liability, each policy period 300,000
School Time Compulsory Student Accident - Markel Insurance Co
Base plan maximum, full excess including interscholastic sports and football 1,000,000
Excess medical 5,000,000
Deductible 25,000
Accidental death dismemberment 20,000
Catastrophic injury 500,000
Volunteer workers 25,000
Bond -The Hartford Insurance Group
Kenneth Jannarone, BA/BS 3,000
Bond - NJSBAIG
Stephen Gallagher, Treasurer of School Monies 200,000 1,000
(continued)
95

J-20TOWNSHIP OF OCEAN BOARD OF EDUCATION
Insurance ScheduleJune 30, 2012
Unaudited
Coverage Deductible
Student Accident - Berkley Life and Health Insurance Co.
Aggregate limit of liability, per covered accident, accidental death and dismemberment 25,000
Accidential Death and Dismemberment
Class 1, School Coverage 10,000
Class 2, Sports Coverage 10,000
Class 3, Supervised and Sponsored Activities 10,000
Total Benefit Maximum for all Accident Medical
Class 1, School Coverage 25,000
Class 2, Sports Coverage 25,000
Class 3, Supervised and Sponsored Activities 25,000
96

SINGLE AUDIT SECTION

PO Box 206, 220 Monmouth Road, Oakhurst, NJ 07755 732-531-4100 s Fax 732-531-4130 s www.pdgcpa.com
PADUANO, DITOMMASO
& GOLDA, LLC
Certified Public Accountants and Consultants
K-1
Page 1 of 2 REPORT ON INTERNAL CONTROL OVER FINANCIAL REPORTING AND ON COMPLIANCE AND OTHER MATTERS BASED ON AN AUDIT OF FINANCIAL STATEMENTS PERFORMED IN ACCORDANCE WITH
GOVERNMENT AUDITING STANDARDS
The Honorable President and Members of the Board of Education Township of Ocean School District County of Monmouth Oakhurst, New Jersey 07755 We have audited the financial statements of the Board of Education of the Township of Ocean School District, in the County of Monmouth, State of New Jersey, as of and for the year ended June 30, 2012, and have issued our report thereon dated October 26, 2012. We conducted our audit in accordance with auditing standards generally accepted in the United States of America, the standards applicable to financial audits contained in Government Auditing Standards , issued by the Comptroller General of the United States, and audit requirements as prescribed by the Division of Finance, Department of Education, State of New Jersey. Internal Control Over Financial Reporting Management of the Board of Education of the Township of Ocean School District is responsible for establishing and maintaining internal control over financial reporting. In planning and performing our audit, we considered the Township of Ocean Board of Education’s internal control over financial reporting as a basis for designing our auditing procedures for the purpose of expressing our opinion on the financial statements, but not for the purpose of expressing an opinion on the effectiveness of the Township of Ocean Board of Education’s internal control over financial reporting. Accordingly, we do not express an opinion on the effectivenes s of the Township of Ocean Board of Education’s internal control over financial reporting. A deficiency in internal control exists when the design or operation of a control does not allow management or employees, in the normal course of performing their assigned functions, to prevent, or detect and correct misstatements on a timely basis.
97

Township of Ocean School District K-1 October 26, 2012 Page 2 of 2 Page 2 A material weakness is a deficiency, or combination of deficiencies , in internal control, such that there is a reasonable possibility that a material misstatement of the entity’s financial statements will not be prevented, or detected and corrected on a timely basis. Our consideration of internal control over financial reporting was for the limited purpose described in the first paragraph of this section and was not designed to identify all deficiencies in internal control over financial reporting that might be deficiencies, significant deficiencies or material weaknesses. We did not identify any deficiencies in internal control over financial reporting that we consider to be material weaknesses, as defined above. Compliance and Other Matters As part of obtaining reasonable assurance about whether the Township of Ocean Board of Education’s financial statements are free of material misstatement, we performed tests of its compliance with certain provisions of laws, regulations, contracts and grant agreements, noncompliance with which could have a direct and material effect on the determination of financial statement amounts. However, providing an opinion on compliance with those provisions was not an objective of our audit, and accordingly, we do not express such an opinion. The results of our tests disclosed no instances of noncompl iance or other matters that are required to be reported under Government Auditing Standards and audit requirements as prescribed by the Division of Finance, Department of Education, State of New Jersey. This report is intended solely for the information and use of the audit committee, management, the Township of Ocean Board of Education, the New Jersey State Department of Education, and other federal and state awarding agencies and pass-through entities and is not intended to be and should not be used by anyone other than these specified parties.
Paduano, DiTommaso & Golda, LLC Certified Public Accountant October 26, 2012 Licensed Public School Accountant #CS00164
98

PO Box 206, 220 Monmouth Road, Oakhurst, NJ 07755 732-531-4100 s Fax 732-531-4130 s www.pdgcpa.com
PADUANO, DITOMMASO
& GOLDA, LLC
Certified Public Accountants and Consultants
K-2 Page 1 of 2
REPORT ON COMPLIANCE WITH REQUIREMENTS THAT COULD HAVE A DIRECT AND MATERIAL EFFECT ON EACH MAJOR PROGRAM
AND ON INTERNAL CONTROL OVER COMPLIANCE IN ACCORDANCE WITH OMB CIRCULAR A-133 AND NEW JERSEY OMB CIRCULAR 04-04
The Honorable President and Members of the Board of Education Township of Ocean School District County of Monmouth Oakhurst, New Jersey 07755 Compliance We have audited the compliance of the Board of Education of the Township of Ocean School District, in the County of Monmouth, State of New Jersey, with the types of compliance requirements described in the U.S. Office of Management and Budget (OMB) Circular A-133 Compliance Supplement and the New Jersey State Aid/Grant Compliance Supplement that could have a direct and material effect on each of the Board of Education of the Township of Ocean School District’s major federal and state programs for the fiscal year ended June 30, 2012. The Township of Ocean Board of Education’s major federal and state programs are identified in the summary of auditor’s results section of the accompanying schedule of findings and questioned costs. Compliance with the requirements of laws, regulations, contracts, and grants applicable to each of its major federal and state programs is the responsibility of the Township of Ocean Board of Education’s management. Our responsibility is to express an opinion on the Township of Ocean Board of Education’s compliance based on our audit. We conducted our audit of compliance in accordance with auditing standards generally accepted in the United States of America; the standards applicable to financial audits contained in Government Auditing Standards , issued by the Comptroller General of the United States; the audit requirements as prescribed by the Office of School Finance, Department of Education, State of New Jersey; OMB Circular A-133, Audits of States, Local Governments, and Non-Profit Organizations; and New Jersey OMB’s Circular Letter 04-04, Single Audit Policy for Recipients of Federal Grants, State Grants and State Aid. Those standards, OMB Circular A-133 and New Jersey OMB’s Circular 04-04, require that we plan and perform the audit to obtain reasonable assurance about whether noncompliance with the types of compliance requirements referred to above that could have a direct and material effect on a major federal or state program occurred. An audit includes examining, on a test basis, evidence about the Township of Ocean Board of Education’s compliance with those requirements and performing such other procedures as we considered necessary in the circumstances. We believe that our audit provides a reasonable basis for our opinion. Our audit does not provide a legal determination of the Township of Ocean Board of Education’s compliance with those requirements.
99

Township of Ocean School District K-2 October 26, 2012 Page 2 of 2 Page 2 In our opinion, the Board of Education of the Township of Ocean School District, in the County of Monmouth, State of New Jersey, complied, in all material respects, with the compliance requirements referred to above that could have a direct and material effect on each of its major federal and state programs for the fiscal year ended June 30, 2012. Internal Control Over Compliance The management of the Board of Education of the Township of Ocean School District is responsible for establishing and maintaining effective internal control over compliance with the requirements of laws, regulations, contracts, and grants applicable to federal and state programs. In planning and performing our audit, we considered the Township of Ocean Board of Education’s internal control over compliance with the requirements that could have a direct and material effect on a major federal or state program to determine the auditing procedures for the purpose of expressing our opinion on compliance and to test and report on internal control over compliance in accordance with OMB Circular A-133 and New Jersey OMB Circular 04-04, but not for the purpose of expressing an opinion on the effectiveness of internal control over compliance. Accordingly, we do not express an opinion on the effectiveness of the Township of Ocean Board of Education’s internal control over compliance. A deficiency in internal control over compliance exists when the design or operation of a control over compliance does not allow management or employees, in the normal course of performing their assigned functions, to prevent, or detect and correct, noncompliance with a type of compliance requirement of a federal or state program on a timely basis. A material weakness in internal control over compliance is a deficiency, or combination of deficiencies, in internal control over compliance, such that there is a reasonable possibil ity that a material noncompliance with a type of compliance requirement of a federal or state program will not be prevented, or detected and corrected, on a timely basis. Our consideration of internal control over compliance was for the limited purpose described in the first paragraph of this section and was not designed to identify all deficiencies in internal control over compliance that might be deficiencies, significant deficiencies or material weaknesses. We did not identify any deficiencies in internal control over compliance that we consider to be material weaknesses, as defined above. This report is intended solely for the information and use of the audit committee, management, the Township of Ocean Board of Education, the New Jersey State Department of Education, and other state and federal awarding agencies and pass-through entities and is not intended to be and should not be used by anyone other than these specified parties.
Paduano, DiTommaso & Golda, LLC Certified Public Accountant October 26, 2012 Licensed Public School Accountant #CS00164
100

K-3Schedule A
TOWNSHIP OF OCEAN BOARD OF EDUCATIONSchedule of Expenditures of Federal Awards
For the Fiscal Year Ended June 30, 2012
Balance at June 30, 2011 Repayment
Federal Grant or Program or Deferred Carryover/ of Prior Balance at June 30, 2012
Federal Grantor/Pass-Through CFDA State Project Award Revenue Due to (Walkover) Cash Budgetary Years' Accounts Deferred Due to
Grantor/Program Title Number Number Amount From To (Accts. Rec.) Grantor Amount Received Expenditures Adjustments Balances Receivable Revenue Grantor
U.S. Department of Education
General Fund:
Education Jobs Fund 84.410A N/A 336,624$ 7/1/11 6/30/12 -$ -$ -$ 336,624$ (336,624)$ -$ -$ -$ -$ -$
Medical Assistance Program (SEMI) 93.778 N/A 35,044 7/1/11 6/30/12 - - - 35,044 (35,044) - - - - -
Medical Assistance Program (SEMI) 93.778 N/A 68,731 7/1/10 6/30/11 (9,225) - - 9,225 - - - - - -
Total General Fund (9,225) - - 380,893 (371,668) - - - - -
U.S. Department of Education
Passed-through State Department of Education:
Special Revenue Fund:
Title I, Part A, Improving Basic Skills 84.010A NCLB-12 481,318 9/1/11 8/31/12 - - - 315,172 (454,573) - - (139,401) - -
Title I, Part A, Improving Basic Skills 84.010A NCLB-11 460,444 9/1/10 8/31/11 (134,252) - - 139,892 (5,640) - - - - -
Title II, Part A, Teacher and Principal Training and Recruiting 84.281A NCLB-12 106,637 9/1/11 8/31/12 - - - 73,206 (115,113) - - (41,907) - -
Title II, Part A, Teacher and Principal Training and Recruiting 84.281A NCLB-11 122,304 9/1/10 8/31/11 (24,626) - - 30,310 (5,684) - - - - -
Title II, Part D, Enhancing Education Through Technology 84.281 NCLB-11 1,067 9/1/10 8/31/11 (63) - - 124 (61) - - - - -
Title IIIA, English Language Enhancement 84.294 NCLB-12 45,195 9/1/11 8/31/12 - - - 27,501 (43,334) - - (15,833) - -
Title IIIA, English Language Enhancement 84.294 NCLB-11 46,419 9/1/10 8/31/11 (13,568) - - 15,303 (1,735) - - - - -
Title IIIA, Immigrant 84.294 NCLB-12 21,470 9/1/11 8/31/12 - - - 14,276 (17,232) - - (2,956) - -
IDEA, Part B 84.027 FT-12 990,333 9/1/11 8/31/12 - - - 734,767 (1,004,066) - - (269,299) - -
IDEA, Part B 84.027 FT-11 995,461 9/1/10 8/31/11 (295,834) - - 282,282 (17,931) 31,483 - - - -
IDEA, Preschool 84.173 PS-12 42,219 9/1/11 8/31/12 - - - 33,581 (42,219) - - (8,638) - -
IDEA, Preschool 84.173 PS-11 42,429 9/1/10 8/31/11 (9,538) - - 8,271 - 1,267 - - - -
ARRA-Title 1 , Part A 84.389 ARRA-11 307,837 9/1/09 8/31/11 (64,108) - - 64,459 (351) - - - - -
ARRA-IDEA, Part B 84.391 ARRA-11 1,085,944 9/1/09 8/31/11 (353,313) - - 353,313 - - - - - -
ARRA-IDEA,Part B, Preschool 84.392 ARRA-11 39,246 9/1/09 8/31/11 (8,211) - - 8,211 - - - - - -
Total Special Revenue Fund (903,513) - - 2,100,668 (1,707,939) 32,750 - (478,034) - -
U.S. Department of Agriculture
Passed-through State Department of Education:
Enterprise Fund:
Food Distribution Program 10.550 N/A 64,490 7/1/11 6/30/12 - - - 64,490 (56,662) - - - 7,828 -
Food Distribution Program 10.550 N/A 50,684 7/1/10 6/30/11 3,672 - - - (3,672) - - - - -
School Breakfast program 10.553 N/A 10,775 7/1/11 6/30/12 - - - 10,001 (10,775) - - (774) - -
National School Lunch Program 10.555 N/A 345,125 7/1/11 6/30/12 - - - 328,951 (345,125) - - (16,174) - -
National School Lunch Program 10.555 N/A 320,706 7/1/10 6/30/11 (53,709) - - 53,709 - - - - - -
Special Milk program 10.556 N/A 669 7/1/11 6/30/12 - - - 597 (669) - - (72) - -
Total Enterprise Fund (50,037) - - 457,748 (416,903) - - (17,020) 7,828 -
Total Federal Awards (962,775) - - 2,939,309 (2,496,510) 32,750 - (495,054) 7,828 -
The accompanying notes to schedules of expenditures of federal awards and state financial assistance are an integral part of this schedule.
101
Grant Period

K-4
Schedule B
TOWNSHIP OF OCEAN BOARD OF EDUCATION
Schedule of Expenditures of State Financial AssistanceFor the Fiscal Year Ended June 30, 2012
Balance at June 30, 2011 Memo
Program or Deferred Carryover/ Repayment of Balance at June 30, 2012 Cumulative
Grant or State Award Revenue Due to (Walkover) Cash Budgetary Prior Years' Accounts Deferred Due to Budgetary Total
State Grantor/Program Title Project Number Amount From To (Accts. Rec.) Grantor Amount Received Expenditures Balances Receivable Revenue Grantor Receivable Expenditures
State Department of Education
General Fund:
Categorical Special Education Aid 12-495-034-5120-089 2,195,245$ 7/1/11 6/30/12 -$ -$ -$ 1,975,721$ (2,195,245)$ -$ -$ -$ -$ 219,524$ 2,195,245$
Categorical Security Aid 12-495-034-5120-084 408,331 7/1/11 6/30/12 - - - 367,498 (408,331) - - - - 40,833 408,331
Adjustment Aid 12-495-034-5120-085 3,968,638 7/1/11 6/30/12 - - - 3,587,629 (3,968,638) - - - - 381,009 3,968,638
Categorical Transportation Aid 12-495-034-5120-014 1,321,803 7/1/11 6/30/12 - - - 1,189,623 (1,321,803) - - - - 132,180 1,321,803
Extraordinary Special Education Costs Aid 12-495-034-5120-473 299,089 7/1/11 6/30/12 - - - - (299,089) - - - - 299,089 299,089
Nonpublic Transportation Cost Aid 12-100-034-5120-068 37,305 7/1/11 6/30/12 - - - - (37,305) - - - - 37,305 37,305
Reimbursed TPAF Social Security Contributions 12-495-034-5095-002 2,169,792 7/1/11 6/30/12 - - - 2,064,706 (2,169,792) - (105,086) - - - 2,169,792
Reimbursed TPAF Social Security Contributions 11-495-034-5095-002 2,216,989 7/1/10 6/30/11 (106,909) - - 106,909 - - - - - - -
On behalf TPAF pension contributions 12-495-034-5095-006 2,975,741 7/1/11 6/30/12 - - - 2,975,741 (2,975,741) - - - - - 2,975,741
Total General Fund (106,909) - - 12,267,827 (13,375,944) - (105,086) - - 1,109,940 13,375,944
Special Revenue Fund:
NJ Nonpublic Aid:
Textbook Aid 12-100-034-5120-064 36,171 7/1/11 6/30/12 - - - 36,171 (34,207) - - - 1,964 - 34,207
Textbook Aid 11-100-034-5120-064 40,640 7/1/10 6/30/11 - 2,336 - - - 2,336 - - - - -
Nursing 12-100-034-5120-070 51,667 7/1/11 6/30/12 - - - 51,667 (51,382) - - - 285 - 51,382
Nursing 11-100-034-5120-070 45,461 7/1/10 6/30/11 - 1,097 - - - 1,097 - - - - -
Auxiliary Services:
Compensatory Education 12-100-034-5120-067 213,022 7/1/11 6/30/12 - - - 213,022 (213,022) - - - - - 213,022
Compensatory Education 11-100-034-5120-067 228,658 7/1/10 6/30/11 - - - - - - - - - - -
English as a Second Language 11-100-034-5120-067 7,684 7/1/10 6/30/11 - 7,684 - - - 7,684 - - - - -
Home Instruction 12-100-034-5120-067 430 7/1/11 6/30/12 - - - - (430) - (430) - - - 430
Handicapped Services:
Examination and Classification 12-100-034-5120-066 133,339 7/1/11 6/30/12 - - - 133,339 (118,803) - - - 14,536 - 118,803
Examination and Classification 11-100-034-5120-066 152,336 7/1/10 6/30/11 - 12,786 - - - 12,786 - - - - -
Corrective Speech 12-100-034-5120-066 44,232 7/1/11 6/30/12 - - - 44,232 (42,652) - - - 1,580 - 42,652
Corrective Speech 11-100-034-5120-066 54,919 7/1/10 6/30/11 - - - - - - - - - - -
Supplemental Instruction 12-100-034-5120-066 83,410 7/1/11 6/30/12 - - - 83,410 (83,410) - - - - - 83,410
11-100-034-5120-066 97,971 7/1/10 6/30/11 - 5,559 - - - 5,559 - - - - -
Total Special Revenue Fund - 29,462 - 561,841 (543,906) 29,462 (430) - 18,365 - 543,906
Debt Service Fund
Debt Service Aid- Type II 10-495-034-5120-017 186,706 7/1/11 6/30/12 - - - 186,706 (186,706) - - - - - 186,706
State Department of Agriculture
Enterprise Fund:
National School Lunch Program (State share) 12-100-010-3350-023 11,670 7/1/11 6/30/12 - - - 11,141 (11,670) - (529) - - - 11,670
National School Lunch Program (State share) 11-100-010-3350-023 10,877 7/1/10 6/30/11 (1,890) - - 1,890 - - - - - - -
Total Enterprise Fund (1,890) - - 13,031 (11,670) - (529) - - - 11,670
Total State Financial Assistance (108,799)$ 29,462$ -$ 13,029,405$ (14,118,226)$ 29,462$ (106,045)$ -$ 18,365$ 1,109,940$ 14,118,226$
The accompanying notes to schedules of expenditures of federal awards and state financial assistance are an integral part of this schedule.
102
Grant Period

103
K-5 TOWNSHIP OF OCEAN BOARD OF EDUCATION Notes to Schedules of Expenditures of Awards and Financial Assistance June 30, 2012 NOTE 1. GENERAL The accompanying schedules of expenditures of federal awards and state financial assistance include federal and state award activity of the Township of Ocean Board of Education. The Board of Education is defined in Note 1 to the Board’s basic financial statements. All federal and state awards received directly from federal and state agencies, as well as federal awards and state financial assistance passed through other government agencies is included on the schedule of expenditures of federal awards and state financial assistance. NOTE 2. BASIS OF ACCOUNTING The accompanying schedules of expenditures of awards and financial assistance are presented on the budgetary basis of accounting with the exception of programs recorded in the food service fund, which are presented using the accrual basis of accounting. These basis of accounting are described in Note 1 to the Board's basic financial statements. The information in this schedule is presented in accordance with the requirements of OMB Circular A-133, Audits of States, Local Governments and Non-Profit Organizations . Therefore, some amounts presented in this schedule may differ from amounts presented in, or used in the preparation of, the basic financial statements. NOTE 3. RELATIONSHIP TO BASIC FINANCIAL STATEMENTS The basic financial statements present the general fund and special revenue fund on a GAAP basis. Budgetary comparison statements or schedules (RSI) are presented for the general fund and special revenue fund to demonstrate finance-related legal compliance in which certain revenue is permitted by law or grant agreement to be recognized in the audit year, whereas for GAAP reporting, revenue is not recognized until the subsequent year or when expenditures have been made. The general fund is presented in the accompanying schedules on the modified accrual basis with the exception of the revenue recognitio n of the one or more deferred June state aid payments in the current budget year, which is mandated pursuant to N.J.S.A. 18A:22-44.2. For GAAP purposes, payments are not recognized until the subsequent budget year due to the state deferral and recording of the one or more June state aid payments in the subsequent year. The special revenue fund is presented in the accompanying schedules on the grant accounting budgetary basis which recognizes encumbrances as expenditures and also recognize s the related revenues, whereas the GAAP basis does not. The special revenue fund also recognizes the one or more state aid June payments in the current budget year, consistent with N.J.S.A. 18A:22-44.2. The net adjustment to reconcile from the budgetary basis to the GAAP basis is ($113,234) for the general fund and $321,034 for the special revenue fund. See C-3 (Notes to the Required Supplementary Information) for a reconciliation of the budgetary basis to the modified accrual basis of accounting for the general and special revenue funds. Awards and financial assistance revenues are reported in the Board’s basic financial statements on a GAAP basis as presented below:
Federal State Total
General Fund 371,668$ 13,262,710$ 13,634,378$ Special Revenue Fund 2,028,972 543,906 2,572,878
Debt Service Fund - 186,706 186,706
Food Service Fund 410,284 11,670 421,954
Total Awards and Financial Assistance 2,810,924$ 14,004,992$ 16,815,916$

104
K-5 TOWNSHIP OF OCEAN BOARD OF EDUCATION Notes to Schedules of Expenditu res of Awards and Financial Assistance June 30, 2012 NOTE 4. RELATIONSHIP TO FEDERAL AND STATE FINANCIAL REPORTS Amounts reported in the accompanying schedules agree with the amounts reported in the related federal and state financial reports. NOTE 5. OTHER Revenues and expenditures reported under the food distribution program represent current year value received and current year distributions, respectively. The amount reported as TPAF pension contributions represent the amount paid by the State on behalf of the District for the year ended June 30, 2012. TPAF social security contributions represent the amount reimbursed by the state for the employer's share of social security contributions for TPAF members for the year ended June 30, 2012. The post retirement pension and medical benefits received on-behalf of the District for the year ended June 30, 2012 amounted to $2,975,741 . NOTE 6. ADJUSTMENTS The adjustment column on Schedule s A and B arises from favorable differences incurred in the liquidat ion of encumbrances which were charged as budgetary basis expenditures in the prior fiscal year.

105
K-6 Page 1 of 4
TOWNSHIP OF OCEAN BOARD OF EDUCATION SCHEDULE OF FINDINGS AND QUESTIONED COSTS
FOR THE FISCAL YEAR ENDED JUNE 30, 2012
Part I – Summary of Auditor’s Results
Financial Statements Type of auditor’s report issued: unqualified Internal control over financial reporting: 1. Material weakness(es) identified? yes no
2. Significant deficiencies identified that are not considered to be material weaknesses? yes none reported Noncompliance material to basic financial statements noted? yes no Federal Awards Internal Control over major programs:
1. Material weakness(es) identified? yes no
2. Significant deficiencies identified that are not considered to be material weaknesses? yes none reported
Type of auditor’s report issued on compliance for major programs: unqualified Any audit findings disclosed that are required to be reported in accordance with section .510(a) of Circular A-133? yes no Identifi cation of Major Programs: CFDA Number(s) Name of Federal Program or Cluster 84.010A NCLB Title l, Part A 84.027 IDEA, Part B 84.410A Education Jobs Fund 10.555 National School Lunch Program Dollar threshold used to distinguish between type A and type B programs: $ 300,000 Auditee qualified as low-risk auditee? yes no

106
K-6 Page 2 of 4
TOWNSHIP OF OCEAN BOARD OF EDUCATION SCHEDULE OF FINDINGS AND QUESTIONED COSTS
FOR THE FISCAL YEAR ENDED JUNE 30, 2012 (continued)
Part I – Summary of Auditor’s Results (cont’d) State Awards Dollar threshold used to distinguish between type A and type B programs: $ 300,000 Auditee qualifies as low-risk auditee? yes no Internal Control over major programs: 1. Material weakness(es) identified? yes no
2. Significant deficiencies identified that are not considered to be material weaknesses yes none reported
Type of auditor’s report issued on compliance for major programs: unqualified Any audit findings disclosed that are required to be reported in accordance with NJ OMB Circular 04-04? yes no Identification of Major Programs: GMIS Number(s) Name of State Program 12-495-034-5120-089 Categorical Special Education Aid 12-495-034-5120-014 Transportation Aid 12-495-034-5120-085 Adjustment Aid 12-495-034-5095-002 Reimbursed TPAF Social Security Contributions 12-495-034-5120-084 Categorical Security Aid

107
K-6 Page 3 of 4
TOWNSHIP OF OCEAN BOARD OF EDUCATION SCHEDULE OF FINDINGS AND QUESTIONED COSTS
FOR THE FISCAL YEAR ENDED JUNE 30, 2012 (continued)
Part II – Schedule of Financial Statement Findings This section identifies the significant deficiencies, material weaknesses, and instances of noncompliance related to the basic financial statements that are required to be reported in accordance with Chapter 5.18 of Government Auditing Standards . No matters were reported.
108
K-6 Page 4 of 4
TOWNSHIP OF OCEAN BOARD OF EDUCATION SCHEDULE OF FINDINGS AND QUESTIONED COSTS
FOR THE FISCAL YEAR ENDED JUNE 30, 2012 (continued)
Part III – Schedule of Federal Awards and State Financial Assistance Findings and Questioned Costs
This section identifies the reportable conditions, material weaknesses, and instance of noncompliance including questioned costs, related to the audit of major federa l and state programs, as required by OMB Circular A-133 and NJ OMB Circular 04-04. No matters were reported.

109
K-7
TOWNSHIP OF OCEAN BOARD OF EDUCATION SUMMARY SCHEDULE OF PRIOR AUDIT FINDINGS
As Prepared by Management For the Fiscal Year Ended June 30, 2012
This section identifies the status of prior-year audit findings related to the basic financial statements and federal and state awards that are required to be reported in accordance with Chapter 6.12 of Government Auditing Standands , U.S. OMB Circular A-133 (section .315(a)(b)) and New Jersey OMB’s Circular 04-04. STATUS OF PRIOR-YEAR FINDINGS There were no prior-year audit findings for the fiscal year ended June 30, 2011 that we are required to report on. We have also reviewed any findings in the audit report issued by the Office of Fiscal Accountability and Compliance (OFAC). Correction has been taken on all findings in the report dated August 16, 2011