towards multi-modal sclera and iris biometric recognition
TRANSCRIPT

Towards Multi-modal Sclera and Iris Biometric Recognitionwith Adaptive Liveness Detection
Author
Das, Abhijit
Published
2017-05
Thesis Type
Thesis (PhD Doctorate)
School
School of Info & Comm Tech
DOI
https://doi.org/10.25904/1912/2705
Copyright Statement
The author owns the copyright in this thesis, unless stated otherwise.
Downloaded from
http://hdl.handle.net/10072/370828
Griffith Research Online
https://research-repository.griffith.edu.au

Towards Multi-modal Sclera and Iris Biometric
Recognition with Adaptive Liveness Detection
Mr. Abhijit Das
Master of Technology (Information Technology)
School of Information and Communication Technology
Griffith Sciences
Griffith University
Submitted in fulfilment of the requirements of the degree of
Doctor of Philosophy
May 2017
Towards Multi-modal Sclera and Iris Biometric Recognition with Adaptive Liveness Detection
2 | P a g e
Abstract
Security breaches due to misidentification of an individual pose one of the greatest threats
and challenges for today’s world. The use of biometrics can be quite promising in
minimising this threat. Biometrics refers to the automatic authentication of individuals based
on their physiological and behavioural characteristics. To date, various biometric systems
have been proposed in the literature, among them biometric traits such as the face, iris,
fingerprints, retina, gait, and vocal patterns are found to be distinctive to each and every
person and are considered to be most reliable biometric identifiers.
Regardless of the available biometrics traits, to date, no biometric system has been found
to be a perfect, and which can be applied universally in a way that is robust/adaptive to
change in different environmental conditions. Multimodal biometric systems were proposed
in the late 1990’s to extend the range of biometric applicability. In a multimodal biometric
system, two or more biometric identifiers are fused by an information fusion technique,
thereby providing robustness for changing in a greater range of environmental conditions
and enhancing other properties that an ideal biometric system should possess. Another
important property that a biometric system should possess is a capability to distinguish
between real and fake data. Although both the robustness of the system and capability to
distinguish between a real and fake data should be incorporated into a single system, there
is a trade-off. Therefore, due to the aforementioned research problems, this thesis addresses
advancements in multimodal ocular biometrics using iris and sclera and also investigates
the trade-off between robustness/adaptability and anti-spoofing/liveness detection (which is
one method to distinguish between real and fake data).
Biometrics traits that allow personal identification, eye traits offer a good choice of
biometrics, as the eye offers a wide range of unique characteristics. The two common eye
biometric identifiers that can be found in the literature are the iris and retina. Two more
biometrics that are becoming popular nowadays are the sclera and the peri-ocular. The iris
biometric is believed to be the most reliable eye biometric and that is why various
commercial products based on this biometric are available; but the iris biometric used in an
unconstrained scenario is still an open research area. The performance of iris biometrics
with changes in the gaze angle of the eye can be affected highly. Therefore, due to this
restriction, high user cooperation is required by persons with squinty eyes to get successfully
identified in an iris biometric system. Identifying individuals with darker irises is another
big challenge in iris recognition in the visible spectrum. To mitigate this problem, multi-
modal eye biometrics was proposed by combining iris and sclera traits in the visible
spectrum.
However, in order to establish the concept of multimodal eye biometrics using the iris
and sclera, it is first necessary to assess if sufficient discriminatory information can be
Towards Multi-modal Sclera and Iris Biometric Recognition with Adaptive Liveness Detection
3 | P a g e
gained from the sclera, further assessment in regards to its combination with the iris pattern
and adaptiveness of the traits with respect to changes in environmental conditions,
population, the data acquisition technique and time span. Multimodal biometrics using
sclera and iris have not been extensively studied and little is known regarding their
usefulness. So, the state-of-the-art related to it is not sufficiently mature and still in its
infancy. This thesis concentrates on designing an image processing and pattern recognition
module for evaluating the potential of the scleral biometric with regards to biometric
accuracy. Thus, research is also carried out investigate usefulness of the sclera trait in
combination with the iris pattern. Various, pre-processing techniques, segmentation, feature
extraction, information fusion and classification techniques are employed to push the border
of this multimodal biometrics.
The latter half of the thesis concentrates on bridging the anti-spoofing technique liveliness
with adaptiveness of biometrics. Traditional biometric systems are not equipped to
distinguish between fake and real data that has been scanned in front of the sensors. As a
result, they adhere to forgery attacks by intruders who can take the privilege of a genuine
user. With the rising demand of involuntary or unmanned biometric systems in border
security, flight checking, and other restricted zones, the incorporation of the automatic
detection of forgery attacks is becoming very obvious. Adaptability of the system with
respect to the change in the trait is another important aspect that this biometric system should
be enriched with. As mentioned previously both the forgery detection method (termed as
liveness detection in the literature of biometrics) and adaptability of the trait is necessary
for a trusted involuntary biometric system, but initial studies in the literature exhibit it as a
trade-off. Therefore to fulfil the gap, this thesis aimed to propose a new framework for
software-based liveness detection, which is also associated to the adaptability of the trait.
To fulfil the above-highlighted aim in the proposed framework, intra-class level (i.e. user
level) liveness detection is introduced employing image quality-based features.
Furthermore, to incorporate the adaptability of the trait, online learning-based classifiers are
used. Initial investigation and experimental results solicit the use of the proposed framework
for trusted involuntary biometric systems. Two new multi-angle eye datasets were
developed and published as a part of the current research. The thesis also consists of
contributions to other fields of pattern recognition such as wrist vein biometrics, multiscript
signature verification and script identification.

Towards Multi-modal Sclera and Iris Biometric Recognition with Adaptive Liveness Detection
4 | P a g e
Statement of Originality
I hereby confirm that this work has not previously been submitted for fulfilment of a degree
or diploma in any university/institute. To the best of my knowledge and belief, the thesis
contains no material previously published or written by another person except where due
reference is made in the thesis itself.
Abhijit Das
May 12, 2017

Towards Multi-modal Sclera and Iris Biometric Recognition with Adaptive Liveness Detection
5 | P a g e
Acknowledgements
At the outset, I would like to express my gratitude to the almighty who has given me the
chance, inspiration, and the mental, physical and economic strength to undertake my Ph. D.
studies.
I am sincerely grateful to my principal supervisor Prof. (Dr.) Michael Blumenstein for his
guidance and support during my Ph. D. candidature. His encouragement and all his
contributions have made my experience during the tenure of Ph. D. a very productive. I wish
to express my sincere gratitude to my external supervisor Prof. (Dr.) Umapada Pal, Indian
Statistical Institute and Prof. (Dr.) Miguel Angel Ferrer, University de Las Palmas de Gran
Canarias for his constant guidance, motivation, and support during my Ph. D. tenure. I
would like to thank my associate supervisor, Asst. Prof. (Dr.) Alan Liew, Griffith
University, for his support and insightful advice on during my Ph. D. candidature.
I will extend my special thanks to Asso. Prof. Jun Jo, Griffith University, for his support. I
would like to thank Prof. Arun Ross, Michigan State University and Prof. Javier Ortega-
Garcia, University Autonoma Madrid for their fruitful collaboration in a few of the works
in this thesis.
I would like to thank the School of ICT, Griffith University, and all other staff members for
their help and support. I am thankful to my colleagues, Dr. Srikanta Pal, Dr. Nabin Sharma,
Adel Fazel, Rituraj Kunwar, Chandranath Adak, and Rupam Deb for their help, support,
and inspiration.
My regards and respect to my parents, and all my family members for their constant
inspiration, love, support and patience, without which it would not have been possible to
complete my Ph. D. journey.

Towards Multi-modal Sclera and Iris Biometric Recognition with Adaptive Liveness Detection
6 | P a g e
Contents
List of Figures 13
List of Tables 19
Abbreviations 23
List of Publications during Candidature 25
Chapter 1: Introduction 29
1.1. Overview 32
1.2 Motivation 33
1.3. Problem Description and Scope of Research 34
1.4. Contributions 36
1.5. Organization of the thesis 36
Chapter 2: Literature Survey 39
2.1. Iris literature 39
2.1.1 Seminal Work and Main stages of iris recognition 40
2.1.1.1. Iris Segmentation 40
2.1.1.2. Image Registration or Iris Normalization 41
2.1.1.3 Feature Extraction 42
2.1.1.4. Classification 42
2.1.2. Some Pioneer Iris Recognition Methods 43
2.1.2.1. Daugman’s Method 43
2.1.2.2. Wilde’s Method 43
2.1.2.3. Ma et al. Method 44
2.1.3. Non-Cooperative Iris Recognition 44
2.1.4. Iris Databases 45
2.1.4.1. BATH Database= 46

Towards Multi-modal Sclera and Iris Biometric Recognition with Adaptive Liveness Detection
7 | P a g e
2.1.4.2. CASIA Database 46
2.1.4.3. ICE Database 47
2.1.4.4. MMU Database 47
2.1.4.5. UPOL Database 47
2.1.4.6. WVU Database 47
2.1.4.7. UBIRIS 48
2.1.4.8. Notre Dame Database 48
2.1.4.9. IIT Delhi Database
2.1.4.10. MBGC
2.1.4.11. Mobile Iris Challenge Evaluation
48
48
48
2.1.5. Recent Works on Iris After 2010 48
2.2. Sclera Literature 52
2.2.1 Sclera Anatomy 53
2.2.2. Challenges and Research Problems in Sclera Biometrics
55
2.2.2.1 Image Acquisition
55
2.2.2.2. Segmentation 57
2.2.2.3 Enhancement 59
2.2.2.3. Feature Extraction 60
2.2.2.4. Classification 61
2.2.2.5. Fusion with Other Traits
62
2.2.2.6. Performance Measures
63
2.2.2.7. Anti-Spoofing
64
2.2.3. Critical Review of the Sclera Literature
65
2.2.3.1 Image Acquisition
65
2.2.3.2. Segmentation 66
2.2.3.3 Enhancement 68

Towards Multi-modal Sclera and Iris Biometric Recognition with Adaptive Liveness Detection
8 | P a g e
2.2.3.4. Feature Extraction 69
2.2.3.5. Classification 70
2.2.3.6. Multimodal Approaches in the Sclera Literature 71
2.2.3.6. Performance Measures 72
2.2.4. Available Datasets and Overall Performance 72
2.3. Liveness Detection Literature
76
2.4. Adaptive Biometrics Literature
79
2.5. Summary
80
Chapter 3: Advancement in Multimodal Iris and Sclera Biometrics
83
3.1. Sclera Segmentation
83
3.1.1. Active Contour Based Region Growing Segmentation
84
3.1.2. K-means based segmentation
86
3.1.3. C-means based segmentation
87
3.2. Iris Segmentation
89
3.3. Sclera vessel structure enhancement
89
3.4.1. Adaptive Histogram Equalization and Haar Wavelet 89
3.3.2. Fuzzy logic-based Brightness Preserving Dynamic Fuzzy
Histogram Equalization and Discrete Meyer wavelet Based
Enhancement
90
3.4. Iris Pattern enhancement 91
3.5. Feature Extraction Method 91
3.5.1. Orientated Local Binary Pattern Based Feature Extraction 91
3.5.2. SIFT Based Feature Extraction 93
3.5.3. Patch-Based Descriptor for Feature Extraction 94
3.5.3.1. Dense-SIFT 94
3.5.3.2. Dense-LBP 95

Towards Multi-modal Sclera and Iris Biometric Recognition with Adaptive Liveness Detection
9 | P a g e
3.5.3.3. Dense LDP 96
3.6. Classification 97
3.6.1. Template-based matching Based Classification 97
3.6.1. SVM Based Classification 97
3.6.3. Projective Pairwise Discriminative Dictionary
98
3.7. Data Set 103
3.7.1. UBIRIS 103
3.7.2. MASD 105
3.8. Results
111
3.8.1. Sclera Enhancement 111
3.8.2. Iris Enhancement 111
3.8.3.Feature Extraction Experiment 111
3.8.3.1.Sclera feature extraction experiment 111
3.8.3.2. Iris feature extraction experiment 115
3.8.3.3. Iris & Sclera fusion feature selection experiment 115
3.9.Overall Experiment Results 118
3.10. Comparison with the state of art 119
3.11. Results on Competition Conducted on MASD 120
3.12. Summary
123
Chapter 4: Proposed Methodologies for Liveness Detection 126
4.1. Liveliness Detection by Multi-angle Sequence of the Eye 126
4.2. Image Quality-Based Liveness Framework 131
4.2.1. Proposed Liveness Framework 132
4.2.1.1. Transform Domain or Focus Related Quality Feature 133
4.2.1.2. Aspect Related Feature
136
4.2.1.3. Contrast Related Feature
138

Towards Multi-modal Sclera and Iris Biometric Recognition with Adaptive Liveness Detection
10 | P a g e
4.2.2. Experimentation Result
139
4.2.2.1. Dataset
139
4.2.2.2. Classifier Used and Feature Selection and Optimization
Technique
140
4.2.2.3. Experimental Result Details
141
4.2.2.4 Comparison with the State-of-the-art Methods
144
4.3. Summary
146
Chapter 5: Proposed Methodologies for Adaptive Biometrics 149
5.1. Proposed Framework for Adaptive Biometrics 150
5.2. Ensemble of Classifiers 152
5.3. Incremental/Adaptive Support Vector Machines (SVMs)
156
5.4. Incremental/Adaptive Neural Network
160
5.5. Experimental details and results
162
5.5.1. Experiment on the UBIRIS Version 1
162
5.5.2 Experiments on Proposed Dataset
164
5.6 Summary
165
Chapter 6: Contribution to Other Field of Pattern Recognition
167
6.1. Multi-Script Signature Verification
167
6.1.1. Background
168
6.1.2. Databases
170
6.1.3. Merging of Databases
172
6.1.4. Feature and Performance Analysis
174
6.1.5 Experimental Setup, Results and Discussion
176

Towards Multi-modal Sclera and Iris Biometric Recognition with Adaptive Liveness Detection
11 | P a g e
6.1.5.1. Single-script Scenario
176
6.1.5.2. Multi-Script Scenario
179
6.1.6. Results and Discussion
179
6.1.7. Thai and Roman Bi-script Signature Verification
183
6.1.7.1 Proposed Thai Dataset
184
6.1.7.2. Experimental Details and Discussions
186
6.1.8 Summary of Multi-script Signature Verification
190
6.2 Wrist Biometrics
191
6.2.1. Proposed Wrist Vein Biometrics System
193
6.2.2.Experimental Results
194
6.2.2.1. Dataset
194
6.2.2.2. Results
196
6.2.2.3. Comparison with the State-of-the-art
197
6.2.3. Summary of Wrist Biometrics
199
6.3. Script Identification
199
6.3.1. Database
200
6.3.2. Pre-processing
201
6.3.2.1. Block Segmentation
201
6.3.2.2 Text lines segmentation
202
6.3.2.3. Words Segmentation
203
6.3.3. Script Identification Features
204
6.3.4. Experimental Results
206
6.3.5. Summary of Script Identification
208

Towards Multi-modal Sclera and Iris Biometric Recognition with Adaptive Liveness Detection
12 | P a g e
Chapter 7: Conclusion and Future Scope
210
7.1. Contributions
210
7.2. Future Scopes
212
7.3. Criticism of the proposed work 213
References 216

Towards Multi-modal Sclera and Iris Biometric Recognition with Adaptive Liveness Detection
13 | P a g e
List of Figures
Figure 1.1: (a) Block diagram of atypical biometric system (b)
Various biometric techniques available
30
Figure. 1.2. Colour image of an eye consisting of pupil, iris and sclera
area.
32
Figure 2.1. A block diagram of a typical iris biometric. 40
Figure 2.2 Illustrates of the translation process of iris-based both in
polar (θ) and radial (r) variables.
41
Figure 2.3. A block diagram of a typical sclera biometric. 52
Figure 2.4: Different parts of the human eye 53
Figure 2.5: An eye image acquired in the visible spectrum with lighting
in the visible spectrum
55
Figure 2.5: Eye image of an individual acquired in different lighting
conditions taken from MASD (a) indoor controlled, (b) indoor
uncontrolled, (c) outdoor controlled, (d) outdoor lighting uncontrolled.
56
Figure 2.6: Eye image of an individual looking at different angles taken
from MASD (a) looking right, (b) looking straight, (c) looking left, (d)
looking up and (e) looking downwards.
56
Figure 2.7: Examples of eye image (from MASD dataset) of an (a)
child, (b) diabetic person, (c) with motion blur and (d) closed eye.
57
Figure 2.8: Eye image captured in (a) NIR taken from CASIA version
1 [78], (b) the plot of the transmission vs reflection for different spectra
[85], (c) eye images in the hyperspectral band, (d) in the visible
spectrum, (e) green band of visible spectrum and (f) red band of the
visible spectrum. (d-f) are taken from Crihalmeanu and Ross [8].
58
Figure 2.9: (a) Images of the sclera after stressful work. (b) Eye image
of an old person with less prominent sclera visibility.
60
Figure 2.10. An example of sclera pattern of the same individual left
eye looking in different directions/ gaze.
61
Figure 2.11: Example of (a) an eye image (b) fake generated by
scanning the eye image from a digital screen and (c) ) fake generated
by scanning the eye image from a printed image.
65

Towards Multi-modal Sclera and Iris Biometric Recognition with Adaptive Liveness Detection
14 | P a g e
Figure 2.12: An eye image showing a sclera with dark brown ring and
brown patches on the sclera region.
69
Figure 3.1. A block diagram of the proposed system. 84
Figure.3.2. (a) The image of the original RGB image, (b) The red
channel component of (a), (c) The Green channel component of 1(a),
and (d) blue channel component of (a),
85
Figure. 3.3. (a) Is the histogram equalized image and (b) the Haar
filtered image of 3.2(b).
85
Figure.3.4. Seed point for sclera segmentation 86
Figure. 3.5. Region growing segmentation method of left and right
sclera. (a) The Histogram equalized and filtered image of red
component of (a),,(b) Initial size of the seed for right sclera,(c)
Segmented image of (a),(d) Segmented mask developed for right
sclera, (e)The Histogram equalized and filtered image of red
component of (a),(f) Initial size of the seed for left sclera,(g)
Segmented image of (e), (h) Segmented mask developed for left
sclera
86
Figure. 3.6. (a) Iris image; (b) k-means clusters. 86
Figure 3.7 : (a)original image, (b) grey image of (a).(c) shows the
Fuzzy C means-based sclera segmentation of (a) index 1.Figure 1(d)
shows the Fuzzy C means-based sclera segmentation of (a) index 2
and (e) shows the Fuzzy C means-based sclera segmentation of (a)
index 3.
88
Figure 3.8: Segmented iris image 89
Figure 3.9: Adaptive histogram equalization of sclera image 89
Figure 3.10: The vessel enhanced image. 90
Figure 3.11 (a) The original RGB image, (b) The red channel
component of (a), (c) The green channel component of (a), and (d)
blue channel component of (a),
90
Figure 3.12: (a) Adaptive histogram equalization of the sclera image.
(b) the vessel enhanced image.(c) fuzzy logic based Brightness
90

Towards Multi-modal Sclera and Iris Biometric Recognition with Adaptive Liveness Detection
15 | P a g e
Preserving Dynamic Fuzzy Histogram Equalization on the green
channel of the sclera image
Figure 3.13: Red channel of the iris image 91
Figure 3.14: Adaptive histogram equalization iris image. 91
Figure. 3.15. OLBP of the vein images 92
Figure 3.16: (a & b) The image is divided into a 22x22 location of a
9x9 patch size for the dense SIFT descriptor. (c and d) SIFT
descriptor with a number of 4 bins and 8 orientations.
94
Figure 3.17: (a) Patch division of the image of D-LBP, (b) Histogram
of LBP.
96
Figure 3.18: Filters used for LDP. 96
Figure 3.19: Patch division of the image to calculate D-LDP 97
Figure 3.20: Different quality of eye images used.in the experiment
(a) is the type of best quality image of Session 1, (b) ) is the type of
medium quality of Session 1 (c) is the type of Poor quality of Session
1, (d) is the type of below average quality image of Session 2, (e) is
the type of average quality of Session 2 (f) is the type of best quality
in of Session 2
104
Figure 3.21: Example of closed and blurred eyes. (a), (b) and (c) are
of session 1 and (d),(e) and (f) are of session 2.
105
Figure 3.22: A framework of the image capturing technique. 106
Figure 3.23: Image capture at distance. 106
Figure 3.24: Two halves of the face image. 106
Figure 3.25: Hough Circle detected the eyeball 107
Figure 3.26: An automatically cropped image. 107
Figure 3.27: Images at different angle 107
Figure 3.28: Few samples of images from the proposed dataset 108
Figure 3.29: Different quality of eye images used in the experiments 108
Figure 3.30: Examples of closed and blurred eyes. 109
Figure 3.31: Different quality of ground truth and the original images. 110
Towards Multi-modal Sclera and Iris Biometric Recognition with Adaptive Liveness Detection
16 | P a g e
Figure 3.32. (a) Mask applied without dilatation, mask applied with
dilatation using a structural element of 50×50 (b) and 100×100 pixels
(c).
112
Figure 3.33.CMC curve for recognition & EER curve for recognition 113
Figure 3.34. ROC curves of the overall experiments of UBIRIS
version 1 and MASD with PPDD
119
Figure 3.35: Four scenarios where algorithms failed to successfully
obtain a fair mask.
120
Figure 4.1: The diagrammatical representation of the proposed
liveliness detecting system design.
127
Figure 4.2.Image label fusion of different angles. 128
Figure 4.3: Examples of images taken by displaying eye images from
mobile.
131
Figure 4.4: (a) Inter-class level or dataset level liveness framework,
(b) intra-class / class level liveness framework(c) A pictorial
representation of the above mention framework for liveness
detection.
134
Figure 4.5: (a) Power spectrum of the real image, (b) Power spectrum
of the fake image, (c) real image and (d) fake image.
135
Figure 4.6: (a) Laplacian of the real image of 4.5(c), (b) Laplacian of
the fake image of 4.5(d).
135
Figure 4.7: (a) High-frequency filter response of the real image of
4.5(c), (b) High-frequency filter response of the fake image of 4.5(d).
136
Figure 4.8: Sclera length estimation technique adopted by calculating
the two corners from the segmented mask.
137
Figure 4.9: Different real images of different quality in the dataset. 139
Figure 4.10: (a) Fake image capture from screen where the original
image was captured by NIKON camera, (b) fake image capture from
screen where the original image was captured by Micromax mobile
camera, (c) fake image capture from printed image where the original
image was captured by NIKON camera, and (d) fake image capture
140

Towards Multi-modal Sclera and Iris Biometric Recognition with Adaptive Liveness Detection
17 | P a g e
from printed eye where the original image was captured by Micromax
camera.
Figure 4.11. Feature distributions of the best discriminative quality
features for the genuine and fake samples of each class (a) Global
contrast QF14, (b) Red channel contrast QF17, and (c) Green channel
contrast QF18
143
Figure 4.12: Feature distributions of (a) Blue channel contrast QF18,
(b) QF4 (is the ratio of the pupil and the iris radius).
144
Figure 5.1: Proposed Adaptive biometric framework using cascade
based classifier selection.
151
Figure. 5.2: Block diagram representing the batch learning (MLE) of
Augmented Naive Bayes network.
154
Figure 5.3: Left: Bayes net for Naive Bayes. Right: Bayes net for
Augmented Naive Bayes.
155
Figure 5.4: Flowchart of SOINN, shows the basic overflow of the
proposed algorithm. This figure has been taken from [180].
162
Figure 5.5. Example of images from proposed dataset for AB with
large sample
164
Figure 6.1: Sample signature images from different databases: (a-c)
SVC 2004, (d-f) GPDS and MCYT, (g-i) Hindi signature, (j-l)
Bengali signature, (m-o) Arab script dataset. (p-r) NFI, (s-u) SUSIG
VISUAL, (v-x) SVC2004 western.
173
Figure 6.2. Similar EER distribution procedure for user selection
when merging databases
174
Figure 6.3: DET curves of the multi-script and single script signature
environments for random forgeries.
182
Figure 6.4: DET curves of the multi-script and single script signature
environment for skilled forgeries.
182

Towards Multi-modal Sclera and Iris Biometric Recognition with Adaptive Liveness Detection
18 | P a g e
Figure 6.5: A Thai signature image labelled with the local and global
features.
185
Figure 6.6. Thai People Signatures structure and their zones 185
Figure 6.7. DET the multi-script and single script signature
performed employing Thai and Roman signature
192
Figure 6.8: (a) A wrist vein image. (b) A system design of the
proposed system
193
Figure 6.9: Image after adaptive histogram equalisation 193
Figure 6.10: The final vein enhanced image. 194
Figure 6.11:(a)- (f) Different quality of palm vein images used in the
experiments, (g) A framework of the image capturing
technique[9].(h)-(m)Images of low-resolution palm print from the
mention dataset.
195
Figure 6.12. Block segmented documents 201
Figure 6.13: Line detection procedure 203
Figure 6.14. Examples of segmented lines in Latin, Thai, Arab,
Malayalam and Japanese respectively.
203
Figure 6.15. Word Segmentation example. 204
Figure 6.16. Example of LBP feature vector
206

Towards Multi-modal Sclera and Iris Biometric Recognition with Adaptive Liveness Detection
19 | P a g e
List of Tables
Table 2.1: Different sensor level technique proposed in
literature to acquire sclera
66
Table 2.2: Different segmentation technique used in literature 67
Table 2.3: Different sclera vein enhancement technique used in literature.
68
Table 2.4: Different featuring techniques used in the literature.
69
Table 2.5: Different classification technique used in sclera
literature.
70
Table 2.6: Different multimodal biometric used in sclera literature
71
Table 2.7. Various in-house datasets proposed in the sclera biometric literature and their performance achieved
73
Table 2.8. UBIRIS version 1 publicly available datasets proposed in the sclera biometric literature and performance on them by various proposed work in the literature
74
Table 3.1. EERs (%) obtained using SIFT over sclera and iris patterns
112
Table 3.2. EERs (%) performance for different segmentation masks
113
Table 3.3: Equal Error Rate and the Cumulative Matching
of the verification
114
Table 3.4: Result of sclera feature extraction with
different descriptors
114
Table 3.5: Result of iris feature extraction with different
descriptors
115

Towards Multi-modal Sclera and Iris Biometric Recognition with Adaptive Liveness Detection
20 | P a g e
Table 3.6. EERs (%) obtained using SIFT and a
combination at image level of sclera and iris patterns.
116
Table 3.7: Result of image level fusion with different
descriptors
116
Table 3.8. EERs (%) obtained using SIFT and a
combination at score level of sclera and iris patterns.
117
Table 3.9: Result of the score level fusion using different
descriptor
117
Table 3.10: Result of feature level fusion with different
descriptors
118
Table 3.11: A state of the art compares of the other pieces
of work on UBIRIS version 1
121
Table 3.12: Algorithms and results of SSBC 2015 and
SSRBC 2016.
122
Table 4.1: EER of the different angle
127
Table 4.2: The results with forgeries obtained if the user
is looking at a different angle for that of which the system
have asked for
128
Table 4.3. EER of the different level of fusion
128
Table 4.4. The results with forgeries obtained if the user is
looking at a different sequence of angles from that which
the system has asked for by image level fusion
129
Table 4.5. The results with forgeries obtained if the user is
looking at a different sequence of angles from that which
the system has asked for, by feature level fusion
130
Table 4.6. Equal Error Rate of the different level of fusion
by testing the mobile images
131

Towards Multi-modal Sclera and Iris Biometric Recognition with Adaptive Liveness Detection
21 | P a g e
Table 4.7: Liveness detection performance of the various
individual and combinations of image quality-based
features.
142
Table 4.8: The detailed performance-based comparison of
results between the proposed framework and the
framework presented in Galbally et al., [102] using the
proposed set of quality features.
145
Table 5.1. Results show that adaptive/online Naïve Bayes
classifier is more accurate. Adaptive classifiers are initially
trained with a few samples in batch/offline mode and later
learn in an online/adaptive manner i.e. using one sample at
a time. For example row 2:- classifier was initially trained
with 5 samples per class, subsequently it was adaptively
trained with 2 samples per class and later tested with 3
samples per class.
164
Table 5.2: Result of the different classifiers used in the
framework and their individual performances in EER %.
165
Table 6.1: Main information of the considered datasets
with genuine and the fake sample statistics
172
Table 6.2: FAR and FRR statistics for each dataset used in
multi-script experiments.
177
Table 6.3: FAR and FRR statistics for each dataset used in
single script experiments
178
Table 6.4. Single-script results for random and skilled
forgeries in terms of EER in (%)
180

Towards Multi-modal Sclera and Iris Biometric Recognition with Adaptive Liveness Detection
22 | P a g e
Table 6.5. Multi-script results for random and skilled
forgeries in terms of EER in (%)
181
Table 6.6. Bhattacharyya distance between the densities of
genuine and forgery scores for the single-script experiment
181
Table 6.7. Bhattacharyya distance between the densities of
genuine and forgery scores for the multi-script experiment
181
Table 6.8. Example of Thai Signature 185
Table 6.9. FAR and FRR statistics of the experiments
187
Table 6.10. EER in % for the proposed experimental setup
187
Table 6.11. Bhattacharyya Distance for the proposed
experimental setup
188
Table 6.12: EER in % of the single and multi-session
experiments
197
Table 6.13. A state of the art comparison with the proposed
work.
198
Table 6.14. A state of the art comparison of different
methods employed in various stages, with the proposed
work.
199
Table 6.15. Details about the proposed database 202
Table 6.16. Benchmark: Hit ratio in % at Block, Line and
Word level for different texture features
207

Towards Multi-modal Sclera and Iris Biometric Recognition with Adaptive Liveness Detection
23 | P a g e
Abbreviations
DCT Discrete Cosine Transforms
KNN K-Nearest Neighbours
SIFT Scale-Invariant Feature Transform
DSIFT Dense Scale-Invariant Feature Transform
SPM Spatial Pyramid Matching
BoF Bag of Feature
SVM Support Vector Machine
FAR False Acceptance Rate
FRR False Rejection Rate
EER Equal Error Rate
ROC Receiver Operating Characteristic
CMC Cumulative Match Characteristic
LBP Local Binary Pattern
D-LBP Dense Local Binary Pattern
GLCM Grey Level Co-occurrence Matrix
DCT Discrete Cosine Transform
OLBP Orientated Local Binary Pattern
LDP Local Directional Pattern
ICE Iris Challenge Evaluation
BATH University of Bath
IR Infra-Red

Towards Multi-modal Sclera and Iris Biometric Recognition with Adaptive Liveness Detection
24 | P a g e
WVU West Virginia University
UPOL University of Palack eho
MMU Multimedia University
CASIA Institute of Automation from the Chinese Academy of
Sciences
MASD Multi-Angle Sclera Dataset
ICB International Conference on Biometrics
BTAS International Conference on Biometrics: Theory Application
and System
QF Quality Features
AB Adaptive Biometrics
SVM Support Vector Machine
NN Neural Network
DDD Diversity for Dealing with Drifts
ASV
Automatic Signature Verification
HMM Hidden Markov Model
SFS
Skilled Forged Signature
RFS Random Forged Signature
BD
Bhattacharyya Distance
OCR
Optical Character Recognition
LDerP
Local Derivative Patterns

Towards Multi-modal Sclera and Iris Biometric Recognition with Adaptive Liveness Detection
25 | P a g e
List of Publications during Candidature
Book chapters:
1. Abhijit Das, Rituraj Kunwer, Umapada Pal, Miguel Ferrer Ballaster and Michael
Blumenstein, Book chapter entitled "An online learning technique for adaptive biometric
system" pp. 73-96, in book of Adaptive Biometric Systems to be published by Springer.
Peer-reviewed journal publications:
2. Abhijit Das, Umapada Pal, Miguel Ferrer Ballester and Michael Blumenstein,“A
Framework for Liveness Detection for Direct Attack in Visible Spectrum for Multimodal
Ocular Biometrics”. Pattern Recognition Letter, ISSN: 0167-8655, 2015.
3. Abhijit Das, Miguel Ferrer Ballester, Umapada Pal, Srikanta Pal, Moisis Diaz and
Michael Blumenstein ,“Multi-script vs single-script scenarios in automatic off-line
signature verification”. IET biometrics.
3. Abhijit Das, Rituraj Kunwar, Umapada Pal , Miguel Ferrer Ballester and Michael
Blumenstein ,“A more efficient and adaptive biometrics system using online learning”. to
be Communicated to Pattern Recognition.
4. Abhijit Das, Umapada Pal, Miguel Ferrer Ballester and Michael Blumenstein, “Sclera
Information Fusion-Based Robust and Adaptive Iris Biometrics in Visible Spectrum”. to be
communicated Pattern Recognition Letter.
5. Abhijit Das, Umapada Pal, Miguel Ferrer Ballester and Michael Blumenstein “Sclera
biometrics: state-of-the-art and a way forward”.to be Communicated to ACM survey.
Peer-reviewed conference publication (oral presentations):
6. Abhijit Das, Umapada Pal, Miguel Ferrer Angel Ballester and, Michael Blumenstein, “A
New Method for Sclera Vessel Recognition using OLBP”, appeared in International
Conference Chinese Conference on Biometric Recognition, LNCS 8232, pp. 370–377,2013.
7. Abhijit Das, Umapada Pal, Miguel Ferrer Ballester and Michael Blumenstein,’ Sclera
Recognition Using D-SIFT’, Appeared In 13th International Conference on Intelligent
Systems Design and Applications pp.74-79, 2013.
8. Abhijit Das, Umapada Pal, Miguel Ferrer Ballester and Michael Blumenstein,’Fuzey
Logic based Sclera Recognition ’, pp. 561-568, In IEEE World Congress on Computational
Intelligence - IEEE International Conference on Fuzzy Systems 2014.

Towards Multi-modal Sclera and Iris Biometric Recognition with Adaptive Liveness Detection
26 | P a g e
9. Abhijit Das, Umapada Pal, Miguel Ferrer Ballester and Michael Blumenstein,’ Multi-
angle Based Lively Sclera Biometrics at a Distance’. pp. 22-29, IEEE Symposium Series on
Computational Intelligence, December 9-12, 2014, Orlando, USA.
10. Abhijit Das, Umapada Pal, Miguel Ferrer Ballaster and Michael Blumenstein, "A New
Efficient and Adaptive Sclera Recognition System", pp.1-6, IEEE Symposium Series on
Computational Intelligence, December 9-12, 2014, Orlando, USA.
11. Abhijit Das, Umapada Pal, Miguel Ferrer Ballaster and Michael Blumenstein, "A New
Wrist Vein Biometric System", pp. 68-75, IEEE Symposium Series on Computational
Intelligence, December 9-12, 2014, Orlando, USA.
Peer-reviewed conference publication (poster presentations):
12. Abhijit Das, Umapada Pal, Michael Blumenstein and Miguel Ferrer Ballester, “Sclera
Recognition - A Survey” Appeared in Recent Advancement in Computer Vision and Pattern
Recognition, pp. 917 -921, 2013.
13. Abhijit Das, Umapada Pal, Miguel Ferrer Ballester and Michael Blumenstein,“SSBC
2015: Sclera Segmentation Benchmarking Competition”. pp. 1-6, at International
Conference Biometrics Theory, Applications and Systems (BTAS), 2015.
14. Abhijit Das, Prabir Mondal, Umapada Pal, Michael Blumenstein and Miguel Angel
Ferrer Sclera Pattern Synthesis Based on Non-parametric Texture Synthesis Technique, at
Computer Vision and Image Processing (CVIP-2016).
15. Abhijit Das, Umapada Pal, Miguel Ferrer Ballester and Michael Blumenstein,“SSRBC
2015: Sclera Segmentation and Recognition Benchmarking Competition”. at International
Conference on Biometrics, 2016.
16. Abhijit Das, Prabir Mondal, Umapada Pal, Michael Blumenstein and Miguel Angel
Ferrer, “Fast and Efficient Multimodal Eye Biometrics using Projective Dictionary Pair
Learning”, at IEEE World Congress on Computational Intelligence- IEEE CEC 2016.

Towards Multi-modal Sclera and Iris Biometric Recognition with Adaptive Liveness Detection
27 | P a g e
Ethical Clearance
Granted Ethical Clearance GU Protocol Number: ICT/05/13/HREC

Towards Multi-modal Sclera and Iris Biometric Recognition with Adaptive Liveness Detection
28 | P a g e
Dedicated to my parents, and all family members...

Towards Multi-modal Sclera and Iris Biometric Recognition with Adaptive Liveness Detection
29 | P a g e
1 Introduction
Security failing due to misidentifying an individual is one of the greatest threats to today’s
world. Various techniques have been adopted to mitigate this threat, like utilising
passwords, electronic cards, etc. But the risk of forging cannot be satisfactorily minimised.
Biometrics is the technique that can be quite promising in this scenario. Biometrics refers
to the automatic authentication of individuals based on their physiological and behavioural
characteristics Jain et al. [130]. Biometrics has received significant attention by the
researchers in industry, government, and academia. Over the last few decades, intensive
research work has been performed in the field of biometrics to identify individuals as
accurately as possible based on biological or physiological traits or both Zhou et al. [5].
Nowadays the need for biometric systems is increasing in day-to-day activities (e.g.
attendance system for organisations, citizenship proof, door locks for high-security zones,
etc.). Due to its ease of use by common people and organisations, financial sectors,
government and reservation systems are also adopting biometric technologies for ensuring
security in their own domains and to maintain signed log activity for every individual.
The earliest biometric cataloguing can be found in 1891 when Juan Vucetich started a
collection of fingerprints of criminal identification in Argentina. The first automatic
biometric system was proposed in the 1980’s. An example of a typical biometric system and
a few examples of different biometric traits are given below in Figure 1.1

Towards Multi-modal Sclera and Iris Biometric Recognition with Adaptive Liveness Detection
30 | P a g e
(a)
(b)
Figure 1.1: (a) Block diagram of a typical biometric system (b) Various biometric techniques available.
Biometric systems can be classified into two categories: behavioural biometric and
physiological biometric. Some examples of this biometrics are given below.
1. Behavioural: The behavioural biometric system, biometric characteristics of an
individual are employed for biometric authentication.
Voice recognition- Voice recognition systems distinguish between various people’s
voices by frequency, pitch, and intensity of the voice. Voice biometrics is a growing
technology in computer security. It uses a measurable, physical characteristic, or personal
behavioural trait to verify and authenticate an individual. It uses what you are as a way
to identify yourself. Further, it compares two samples of data and verifies if they match.
Types on a keyboard/ keystroke biometric- A behavioural measurement aiming to
identify users based on typing pattern/ rhythms or attributes. Typing rhythms is an idea
whose origin lies in the observation (made in 1897) that telegraph operators have
distinctive patterns of keying messages over telegraph lines.
Mouse movement dynamics- The mouse biometric system uses continuous dynamic
authentication by the movement of the mouse. No additional hardware is a requirement
here. There are different approaches available to collect data for this biometrics.
Signature- Signature verification is not only a popular research area in the field of image
processing and pattern recognition, but also plays an important role in many applications

Towards Multi-modal Sclera and Iris Biometric Recognition with Adaptive Liveness Detection
31 | P a g e
such as security, access control, contractual matters etc. A signature verification system
can be divided into two classes: online and off-line based methods.
Gaits- It aims to discriminate individuals by the way they walk. It is unobtrusive as it
depends on how the silhouette shape of individual changes over time in an image
sequence.
Lip movement- Motion History Images (MHI) can be utilised for a biometric template
of a spoken word for each speaker.
2. Physiological: The physiological characteristics of an individual are employed for
biometric authentication for this type of biometric systems.
Fingerprint: The lines that flow in various patterns across fingerprints are called ridges
and the spaces between ridges are valleys. Fingerprint features (associated with some
matching algorithm): Ridge pattern - global pattern matching technique is adapted for
this biometric.
Hand geometry- The shape of the hand of a human being can be used for biometric
authentication by mathematical modelling of the hand shape.
Iris- It is a ring of tissue on the eyeball that contains a pattern which is used in biometric.
Retina- The retina is a thin layer of cells at the back of the eyeball of vertebrates. It is
the part of the eye which converts light into nerve signals. The retina contains
photoreceptor cells (rods and cones) which receive the light; the resulting neural signals
then undergo complex processing by other neurones of the retina and are transformed
into action potentials in retinal ganglion cells whose axons form the optic nerve which
creates a pattern that can be utilised for biometrics.
Sclera- The white region of the eye that contains blood vessels pattern that can be used
in biometrics.
Peri-ocular- The pattern around the eye is utilised here for biometrics
Face- Central role in human interactions which can contribute to biometrics as each and
every individual look alike by face.
Vein patterns – The vein pattern at different parts of the body contain different
ordination and pattern that is also used for biometrics.
Till date, many biometric systems have been proposed in the literature, such as a face in Das
et al. [42,] iris in Das et al. [39, 40], etc. Still, no such system can be applied universally and
can be robust to change in different environmental conditions or hold the properties of a
perfect biometric system Zhou et al. [5]. In order to increase population coverage, extend

Towards Multi-modal Sclera and Iris Biometric Recognition with Adaptive Liveness Detection
32 | P a g e
the range of environmental conditions, improve resilience to spoofing, and achieve higher
recognition accuracy, further research on biometric traits was performed. In order to negate
the above motion problem and to make the biometric system more universal multimodal
biometric was proposed. So further research on a combination of various biometric agents
is continuing on the popular biometrics with some biometrics (iris and sclera) or another
popular biometric (iris and face) was carried out.
1.1. Overview
Eye biometric is believed to be one of the most popular and reliable biometrics Zhou et al.
[5]. Among eye biometrics that can be found in the literature, the iris is the most popular
and reliable one. Unfortunately, some disadvantages in the iris recognition have been found
in the literature. For example robustness of iris biometrics with changes in gaze angle of the
eye (off-angle eye), iris biometric in the visible spectrum for darker irises, are found to be
tough. Moreover, the information of iris patterns reduces when images are captured in the
visible spectrum rather than Infra Red (IR) band. As a solution, multimodal eye biometric
using iris and sclera was proposed in the visible spectrum. The sclera is the white region in
the eye that consists of blood vessels pattern. A label image of sclera and iris are shown in
Figure 1.2.
Figure. 1.2. Colour image of an eye consisting of pupil, iris and sclera area.
Iris and sclera-based multi-modal eye biometric in the visible spectrum can be easily
spoofed by scanning a high-resolution image or high definition video. Therefore, to enrich
the security and reliability of the discussed multimodal ocular biometric it is necessary to
incorporate it with an antispoofing/ liveness detection technique, which can differentiate
between the fake and the real data. Moreover, a review of the extant literature reveals that
liveness detection and the robustness/ adaptability of the trait is a trade-off.
So in this thesis, an adaptive liveliness based multimodal eye biometric is proposed using
the iris and sclera. The organisation of this section is as follows: Subsection 1.2 explains the
aim of the proposed research: in subsection 1.3 problem description and the scope of the
research is explained, and contributions of the thesis are explained: in subsection 1.4, and
in subsection 1.5, the organisation of the report is summarised.
Towards Multi-modal Sclera and Iris Biometric Recognition with Adaptive Liveness Detection
33 | P a g e
1.2 Motivation Recent advancements in digital imaging technology have led to the development of
sophisticated digital cameras, camcorders, and smartphones with cameras. These electronic
’gadgets’ are not only low-priced and portable but also have tremendous scope to act as a
biometric sensor. Due to the revolution in digital sensor technology and claim for a more
secure world, biometric research and commercial products have received significant
attention. This leads to the claim for more secure and trusted universal biometrics. Initial
research found that no biometric trait can be universal in regards to its application. So,
multimodal biometric was proposed.
Among all biometrics traits for people identification, eye traits offer a good choice of
biometrics and also offer a wide range of traits. Moreover, the eye is a highly protected
organ of a human being that cannot get changed by external activities. The traits are also
stable and they are different even for identical twins Zhou et al. [5]. Major eye biometric
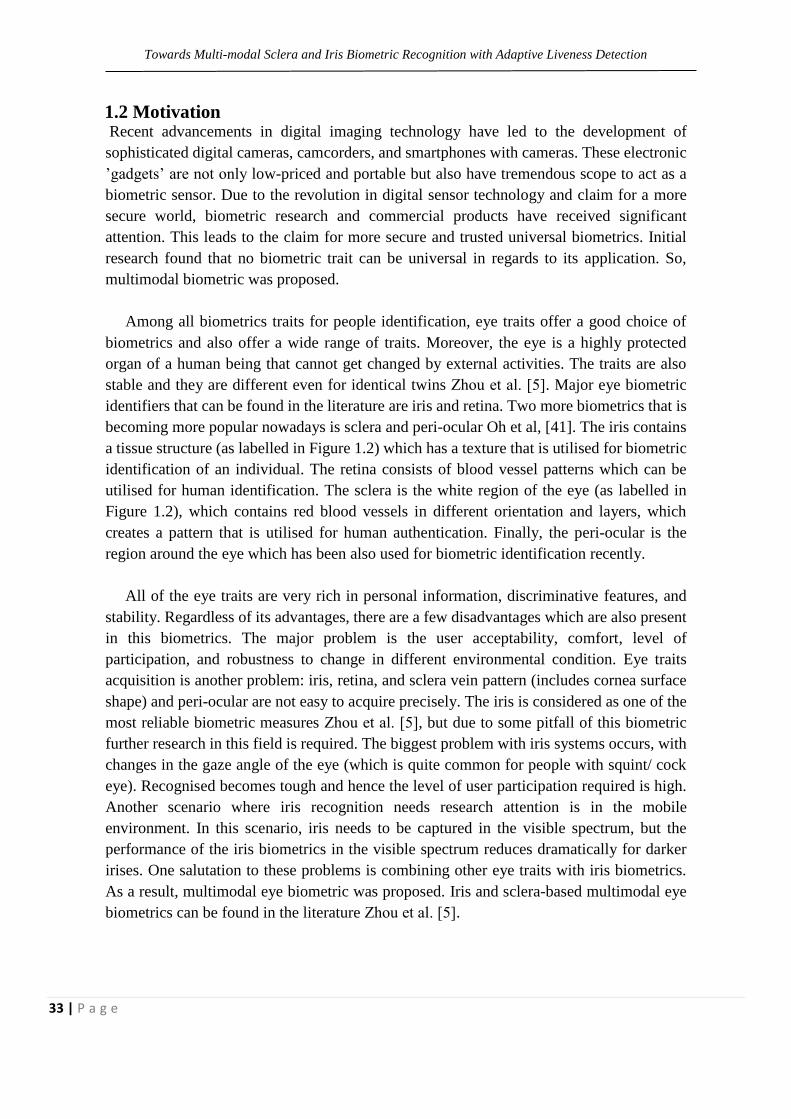
identifiers that can be found in the literature are iris and retina. Two more biometrics that is
becoming more popular nowadays is sclera and peri-ocular Oh et al, [41]. The iris contains
a tissue structure (as labelled in Figure 1.2) which has a texture that is utilised for biometric
identification of an individual. The retina consists of blood vessel patterns which can be
utilised for human identification. The sclera is the white region of the eye (as labelled in
Figure 1.2), which contains red blood vessels in different orientation and layers, which
creates a pattern that is utilised for human authentication. Finally, the peri-ocular is the
region around the eye which has been also used for biometric identification recently.
All of the eye traits are very rich in personal information, discriminative features, and
stability. Regardless of its advantages, there are a few disadvantages which are also present
in this biometrics. The major problem is the user acceptability, comfort, level of
participation, and robustness to change in different environmental condition. Eye traits
acquisition is another problem: iris, retina, and sclera vein pattern (includes cornea surface
shape) and peri-ocular are not easy to acquire precisely. The iris is considered as one of the
most reliable biometric measures Zhou et al. [5], but due to some pitfall of this biometric
further research in this field is required. The biggest problem with iris systems occurs, with
changes in the gaze angle of the eye (which is quite common for people with squint/ cock
eye). Recognised becomes tough and hence the level of user participation required is high.
Another scenario where iris recognition needs research attention is in the mobile
environment. In this scenario, iris needs to be captured in the visible spectrum, but the
performance of the iris biometrics in the visible spectrum reduces dramatically for darker
irises. One salutation to these problems is combining other eye traits with iris biometrics.
As a result, multimodal eye biometric was proposed. Iris and sclera-based multimodal eye
biometrics can be found in the literature Zhou et al. [5].

Towards Multi-modal Sclera and Iris Biometric Recognition with Adaptive Liveness Detection
34 | P a g e
However, in order to establish this concept, it is necessary to first assess if sufficient
discriminatory information can be gained from the sclera and the accompanying iris pattern
of the eye in a combination. It is also to an important investigation regarding it adaptively
with respect to change in environmental conditions, population coverage, data accruing
technique and time span. To date, this biometrics is relatively less studied and little is known
regarding its usefulness. So, the state-of-the-art related to them are not mature enough and
still in its infancy
The beginning of this research concentrates on designing an image processing and pattern
recognition module for evaluating the potential of the scleral biometric in regards to
accuracy and adaptability with changes in condition. Also, evaluation was carried out in
combination with iris pattern. It will be also interesting to explore the field of sclera
biometrics, as it is essential to consider different feature extraction and matching techniques
in order to determine an effective method to characterise this biometric. But it will be more
interesting to invade the paradigm of multimodal using ocular biometric in using sclera and
iris due to their above-mentioned properties. Iris and sclera based multimodal eye biometric
system in the visible spectrum can be easily spoofed by scanning a high-resolution image
or high definition video in front of the sensor of the system.
With the recent demand for trusted involuntary biometrics system in international border
checking, airport checking, etc., it are important to research on the aspect of liveness
detection. Present biometric systems used in these security places are not equipped to
distinguish between fake and real data. As a result, they are prone to forgery attacks by
intruders who can take the privilege of a genuine user and can jeopardise the security.
Adaptability of the system with respect to the change in the trait is another important aspect
that this biometric system should be enriched with. As mentioned previously both the
forgery detection method (termed as liveness detection in the literature of biometrics) and
adaptability of the trait is necessary for a trusted involuntary biometric system, but initial
studies exhibit it as a trade-off. Therefore to fulfil the gap, this part of the thesis is conceived
1.3. Problem Description and Scope of Research
In this thesis, the primary focus will be to identify individuals based on their physiological
trait namely iris and sclera. Considering both the trait are captured as an image, the steps for
biometric processing include the following steps:
Segment the iris and the sclera trait individually
Image enhancement of the trait after the image is segmented
Feature extraction of the trait individually

Towards Multi-modal Sclera and Iris Biometric Recognition with Adaptive Liveness Detection
35 | P a g e
Combining the feature at different level of information fusion
Classification of the trait after information fusion
The liveness detection of the input image is done by analysing
Its image contrast property
Image aspect property and frequency domain quality properties.
The adaptability of the input trait is done by using online learning based classifier
The objective of this research is to develop an adaptive liveness-based multimodal
recognition system using the iris and sclera, and which will result in the reliable involuntary
biometric system. Several shortcomings of the previously proposed approaches were
identified and taken into consideration during this study. The following are the major
shortcomings which were identified as needing to be addressed:
Iris and sclera based multimodal biometrics were not extensively studied. Therefore, it
is very important to investigate the biometric property of the sclera individually and in
combination with the iris.
The work proposed in the earlier work used multi-angle eye images from a few discrete
angle, therefore a new dataset in multi-angle with more multi-angle of sclera and iris is
proposed.
Segmentation of sclera from the eye image was not studied intensively with modern
segmentation techniques, this thesis fulfils the gap.
Sclera image enhancement from the eye image was not studied intensively with modern
enhancement techniques, this thesis covers the gap.
Template matching techniques were mainly used in the literature for classification of
the iris and sclera-based multimodal biometrics. The slow processing time of the
template matching technique makes it inappropriate for real-life application. The thesis
introduces the use of texture-based featuring techniques followed by probabilistic
classification.
The liveness detection was performed at the database level. The thesis introduces a
framework which performed liveness detection at the user level, which it is not a trade-
off with the adaptability of the system with respect to change in traits.
Adaptability of the traits is also not investigated in the literature. An online learner based
adaptive biometric system is proposed in the thesis to fulfil the gap.
Towards Multi-modal Sclera and Iris Biometric Recognition with Adaptive Liveness Detection
36 | P a g e
1.4. Contributions
The proposed techniques described and introduced in this thesis are based on a number of
research areas within biometrics. The following contributions are made in this thesis,
Various pre-processing techniques for the sclera and the iris trait are investigated to find
the best possible pre-processing approach.
Introduces the use of a probabilistic classification technique and texture=based features
to classify the iris and sclera-based multimodal ocular biometrics.
The proposed pre-processing, feature extraction and classification techniques were also
successfully applied to other biometric traits (wrist vein patterns and signatures) as well
as other pattern classification tasks (script identification)
Proposes a multi-angle eye dataset which is publicly available and used for three
biometrics competitions organised in conjunction with BTAS 2015, ICB 2016 and IJCB
2017.
A user level-based liveness detection framework is proposed which is not a trade-off
with the adaptability of the system with respect to change in the trait.
Introduces the use of an online learning-based classifier for adaptive biometrics.
The thesis also contributes to other field of pattern recognition (multi-script signature,
verification, wrist biometrics and script identification)
1.5. Organisation of the Thesis
The rest of this thesis is organised as follows.
Chapter 2, includes the recent developments and approaches in the related area of the
sclera, iris, and multimodal eye biometrics using sclera and iris. Followed by a review
of the recent literature of the liveness detection and adaptive biometrics.
Chapter 3, includes advancement carried out on the iris and sclera, and their
combination.
Chapter 4, includes proposed research methodology for liveness detection, followed by
results, and discussion.
Chapter 5, includes proposed research methodology for adaptiveness, followed by
results, and discussed.

Towards Multi-modal Sclera and Iris Biometric Recognition with Adaptive Liveness Detection
37 | P a g e
Chapter 6, includes the contribution to other fields of biometrics and pattern recognition.
Chapter 7, includes the conclusion and future scope of the thesis.

Towards Multi-modal Sclera and Iris Biometric Recognition with Adaptive Liveness Detection
38 | P a g e

Towards Multi-modal Sclera and Iris Biometric Recognition with Adaptive Liveness Detection
39 | P a g e
2 Literature Review
In this chapter first, the iris literature are summarised, followed by sclera biometrics
anatomy, its challenges and literature. Next, the chapter summarised the literature on
liveness detection and adaptability of biometrics. Section 2.1 reviews the iris biometric
followed by Section 2.2 which highlights the sclera anatomy, challenges in characterising
this biometrics and its literature till date. In Section 2.3 liveness detection literature is
summarised. In Section 2.4 literature on adaptive biometrics is discussed.
2.1. Iris Literature Iris literature is rich and vast, therefore only the major and the related works on the iris
literature is focused in this survey. The possibility of using iris patterns as a basis for
personal identification was first proposed by Herschel in 1858 followed by Bertillon [26] in
1885 by the French scientist. Science the 19th-century various automatic iris biometric
systems have been proposed. The various stages involved in the iris biometric system, the
initial stage deals with iris segmentation. This process consists of localising the iris inner
(pupillary) and outer (scleric) borders, assuming either circular or elliptical shapes for both
of the borders. In order to compensate for the variations in the pupil size and in the image
capturing distances, it is common to translate the segmented iris region into a fixed length
and dimensionless polar coordinate system for image registration. Regarding feature
extraction, iris recognition approaches can be divided into three major categories: phase-
based methods, zero-crossing methods and texture analysis based methods. Finally, the
comparison between iris signatures is made, producing a numeric dissimilarity value. If this
value is higher than a threshold, the system outputs a non-match meaning that each signature

Towards Multi-modal Sclera and Iris Biometric Recognition with Adaptive Liveness Detection
40 | P a g e
belongs to different irises. Otherwise, the system outputs match, meaning that both
signatures were extracted from the same iris. A block diagram of a typical iris biometric is
as given below in Figure 2.1.
Figure 2.1. A block diagram of a typical iris biometric.
The rest of the section is divided into the following sub-sections. The sub-section 2.1.1
explains major work on the main stages of iris recognition; 2.1.2 highlights the pioneer
works of iris literature, followed by sub-section 2.1.3 which focuses on the non-ideal iris
recognition literature. In the last subsection 2.1.4, the available iris datasets are summarised
2.1.1 Seminal Work and Main Stages of Iris Recognition
The overviews of the most relevant works on the main stages of iris recognition that can be
found in the literature are in the next sub-sections. The sub-subsections describe some usual
approaches to performing each of the above-identified stages.
2.1.1.1. Iris Segmentation
In 1993, Daugman [16] presented one method for iris segmentation based on the majority
of the functioning systems. Regarding the segmentation stage, Daugman introduced an
integrodifferential operator to find the inner and outer borders of the iris. This operator
remains efficient and was proposed in 2004 with minor differences developed by Nishino
and Nayar [23].
Camus and Wildes [24] and Martin-Roche et al [24] proposed integrodifferential operators
that finds the N3 space, with the objective of maximising the process which identifies the
iris borders. Wildes [50] proposed an iris segmentation method through a gradient-based
binary edge map construction coupled by a circular Hough transform. This method has been
proposed with minor variants by Cui et al. [16], Huang et al. [51], Kong and Zhang [52],
Ma et al.[54], [55] and [56]. Liam et al. [53] proposed another interesting method, this
method is based on thresholding and maximising a simple function to obtain two ring
parameters that correspond to the iris inner and outer borders.
Towards Multi-modal Sclera and Iris Biometric Recognition with Adaptive Liveness Detection
41 | P a g e
Du et al. [57] proposed an iris detection method-based on the prior pupil segmentation.
The iris outer border is detected as the largest horizontal edge resultant from Sobel Filtering,
further, the image is transformed into polar coordinates. However, this approach may fail in
scenarios of non-concentric iris and pupil and for very dark irises. In a following work, a
morphologic operators were applied by Mira and Mayer [58] to obtain iris borders. Authors
detected the pupillary and scleric borders by using thresholding, image opening and closing.
Kim et al. [59] proposed the use of the Expectation Maximisation algorithm to estimate the
respective distribution parameters, based on the assumption that the pixels’ intensity of the
captured image can be well represented by a mixture of three Gaussian distributions.
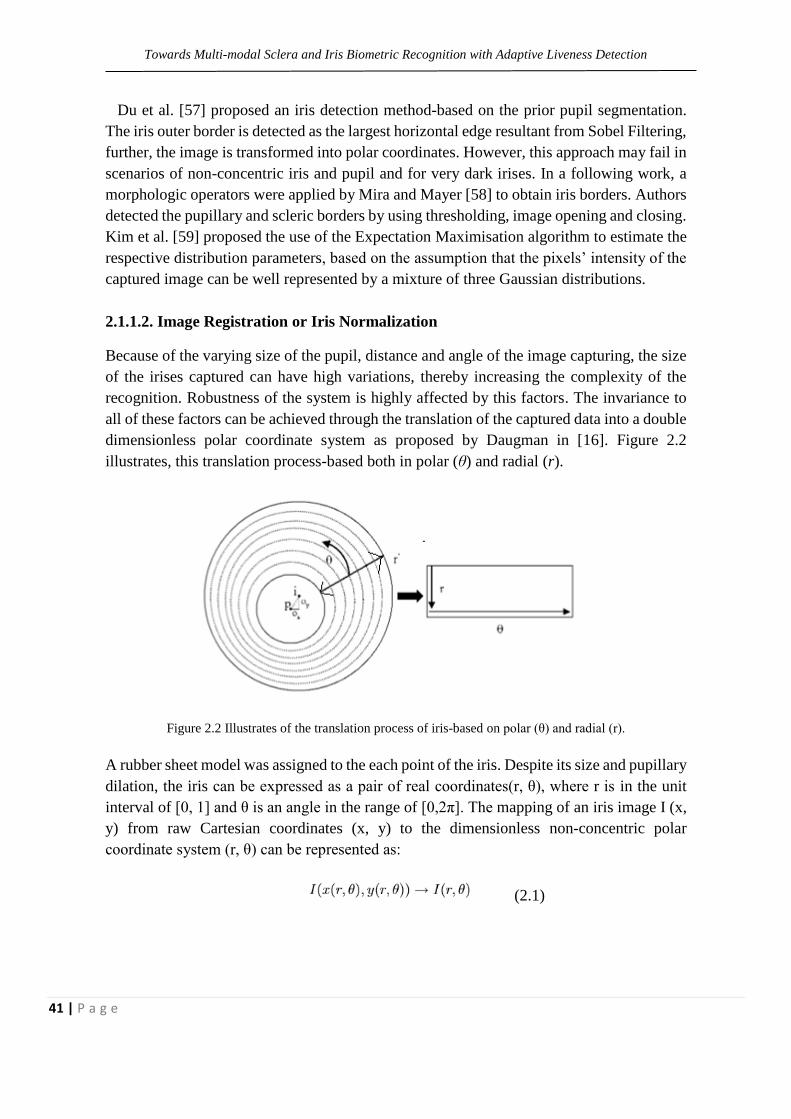
2.1.1.2. Image Registration or Iris Normalization
Because of the varying size of the pupil, distance and angle of the image capturing, the size
of the irises captured can have high variations, thereby increasing the complexity of the
recognition. Robustness of the system is highly affected by this factors. The invariance to
all of these factors can be achieved through the translation of the captured data into a double
dimensionless polar coordinate system as proposed by Daugman in [16]. Figure 2.2
illustrates, this translation process-based both in polar (θ) and radial (r).
Figure 2.2 Illustrates of the translation process of iris-based on polar (θ) and radial (r).
A rubber sheet model was assigned to the each point of the iris. Despite its size and pupillary
dilation, the iris can be expressed as a pair of real coordinates(r, θ), where r is in the unit
interval of [0, 1] and θ is an angle in the range of [0,2π]. The mapping of an iris image I (x,
y) from raw Cartesian coordinates (x, y) to the dimensionless non-concentric polar
coordinate system (r, θ) can be represented as:
(2.1)

Towards Multi-modal Sclera and Iris Biometric Recognition with Adaptive Liveness Detection
42 | P a g e
Where x(r, θ) and y(r, θ) are linear combinations of both the set of the pupillary boundary
points (xp(θ), yp (θ))and set of limbus boundary points in the outer perimeter of the iris(xs(θ),
ys(θ)) bordering the sclera, which were detected in the iris segmentation stage:
(2.2)
2.1.1.3 Feature Extraction
Feature extraction and recognition approaches can be grouped into three major categories:
1. Phase-based methods used in Daugman [16],
2. Zero-crossing methods as proposed in Boles and Boashash [60], and Roche et al.[61],
3. Texture analysis based methods used in Wildes [62], Kim et al. [59] and Ma et al. [54].
Daugman [18] employed multiscale quadrature wavelets to extract texture phase
information and obtain an iris signature of 2048 binary components. Similar to segmentation
this proposal acted as a seminal work for others, with minor modification proposed in Ma
et al. [65].
To feature the iris texture, Boles and Boashash [60] used the zero-crossing representation
of a 1-D wavelet at different resolutions in concentric circles.
Wildes [62] proposed the featuring of the iris texture through a Laplacian pyramid. Using
4 different levels or scales. Most common approaches were found in the wavelet
decomposition, using Haar, Mallat or other basic wavelets. This similar proposal can be
found in Ali and Hassanien [63], Ma et al. [55] and Lim et al. [64],
Another approach can be found in Huang et al. [68] that employed the independent
coefficient analysis to characterise the iris texture. Muron et al. [65] proposed the use of the
power of the Fourier spectrum for featuring iris. Du et al. [57] proposed iris featuring
technique through the computation of invariant local texture patterns. Nam et al. [66]
proposed directional properties of the image to create a binary signature, by the analysis of
the image second derivatives.
2.1.1.4. Classification
The use of distance metrics is proposed for iris feature classification in the literature:
1. Hamming distance in Daugman [18] and Tissue et al. [67],

Towards Multi-modal Sclera and Iris Biometric Recognition with Adaptive Liveness Detection
43 | P a g e
2. Euclidean in Huang et al. [68] and
3. Weighted Euclidean in Zhu et al. [69] and Ma et al. [54].
Methods-based on signal correlation for iris feature classification was proposed in Wildes
[62]. The specific proposal was proposed by Lim et al. [64], by the utilisation of a
competitive learning neural network. In another work Ma et al. [55], modified nearest
neighbour to compare the acquired and enrolled samples to assign recognition.
2.1.2. Some Pioneer Iris Recognition Methods
The following sub-subsections describe with the detail of some pioneering work of iris
recognition methods. Apart from the Daugman’s method, that acts as seminal works for
other proposals, were the methods proposed by Wildes [62] and Li et al. [70].
2.1.2.1. Daugman’s Method
The Daugman’s recognition method proposed in [18] is as following:
Iris segmentation: Author proposed an integrodifferential operator that finds the
maximal difference between the average intensity of circumferences with consecutive
radius values of the iris.
Normalisation: To normalise for the dissimilarity in the size of the pupil, maps iris
images to a dimensionless polar coordinate system through a process known as the
Daugman Rubber Sheet [18].
Feature Extraction: The iris featuring was performed through the use of 2D Gabor
filters.
Feature Comparison: Binarization process of the 2D Gabor filter is performed and the
Hamming distance was used as similarity measure.
2.1.2.2. Wildes’ Method
In [62], Wildes proposed a machine vision system for non-invasive iris biometric. The
proposed system is divided following parts:
Image Acquisition: The small dimension of the iris is considered as the major challenge
by the author for the image acquisition. The author also discussed the role sufficient
resolution, sharpness, good contrast, level of illumination as the detail challenges. The
captured images must in the centred of the image and noises like specular reflections
and optical aberrations should be minimised. Based on these, the author describes a
framework for the iris acquiring from a distance of 20 cm. using an 80 mm. lens.

Towards Multi-modal Sclera and Iris Biometric Recognition with Adaptive Liveness Detection
44 | P a g e
Iris Localization: The author performs localization in two steps.
1. The image is converted into a binary edge map.
2. The edge points vote for instantiating particular contour parameter values. The edge
map was reconstructed through a gradient-based edge detection, which consists of
thresholding the magnitude of the image intensity gradient convolved with a two-
dimensional Gaussian Kernel.
Pattern Matching: The author decomposes this task in four parts: alignment,
representation, comparison and decision.
2.1.2.3. Ma et al.’s Method
Ma et al. [64] proposed an iris recognition-based on the key local variations. It is composed
of following stages:
Iris Localization: The authors estimated both the pupillary and scleric borders as
circles. The procedure initiates by roughly finding the iris region followed by the exact
finding of the parameters correspondent to iris borders, similar to the procedure
proposed in Wildes’ [62].
Iris Normalization: In order to minimize the effect of the variations in pupil size and
image capturing distance, authors used the normalisation process described by Daugman
[18].
Image Enhancement: due to non-uniform brightness and low contrast of the iris
images, the authors performed image enhancement-based on the subtraction of the
estimated background illumination using small blocks of 32×32. Such pre-processing
normalised the effect of non-uniform illumination.
Feature Extraction: Authors proposed a set of 1-D intensity signals for iris featuring.
Matching: The feature vector is converted into binary form, then the similarity is
computed through the XOR function.
2.1.3. Non-Cooperative Iris Recognition
In the latter half of the iris, literature concentrates on non-cooperative iris recognition, which
occurs due to automatic recognise of individuals, using their iris images captured at a
distance and without any active participation.

Towards Multi-modal Sclera and Iris Biometric Recognition with Adaptive Liveness Detection
45 | P a g e
This type of motivations has increased the researcher's interests and was the subject of
several studies proposed by Du et al. [57]. In [71] the authors investigated the performance
of partial iris for recognition. They analysed 3 different types of partial iris images: “left-to-
right” that is left middle part of the iris,”outside-to-inside” and” inside-to-outside”. The
authors found a distinguishable and unique signal while analysing the inner parts of the iris
and hence concluded that it is possible to employ a portion of the iris for biometrics.
Dorairaj et al. [72] proposed an iris recognition system that can handle off-angle images.
The author’s estimates of the gaze direction by the Hamming distance between the
Independent Component Analysis of a frontal view image. Nest, they applied a projective
transformation that maps the captured iris image to frontal view. Besides images of the
CASIA database, the authors also used dataset captured in their institute to confirm the
proposal. In Sung et al. [73] identified the potential problems that must be overcome in non-
ideal iris recognition. The authors considered the problem of lighting conditions as hard to
overcome unless a special lighting method is introduced. A slightly uncommon
segmentation method by the initial inner eye corner detection followed by a least square
elliptical fit to the limbic edge pixels was proposed form off-angle iris. The authors proposed
a method-based on wavelet packet maximum by Shannon entropy for iris information
reconstruction measuring due to off-angle. The feature extraction used a classical
convolution with a bank of complex-valued 2D Gabor filters. A feature comparison by
means of correlation and classification through the nearest neighbour was used for
classification. Fancourt et al. [74] claim the use of human iris recognition up to 10 meters
distance. An imaging framework composed by a telescope and an infra-red camera was
proposed. A local correlation matcher was used by authors, which reported minor
performance degradation with distance, off-angle images and eyewear. As in [75], fair
results were obtained when the captured images do not contain significant portions of noise,
specifically due to lighting. The works claim the possibility to capture images with enough
quality in less cooperative modes and achieve accurate human recognition in these
situations. Based on observations made in [227] following types of noise be found: the iris
obstruction by eyelids (NEO) or eyelashes (NLO), specular (NSR) or lighting reflections
(NLR), poor focused images (NPF), partial (NPI) or out of iris images (NOI), off-angle iris
(NOA), motion blurred irises (NMB) and pupil (NPS) or sclera (NSS) portions wrongly
considered as belonging to the iris. This type of noise can affect the iris recognition system
and few methods to handle such scenario are prosed in [227]. In this next subsection, the
main characteristics of the public and freely available iris image databases for biometrics
purposes are described.
2.1.4. Iris Databases
The biometrics research and development need analysis on real data, although, a fair
comparison between recognition methods depends on input data. Therefore, to test the

Towards Multi-modal Sclera and Iris Biometric Recognition with Adaptive Liveness Detection
46 | P a g e
recognition methods standard biometric databases are of high relevance and become
mandatory for the development process. Public and freely available iris image databases for
biometrics purposes are highly anticipated and are described next.
2.1.4.1. BATH Database
The University of Bath (BATH) iris image database contains iris images taken from 800
eyes of 400 subjects [77]. The database comprises images taken from students and staff of
the University of Bath. The images are of very high quality, taken with a professional
machine vision camera, mounted on a height-adjustable camera-stand. The illumination was
provided through a number of infrared LEDs, positioned below the camera and set at an
angle such that reflections were aimed to the pupil. Next, an infrared pass filter was
employed in order to negate the effect of the daylight and other environmental light
reflections on the irises region. Images from the BATH database contain almost all noise
factors of iris obstructions (due to eyelids and eyelashes).Along with ideal images, some
non-ideal iris images are also including in the dataset incorporating variation in the dataset.
2.1.4.2. CASIA Database
Iris recognition has been an active research topic of the Institute of Automation from the
Chinese Academy of Sciences. This database is clearly the most known and widely used by
the majority of the researchers.
CASIA version 1: CASIA iris image database [78] (version 1.0, the only one that had access
to) includes 756 iris images from 108 eyes, hence 108 classes. For each eye, 7 images are
captured in two sessions, where three samples are collected in the first and four in the second
session. In this dataset, images were captured within a highly constrained capturing
environment. They have homogeneous characteristics and their noise factors are exclusively
related with iris obstructions by eyelids and eyelashes.
CASIA version 2: In CASIA Version 2.0 (CASIA-IrisV2) includes two subsets captured
with two different devices: Iris pass-h developed by OKI and self-developed device of
CASIA, CASIA-IrisCamV2). Each subset includes 1200 images from 60 classes.
CASIA version 3: CASIA-IrisV3 includes three subsets which are labelled as CASIA-Iris-
Interval, CASIA-Iris-Lamp, CASIA-Iris-Twins. CASIA-IrisV3 contains a total of 22,034
iris images from more than 700 subjects. All iris images are 8-bit grey-level JPEG files,
collected under near infrared illumination. Almost all subjects are Chinese except a few in
CASIA-Iris-Interval. Because the three data sets were collected at different times, only
CASIA-Iris-Interval and CASIA-Iris-Lamp have a small overlap in subjects.
CASIA version 4: CASIA-IrisV4 contains a total of 54,601 iris images from more than
1,800 genuine subjects and 1,000 virtual subjects. All iris images are 8-bit grey level JPEG
files, collected under near infrared illumination or synthesised. The six datasets were
collected or synthesised at different times and CASIA-Iris-Interval, CASIA-Iris-Lamp,

Towards Multi-modal Sclera and Iris Biometric Recognition with Adaptive Liveness Detection
47 | P a g e
CASIA-Iris-Distance; CASIA-Iris-Thousand may have a small inter-subset overlap in
subjects.
2.1.4.3. ICE Database
The Iris Challenge Evaluation (ICE) is a competition designed to measure the accuracy of
the underlying technology that makes iris recognition possible. Its goals are to promote the
development and advancement of iris recognition and assess the technology’s current level
of performance. It is divided into two stages: first, it was asked to researchers and
developers to participate in iris recognition challenge problems that might improve their
recognition algorithms. Later, an opportunity to participate in a large-scale and independent
evaluation will be given, through a new iris data set and a proper evaluation framework.
Regarding the first stage of ICE, to facilitate the evaluation of different iris recognition
proposals, an iris image database has been released for the researchers and entities that
manifest the desire to participate in this competition. The ICE [79] database is comprised
of 2954 images, with a variable number of images per subject. Similarly to the remaining
public iris databases, its images were captured having quality as the main concern and
clearly simulate the users’ cooperation in the image capturing. Therefore, the noise factors
that the ICE database contains are almost exclusively related to iris obstructions and poorly
focused images.
2.1.4.4. MMU Database
The Multimedia University has developed a small data set of 450 iris images (MMU) [80].
They were captured through one of the most common iris recognition cameras presently
functioning (LG Iris Access R© 2200). This is a semi-automated camera that operates at the
range of 7-25 cm. Further, a new data set (MMU2) comprised of 995 iris images has been
released and another common iris recognition camera (Panasonic BM-ET100US Authentic
cam) was used. The iris images are from 100 volunteers with different ages and nationalities.
They come from Asia, Middle East, Africa and Europe and each of them contributed with
five iris images from each eye. Obviously, the images are highly homogeneous and their
noise factors are exclusively related with small iris obstructions by eyelids and eyelashes.
2.1.4.5. UPOL Database
The UPOL [81] iris image database was built within the University of Palack eho and
Olomouc. Its images have been captured through an optometric framework (TOPCON
TRC50IA) and so images of extremely high quality are produced. The database contains
384 images from both eyes of 64 subjects.
2.1.4.6. WVU Database
The West Virginia University developed an iris image database (WVU) [82] comprised of
1852 images from 380 different eyes. The number of acquisitions from each eye ranges
between three and six and an OKI Iris Pass-H hand-held device was used.

Towards Multi-modal Sclera and Iris Biometric Recognition with Adaptive Liveness Detection
48 | P a g e
2.1.4.7. UBIRIS
The UBIRIS version 1 [21] database consists of 1877 RGB images taken in two distinct
sessions (1205 images in session 1 and 672 images in session 2) from 241 identities. Both
high-resolution images (800 x 600) and low-resolution images (200 x 150) are provided in
the database. In UBIRIS version-2 the images were actually captured on non-constrained
conditions at-a-distance, on-the-move and on them visible wavelength. Here 261 subjects
of sclera 522 are present in this version. From these subjects, a total of 11,102 eye images
is present in two sessions. Few subjects are there in the database, where the volunteers are
wearing glasses.
2.1.4.8 Notre Dame Database
This dataset was Dept. of Computer Science and Engineering, University of Notre Dame,
Notre Dame, United States of America. An Iridian LG EOU2200 64,980 camera was used
to iris images from 356 subjects.
2.1.4.9. IIT Delhi Database
This dataset was collected at the Biometrics Research Laboratory in the Indian Institute of
Technology Delhi (IITD). It was collected using JIRIS, JPC1000, digital CMOS camera.
This dataset contains 1120 iris images from 224 users. Iris images are in bitmap format with
240*320 resolution.
2.1.4.10. MBGC
This database consists of 59,558 images collected from 240 users, using LG EOU 2200 Iris
Camera near-infrared 8-bit intensity level, having 480*640. The images are stored in BMP
image format.
2.1.4.11. Mobile Iris Challenge Evaluation
This challenge was organised in two-phase on two dataset MICHE I and II. MICHE-I is an
iris biometric dataset captured under uncontrolled settings using mobile devices. The key
features of the MICHE-I dataset are a wide and diverse population of subjects, the use of
different mobile devices for iris acquisition, realistic simulation of the acquisition process
(including noise), several data capture sessions separated in time, and image annotation
using metadata. MICHE-II is to represent the starting core of a wider dataset to be collected
with aforementioned unconstrained conditions.
2.1.5. Recent Works on Iris After 2010
Few recent works on iris segmentation are summarized as below.
1. Tan et al. [228] used UBIRIS v1 in their work. Clustering based coarse iris localization
followed by Localization of pupillary and limbic boundaries and localization of eyelids
is performed in this work.

Towards Multi-modal Sclera and Iris Biometric Recognition with Adaptive Liveness Detection
49 | P a g e
2. Zhang et al. [229] employed ICE 2005, CASIA v3 in their work. A robust gradient map
is used for iris localization. SIMC generated using spatial information and coarse iris
location. Segmentation achieved by a level set method was used.
3. Roy et al. used [230] ICE 2005, CASIA v3, UBIRIS v1for their work. Game-theoretic
decision making procedure to segment irises was used. Further, integrates region based
segmentation and gradient-based boundary localization was performed.
4. Pundlik et al. [231] used WVU Non-Ideal and WVU Off-Angle datasets in their work.
Images were modelled as MRF. Energy minimization is achieved via graph cuts was
performed. Further, model iris as an ellipse to refine segmentation region.
5. In Zuo and Schmid [232] CASIA v3, ICE, WVU was used. A combined scheme for pre-
processing, pupil segmentation, iris segmentation, and occlusion detection was reported
6. De Marisco et al. [233] used CASIA v3, UBIRIS v1 Pre-process using pasteurization
filter. Canny filtering is applied to locate pupil boundary. The image is transformed to
polar coordinates to identify the boundary between iris and sclera.
7. Proença [234] used UBIRIS v2 in this work. Sclera and iris are segmented and classified.
By Polynomial fitting.
8. Koh et al. [235] used CASIA v3 in their work. Center of the pupil is estimated based on
histograms. The pupillary boundary is computed using Hough transform. Applied
Hough transform again to localize limbic boundary
9. Tan and Kumar [236] used UBIRIS v2 for the work. Iris features extracted using
localized Zernike moments and sclera features are extracted using colour features. A
robust approach is proposed for post-processing classified iris pixels
10. Tan and Kumar [237] used UBIRIS v2, FRGC v1 and CASIA v4 in the work. Multiple
higher order local pixel dependencies are used to robustly classify eye region pixels into
iris or non-iris regions. Post-processing operations effectively tackle noisy pixels
11. Sutra et al. [238] used ICE 2005, CASIA v3, North Dame IRIS-0405 in their work. Pre-
processing is performed using anisotropic diffusion. Gradients are computed using the
Sobel filter and Viterbi algorithm is applied to find contour.

Towards Multi-modal Sclera and Iris Biometric Recognition with Adaptive Liveness Detection
50 | P a g e
12. Li et al. [239] CASIA v4 was used. Locate edge points on iris boundary. Boundary
detectors for pupillary, limbic, eyelid boundaries are learned and iris boundaries are
localized. Further eyelid edge points are modelled as parabolas.
13. Tan and Kumar [240] used UBIRIS v2 and CASIA v4 in their work. Iris segmentation
approach based on cellular automata using grow-cut algorithm is proposed. Further,
reduces computational complexity while increasing recognition was performance
14. Uhl and Wild [241] used CASIA Iris, North Dame dataset in their work. Adaptive
Hough transforms estimates iris centre. Polar transform detects the first elliptic pupillary
boundary. Ellipso-polar transform is used to find the second boundary
15. Li et al. [242] used CASIA v4 in their work. Assembled pupillary contour segments are
fitted as an ellipse. Limbic boundary points detected by LBD. Unseen boundary points
are extrapolated in eyelid occluded regions.
16. Alonso-Fernandez and Bigun [243] used CASIA v3 in their work. Pupil boundary is
searched for and sclera is detected. Eyelid occlusion is computed and the iris is localized
17. Tan and Kumar [244] used UBIRIS v2, FRGC, CASIA v4 dataset in their work. The
image is segmented using random walker algorithm. Coarsely segmented iris is refined
and modelled as a graph
18. Hu et al. [245] used UBIRIS v2. FRGC l1-norm induces sparsity allowing coarse iris
localization, limbic and pupillary boundary segmentation. Eyelid fitting and post-
processing are performed
Some advanced pieces of work on iris featuring are as following:
1. Zhou and Kumar [246] used IITD v1 and CASIA v3 dataset in their work. LRT exploits
the orientation information from the local features. Dominant orientation is used to
generate feature representation. The similarity is computed using matching distances.
2. In Roy et al. [247] UBIRIS v1, ICE 2005, WVU dataset was employed. An Active
contour model is deployed to segment non-ideal iris. A Modified Contribution-Selection
Algorithm select informative features without affecting recognition performance
3. Zhang et al. [248] CASIA v4 was employed. DAISY descriptors are extracted from iris.
Iris key points are localized on feature map. Extracted key points are matched for
classification.

Towards Multi-modal Sclera and Iris Biometric Recognition with Adaptive Liveness Detection
51 | P a g e
4. In Bastys et al. [249] CASIA v2, ICE v1, dataset were used. A fusion of multi-scale
Taylor expansion phase information and its local extrema is proposed as a hybrid
descriptor in this work.
5. Proença and Santos [250] NICE v2 Segment iris into coherent regions. Colour and
shape information is extracted as a feature.
6. Kumar et al. [251] used UBIRIS v2, FRGC, CASIA v4 dataset in their work.
Recognition of distantly acquired irises using LRT based orientation features. Iris is
modelled as sparse coding solution based on computationally efficient LRT dictionary
7. Li and Wu [252] UBIRIS v2, CASIA v3 Iris boundaries and eyelids are localized. Log-
Euclidean Co-variance Matrices are used to model correlation of spatial coordinates,
intensities, further a 1st and 2nd-order image derivatives was used as feature
8. Rahulkar and Holambe [253] used UBIRIS, CASIA v3, IITD dataset in their work. Iris
Features are extracted based on Triplet Half-Band Filter Bank. Post-classifier system
achieves robustness against intra-class iris variations
9. Zhang et al. [254] employed CASIA v4, ICE 2005 dataset, propose Perturbation-
enhanced Feature Correlation Filter for robust iris matching. Correlation filters are
utilized for Gabor images matching.
10. Liu and Li [255] used UBIRIS v2, CASIA v4 dataset in the work. Normalized iris image
is divided into patches, next represented by SIFT descriptors. The low-dimensional
features are encoded to binary codes. Matching is performed by counting binary codes
in the agreement was performed.
11. Kumar and Chan [256] UBIRIS v2 is employed. Hyper-complex sparse representation
is used. The orientation of iris texture is extracted using a dictionary of oriented atoms.
Iris representation as quaternion sparse coding problem is solved using convex
optimization strategy
12. Zhang et al. [257] used UBIRIS v1, UBIRIS v2, NICE v2 dataset is used. Colour
Texton is combined with the pixel value in multiple colour spaces. The image is
represented by the histogram of the learnt Textron vocabulary for featuring.
13. Wang et al. [258] used CASIA v4. A large margin loss function is adapted to learn the
robust model. Information from each feature is considered to remove noise. The model
is solved using Simplex algorithm.

Towards Multi-modal Sclera and Iris Biometric Recognition with Adaptive Liveness Detection
52 | P a g e
14. Sun et al. [259] employed CASIA. Hierarchical Visual Codebook integrates Vocabulary
Tree and Locality-constrained Linear Coding was used for featuring followed by adopts
coarse-to-fine visual coding strategy
15. Sun et al. used [260] CASIA v4 dataset in their work. Perform ordinal feature selection;
objective function considers misclassification error of intra-class and inter-class
matches. Multi-lobe Ordinal Filter is proposed to analyses ordinal measures of images
16. Tan and Kumar [261] used UBIRIS v2, FRGC, CASIA v4 for their work. Propose a
non-linear approach to capture local consistency of iris bits and overall quality of weight
map for recognition. Zernike moment based phase encoding of iris features is employed.
17. Tan and Kumar [262] used UBIRIS v2, FRGC, CASIA v4 dataset. Propose a strategy
for accurate iris recognition from distantly acquired images. The algorithm generates a
geometric key - set of coordinate-pairs assigned to each individual.
2.2. Sclera Literature
The first recognised work on sclera biometrics using blood vessels of sclera is recorded in
Derakhshani et al., [1]. All the contributions of the different works found in sclera literature
can be clustered into four basic categories. They are sclera segmentation, sclera vessel
enhancement and image registration, feature extraction and classification. The various
techniques that are employed for the above-mentioned steps are explained in the following
sub-sections. Figure 2.3 is a block diagram of a typical sclera biometric system.
Figure 2.3. A block diagram of a typical sclera biometric
The rest of the section is divided into the following sub-sections. The sub-section 2.1.1.
discusses the sclera anatomy; followed by sub-section 2.1.2 which highlights the several
challenges in different stages of sclera biometrics, and in subsection 2.2.3 the available
works in the literature and sclera datasets are discussed.

Towards Multi-modal Sclera and Iris Biometric Recognition with Adaptive Liveness Detection
53 | P a g e
2.2.1 Sclera Anatomy
Investigating the characteristics of the human organ that is employed for a biometric trait is
a very important step before using it. Therefore, in this section will discuss the properties
of eye anatomy and will point out the biological richness of sclera as a biometric trait.
The eye is one of the most complex organs in human body. It is constituted of the following
parts as described in Joussen et al. [85] and Kobayashi et al. [86]:
Cornea/sclera the white portion of the eye i.e. the clear front surface of the eye. Light is
focused primarily by the sclera. It contains the blood vessels which create a pattern.
The iris of the eye functions like the diaphragm of a camera, controlling the amount of
light reaching the back of the eye.
The eye's crystalline lens is located directly behind the pupil (a small hole through which
light enters into the eye) and further focuses light.
Light is focused by the cornea and crystalline lens (and limited by the iris and pupil)
then reaches the retina — the light-sensitive inner lining of the back of the eye.
Other parts of the human eye play a supporting role in the main activity of sight: Some
carry fluids (such as tears and blood) to lubricate or nourish the eye.
Figure 2.4: Different parts of the human eye 1.
Embryonal eye formation begins in the third week of the embryonic development and
continues till the tenth week as mentioned in Ort et al. [87], Sadler [88], Keller [89], and
Fuhrmann et al, [90]. The middle portion of the optic cup develops into the ciliary body and
iris (Eiraku [91]). Further differentiation and mechanical rearrangement of cells in and
1 http://www.vision-and-eye-health.com/eye-anatomy.html

Towards Multi-modal Sclera and Iris Biometric Recognition with Adaptive Liveness Detection
54 | P a g e
around the optic cup gives rise to the fully developed eye which also includes the scleral
part. Therefore, these facts prove that the sclera vessel patterns are present since birth.
As this article is focused on the sclera biometric trait, in the next subsection will provide
further insight into sclera anatomy. It is interesting to note that humans are the only
mammals with extensively exposed sclera, which is amenable to imaging (Kobayashi et al.
[86]).This is another advantage of using sclera for human identification. It is formed
randomly for each person due to the orientation of the blood vessels. The blood vessel
patterns are also unique with both genetic and developmental components determining their
structure. The structure of the blood vessels is visible and found to be stable over time. Even
though with increasing age, collagen and elastic fibers deteriorate, glycosaminoglycan loss
and sclera dehydration occur, and lipids and calcium salts accumulate, but the blood vessels
do not deteriorate. Therefore, sclera’s embryonal and biological properties prove and
advocate the stability of the pattern.
As discussed, the sclera is a white opaque area around the iris, containing blood vessel
pattern in different layers. The sclera as explained in Trier [92] and Kanski, [93], is a firm
dense surface composed of collagen and elastic fibers, with thickness varying from 0.8 mm
to 0.3 mm and organised in four layers: episclera, stroma, lamina fiscal and endothelium.
The conjunctiva is a clear mucous membrane, made up of epithelial tissue, and consists of
cells and underlying basement membrane that covers the sclera and lines the inside of the
eyelids; the conjunctival vascular is hard to see with the naked eye at a distance.
The episclera is the outermost layer and the endothelium is the innermost one. The sclera
is avascular, except in its outermost surface. The episclera which contains the blood
vessel patterns is employed for biometric applications.
The anterior part of the sclera, up to the edge of the cornea (the sclerocorneal junction)
and the inside of the eyelids, are covered by the conjunctival membrane, a thin layer
containing secretory epithelium that helps lubricate the eye for eyelid closure, and
protects the ocular surface from bacterial and viral infections.
The part of the conjunctiva that covers the inner lining of the eyelids is called palpebral
conjunctiva. The outer surface of the eyeball is covered by the bulbar conjunctiva, and
the junction of the palpebral conjunctiva and the bulbar conjunctiva is called the
conjunctival fornix. Bulbar conjunctiva is semi-transparent and colourless and contains
blood vessels.
Anatomically, the blood vessels in bulbar conjunctiva can be differentiated from those
of episclera; while conjunctival vessels may slightly move because of the conjunctival
membrane, those in episclera will not as mentioned in Heath [94].

Towards Multi-modal Sclera and Iris Biometric Recognition with Adaptive Liveness Detection
55 | P a g e
The rich vasculature patterns revealed in the episclera and conjunctival membrane are
together referred to as conjunctival vasculature/sclera in this article. Therefore, it can be
concluded from the aforementioned discussion that the orientation of the blood vessels
creates a pattern. It can also be concluded that their biological properties solicit their stability
and ease for use as a biometric trait.
2.2.2. Challenges and Research Problems in Sclera Biometrics
A sclera biometric system is comprised of different stages. Which are: image acquiring,
segmentation, image enhancement, feature extraction and classification. Each of these
stages poses different challenges and research problems. Challenges and research issues of
each of these stages are discussed below.
2.2.2.1 Image Acquisition
Image capture is the first and very crucial stage for any image processing related system.
Likewise, for sclera biometric systems, image acquiring plays a vital role. Accurate and best
quality information capturing is the main aim of this stage. However, there are several
challenges that can resist this information gathering stage, this includes.
The external lighting conditions (Figure 2.5), bulge structure of the sclera and specular
reflections due to the water content of the eye are the general challenges. These noise
issues can be minimised in controlled environments using indoor lighting conditions.
Sclera patterns are more prominently visible in indoor lighting conditions. Although in
indoor uncontrolled environments, specular reflection can get introduced in the eye
image (Figure 2.6 a, b).
The sclera patterns are less prominently visible in controlled and uncontrolled outdoor
lighting conditions (Figure 2.6 c, d).
Figure 2.5: An eye image acquired in the visible spectrum with lighting in the visible spectrum (taken from
UBIRIS version 1)
Moreover, capturing sclera patterns whilst also preserving the iris pattern is very important.
Visibility of the sclera pattern is prominent for most of the eye angles (Figure 2.6), except
when a person is looking downwards, as, during this scenario, the eye portion is mostly
covered by the eyelid and lashes.

Towards Multi-modal Sclera and Iris Biometric Recognition with Adaptive Liveness Detection
56 | P a g e
(a) (b)
(b) (d) Figure 2.5: Eye image of an individual acquired in different lighting conditions taken from MASD (a) indoor
controlled, (b) indoor uncontrolled, (c) outdoor controlled, (d) outdoor lighting uncontrolled.
The fineness of vascular patterns (medical condition) and age of the individual can also
affect the quality of the sclera pattern acquired in different ways, such as:
The sclera pattern of children is less visible as they are blueish in nature and the sclera
region is less exposed
Sometimes the sclera pattern can also be affected by medical conditions. A person
suffering from an eye allergy will tend to have a less exposed sclera region. The
prominence of patterns can be reduced for the patient suffering from the diabetic medical
condition (Figure 2.7b).
(e)
Figure 2.6: Eye image of an individual looking at different angles taken from MASD (a) looking right, (b)
looking straight, (c) looking left, (d) looking up and (e) looking downwards.

Towards Multi-modal Sclera and Iris Biometric Recognition with Adaptive Liveness Detection
57 | P a g e
Movement of the eyeball can also affect the sclera pattern acquired; blur and other noises
can get introduced in the pattern. Occlusions and other noisy factors are also a few of
the challenges that need to be addressed during this step (Figure 2.7 c, d) ta.
(a) (b)
(c) (d)
Figure 2.7: Examples of eye image (from MASD dataset) of a (a) child, (b) diabetic person, (c) with motion
blur and (d) closed eye.
Another important aspect that needs to be addressed in the sclera acquiring stage, is the light
spectrum in which the images will be captured. In general, the iris images are captured in
the NIR spectrum, but the sclera vessels are hardly visible in the NIR image of the sclera
(Figure 2.8 b), mainly due to the thin diameter of the veins in the eye (reflection and
transmission in NIR band are the same).In contrast, both the sclera and the iris patterns are
visible in the visible spectrum, which can be used for acquiring both patterns. More
precisely, sclera patterns are more prominently visible in the green band of the visible
spectrum and the iris in the red band. Therefore, one solution to obtain the iris and sclera
pattern at best quality can be captured in the multi-spectrum band. Figure 2.8 (c-f) examples
of images captured in multi-spectral bands. Eye images acquired with multispectral and
hyperspectral cameras. Looking for a discriminative camera for the sclera or iris could be a
better solution but the high cost of these cameras deters their use.
2.2.2.2. Segmentation
Segmentation is the first necessary step for most biometric related research. The main aim
of segmentation is to identify the region of interest as accurately as possible. Similarly, in

Towards Multi-modal Sclera and Iris Biometric Recognition with Adaptive Liveness Detection
58 | P a g e
(a) (b)
(c)
(d) (e) (f)
Figure 2.8: Eye image captured in (a) NIR taken from CASIA version 1 [78], (b) the plot of the transmission
vs reflection for different spectra [85], (c) eye images in the hyperspectral band, (d) in the visible spectrum,
(e) green band of visible spectrum and (f) red band of the visible spectrum. (d-f) are taken from Crihalmeanu
and Ross [8].
sclera biometrics a precise segmentation is important otherwise, an incorrect segmentation
can not only reduce the pattern available but also can introduce other patterns such as
eyelashes and eyelids. In addition, there are also several other specific challenges of the
sclera segmentation which are as follows:
One main problem is the low contrast of the sclera region i.e. the foreground and its
surroundings i.e. the background. Therefore it is difficult to apply traditional
binarization methods for segmentation.
Another significant challenge that affects sclera segmentation is highly bundled vessel
patterns, mainly near the tear gland. These bundled patterns sometimes can be
misclassified with the skin colour during segmentation and can be classified as the skin
or non-sclera area.
Towards Multi-modal Sclera and Iris Biometric Recognition with Adaptive Liveness Detection
59 | P a g e
Lighting shades and specular reflections on the sclera region are the other few challenges
that need to be tackled during sclera segmentation.2
The variations in the specular reflections may be accentuated by the rapid movement of
the eyeball. Based on the angle of the incoming ray of light, some specular highlights
may have intensities closer to the background intensity values; hence isolating the
specular reflections can be an additional difficulty.
2.2.2.3. Enhancement
The vessel pattern in the sclera is not prominently visible. So in order to make them clearly
visible, image enhancement is required. The following are the challenges in the sclera vessel
enhancement task.
Low contrast between the sclera vessels i.e. the foreground and the white region (non-
vascular part) i.e. the background are the main challenges for sclera vessel enhancement.
The vessel patterns are of varying intensity. Moreover, the randomness in the intensity
of the pattern varies from one individual to another.
Reflection, shade and lighting conditions (that are introduced during image acquisition)
can also affect the enhancement.
The presence of fluid in the eye can introduce specular reflection, which can also affect
the vessel pattern enhancement.
Medical conditions can reduce vessel pattern intensity e.g., a person suffering from
diabetes may get loose the capillaries present in the sclera.
Other conditions such as the presence of artificial lenses/glasses, after a long period of
near vision work (Figure 2.9a), irritation or rubbing of eyes, can introduce reddishness
which affects sclera pattern enhancement.
Ageing is another factor that affects the pattern enhancement i.e. the vessel pattern is
less prominent in children and the sclera region is smaller as compared to the adult.
2 The reason for the introduction of this specular reflection is because in order to image the scleral surface with its blood
vessel patterns, a sufficient amount of light needs to be directed into the eye. This light will be prominent on the
spherical surface of the sclera after passing through the conjunctiva. Optical processes such as reflection and refraction
are difficult to fully control and these results in specular reflections with a variety of different intensity values,
topologies, shapes, sizes and locations.

Towards Multi-modal Sclera and Iris Biometric Recognition with Adaptive Liveness Detection
60 | P a g e
Moreover, eyes in kids are generally bluish so the contrast of the blood vessels and sclera
is less prominent that of adults.
Due to ageing, a brown ring and pattern can also be introduced in the sclera area that
can be challenging to discriminate from blood vessels during enhancement due to their
close intensity.
The blood vessels can stretch and get loosened from the underlying sclera leading to the
formation of vessel folds with ageing. The white portion of the eye becomes yellowish
and an increase in melanin in the sclera region can also appear with ageing as mentioned
in [Heath, 2006], which affects enhancement process (Figure 2.9b).
The nonlinear blood vessel movement can also affect enhancement process.
(a) (b)
Figure 2.9: (a) Images of the sclera after stressful work. (b) Eye image of an old person with less prominent
sclera visibility (taken from MASD).
Another vital factor that needs to be considered during enhancement of this trait, is the layers
of the sclera to be considered for authentication. In the literature, both conjunctival
vasculature and the sclera are used parallelly. Conjunctival vasculature considers only the
episclera, while in the sclera the vessel patterns of the bulber layer are also present.
2.2.2.3. Feature Extraction
Feature extraction of a sclera involves a building of an appropriate mathematical model of
the abstract sclera pattern to reliably identify persons for authentication and identification
purposes. Following are the challenges that can be faced in feature extraction.
Upon rubbing the eye, the conjunctiva can slightly move which can change the pattern.
Even large changes in gaze can affect the feature as the vein pattern changes
significantly with the orientation of the eyeball (e.g. looking left vs. right so on. Figure
2.10).
Medical conditions can also influence the performance of the feature extraction
algorithms. Owen et al., [95-96] mentioned diabetes is associated with the loss of
capillaries, macro-vessel dilation and changes in tortuosity in vessel intensity.

Towards Multi-modal Sclera and Iris Biometric Recognition with Adaptive Liveness Detection
61 | P a g e
Hyperemia, conjunctivitis and haemorrhage influence a number of blood vessels seen
on the sclera surface, and affect the contrast between the blood vessels and the
background i.e. white part of the eye (the eye becomes reddish due to infections) Heath,
[94].
Figure 2.10. An example of sclera pattern of the same individual left eye looking in different directions/ gaze
(taken from MASD).
Medical conditions can also influence the performance of the feature extraction
algorithms. Diabetes is associated with the loss of capillaries, macro-vessel dilation and
changes in tortuosity in vessel intensity as mentioned in Owen et al., [95, 96].
Hyperemia, conjunctivitis and haemorrhage influence a number of blood vessels seen
on the sclera surface, and affect the contrast between the blood vessels and the
background i.e. white part of the eye (the eye becomes reddish due to infections) Heath,
[94].
Age is another factor that influences the appearance of the sclera surface. As mentioned
previously, vessels can stretch and loosen from the underlying sclera, leading to the
formation of conjunctival folds. The white region of the eye becomes yellowish and
along with increment in melanin in the conjunctiva can also appear.
In younger people, blood vessels may be less visible. With age, the conjunctival
vasculature becomes thicker and more visible, hence appropriate techniques are
required in order to determine and characterise this biometric to adjust this
development.
2.2.2.4. Classification
Biometric algorithms generally aim to provide a score of the membership of the input trait
by a given identity and hence classification plays an important role. The importance of
classification method is also reflected in the sclera literature. The main challenge is how to
best classify a trait on basis of the features extracted. In addition to general image
classification challenges few other challenges are as following:

Towards Multi-modal Sclera and Iris Biometric Recognition with Adaptive Liveness Detection
62 | P a g e
Adaptation with respect to changes in lighting conditions, medical conditions, ageing
and changes in orientation of the eyeball/gaze angle are the other challenges that make
the classification task complex.
Moreover, as referred to previously, upon rubbing the eye, the blood vessels can slightly
move relative to the sclera surface, generating small deformations of its blood vessels
as mentioned Heath, [94]. . Matching images of the conjunctival vasculature is greatly
impacted by these deformations.
Classification for larger samples and populations is another highlighted challenge that
will be necessary to take into account at this stage.
2.2.2.5. Fusion with Other Traits
Multimodal biometrics use more than one means of biometric identification to achieve
higher recognition accuracy. It was introduced to combine multiple biometrics to perform
positive human identification proposed in Ross and Jain. [97]. Like other multimodal
biometrics, such as iris and fingerprints, or iris and face, iris and sclera information can also
be used easily. As sclera and iris pattern can be obtained at one camera short. Focusing on
one-shot biometrics, for user convenience and transparency, the most reliable combination
is iris and sclera traits. Regardless of these advantages, several challenges that can be faced
in this stage are:
Selecting the best level of fusion is a big challenge in the course of multimodal eye
biometrics using iris and sclera.
Keeping the complexity of the algorithm low is another big challenge.
Studying the statistical independence of the traits is also required to build a more reliable
system.
Quality assessment of the traits is very important for assisting decision-making in the
matching process.
Adaptiveness of the quality assessment with a variance to lighting conditions, ageing
and gaze angle of the eye are a few additional challenges that are also faced with the
uni-modal scenario but can become more complex in a fusion scenario.
2.2.2.6. Performance Measures
In real life scenarios, it is required to know how well the system performs and what factors
affect its performance so that proper system selection or setup adjustments can be made.

Towards Multi-modal Sclera and Iris Biometric Recognition with Adaptive Liveness Detection
63 | P a g e
The only way to acquire such knowledge is through evaluation, which is the procedure that
involves testing of a system on a database and/or in a specific setup for the purpose of
obtaining measurable statistics that can be used for comparison. Several such measures have
been proposed in the literature and several challenges are being identified at different stages
of biometric data processing described in Snelick et al [98]. BEAT Biometrics Evaluation
and Testing (http://www.beat-eu.org/) is a standard that has also been proposed in recent
times.
A sclera biometric system also includes several stages of signal processing, image
processing and pattern recognition tasks. Therefore, performance evaluation of each of these
stages is required to be carried out individually. The identified challenges are as follows:
Performance evaluation of a sclera segmentation is one of the greatest challenges
because it requires good quality baseline (manually segmented masks or ground truth).
Moreover, the sclera region may be occluded by eyelashes which additional challenge
to segment and prepare baseline.
For sclera vein pattern enhancement, developing a standard baseline and performance
measure for it is challenging.
An appropriate quantitative analysis method to evaluate the performance of the features
employed and the classification process on a larger range of the population are also some
of the main challenges faced.
In addition to the general challenges of biometric performance evaluation, the quality
assessment of biometric raw data is receiving more and more attention since it is considered
one of the main factors affecting the overall performance of biometric systems, as found by
El-Abed et al [99]. These challenges are enlisted as below:
Acquisition artefacts such as illumination and acquisition environments are difficult to
maintain. Therefore, controlling the quality of the biometric raw data is absolutely
necessary before undertaking performance evaluation of the trait.
In general, to maintain standard using quality information can be performed, poor
quality samples can be removed during the enrolment phase or rejected during the
identification stage, followed by asking the user for a new sample. This scenario is also
true for sclera biometrics.
Contrast effects and their impact on the quality of the performance also need to be
evaluated.
Towards Multi-modal Sclera and Iris Biometric Recognition with Adaptive Liveness Detection
64 | P a g e
2.2.2.7. Anti-spoofing
Ratha et al. [100] mentions that with the potential growth of biometrics application,
biometric systems need to be equipped with countermeasures against spoofing attacks. Toth
[100] defines liveness/anti-spoofing detection refers to the different techniques that are
employed to countermeasures spoofing attack. The liveness detection methods may
scrutinise the physical properties of a living body (in terms of density, elasticity, electrical
capacitance, etc.) or of spectral reflection, absorbance, visual properties (colour, etc.),
involuntary signals of a living body (such as the pulse, blood pressure, etc.), or bodily
responses to external stimuli, (for instance smiling or the blinking of an eye) are employed
to detect liveness.
The potential types of approaches for forging that can be adapted in ocular biometric
systems are as follows [Daugman, [16], [29]:
1. Eye image/video: Scanning an image/video from a portable screen can be a potential
way of attacking the system (Figure 2.11b).
2. Printed images: Scanning a high resolution printed image as an artificial eye in front
of the scanner (Figure 2.11c).
3. Lens: Glass/plastic lens and 3D print of an eye.
Similar to other biometric the sclera biometric system should also be equipped with anti-
spoofing technique. Several challenges reside in designing anti-spoofing methods in sclera
based biometrics systems:
In general ocular biometrics in the visible spectrum, can face more threats of spoofing
as addressed in Galbally et al. [102].
Asking for responses to different stimuli could be effective, but also reduce the user
transparency of the scheme.
On the other hand, for software-based anti-spoofing methods, signal processing and
image processing tools are employed to established liveness, these establishments can
be tough to handle if 3D printing of an eye image is used to spoof.
Besides the general challenges of anti-spoofing attacks, there are few additional
challenges that exist for liveness detection. Liveness and adaptiveness of biometric traits
both are necessary to be incorporated in a biometric system. However, liveness and
adaptiveness of biometric traits have been found to be a trade-off in the literature.
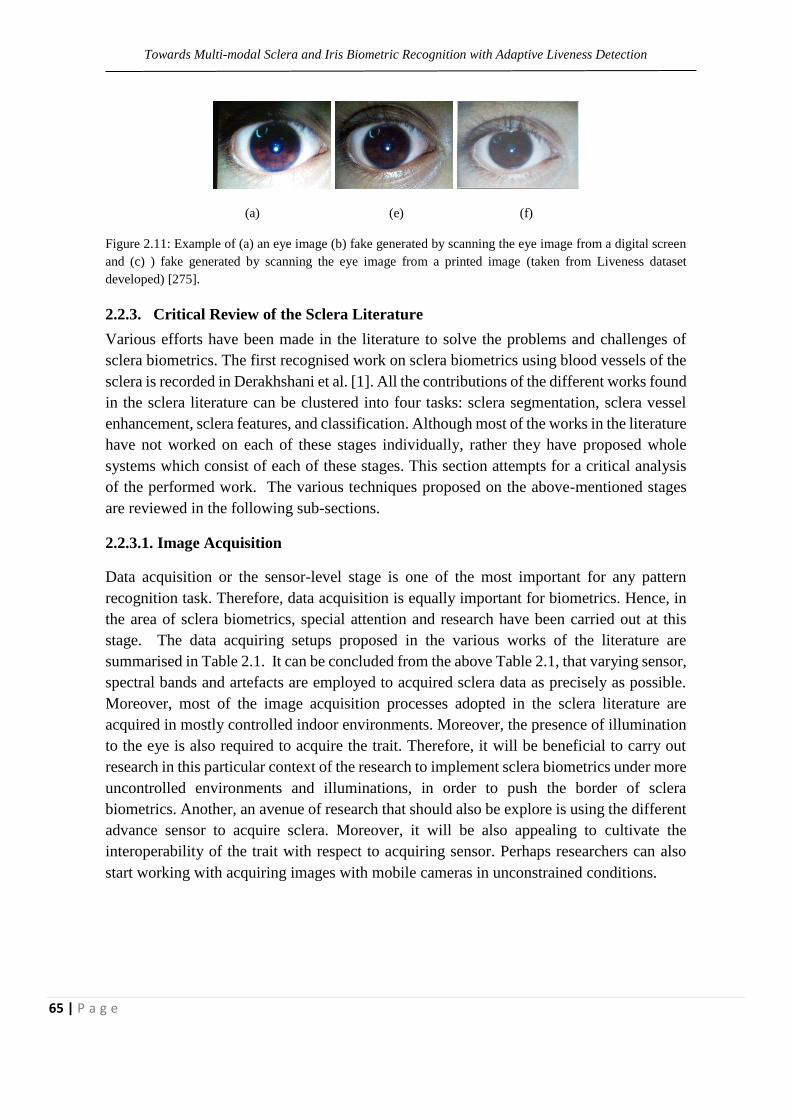
Towards Multi-modal Sclera and Iris Biometric Recognition with Adaptive Liveness Detection
65 | P a g e
(a) (e) (f)
Figure 2.11: Example of (a) an eye image (b) fake generated by scanning the eye image from a digital screen
and (c) ) fake generated by scanning the eye image from a printed image (taken from Liveness dataset
developed) [275].
2.2.3. Critical Review of the Sclera Literature
Various efforts have been made in the literature to solve the problems and challenges of
sclera biometrics. The first recognised work on sclera biometrics using blood vessels of the
sclera is recorded in Derakhshani et al. [1]. All the contributions of the different works found
in the sclera literature can be clustered into four tasks: sclera segmentation, sclera vessel
enhancement, sclera features, and classification. Although most of the works in the literature
have not worked on each of these stages individually, rather they have proposed whole
systems which consist of each of these stages. This section attempts for a critical analysis
of the performed work. The various techniques proposed on the above-mentioned stages
are reviewed in the following sub-sections.
2.2.3.1. Image Acquisition
Data acquisition or the sensor-level stage is one of the most important for any pattern
recognition task. Therefore, data acquisition is equally important for biometrics. Hence, in
the area of sclera biometrics, special attention and research have been carried out at this
stage. The data acquiring setups proposed in the various works of the literature are
summarised in Table 2.1. It can be concluded from the above Table 2.1, that varying sensor,
spectral bands and artefacts are employed to acquired sclera data as precisely as possible.
Moreover, most of the image acquisition processes adopted in the sclera literature are
acquired in mostly controlled indoor environments. Moreover, the presence of illumination
to the eye is also required to acquire the trait. Therefore, it will be beneficial to carry out
research in this particular context of the research to implement sclera biometrics under more
uncontrolled environments and illuminations, in order to push the border of sclera
biometrics. Another, an avenue of research that should also be explore is using the different
advance sensor to acquire sclera. Moreover, it will be also appealing to cultivate the
interoperability of the trait with respect to acquiring sensor. Perhaps researchers can also
start working with acquiring images with mobile cameras in unconstrained conditions.

Towards Multi-modal Sclera and Iris Biometric Recognition with Adaptive Liveness Detection
66 | P a g e
Table 2.1: Different sensor level technique proposed in literature to acquire sclera
Work Wavelength Hardware used Environment
Derakhshani et al.
[1]
Visible 5 MP Sony digital camera Indoor
controlled
Derakhshani and
Ross [2]
Visible Canon 20D camera EFS 60mm
f/2.8 Macro and EF 70-200 mm
f/4L USM telephoto lenses
Indoor
controlled
Zhou et al. [3, 5] Multi-wavelength (purple (420
nm), blue (470 nm), green (525
nm), yellow (590 nm), orange
(610 nm), red (630 nm), deep
red (660 nm), infrared (820
nm))
Crihalmeanu et al.
[14]
Visible SONY CyberShot DSC F717(5
megapixels)
Indoor
controlled
Crihalmeanu and
Ross [8]
Multiple spectral bands
range from 350 to 1700 nm
Redlake (Duncan Tech) MS3100
multispectral camera (three array
sensors based on CCD)
Ophthalmolog
ist’s slit-lamp
mount and a
light source
Tankasala et al.
[9]
Visible Canon 20D DSLR camera mounted
on a tripod
Regular office
environment
using ambient
lighting & no
flash
Gottemukkula et
al. [11]
Visible NikonD3S FX-format camera with
12.1 effective megapixels and a
micro Nikkor 105mm lens
Blocked
ambient light
UBIRIS version 1
& 2 Proença and
Alexandre [21]
Visible Nikon E5700 Darkroom
indoor
lighting and
outdoor light
2.2.3.2. Segmentation
As indicated in section 2.2.2.2 that sclera segmentation poses a huge amount of challenges,
therefore special research attention is required to be paid. Sclera segmentation has evolved
from manual segmentation to various intensity based and contour-based segmentation
technique. In the initial works of the sclera biometric literature such as in Derakhshani et al.
[1].and Derakhshani et al. [2], manual segmentation was used. Possibly Tan and Kumar
[237] followed by Khosravi and Safabakhsh. [7] was the first works that proposed
automated sclera detection in the visible spectrum. Rest of the works on sclera segmentation
are summarised in the below Table 2.2.

Towards Multi-modal Sclera and Iris Biometric Recognition with Adaptive Liveness Detection
67 | P a g e
Table 2.2: Different segmentation technique used in literature.
Work Technique Limitation Database
Khosravi and
Safabakhsh. [7]
TASOM (Time Adaptive Self-
Organizing Map)-method detailed
in [Shah-Hosseini 2003 a, b]
Some of the vein patterns in the sclera
region are quite bright and bundled,
especially in the edges that create
hindrance to segment region growing.
In-house
Crihalmeanu et al.
[14]
Semi-automated using k-means Sclera region misclassified to skin
region
In-house
Tankasala et al. [9] K-means clustering and
considering three clusters, sclera
pixel cluster was determined as the
cluster which has the largest
Euclidean distance from the origin
of the coordinate system to its
centroid.
Vein patterns in the sclera region
which are quite bright and bundled
classified into skin cluster
The performance also depends on the
illumination of the image.
In-house
Zhou et al. [4] Downsampling, to the HSV colour
space, followed by eyelid and iris
boundary refinement, mask
creation and mask up-sampling
Performance depends on the
illumination of the image.
UBIRIS
version 1
Zhou et al.[5]. For grey image: Otsu’s threshold
method, refinement by Fourier
active contour method [17].
Colour image estimation the best
representation between two colour
based techniques
Blur images cannot be handled
Oh and Toh [10] HSV colour model based
segmentation
Illumination change can effect
Gottemukkula et al.
[11]
Tiled based Blur images cannot be handled In-house
Crihalmeanu and
Ross [8]
The sclera-eyelids contour: (Land
+ Satellite), Pupil region
segmentation, the sclera-iris
boundary
Improper illumination or the
presence of plenty of mascara leads
to low segmentation performance
In-house
Sclera segmentation is a significantly important part of sclera biometrics. However, sclera
segmentation has not been extensively investigated as a separate topic, but mainly
summarised as a component of a broader task. It can be inferred from recent developments
in the aforementioned literature reported in Table 2.2, that there has been a number of
independent research efforts made by researchers to establish sclera segmentation. It can
be inferred from the above discussions that, two strategies for sclera segmentation have been
adopted in the literature. These categories of techniques are based on sclera pixel
thresholding and sclera shape contour. Each of techniques is having their advantages and

Towards Multi-modal Sclera and Iris Biometric Recognition with Adaptive Liveness Detection
68 | P a g e
disadvantages. Although from the observation made, active contour based is perhaps a better
approach as it has less effect in presence of noise. Therefore, more research attention is
required to establish the best technique for both low and high-resolution images. Another
important concern that should also be raised is evaluating the segmentation biometric
performance of the trait, depending on the perfectness of the trait. The goal is to obtain high
biometric performance rather than to attend ideal sclera segmentation, which might not be
attended on an unconstrained scenario.
2.2.3.3. Sclera Vessel Pattern Enhancement
Sclera vessel pattern is very important for proper featuring of the trait. Enhancement
technique has got mature from basic pre-processing using tonal correction used in
Derakhshani et al. [1] to wavelet enchantment used in Zhou et al. [5]. The different
techniques proposed for the same are in Table 2.3.
Table 2.3: Different sclera vein enhancement technique used in literature.
Work Technique Database
Derakhshani
et al. [1]
Contrast limited adaptive histogram equalisation (CLAHE) on the green channel
of the RGB image of sclera to get better contrast Followed by selective line
enhancement technique the region growing algorithm is applied before
binarization
In-house
Derakhshani
and Ross [2]
Green layer of the RGB image is pre-processed by a contrast-limited adaptive
histogram equalisation by 8×8 tiles 256-bin histograms. In-house
Crihalmeanu
et al. [8, 14]
Histogram equalisation, a low pass filtering was employed. Image registration a
local affine and a global smooth transformation were applied. In-house
Gottemukkula
et al. [11] An image mapping method used followed by sclera, followed by CLAHE In-house
Tankasala et
al. [9]
CLAHE with parameters: 8×8 tiles, contrast enhancement limit of 0.01, and
uniform distribution of the histogram. In-house
Zhou et al.[3-
5]
Bank of directional Gabor filters threshold for binarization, morphological
thinning
UBIRIS
version 1
Efforts have been made by researchers to resolve the problem of sclera vessel enhancement
as accurately as possible. It can be concluded from the above Table 2.3 that mainly CLAHE
and wavelet filters are used on the green channel of the sclera image to achieve prominent
sclera pattern. Various algorithms have been proposed for sclera enhancement in subsequent
independent research work. Still, sclera enhancement is an unsolved challenge and remains
an open research area, as performance analysis of this particular area has not at all been
investigated. Establishing performance measures for sclera vein enhancement can be a

Towards Multi-modal Sclera and Iris Biometric Recognition with Adaptive Liveness Detection
69 | P a g e
notable approach to research. Furthermore, vein enhancement is a significantly important
part of sclera biometrics, however, sclera enhancement has not been extensively
investigated as a separate topic. Several other issues such as invariance of the algorithm with
the individual ethnicity (individual with dark skin colour and white skin), cross sensor and
medical issues (dark brown ring around the iris, brown patches around sclera region, red
eyes, etc. as shown in Figure 2.12) have not been investigated yet.
Figure 2.12: An eye image showing a sclera with dark brown ring and brown patches on the sclera region.
2.2.3.4. Feature Analysis
Sclera vessels patterns are rich in texture features. Considering this assumption, different
texture feature-based extraction techniques are employed to model the pattern created by
sclera vessel patterns. The most relevant features proposed in the literature are summarised
in Table 2.4.
Table 2.4: Different feature extraction techniques used in the literature.
Work Technique Database
Derakhshani [1] Minutia point-based feature extraction
In-house
Derakhshani [2] Discrete Cohen-Daubechies-Feauveau 9/7 Wavelet transform, the resulting CDF 9/7
wavelet feature matrix (16×32=512 features) * 8 levels.
Crihalmeanu et
al. [8, 14]
SURF (Speeded Up Robust Features), minutiae-based extraction, followed by direct
correlation matching (by pixel to pixel matching) and finally, for fusing the features of
the different poses, a minutia score and direct correlation scores were used. Models a
local affine and a global smooth transformation.
Gottemukkula et
al. [11] A tile-based feature extraction method (mean and variance)
Tankasala et al.
[9]
Statistical features of GLCM (Grey Level Co-occurrence Matrix, such as contrast,
correlation, energy and homogeneity, were used in conjunction with Fisher linear
discriminant analysis.
Zhou et al. [4] Average, min, max and quality based average score for combining multi-angle images. UBIRIS
version 1
Oh and Toh [10] LBP (Local Binary Pattern)

Towards Multi-modal Sclera and Iris Biometric Recognition with Adaptive Liveness Detection
70 | P a g e
It can be inferred from the above Table 2.4 that typically, sclera features are assumed to be
texture features, although the sclera vessel pattern is also rich in shape feature. Moreover,
most of the work has been done on independent dataset so a fair comparison of their reported
performance is impossible. Therefore, it is very important to benchmark them with a single
dataset.
Regardless of the investigation made to date, several research areas such as the invariant
feature extraction of the sclera pattern in the presence of noise, medical condition, stress
condition and other external agents (eyelash or makeup introduced), need to be further
investigated. The effect of acquiring images in uncontrolled conditions, medical conditions
and cross sensor environments are also required to be further investigation.
Fresh ideas like, to produce view invariant feature are also required to research, to enrich
the subject of research. Moreover, attending higher performance will remain always to be
appealing, therefore designing more accurate featuring always remain an open research area.
2.2.3.5. Classification Techniques
Classification of the sclera vein pattern has been studied in most of the work in the literature
on sclera biometrics. Classification techniques in sclera biometrics got advanced from basic
classifiers as used in Derakhshani et al. [1]. The classification techniques used for
classification are summarised in the below Table 2.5.
Table 2.5: Different classification technique used in sclera literature.
Work Technique Database
Derakhshani et al. [1] First a coarse level procedure then a detailed matching. In-house
Derakhshani and Ross [2] Single hidden layer feed-forward NN (Neural Network) In-house
Crihalmeanu et al. [8,14] Score matching In-house
Gottemukkula et al. [11] Correlation coefficient In-house
Tankasala et al. [9] Neural networks (match score average method) In-house
Zhou et al.[3-5] Template matching UBIRIS
version 1 Oh and Toh [10] A normalised Hamming distance
An appreciable recognition result was attained in this above-mentioned work. However,
matching speed was slow for techniques based on template matching, which could curb the
utility of template matching for real-time applications. Although the best efforts have been

Towards Multi-modal Sclera and Iris Biometric Recognition with Adaptive Liveness Detection
71 | P a g e
made by researchers to classify the traits, but in this studies the classification techniques
have been investigated as a system not individually. Moreover, as all these works have used
different classifiers, and even the feature inputs are different, therefore a fair comparison is
impossible. Future effort should be made to make a fair comparison. Adaptability of the
system with respect to changes (noise, medical condition, stress condition and other external
agents) is still an open research area that needs to be thoroughly investigated. Especially, in
regards to medical condition and cross-sensor environment needs extensive research
attention. Fresh ideas for classification, score optimisation and matching are also required
to be explored. Moreover, similar to featuring classification will always remain to be an
open research area as it is directly related to the performance of the system. Robust user
template registration and an efficient matching procedure also required being research.
2.2.3.6. Multimodal Approaches in the Sclera Literature
In Gottemukkula et al. [11], the concept of combining the sclera and iris pattern was
proposed for the first time in the literature. Rest of the work proposed in the literature are
summarised in Table 2.6. The performance of the work proposed in Zhou et al. [6],
Tankasala et al. [9] and Gottemukkula et al. [12] depends on the Quality of the traits, which
was further explored by the work of Zhou et al. [4]. Although, appreciable recognition
accuracy was attained in the work of Zhou et al. [4], but multisession experimental scenarios
were not explored in the study.
Table 2.6: Different multimodal biometric used in sclera literature.
Work Modality Fusion Technique Database
Zhou et al.[4] Iris and sclera Score fusion based on GMM kernel UBIRIS version
1
Gottemukkula et al.
[12] Iris and sclera Weighted score fusion In-house
Zhou et al. [6] Iris and sclera Quality assessment-based score fusion
technique UBIRIS version
1 Tankasala et al [9] Iris and sclera Match score level fusion
Oh and Toh [10] Periocular and sclera Score level (TERELM)
Techniques available for information fusion are available. Hence the challenging to find the
optimal solution for fusing the sclera with other traits. In multi-biometric systems, the
information acquired from different sources can be processed either in sequence or parallel.
Hence it is important to decide about the processing architecture. The sensor should be fast
in collecting quality images from a distance and should also have low cost with optimal
failures to enrol. In sclera multi-biometrics, it is also very important to find this optimality
Towards Multi-modal Sclera and Iris Biometric Recognition with Adaptive Liveness Detection
72 | P a g e
which is hardly addressed in the literature. Moreover, as the information are the best present
at the sensor level, and it is possible to fuse the traits with sclera at the sensor level.
Therefore, efforts should be made to research on sensor level-based sclera multi-biometrics.
2.3.3.7. Performance Analysis and Quality Assessment
Research on performance analysis for the sclera biometrics is not researched in the literature.
Only the existing performance analysis measures for recognition and verification like FAR
(False Acceptance Rate), FRR (False Rejection Rate) and EER (Equal Error Rate) are
employed). In Zhou et al [4] a quality measure is proposed, which was able to detect 72 out
of 78 blurred and distorted images present from session 1 of UBIRIS version 1 dataset. In
another work Zhou et al [5] proposed a comprehensive approach to the sclera image quality
measure. The work includes quality filter and quantitative quality assessment unit,
segmentation evaluation unit, feature evaluation unit, and score fusion unit. The
experimental results show that the combination score is highly correlated with the sclera
recognition accuracy and can be used to improve and predict the performance of sclera
recognition systems.
2.2.4. Available Datasets and Overall Performance
One of the main problems that can be found in the development, testing and performance
evaluation of biometric recognition systems is the lack of publicly available large databases
acquired under real life conditions. The availability of biometric features corresponding to
a large population of individuals, together with the desirable presence of biometric intra-
class variability, Scenarios like acquiring artefacts, cross-sensor, quality, etc. can introduce
intra-class variability. There are various datasets proposed in the literature of sclera
biometric. Some of them are available publicly and some are in-house datasets. These
datasets and performance of the proposed systems employing them are summarised in the
Tables 2.7 and 2.8. It is quite clear from the Table 2.7 that several works have been carried
out in the literature on sclera biometric. Many of the identified challenges discussed in
section 2.2.3 are address and best efforts were made to solve these challenges. Although it
should be mentioned that all these works were performed on independent datasets, which
defers in acquiring artefacts. Moreover, the methods used in the segmentation,
enhancement, featuring and classification of sclera are discreet. Therefore, regardless of
satisfactory performances, these works are not comparable in an unbiased way. Hence, it is
clear that the literature should be more enriched with publicly available datasets. Public
datasets are an important component of active research. They provide strong advantages in
algorithmic development, provide a platform for performance evaluation of the trait, and
also introduce new challenges to the research community. The availability of datasets
associated with competitions is also required to

Towards Multi-modal Sclera and Iris Biometric Recognition with Adaptive Liveness Detection
73 | P a g e
Table 2.7. Various in-house datasets proposed in the sclera biometric literature and their performance achieved
Data Set in
Reference
Number of
subjects
and gaze
No. of
images
/subjec
ts
Segment-
ation
technique
Enhanceme
nt
technique
Feature Classifier Accuracy in %
Derakhshani
et al. [1]
6 (Both left
and right
eye)+
6 Manual CLAHE
and region
growing
Hu
moment
and
minutia
Multi-level
classification
100
Derakhshani
and Ross. [2]
50 (Session
1) and 17
(Session 2
taken after
4 months)+
2 per
gaze
CLAHE
CDF
ANN 4.3 (1 ft), 8.8
(5ft),9.2 (9 ft)
1 training
(6.5%,7.4%,
11%)
Crihalmeanu
et al. [14]
50 (Session
1);
17(Session
2)
+ (left
looking left
were only)
2
image
per
angle
at
distanc
e of 1,
9 and
12 ft
K-means
(Semi-
automated
)
CLAHE,
selective
enchantmen
t filter
Key
point-
descripto
r, affine
transfor
m.
Score
matching
25
Tankasala [9] 50 (Session
1 and 47
( Session 2)
#
Distan
ce 254;
152 &
30cm.
K-means
CLAHE
GLCM ANN 13.82
Gottemukkul-
a et al. [12] *
50 (Session
1) and 47
( Session 2)
4-30 days
apart
2
Varyin
g
gender
and
age
Tiled
based
CLAHE
Tile-
based
feature
Correlation
coefficient
4.29
Crihalmeanu
and Ross [8]
103 # 3280
(8 per
angle)
Contour:
CLAHE
Key
point,
affine
transfor
m.
Score
matching
0.37
Crihalmeanu
& Ross [22]
Hessian
matrix
Cross
correlation
0.6 average
Zhou et al. [4] 88, 44
subjects 4
different
eye, 2
1
1ft
distanc
e
Otsu &
HSV
Gabor &
thinning
Score TM
(Template
Matching)
11.89
8.49(manu-al
segmentati-on)
* Multimodal sclera fusion with iris
+ looking left, right, straight and up
# looking left and right

Towards Multi-modal Sclera and Iris Biometric Recognition with Adaptive Liveness Detection
74 | P a g e
Table 2.8. UBIRIS version 1 publicly available datasets proposed in the sclera biometric literature and
performance on them by various proposed work in the literature.
No. of
subjects
No. of images
per subjects Work
Segme-
Ntation
Enhan-
cement Feature Classifier
Accuracy
in %/EER
S1/S2/S12/S
21
241 in 2
discreet
sessions
5 per session
1877 RGB
images taken
in two distinct
sessions (1205
images in
session 1
and 672
images in
session 2)
from 241
identities.
Both high
resolution
images (800 x
600) and low
resolution
images (200 x
150)
Zhou et
[3]* Otsu
and
HSV
Gabor &
thinning
Score
TM (Template
Matching)
2.73/-/-/-
Zhou et al.
[6] 1.34/-/-/-
Zhou et al.
[6] *
96.42FAR(0
.1)/94.92(0.
01)/-/-/-
Oh and
Toh [10] HSV, CLAHE, LBP 0.47/-/-/-
* Multimodal sclera fusion with iris
+Multimodal sclera fusion with peri-ocular
S1= UBIRIS version 1 session 1 images as training and testing
S2= UBIRIS version 1 session 2 images as training and testing
S12= UBIRIS version 1 session 1 images as training and session 2 images as testing
S12= UBIRIS version 1 session 2 images as training and session 1 images as testing
Towards Multi-modal Sclera and Iris Biometric Recognition with Adaptive Liveness Detection
75 | P a g e
motivate researchers and benchmark dataset with the common experimental protocol.
Moreover, the common framework also helps in gauging the performance of a new
algorithm and can be compared with prior state-of-the-art approaches in an unbiased way.
As a reason in the second half of sclera literature, many researchers have started working
on the publicly available dataset. They are summarised in the next Tables 2.8. It quite clear
from Table 2.8 that several independent works were performed on UBIRIS version 1 dataset
and appreciable results were achieved in most of the work. Although all these works have
used a discrete technique in different stages and therefore it will be unfair to make a
comparison in between them.
Moreover, the dataset partition i.e. the testing and the training sequence used, the
performance measure used in these works were also different. Therefore only an overall
conclusion can be drawn as a whole. From the critical analysis, it can conclude that
performance of these systems on the single session experiment (employing images from the
same session for testing and training) seems to be impressive. Furthermore, in all these work
the result of the session 1 is of UBIRIS version 1 is found to better that session 2. Whereas,
in multisession experiments (employing images from one session for testing and with
images from the other session for training) the results falls quite a lot. The poor performance
of inter-session can be assumed to be the change in the acquiring artefact. It is also notable
that the difference is higher for iris trait, it illustrates the importance of illumination for
capturing good quality eye images in the visible spectrum and as well as the effect of the
illumination on iris pigment. Dark irises require NIR illumination or more intense diffused
illumination in the visible spectrum with minimal specular reflection. The performances on
few other publicly available datasets are summarised in the next Table 2.8.
In addition, from the Tables 2.7 and 2.8 it can also note that different segmentation,
enhancement, featuring and classification present in the literature are explored in the sclera
biometrics till date. As mention previously that many pieces of work are performed on
independent datasets, therefore a fair comparison between them is not possible.
Furthermore, the work proposed on the publicly available datasets have used discrete
segmentation, enhancement, featuring and classification techniques, and experimental
protocol which makes it hard to make an unbiased comparison between them. Therefore, it
flags an alert to the scientific community to make a structured research on this subject of
research. So, that it can prove the potentiality of sclera as a trait and future researchers can
easily identify the state-of-the-art, and from where they should start.
In biometric data labels associated with individual samples, subject identity and possibly
some demographic attributes e.g. gender, age, and race are necessary for inclusion. Most of
the available datasets are lacking in these details. New datasets need to incorporate these
details.
Towards Multi-modal Sclera and Iris Biometric Recognition with Adaptive Liveness Detection
76 | P a g e
It can be inferred after reviewing the sclera literature that several works which have been
carried out by different research groups to establish sclera biometrics for personal
identification. Many of the identified challenges are also explored and addressed. Therefore,
proposed works and the studied anatomy of the sclera establishes the preliminary viability
of the trait. Although the initial viability of the trait is experimented in a laboratory
environment, there are several issues remain unsolved and unaddressed. Especially, the
main concern that should be undertaken is to push its boundary of applicability in real life
scenario and to move out from its infant stage. To best of author’s knowledge applicability
of the sclera biometrics in a real life, the scenario is not explored at all. Moreover, as address
previously the highest concern that this field of research should receive is systematic and
structure research.
2.3. Liveness Detection Literature
Traditional biometric authentication systems are not equipped to discriminate impostors
those who can illegally duplicate genuine traits and use the privileges to access a system as
a genuine user. Therefore, in order to increase the security and reliability of the biometric
system, anti-spoofing/ liveness detection is a necessary step to prevent threats from
intruders.
Liveness detection refers to the different techniques employed as a countermeasure to
overcome the threat of physical spoofing of biometric samples. The liveness detection
methods may examine physical properties of a living body in terms of density, elasticity,
electrical capacitance, etc. or spectral reflection and absorbance, visual (colour, etc.) or may
analyse body fluids (DNA, etc.), involuntary signals of a living body such as the pulse, blood
pressure, etc. Also bodily responses to external stimuli, for instance, smiling or the blinking
of an eye can also employed to establish liveness.
In this context it worth of mentioning that, most of the eye liveness detection work and
the associated databases that were developed in the literature were aimed at incorporating
iris liveness. In those datasets, iris images in the infra-red spectrum were captured.
Although, for multimodal eye biometrics, the acquisition of iris and sclera traits is required
in the visible spectrum (as mentioned previously the sclera vessel patterns are not prominent
in Infra-red images). Furthermore, in the well-known existing databases like, Biosec
(Fierrez et al, [118]), Clarkson (Schuckers et al., [119]), NotreDame (Doyle, and Bowyer,
[120]), Warsaw (Czajka, [121]) and MobBIO (Sequeira et al., [122]), the sclera vessel
patterns are not visible due to the image acquisition approach adopted. Moreover, the fake
images developed in these databases were produced from printed eye images and artificial
lens patterns. Whereas, nowadays several other sophisticated techniques such as portable
screens and mobiles can be used by intruders to forge the highlighted multimodal ocular
system in the visible spectrum. These highlights for development of a new dataset for
liveness detection.

Towards Multi-modal Sclera and Iris Biometric Recognition with Adaptive Liveness Detection
77 | P a g e
Many approaches for identifying forgeries and establishing liveness have been
investigated in the biometrics literature. In Ratha et al., [100], the authors identified two
types of attacks that can be adopted by intruders while attacking a biometric system: Direct
and Indirect.
a. Direct attack: Direct attacks are performed at the sensor level. It relates to the
generation of synthetic biometric traits (for instance, iris, face images or videos) in order
to fraudulently access a system.
b. Indirect attacks: Indirect attacks are performed at the digital level forging the data
flow as explained in Ratha et al., [100], these attacks targets the feature extractor, the
matcher or the weak points in the communication channels.
The proposed solutions and specific anti-spoofing method proposed in the literature can be
categorised into two groups of techniques as mentioned in Ratha et al., [100], they are as
follows.
a. Software-based techniques: In these techniques, fake biometric traits are detected
once the sample has been acquired with a standard sensor. Subsequently, image quality
features, body movement features, motion features, and physical properties are
employed to realise liveness.
b. Hardware-based techniques: In these techniques, specific devices are added to the
sensor in order to detect particular properties. As an example, this may include the
detection of live fingers in a fingerprint recognition system via blood pressure.
Furthermore, it can be noted in the literature that the methods of liveness detection can be
classified into four groups. This categorization is based on the approach adapted for
featuring the biometric trait and liveness as well as the timing of measurement as mentioned
in Une and Tamura [116].
As mentioned previously, among the ocular biometrics, the iris is the most promising
trait. So, various examples of research for liveness detection of iris biometrics can be found
in the literature. The potential approaches for forging iris-based systems that are highlighted
in the literature are as followings:
Eye image/video: Scanning an image/video from a probable screen.
Printed images: Scanning a high resolution printed image of an artificial eye.
Lens: Glass/plastic artificial lenses etc.

Towards Multi-modal Sclera and Iris Biometric Recognition with Adaptive Liveness Detection
78 | P a g e
The feasibility of these attacks has been investigated and reported that it is actually possible
to spoof iris recognition systems with printed iris images and well-made colour iris lenses
as mentioned in Daugman, [28], Lee et al., [117], Daugman, [29].
In the literature of iris liveness detection, the potential of quality assessment to identify
genuine and fake iris samples acquired from a high quality printed images has been explored
as a way to detect spoofing attacks in Galbally et al., [101]. In this work, a strategy based
on the combination of several quality-related features has also been used for anti-spoofing
measure. This work also proposed a framework of image quality based feature selection.
Another approach for quality-based features assessment has been used for liveness detection
in Kanematsu et al., [125]. One more example for assessing the iris image quality for
liveness measures, such as occlusion, contrast, focus and angular deformation can be found
in Abhyankar and Schuckers, [126].
The use of texture analysis of the iris liveness can be found in He et al., [127]. The
analysis of frequency distribution rates of some specific regions of the iris can be found in
Ma et al., [128] used as an measure of liveness detection. Some significant developments in
iris liveness detection can be found in the competition series of iris Livedet, organised to
record the recent developments. Some well-established texture assessment-based measures
were used by the participants to establish liveness detection.
In the context of previous research of liveness, manual segmentation was adopted to find
the region of interest, which is quite unrealistic. A very recent work of Sequeira et al., [129]
investigated and concluded that automatic segmentation does not affect the liveness
detection measure. In the literature, most of the seminal and recent works concerning
liveness detection Alonso-Fernandez et al., [123] in fingerprint-based recognition systems
and Galbally et al., [101] in iris have employed image quality features for liveness detection.
Another approach for software-based liveness detection of direct attacks, by challenge-
response framework embedded into the visual or audio-visual signal, is reported in
Kollreider et al., [124]. Several properties of a living body such as bodily responses to
external stimuli are reported in Kollreider et al., [124] for real-time face detection and
motion analysis.
It can be evident for the above review of the literature that liveness detection for ocular
biometrics can be more resilient to spoof attack and it is an open research area. Different
image quality based feature, response to stimuli like asking blinking left eye, opening
mouth, rotating head, etc. in an unknown sequence can be used to establish liveness.
Towards Multi-modal Sclera and Iris Biometric Recognition with Adaptive Liveness Detection
79 | P a g e
Therefore, this thesis will concentrate to propose a framework for liveness detection of
ocular biometric in the visible spectrum.
2.4. Adaptive Biometrics Literature
Adaptiveness of the biometric system with change or variation in the trait that may happen
due to ageing, acquiring conditions or variation in the position of the trait while acquiring.
Identifying correctly while handling these changes is a significant challenge and which gives
growth to the new field of research i.e. Adaptive Biometrics (AB).
In the last decade, adaptive biometric systems have been a subject of great interested to
the researchers from the biometric community. Various research techniques have been
proposed by different researchers. Best of author’s knowledge, the first adaptive biometric
approach was introduced in Rattani et al. [103]. Literature of AB systems can be grouped
by the key attributes of machine intelligence methods proposed. Supervised training used in
Rattani et al. [105-107], Poh et al, [108], and Uludag et al, [109] against semi-supervised
training in Rattani et al. [106], Poh et al, [108], and [113], Self-train Jiang and Ser [110],
Rye et al. [111], Liu. et al, [112] or co-train Rattani et al. [106], Roli et al, [113], and Online
Jiang and Ser [110], Rye et al. [111] and offline Rattani et al. [107], Roli et al, [114], Rattani
et al. [115]. In the recent past, a general study has been done in regard to AB in Poh et al,
[104] to address some general questions like:
• Whether supervised adaptation better than semi-supervised?
• Whether co-training can outperform self-training?
• Whether offline adaptation is better than online?
Further, an analysis was conducted to validate the hypothesis in Rattani et al, [103]. In work
of Rattani et al, [105] the author proposes a two-stage classifier technique for automatically
updating the biometric templates. In the work, a labelling scheme based on probabilistic
semi-supervised learning was employed. Soft probabilistic labels were marked to each batch
of input samples by calculating the minimum energy function on a graphical representation.
A harmonic function was used for uniqueness representation of the samples. Also to ensure
that labels assigned to input sample employing are performed both the enrolled and closely
related input data. Further, the genuinely classified samples undergo a selection process
designed on risk minimization. The experiment was perform to validate on DIEE fingerprint
dataset, an appreciable result was achieved.

Towards Multi-modal Sclera and Iris Biometric Recognition with Adaptive Liveness Detection
80 | P a g e
In research of Rattani et al, [106], the effect of different threshold settings was used to
template update.
A novel method was proposed by passing the threshold selection step. This work also
analysed that template update method could be better for group specific updating. This is
due to the presence of different type of population. Attempts have been also made to give a
preliminary guideline on the type of update procedures. That could be undertaken for a
specific group of the population. Further, set of rules for simulating real world situation has
been proposed for the unbiased validation of update methods. However, liveness and
adaptiveness of biometric traits have been found to be a trade-off in the literature.
2.5. Summary
For the literature survey documented in this chapter, it is evident from the iris literature
surveys that present works focus the non-ideal iris recognition and it can also be concluded
that more research work on this topic is required to make it more accurate as much as
possible.
The chapter further discusses the viability of the sclera biometric, list and, identify
challenges that exist in the different stages of its processing and propose a whole set of
future research line. The viability of the sclera biometrics is reviewed analysing its anatomy
and existing work. Furthermore, a variety of databases proposed and their performances
reported in the literature are also highlighted.
Very surprisingly the main gap that was found in this subject of research is that many
discrete works have been proposed in the literature, perhaps which leads to haphazard
research. Consequently, in thesis research will be performed using this particular trait to
pursue systematic research.
It is also evident from the survey to date, the sclera biometrics both independently and as
well in multi-modal has not been extensively studied and little is known regarding its
usefulness. So, the state-of-art related to it is not mature enough and still in its infancy.
Therefore more research should be performed for evaluating the potential of the sclera
biometric in regards to accuracy and adaptability with changes in condition and also
evaluation should be carried out for its combination with iris pattern to increase the
biometric applicability of iris biometrics. Even the liveliness of the data for eye biometrics
is not enlightened in the literature. Therefore the proposed research is conceived to solve
the above-identified gaps identified in the literature.
In the next half of the chapter, the literature of liveness detection and adaptive biometric
is surveyed. It can be concluded for the survey that liveness and adaptiveness of biometric
traits have been found to be a trade-off in the literature.

Towards Multi-modal Sclera and Iris Biometric Recognition with Adaptive Liveness Detection
81 | P a g e
Therefore, the second half of the thesis will concentrate on bridging the gap of liveness
and adaptability in multimodal ocular biometric using iris and sclera.

Towards Multi-modal Sclera and Iris Biometric Recognition with Adaptive Liveness Detection
82 | P a g e
Towards Multi-modal Sclera and Iris Biometric Recognition with Adaptive Liveness Detection
83 | P a g e
3 Advancement in Multimodal Iris and
Sclera Biometrics In this chapter, the proposed advancement on sclera and iris segmentation process, pattern
enhancement techniques, and feature extraction techniques are explained. Next, the
classification techniques are discussed in detail. A block diagram of the proposed system is
given in Figure 3.1.
The rest of this chapter is organised into the following Sections: 3.1 explain the proposed
sclera segmentation processes; 3.2 explain the proposed iris segmentation process: section
3.3 and 3.4 sclera and iris image enhancement techniques are explained. In Section 3.5 the
various proposed feature extraction processes are highlighted, while in Section 3.6 the
various classification techniques are also explained. The experimental setup and the results
of the proposed work are explained in rest of the chapter. Section 3.7 illustrates the different
datasets used, followed by results, discussion and state-of-the-art comparison with the
proposed works are described in Section 3.8
Major parts of the chapter have been published in the articles Das et al. [263-265, 267, 273].
3.1. Sclera Segmentation
Segmentation is the first step for most biometric systems. The aim of segmentation is to
determine the appropriate region of interest or the region which has the information for
biometric authentication. As sclera literature is very new, several segmentation techniques

Towards Multi-modal Sclera and Iris Biometric Recognition with Adaptive Liveness Detection
84 | P a g e
have been employed to analyse the most stable and efficient segmentation technique, which
are described in the sub-sections below.
3.1.1. Active Contour-based Region Growing Segmentation
The sclera is a white region of connective tissue and blood vessels surrounding the iris. This
portion of blood vessels inside the sclera region is randomly-oriented which creates a
pattern, that can be utilised for biometric identification. Segmentation is the first step for
most biometric-related research. Similarly, in sclera biometrics a perfect segmentation is
Figure 3.1. A block diagram of the proposed system.
important, otherwise an incorrect segmentation can reduce the scope of the pattern available
and it can also introduce other patterns such as eyelashes and eyelids, which will bias the
recognition result. As the blood vessels inside the sclera region are oriented in different
layers, the intensity of the vessels varies highly. Some of them are quite bright and bundled,
creating a hindrance to standard region growing. In order to minimise this hindrance, the
red channel of the image has been selected for segmentation, as the blood vessels are less
prominent in the red channel, as shown in Figure (b). A representation for each colour
channel is indicated in Figure 3.2.

Towards Multi-modal Sclera and Iris Biometric Recognition with Adaptive Liveness Detection
85 | P a g e
(a) (b)
(c) (d)
Figure.3.2. (a) The image of the original RGB image, (b) The red channel component of (a), (c) The Green
channel component of 1(a), and (d) blue channel component of (a) [263].
Adaptive histogram equalisation was performed with a small window of 2x2 to reduce the
vessel content. Next, a bank of low pass Haar reconstruction filters as described in Mallat
[31] with a high cut-off was used to achieve a clear white sclera without the patterns of the
blood vessel. Analysing different results the cutoff value was selected and the value that
produces the best result was used for experimentation. Figure 3.3 (a) shows the histogram-
equalized image and 3.3 (b) is the Haar filtered image of 3.3 (a).
(a) (b)
Figure. 3.3. (a) Is the histogram equalized image and (b) the Haar filtered image of 3.2(b) [263].
This pre-processed image can be used for segmentation by a time-adaptive active contour-
based region growing segmentation method discussed in Chan and Vese [15]. The right and
the left sclera are segmented separately. For region growing-based segmentation, a seed
point was required. In order to get the seed point Daugmans integrodifferential operator in
Daugman [16, 27] was used, to calculate the centre and radius of the iris. From the centre
of the iris at a distance of 1.1 of the radius length of the iris and a deviation of 45 degrees
with the horizontal, the seed point for region growing is set on both sides of the sclera as
explained in Figure 3.4.

Towards Multi-modal Sclera and Iris Biometric Recognition with Adaptive Liveness Detection
86 | P a g e
Figure.3.4. Seed point for sclera segmentation [263].
Now the seed point as shown in below Figure 3.5 (b and f), grows to provide the total sclera
region as explained in Figure 3.5.
Figure. 3.5. Region growing segmentation method of left and right sclera. (a) The Histogram equalized and
filtered image of red component of (a),,,(b) Initial size of the seed for right sclera,(c) Segmented image of
(a),(d) Segmented mask developed for right sclera, (e)The Histogram equalized and filtered image of red
component of (a),(f) Initial size of the seed for left sclera,(g) Segmented image of (e), (h) Segmented mask
developed for left sclera [263].
3.1.2. K-means Based Segmentation
Among the different segmentation methods available in the computer vision area, a model
-based segmentation algorithm based on k-means [32] has been chosen. The eye image was
segmented into three clusters using a k-means algorithm, as shown in the Figure. 3.6.
(a)
(b)
Figure. 3.6. (a) Iris image; (b) k-means clusters.

Towards Multi-modal Sclera and Iris Biometric Recognition with Adaptive Liveness Detection
87 | P a g e
3.1.3. C-means based segmentation
In this scenario, sclera segmentation was performed by a Fuzzy C-means clustering-based
segmentation proposed in Li et al. [35]. Fuzzy C-means is a method of clustering which
allows one piece of data to belong to two or more clusters [33-34]. It is based on the
minimization of the following objective function which appears in the equation below 3.1.
where (3.1)
where m is any real number greater than 1, uij is the degree of membership of xi in the cluster
j, xi is the ith of d-dimensional measured data, cj is the d-dimension centre of the cluster,
and ||*|| is any norm expressing the similarity between any measured data and the centre.
Fuzzy partitioning is carried out through an iterative optimisation of the objective function
shown above, with the update of membership uij and the cluster centres cj.
(3.2)
(3.3)
This iteration will stop when , where s is a termination criterion between 0
and 1, and k are the iteration steps. This procedure converges to a local minimum or a saddle
point of Jm. The performance of the level set segmentation is subject to appropriate
initialization and optimal configuration of controlling parameters, which require substantial
manual intervention. A new fuzzy level set algorithm was used to facilitate sclera
segmentation. It is able to directly evolve from the initial segmentation by spatial fuzzy
clustering. The controlling parameters of the level set evolution are also estimated from the
results of the fuzzy clustering. Moreover, the fuzzy level set algorithm was enhanced with
locally regularized evolution. Such improvements facilitate level set manipulation and lead
to a more robust segmentation.
The parameters that are affecting the level set segmentation are:
a. Controlling the spread of the Gaussian smoothing function

Towards Multi-modal Sclera and Iris Biometric Recognition with Adaptive Liveness Detection
88 | P a g e
b. Controlling the gradient strength of the initial level set function
c. Regulating or direct function
d. Weighted coefficient of penalty term
e. Coefficient of Counter length for smoothing
f. Artificial balloon force
g. Time set for level set initialization
h. Maximum iteration for level set evolution
A performance evaluation of the proposed algorithm was carried out on sclera images from
the different index. The results confirm the effectiveness of the technique for sclera image
segmentation. The number of clusters considered here was three and with index three. The
segmentation was performed on grey image images Figure 3.7 (c) shows the Fuzzy C
means-based sclera segmentation of (a) index 1. Figure 3.7 (d) shows the Fuzzy C means-
based sclera segmentation of 3.7(a) index 2 and Figure 3.7(f) shows the Fuzzy C means-
based sclera segmentation of 3.7(a) index 3 and 3.7(b) grey image of 3.7(a).
(a) (b) (c)
(d) (e)
Figure 3.7: (a)original image, (b) grey image of (a).(c) shows the Fuzzy C means-based sclera segmentation
of (a) index 1.Figure 1(d) shows the Fuzzy C means-based sclera segmentation of (a) index 2 and (e) shows
the Fuzzy C means-based sclera segmentation of (a) index 3 [265].
Here the Fuzzy C means-based sclera segmentation of index 1 is used as the segmented
mask for further experimentation.
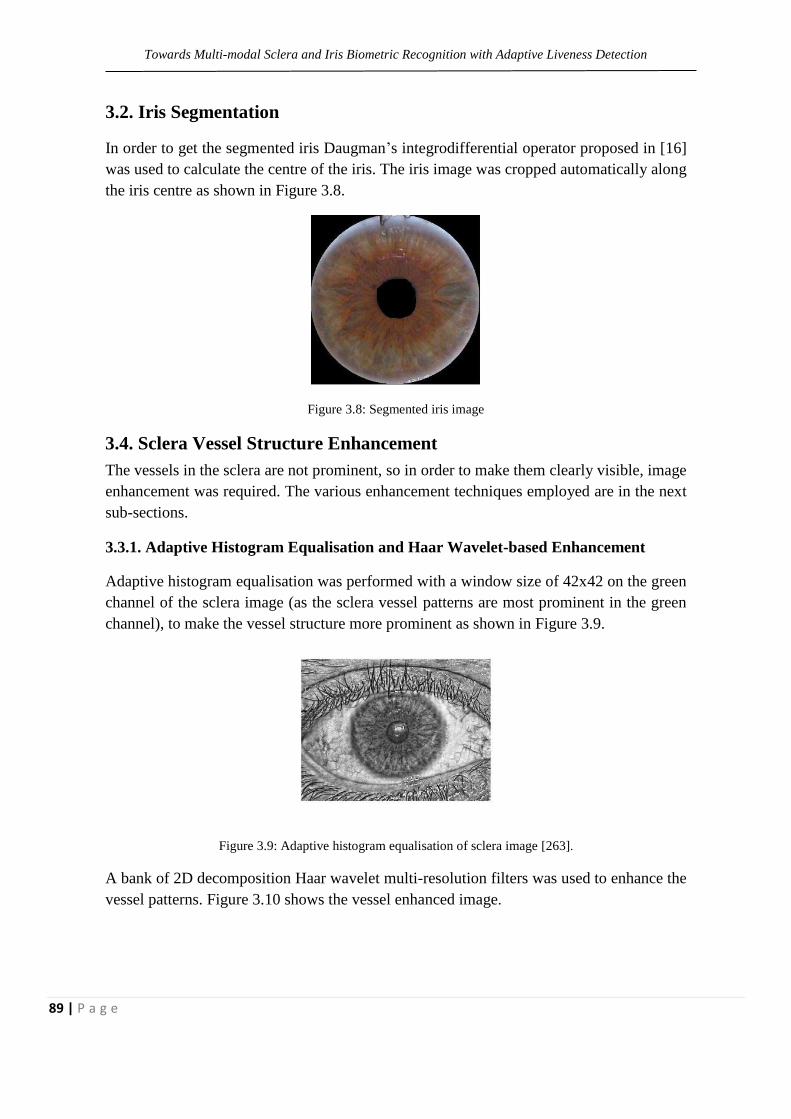
Towards Multi-modal Sclera and Iris Biometric Recognition with Adaptive Liveness Detection
89 | P a g e
3.2. Iris Segmentation
In order to get the segmented iris Daugman’s integrodifferential operator proposed in [16]
was used to calculate the centre of the iris. The iris image was cropped automatically along
the iris centre as shown in Figure 3.8.
Figure 3.8: Segmented iris image
3.4. Sclera Vessel Structure Enhancement
The vessels in the sclera are not prominent, so in order to make them clearly visible, image
enhancement was required. The various enhancement techniques employed are in the next
sub-sections.
3.3.1. Adaptive Histogram Equalisation and Haar Wavelet-based Enhancement
Adaptive histogram equalisation was performed with a window size of 42x42 on the green
channel of the sclera image (as the sclera vessel patterns are most prominent in the green
channel), to make the vessel structure more prominent as shown in Figure 3.9.
Figure 3.9: Adaptive histogram equalisation of sclera image [263].
A bank of 2D decomposition Haar wavelet multi-resolution filters was used to enhance the
vessel patterns. Figure 3.10 shows the vessel enhanced image.

Towards Multi-modal Sclera and Iris Biometric Recognition with Adaptive Liveness Detection
90 | P a g e
Figure 3.10: The vessel enhanced image [264].
3.3.2. Fuzzy logic-based Brightness Preserving Dynamic Fuzzy Histogram
Equalisation and Discrete Meyer wavelet Based Enhancement
Adaptive histogram equalization [36] was performed with a window size of 42x42 on the
green channel of the sclera image (as the sclera vessel patterns are most prominent in the
green channel as shown in Figure 3.11(c)) to make the vessel structure more prominent as
shown in Figure (a). Next Fuzzy logic-based Brightness Preserving Dynamic Fuzzy
Histogram Equalisation proposed in Sheet et al.[43] was used to make the pattern clearer
using Gaussian-based Fuzzy Membership function and a window size of 42 x 42 as shown
in Figure 3.12(c).
(a) (b) (c) (d)
Figure 3.11 (a) The original RGB image, (b) The red channel component of (a), (c) The green channel
component of (a), and (d) blue channel component of (a) [263],
Furthermore, the Discrete Meyer wavelet [37] was used to enhance the vessel patterns. A
low pass reconstruction of the above-mentioned filter was used to enhance the Figure 3,12
(b) shows the vessel enhanced image after applying the filter.
(a) (b) (c)
Figure 3.12: (a) Adaptive histogram equalisation of the sclera image. (b) the vessel enhanced image.(c) fuzzy
logic based Brightness Preserving Dynamic Fuzzy Histogram Equalization on the green channel of the sclera
image [265].
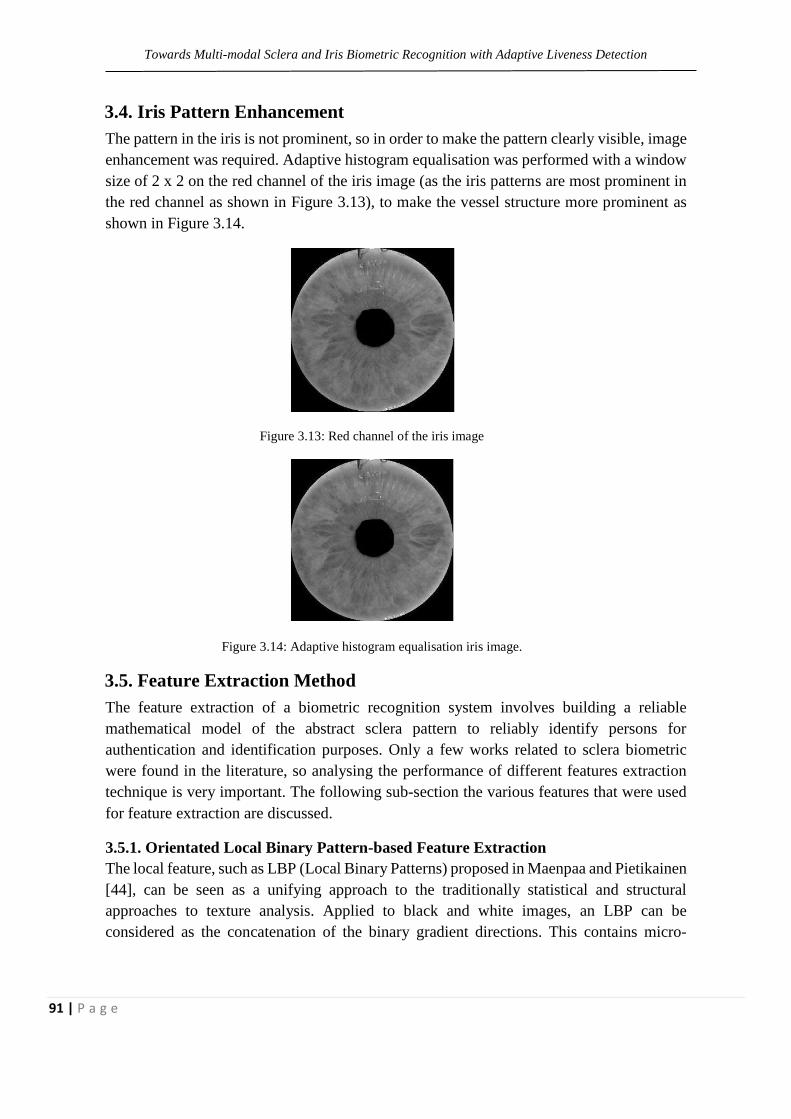
Towards Multi-modal Sclera and Iris Biometric Recognition with Adaptive Liveness Detection
91 | P a g e
3.4. Iris Pattern Enhancement
The pattern in the iris is not prominent, so in order to make the pattern clearly visible, image
enhancement was required. Adaptive histogram equalisation was performed with a window
size of 2 x 2 on the red channel of the iris image (as the iris patterns are most prominent in
the red channel as shown in Figure 3.13), to make the vessel structure more prominent as
shown in Figure 3.14.
Figure 3.13: Red channel of the iris image
Figure 3.14: Adaptive histogram equalisation iris image.
3.5. Feature Extraction Method
The feature extraction of a biometric recognition system involves building a reliable
mathematical model of the abstract sclera pattern to reliably identify persons for
authentication and identification purposes. Only a few works related to sclera biometric
were found in the literature, so analysing the performance of different features extraction
technique is very important. The following sub-section the various features that were used
for feature extraction are discussed.
3.5.1. Orientated Local Binary Pattern-based Feature Extraction
The local feature, such as LBP (Local Binary Patterns) proposed in Maenpaa and Pietikainen
[44], can be seen as a unifying approach to the traditionally statistical and structural
approaches to texture analysis. Applied to black and white images, an LBP can be
considered as the concatenation of the binary gradient directions. This contains micro-

Towards Multi-modal Sclera and Iris Biometric Recognition with Adaptive Liveness Detection
92 | P a g e
pattern information about the distribution of the edges, spots, and other local Figures in an
image which can be used as features for sclera recognition. The original LBP operator labels
the pixel of an image by thresholding the 3×3 neighbourhood of each pixel and
concatenating the results binomially to form a number. Assume that a given image is defined
as 𝐼 (𝑍) =𝐼 (𝑥, 𝑦). The LBP operator transforms the input image to (𝑍) as follows:
𝐿𝐵𝑃(𝑍𝑐) = ∑ 𝑠 (𝐼(𝑍𝑝) − 𝐼(𝑍𝑐))7𝑝=0 ∙ 2𝑝, (3.4)
Where 𝑠(𝑙) = {1 𝑙 ≥ 00 𝑙 < 0
is the unit step function and𝐼(𝑍𝑝) is the 8-neighborhood around
𝐼(𝑍𝑐). The feature representation method called Orientated Local Binary Pattern (OLBP)
proposed in Bu et al.[45] is an extension of the local binary pattern (LBP). OLBP can
represent more explicitly the orientation information of the contours which is an important
characteristic of the sclera. The 𝑂𝐿𝐵𝑃 of a given pixel 𝑍𝑐 is computed as follows:
1. Compute the sequence 𝑠 (𝐼(𝑍𝑝) − 𝐼(𝑍𝑐)) , 𝑝 = 0,… ,7.
2. Find the starting index (𝑆𝑡𝑎𝑟𝑡) and ending index (𝐸𝑛𝑑) of the longest
continuous 0 substring looking cyclically in the sequence of the previous step.
𝑆𝑡𝑎𝑟𝑡 =argmax( (StringLength)), End= Start + StringLength(StartOri)-1,
3. The index of the zeros substring centre is the OLBP, i.e.
𝑂𝐿𝐵𝑃(𝑍𝑐) = 𝑟𝑜𝑢𝑛𝑑((𝑆𝑡𝑎𝑟𝑡 + 𝐸𝑛𝑑) 2⁄ )𝑚𝑜𝑑8, (3.5)
Where round() rounds a number to the nearest integer, and the mod is the arithmetic
complement operation. An example of OLBP images of the vessel structure is presented in
Figure 3.15.
Figure. 3.15. OLBP of the vein images [263].
In order to make image translation independent, have registered the iris centre to the centre
of the image for each of the OLBP images produced in the earlier section. Registration is
performed by using the following equations.

Towards Multi-modal Sclera and Iris Biometric Recognition with Adaptive Liveness Detection
93 | P a g e
rowdiff = Imgx – Ix (3.6)
columndiff = Imgy − Iy (3. 7)
where (Ix, Iy) represents the iris centre location, (Imgx, Imgy) is the image centre, and
(rowdiff, columndiff)denotes the relative distance of the iris centre from the image centre.
Next, the relative amount of shift in the row direction and column direction was applied to
the OLBP image to register it against the image centre.
3.5.2. SIFT-Based Feature Extraction
The SIFT was originally proposed in Lowe [46] and was used for biometrics such as palm
print [47] and iris [48], among others. The method is divided into three main steps:
Key point location: A detailed model is fitted to determine the location and scale of each
candidate location at different scales. The candidate locations are potential interest points
that are invariant to scale and orientation.
Descriptors generation: Around each key-point, the local gradients are measured at the
selected scale. The orientation of the region around the key point was introduced to
increase the rotation invariance.
Matching: The descriptors of the query pattern are compared with each of the descriptors
extracted from the corresponding pattern in the gallery set. The score generation from the
candidate matches was based on the Euclidean distance between the descriptor vectors.
The final similarity score was the number of matches between query and gallery samples.
One of the advantages of this method is that it can be applied to both sclera and iris patterns
and therefore, their combination is simple and efficient.
3.5.3. Patch-Based Descriptor for Feature Extraction
In recent years, the local patch-based descriptors have emerged as a way to improve feature
extraction methods. It also worked efficiently in the presence of distortions such as of scale,
rotation, translation and occlusion. It's high discriminative capability and robustness
attracted researchers in the area of biometrics.
The variance of the position of eyelids produces occlusions which are difficult to manage
with traditional texture feature methods. The robustness against occlusion is one of the most
interesting factors in the application of sclera and iris recognition. The sclera and iris feature
extraction based on Dense Scale Invariant Feature Transform (D-SIFT), Dense Local Binary
Pattern (D-LBP) and Dense Local Directional Pattern (D-LDP) were performed here. The
various patch based descriptors are described below.

Towards Multi-modal Sclera and Iris Biometric Recognition with Adaptive Liveness Detection
94 | P a g e
3.5.3.1. Dense-SIFT
D-SIFT patches based descriptors for each training images are used to form a bag of the
feature. Here, a 128-dimensional based SIFT keypoint was extracted which stores the
gradients of 4×4 locations around a pixel in a histogram bin of 8 directions. The gradients
of each key point were aligned to the main direction, which makes D-SIFT a rotation
invariant descriptor. Different Gaussian scale spaces were considered for the computation
of vector which makes it scale invariant.
(a) (b)
(c) (d)
Figure 3.16: (a & b) The image is divided into a 22x22 location of a 9x9 patch size for the dense SIFT descriptor.
(c and d) SIFT descriptor with a number of 4 bins and 8 orientations [264].
The blue cross in the Figure.3.16 (c and d) represent the 16×16 SIFT patches and Figure.
3.16 shows a graphical representation of SIFT descriptors of 4 bins and 8 orientations.
Next, all these patch based descriptors were processed through a feature extraction chain by
K-means and Spatial Pyramid matching (SPM) [20]. In order to do so, the Bag-of-Features
(BoF) histograms are computed within each of the 2𝑖segments of each of the patches to
develop a k-means cluster, and all the histograms are finally merged to form a vector
representation of the image by using a spatial pyramid matching technique. The spatial
pyramid matching (SPM) is an extended version of the BoF model and is simple and
computationally efficient. In the BoF model, the spatial order of local descriptors is not
considered, so it restricts the descriptive power of the image representation. The limitation

Towards Multi-modal Sclera and Iris Biometric Recognition with Adaptive Liveness Detection
95 | P a g e
of the BoF is overridden in the SPM [20] approach, and is successfully applied on image
recognition tasks. An image is partitioned into 2𝑖x2𝑖segments where i= 0; 1; 2, each
represent the different resolutions.
SPM reduces to BoF when the value of the scale is i= 0. Here, the pyramid matching is
performed in a two-dimensional image space and uses a traditional clustering technique in
the feature space. The number of matches at level i was given by the histogram intersection
function:
I(gX;gY) = ∑ 𝑚𝑖𝑛(𝑔𝑋(𝑖); 𝑔𝑌 (𝑖))𝑛
𝑘=𝑖 (3.9)
Finally, the representation of the image for classification is the total number of matches from
all the histograms, which is given by the definition of a pyramid match kernel:
K(X; Y) = ∑ 0.5𝑖𝑙
𝑖=1(Ii –Ii-1) (3.10)
All total 21 (16+4+1) BoF histograms are computed from these three levels, and all the
histograms are concatenated to get the final vector representation of an image. The equation
below represents the pyramid match kernel for three scales:
KΔ = I2 +0.5(I1 - I2) +0.25(I0 - I1) (3.11)
3.5.3.2. Dense-LBP
Dense Multi-Block LBP (Dense-LBP) was proposed for feature extraction. They are based
on a spatial pyramidal architecture of multi-block LBP (MBLBP) histograms. More
precisely, the image 𝐼 to be features, of 𝑛𝑥 rows and 𝑛𝑦 columns is divided, at each level
𝑙 = 1,2, … , 𝐿 into 𝑁𝑙𝑥 by 𝑁𝑙
𝑦 patches of size ℎ𝑙 by 𝑤𝑙 uniformly distributed in the image.
For each patch the histogram of MBLBP descriptors at 𝑠 different scales are worked out.
The scale is applied to every 9 blocks their LBP is computed. The final feature is calculated
by concatinating the histogram of all the blocks, so it will be ∑ 256𝑠𝑁𝑙𝑥𝑁𝑙
𝑦𝐿𝑙=1 dimensional.
In this scenario as in Figure 3.17, it is defined heuristically 𝐿 = 2 and 𝑠 = 4. At first level,
𝑁1𝑥 = 1, 𝑁1
𝑦= 1, ℎ1 = 𝑛𝑥 and 𝑤1 = 𝑛𝑦, at the second level 𝑁2
𝑥 = 3, 𝑁2𝑦= 3, ℎ2 = 𝑛𝑥/2
and 𝑤2 = 𝑛𝑥/2, so the 9 patches are 25% overlapped. Then, the feature vector dimension
is 10240.

Towards Multi-modal Sclera and Iris Biometric Recognition with Adaptive Liveness Detection
96 | P a g e
(a) (b)
Figure 3.17: (a) Patch division of the image for D-LBP, (b) Histogram of LBP [265].
3.5.3.3. Dense LDP
The Local Directional Pattern (LDP) proposed in Kabir et al, [49], computes the edge
response values in different directions and uses these to encode the image texture.
Considering the relative edge response values in different directions by using eight filters
(shown in Figure 3.18), the LDP feature encodes the local neighbourhood property of image
pixels with a binary bit sequence. Feature extraction based on the Dense Local Directional
Pattern (D-LDP) was performed by employing Multi-scale of a higher order of the LDP. Ten
different spatial planes are considered for featuring. Each histogram distribution of bin size
of 256 is calculated for each plane, order and spatial plane and concatenated to get the total
feature of dimension 30720. This can be calculated as: FD= Ns * No* 256* Nsp
Where, FD= feature dimension; Ns= number of scale, No= number of order, Nsp= number
of spatial plane. The Spatial plane division of the image which divides the image into dense
sampling plane is explained in the following Figure 7. The various level of the spatial division
incorporates the local and the global feature of the traits.
Figure 3.18: Filters used for LDP [49].

Towards Multi-modal Sclera and Iris Biometric Recognition with Adaptive Liveness Detection
97 | P a g e
The blue cross in Figure 3.19 (a) represents the 22×22 D-LDP patches and Figure 3.19(b)
shows a histogram representation of D-LDP descriptors of 3 different scales. Histogram of
the 3 different histogram blocks is given below in Figure 3.19.
Figure 3.19: Patch division of the image to calculate D-LDP [267]
3.6. Classification
Biometric algorithms generally aim to provide a reasonable binary answer for all possible
inputs and so classification plays an important role. Therefore the techniques used in the
proposed method are highlighted here in the next sub-sections.
3.6.1. Template-based matching Based Classification
Template-based matching was used for classification. The gallery of query image was
overlapped over the template of each class. The OLBP regions were binaries to get a binary
template. Subsequently, identification was performed by template matching over the OLBP
region by computing the Hamming Distance between the query image and templates, the
matching which creates the minimum Hamming Distance is considered as the class of the
query image. The Hamming Distance was calculated as below.
HD = ∑(template ⊕query)⋂(mask ⋃ query mask )
template − ~( mask ⋃ query mask ) (3.12)
Mask and query mask were the masks of the template and query image. The symbol ⊕
signifies the XOR operation, the symbol ⋂ signifies the AND operation, the symbol
⋃ signifies the OR operation, - signifies subtraction operator and the symbol ~ signifies the
NOT operation.
3.6.2. SVM-based Classification
The Support Vector Machines (SVMs) [38] are used for classification of the local
descriptors. The SVMs are a popular supervised machine learning technique which performs
implicit mapping into a higher dimensional feature space. This is also known as a kernel
trick. After the mapping is completed it finds a linear separating hyperplane with a maximal
margin to separate data from this higher dimensional space. The Library for Support Vector
Machines (LIBSVM), was used for the SVM implementation.
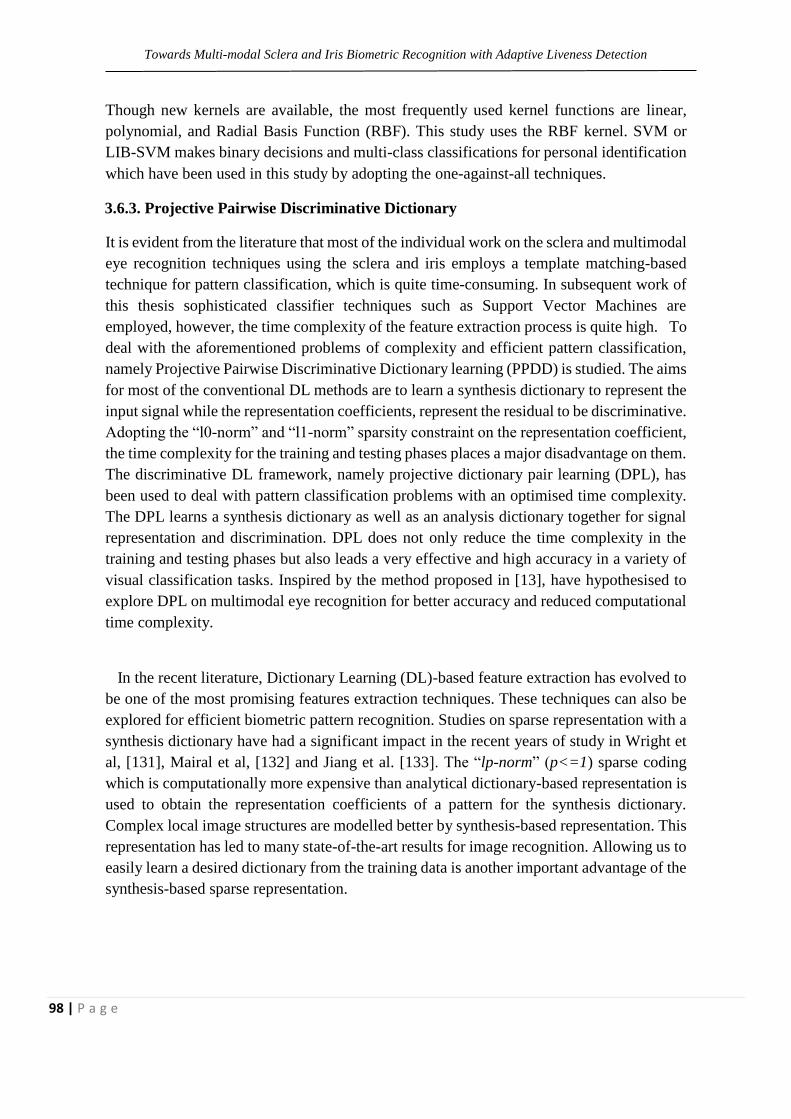
Towards Multi-modal Sclera and Iris Biometric Recognition with Adaptive Liveness Detection
98 | P a g e
Though new kernels are available, the most frequently used kernel functions are linear,
polynomial, and Radial Basis Function (RBF). This study uses the RBF kernel. SVM or
LIB-SVM makes binary decisions and multi-class classifications for personal identification
which have been used in this study by adopting the one-against-all techniques.
3.6.3. Projective Pairwise Discriminative Dictionary
It is evident from the literature that most of the individual work on the sclera and multimodal
eye recognition techniques using the sclera and iris employs a template matching-based
technique for pattern classification, which is quite time-consuming. In subsequent work of
this thesis sophisticated classifier techniques such as Support Vector Machines are
employed, however, the time complexity of the feature extraction process is quite high. To
deal with the aforementioned problems of complexity and efficient pattern classification,
namely Projective Pairwise Discriminative Dictionary learning (PPDD) is studied. The aims
for most of the conventional DL methods are to learn a synthesis dictionary to represent the
input signal while the representation coefficients, represent the residual to be discriminative.
Adopting the “l0-norm” and “l1-norm” sparsity constraint on the representation coefficient,
the time complexity for the training and testing phases places a major disadvantage on them.
The discriminative DL framework, namely projective dictionary pair learning (DPL), has
been used to deal with pattern classification problems with an optimised time complexity.
The DPL learns a synthesis dictionary as well as an analysis dictionary together for signal
representation and discrimination. DPL does not only reduce the time complexity in the
training and testing phases but also leads a very effective and high accuracy in a variety of
visual classification tasks. Inspired by the method proposed in [13], have hypothesised to
explore DPL on multimodal eye recognition for better accuracy and reduced computational
time complexity.
In the recent literature, Dictionary Learning (DL)-based feature extraction has evolved to
be one of the most promising features extraction techniques. These techniques can also be
explored for efficient biometric pattern recognition. Studies on sparse representation with a
synthesis dictionary have had a significant impact in the recent years of study in Wright et
al, [131], Mairal et al, [132] and Jiang et al. [133]. The “lp-norm” (p<=1) sparse coding
which is computationally more expensive than analytical dictionary-based representation is
used to obtain the representation coefficients of a pattern for the synthesis dictionary.
Complex local image structures are modelled better by synthesis-based representation. This
representation has led to many state-of-the-art results for image recognition. Allowing us to
easily learn a desired dictionary from the training data is another important advantage of the
synthesis-based sparse representation.

Towards Multi-modal Sclera and Iris Biometric Recognition with Adaptive Liveness Detection
99 | P a g e
The seminal work of KSVD Aharon et al. [134] tells us that an over-complete dictionary
can be learned from example natural images, and it can lead to much better image
reconstruction results than the analytically designed off-the-shelf dictionaries. Many
dictionary learning (DL) methods have been proposed and state-of-the-art performance in
the image recognition task has been achieved by utilising KSVD. Regardless of these
advantages, this synthesis DL poses high time complexity due to the use of l0 or l1-norm
sparsity constraints. Therefore, a blend of the synthesis and analytical-based DL can be
assumed to overcome the aforementioned pitfall, preserving the pattern recognition
accuracy. Because of this, in this work, aim to explore such a dictionary-based learning for
a multimodal eye pattern recognition task. Hypothesise to explore a projective dictionary
pair learning for a biometric pattern recognition task. In the next subsection, discriminative
dictionary learning, the projective dictionary pair learning model and the classification
scheme is explained.
Discriminative dictionary learning- Let X= [X1p, X2p,….., XKp] be the training samples
set having p dimensionality from k classes. Where, Xk is a p-by-n matrix or a training sample
set of class k, considering n is the number of samples of each class. An effective data
representation model from X is learned by the discriminative DL methods for the
classification tasks by exploiting the class label information in the training phase. The
discriminative DL methods can be expressed as follows:
𝑚𝑖𝑛𝐷,𝐴 || 𝑋 − 𝐷𝐴 ||𝐹 2 +𝜆 || 𝐴 ||𝑝 + 𝜓(𝐷, 𝐴, 𝑌), (3.13)
Here Y represents the class label matrix of samples in X, λ is a scalar constant (>=0), D is
the synthesis dictionary that has to be learned and A is the coding coefficient matrix of X on
D. Therefore in the training model, ||𝑋 − 𝐷𝐴||𝐹2ensures representation efficiency of D, ||𝐴||𝑝
represents the ‘lp-norm” regularise on A and 𝜓(𝐷, 𝐴, 𝑌) represents the discriminative
function. Discriminative Learning works in two ways: some of them used in Ramirez et al,
[136], Yang et al, [137] and Wang et al, [138] learn a structured dictionary for the
discrimination of classes, whereas others in Mairal et al, [132], Jiang et al. [133], Mairal et
al, [135] shared a dictionary for all classes and a classifier on the coding coefficients
simultaneously. The “l0-norm” and “l1-norm” sparsity are regularise on the coding
coefficients and are applied by all the DL methods. So there is some inefficiency in the
training phase and the consequent testing phase.
The formula in (1) is for the conventional DL model. It learns a discriminative synthesis
dictionary. In the DPL method, have used the DL which was extended to a novel DPL model
that learns both synthesis and analysis dictionaries. It shows time computational efficiency
as “l0-norm” or “l1-norm” and the sparsity regularise is not required for the coding
coefficients rather it can be explicitly learned by linear projection.

Towards Multi-modal Sclera and Iris Biometric Recognition with Adaptive Liveness Detection
100 | P a g e
Projective dictionary pair learning model- Learning a synthesis dictionary D to sparsely
represent the signal X is the main objective of the conventional discriminative model in
equation (3.14). To resolve the code A, the costly “l1-norm” sparse coding process is
required. The representation of X would be very efficient if an analysis dictionary (P) can
found which could satisfy A=PX. To do this, an analysis dictionary is learnt with the
synthesis dictionary D and the model obtained can be formulated as follows,
{𝑃∗, 𝐷∗} = 𝑎𝑟𝑔 𝑃,𝐷 𝑚𝑖𝑛|| 𝑋 − 𝐷𝑃𝑋 ||𝐹
2 + 𝜓(𝐷, 𝑃, 𝑋, 𝑌) (3.14)
Here to analytically code X, the analysis dictionary P is implemented and the synthesis
dictionary D is used to reconstruct X. Where, 𝜓(𝐷, 𝑃, 𝑋, 𝑌) is some discrimination function.
So the structured synthesis dictionary D= [D1, D2,…, DK] and a structured analysis
dictionary P=[P1,P2,…, PK] is learned. Here Dk and Pk take part to produce a sub-
dictionary pair corresponding to class k. The efficiency of the DPL model depends on the
design of the discrimination function. Now the sparse subspace clustering [139] has proved
that if signals satisfy certain incoherence conditions then the sample can be represented by
its corresponding dictionary. It is desired that Pk should project the samples from class i
(where i not equal to k) towards a null space with the structured analysis dictionary P. It can
be formulated as follows,
𝑃𝑘𝑋𝑖 ≈ 0, ∀𝑘 ≠ 𝑖. (3.15)
Similarly, the structured synthesis dictionary D can reconstruct the data matrix X. The data
matrix Xk can be reconstructed efficiently by the sub-directory Dk from the projective code
matrix PkXk. Hence the dictionary pair is used to minimise the reconstruction error. So,
𝑚𝑖𝑛𝑃,𝐷 ∑ ||𝑋𝑘 − 𝐷𝑘𝑃𝑘𝑋𝑘||𝐹2𝑘
𝑘=1 (3.16)
and according to the above discussion, the DPL model can be formulated as,
{𝑃∗, 𝐷∗} = 𝑎𝑟𝑔 𝑃,𝐷 𝑚𝑖𝑛∑||𝑋𝑘 − 𝐷𝑘𝑃𝑘𝑋𝑘||𝐹
2𝑘
𝑘=1
+ 𝜆 ||𝑃𝑘𝑋𝑘||𝐹
2
,
𝑠. 𝑡. || 𝑑𝑖 ||22 ≤ 1. (3.17)

Towards Multi-modal Sclera and Iris Biometric Recognition with Adaptive Liveness Detection
101 | P a g e
Here, 𝑋𝑘 is the complement of Xk; in the whole training set X; the ith atom of synthesis
dictionary D is di whose energy is constrained to avoid the trivial solution Pk=0 to make
the DPL stable. λ is a scalar constant which is greater than 0.
It is argued that sparse coding may not be crucial in classification [140, 141]. However,
the DPL model is much faster, and it has very competitive classification performance.
Therefore, for the classification scheme, the following approach is used.
For optimisation purposes, the following methodology proposed in Gu et al, [142] is used.
The objective function in (3.18) is generally non-convex. A variable matrix A is introduced
and relaxed (3.18) to the following problem:
{𝑃∗, 𝐴, 𝐷∗} = 𝑎𝑟𝑔 𝑃,𝐴,𝐷 𝑚𝑖𝑛 ∑||𝑋𝑘 − 𝐷𝑘𝐴𝑘||𝐹
2𝑘
𝑘=1
= ||𝑃𝑘𝑋𝑘 − 𝐴𝑘||𝐹2+ 𝜆 ||𝑃𝑘𝑋𝑘||
𝐹
2
,
𝑠. 𝑡. || 𝑑𝑖 ||22 ≤ 1. (3.18)
where τ is a scalar constant. All terms in the above objective function are characterised by
the Frobenius norm, and (6) can be easily solved. The analysis dictionary P and synthesis
dictionary D is initialized as random matrices with the unit Frobenius norm, and then
alternatively update A and {D, P}. The minimization can be alternated between the following
two steps.
Fix D and P, update A
𝐴∗ = 𝑎𝑟𝑔 𝐴 𝑚𝑖𝑛 ∑ ||𝑋𝑘 − 𝐷𝑘𝐴𝑘||𝐹
2𝑘𝑘=1 + τ ||𝑃𝑘𝑋𝑘 − 𝐴𝑘||𝐹
2 (3.19)
This is a standard least squares problem and has the closed-form solution:
𝐴𝑘∗ = (𝐷𝑘
𝑇𝐷𝑘 + τI)−1(τ𝑃𝑘𝑋𝑘 + 𝐷𝑘
𝑇𝑋𝑘) (3.20)
Fix A, update D and P:
{𝑃∗ = 𝑎𝑟𝑔 𝑝
𝑚𝑖𝑛 ∑ ||𝑃𝑘𝑋𝑘 − 𝐴𝑘||𝐹2𝑘
𝑘=1 + 𝜆 ||𝑃𝑘𝑋𝑘||𝐹
2
𝐷∗ = 𝑎𝑟𝑔 𝐷 𝑚𝑖𝑛 ∑ ||𝑋𝑘 − 𝐷𝑘𝐴𝑘||𝐹
2𝑘𝑘=1
(3.21)
𝑠. 𝑡. || 𝑑𝑖 ||22 ≤ 1.

Towards Multi-modal Sclera and Iris Biometric Recognition with Adaptive Liveness Detection
102 | P a g e
The closed-form solutions of P can be obtained as:
𝑃𝑘∗ = τ𝐴𝑘𝑋𝑘
𝑇(τ𝑋𝑘𝑋𝑖𝑇 + 𝜆𝑋𝑘𝑋𝑘
𝑇 + γ𝐼) (3.22)
where,
γ = 10e −4 is a small number.
The D problem can be optimised by introducing a variable S:
𝑚𝑖𝑛𝐷,𝑠 ∑ ||𝑋𝑘 − 𝐷𝑘𝐴𝑘||𝐹2𝑘
𝑘=1 (3.23)
𝑠. 𝑡. 𝐷 = 𝑆, || 𝑆𝑖 ||22 ≤ 1.
The optimal solution of (3.25) can be obtained by the ADMM algorithm:
{
𝐷(𝑟+1) = 𝑎𝑟𝑔 𝐷
𝑚𝑖𝑛 ∑ ||𝑋𝑘 − 𝐷𝑘𝐴𝑘||𝐹2𝑘
𝑘=1 +
𝑝 ||𝐷𝑘 − 𝑆𝑘(𝑟) + 𝑇𝑘
(𝑟)||𝐹
2
𝑆(𝑟+1) = 𝑎𝑟𝑔 𝑆 𝑚𝑖𝑛 ∑ 𝑝 ||𝐷𝑘
(𝑟+1) − 𝑆𝑘(𝑟) + 𝑇𝑘
(𝑟)||𝐹
2𝑘𝑘=1
𝑠. 𝑡. 𝐷 = || 𝑆𝑖 ||22 ≤ 1
𝑇(𝑟+1) = 𝑇(𝑟) + 𝐷𝑘(𝑟+1) − 𝑆𝑘
(𝑟+1),
(3.25)
update 𝑝 if appropriate
In each step of optimisation, closed-form solutions for variables A and P, and the ADMM-
based optimisation of D converges rapidly. The training of the proposed DPL model is much
faster than most previous discriminative DL methods. When the difference between the
energy in two adjacent iterations is less than 0.01, the iteration stops. The analysis dictionary
P and the synthesis dictionary D are then output for classification. One can see that the first
sub-objective function in (3.23) is a discriminative analysis dictionary learner, focusing on
promoting the discriminative power of P; the second sub-objective function in (3.23) is a
representative synthesis dictionary learner, aiming to minimize the reconstruction error of
the input signal with the coding coefficients generated by the analysis dictionary P. When

Towards Multi-modal Sclera and Iris Biometric Recognition with Adaptive Liveness Detection
103 | P a g e
the minimization process converges, a balance between the discrimination and
representation power of the model can be achieved.
Classification scheme- Classification is performed based on the residual value over the
samples for a class. Pk(*) is the analysis sub-directory trained to produce small coefficients
for samples from classes other than k while the Dk(*) is the synthesis sub-directory trained
to reconstruct the samples of class k. Then the residual ||𝑋𝑘 − 𝐷𝑘∗𝑃𝑘
∗𝑋𝑘||𝐹2 will be smaller than
the residual ||𝑋𝑖 − 𝐷𝑘∗𝑃𝑘
∗𝑋𝑖||𝐹2 when 𝑖 ≠ 𝑘. In the testing phase, a query sample y of an
unknown class is considered a query image and its residual are calculated for every class.
The class having the minimum residual is the class of the testing sample. The testing is
formulated as follows,
𝑖𝑑𝑒𝑛𝑡𝑖𝑡𝑦(𝑦) = 𝑎𝑟𝑔 𝑚𝑖𝑛 𝑖|| 𝑦 − 𝐷𝑖𝑃𝑖𝑦 ||2 (3.26)
Here Di and Pi are the synthesis sub-directory and the analysis sub-directory respectively
for class i. So according to (3.26), a sample from saying class i, would be the class of the
sample y if the minimum residual is obtained from (3.26) for class i. As sclera literature is
very new, several segmentation techniques have been employed to in this proposed
approach to analyse the most Table and efficient segmentation technique, image
enhancement technique, feature representation technique and classification technique.
Proposed methodology also focuses on the combination of iris feature with sclera feature to
build a robust multi-modal eye recognition system. The experimental result in support for
the proposed technique is in the next subsection.
3.7. Data Set
In order to evaluate the performance of the proposed method, a public dataset (UBIRIS) and
an in-house dataset were employed. The descriptions of the above-mentioned datasets are
given in the sub-sections below.
3.7.1. UBIRIS
The UBIRIS version 1 is a public database [21] that was utilised in this experiment. This
database consists of 1877 RGB images taken in two distinct sessions (1205 images in
session 1 and 672 images in session 2) from 241 identities where each channel of RGB
colour space is represented in grey-scale. The database contains blurred images and images
with closed eyes. Both high-resolution images (800 × 600) and low-resolution images (200
× 150) are provided in the database and all the images are in JPEG format.
Different quality images have been used in the experiments, in which some of the sample
images are shown in Figure 3.20. Some of them are not occluded having a good quality of

Towards Multi-modal Sclera and Iris Biometric Recognition with Adaptive Liveness Detection
104 | P a g e
sclera regions visible, some of them are of medium quality and the third types were of poor
quality with respect to sclera region visibility. In the experiments some closed eye images
were also used, examples of such images are provided in Figure 3.21.
The first session images were taken in a dark room so that the noise factors such as
reflection, luminosity, and contrast were minimised.
In the second session, the images were taken under natural illumination conditions with
spontaneous user participation in order to introduce natural luminosity and add more noise
factors than the first session.
(a) (b) (c)
(d) (e) (f)
Figure 3.20: Different quality of eye images used in the experiment (a) is the type of best quality image of
Session 1, (b) ) is the type of medium quality of Session 1 (c) is the type of Poor quality of Session 1, (d) is
the type of below average quality image of Session 2, (e) is the type of average quality of Session 2 (f) is the
type of best quality in of Session 2.
The database contains blurred images and occluded images of eyes as shown in Figure 3.21.
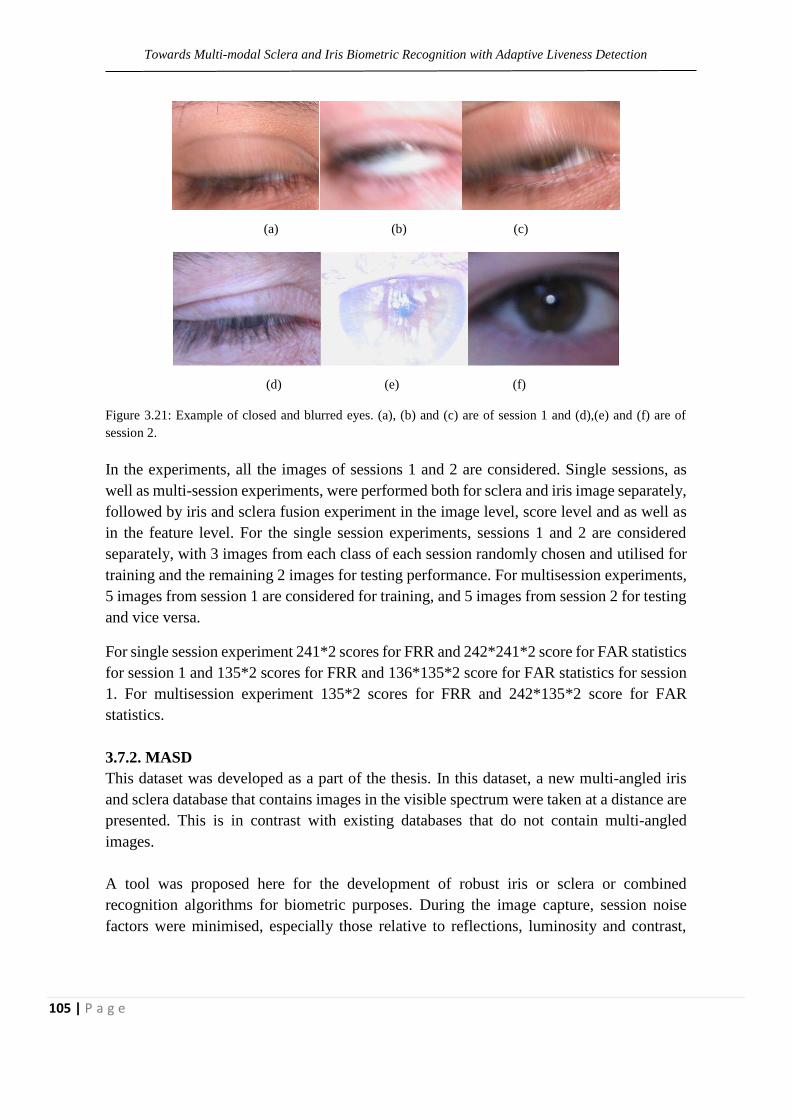
Towards Multi-modal Sclera and Iris Biometric Recognition with Adaptive Liveness Detection
105 | P a g e
(a) (b) (c)
(d) (e) (f)
Figure 3.21: Example of closed and blurred eyes. (a), (b) and (c) are of session 1 and (d),(e) and (f) are of
session 2.
In the experiments, all the images of sessions 1 and 2 are considered. Single sessions, as
well as multi-session experiments, were performed both for sclera and iris image separately,
followed by iris and sclera fusion experiment in the image level, score level and as well as
in the feature level. For the single session experiments, sessions 1 and 2 are considered
separately, with 3 images from each class of each session randomly chosen and utilised for
training and the remaining 2 images for testing performance. For multisession experiments,
5 images from session 1 are considered for training, and 5 images from session 2 for testing
and vice versa.
For single session experiment 241*2 scores for FRR and 242*241*2 score for FAR statistics
for session 1 and 135*2 scores for FRR and 136*135*2 score for FAR statistics for session
1. For multisession experiment 135*2 scores for FRR and 242*135*2 score for FAR
statistics.
3.7.2. MASD
This dataset was developed as a part of the thesis. In this dataset, a new multi-angled iris
and sclera database that contains images in the visible spectrum were taken at a distance are
presented. This is in contrast with existing databases that do not contain multi-angled
images.
A tool was proposed here for the development of robust iris or sclera or combined
recognition algorithms for biometric purposes. During the image capture, session noise
factors were minimised, especially those relative to reflections, luminosity and contrast,

Towards Multi-modal Sclera and Iris Biometric Recognition with Adaptive Liveness Detection
106 | P a g e
having installed a framework. A diagrammatic representation of the framework of the image
capturing technique is given below in Figure 3.22.
Figure 3.22: A framework of the image capturing technique [266].
The images are acquired by a digital camera in the visible spectrum at a distance of about
2 meters from the individual as shown in Figure 3.23.
Figure 3.23: Image captured at distance [266].
At first, the image is divided vertically into two halves as shown in Figure 3.24.
(a) (b)
Figure 3.24: Two halves of the face image [266].
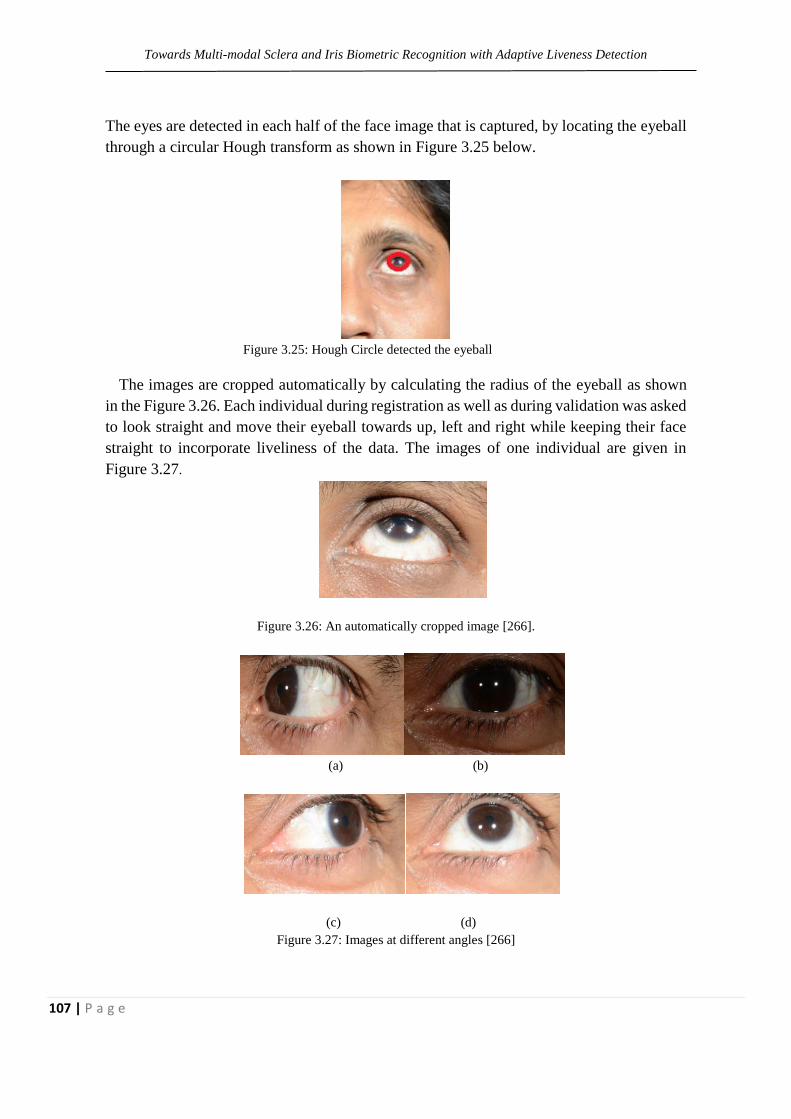
Towards Multi-modal Sclera and Iris Biometric Recognition with Adaptive Liveness Detection
107 | P a g e
The eyes are detected in each half of the face image that is captured, by locating the eyeball
through a circular Hough transform as shown in Figure 3.25 below.
Figure 3.25: Hough Circle detected the eyeball
The images are cropped automatically by calculating the radius of the eyeball as shown
in the Figure 3.26. Each individual during registration as well as during validation was asked
to look straight and move their eyeball towards up, left and right while keeping their face
straight to incorporate liveliness of the data. The images of one individual are given in
Figure 3.27.
Figure 3.26: An automatically cropped image [266].
(a) (b)
(c) (d)
Figure 3.27: Images at different angles [266]

Towards Multi-modal Sclera and Iris Biometric Recognition with Adaptive Liveness Detection
108 | P a g e
Few samples of images from the proposed dataset are given below in Figure 3.28.
Figure 3.28: Few samples of images from the proposed dataset [266].
The proposed multi-angled dataset consists of 5248 RGB images taken in one session from
82 individuals where each channel of RGB colour space is represented in grey-scale. The
individuals were comprised of both male and female, with different ages and different
colours were considered, a few of them were wearing contact lenses and images were taken
at the different time of day. The database contains images with occluded eyes, closed eyes
and blurred eye images, images with high resolution are provided in the database. All images
are in JPEG format. Here for each individual image in four multi-angle were considered.
For each angle, eight images were acquired. For each individual both left and right eye was
captured. Different lighting conditions were considered during the image accusing. A
NIKON D 800 camera and 28300 lenses were used for image acquisition. Different quality
images were used here and some of the sample images are shown below in Figure 3.29.
(a) (b) (c) (d)
Figure 3.29: Different quality of eye images used in the experiments [266].
Some of them are not occluded having a good quality of sclera regions visible, some of them
are of medium quality and the third type was of poor quality with respect to sclera region
visibility. In the experiments some closed eye images were also used, examples of such
images are provided below in Figure 3.30. The images were captured in an indoor lighting

Towards Multi-modal Sclera and Iris Biometric Recognition with Adaptive Liveness Detection
109 | P a g e
condition so noise factors such as reflection, luminosity, and contrast were minimised. The
database contains blurred images and images with blinking eyes as shown in Figure 3.30.
In the experiments, all the images were considered for experimentation. For the experiment,
4 images from each angle, each class are randomly chosen and utilised for training and the
remaining 4 set images for testing performance. So the FRR statistics is 164*16 and FAR
of 164* 163 * 16. In order to analyse the effectiveness of the automatic segmentation techniques,
ground truth or the manually segmented images of the dataset were designed. Here for each angle
for each individual, 4 images were used for the ground truth preparation out of the 8 images for
each angle present in the dataset. Few sample images of the manual segmentation are given in
Figure 3.31. A set of protocols that were followed during the data collection procedure is as follows.
(a) (b)
(a) (e)
(e) (f)
Figure 3.30: Examples of closed and blurred eyes [266].
The images were acquired in the visible wavelength.
Multi-angled (each individual looking left, right up, down and straight keeping their
face towards the camera) eye images were captured, for each angle 8 instances were
acquired.
People were sitting in front of the camera while the images were captured.

Towards Multi-modal Sclera and Iris Biometric Recognition with Adaptive Liveness Detection
110 | P a g e
Between each camera sort, people walked for 2 to 3 meters and came back for next
sort. The manual shot was taken for each image.
The dataset was prepared from all ages, sexes, no glasses, no lenses, with lenses and
also people with possible eye illness. All images were captured in an indoor session
in room light (tungsten lights).
The images were captured at different times of day early in the day and late in the
day.
A quality estimation program in Matlab was delivered in order to guarantee similar
images from all the locations.
Camera height position was fixed to 1m above the floor. Both left and right eye images
of each individual were captured.
(a) (b)
(c ) (d)
(e) (f)
Figure 3.31: Different quality of ground truth and the original images.

Towards Multi-modal Sclera and Iris Biometric Recognition with Adaptive Liveness Detection
111 | P a g e
3.8. Results
The results of proposed methodology on described datasets are discussed in this subsection.
3.8.1. Sclera Enhancement
In the experiments, it has been found that in the green channel of the images, the sclera
vessel patterns are most prominent it can be found in the Figure 3.11. Although it can be
dataset depended particular cause for it needs to be investigated. After that, adaptive
histogram equalisation was performed with a tiled window size of 42 x42 at a clip limit of
0.01, with a full range and distribution exponential to get the best result.
Further, a bank of Haar wavelet was used to enhance the vessel patterns. High pass
decomposition with a cut off range of -0.7, 0.65, and 0.55 was used with a window size of
3x3. In another process of sclera enhancement, the Discrete Meyer wavelet was used to
enhance the vessel patterns. Low pass reconstruction with a cut-off value of -0.9 * 𝑒10and a
window size of 3x3. Next, the same adaptive histogram equalisation with a tiled window
size of 42x42 at a clip limit of 0.01, with full range and distribution exponential was imposed
on the filtered image.
3.8.2. Iris Enhancement
In the experiments, it has been found that in the red channel of the images, the iris patterns
are most prominent, it can be found in the Figure 3.11. Although it can be dataset depended
particular cause for it needs to be investigated. After that, adaptive histogram equalisation
was performed with a tiled window size of 2x2 at a clip limit of 0.01, with a full range and
distribution exponential to get the best result. Further Haar filer was employed as
investigated in [289], but it did not worked well.
3.8.3. Feature Extraction Experiment
The results of various feature extraction techniques used are discussed in this subsection.
3.8.3.1. Sclera Feature Extraction Experiment
The various experimental data related to sclera feature extraction are highlighted in the
following sub-subsection below.
SIFT- Here a subset of UBIRIS version 1 is used, first 41 users from dataset from session
one was employed here. So the FRR statistics is 41*2 and FAR of 41* 40* 2. The first
experiments involved the study of the performance of the interior and exterior sclera pattern.
The evaluation includes both manual and automatic segmentation of the sclera based on

Towards Multi-modal Sclera and Iris Biometric Recognition with Adaptive Liveness Detection
112 | P a g e
SIFT features extracted from the equalised image, as shown in Table 3.1. We can find the
effect of wrong segmentation on performance as also addressed in [288].
Table 3.1. EERs (%) obtained using SIFT over sclera and iris patterns.
Segmentation
Manual Automatic
Sclera
Exterior
10.1% 17.5%
Sclera
Interior
8.37% 22.1%
The interior sclera outperforms the exterior, and the gap between automatic and manual
segmentation is significant. The difference between the interior and exterior sclera can be
justified due to the higher presence of vein pattern in the former. In fact, some users do not
show any vein pattern on the exterior sclera region.
In terms, if the performance of the sclera pattern it is important to emphasise the impact
of the segmentation on the performance. The experiments performed show a gap of around
7% -10% of EER between manual and automatic segmentation. The influence of
segmentation in the performance was evident. Moreover, an incorrect segmentation can
involve not only in reducing the pattern available but also it can introduce other patterns
such as eyelashes and eyelids (see Figure. 3.32).
(a) (b) (c)
Figure. 3.32. (a) Mask applied without dilatation, mask applied with dilatation using a structural element of
50×50 (b) and 100×100 pixels (c).
The next Table shows the performance of the sclera when morphological dilatation is
applied to the binary mask obtained during the segmentation.

Towards Multi-modal Sclera and Iris Biometric Recognition with Adaptive Liveness Detection
113 | P a g e
Table 3.2. EERs (%) performance for different segmentation masks
Segmentation
Manual Automatic
Dilatation 50×50 100×100 50×50 100×100
Sclera Exterior 2.29% 1.56% 5.69% 1.82%
Sclera Interior 4.82% 2.02% 10.4% 7.55%
The Table shows an important improvement (EER less than 2%) on the performance when
dilatation was applied to the segmentation masks. The dilatation includes features obtained
from patterns such as eyelashes and eyelids.
OLBP-Here a subset of UBIRIS version 1 is used: first 241 users from the dataset from
session one was employed here. So the FRR statistics is 241*2 and FAR of 241* 240* 2.
Among this, 54 images were discarded because of failures during acquiring. The
experiments have been conducted to work out the sclera identification capability of the
proposed feature and classifier. As it is a classical identification or verification problem, the
results will be given in terms of Cumulative Matching Curves (CMC) and Equal Error Rate
(EER) curve. The CMC & EER curve is displayed in Figure 3.33. Along the X-axis is the
rank of the CMC and along the Y- axis the identification rate. Based on the interpretation of
the graph it can be noted that faithful accuracy was achieved. Along the X-axis is the
matching score and along the Y- axis the density.
Figure 3.33.CMC curve for recognition & EER curve for recognition for MASD
The closed and occluded eye images were discarded in this experiments for both UBIRIS
version 1 and MASD database. Table 3.3 provides the numerical data of Equal Error Rate
and the Cumulative Matching Curves of the verification experiment.

Towards Multi-modal Sclera and Iris Biometric Recognition with Adaptive Liveness Detection
114 | P a g e
Table 3.3: Equal Error Rate and the Cumulative Matching of the verification
Dataset EER (%) Cumulative
Matching
UBIRIS version 1 0.52 99.48%
MASD 1.78 89.3%
Patch-Based Local Descriptors and PPDD- In this experiment, all the images from the
UBIRIS dataset were used. For feature extraction, a few local features such as Dense SIFT
(Scale Invariant Feature Transform), Dense LBP (Local Binary Pattern), and dense LDP
(Local Directional Pattern) and PPDD are employed. The results in Table 3.4 reflect that
PPDD produces the best results. As these four features produced better results, so also tested
them for all multisession and single session experiments and further for fusion level
experiments. Multisession 2_1 signifies images session 2 as testing and images from session
1 as testing. Multisession 1_2 signifies images session 1 as testing and images from session
2 as testing. The EER achieved in multisession experiments were somewhat higher than for
the single session experiment. The reason behind the fact may be the change in the
illumination and other acquiring artefacts. It can also be observed that result of Multisession
1_2 results is better than for Multisession 2_1, the reason might be due to acquiring artefact
(session 1 acquired in a controlled environment, session 2 acquired in an uncontrolled
environment) and another reason might be the availability of the trait acquired.
Table 3.4: Result of sclera feature extraction with different descriptors
Feature
Equal Error Rate (%)
Multisession
2_1
Multisession
1_2 Single session 1 Single session 2
UBIRIS
version 1 Dense SIFT
5.63 4.05 0.66 0.71
Dense LBP 6.02 5.05 0.71 0.83
Dense LDP 4.34 3.95 0.42 0.51
PPDD 3.29 2.01 0.33 0.41
MASD Dense SIFT
NA NA 1.66 NA
Dense LBP NA NA 1.50 NA
Dense LDP NA NA 1.49 NA
PPDD NA NA 1.23 NA

Towards Multi-modal Sclera and Iris Biometric Recognition with Adaptive Liveness Detection
115 | P a g e
3.8.3.2. Iris Feature Extraction Experiment
For iris recognition also various features have been used, the result of the recognition and
verification are explained below.
SIFT-The recognition performance of segmented iris based on SIFT features extracted from
the equalised image was 0.24% of EER. In the experiment a subset of UBIRIS version 1 is
used, the first 41 users from the dataset from session one were employed here.
Patch-Based Local Descriptors and PPDD- For iris feature extraction, a few local features
such as Dense SIFT, Denes LBP, Dense LDP and PPDD are employed. The results in Table
3.5 reflect that PPDD produces the best results. In UBIRIS version 1 the in general iris trait
attended better accuracy, however in MASD performance was lower. The rest of the pattern
of the results remain the same as in Table 3.4.
Table 3.5: Result of iris feature extraction with different descriptors
3.8.3.3. Iris and Sclera fusion feature selection experiment
Image Level Fusion- The superior performance of the iris is well known, so the next
experiment intends to ascertain the potential of the sclera biometric to further improve the
iris approach. The different nature of the iris and sclera patterns advises exploring different
combination schemes. Table 3.6 shows the performance with a combination at the image
level. The combination is done extracting the SIFT descriptors from each region (sclera or
iris) and matching every descriptor regardless of which region it belongs to.
Feature
Equal Error Rate (%)
Multisession 2_1 Multisession 1_2 Single session 1 Single session 2
UBIRIS
version 1
Dense SIFT
2..50 2.42 0.41 0.71
Dense LBP
1.79 1.16 0.39 0.63
Dense LDP
1.67 1.09 0.36 0.43
PPDD 1.21 1.05 0.31 0.37
MASD Dense SIFT
NA NA 1.78 NA
Dense LBP NA NA 1.55 NA
Dense LDP NA NA 1.59 NA
PPDD NA NA 1.48 NA

Towards Multi-modal Sclera and Iris Biometric Recognition with Adaptive Liveness Detection
116 | P a g e
Table 3.6. EERs (%) obtained using SIFT and a combination at image level of sclera and iris patterns.
Image Combination
Segmentation EER (%)
Manual Automatic
Sclera Ext. + Int. 5.38% 13.84%
Sclera Ext. + Iris 0.26% 0.27%
Sclera Int. + Iris 0.06% 0.27%
Sclera Ext. + Int. + Iris 0.11% 0.04%
The combination sclera with iris was effective and the EER is reduced 80% (from 0.24% to
0.04%).The combination of both sclera regions outperforms the individual results, but
performances are far from those obtained with iris. However, only first 41 users of the 1st
session from the UBIRIS version 1 were employed in this experiment. In the next
experiment with patched based descriptors, the total dataset of UBIRIS version 1 has been
used. For image label fusion extraction, a few local features such as Dense SIFT, Dense
LBP, Dense LDP and PPDD were used. The results in Table 3.7 reflect that PPDD produces
the best results in the image level fusion. It can also be observed that the employed fusion
and featuring technique have achieved significant improvement in performance accuracy in
every scenario (~0.05% in single session experiment, ~0.5% for a multisession experiment
for UBIRIS version 1 and ~0.5% for MASD). The rest of the pattern of the experiments
remain the same to previous experiments on sclera and iris.
Table 3.7: Result of image level fusion with different descriptors
Feature
Equal Error Rate (%)
Multisession
2_1
Multisession
1_2 Single session 1 Single session 2
UBIRIS
version 1
Dense SIFT
1.92 1.72 0.37 0.40
Dense LBP
1.82 1.06 0.49 0.39
Dense LDP
1.75 0.91 0.35 0.36
PPDD 1.01 0.85 0.27 0.30
MASD Dense SIFT
NA NA 1.05 NA
Dense LBP NA NA 1.10 NA
Dense LDP NA NA 1.01 NA
PPDD NA NA 0.92 NA

Towards Multi-modal Sclera and Iris Biometric Recognition with Adaptive Liveness Detection
117 | P a g e
Score Level Fusion- Table 3.8 shows the performance when the combination is done at
score level with SIFT feature for the first 41 users of the session from UBIRIS version 1. In
this combination scheme, each region is classified separately and the classification scores
(number of matches) are combined using a weighted sum as 𝑠𝑐𝑜𝑟𝑒𝑐𝑜𝑚𝑏 = 𝑤1𝑠𝑐𝑜𝑟𝑒𝐴 +
𝑤2𝑠𝑐𝑜𝑟𝑒𝐵 +𝑤3𝑠𝑐𝑜𝑟𝑒𝐶. The combination at score level confirms the effectiveness of the
sclera pattern to further improve the iris approach. In a combined scheme, the segmentation
of the iris seems to be less crucial and therefore competitive performances are obtained with
both automatic and manual segmentations.
Table 3.8. EERs (%) obtained using SIFT and a combination at score level of sclera and iris patterns.
Score Combination Weighting factors Segmentation
𝑤1 𝑤2 𝑤3 Manual Automatic
Sclera Ext. + Int. 0.4 0.5 0 10.1% 16.6%
Sclera Ext. + Iris 0.4 0.9 0 0.13% 0.14%
Sclera Int. + Iris 0.2 0.8 0 0.16% 0.18%
Sclera Ext. + Int. + Iris 0.2 0.1 0.9 0.15% 0.17%
The result of score level fusion with different descriptors like Dense LBP, Dense LDP.
Dense SIFT and PPDD are in Table 3.9. It is apparent from the result that the result achieved
is less accurate than that of image level fusion.
Table 3.9: Result of the score level fusion using different descriptor
Feature
Equal Error Rate (%)
Multisession
2_1
Multisession
1_2 Single session 1 Single session 2
UBIRIS
version 1
Dense SIFT
2.19 1.81 0.48 0.52
Dense LBP
1.96 1.50 0.45 0.41
Dense LDP
1.26 1.21 0.39 0.40
PPDD 1.21 1.02 0.35 0.37
MASD Dense SIFT
NA NA 1.21 NA
Dense LBP NA NA 1.32 NA
Dense LDP NA NA 1.15 NA
PPDD NA NA 1.11 NA

Towards Multi-modal Sclera and Iris Biometric Recognition with Adaptive Liveness Detection
118 | P a g e
Feature Level Fusion-Result of score level fusion with different descriptors like Dense
LBP, Dense LDP. Dense SIFT and PPDD are in Table 3.10. It can be apparent from the
result that the result achieved is less accurate than that of image level fusion. Here a
weighted feature fusion of 0.75 for iris and 0.25 for sclera was used.
Table 3.10: Result of feature level fusion with different descriptors
It is clear from the result that the result achieved is less accurate than that of image level
fusion, although rest of the pattern of the experiment remained the same.
3.9. Overall Experimental Results
It can be inferred from the above Tables that for session 1 as training, and session 2 as testing
produces the best result for the multi-session experimental environment. For the single
session experiments, session 1 produces the best results. It can also be concluded from the
above Table that the result for the multisession experiments has deteriorated somewhat. The
possible cause can be the different lighting condition, image properties and the presence of
some eyelids and eyelashes in the feature computed area. It can also be due to the quality of
the traits available in the sessions. The performance of iris was better in all scenario for
UBIRIS 1, whereas results for the sclera was better in MASD. A possible reason can be the
presence of more off-angle images in the dataset. Overall, better accuracy has been achieved
in all the levels of fusion than the individual traits.
Feature
Equal Error Rate (%)
Multisession
2_1
Multisession
1_2 Single session 1 Single session 2
UBIRIS
version 1
Dense SIFT
2.19 1.81 0.48 0.52
Dense LBP
1.96 1.50 0.45 0.41
Dense LDP
1.26 1.21 0.39 0.40
PPDD 1.21 1.02 0.35 0.37
MASD Dense SIFT
NA NA 1.21 NA
Dense LBP NA NA 1.32 NA
Dense LDP NA NA 1.15 NA
PPDD NA NA 1.11 NA
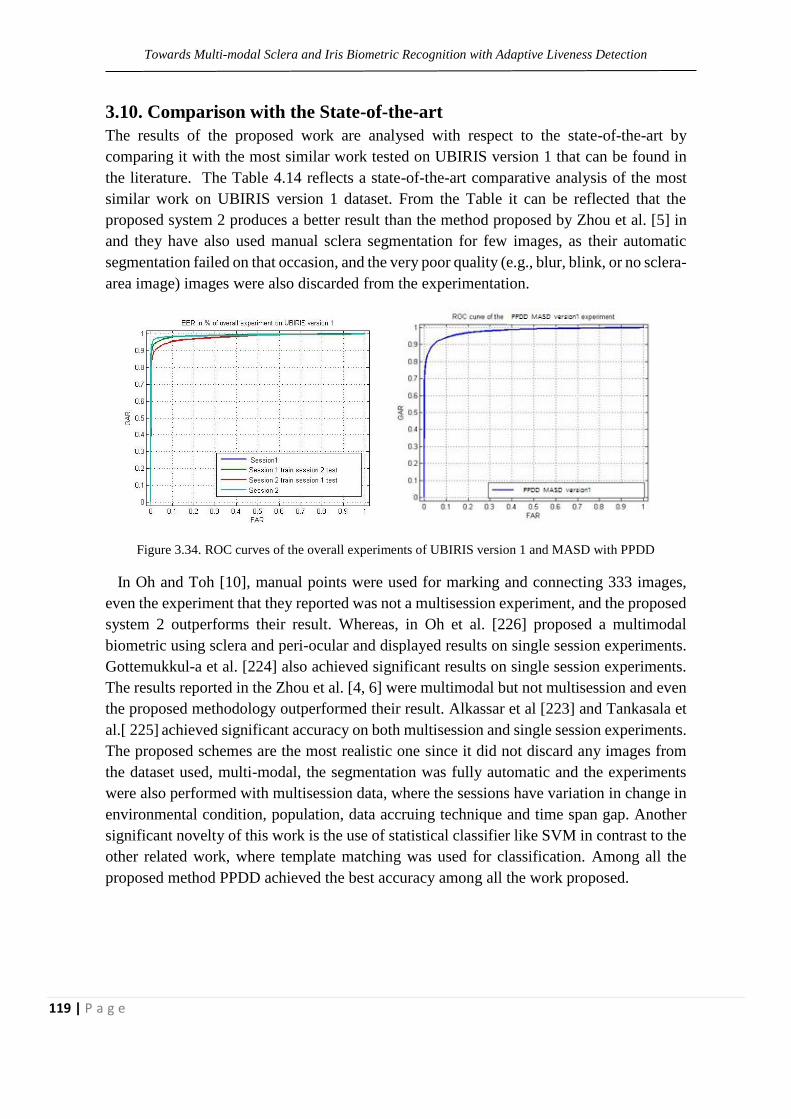
Towards Multi-modal Sclera and Iris Biometric Recognition with Adaptive Liveness Detection
119 | P a g e
3.10. Comparison with the State-of-the-art
The results of the proposed work are analysed with respect to the state-of-the-art by
comparing it with the most similar work tested on UBIRIS version 1 that can be found in
the literature. The Table 4.14 reflects a state-of-the-art comparative analysis of the most
similar work on UBIRIS version 1 dataset. From the Table it can be reflected that the
proposed system 2 produces a better result than the method proposed by Zhou et al. [5] in
and they have also used manual sclera segmentation for few images, as their automatic
segmentation failed on that occasion, and the very poor quality (e.g., blur, blink, or no sclera-
area image) images were also discarded from the experimentation.
Figure 3.34. ROC curves of the overall experiments of UBIRIS version 1 and MASD with PPDD
In Oh and Toh [10], manual points were used for marking and connecting 333 images,
even the experiment that they reported was not a multisession experiment, and the proposed
system 2 outperforms their result. Whereas, in Oh et al. [226] proposed a multimodal
biometric using sclera and peri-ocular and displayed results on single session experiments.
Gottemukkul-a et al. [224] also achieved significant results on single session experiments.
The results reported in the Zhou et al. [4, 6] were multimodal but not multisession and even
the proposed methodology outperformed their result. Alkassar et al [223] and Tankasala et
al.[ 225] achieved significant accuracy on both multisession and single session experiments.
The proposed schemes are the most realistic one since it did not discard any images from
the dataset used, multi-modal, the segmentation was fully automatic and the experiments
were also performed with multisession data, where the sessions have variation in change in
environmental condition, population, data accruing technique and time span gap. Another
significant novelty of this work is the use of statistical classifier like SVM in contrast to the
other related work, where template matching was used for classification. Among all the
proposed method PPDD achieved the best accuracy among all the work proposed.

Towards Multi-modal Sclera and Iris Biometric Recognition with Adaptive Liveness Detection
120 | P a g e
3.11. Results on Competition Conducted on MASD
To fill this gap and to raise the popularity of sclera biometrics [269], the 1st Sclera
Segmentation Benchmarking Competition (SSBC 2015) in Das et al. [270] was organized
in the context of the IEEE Seventh International Conference on Biometrics: Theory,
Applications and Systems BTAS 2015 and the 1st Sclera Segmentation and Recognition
Benchmarking Competition (SSRBC 2016) in Das et al. [272] was organized in the context
of the 9th IAPR International Conference on Biometrics: ICB 2016. The proposed MASD
dataset was employed in this context. The four algorithms submitted by the four participants
of SSBC 2015 and three algorithms from SSRBC 2016 are as below in Table 3.12. The
segmentation algorithms proposed in SSBC 2015 and SSERBC 2016 reached significant
accuracy in segmentation (95.05% of precision and recall of 94.56% on the proposed SSBC
2015 on MASD dataset, but segmentation techniques are highly affected by the change in
illuminations and the image quality. Especially for low-quality images, the proposed
segmentation techniques are not very successful. Four scenarios were identified where the
algorithms failed to successfully obtain a fair mask, as followings:
• Variation in illumination for one part of the eye – (Figure 3.35a)
• Variation in illumination at the part of the sclera and the other parts of the eye – (Figure
3.35 b & c).
• Variation in illumination for the total eye image – (Figure 3.35 d and e)
• Variation in illumination due to the light source – (Figure 3.35 f & g)
Figure 3.35: Four scenarios where algorithms failed to successfully obtain a fair mask [270]
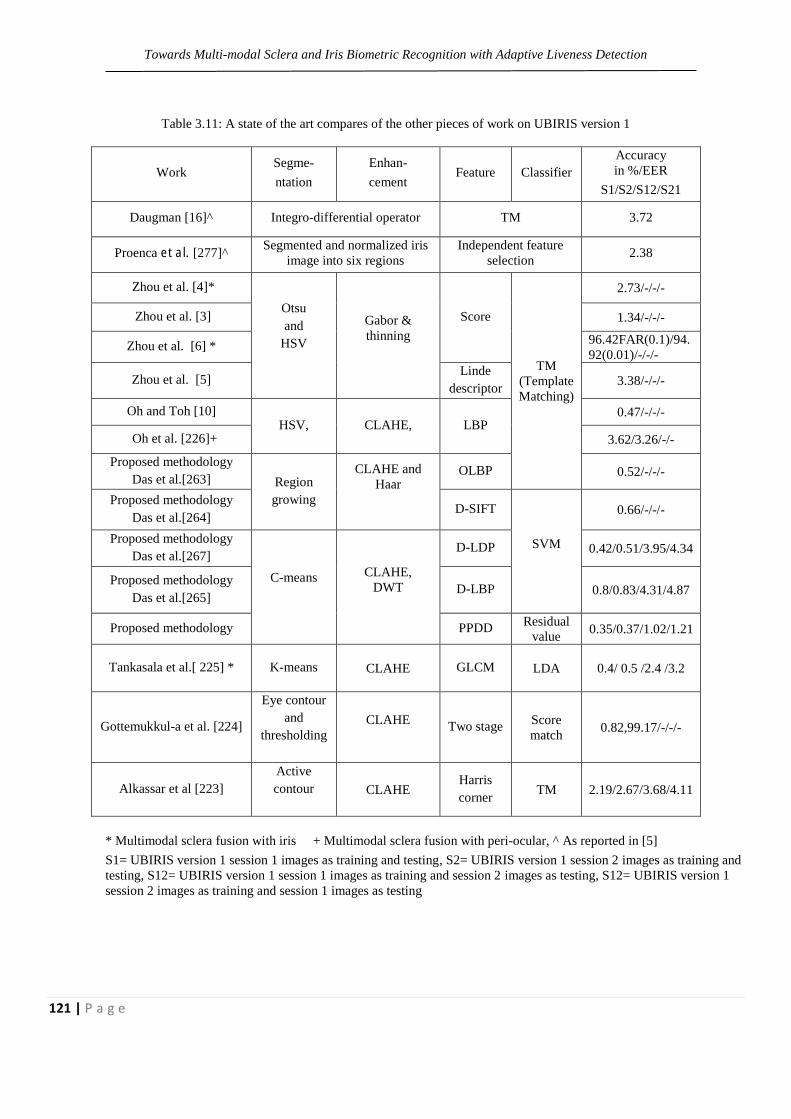
Towards Multi-modal Sclera and Iris Biometric Recognition with Adaptive Liveness Detection
121 | P a g e
Table 3.11: A state of the art compares of the other pieces of work on UBIRIS version 1
Work Segme-
ntation
Enhan-
cement Feature Classifier
Accuracy
in %/EER
S1/S2/S12/S21
Daugman [16]^ Integro-differential operator TM 3.72
Proenca et al. [277]^ Segmented and normalized iris
image into six regions
Independent feature
selection 2.38
Zhou et al. [4]*
Otsu
and
HSV
Gabor &
thinning
Score
TM
(Template
Matching)
2.73/-/-/-
Zhou et al. [3] 1.34/-/-/-
Zhou et al. [6] * 96.42FAR(0.1)/94.
92(0.01)/-/-/-
Zhou et al. [5] Linde
descriptor 3.38/-/-/-
Oh and Toh [10] HSV, CLAHE, LBP
0.47/-/-/-
Oh et al. [226]+ 3.62/3.26/-/-
Proposed methodology
Das et al.[263] Region
growing
CLAHE and
Haar
OLBP 0.52/-/-/-
Proposed methodology
Das et al.[264] D-SIFT
SVM
0.66/-/-/-
Proposed methodology
Das et al.[267]
C-means
CLAHE,
DWT
D-LDP 0.42/0.51/3.95/4.34
Proposed methodology
Das et al.[265] D-LBP 0.8/0.83/4.31/4.87
Proposed methodology PPDD Residual
value 0.35/0.37/1.02/1.21
Tankasala et al.[ 225] * K-means CLAHE GLCM LDA 0.4/ 0.5 /2.4 /3.2
Gottemukkul-a et al. [224]
Eye contour
and
thresholding
CLAHE
Two stage
Score
match 0.82,99.17/-/-/-
Alkassar et al [223]
Active
contour
CLAHE Harris
corner TM 2.19/2.67/3.68/4.11
* Multimodal sclera fusion with iris + Multimodal sclera fusion with peri-ocular, ^ As reported in [5]
S1= UBIRIS version 1 session 1 images as training and testing, S2= UBIRIS version 1 session 2 images as training and
testing, S12= UBIRIS version 1 session 1 images as training and session 2 images as testing, S12= UBIRIS version 1
session 2 images as training and session 1 images as testing

Towards Multi-modal Sclera and Iris Biometric Recognition with Adaptive Liveness Detection
122 | P a g e
Table 3.12: Algorithms and results of SSBC 2015 and SSRBC 2016.
Participat-
ing teams Method
Precis-
ion in
%
Recall
in%
The
university of
Reading,
UK
A two-stage classifier : the first stage, a set of simple classifiers was
employed, while at the second stage, a neural network classifier 95.05 94.56
Università-
degli studi di
Napoli
Federico II,
Italy
Pre-processing: 5x5 downsampling, 9x9 median filtering on each
colour band. Marker extraction: Morphological closure (square
structuring element 10x10), morphological opening (square
structuring element 30x30), K-means clustering (k=5) on green and
blue bands. Modulus of the gradient: Watershed and upsampling
[Vincent and Soille 1991] [Puhan et al. 2011].
90.51 86.03
ATVS
Biometric
Recognition
Group,
Spain
Pre-processing: The red channel eye image is segmented into three
clusters using the k-means algorithm. 1st stage of segmentation: K-
means clustering (k=3) applied on the pre-processed image. 2nd stage
of segmentation: Kissing ellipse around the eyelids is worked out
with the vertical minor axes equal to the iris diameter and the
horizontal major axes equal to the image width
90.49 80.02
Birla
Institute of
Technology,
Mesra,
Ranchi,
India
Pre-processing: The image is pre-processed by shifting the
histogram of the image towards the darker side of the image to get a
greater contrast between the sclera and the background region.
Segmentation: Otsu’s binarization method was applied on the pre-
processed image. Morphological filling operation was used to fill the
small unmasked spaces left after the binarization due to presence of
specular reflection and other noises
87.34 79.02
SJCE,
Mysusru,
India
Segmentation method based on Fuzzy C-Means was used. Robust
Spatial Kernel FCM (RSKFCM) method was proposed to segment
sclera. Gaussian kernel was used to calculate the distance between
the centre of the cluster and the data point
85.21 80.21
Griffith
University,
Australia
Peaks are found from the gray-level histogram of Fuzzy C-Means.
The number of clusters is perceived as the number of peaks (± low
threshold) of that histogram Big holes found in the segmented sclera
region are filled in and small holes found are filtered out as noise
75.09 70.10
Two clusters (histogram of Fuzzy C-Means) having the highest and
the next-to-highest cluster is considered. On these two clusters,
Otsu’s binarization is performed, followed by similar pre-processing
as in the previous method to obtain better segmentation mask.
74.01 73.20

Towards Multi-modal Sclera and Iris Biometric Recognition with Adaptive Liveness Detection
123 | P a g e
The basic faults that appear on the segmented mask due to these conditions:
• In the first scenario (Figure 3.35 a), the lighter part of the sclera is segmented partially
correctly (some non-sclera parts are misclassified) but the darker part is not
segmented correctly.
• In the second scenario, some parts of the sclera mainly the vessels patterns, were
misclassified (Figure 3.35b and Figure 3.35c are eye images of the same individual,
in Figure 3.35b sclera part are misclassified).
• In the third scenario, the lighter part of the sclera is segmented correctly, but the
darker part is not segmented (Figure 3.35d and Figure 3.35e are eye images of the
same individual; in Figure 3.35d sclera part is misclassified due to less illumination).
• In the fourth scenario in the darker images that is images where less illumination was
applied, the skin region around the eye was also misclassified as sclera region (Figure
3.35f and Figure 3.35g are eye images of the same individual, in Figure 3.35f the
non-sclera part is misclassified due to less illumination).
Similar to segmentation task a recognition competition was organised in the context of
the 9th IAPR International Conference on Biometrics: ICB 2016. Histogram of Oriented
Gradient and Gabor feature were used for feature extraction by the two participants of the
competition.
For classification the K-nearest neighbour classifier was used by both participants. A
satisfactory recognition accuracy was achieved by the systems on MASD dataset.
3.12. Summary
Considering the recent popularity and ongoing research on sclera biometric, and multimodal
ocular biometric using iris and sclera, this chapter discuss the advancement proposed in this
subject of research.
As identified in chapter 2 that this area of biometric needs substantial attention, therefore
in this chapter we proposed and discussed various segmentation, pattern enhancement,
feature extraction, classification and information fusion technique to characterise the sclera,
iris, and sclera and iris-based multimodal ocular biometrics.
Two datasets namely UBIRIS version 1 and MASD were used for experimentation.
MASD was proposed as a part of the thesis and it incorporates a larger number of off-angle
images in the different gaze of an eye. The result achieved in the experiment depicts that

Towards Multi-modal Sclera and Iris Biometric Recognition with Adaptive Liveness Detection
124 | P a g e
traits were best fused at the sensor level. Few initiative for benchmarking sclera
segmentation and recognition is also discussed.

Towards Multi-modal Sclera and Iris Biometric Recognition with Adaptive Liveness Detection
125 | P a g e

Towards Multi-modal Sclera and Iris Biometric Recognition with Adaptive Liveness Detection
126 | P a g e
4
Proposed Methodologies for Liveness
Detection
Traditional multimodal ocular biometric authentication systems are not equipped to
discriminate between genuine users and those who illegally duplicate genuine traits and take
the privileges to access a system as a genuine user. Therefore, in order to enhance the
security and reliability of these biometric systems, liveness detection is a necessary step to
prevent threats from intruders. This chapter of the thesis will concentrate on design
software- based liveliness multimodal eye biometric systems. Software-based liveness can
be established by measuring image quality features, body movement features, motion
features, and physical properties. Two methods for liveness detection is proposed in the
chapter described in the next to section. The first method employed a body movement
feature and the second method uses a few image quality features to realise liveness.
Major parts of the chapter have been published in the articles Das et al. [266, 275].
4.1. Liveliness Detection by Multi-angle Sequence of the Eye
The liveliness of the data will be detected by the motion of the eye. During enrolment, the
user will be asked to look straight, up, left and right angle keeping the face straight towards
the camera. Combinations of the sequence produced considering each of the views is stored
in the training model. During enrolment, the user will be asked to perform any of the random
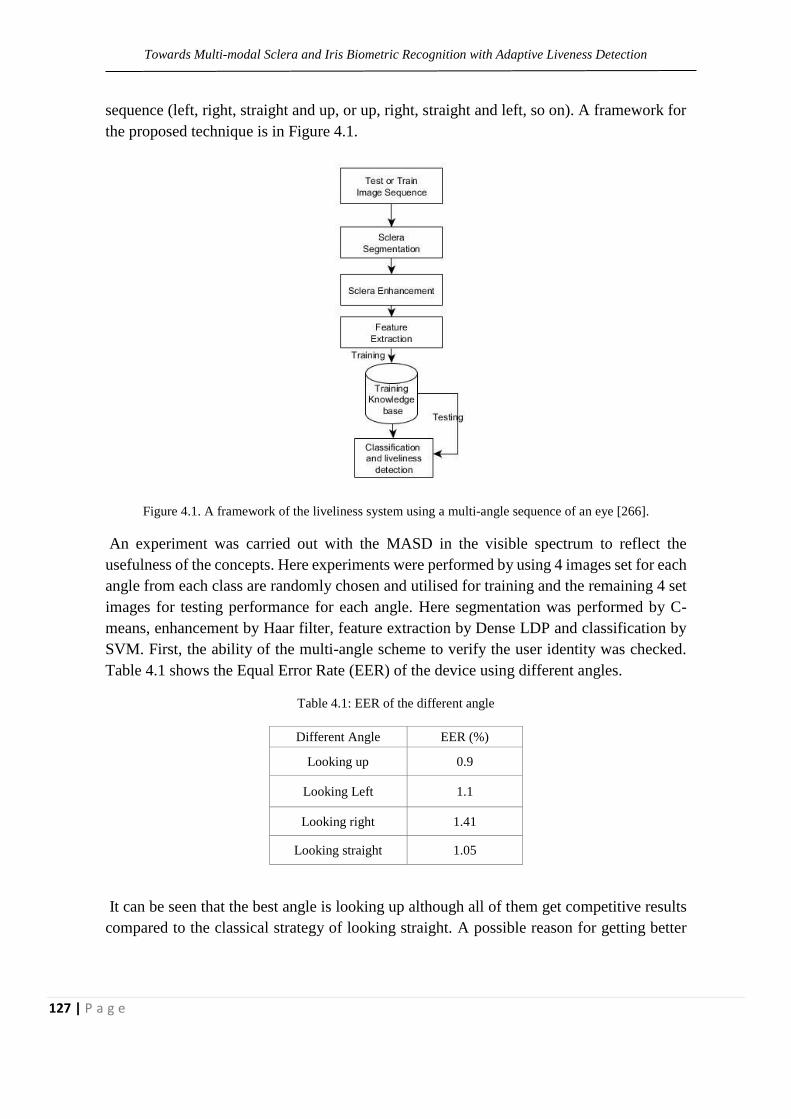
Towards Multi-modal Sclera and Iris Biometric Recognition with Adaptive Liveness Detection
127 | P a g e
sequence (left, right, straight and up, or up, right, straight and left, so on). A framework for
the proposed technique is in Figure 4.1.
Figure 4.1. A framework of the liveliness system using a multi-angle sequence of an eye [266].
An experiment was carried out with the MASD in the visible spectrum to reflect the
usefulness of the concepts. Here experiments were performed by using 4 images set for each
angle from each class are randomly chosen and utilised for training and the remaining 4 set
images for testing performance for each angle. Here segmentation was performed by C-
means, enhancement by Haar filter, feature extraction by Dense LDP and classification by
SVM. First, the ability of the multi-angle scheme to verify the user identity was checked.
Table 4.1 shows the Equal Error Rate (EER) of the device using different angles.
Table 4.1: EER of the different angle
Different Angle EER (%)
Looking up 0.9
Looking Left 1.1
Looking right 1.41
Looking straight 1.05
It can be seen that the best angle is looking up although all of them get competitive results
compared to the classical strategy of looking straight. A possible reason for getting better
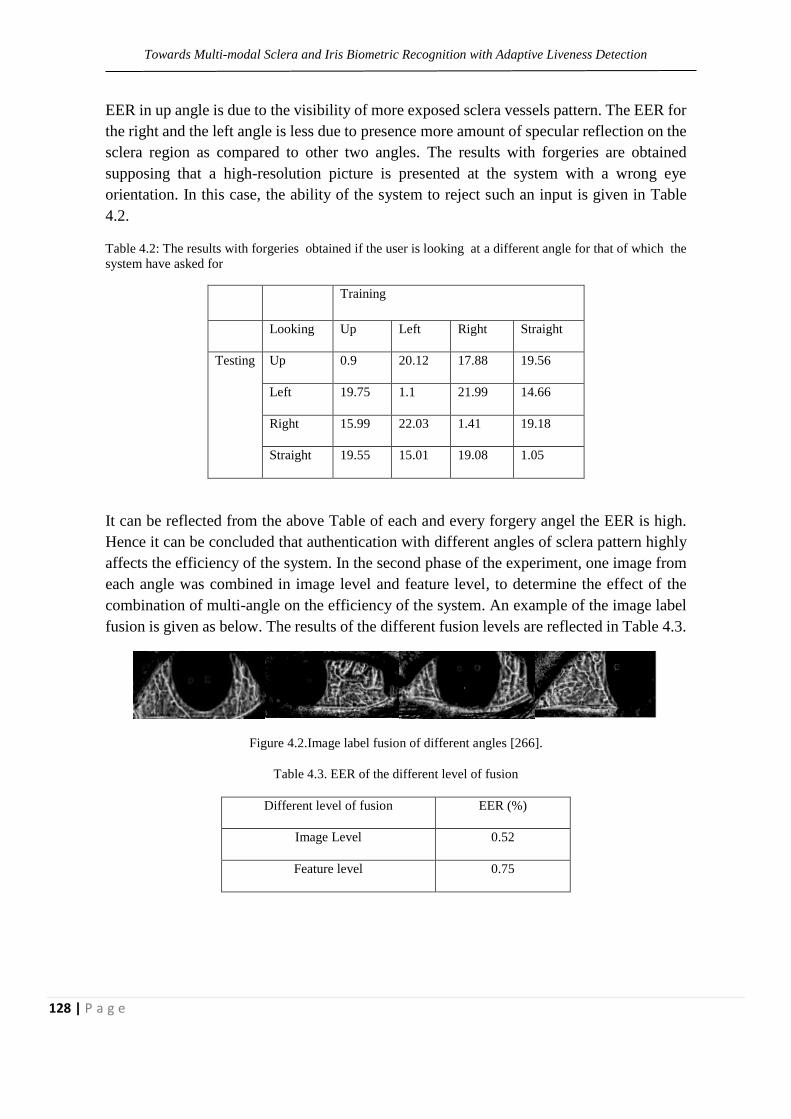
Towards Multi-modal Sclera and Iris Biometric Recognition with Adaptive Liveness Detection
128 | P a g e
EER in up angle is due to the visibility of more exposed sclera vessels pattern. The EER for
the right and the left angle is less due to presence more amount of specular reflection on the
sclera region as compared to other two angles. The results with forgeries are obtained
supposing that a high-resolution picture is presented at the system with a wrong eye
orientation. In this case, the ability of the system to reject such an input is given in Table
4.2.
Table 4.2: The results with forgeries obtained if the user is looking at a different angle for that of which the
system have asked for
Training
Looking Up Left Right Straight
Testing Up 0.9 20.12 17.88 19.56
Left 19.75 1.1 21.99 14.66
Right 15.99 22.03 1.41 19.18
Straight 19.55 15.01 19.08 1.05
It can be reflected from the above Table of each and every forgery angel the EER is high.
Hence it can be concluded that authentication with different angles of sclera pattern highly
affects the efficiency of the system. In the second phase of the experiment, one image from
each angle was combined in image level and feature level, to determine the effect of the
combination of multi-angle on the efficiency of the system. An example of the image label
fusion is given as below. The results of the different fusion levels are reflected in Table 4.3.
Figure 4.2.Image label fusion of different angles [266].
Table 4.3. EER of the different level of fusion
Different level of fusion EER (%)
Image Level 0.52
Feature level 0.75

Towards Multi-modal Sclera and Iris Biometric Recognition with Adaptive Liveness Detection
129 | P a g e
It can be inferred from the above Table that image label fusion produces the best results and
even the fusion of the different angle helps to increase the efficiency of the system. Next to
experiment the effect of a sequence of the orientation when an individual is asked to look in
a sequence: for instance straight, up, left and right but the individual looks in some other
sequence, then what is the performance of the system.
Table 4.4. The results with forgeries obtained if the user is looking at a different sequence of angles from that
which the system has asked for by image level fusion
Training by sequence of looking
straight, up, left and right
Testing Sequence of orientation EER in %
Straight, up, left and right 0.52
Straight, up, right and left 19.90
Straight, left, up and right 17.01
Straight, left, right and up 23.05
Straight, right, left and up 24.01
Straight, right, up and left 22.09
Right, left, up and straight 24.35
Right, left, straight and up 22.01
Right, up, left and straight 23.44
Right, up, straight and left 23.01
Right, straight, up and left 22.44
Right, straight, left and up 19.01
Up, straight, left and right 19.90
Up, straight, right and left 21.77
Up, left, straight and right 17.10
Up, left, right and straight 23.33
Up, straight, left, and right 24.44
Up, straight, right and left 21.13
Left, right, up and straight 11.90
Left, right, straight and up 23.4
Left, up, right, and straight 19.08
Left, up, straight and right, 22.01
Left, straight, up and right, 19.01
Left, straight, right and up, 23.02

Towards Multi-modal Sclera and Iris Biometric Recognition with Adaptive Liveness Detection
130 | P a g e
Table 4.5. The results with forgeries obtained if the user is looking at a different sequence of angles from that
which the system has asked for, by feature level fusion
Training by sequence of looking
straight, up, left and right
Testing Sequence of orientation EER in %
Straight, up, left and right 0.75
Straight, up, right and left 19.99
Straight, left, up and right 19.09
Straight, left, right and up 23.95
Straight, right, left and up 24.81
Straight, right, up and left 22.39
Right, left, up and straight 24.05
Right, left, straight and up 22.81
Right, up, left and straight 23.94
Right, up, straight and left 23.81
Right, straight, up and left 22.49
Right, straight, left and up 19.01
Up, straight, left and right 19.99
Up, straight, right and left 21.8
Up, left, straight and right 17.90
Up, left, right and straight 23.77
Up, straight, left, and right 24.66
Up, straight, right and left 22.03
Left, right, up and straight 12.0
Left, right, straight and up 23.87
Left, up, right, and straight 19.99
Left, up, straight and right, 22.65
Left, straight, up and right, 19.88
Left, straight, right and up, 23.74

Towards Multi-modal Sclera and Iris Biometric Recognition with Adaptive Liveness Detection
131 | P a g e
It can be reflected from the above Table of each and every forgery angle sequence the EER
is high. Hence it can be concluded that this sequence of eye movement can work as a good
form for the liveliness of detection. The experiment is extended by training with image
sequences from the dataset and testing them with a set of images captured by images of the
eye of the same set of individuals from a mobile or portable screen (to stimulate a practical
life scenario when the eye image can be scanned for spoofing in front of a sensor by high-
resolution image). Examples of such images are given below in Figure 4.3.
(a) (b)
(c) (d)
Figure 4.3: Examples of images taken by displaying eye images from mobile [266].
The EER obtained in the result of the above-mentioned experiment was 10.05. This signifies
the robustness of the system to spoofing by portable devices. Although a significant result
is achieved in the experiments but trade-off of adaptability and liveness is not addressed.
Therefore, further research is conducted which is summarised in the next section.
Table 4.6. Equal Error Rate of the different level of fusion by testing the mobile images
Different level of fusion EER (%)
Image level 10.05
Feature level 10.79
4.2. Image Quality-Based Liveness Framework
In this section, a new framework for software-based liveness detection exploring image
quality features for ocular biometric in the visible spectrum is proposed. The specific
contributions of the proposed liveness detection scheme are as followings [275]:

Towards Multi-modal Sclera and Iris Biometric Recognition with Adaptive Liveness Detection
132 | P a g e
1. A new framework for liveness detection, as shown in Figure 1(b) is proposed at the intra
-class level, which makes the quality feature more useful than the other previous liveness
framework.
2. A set of quality parameters is proposed for liveness detection in ocular biometrics in the
visible spectrum. These measures are based on transformed domain, geometrical relation
and contrast measures.
3. As liveness is detected at the intra-class level (intra-class level and inter-class level is
emitted in Figure 4.4 (a and b)), adaptiveness of such system is also high (as the
classification is done per user so obtain different thresholds are used per user and hence
adaptation is required in user level).
4. In order to demonstrate the proposed framework different spoofing techniques are
explored (here images are taken from the portable screen as well as from printed).
5. Moreover, this experiment was performed on the low-end image acquired from the
mobile camera in a regular room environment, which reflects potentiality to work in real
life environment.
4.2.1. Proposed Liveness Framework
It can be referred from the literature, that the biometric liveness detection problem is a two
class classifier problem i.e. it classifies the input image into two classes, either a real sample
or a fake sample category. It indicates that either the scanned image is from a real live body
or it is acquired from a non-live body, by processing it by image processing and computer
vision based and signals processing based quality assessment.
Various liveness framework proposed in the literature have been designed at the inter-class
level. In the contrast to the existing frame work, the proposed framework deals with the
liveness problem as two class classifier problems at the intra-class level (fake and real
classification at each user level. A block diagram of the intra-class and inter-class level is
provided in Figure 4.4 (a and b).
In a real-life scenario liveness detection is required to be ensured if the data is recognised
correctly. So, the liveness detection problem can be clearly reduced to a two class classifier
problem at the intra-class level rather than the inter-class level. This new adaptation of
framework not only reduce the complexity of the schema, but also makes the quality features
more useful to classify the real and fake data. Moreover, as each class has individual
represented by a threshold of quality feature score (build a classifier per user, different

Towards Multi-modal Sclera and Iris Biometric Recognition with Adaptive Liveness Detection
133 | P a g e
threshold per user is obtained, so adapt the quality parameter threshold to the user) so
adaptability of the system will be higher than the dataset level framework that was proposed
previously.
The proposed liveness framework for each class is as follows: At the enrolling step real
and fake representations of the user, the eye is obtained. For enrolling the real data individual
collaboration is required, while for the fake sample is acquired in a user transparent way,
i.e. do not require the individual collaboration and it is done automatically as shown in
Figure 4.4 (c). The images acquired from each user in the enrolment phase can be displayed
on a portable screen in front of a camera to produce fake images as shown in Figure 4.4 (b).
At the identification step, the individual is required to be identified correctly and then the
liveness is detected by comparing the various quality parameters with the real and fake
representation of the recognised class. A framework of the above mention framework for
liveness detection and the framework of the image scanning system is given below in Figure
4.4 (c).
The various existing and new quality-based features employed to detect the liveness can be
categorised into three main categories namely transformed domain (focus)-related quality
feature, aspect-related feature and contrast-related feature. These features are described
below in the following sub-sections.
4.2.1.1. Transform Domain or Focus-related Quality Feature
Various types of direct attack that can be used for spoofing in ocular biometrics in the visible
spectrum are scanning a high resolution printed image or a high-resolution image or high
definition video from a portable screen such as a mobile or notepad etc. However in the
entire scenarios, as the spoofing is committed by scanning images which are 2D objects, it
is expected that there will be a focus different with the images captured from live data which
are 3D objects. So, various transformed domain (focus) related feature is explored here as
an image quality assessment tool such as in.
Power Spectrum (QF1): The power spectrum of an image is a unique feature to
discriminate between the real and fake image. The power spectrum splits a signal or an
image into frequency bins, where the maximum frequency which can be observed is the
Nyquist frequency or half of the sampling frequency.
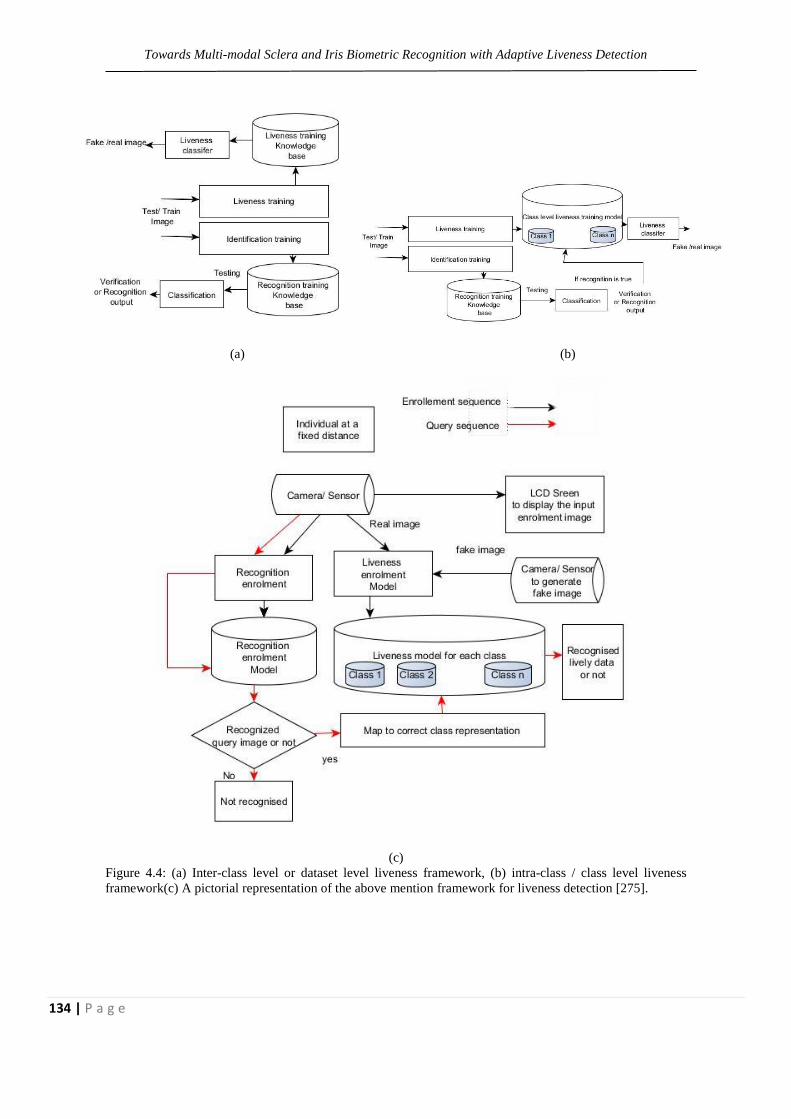
Towards Multi-modal Sclera and Iris Biometric Recognition with Adaptive Liveness Detection
134 | P a g e
(a) (b)
(c)
Figure 4.4: (a) Inter-class level or dataset level liveness framework, (b) intra-class / class level liveness
framework(c) A pictorial representation of the above mention framework for liveness detection [275].

Towards Multi-modal Sclera and Iris Biometric Recognition with Adaptive Liveness Detection
135 | P a g e
(a)
(b)
(c) (d)
Figure 4.5: (a) Power spectrum of the real image, (b) Power spectrum of the fake image, (c) real image and
(d) fake image [275].
Discrete approximation of the Laplacian (QF2): The discrete Laplace operator is an
analogue of the continuous Laplace operator, it provides an accurate approximation of the
Laplacian operator of digital signals passing through this filter.
Figure 4.6: (a) Laplacian of the real image of 4.5(c), (b) Laplacian of the fake image of 4.5(d) [275].

Towards Multi-modal Sclera and Iris Biometric Recognition with Adaptive Liveness Detection
136 | P a g e
High-frequency 2D filter (QF3): The filter response from a high-frequency 2D filter is
also a signal processing tool to detect the quality of an image. Here Discrete Meyer
decomposition filter was employed for the implementation of high-frequency filters.
Figure 4.7: (a) High-frequency filter response of the real image of 4.5(c), (b) High-frequency filter response
of the fake image of 4.5(d) [275].
4.2.1.2. Aspect-related Feature
Like the focus related features, aspect ratio-based features can also play an important role
in aliveness detection in the visible spectrum. The reason because the images scanned for a
system has a unique camera specification even this constraint is quite similar to cross sensor
system scenario and they will produce a sound difference in aspect ratios between the real
and fake image, which also reflected in the literature. Hence the various aspect ratio-based
features should work well to discriminate between the real and fake image. A set of aspect
related feature is proposed and explored here for the proposed liveness system.
The ratio of the pupil and the iris radius (QF4): The first aspect related feature proposed
here is the ratio of the pupil and the iris radius. The ratios were calculated by the
integrodifferential operator proposed in [17].
The ratio of the iris radius and image length (QF5): The aspect of the ratio of iris radius
and image length is also expected to be different for a genuine image and a fake image. As
because the original dimension of the real and fake eye image are different.
The ratio of the iris radius and image width (QF6): The aspect of the ratio of iris radius
and image length is expected to be similar to a genuine image even if the image is scanned
from a small varying distance.
The ratio of the pupil radius and image width (QF7): Similar to the previous quality
feature QF6, an aspect ratio of the pupil radius and the image with it can play an important
role as an aspect based quality feature. This explored quality feature is assumed to be
different for real and fake images, as the papillary dilation changes for 2D (printed images
or video use to spoof) and 3D objects (real human eye) will always be different.

Towards Multi-modal Sclera and Iris Biometric Recognition with Adaptive Liveness Detection
137 | P a g e
The ratio of the pupil radius and image length (QF8): Similar to the previous aspect
feature based on the ratio of pupil radius and the image width, in this feature image length
is introduced which is also expected to be enough capable of discriminating a live and fake
image.
The ratio of the sclera length and image width (QF9): In this aspect ratio based quality
feature the ratio of sclera length and the image width is employed. The sclera length is
estimated by calculating the length difference between the two corners of the eyes. At first,
the sclera is segmented by the Time-Adaptive Region growing algorithm as proposed in
[5]. Then the two corners are estimated by finding the first column of the binary segmented
mask image having a white pixel and the corresponding last column having a white pixel
as shown in Figure 4.8.
The ratio of the sclera length and image length (QF10): As similar to QF9, sclera length
is estimated by calculating the length difference between the two corners of the eyes from
the sclera segmented image and then the ratio of the sclera length and image length is
calculated.
The ratio of the sclera length and iris radius (QF11): The ratio of the sclera length and
the iris radius is one another quality feature that can be used for liveness detection. The
sclera length is calculated in a similar way as in QF9.
Figure 4.8: Sclera length estimation technique adopted by calculating the two corners from the segmented
mask [275].
The ratio of the sclera length and pupil radius (QF12): The ratio of the sclera length
and pupil radius is also a unique aspect for liveness detection, which is employed in this
quality feature.
The ratio of the sclera segmented image and a binary image (QF13): The ratio of the
count of the white pixel of the segmented mask and the binary image achieved by applying
Otsu’s binarization method is quite different for the real and fake image because of the
intensity distribution difference present in both category of image. This aspect related
feature of the two binarization method is employed for liveness detection.

Towards Multi-modal Sclera and Iris Biometric Recognition with Adaptive Liveness Detection
138 | P a g e
4.2.1.3. Contrast Related Feature
It can be easily visualised looking at the fake and the real images that there is a huge
difference in the contrast distribution between both the category of image. As a reason, the
contrast-related quality feature can be a key attribute to distinguish the fake and the real
image correctly. So, the following contrast based quality features are proposed in this work.
Global contrast (QF14): The global construct is the first contrast related quality feature
employed in this work. The global construct of the image is calculated for each image as
a quality feature, by the following equation.
Contrast = Value of highest intensity - average intensity (4.1)
The global contrast of the fake image and the real image varies in a huge difference
which is reflected from the images, so this feature plays an impotent role in this
framework.
Local construct (QF15): It is also evident from the fake and the real images that there is
a good discriminable difference in local contrast in between them. So, the images are
divided into10X10 patches and the contrast of each patch is summed to get the final
representation. Similar to the global contrast, this feature also plays an impotent role in
detecting liveness for this framework.
Local construct (QF16) at the channel level: A new image channel based contrast related
quality feature is proposed in this work for liveness detection. The images are divided
into10X10 patches at each channel level (red, green and blue channel) and the contrast of
each patch of subsequent channel representations are added to get the channel level local
feature. Finally, the three channel level representations are added to get the final
representation of this proposed feature.
Image red channel contrast (QF17): Among the contrast related feature few channel
based global feature is also proposed. In this feature, the red channel global contrast of the
image is calculated by the following equation.
RcC = RcHi - RcAi (4.2)
Where RcC= Red channel Contrunst. RcHi= Value of highest intensity in the red channel of an image.
RcAi= Average intensity in red channel of an image;

Towards Multi-modal Sclera and Iris Biometric Recognition with Adaptive Liveness Detection
139 | P a g e
Image green channel contrast (QF18): In this feature, the green channel contrast of the
image is calculated, similarly by equation 2 only by replacing the red channel attribute by
green channel attribute. This was a most effective feature among other contrast feature.
Image blue channel contrast (QF19): Similar to .red and green channel the blue channel
contrast is proposed and calculated by the same equation employing the .blue channel
contrast attributes. This quality based feature was also quite efficient at detecting liveness.
The result of the liveness detection after employing the above-mentioned set of the proposed
quality feature is reported in the next section.
4.2.2. Experimentation Result
To justify practical effectiveness the proposed framework an experimental setup was
designed, the detailed result of the experiment and the dataset used to implement the
experiment is explained in the following sub-section.
4.2.2.1. Dataset
In order to implement the proposed aliveness framework and to assess the effectiveness of
the proposed quality features an in-house dataset was prepared. This database consists of
200 real RGB images from both eyes of 25 identities (so 50 different eyes), 4 samples for
each eye were captured. The database contains blurred images and images with blinking
eyes. The high-resolution images (3200 × 2400) and 72 dpi are provided in the database.
All the images are in JPEG format. The individual comprises of both male and female (14
male and 11 female), of different age and different skin colours were considered, 2 of them
were wearing contact lens and the images were taken at the different time of the day. Have
used different quality images and some of the sample images are shown in Figure 4.9. The
images were captured using a Micromax mobile camera doodle version with an 8 megapixel
rear camera.
Figure 4.9: Different real images of different quality in the dataset [275].
In order to emit the forge attack experiment, the fake images for enrolment were prepared
automatically by displaying original the acquired images during real image enrolment, in a
digital screen and then generate the fake image by, capturing the displayed image by a
camera stalled in front of the screen. Varying type of display screen was used to emit the

Towards Multi-modal Sclera and Iris Biometric Recognition with Adaptive Liveness Detection
140 | P a g e
real life scenario and the same standard sensor is used to acquire them. The 100 fake images
were prepared by the above methodology for enrolment, 2 fake images for each eye. For
testing, 100 fake images were prepared i.e. 2 images for each eye.
They were prepared either by scanning a high quality image captured from the same
camera or a NIKON D 800 camera and 28300 lenses (as imposter can use very sophisticated
camera to acquire the original biometric trait) or an low quality image capture by camera
having same specification as the sensor and scanned from a portable screen like mobile
notepad, etc. Even spoof images were also prepared from printed images printed from laser
colour printer, employing the above mention the high and low-quality images and then
scanned in front of the sensor. Examples of such few fake images are given in Figure 4.10.
(a) (b)
(c) (d)
Figure 4.10: (a) Fake image capture from screen where the original image was captured by NIKON camera,
(b) fake image capture from screen where the original image was captured by Micromax mobile camera, (c)
fake image capture from printed image where the original image was captured by NIKON camera, and (d)
fake image capture from printed eye where the original image was captured by Micromax camera [275]..
4.2.2.2. Classifier Used and Feature Selection and Optimization Technique
As liveness classification is a two-class classification problem and the dimension of the
feature used are not large, so various pair-wise classifier such as a Euclidean distance, city
block distance, Chebyshev distance, cosine distance, spearman distance, Hamming distance
and Jaccard distance which are available in the literature are exploited here. Among them,
the Jaccard distance produced the best result. For feature selection first found the
performance of the individual features and then the feature producing the best result is
combined with the second best result and so on.

Towards Multi-modal Sclera and Iris Biometric Recognition with Adaptive Liveness Detection
141 | P a g e
4.2.2.3. Experimental Result Details
The liveness experimental results with various quality-based features are explained in this
subsection. For training, five samples from each class from the fake and the genuine
categories are used to produce the training model (the feature values are averaged to get the
feature representation of each class) and the remaining five samples from each class of fake
and genuine images were used for testing. The performances of the above-mentioned
features individually and in combination are presented in Table 4.7.
The table illustrates the satisfactory performance of the proposed quality feature for both
aspects of liveness detection (i.e. ability to classify genuine and fake samples correctly). It
can be seen from the above Table that the focus-related features worked for detecting
liveness. Aspect-related features worked better than the focus-related feature. Among the
aspect-related features, the performance of the QF4 (i.e. the ratio of iris and pupil radius)
was the best. Furthermore, the group of contrast-related features produced the best results.
Among them, QF 18 i.e. the green channel contrast, outperformed the other quality features
introduced here. As mentioned previously, a combination of this feature is also used to
analyse the performance. Fused the features according to the performance rank so, combined
the 1st rank feature with 2nd and so on. It can be concluded from Table 4.7 that the
combination of the contrast-based features and the aspect-based features produced the best
result.
Moreover, it will be also quite interesting to observe the correlations between the features.
It can be seen from the results that the accuracy of the features is quite close. But the features
are significant because when they are combined, they boost the accuracy as opposed to when
they are applied individually.
Although the contrast-related features have worked exceptionally well in the proposed
schema, unfortunately, such features can be attacked by intruders at the software level by
using photometric normalisation. However, for such scenarios of attack, the intruder will be
required to have technical details about the inner functionality and a clear architecture of the
liveness system for tonal correction of the fake images. Moreover, they need to attack at the
software level rather the sensor level, which is more difficult than a direct attack.
The feature distributions of the best discriminative features, such as the pupil and the iris
radius QF4 and contrast quality features QF19, are shown in Figure 4.12 and the contrast
quality features (QF14, QF17, and QF18) are shown in Figure 4.11. Although the
cumulative frequency or the probability distributions, i.e. the score of the feature normalised
at each class level, would have been a better measure, for better discernibility of the feature,
this feature distribution is used. Moreover, the feature distribution is also a better measure
to reflect the effectiveness of the feature at the class level and the database level. In each
graph, the quality feature score distribution of the entire genuine sample is represented by a
green line and the fake sample by a blue line. Along the X-axis is the

Towards Multi-modal Sclera and Iris Biometric Recognition with Adaptive Liveness Detection
142 | P a g e
Table 4.7: Liveness detection performance of the various individual and combinations of image quality-based
features.
Feature Test averaged accuracy in % achieved for
Fake samples Genuine samples F
ocu
s
Fea
ture
s
QF1 81 79
QF2 70 83
QF3 76 80
Asp
ect
feat
ure
s
QF4 95 94
QF5 86 82
QF6 87 84
QF7 84 86
QF8 87 84
QF9 85 78
QF10 84 70
QF11 80 70
QF12 78 78
QF13 85 86
Co
ntr
ast
mea
sure
s
QF14 96 96
QF15 88 89
QF16 89 90
QF17 96 95
QF18 98 97
QF19 95 94
Co
mb
inat
ion
QF14+QF18 98 98
QF14+QF17+QF18 98 99
QF14+QF17+QF18+QF19 99 99
QF4+QF14+QF17+QF18+QF19 100 100
sample and along the Y-axis is the feature value. In each of the lines in the graph, the first
ten feature values represent the feature value of the ten fake/genuine samples of the first

Towards Multi-modal Sclera and Iris Biometric Recognition with Adaptive Liveness Detection
143 | P a g e
class, the next ten from the second class and so on. It is clear from the graphs that the feature
values of the fake and genuine samples have a discernible difference within each class.
Whereas, if database-level feature distribution is considered, then this feature value would
have a certain overlapping region. Therefore that creates confusion in the classification of
‘alive’ and fake data at the database level.
(a)
(b)
(c)
Figure 4.11. Feature distributions of the best discriminative quality features for the genuine and fake samples of
each class (a) Global contrast QF14, (b) Red channel contrast QF17, and (c) Green channel contrast QF18 [275].

Towards Multi-modal Sclera and Iris Biometric Recognition with Adaptive Liveness Detection
144 | P a g e
(a)
(b)
Figure 4.12: Feature distributions of (a) Blue channel contrast QF18, (b) QF4 (is the ratio of the pupil and the
iris radius) [275].
4.2.2.4 Comparison with the State-of-the-art Methods
The performance of the above-mentioned framework is compared with the most relevant
previously proposed liveness framework in Galbally et al., [102] using the proposed set of
quality features, feature selection process and classification technique. The results
producing the better performance were on the basis of the newly proposed liveness
framework. The detailed comparison of the results of the two frameworks is given in Table
4.8. It can be seen from Table 4.8 that the focus-related feature worked averagely for
detecting liveness in the previous framework of Galbally et al., [102]. Whereas the aspect-
related feature worked less accurately than the focus-related feature. Furthermore, the group
of contrast-related features produced the best result. Similar to the results of Table 1, here
also the QF18, i.e. the green channel contrast, outperformed every other quality feature
introduced here. The combination of the features was also performed, and the improvement
in results was noticeable.

Towards Multi-modal Sclera and Iris Biometric Recognition with Adaptive Liveness Detection
145 | P a g e
Table 4.8: The detailed performance-based comparison of results between the proposed framework and the
framework presented in Galbally et al., [102] using the proposed set of quality features.
Feature Test averaged accuracy in % achieved for
Proposed framework Framework Galbally et al., [102]
Fo
cus
feat
ure
s
QF1 80 70
QF2 77 73
QF3 79 74
QF4 95 86
Asp
ect
feat
ure
s
QF5 84 83
QF6 85 80
QF7 85 80
QF8 85 78
QF9 81 75
QF10 77 74
QF11 75 74
QF12 78 70
QF13 86 80
QF14 96 89
QF15 88 84
Co
ntr
ast
mea
sure
s QF16 90 82
QF17 96 88
QF18 97 100
QF19 95 87
Co
mb
inat
ion
QF14+QF18 98 91
QF14+QF17+QF18 99 93
QF14+QF17+QF18+QF19 99 94
QF4+QF14+QF17+QF18+QF19 100 94
All 100 94

Towards Multi-modal Sclera and Iris Biometric Recognition with Adaptive Liveness Detection
146 | P a g e
Although the proposed aspect-related features worked for the previous framework in
Galbally et al., [102], it is clear from the above Table that the concept of class-level liveness
classification has outperformed the database-level liveness detection/classification by an
appreciable margin. These results and comparisons demonstrate the effectiveness of the
proposed framework in contrast to the previous framework.
For further analysis and comparisons, the best quality feature combinations in Galbally et
al., [102] i.e. the combination of occlusion (pupillary dilation), global contrast and local
construct are applied in the database, both using the class-level liveness classification and
database-level classification. In the database level classification, these features were able to
discriminate 94% of the genuine and 89% of the fake images. Whereas, in the inter-class
level liveness framework, these same features were able to correctly discriminate only 95%
of the genuine and 93% of the fake images.
From the above analysis, it is again demonstrated that the class-level classification is
more efficient than the database-level liveness classification framework. Moreover, it is also
clear that the best quality feature combination of Galbally et al., [102] in the class-level
classification could not outperform the result of the proposed quality-related feature.
Another comparison was performed with a very recent and most efficient work on ocular
liveness detection proposed in Sequeira et al., [122]. The liveness algorithm of the above-
mentioned research was employed using the framework and the proposed database to
perform the analysis. On the basis of the experiments performed it is clear from the results
that it can only efficiently classify 89% of the fake images and 94% of the real images.
Whereas, employing their algorithm at the database-level liveness framework and using
the database, the result was less effective. Thus, similar to the previous analysis, this
analysis also demonstrates the superior effectiveness of the proposed framework and the
feature set.
So, from the above analysis, the effectiveness and applicability of the proposed
framework in a real-life scenario are demonstrated. Moreover, the effectiveness of the
quality features is also justified on the basis of the above comparison.
4.3. Summary
This chapter proposes a new liveness detection approach for multimodal ocular biometrics
in the visible spectrum based on multi-angle eye images and image quality features. Both
methods seem to achieve potential results. The novel framework proposes inter-class/class
level liveness detection based on the combination of domain transforms, geometrical ratios
and contrast measures.

Towards Multi-modal Sclera and Iris Biometric Recognition with Adaptive Liveness Detection
147 | P a g e
Furthermore, this framework and the new quality features proposed can also be used to
explore liveness detection of multimodal biometric traits across the visible spectrum, in a
more realistic and accurate way compared to previous liveness detection schemas. The
success of the proposed framework and the proposed set of quality features of liveness are
evident from the experimental results. Moreover, a new database is proposed for liveness
detection, consisting of fake images that were developed with more versatile forging
technology that can be used by intruders. Moreover, the images in the database also contain
sufficient accurate biometric information for the aforementioned ocular traits.

Towards Multi-modal Sclera and Iris Biometric Recognition with Adaptive Liveness Detection
148 | P a g e

Towards Multi-modal Sclera and Iris Biometric Recognition with Adaptive Liveness Detection
149 | P a g e
5
Proposed Methodologies for Adaptive
Biometrics
In this chapter, we address the potential incremental learning techniques which can be
applied in the biometric domain to create an adaptive learning system. The motivation to
create an adaptive learning system for biometrics is explained below. In real-world
scenarios, where we use machine learning algorithms, we often have to deal with cases
where the input data changes its nature with time. In order to maintain the accuracy of the
learning algorithm, we frequently have to retrain the learning system, thereby making the
system inconvenient and unreliable. This problem can be solved by using learning
algorithms which can learn continuously with time (incremental/online learning). In
contrast, offline learning works fine in an ideal scenario where there is no change in the
underlying distribution of the input with time. However, for various reasons, this does not
often hold in real time problems that are intended to address (i.e. of the robust biometric
system) using machine learning.
In contrast to offline learning, ideally, incremental/online learning can be simultaneously
trained and tested. Precisely, it need not stop performing its task (i.e. prediction or
classification) if the learner has to update its learning parameters. Learning parameters can
be updated as soon as the new training data is available. This leads to the creation of a never-
ending learning process which can adjust itself even if the environment changes and can
perform learning while performing the task.

Towards Multi-modal Sclera and Iris Biometric Recognition with Adaptive Liveness Detection
150 | P a g e
The critical assumption on which most of the incremental learning algorithms are based
upon is that previous data is completely or partially accessible. Based on this assumption,
to handle streaming data they apply the time windowing technique of either fixed or variable
size [146, 143 and 146]. Others have handled streaming data by weighting models in the
ensemble [144, 147 and 148] or by weighting the data [149] or by retaining only the relevant
subset of previous data [143 and 144]. It is assumed for experimentation that there is no
access to the previous data, thus making the algorithm capable of handling the scenario
where old data is inaccessible. Despite these above-highlighted advantages, a lot of
limitations is also associated with the existing online to the employee for adaptive biometric
systems.
The main challenge is feeding substantial amount of samples for such systems, for which
need to acquire a large number of samples which is a quite time consuming and complex
process. If an adopted self-updating system captures only limited amount samples during
enrollment, a large number informative and significant variations remain unenrolled and as
a result, it can achieve limited performance gain or even loss over the performance of
baseline system.
To overcome this in the next section framework is proposed and discuss some potential
methods which can be used to make an adaptive biometric system. Next, the experimental
details and that were produced are exploded. Major parts of the chapter have been published
in the articles Das et al. [274].
5.1. Proposed Framework for Adaptive Biometrics
In a biometric system requires 1 to 1 or 1 to n match as its intended to verify or recognise
the claimers identity by matching the presented biometric property with the enrolled
biometric knowledge base. This scenario can be mathematically formulated by:
Let f be a mathematical representation of the biometric property or feature vector extracted
from the presented biometric image and e be the enrolled representation feature vector
stored for the claimed identity I.
The task is to determine if the pair (I, f) belongs to class I which is to accept (genuine) the
user or class else which is to reject (imposter) the user.
Let S( f, e) denote the distance matching score computed by matching e and f and T denotes
the threshold determined at the learning stage. Then the verification/ recognition is defined
as:
(l, f ) I ,if S( f,e) <𝑇
𝑐𝑙𝑎𝑠𝑠 𝑒𝑙𝑠𝑒, 𝑜𝑡ℎ𝑒𝑟𝑤𝑖𝑠𝑒 (5. 1)
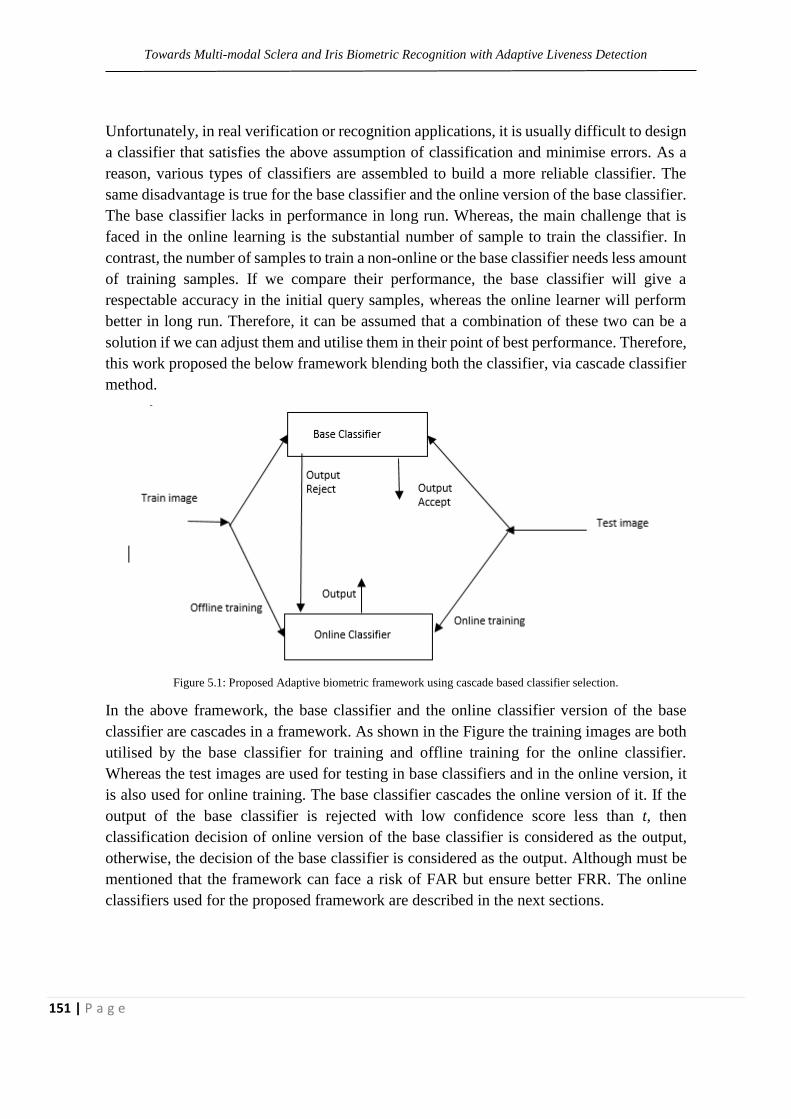
Towards Multi-modal Sclera and Iris Biometric Recognition with Adaptive Liveness Detection
151 | P a g e
Unfortunately, in real verification or recognition applications, it is usually difficult to design
a classifier that satisfies the above assumption of classification and minimise errors. As a
reason, various types of classifiers are assembled to build a more reliable classifier. The
same disadvantage is true for the base classifier and the online version of the base classifier.
The base classifier lacks in performance in long run. Whereas, the main challenge that is
faced in the online learning is the substantial number of sample to train the classifier. In
contrast, the number of samples to train a non-online or the base classifier needs less amount
of training samples. If we compare their performance, the base classifier will give a
respectable accuracy in the initial query samples, whereas the online learner will perform
better in long run. Therefore, it can be assumed that a combination of these two can be a
solution if we can adjust them and utilise them in their point of best performance. Therefore,
this work proposed the below framework blending both the classifier, via cascade classifier
method.
Figure 5.1: Proposed Adaptive biometric framework using cascade based classifier selection.
In the above framework, the base classifier and the online classifier version of the base
classifier are cascades in a framework. As shown in the Figure the training images are both
utilised by the base classifier for training and offline training for the online classifier.
Whereas the test images are used for testing in base classifiers and in the online version, it
is also used for online training. The base classifier cascades the online version of it. If the
output of the base classifier is rejected with low confidence score less than t, then
classification decision of online version of the base classifier is considered as the output,
otherwise, the decision of the base classifier is considered as the output. Although must be
mentioned that the framework can face a risk of FAR but ensure better FRR. The online
classifiers used for the proposed framework are described in the next sections.

Towards Multi-modal Sclera and Iris Biometric Recognition with Adaptive Liveness Detection
152 | P a g e
5.2. Ensemble of Classifiers
Since the inception of ensemble-based classification, it has been one of the most studied
classification methods [151, 152]. Ensemble-based classifiers have often been used in past
for performing incremental/online learning [144, 146, 147, 150, 152, 153]. The principle
behind the ensemble decision is that the individual predictions combined appropriately
should have better overall accuracy, on average, than any individual ensemble member
[152]. There are various reasons why an ensemble-based classification is chosen over a
single classifier, a few are listed below.
1. No free lunch theorem states that in the absence of prior knowledge about a problem, no
one classifier is universally better than any other classifier [154], this also includes
random guessing.
2. In the case of extremely high dimensional data, a single classifier’s complexity may scale
with the dimensionality of the data thus making the generation of a reliable single
classifier infeasible. Instead of a single classifier, generate multiple classifiers on different
subsets of features thus reducing the complexity of each classifier trained on the subset.
3. Single classifiers may not work well with data that are too little or too large in size. To
work around this problem, ensembles can generate classifiers on multiple bootstrap
datasets.
4. Reduces bias towards majority class (a class that is well represented by training samples).
And generating single strong classifier may be infeasible due to computational costs.
The success of ensemble learning algorithms is believed to depend both on the accuracy
and on the diversity among the base learners [155] and some empirical studies revealed that
there is a positive correlation between accuracy of the ensemble and diversity among its
members [156, 157]. Breiman [69] also shows that random forests with lower generalisation
error have a lower correlation among base learners and higher base learners’ strength.
Besides, he derives an upper bound for the generalisation error of random forests which
depends on both correlation and strength of the base learners.
Literature suggests that there is a trade-off between base learner’s accuracy and
diversity, meaning that lower accuracy may indicate higher diversity. However, a study in
[158] shows that relationship between accuracy and diversity is not straightforward and
lower accuracy may not essentially mean higher diversity. A recent study in Freund et al,
[159, 160] discusses that when, how and why ensembles of learning machines can help to
handle concept drift in online learning, through a diversity study in the presence of concept
drift. This work presents an analysis of low and high diversity ensembles combined with

Towards Multi-modal Sclera and Iris Biometric Recognition with Adaptive Liveness Detection
153 | P a g e
different strategies to deal with concept drift and proposes a new approach “Diversity for
Dealing with Drifts” (DDD) to handle drifts. DDD maintains ensembles with different
diversity levels, exploiting the advantages of diversity to handle drifts and using information
from the old concept to aid the learning of the new concept. The authors claim that DDD is
accurate both in the presence and in the absence of drifts.
In a recent study in Kunwar et al, [161] has reiterated the efficacy of ensemble-based
learning to create an adaptive/online learning system for handwritten character recognition,
have used that method to make an adaptive biometric system which learns using one sample
at a time. The system as presented in Kunwar et al, [161] is briefly described below.
The block diagram is shown in the Figure.5.2 shows the overall picture of the online learning
method proposed in Kunwar et al, [161]. The method proposed in the work is to conduct
both online supervised as well as online semi-supervised learning. In general, to conduct
semi-supervised learning abundant unlabeled data is required but unfortunately, we have
very limited number of samples/class in the biometric learning problem. Therefore, only
online supervised learning can be conducted but with the availability of more data in future,
semi-supervised online learning as well can be used. Technical details are given below:
Let us introduce some notation to describe the data. Training dataset 𝜒 =
{(𝑋1, 𝑌1)… (𝑌𝑁 , 𝑌𝑁)} where 𝑋𝑖 = 𝑥1𝑖 …𝑥𝐷
𝑖 , 𝑋𝑖𝜖 𝑅𝐷, are the samples in a D
dimensional feature space and 𝑌𝜖{1,…𝐾} are the corresponding labels for a K-class
classification problem.
Using Bayes rule and conditional independence among the feature given the class label
(assumption used to formulate Naïve Bayes classifier), can write the posterior probability
as:
𝑃(𝑌 = 𝑦𝑘|𝑥1…𝑥𝐷) =𝑃(𝑌=𝑦𝑘)∏ 𝑃(𝑥𝑖|𝑌=𝑦𝑘𝑖 )
∑ 𝑃(𝑌=𝑦𝑗)𝑃(𝑥1…𝑥𝐷|𝑌=𝑦𝑗)𝑗 (5.2)
So to train classifier can fit a Gaussian 𝒩(𝑥𝑖; µ𝑖�̂� , 𝜎𝑖𝑘2̂ ) to each 𝑃(𝑥𝑖|𝑌 = 𝑦𝑘), and estimate
mean and variance for the same using the training data. Next, perform Maximum Likelihood
Estimation (MLE) to find the mean µ𝑖�̂� and variance 𝜎𝑖𝑘2̂ of 𝑃(𝑥𝑖|𝑌 = 𝑦𝑘) for each feature 𝑥𝑖,
which is just equal to sample mean and sample variance respectively. And the classification
rule for a new sample 𝑋𝑛𝑒𝑤 =< 𝑥1…𝑥𝐷 > can be written as
𝑌𝑛𝑒𝑤 = arg𝑚𝑎𝑥𝑦𝑘 𝑃(𝑌 = 𝑦𝑘)∏ 𝑃(𝑥𝑖|𝑌 = 𝑦𝑘𝑖 ) (5.3)
𝑛𝑒𝑤 = arg𝑚𝑎𝑥𝑦𝑘 𝜋𝑘∏ 𝒩(𝑥𝑖𝑛𝑒𝑤; µ𝑖�̂�, 𝜎𝑖𝑘
2̂ )𝑖 (5.4)

Towards Multi-modal Sclera and Iris Biometric Recognition with Adaptive Liveness Detection
154 | P a g e
In order to make an ensemble of B classifiers, repeat the following steps B times: Randomly
select F features from the pool of D features. Estimate the learning parameters for the
classifier.
Figure. 5.2: Block diagram representing the batch learning (MLE) of Augmented Naive Bayes network [274].
A test sample will be classified by each classifier in the ensemble and the class which gets
the majority vote by the ensemble will get assigned to the test sample. In an above-explained
way an ensemble of B classifiers is trained as an initialization step, by just 1 samples/class.
Beyond this with time, as we get more samples of a class, we can update its respective
learning parameter as shown below in an online (on the fly) manner using 1 sample at a
time. This enables the system to adapt to the changes in the underlying distribution of input
samples. Initialization (by just one labelled training sample):
µ𝑖�̂� = 𝑥𝑖𝑘1 ; 𝜎𝑖𝑘
2̂ = 𝜎0 ; 𝜋𝑘 =1
𝑛𝑜. 𝑜𝑓 𝑐𝑙𝑎𝑠𝑠𝑒𝑠 ; 𝑐𝑘 = 1 ; 𝛼 = 𝛼0
Where 𝑐𝑘 = 𝑛𝑜. 𝑜𝑓 𝑠𝑎𝑚𝑝𝑙𝑒𝑠 𝑢𝑠𝑒𝑑 𝑠𝑜 𝑓𝑎𝑟 𝑓𝑜𝑟 𝑡𝑟𝑎𝑖𝑛𝑖𝑛𝑔,
𝛼 = 𝑑𝑒𝑐𝑖𝑑𝑒𝑠 𝑡ℎ𝑒 𝑙𝑒𝑛𝑔𝑡ℎ 𝑜𝑓 𝑚𝑒𝑚𝑜𝑟𝑦 𝑜𝑓 𝑡ℎ𝑒 𝑐𝑙𝑎𝑠𝑠𝑖𝑓𝑖𝑒𝑟 (α < 1)
Repeat steps below for all the incoming labelled training samples for any class k:
𝑐𝑘 = 𝑐𝑘 + 1 ; 𝜂𝑘 = (1−𝛼
𝑐𝑘+ 𝛼) (5.5)
where ηk is learning rate for class k

Towards Multi-modal Sclera and Iris Biometric Recognition with Adaptive Liveness Detection
155 | P a g e
µ𝑖𝑘(𝑡) = (1 − 𝜂𝑘)µ𝑖𝑘(𝑡 − 1) + 𝜂𝑘𝑥𝑖𝑗𝛿(𝑌𝑗 = 𝑦𝑘) (5.6)
𝜎𝑖𝑘2 (𝑡) = (1 − 𝜂𝑘)𝜎𝑖𝑘
2 (𝑡 − 1) + 𝜂𝑘 (𝑥𝑖𝑗− µ𝑖𝑘(𝑡))
2
𝛿(𝑌𝑗 = 𝑦𝑘) (5.7)
In the same paper of Kunwar et al.[161], another method has been suggested to conduct
online learning in a semi-supervised manner. The only difference between supervised online
learning and semi-supervised online learning lies in the definition of learning rate. Learning
rate definition for semi-supervised learning is:
𝜂𝑘 = 𝑞𝑘 (1−𝛼
𝑐𝑘+ 𝛼) 𝜆 ; (α < 1) (5.8)
Where λ = weight factor applied to moderate the contribution of unlabelled data in the
parameter estimation step.
If an incoming new sample is unlabelled then the trained classifier is used to produce the
posterior 𝑞𝑘 = 𝑃(𝑌𝑗 = 𝑦𝑘|𝑋) corresponding to all k (class). This posterior will be used to
calculate the learning rate corresponding to all the classes and subsequently this learning
rate will be used to update learning parameters of all the classes as is done in case of the
supervised online learning.
In Kunwar et al, [161] the authors have upgraded the Naive Bayes network structure and
have suggested a method to conduct an online learning for that upgraded network. The
network structure was upgraded to get rid of the Naïve Bayes unrealistic assumption of
conditional independence between different features given the class label. The structure was
upgraded with a restriction that all the features will have at most two parents (earlier each
had just one) Figure 5.3. The improved structure was proved to be working much better in
the concerned application. The technical detail is briefly explained below.
Figure 5.3: Left: Bayes net for Naive Bayes. Right: Bayes net for Augmented Naive Bayes [274].
𝑃(𝑋𝑖|𝑋𝑖−1, 𝑌) can be parameterized by the following Gaussian distribution:
𝑃(𝑋𝑖|𝑋𝑖−1, 𝑌) = 𝑁(𝛽0 + 𝛽1𝑋𝑖−1, 𝜎2)
The author in Kunwar et al, [161] performs MLE estimation to evaluate the learning
parameters 𝛽0, 𝛽1 𝑎𝑛𝑑 𝜎2 for supervised learning

Towards Multi-modal Sclera and Iris Biometric Recognition with Adaptive Liveness Detection
156 | P a g e
𝛽1 = 𝐸𝐷[𝑋𝑖𝑋𝑖−1]− 𝐸𝐷[𝑋𝑖]𝐸𝐷[𝑋𝑖−1]
𝐸𝐷[𝑋𝑖−1𝑋𝑖−1]−(𝐸𝐷[𝑋𝑖−1])2= 𝛴𝑋𝑖−1𝑋𝑖−1
−1 𝛴𝑋𝑖𝑋𝑖−1 (5.9)
𝛽0 = 𝜇𝑋𝑖 − 𝛴𝑋𝑖−1𝑋𝑖−1−1 𝛴𝑋𝑖𝑋𝑖−1𝜇𝑋𝑖−1 (5.10)
𝜎2 = 𝛴𝑋𝑖𝑋𝑖 − 𝛴𝑋𝑖𝑋𝑖−1𝛴𝑋𝑖−1𝑋𝑖−1−1 𝛴𝑋𝑖𝑋𝑖−1 (5.11)
The authors further propose to update 𝐸𝐷[𝑋𝑖 ], 𝐸𝐷[𝑋𝑖−1], 𝐸𝐷[𝑋𝑖−1𝑋𝑖−1],
𝐸𝐷[𝑋𝑖𝑋𝑖−1] in an online manner in order to update 𝛽0, 𝛽1𝑎𝑛𝑑 𝜎2 because they are the
building block which is obvious from their definition. Hence, it can be written as:
𝐸𝐷[𝑋𝑖 ](𝑡) = (1 − 𝜂𝑘)𝐸𝐷[𝑋𝑖 ](𝑡 − 1) + 𝜂𝑘𝑋𝑖 (5.12)
𝐸𝐷[𝑋𝑖−1 ](𝑡) = (1 − 𝜂𝑘)𝐸𝐷[𝑋𝑖−1 ](𝑡 − 1) + 𝜂𝑘𝑋𝑖−1 (5.13)
𝜎𝑋𝑖−1 2 (𝑡) = (1 − 𝜂𝑘)𝜎𝑋𝑖−1
2 (𝑡 − 1) + 𝜂𝑘(𝑋𝑖−1 − 𝐸𝐷[𝑋𝑖−1 ](𝑡))2 (5.14)
Covariance between two RVs, A and B is given by:
𝜎𝐴,𝐵 = 𝐸[𝐴𝐵] − 𝐸[𝐴] 𝐸[𝐵] (5.15)
Therefore:𝐸𝐷[𝑋𝑖−1𝑋𝑖−1](𝑡) = 𝜎𝑋𝑖−1 2 (𝑡) + {𝐸𝐷[𝑋𝑖−1 ](𝑡)}
2
Similarly:𝜎𝑋𝑖 𝑋𝑖−1 (𝑡) = (1 − 𝜂𝑘)𝜎𝑋𝑖 𝑋𝑖−1 (𝑡 − 1) + 𝜂𝑘(𝑋𝑖 − 𝐸𝐷[𝑋𝑖 ](𝑡))(𝑋𝑖−1 −
𝐸𝐷[𝑋𝑖−1 ](𝑡))
Using the above equations:
𝐸𝐷[𝑋𝑖𝑋𝑖−1](𝑡) = 𝜎𝑋𝑖 𝑋𝑖−1 (𝑡) + 𝐸𝐷[𝑋𝑖 ](𝑡)𝐸𝐷[𝑋𝑖−1 ](𝑡) (5.16)
In the equations above, 𝜂𝑘 refers to learning rate and its definition is same as in case of
Naïve Bayes online learning case. And along similar lines, online semi-supervised learning
was proposed with a changed definition of learning rate. It has been shown that the upgraded
network performs much more accurately as it captures the relationship between different
features and accordingly learns. Details can be found in Kunwar et al, [161].
5.3. Incremental/Adaptive Support Vector Machines (SVMs)
SVM is based on a kernel method; however unlike suboptimal kernel methods, as in the
case of a kernel method based on clustering, kernel methods for SVMs are optimal, with the
optimality being rooted in convex optimisation. Realising the theoretical strength of SVMs,
researchers have developed incremental versions of them. And considering the fact that
incremental SVMs have never been explored in the biometric domain, it becomes

Towards Multi-modal Sclera and Iris Biometric Recognition with Adaptive Liveness Detection
157 | P a g e
imperative to discuss SVMs and their incremental versions in the context of adaptive
biometrics.
Classification and regression methods based on SVMs in Vladimir and Vapnik [162] are
very powerful, which generalise well even in the case of very sparse and high dimensional
data. SVM is based on Vapnik’s structural risk minimization induction principle which
carries out searching over hypothesis classes of varying capacity with best generalisation
performance.
A two-class classifier based on SVM can be represented as 𝑓(𝑋) = 𝑤.𝜑(𝑋) + 𝑏 are
learned from the data 𝜒 = {(𝑋1, 𝑌1)… (𝑌𝑁 , 𝑌𝑁)} where 𝑋𝑖 =
𝑥1𝑖 …𝑥𝐷
𝑖 , 𝑋𝑖𝜖 𝑅𝐷 𝑎𝑛𝑑 𝑌𝑖 𝜖 {−1,1} by minimizing
min 𝑤,𝑏,𝜉
1
2||𝑤||2 + 𝐶∑ 𝜉𝑖
𝑝𝑁𝑖=1 (5.17)
For 𝑝 ∈ {1,2} subject to the constraints (soft margin)
𝑌𝑖(𝑤. 𝜑(𝑋𝑖) + 𝑏) ≥ 1 − 𝜉𝑖𝑝, 𝜉𝑖
𝑝 > 0 ∀ 𝑖 ∈ {1, …… ,𝑁} (5.18)
A set of slack variables are introduced for the system to allow few samples to be on the
wrong side of the margin (to handle overlapping class distributions) but impose penalty of
𝜉𝑖𝑝 = |𝑌𝑖 − 𝑓(𝑋𝑖)|𝑝 over the objective cost for the samples to be on the wrong side of the
margin boundary. Value of 𝜉𝑖𝑝 = 0 for being on the correct side of the margin boundary. p
= 1 is what generally preferred in practice because of the robustness to outliers that hinge
loss offers as compared to the quadratic loss which corresponds to p = 2. The goal is to
minimize above the objective function while softly penalizing the points that lie on the
wrong side of the margin boundary. Parameter C > 0 controls the trade-off between the slack
variable penalty and the margin. Above minimization can be done using quadratic
programming but to simplify and take advantage of the kernel trick the above minimization
problem is expressed in its dual form
min0≤𝛼𝑖≤𝐶
𝑊 = 1
2∑ 𝛼𝑖𝑄𝑖𝑗𝛼𝑗𝑁𝑖,𝑗=1 − ∑ 𝛼𝑖𝑁
𝑖=1 + 𝑏 ∑ 𝑌𝑖𝛼𝑖𝑁 𝑖=1 (5.19)
With the Lagrange multiplier (and offset) b and 𝑄𝑖𝑗 = 𝑌𝑖𝑌𝑗𝜑(𝑋𝑖). 𝜑(𝑋𝑗). The above dual
form of the original minimization problem must satisfy the famous Karush-Kuhn-Tucker
(KKT) condition. The KKT conditions generally involves the Primal constrains, dual
constrains and complementary slackness. Therefore the above dual form along with the
KKT condition gives rise to a linearly constrained quadratic programming problem. And
there are standard solvers available to solve them. The resulting dual form of the SVM is
then 𝑓(𝑋) = ∑ 𝑦𝑖𝛼𝑖𝑁𝑖=1 𝜑(𝑋𝑖)𝜑(𝑋) + 𝑏. Point to be noted here is that the transformed
sample now only appear in dot product. Therefore one can employ a positive definite kernel

Towards Multi-modal Sclera and Iris Biometric Recognition with Adaptive Liveness Detection
158 | P a g e
function to implicitly project the input samples into some high dimensional (which can be
infinite) space and calculate the dot product to perform classification or regression in that
space.
In the mid-90’s Support Vector Machines (SVMs) emerged and subsequently researcher’s
interest in its online version arose. Early work on this subject by [163] suggests that for each
new batch of data, a Support Vector Machine is trained on the new data and the Support
Vectors from the previous learning step. And the logic behind this approach is that the
decision function of an SVM depends only on its Support Vectors, i.e. training an SVM on
the Support Vectors alone results in the same decision function as training on the whole data
set. Because of this, one can expect to get an incremental result that is equal to the non-
incremental result, if the last training set contains all examples that are Support Vectors in
the non-incremental case. However, the shortcoming of this approach is that as there are
typically only very few Support Vectors, their influence on the decision function in the next
incremental learning step may be very small if the new data is distributed differently. Note:
Support Vectors are a sufficient description of the decision boundary between the examples,
but not of the examples themselves.
The above problem was addressed in [164] by making a clever change in the objective
function to be optimised, and i.e. by making the error on old Support Vectors (which
represent the old learning set) more costly than an error on a new example. Details can be
found on the concerned paper. At the same time [165] exploits the locality of the RBF kernel
to build online SVM. The authors do not use all the previous support vectors (as done in
[67, 68]), instead, it only uses the support candidates in the neighbourhood of the new
incoming sample. Though deciding the neighbourhood is critical, the method would be fast.
However above three approaches and methods proposed by [166]; provide an only
approximate solution and may require many passes through the dataset to reach a reasonable
level of convergence.
An exact solution to the problem of online SVM learning has been found by [167]. Their
incremental algorithm updates an optimal solution of an SVM training problem after one
training example is added (or removed). In this, the authors construct the solution
recursively one point at a time such that the KKT condition is satisfied over all the data are
already seen as well as the new incoming samples.
The first order condition on W reduces to KKT condition:
𝑔𝑖 = 𝜕𝑊
𝜕𝛼𝑖= ∑ 𝑄𝑖𝑗𝛼𝑗𝑁
𝑗=1 + 𝑌𝑖𝑏 − 1 = 𝑌𝑖𝑓(𝑋𝑖) − 1 (5.20)
𝑔𝑖 = { ≥ 0 𝛼𝑖 = 0
= 0 0 < 𝛼𝑖 < 𝐶 ≤ 0 𝛼𝑖 = 𝐶

Towards Multi-modal Sclera and Iris Biometric Recognition with Adaptive Liveness Detection
159 | P a g e
𝜕𝑊
𝜕𝑏=∑𝑦𝑗𝛼𝑗
𝑁
𝑗=1
= 0
This partitions the data into three categories:
A) 𝑥𝑖 ∈ 𝑆 ⊂ 𝜒 where S is a set of margin support vectors, strictly on the margin (i.e.
𝑌𝑖𝑓(𝑋𝑖) = 1).
B) ∈ 𝑂 ⊂ 𝜒, where O is the set of other vectors for which 𝑌𝑖𝑓(𝑋𝑖) > 1 i.e. the sample is on
the correct side of the margin boundary (correctly classified).
C) 𝑥𝑖 ∈ 𝐸 ⊂ 𝜒 where E is a set of error vectors 𝑌𝑖𝑓(𝑋𝑖) < 1, sample is on the wrong side
of the margin boundary but not necessarily misclassified.
The set R = {O ∪ E} is a set of reserve vectors. Lowercase letters s, e, o and r will be used
to refer to such kind of partitions.
By writing the KKT conditions before and after an update Δ𝛼 obtain the following
conditions that must be satisfied after an update [167]:
[
Δg𝑐
Δg𝑠
Δg𝑟
0
] = [
Y𝑐
Y𝑠
Y𝑟
0
Q𝑐𝑠
Q𝑠𝑠
Q𝑟𝑠
Y𝑠𝑇
] [Δ𝑏Δ𝛼𝑠
] + Δ𝛼𝑐 [
Q𝑐𝑐𝑇
Q𝑐𝑠𝑇
Q𝑐𝑟𝑇
Y𝑐
] (5.21)
It is easy to see that Δ𝛼𝑐 is in equilibrium with Δ𝛼𝑠 and Δb in order for the above condition
to hold. Considering the fact that Δg𝑠 = 0, from line 2 and 4 of the above equation can be
written:
[00] = [
0 Y𝑠𝑇
Y𝑠 Q𝑠𝑠] Δ𝑠 + [
Y𝑐
Q𝑐𝑠𝑇] ; 𝑤ℎ𝑒𝑟𝑒 Δ𝑠 = [
Δ𝑏Δ𝛼𝑠
] (5.22)
Above linear equation can be solved for Δ𝑠
Δ𝑠 = 𝛽Δ𝛼𝑐
Where
𝛽 = − [0 Y𝑠𝑇
Y𝑠 Q𝑠𝑠]−1
[Y𝑐
Q𝑐𝑠𝑇] (5.23)
is the gradient of the manifold of optimal solutions parameterized by 𝛼𝑐
Similarly from line 1 and 3
Towards Multi-modal Sclera and Iris Biometric Recognition with Adaptive Liveness Detection
160 | P a g e
[Δg𝑐
Δg𝑟] = 𝛾Δ𝛼𝑐 (5.24)
Where
𝛾 = [Y𝑐 Q𝑐𝑠
Y𝑟 Q𝑟𝑠] 𝛽 + [
Q𝑐𝑐𝑇
Q𝑐𝑟𝑇] (5.25)
is the gradient of the manifold of gradient g𝑟 at an optimal solution parameterized by 𝛼𝑐.
These refined set of equations shows that that update process is controlled by very simple
sensitivity relation: Δ𝑠 = 𝛽Δ𝛼𝑐 and [Δg𝑐 Δg𝑟]𝑇 = 𝛾Δ𝛼𝑐, where 𝛽 is the sensitivity of
Δ𝑠 with respect to Δ𝛼𝑐 and 𝛾 is the sensitivity of Δg𝑐 𝑎𝑛𝑑 Δg𝑟 with respect to Δ𝛼𝑐.
At this stage to carry out the parameter update process, the key is to find out the largest
possible increment of Δ𝛼𝑐 and subsequently Δ𝑠 and Δ𝑔 is updated. Authors of
Cauwenberghs and Poggio [167] have very exhaustively addressed all the cases by which
one can determine the largest value of Δ𝛼𝑐. And once the step is determined, one can follow
the steps of algorithm 1 given in Laskov et al, [168] to carry out online learning.
Finding an absence of a well-accepted implementation of the work by [167]; [168] proposed
a new design of storage and numerical operation which speeds up the incremental SVM
training by a factor of 5 to 20. On the similar line, [169] have applied the accumulated
knowledge of optimisation to the computational problem presented by the SVM to propose
a very efficient way of training SVM in an incremental fashion.
5.4. Incremental/Adaptive Neural Network
Neural Networks is one of the oldest methods of machine learning, it is very obvious that
umpteen amount of work has been done on that domain and many of them deal with
incremental and adaptive learning. Following is the list of few Neural Network which can
be useful to create an adaptive biometric system.
Fuzzy ARTMAP: This is a neural network based structure and it is one of the earliest
methods used in incremental learning. The fuzzy ARTMAP has two fuzzy ART modules
that are linked via an inter-art module known as “map field”. The map field is used to form
predictive categories for learning class association. Fuzzy ARTMAP will generate new
decision clusters in response to new input patterns that are sufficiently different from
previously seen instances. The ’sufficiently different’ patterns are controlled using a free
parameter of ARTMAP known as the vigilance parameter. ARTMAP is sensitive to the
vigilance parameter especially in presence of significant noise in the training data. Using
stability and match tracks, fuzzy ARTMAP automatically constructs as many categories as
are needed to learn any static training set to 100%. Thus, fuzzy ARTMAP may over-fit,
leading to poor generalisation.
Towards Multi-modal Sclera and Iris Biometric Recognition with Adaptive Liveness Detection
161 | P a g e
Learn ++: This is one of the most notable families of the incremental learning algorithm,
which was first introduced by Polikar et al. in [170] and later upgraded by few other authors
for e.g. [171]. It creates multiple classifiers to each data chunk presented to the system.
Inspired by AdaBoost [172, 173] for each chunk, the training set for each base learner is
created by sampling examples according to a distribution of probability. Like AdaBoost,
Learn++ maintains a distribution of instance weights; however, Learn++ does not update
the weights in the same manner as performed with AdaBoost. In AdaBoost, the distribution
of probability is built to give higher priority to instances misclassified by the last previously
created classifier whereas Learn++ uses the ensemble decision, rather than the decision of
the latest classifier. When a new dataset arrives, the distribution is re-initialized by
evaluating the entire ensemble and initializing the distribution. Pros: Learn++ does not have
to access the previous data chunks and it demonstrates considerable improvement at
generalisation when compared with fuzzy ARTMAP on common databases. Cons: Problem
is that a new set of classifiers is created for each new data chunk. So, the ensemble size can
become extremely large considering lifelong learning.
Self-Organized Incremental Neural Network (SOINN): This is an unsupervised
incremental learning method which was proposed in [178] for topology learning and
classification to handle noisy unlabelled data. This method is essentially a combination of
the self-organizing map [180] and competitive Hebbian learning [181, 182] which can be
used to learn the topology of the input data stream. The proposed algorithm makes a two-
layered neural network Figure 5.4. The first layer which represents a reasonable topological
structure of unlabelled data gives a reasonable number of clusters and gives a typical
prototype pattern of every cluster. Prior knowledge regarding the number of classes or
codebook is not required.
The first layer learns the density distribution of the input pattern. Subsequently, the output
of the first layer serves as the input of the second layer, where the different clusters are
separated by detecting the low-density overlap area. The method uses similarity threshold
and a locally accumulated error-based insertion criterion for growing the system
incrementally and accommodating the input patterns of online non-stationary data
distribution. It also uses an online criterion to delete nodes from the low probability regions
and this enables the system to separate the cluster and simultaneously eliminate the noise
noisy samples from the input data. Authors use “error radius” as the utility parameters to
control the growth of a number of nodes in the network and check successful node insertion.
Though the method has been successfully applied to some real-time problems, it has several
limitations for e.g. a) in case of high-density overlap it is difficult for the method to separate
the clusters b) several important parameters value need to be decided by the users which
increase the chances that the system getting used sub-optimally. On the similar lines, authors
have further modified the SOINN to make a semi-supervised incremental active learning

Towards Multi-modal Sclera and Iris Biometric Recognition with Adaptive Liveness Detection
162 | P a g e
system [179] which is very promising and claims have been made that this method can be
very useful to create a never-ending learning system.
Figure 5.4: Flowchart of SOINN, shows the basic overflow of the proposed algorithm. This Figure has been
taken from [180, 274].
5.5. Experimental details and results
Two set of experiment was performed for AB, They are summarised in the next
subsections.
5.5.1. Experiment on the UBIRIS Version 1
In order to evaluate the effectiveness of the discussed incremental learning algorithms a part
of UBIRS version 1 was employed. One of the discussed methods is used to develop an
adaptive sclera biometric system. Similar sclera pre-processing as proposed in Chapter 3
was performed. Fuzzy C-means clustering was used to segment the sclera. A histogram
equalisation on the green channel, followed by a bank of the filter based on Discrete Meyer
wavelet was used to enhance the vessel patterns. Sclera feature extraction based on the D-
LDP was performed. The irises were segmented along the radius by calculating the centre
and the radius by the integrodifferential operator and further enhanced using an adaptive

Towards Multi-modal Sclera and Iris Biometric Recognition with Adaptive Liveness Detection
163 | P a g e
histogram equalisation technique. The red channel of the colour image was used for iris
image enhancement. Image level fusion was performed using iris and sclera, and
subsequently, the patterns were classified using the developed features.
It was observed that the number of participants in the two sessions was not the same which
produced a very uneven number of samples corresponding to different individuals. Even
the number of the population was different for the two sessions. The first session consisted
of 241 users and in the second session, there were 135 users. Experiments have used 50 out
of 241 total classes present because many classes did not have data from both sessions which
makes the number of samples too few to apply the learning algorithm over them.
Experiments did not use a few classes because the iris and sclera region of the participants
were too occluded to be used for learning. For experiment as a learner, incremental Naive
Bayes classifier as proposed in [164] was used. The number of features used for each class
was 30480. The total number of classes used was 50. For each feature, a single Gaussian of
the form 𝑃(𝑥𝑖|𝑌 = 𝑦𝑘) corresponding to each class was fitted. Where i and k refer to ith
feature and kth class, respectively. The classifier is initially trained offline with few numbers
of samples using maximum likelihood estimation. Subsequently, updated the learning
parameters of each Gaussian corresponding to each class in the online fashion as discussed
in Section 1.3.1 and in [161]. The value of constant 𝛼 was empirically decided to be 0.55
for the experiments. The work did not concentrated on creating ensemble of classifiers and
semi-supervised learning as the iris no enough data per class to create different classifiers.
But creating an ensemble using a randomization technique is a powerful technique to create
a boost in accuracy of the classifier.
Few parameters used in the learning method employed are as follows:
A) 𝑐𝑘 which keeps track of the number of samples that have been used for each class for
online training.
B) 𝛼 it is a constant which decides the length of the memory of the classifier, it influences
the value of 𝜂𝑘which decides how much weight must be given (in general and when the
convergence (when 𝑐𝑘 → ∞) is achieved) to the new incoming samples in the learning
parameter estimation step.
C) 𝜂𝑘 is the learning rate parameter whose value depends on the value of count of samples
and the value of α and the value of 𝑐𝑘. The detailed discussion over the role of these
parameters in learning process is given in [161].
The results table shows the accuracy of the applied method under different settings of the
experiments. Considering the fact that Naive Bayes is a classifier which is based on a very

Towards Multi-modal Sclera and Iris Biometric Recognition with Adaptive Liveness Detection
164 | P a g e
strong assumption of conditional independence among the features given the class, it is
performing reasonably well. Therefore it can be assumed that the stronger version of
incremental learning algorithms could perform even better. This experimental process
shows that larger accuracies can be achieved using incremental learning in the biometric
domain by more experimentation with other adaptive learning techniques available in the
machine learning literature.
Table 5.1. Results show that adaptive/online Naïve Bayes classifier is more accurate (fusing sclera and iris at
image level fusion ). Adaptive classifiers are initially trained with a few samples in batch/offline mode and
later learn in an online/adaptive manner i.e. using one sample at a time. For example row 2:- classifier was
initially trained with 5 samples per class, subsequently it was adaptively trained with 2 samples per class and
later tested with 3 samples per class.
Classifier Name Training/Testing Accuracy (%)
Naive Bayes (NB) 7 offline/3 60
Online/adaptive NB 5 offline + 2 online/3 72
Online/adaptive NB 5 offline + 3 online/2 86
Online/adaptive NB 5 offline + 4 online/1 88
5.5.2 Experiments on Proposed Dataset
To overcome the drawback of the above-mentioned experiment and justify the proposed
framework, a new dataset was developed. It consists of images from 37 individual, for each
individual 200 samples eye images were collected. The images were captured from the
camera of Lenovo K3 note mobile. The users were asked to look at random angles, while
the images were captured. The base classifier was trained by first 50 samples, rest of the
images were used for testing. For online classifier initiation was done by 10 samples and
140 samples for online training, rest of the images were used for testing. A high variation in
a trait due to the change in gaze angle of the eye is reflected from the sample images in
Figure 5.5.
Figure 5.5. Example of images from the proposed dataset for AB with a large sample.
For segmentation, at first the corner of the eye was detected and the image is cropped along
the boundary of the eye, to minimise the effect of illusion on segmentation algorithm used
(C-means as proposed in Chapter 3). For sclera enhancement, an adaptive histogram
equalisation (as used in earlier work) was applied on the green channel of the image.
Followed by second derivatives, using the Hessian matrix used in [1] is employed to get the

Towards Multi-modal Sclera and Iris Biometric Recognition with Adaptive Liveness Detection
165 | P a g e
final enhanced image. The pre-processing technique proposed for iris in chapter 3 was used
for iris segmentation and enhancement. For feature extraction, D-LDP descriptors were
used. An information fusion of sclera and iris was performed in the sensor/image level after
pre-processing them individually. A base classifier and online classifier of SVM, NN (online
version used was Fuzzy ARTMAP) and NB were used. From the Table 5.2, the validity of
the prosed framework can be perceived.
Table 5.2: Result of the different classifiers used in the framework and their individual performances in EER
%.
Type of Classifier Base Classifier Online Classifier Framework
NB 31.55 55.25 65.76
SVM 40.69 63.45 70.33
NN 50.98 68.59 76.22
Significant improvement is achieved in the result of the framework in comparison to the
base and online classifier, still, more experiment is required performed to attend the better
performance.
5.6 Summary This chapter discusses many potential existing adaptive learning methods, which can be
applied in the biometric domain to create a robust adaptive biometric system. A framework
coupling online and the base version of the classier is proposed. To demonstrate this one
existing learning method to create an adaptive multimodal ocular approach using iris and
sclera was applied. It is evident from the experiments that the adaptive/incremental system
applied outperforms the base classifier performance. It is also evident from the results that
when the numbers of samples are increased, the adaptability also improves. Due to lack of
availability of a large number of samples, other theories like online semi-supervised learning
methods were not tested.
Further, to explore all the promising adaptive techniques in the biometric domain, to
justify the framework and build a reliable never-ending learning biometric system a dataset
is developed. A significant improvement in the accuracy is achieved applying the
framework. Future work should involve in developing the framework to attend the higher
performance.

Towards Multi-modal Sclera and Iris Biometric Recognition with Adaptive Liveness Detection
166 | P a g e

Towards Multi-modal Sclera and Iris Biometric Recognition with Adaptive Liveness Detection
167 | P a g e
6
Contribution to Other Fields of Pattern
Recognition
This chapter addresses and summarises the contribution of the thesis to other closely connect
topic of the thesis in the field of biometrics and pattern recognition. The contributions are
discussed in the next three sub-sections. Major parts of the chapter have been published in
the articles Das et al. [268, 276].
6.1. Multi-Script Signature Verification
Most law enforcement agencies, governments of various countries, financial institutions, or
forensic units use the signature as identity proof in their daily activities3. Usually, signature
verification involves a manual procedure carried out by Forensic Handwriting Experts
(FHEs), where individual characteristics of the signature are observed, such as inclination,
slant, hooks, the relationship between letters, and so on, using a common set of protocols
and methods. This analysis is time-consuming and moreover, its performance depends on
many factors such as expertise of the observer, availability of data and sample quality. To
mitigate these drawbacks, ASV (Automatic Signature Verification) has been proposed.
Computer vision and pattern recognition frameworks have been employed to build such
systems, in which the signatures are mathematically modelled, and further, a quantitative
similarity called the likelihood is calculated to identify the query signature. Such systems
are nowadays becoming accepted for law enforcement agencies, governments of various
3 http://legal-dictionary.thefreedictionary.com/signature

Towards Multi-modal Sclera and Iris Biometric Recognition with Adaptive Liveness Detection
168 | P a g e
countries, financial institutions and courts. As a result, various commercial ASV systems
have become available4.
Signature verification schemes are usually focused on a single-script environment (Here
by script means the set of letters or characters i.e. different symbols, used for writing a
particular language). The multi-script signature scenario is also a very practical situation,
which can be encountered in international security or forensic paradigms, where aggregation
of a variety of script signatures coming from different geographical areas can be
encountered. The performance of multi-script based ASV scenarios has hardly been studied
[183] in the literature. The multi-script scenario is usually studied by merging several
single-script databases to build a multi-script database and comparing their performance [2]
are compared with the single-script databases. Furthermore, the literature implies that the
performance Automatic Signature Verifier (ASV) reduces when applied to a multi-script
dataset [184]. The reason behind poorer results reported in the multi-script ASV scenario in
construct to the single-script database possibly could be due to the larger number of users.
However, to the best of the knowledge, no studies have focused on the database merging
procedure or proposing a statistical measure for a fair comparison of multi-script verses
single-script scenarios.
Therefore, in order to investigate the aforementioned gap in the literature, the present
work is conceived. This work proposes a statistical measure, as well as a merging procedure
for a fair comparison between single-script and multi-script databases. This study includes
extracting features from the signatures by various well-known techniques, and subsequently
perform an analysis of the different single-script and multi-script databases. Thereafter, a
statistical measure is also employed for a fair comparison of the multi-script vs. single-script
scenarios. Before explaining the proposed approach, the databases used, as well as the off-
line ASV feature extraction techniques, are briefly described.
6.1.1. Background
Automatic Signature Verification has been considered an active problem in the scientific
research community since the 1980's. The majority of initiatives have produced several
contributions to the field over the years [185-190]. However, some issues have not yet been
fully identified due to their recent emergence [190]. One such active aspect is multi-script
signature processing.
Western signatures are most commonly dealt with in regards ASV scenario in the research
community. These kinds of signatures have two different parts: the text and the flourish.
4 http://www.biometricupdate.com/service-directory/signature-verification

Towards Multi-modal Sclera and Iris Biometric Recognition with Adaptive Liveness Detection
169 | P a g e
The text has a more regular kinematic per signer. Conversely, the variation in the flourish is
unpredictable according to its lexical morphology [191]. In addition, the mean velocities in
both parts are very different: the flourish average velocity is not nearly as high as the text
velocity average. However, these features cannot be directly estimated from image-based
signatures. Whereas, Indian, Chinese and Japanese signatures consist of mainly short and
rapid strokes. This way, each pen-down is far smaller than the pen-downs of Western
signatures.
A large number of approaches proposed in the literature on non-Latin signature have
considered script-based text recognition and static signature recognition over the years
without dependence on the number of scripts or their combination [190]. In [192], the
authors evaluated three different signature scripts - Bengali, Devanagari and Roman –
throughout automatic signature systems. They found that the majority of system errors were
due to the misclassification of Bengali and Devanagari signatures. The same authors also
used a modified gradient feature and an SVM classifier for identification and verification
purposes in [193]. They concluded that the verification rates were more competitive for off-
line Hindi signature scripts than for English (the achieved False Acceptance Rate (FAR)
was more than twice for the latter). In the following work of [194], at first the identification
of the script are considered and then verifier method is applied accordingly to the detected
signature script (Hindi or English). In this work, the average error rate was significantly
reduced to 4.81%, mainly due to the first stage of script identification. For Bengali and
English off-line signature verification, in [195] the authors propose a combination of
gradient features and chain code features as templates for signature verification. They were
able to obtain similar high accuracies of 99.41%, 98.45%, and 97.75% using the respective
feature extraction techniques. In the case of English and Chinese static signature scripts, in
[196] the authors proposed a script identification approach on the basis of a foreground and
background technique. Their contribution for multi-script verification relied on script
identification before employing the verification process, which reached an accuracy 97.70%
during the identification stage.
This combination opens up some relevant questions to the currently used technology. On
the one hand, the accuracy of single-script systems can be progressed by the combination of
scripts. However, the system achieves a competitive performance with a Roman script or
Bengali script-based signature when considered separately, but similar accuracy is not
obtained when these scripts are combined. This way, we wonder about the real influence of
low accuracy in the multi-script ASV.
Therefore, although substantial research has previously been undertaken in the area of
signature verification, particularly involving single-script signatures, multi-script ASV
needs further attention. Moreover, a multi-lingual country like India has many different

Towards Multi-modal Sclera and Iris Biometric Recognition with Adaptive Liveness Detection
170 | P a g e
scripts that are used for writing as well as for signing purposes, based on different locations
or regions. In India, a single official transaction sometimes needs signatures using more than
one script. Thus, the consideration of signatures dealing with more than one or two scripts
is important mainly for multi-lingual and multi-script countries. Moreover, the development
of a general multi-script signature verification system is very complicated. This is where the
present research concentrates on investigating the real cause of the lower performance of
multi-script ASVs and proposes a fair method to analyse their performance.
6.1.2. Databases
To look into the cause of the lower performance in the multi-script scenario, eight different
databases have been used for the experimental study of this work. Some of them contain
western signatures, to follow up the single-script merging dataset case, whereas the others
include different scripts such as Devanagari, Bengali, Chinese and Arabic. The datasets are
described as follows:
1. The GPDS100 contains the first 100 signatures of the GPDS960 signature database [197],
which was recorded in Spain in Roman script. The signers used their own pen to sign on a
piece of paper. For each signer, it consists of 24 genuine signatures and 30 forgeries. The
24 genuine specimens of each signer were collected in a single day writing sessions. The
forgeries were produced from the static image of the genuine signature. Each forger was
allowed to practice the signature for as long as they required to produce the forgery. Each
forger imitated 3 signatures of 5 signers each day. The genuine signatures shown to each
forger are chosen randomly from the 24 genuine ones.
2. The MCYT100 contains the first 100 signatures of the MCYT online database from Spain
[16] in Roman script. This was recorded on a WACOM Tablet. Each user produces 25
genuine signatures, and 25 skilled forgeries are also captured for each user. These skilled
forgeries are produced by the 5 subsequent users by observing the static images of the
signature to imitate and to attempt to copy.
3. The SUSIG Visual [199] contains Roman script signatures of 94 users acquired in two
sessions. They were recorded in Turkey on an LCT touch device. Each signer supplied 20
samples of his/her signature in two different sessions, supplying 10 signatures at each
session. There was approximately a one-week time period in between the two signing
sessions. A total of 10 skilled forgeries (5 skilled and 5 highly-skilled) were collected for
each person. Skilled forgers watched an animation of the signature to be falsified and
practised as long as they required. Once they felt sufficiently skilled, they proceeded to write
the forged specimen.

Towards Multi-modal Sclera and Iris Biometric Recognition with Adaptive Liveness Detection
171 | P a g e
4. The NISDCC [200] was used for a signature competition during ICDAR 2009. It was
collected by the Netherlands Forensic Institute. This corpus comprises off-line Roman script
signatures of 79 users. Only 19 users of this database include forgeries. Each forger copied
the genuine signature as fluently as possible, focusing on mimicking the shape of the
specimen.
5. The SVC2004 [201] online database was collected in Hong Kong. It contains Chinese
and Roman script signatures of 80 users. This dataset was obtained from the SVC-2004
competition held in conjunction with the First International Conference on Biometric
Authentication (ICBA 2004). Each set of signers contains 20 genuine signatures and 20
skilled forgeries from five other contributors. To collect the forgeries, each contributor saw
the writing order in which the signature was written. Then, after practising, they decided
when to reproduce it.
6. The off-line Bengali [202] signature database was recorded in India with 100 signers
using paper as the medium for capturing the writing. From each individual, 24 genuine
signatures were collected. A total number of 2400 genuine signatures from 100 individuals
were collected. For each contributor, all genuine specimens were collected in a single day's
writing session. In addition, only skilled forged signatures were collected for this proposed
work. In order to produce the forgeries, the imitators were allowed to practice their forgeries
as long as they wished with static images of genuine specimens. A total number of 3000
forged signatures were collected from the writers.
7. The off-line Hindi dataset [202] was recorded in the same conditions as with the Bengali
one. From each individual, 24 genuine signatures were collected. A total number of 2400
genuine signatures from 100 individuals were collected. A total number of 3000 (10 per
signer) forged signatures were also collected from the writers.
8. Finally, the offline Arabic database [203] was recorded in Egypt and it contains 22
signers. A set of signature data consisting of 220 true samples and 110 forged samples was
used. Every signer was asked to sign 10 times using common types of pens (fountain pen or
ballpoint pen). For forgery signatures, 5 samples were collected; since it was very difficult
to source professional forgers volunteers were asked to simulate the true samples of all
persons. They were allowed to practice many times and correct their mistakes in the final
version of the forgery samples.
In the online corpuses, the off-line version was obtained by 8-connecting the on-line samples
through Bresenham’s lines algorithm and applying the ink deposition model [204, 206, 207].
This procedure allowed an increase in the number of off-line databases in the experiments.
The off-line resolution was adjusted to 600 dpi for all the databases through a bi-cubic

Towards Multi-modal Sclera and Iris Biometric Recognition with Adaptive Liveness Detection
172 | P a g e
interpolation obtained as a weighted average of pixels in the nearest 4×4 neighbourhood and
using the original resolution in which the signatures were collected. A few sample images
from the above-mentioned databases are shown in Figure 6.1. Finally, relevant information
for the datasets considered is summarised in Table 6.1. Apart from SVC2004 and SUSIG
Visual where writers are supposed to modify their original signature, the rest of the
databases included real signatures used daily by the signers.
Table 6.1: Main information of the considered datasets with genuine and the fake sample statistics
Name of the
Database No of Users
Genuine
per user
Forgeries per
user
Year of
development
Country
where
database was
developed
GPDS100 100 24 30 2012 Spain
MCYT100 100 25 25 2003 Spain
SUSIG Visual 94 20 10 2009 Turkey
NISDCC 100 12 6 from 19 user 2009 Netherlands
SVC2004 80 (40 Western and
40 Chinese) 20 20 2004 Hong Kong
Bengali 100 24 30 2014 India
Hindi 100 24 30 2014 India
Arabic 22 10 5 2000 Egypt
6.1.3. Merging of Databases
This section presents the signature database merging technique. The first condition to
compare the performance combination of several databases with the dataset individually is
that all of them contain a very similar number of users. Let {𝑁𝑟}𝑟=1𝑅 be the number of users
of 𝑅 databases to be merged. Then, the number of users of each individual database to be
selected should be {𝐿𝑟}𝑟=1𝑅 , holding that 𝐿𝑟 ≈ 𝑁𝑟/𝑅 and ∑ 𝑁𝑟/𝑅
𝑅𝑟=1 ≈ ∑ 𝐿𝑟
𝑅𝑟=1 .
To avoid bias due to user selection, the 𝐿𝑟 users of a database to be merged with the other
databases are selected as follows: Let {𝐸𝐸𝑅𝑖}𝑖=1𝑁𝑟 be the sequence of each signer’s EER for
database 𝑟. Those values are sorted in ascending order, i.e. from lower to greater EER per
signer as:
𝑗(𝑖) ← i | 𝐸𝐸𝑅𝑗(𝑖) < 𝐸𝐸𝑅𝑗(𝑖+1) , 𝑖 ϵ {1, … ,𝑁𝑟 − 1} (6.1)
Then, select the users to be merged by the equidistant sampling of 𝐿𝑟 users in the j index,
in other words, the selected users are those with indices 𝑗(⌈𝑘𝑁𝑟 𝐿𝑟⁄ ⌉), 𝑘 ϵ {0, … , 𝐿𝑟 − 1}.
This procedure guarantees that the selected users have a similar EER distribution as the
original database for a fairer merging approach and performance comparison between the
merged and non-merged databases. This procedure is illustrated in Figure 6.2.
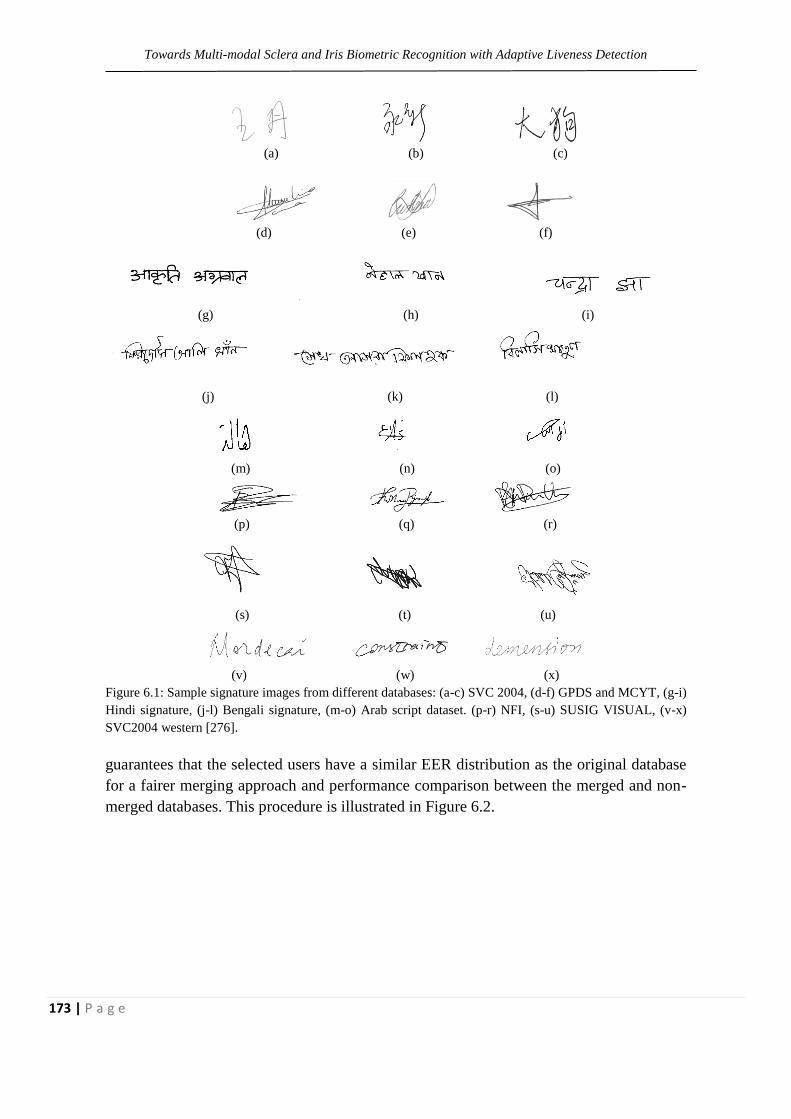
Towards Multi-modal Sclera and Iris Biometric Recognition with Adaptive Liveness Detection
173 | P a g e
(a) (b) (c)
(d) (e) (f)
(g) (h) (i)
(j) (k) (l)
(m) (n) (o)
(p) (q) (r)
(s) (t) (u)
(v) (w) (x)
Figure 6.1: Sample signature images from different databases: (a-c) SVC 2004, (d-f) GPDS and MCYT, (g-i)
Hindi signature, (j-l) Bengali signature, (m-o) Arab script dataset. (p-r) NFI, (s-u) SUSIG VISUAL, (v-x)
SVC2004 western [276].
guarantees that the selected users have a similar EER distribution as the original database
for a fairer merging approach and performance comparison between the merged and non-
merged databases. This procedure is illustrated in Figure 6.2.

Towards Multi-modal Sclera and Iris Biometric Recognition with Adaptive Liveness Detection
174 | P a g e
Figure 6.2. Similar EER distribution procedure for user selection when merging databases [276]
6.1.4. Feature and Performance Analysis
Different types of feature extraction techniques that can be found in the pattern recognition
literature can be classified into three categories: shape features (feature extraction based on
the geometry of the object), colour-based and texture-based features. Among them, shape-
based and the texture-based features are prominent for use with signatures, so they are used
in the different automatic signature verifiers that can be found in the literature. The shape
features aim to extract the discernible information from the signature by the ridges, blob,
edges and corners present in them. Whereas, texture features give information about the
spatial arrangement of colour or intensities in an image or a selected region of an image
locally. The texture-based features explore repetitive pattern and intensity distributions in
the signature. These shape and texture features are both applicable for multi-script
signatures as well. Therefore, several geometric and texture-based feature extraction
techniques are employed in this study.
The use of several features and classifiers allowed a comparison of the performance of
databases and parameters to form a conclusion about the performance analysis of single-
script and multi-script ASV. Here, the following published ASVs have been considered for
the experimental study.
Towards Multi-modal Sclera and Iris Biometric Recognition with Adaptive Liveness Detection
175 | P a g e
1. A Hidden Markov Model (HMM) classifier with geometrical features used in [205] is
employed in the work. The signature is parameterized in Cartesian and polar coordinates.
Both features are combined at the score level. The Cartesian parameters consist of
equidistant samples of the height and length of the signature envelope plus the number of
times the vertical and horizontal line cuts the signature stroke. In polar coordinates, the
parameters are equidistant samples of the envelope radius plus the stroke area in each sector.
A multi-observation discrete left-to-right HMM is chosen to model each signer’s features.
The classification (evaluation), decoding, and training problems are solved with the
Forward-Backward algorithm, the Viterbi algorithm, and the Baum-Welch algorithm.
2. A Euclidean distance between Zernike moments used in [196] is also employed in this
analysis. Zernike polynomials are an orthogonal set of complex-valued polynomials:
Zernike moments have mathematical properties and make them ideal image features to be
used as shape descriptors in shape classification problems. They have rotational invariant
properties and could be made to be scale and translation-invariant as well. These properties
are quite adequate for ASVs, therefore they are widely used in the ASV literature. Inspired
by previous work.
3. Texture-based features, as Local Binary Patterns (LBP) and a Support Vector Machine
(SVM) [198], are employed. In this case, the LBP operator has been used for static signature
parameterization. The grey-level image is transformed into a code matrix that is divided into
4 equal vertical blocks and 3 equal horizontal blocks, which overlap by 60%. From each
block, calculate the 255-bin histograms and the features are obtained concatenating them. A
Least Square Support Vector Machine (LS-SVM) with an RBF kernel has been used as the
classifier.
The three verifiers are trained with the first 5 genuine signatures of each signer in the
database for repeatability of the experiments. The remaining genuine signatures are used for
testing the false rejection rate. The false acceptance rate for the random forgeries has been
obtained with the genuine test samples from all the remaining users, while the false
acceptance rate for the skilled forgery experiments has been worked out with all the forgery
samples of each signer.
The three verifiers are trained with the first 5 genuine signatures of each signer in the
database. This procedure is chosen instead of training with 5 randomly selected samples
several times and providing the averaged performance for the sake of repeatability of the
experiments. It is worth mentioning the fact that the procedure introduces a certain amount
of bias but this is always the same, therefore the comparison between results is fair.
Setting aside the 5 training samples, the remaining genuine signatures are used for testing
the false rejection rate. The false acceptance rate for the random forgeries has been obtained

Towards Multi-modal Sclera and Iris Biometric Recognition with Adaptive Liveness Detection
176 | P a g e
with the genuine test samples from all the remaining users, while the false acceptance rate
for the skilled forgery experiments has been worked out with all the forgery samples of each
signer. For the sake of repeatability, Tables 6.2 and 6.3 show the exact number of training
and testing samples for each experiment.
The results are given in both (EER) and Bhattacharyya distance for both the random and
skilled forgeries. The EER measures the error point when the false acceptance and false
rejection are equal, obtaining the overlap of both the distributions. On the other hand, the
Bhattacharyya distance is a divergence-type measure between distributions; in this case, the
false acceptance and false rejection score distributions called 𝑝(𝑥) and 𝑞(𝑥) respectively,
are obtained as:
𝐷𝐵(𝑝, 𝑞) = −ln (𝐵𝐶(𝑝, 𝑞)) (6.2)
being 𝐵𝐶(𝑝, 𝑞) the Bhattacharyya coefficient defined as:
𝐵𝐶(𝑝, 𝑞) = ∫√𝑝(𝑥)𝑞(𝑥)𝑑𝑥 (6.3)
In statistics, the Bhattacharyya distance measures the similarity of two discrete or
continuous probability distributions. It is a measure of the amount of overlap between
two statistical samples or distributions. Therefore, the relative closeness of the two samples
or distributions are being considered. It is used to measure the separability of classes in a
classification problem. In single-script vs. multi-script signatures, the ASV scenario is
similar. In this scenario, it is needed to measure the overlap between the two distributions
rather than the accuracy of the system which can get affected also due to increase in the
database size.
6.1.5 Experimental Setup, Results and Discussion
The following experimental setups were followed in the proposed set of experiments.
6.1.5.1. Single-script Scenario
In the case of the single-script scenario, two experiments were conducted to study the effect
of merging databases. The first experiment (E1) studied three individual databases:
GPDS100, MCYT100 and SUSIG Visual. They were selected because of the similarity in
their number of users. The first two databases were recorded under similar conditions while
the third one is different in both methodology and geographical location.

Towards Multi-modal Sclera and Iris Biometric Recognition with Adaptive Liveness Detection
177 | P a g e
Table 6.2: FAR and FRR statistics for each dataset used in multi-script experiments.
Name of the
Database
Training samples per
user
Test samples for random forgery
experiments per user
Test samples for skilled forgery experiments
per user
GPDS100 Positive: 5
Negative: 99*5
FRR experiment: (24-5)
FAR experiment: (24-5)*99
FRR experiment: 30
FAR experiment: 30*99
MCYT100 Positive: 5
Negative: 99*5
FRR experiment: (25-5)
FAR experiment: (25-5)*99
FRR experiment: 30
FAR experiment: 25*99
SUSIG Visual Positive: 5
Negative: 93*5
FRR experiment: (20-5)
FAR experiment: (20-5)*93
FRR experiment: 10
FAR experiment: 10*93
E2-Comb1
Users per
database
GPDS: 34
MCYT: 33
SUSIG: 33
Total: 100 users
Positive: 5:
Negative: 99*5
FRR experiment:
if GPDS user: (24-5)
if MCYT user: (25-5)
if SUSIG user: (20-5)
FAR experiment:
(24-5)*A+(25-5)*B+
(20-5)*C
FAR experiment
If GPDS user: 30
If MCYT user: 25
If SUSIG user: 10
FRR experiment:
30*A+25*B+10*C
if GPDS user: A=33,B=33,C=33
if MCYT user: A=34,B=32,C=33
if SUSIG user: A=34,B=33,C=32
E2-comb2
Users per
database
GPDS: 20
MCYT: 20
SUSIG: 20
SVC: 21
NISDC: 19
Total: 100 users
Positive: 5:
Negative: 99*5
FRR experiment:
if GPDS user: (24-5)
if MCYT user: (25-5)
if SUSIG user (20-5)
if SVC user: (20-5)
if NSDCC user: (12-5)
FAR experiment:
(24-5)*A+(25-5)*B+(20-5)*C
+(20-5)*D+(12-5)*E
FAR experiment
if GPDS user: 30
if MCYT user: 25
if SUSIG user: 10
if SVC user: 20
if NSDCC user: 6
FRR experiment:
30*A+25*B+10*C+
20*D+6*E
if GPDS user: A=19, B=20,C=20,D=21,E=19
if MCYT user: A=20, B=19,C=20,D=21,E=19
if SUSIG user: A=20, B=20,C=19,D=21,E=19
if SVC user: A=20, B=20,C=20,D=20,E=19
if NSDCC user: A=20, B=20,C=20,D=21,E=18
E2-comb3
Users per
database
GPDS: 100
MCYT: 100
SUSIG: 94
SVC:
40 (western)
NISDC: 19
Total: 353 users
Positive: 5:
Negative: 99*5
FRR experiment:
if GPDS user: (24-5)
if MCYT user: (25-5)
if SUSIG user (20-5)
if SVC user: (20-5)
if NSDCC user: (12-5)
FAR experiment:
(24-5)*A+(25-5)*B+(20-5)*C
+(20-5)*D+(12-5)*E
FAR experiment
if GPDS user: 30
if MCYT user: 25
if SUSIG user: 10
if SVC user: 20
if NSDCC user: 6
FRR experiment
30*A+25*B+10*C+
20*D+6*E
if GPDS user: A=99, B=100,C=94,D=40,E=19
if MCYT user: A=100, B=99,C=94,D=40,E=19
if SUSIG user: A=100, B=100,C=93,D=40,E=19
if SVC user: A=100, B=100,C=94,D=39,E=19
if NSDCC user: A=100, B=100,C=94,D=40,E=18

Towards Multi-modal Sclera and Iris Biometric Recognition with Adaptive Liveness Detection
178 | P a g e
Table 6.3: FAR and FRR statistics for each dataset used in single script experiments.
Name of the
Database
Training
samples per user
Test samples for random forgery
experiments per user
Test samples for skilled
forgery experiments per user
GPDS100 Positive: 5
Negative: 99*5
FRR experiment: (24-5)
FAR experiment: (24-5)*99
FRR experiment: 30
FAR experiment: 30*99
Hindi100 Positive: 5
Negative: 99*5
FRR experiment: (24-5)
FAR experiment: (24-5)*99
FRR experiment: 30
FAR experiment: 30*99
Bengali Positive: 5
Negative: 93*5
FRR experiment: (24-5)
FAR experiment: (24-5)*99
FRR experiment: 30
FAR experiment: 30*99
E2-Comb1
Users per
database
GPDS: 34
Hindi: 33
Bengali: 33
Total: 100 users
Positive: 5:
Negative: 99*5
FRR experiment: (24-5)
FAR experiment: (24-5)*99
FRR experiment: 30
FAR experiment: 30*99
E2-comb2
Users per
database
GPDS: 20
Hindi: 20
Bengali: 20
SVC:
20 Chinese
Arabic: 20
Total: 100 users
Positive: 5:
Negative: 99*5
FRR experiment:
if GPDS, user: (24-5)
if Hindi user: (24-5)
if Bengali user (24-5)
if SVC user: (20-5)
if Arabic user: (10-5)
FAR experiment:
(24-5)*A+(24-5)*B+(24-5)*C +(20-
5)*D+(10-5)*E
FAR experiment
If GPDS user: 30
If Hindi user: 30
If Bengali user: 30
if SVC user: 20
if Arabic user: 5
FRR experiment
30*A+30*B+30*C+
20*D+5*E
if GPDS user: A=19, B=20,C=20,D=20,E=20
if Hindi user: A=20, B=19,C=20,D=20,E=20
if Bengali user: A=20, B=20,C=19,D=20,E=20
if SVC user: A=20, B=20,C=20,D=19,E=20
if Arabic user: A=20, B=20,C=20,D=20,E=19
E2-comb3
Users per
database
GPDS: 100
Hindi: 100
Bengali: 100
SVC:
40 Chinese
Arabic: 22
Total: 362 users
Positive: 5:
Negative: 99*5
FRR experiment:
if GPDS, user: (24-5)
if Hindi user: (24-5)
if Bengali user (24-5)
if SVC user: (20-5)
if Arabic user: (10-5)
FAR experiment:
(24-5)*A+(24-5)*B+(24-5)*C +(20-
5)*D+(10-5)*E
FAR experiment
If GPDS user: 30
If Hindi user: 30
If Bengali user: 30
if SVC user: 20
if Arabic user: 5
FRR experiment
30*A+30*B+30*C+
20*D+5*E
if GPDS user: A=99, B=100,C=100,D=40,E=22
if MCYT user: A=100, B=99,C=100,D=40,E=22
if SUSIG user: A=100, B=100,C=99,D=40,E=22
if SVC user: A=100, B=100,C=100,D=39,E=22
if NSDCC user: A=100, B=100,C=100,D=40,E=21
The second experiment is divided into two protocols. The first one (E2-comb1), merges
equally from the three above databases. This way, 34, 33 and 33 users from each database
were selected respectively by the similar EER distribution criterion to obtain a 100-user
database. The second one (E2-comb2) merges 20 users from each of the three databases

Towards Multi-modal Sclera and Iris Biometric Recognition with Adaptive Liveness Detection
179 | P a g e
mentioned above, which are selected with a similar EER distribution criterion and the first
21 English signatures from the SVC2004 database as well as 19 users from the NSDCC
database that includes forgeries. The two last databases were recorded under different
conditions from the first three.
The next experiment (E2-comb3) compares the performance of the Similar EER
distribution with respect to aggregate databases. This experiment sums all the
aforementioned databases: GPDS100, MCYT100, SUSIG, SVC2004 and NSDCC and
measures its performance.
6.1.5.2. Multi-Script Scenario
To study the effects of the multi-script scenario in off-line automatic signature verification,
two experiments have been carried out again. As above, the first experiment (E1) studies
individually the GPDS100, Hindi and Bengali databases which contain 100 users in each of
them. Note that the Hindi and Bengali databases were recorded under similar conditions
whilst the GPDS100 was recorded differently. Again, the second experiment was performed
in two steps. The first one (E2-comb1), merges 34, 33 and 33 users of the above databases
selected by the similar EER distribution criterion. Finally, the second one (E2-comb2),
merges 20 users selected from the above three databases with the first 20 users of the Arabic
database and the first 20 Chinese signatures of the SVC2004 database. Again these two
databases were recorded under different conditions compared to the first three. Therefore,
the comparison between single-script and multi-script results is expected to be statistically
fair. In E2-comb3, to compare the performance of similar EER distributions with respect to
aggregate databases, this experiment adds all the aforementioned databases and measures
their performance.
6.1.6. Results and Discussion
The EERs-based results are given in Table 6.4 and 6.5 for single and multi-script
experiments, whereas the Bhattacharyya distances are given in Tables 6.6 and 6.7,
respectively. A DET curve of the multi-script and singe-script signature environments for
both random and skilled forgeries are shown in Figures 6.3 and 6.4. Analysing the single
script random forgery experiment results, (Table 6.4), it can be seen that aggregating all the
databases (E2-comb3) worsens the performance significantly with respect to the single
script database. It is mainly due to the increment of users. Instead, mixing the databases
using the similar EER distribution procedure (E2-comb1) keeps a similar performance as
compared to the single database scenario (E1-GPDS, E1-MCYT and E1-SUSIG). The small
decrease in performance is due to the fact that each database contains a watermark that can
help the classifier to decide on borderline signatures. This reduction is much clearer when
adding 5 databases using the similar EER distribution mixing of the databases (E2-comb2).

Towards Multi-modal Sclera and Iris Biometric Recognition with Adaptive Liveness Detection
180 | P a g e
Given that the last two databases added (SVC2004 and NSDCC) were very different to the
three first ones (GPDS, MCYT and SUSIG), the watermark of the database undoubtedly
helps the classifier to decide.
In the random forgery multi-script scenario, (i.e. Table 6.5), noted similar findings. To
aggregate, the different scripts provide a significantly worse result (E3-comb2) as opposed
to blending the different scripts properly, i.e. using the EER similar distribution procedure.
In this case, the mixing of different scripts barely decreases the performance (E2-comb1 and
E2-comb 2) with respect to the single script database (E1-GPDS, E1-Hindi and E1-Bengali)
in Geometric and Zernike-based classifiers. This fact, in comparison to the result in the
single script case, is surprising since the different scripts should spread the parameters
helping the classifiers to improve their performance. Instead, the performance is improved
significantly with the Texture-based classifier. This result contributes to the
recommendation that texture-based classifiers should be used in multi-script environments.
Tables 6.6 and 6.7 confirm the results of Table 6.4 and 6.5. Usually, when the EER
increases, the Bhattacharyya distance decreases. Found some exceptions in the doubtful
cases, helping to make the conclusion clearer. For instance, Table 6.4, Geometric case in
Random Forgeries. It can be stated that E2-comb1 and EER-comb2 are barely better than
E1-SUSIG because the EER is similar but the Bhattacharyya distances are greater for all
cases.
In skilled forgeries, the results are not as clear as the above. The EER does not display a
clear tendency. This fact is given due to the different skills of the forgers along with the
different databases. Despite the similarity of the EER distributions, the skilled forgeries of
the GPDS dataset are mixed with those of the MCYT dataset, which are less skilful and so
on. Thus, the result of blending the skilled forgeries is more affected by the skill of the
individual databases than by the mixing procedure. Looking over the DET curves, they
highlight the effect of the similar EER distribution procedure. It is easy to realise that in all
the curves there is one odd curve which corresponds to the E2-comb3 experiments. It is due
to both the difference in performance and the mixing of different distributions that distort
the DET curve. For instance, this fact is clearly seen in the two cases of the texture-based
classifier for random forgeries.
Table 6.4. Single-script results for random and skilled forgeries in terms of EER in (%)
Random Forgeries Skilled Forgeries
Experiment Geometric Zernike Texture Geometric Zernike Texture
E1- GPDS 4.72 25.07 2.05 22.50 35.16 18.80
E1-MCYT 4.21 23.06 1.78 19.98 35.51 16.07
E1-SUSIG 3.44 23.07 1.47 31.95 44.73 28.81
E2-comb1 4.10 21.27 1.02 24.84 42.19 21.23
E2-comb2 3.15 20.09 1.09 23.59 41.48 17.30
E2-comb3 7.78 30.41 2.55 38.76 54.16 34.64

Towards Multi-modal Sclera and Iris Biometric Recognition with Adaptive Liveness Detection
181 | P a g e
Table 6.5. Multi-script results for random and skilled forgeries in terms of EER in (%)
Random Forgeries Skilled Forgeries
Experiment. Geometric Zernike Texture Geometric Zernike Texture
E1-GPDS 4.72 25.07 2.05 22.50 35.16 18.80
E1-Hindi 3.85 17.71 1.22 16.83 20.83 12.16
E1- Bengali 3.35 15.28 1.52 20.97 21.35 12.82
E2-comb1 4.73 25.17 1.20 21.25 32.58 15.62
E2-comb2 5.43 27.04 0.94 24.54 32.55 24.24
E2-comb3 7.89 32.61 2.55 29.56 43.56 29.23
Table 6.6. Bhattacharyya distance between the densities of genuine and forgery scores for the single-script experiment
Random Forgeries Skilled Forgeries
Experiment Geometric Zernike Texture Geometric Zernike Texture
E1- GPDS 1.21 0.24 2,18 0.26 0.06 0.40
E1-MCYT 1.19 0.22 2,31 0.34 0.03 0.51
E1-Susig 1.32 0.24 2,45 0.11 0.01 0.14
E2-comb1 1.38 0.25 3,20 0.22 0.01 0.30
E2-comb2 1.47 0.29 3,14 0.24 0.01 0.47
E2-comb3 0.98 0.25 1.69 0.16 0.01 0.21
Table 6.7. Bhattacharyya distance between the densities of genuine and forgery scores for the multi-script experiment
Random Forgeries Skilled Forgeries
Experiment Geometric Zernike Texture Geometric Zernike Texture
E1- GPDS 1.21 0.24 2.18 0.26 0.06 0.40
E1-Hindi 1.29 0.48 2.47 0.31 0.28 0.63
E1- Bengali 1.29 0.42 2.68 0.41 0.31 0.65
E2-comb1 1.32 0.34 2.70 0.30 0.05 0.51
E2-comb2 1.31 0.37 2.86 0.19 0.06 0.23
E2-comb3 0.63 0.35 1.43 0.11 0.02 0.17
Analysing the DET curves in detail, similar conclusions are drawn. By observing and
comparing individual curves of experiments of E1 with the experiments of aggregating
databases E2-com3, it seems that the multi-script database performs less accurately.
Whereas comparing the E1 experiment with the merged datasets using similar EER
distribution i.e. the experiments of E2-comb1 and E2-comb2, the performance seems to be
very similar or better. Therefore the problem is not merging the signatures from different
scripts but merging datasets or increasing the population. This fact is also clear from the
Bhattacharyya distances of the E1, E2-comb1, E2-comb2 and E2-comb3, whereby the
different Bhattacharyya distances of this experimental pair is less than the EER differences
that this combination poses. It can be found in the random forgeries that merging of
databases implies a reduction of the EER and an increment of the Bhattacharyya distance in
both scenarios except for Zernike

Towards Multi-modal Sclera and Iris Biometric Recognition with Adaptive Liveness Detection
182 | P a g e
Figure 6.3: DET curves of the multi-script and single script signature environments for random forgeries.
Figure 6.4: DET curves of the multi-script and single script signature environment for skilled forgeries [276].

Towards Multi-modal Sclera and Iris Biometric Recognition with Adaptive Liveness Detection
183 | P a g e
Bhattacharyya distances of the E1, E2-comb1, E2-comb2 and E2-comb3, whereby the
different Bhattacharyya distances of this experimental pair is less than the EER differences
that this combination poses.
It can be found in the random forgeries that merging of databases implies a reduction of
the EER and an increment of the Bhattacharyya distance in both scenarios except for Zernike
features in the multi-script case. So it shows that the score distributions are less overlapping
and there is more distinction between them. It is supposed to be due to the features of the
different databases, which are statistically different for each database reducing the confusion
among signatures, and this is regardless of the single or multi-script properties of the
database.
In the case of Zernike features, experiments show that these features are oriented to Hindi
and Bengali scripts because of:
1) The EER obtained with Hindi and Bengali are similar between them,
2) The achieved EER with Latin, Arabic and Chinese are similar between them, and
3) The EERs with Hindi and Bengali are significantly lower than the EERs with Latin,
Arabic and Chinese.
Therefore, if we properly merge just the Bengali and Hindi datasets, i.e. merging by means
of the similar EER distribution procedure, the error of the merged database is lower. Similar
observations are made when the Latin, Arabic and Chinese datasets are merged. Therefore
it can be concluded that the merged databases have to display similar performance if they
are fairly compared with their merged versions.
6.1.7. Thai and Roman Bi-script Signature Verification
Inspired by the significant result of the multi-script signature verification proposed earlier
in this section, this work is conceived. In Thailand, Thai people generally sign their names
using the Thai alphabet, however, some of them sign their names in Roman or mixture of
Roman and Thai scripts (i.e. bi-script nature). The Thai language is the official language of
Thailand; however, people also use the English language, hence, they choose to sign their
names in Roman script. From one of the authors’ own experience, some Thai people even
use different signatures on different occasions (official vs. non-official). Furthermore, one
person may have some Roman script-based signatures (or English-like signatures) as well
as Thai signatures. It must be noted that their signatures will be consistent if signing a formal
document (i.e. banking or government-related business), the language selected to sign can
be Thai, Roman or using Thai and Roman alphabets to form their signatures. To solve the
Towards Multi-modal Sclera and Iris Biometric Recognition with Adaptive Liveness Detection
184 | P a g e
above mention challenge this work is undertaken. The contribution of the study is in three-
fold.
1) To explore the characteristics of the signatures of Thai people, which can be signed
in Thai, English, or English-like alphabets. Also to baseline their performance using
available baseline features.
2) To investigate the influence in the multi-script environment (Thai vs. Roman/English
script).
3) Development of a Thai signature dataset which will be available publicly.
Although a couple of Thai signature recognition studies are found in the literature [5],
[6], they have only focused on recognition rather than verification, even if the dataset was
lacking in skilled and random forged signatures. It only contained genuine signatures.
Conversely, the proposed dataset, employed in the present experiments, contained most of
the necessary types of signature samples, being genuine, skilled forged, and random forged
signatures, which made the dataset suitable for signature verification. Moreover, the dataset
employed in the literature [208], [209] considered a very small number of individuals, as
there were 600 (10 signers’ × 60 samples) samples in the dataset.
6.1.7.1 Proposed Thai Dataset
The Thai signatures, both genuine and forged, were obtained from 100 volunteers, whose
ages were between 15-40, included both males and females. Each volunteer was asked to
write their signature 30 times, using the motion time interval technique, on white paper in
the given space; they were asked to sign their signatures as they normally do. They were
asked to write ten signatures at a time, and then take a rest. After a short moment of rest,
they were asked to repeat the process two more times. In total, there were 3,000 (100 signers
× 30 times) genuine signatures obtained. For each of the genuine signatures, 12 skilled
forged and 12 random forged signatures were produced; therefore, there were 24 forged
signatures per each genuine signature. In total, there were 1,200 (100 signers × 12 times)
skilled forged, and 1,200 (100 signers × 12 times) random forged signatures. Altogether
there were 5,400 signatures in this collection. It was found that 36 volunteers signed their
name in English, whereas the other 64 signed their signature in Thai. Among 100 signers 5
signers used both scripts. Since, the volunteers were asked to sign as they normally do,
signing their Thai names in English (or English-like) can be expected. Examples of each
type (based on its characteristic) of the signatures are displayed in Table 6.8. All signatures
were scanned at 300 dpi resolution and stored in a grey-level format, and then were
transformed into Portable Network Graphics (PNG) format. It was observed that many of

Towards Multi-modal Sclera and Iris Biometric Recognition with Adaptive Liveness Detection
185 | P a g e
the random signatures were signed in Thai language-like rather than English-language-like
signatures.
The existing studies of [208], [209] relied on global features which concerned shapes of
Thai signatures and grid features involving the overall signature appearance information.
For global features, such as the signature area, net width, net height, ratio of the signature
image, base-line shift, horizontal centre, vertical centre, maximum number of black pixels
in each column (vertical), largest value of the number of black pixels of all columns,
maximum number of black pixels in each row (horizontal), and the largest value of the
number of black pixels of all rows were used. The grid feature was employed for signature
image density. Local features such as blob, strokes, and textures can also be important
features that need to be considered for Thai signatures as they are found prominently in the
literature and are also visually prominent in the collected data.
Table 6.8. Example of Thai Signature
Figure 6.5: A Thai signature image labelled with the local and global features.
Figure 6.6. Thai People Signatures structure and their zones
The same set of features, classification and performance analysis as used in previous multi-

Towards Multi-modal Sclera and Iris Biometric Recognition with Adaptive Liveness Detection
186 | P a g e
script experiments were used here. An extra feature LBP+LDP combined was used here.
The LBP and LDP were merged together in order to extract features.
6.1.7.2. Experimental Details and Discussions
To investigate the influence of the script dependency on this ASV scenario, the proposed
database is divided into the following components. The database was divided into three
datasets for the experiments; the details are described as follows:
Dataset I: dataset I contains 50% Thai signatures and 50% English-like Thai signatures.
There were 1,080 (36 writers) genuine signatures, 432 skilled forged signatures, and 432
random forged signatures. In total there were 1,944 signatures in this dataset. The
samples were ordered by the characteristic of each of the signatures. Thai signatures start
from 1 – 18 and English-like Thai signatures start from 19 – 36.
Dataset II: dataset II contains 50% Thai signatures and 50% English-like Thai signatures.
There were 2,160 (72 writers) genuine signatures, 864 skilled forged signatures, and 864
random forged signatures. In total there were 3,888 signatures in this dataset. The
samples were ordered by the characteristic of each of the signatures. Thai signatures start
from 1 – 36 and English-like Thai signatures start from 37 – 72.
Dataset III (the full proposed database): dataset III contains 64% Thai signature and 36%
English-like Thai signatures. There were 3,000 (100 writers) genuine signatures, 1,200
skilled forged signatures, and 1,200 random forged signatures. In total there were 5,400
signatures in this dataset. The samples were ordered by the characteristic of each of the
signatures. Thai signatures start from 1 – 64 and English-like Thai signatures start from
65 – 100.
The verifiers are trained with the first 10 genuine signatures of each signer in the
database for repeatability of the experiments. The remainder of the 20 genuine signatures
and 12 skilled and 12 random forged signatures of each signer were used for testing. The
EER is obtained by getting the genuine score from the genuine samples and the forgery from
the skilled or random forgery samples. The FAR and FRR statistics of each of the database
I, II, and III, and for each script scenario (Thai, Roman and their combination) are
summarised in Table 6.9.
The results obtained by the above-mentioned protocols are shown in Table 6.10 and 6.11.
The results and analysis of Table 6.10 and 6.11 are described as follows:

Towards Multi-modal Sclera and Iris Biometric Recognition with Adaptive Liveness Detection
187 | P a g e
Table 6.9. FAR and FRR statistics of the experiments
Database Training
samples per user
Test samples for random
forgery experiments per user
Test samples for skilled
forgery experiments per user
Database I-Thai Positive: 10
Negative: 17*10
FRR experiment: (30-10)
FAR experiment: (30-10)*17
FRR experiment: 12
FAR experiment: 12*17
Database I-Roman Positive: 10
Negative: 17*10
FRR experiment: (30-10)
FAR experiment: (30-10)*17
FRR experiment: 12
FAR experiment: 12*17
Database I-All Positive: 10
Negative: 35*10
FRR experiment: (30-10)
FAR experiment: (30-10)*35
FRR experiment: 12
FAR experiment: 12*35
Database II-Thai Positive: 10
Negative: 35*10
FRR experiment: (30-10)
FAR experiment: (30-10)*35
FRR experiment: 12
FAR experiment: 12*35
Database II-Roman Positive: 10
Negative: 35*10
FRR experiment: (30-10)
FAR experiment: (30-10)*35
FRR experiment: 12
FAR experiment: 12*35
Database II-All Positive: 10
Negative: 71*10
FRR experiment: (30-10)
FAR experiment: (30-10)*71
FRR experiment: 12
FAR experiment: 12*71
Database III-Thai Positive: 10
Negative: 35*10
FRR experiment: (30-10)
FAR experiment: (30-10)*35
FRR experiment: 12
FAR experiment: 12*35
Database III-Roman Positive: 10
Negative: 63*10
FRR experiment: (30-10)
FAR experiment: (30-10)*63
FRR experiment: 12
FAR experiment: 12*63
Database III-All Positive: 10
Negative: 99*10
FRR experiment: (30-10)
FAR experiment: (30-10)*99
FRR experiment: 12
FAR experiment: 12*99
Table 6.10. EER in % for the proposed experimental setup
Database 36 (Dataset I) Database 72(Dataset II)
Database 100 (Dataset
III)
Thai Roman All Thai Roman All Thai Roman All
HMM
Random 0.87 0.87 0.94 1.35 2.08 1.48 1.99 2.08 1.95
Skilled 4.53 8.56 6.15 4.94 10.74 8.46 9.42 8.84 9.41
LBP
Random 0.87 1.38 1.57 1.64 1.82 1.60 1.70 1.82 1.84
Skilled 5.60 11.95 9.46 8.63 10.07 9.76 9.16 10.39 9.40
LDP
Random 1.38 2.26 1.57 1.27 2.08 1.70 1.81 2.08 1.81
Skilled 6.43 11.16 9.31 7.03 11.50 8.77 8.64 11.48 8.98
LBP+
LDP
Random 1.01 0.87 0.87 1.20 1.64 1.29 1.41 1.64 1.34
Skilled 4.95 11.01 8.03 6.57 10.34 8.42 7.92 10.20 8.64

Towards Multi-modal Sclera and Iris Biometric Recognition with Adaptive Liveness Detection
188 | P a g e
Table 6.11. Bhattacharyya Distance for the proposed experimental setup
Database 36 (Dataset I) Database 72 (Dataset II)
Database 100 (Dataset
III)
Thai Roman All Thai Roman All Thai Roman All
HMM
Random 2.07 1.87 2.01 2.03 1.51 1.77 1.85 1.62 1.77
Skilled 1.27 0.94 1.01 1.09 0.68 0.86 0.86 0.77 0.81
LBP
Random 4.99 3.02 3.65 3.85 3.01 3.32 3.39 3.04 3.08
Skilled 1.47 0.72 0.99 1.08 0.85 0.95 1.09 0.86 0.98
LDP
Random 4.62 2.82 3.79 3.78 2.94 3.31 3.46 2.95 3.15
Skilled 1.52 0.74 1.09 1.18 0.77 0.97 1.13 0.78 0.99
LBP+
LDP
Random 5.35 3.29 4.18 4.22 3.32 3.68 3.76 3.32 3.43
Skilled 1.65 0.80 1.14 1.23 0.88 1.04 1.20 0.89 1.06
We can conclude from Table 6.10 that HMMs and LBP+LDP performed better than the
other features extraction techniques employed. Precisely, the combination of LBP+LDP was
better in a maximum number of scenarios (in the scenario of database II and III). It can be
noted that although the combination of LBP+LDP achieved better EERs in most cases, for
dataset I, however, it failed to obtain the same in the case of skilled forge scenario. An EER
of ~0.9% was achieved for Random Forged Signature (RFS) experiments, whereas for
Skilled Forged Signature (SFS) experiments, the EERs of ~5% to ~11% were achieved for
Database I. With the SFS and RFS experiments with Thai and Roman Scripts, the EERs
attained were similar for HMM and LBP+LDP. The EERs slightly increased when the two
scripts are combined, as compared to the EER for Roman signatures, and decreases w.r.t to
EERs obtained for Thai signatures.
It can be noted that the EERs had increased in RFSs experiments with Dataset II and III.
With regards to dataset II, from Table 6.10, it can be seen that the LBP+LDP feature
extraction technique was able to attain the best EER rates for RFS of all script types. The
range of EERs was ~1.20% to ~1.65%. It can also be seen that the resulting EERs having
less than ~0.20%, were obtained when LBP was employed to the dataset. For SFS, it was
observed that for Thai scripts, HMMs were able to attain the best EER of 4.94%, whereas
LBP+LDP was able to achieve the best EER for the Roman script. When both scripts were
combined, the best EER of 8.42% was attained when LBP+LDP was utilised. However, the
remaining patterns of the results remained the same for dataset I. For Dataset III, the best
EER rates of ~1.4% to ~1.6% were attained when the LBP+LDP feature extraction
Towards Multi-modal Sclera and Iris Biometric Recognition with Adaptive Liveness Detection
189 | P a g e
technique was employed on RFS of each type of scripts. However, when compared to
Dataset I and II, the rates were slightly increased. Also, very similar to dataset II, similar
results (EERs less than 0.5%) were obtained when LBP was applied to the dataset. With
SFS, it was observed that for Thai scripts, LBP+LDP was able to attain the best EER of
7.92%, whereas HMMs were able to achieve the best EER of 8.84% for the Roman script.
However, when both scripts were combined, the best EER of 8.64% was attained when LDP
was utilised.
For the skilled signatures EERs fluctuated when results are compared to each scenario from
Dataset I to II to III, and in most of the cases, they increased. Other patterns of the SFS’s
experiments remained similar to the RFS’s experiments on dataset I. The EER are found to
increase slightly or decrease slightly when the signature of two scripts are combined, which
signifies that these increase or decrease depend on number of users and nature of the
database and signature verification can be performed in a script-independent way in a Thai
signature verification system regardless of the challenges addressed in section I. These
observations also imply that the usefulness of texture features for bi-script ASV.
When observing the Bhattacharyya Distance (BD) in Table 6.11, for Dataset I the
experiments employing Roman script best BD was attained utilising LBP+LDP. Overall,
the BDs for Roman SFS is in the range of 0.72% – 3.29%. It was further observed that the
results obtained when Thai script was employed are less that of attained when Roman SFS
was employed. The Thai script BDs were in a range of 1.27% – 5.35%. Thai BDs were
lower than Roman script BDs, in the combined scripts experiments the BDs were also lower
than the Roman script experiments. It can be seen in Table 6.11 that the BDs of the bi-script
were more than the Thai script but yielded less score when compared to Roman script. The
bi-script BDs were in a range of 0.99% – 4.18%. For Dataset II and III, as can be seen in
Table 6.11, the results were similar to the BDs attained when each type of the scripts were
used in the experiments of database I. It was observed that for all experiments, the BDs
attained when the SFS of any type of script was employed, were less compared to the RSF.
For Dataset II, BDs of the Roman SFS were in a range of 0.68% – 3.32%, whereas for
Dataset III, the range was 0.77% – 3.33%. Also, similarly for Dataset I, it was observed that
the results obtained when Thai script was employed were less score than the results attained
when the Roman script was employed. For Dataset II, the Thai script BDs were in a range
of 1.08% – 4.22% and for Dataset III, the range was between 0.86% – 3.76%. And once
again the Thai BDs were lower than Roman BDs when the combined scripts were used in
the experiment, the BDs were also lower than the Roman script experiments but higher than
Thai script. The BDs of the bi-script were more than the Thai script but yielded lower
performance when compared to Roman script. For Dataset II, the bi-script BDs were in a
range of 0.86% – 3.68%, and when Dataset III was employed, the range was between 0.81%

Towards Multi-modal Sclera and Iris Biometric Recognition with Adaptive Liveness Detection
190 | P a g e
– 4.43%. The BD found to be decreasing from the dataset I to II to III for all scenarios.
The Bhattacharyya distance measures the similarity of two discrete or
continuous probability distributions. Higher the distance it is less overlapping and therefore
higher the chance of distributions not to be similar. So, the above observation of the BD
implies similar implication that was made from EER observations. The DET curves of the
multi-script and single script signature performance, employing Thai and Roman signatures,
can be seen in Fig. 6.7.
6.1.8 Summary of Multi-script Signature Verification
This work has designed and implemented a novel method to merge individual databases
according to the statistical similarities in the user-performance distribution. Also, we
proposed a statistical performance analysis method namely the Bhattacharyya distance for
a fair comparison between single and multi-script scenarios. It can conclude that the
performance of the merged databases is slightly better than or quite similar to the individual
ones if the individual databases
1) have a similar performance, i
2) are merged keeping the same number of users, and
iii) if the users are selected on the basis of similar EER.
This analysis advocates that the lower performance of the multi-script signatures that was
reported in the literature in contrast to the single script scenario is not due to the presence of
multi-script signatures. Rather it is due to the increase in the number of classes while
merging the databases. Furthermore, this finding is independent of the single-script or
multi-script properties of the merged databases. Therefore, the multi-script automatic
signature verifier can be seen as an interoperability problem from the system point of view
or a generalisation problem from the pattern recognition perspective. This research opens
the door for applying generalisation and interoperable techniques to the multi-script
signature problem.
Inspired by the result, extended the work for Thai and Roman based Bi-script ASV. The
motivation of this research was to comprehensively study signature verification on off-line
Thai signatures. As described in previous sections, Thai signatures have unique
characteristics due to their bilingual nature (Thai and English/Roman) as well as for a single
language (Thai or English/Roman). The novelty of this research includes the custom Thai
signature collection, which contains genuine signatures as well as skilled and random forged
signatures. Also, this is the first time that Thai signature verification has been investigated.
General challenges for Thai signature verification are also discussed.
Towards Multi-modal Sclera and Iris Biometric Recognition with Adaptive Liveness Detection
191 | P a g e
Experiments were performed on the dataset using features employed in previous ASVs.
It can be concluded from all the experimental results that the best EER of 0.87% was
achieved when either HMMs or LBP+LDP were employed on Thai, Roman, and bi-script
RFS of Dataset I (see Table III). However, for BD, the best result of 5.35% was attained
when Thai RFS of Dataset I was employed, using HMMs (see Table IV). It can be noted
that for both EER and BD, the best results were attained when RFS were employed on
Roman Script. It can also be concluded from the overall experiments that textural features
have proven that Thai ASVs is a script identification independent problem.
It was difficult to compare the results attained in this study with others in the literature, as
to the best of the knowledge, to date no studies have been conducted on Thai signature
verification. However, Thai signature recognition was reported in [208], [209] and accuracy
rate of ~90% on the dataset size of 600 samples from 10 signers was achieved.
Overall, the experiments suggest the script independency of Thai signatures. As this work
aims to baseline the dataset, more feature extraction techniques will need to be investigated
in the future to identify its importance. Future research needs to be undertaken for
improvements and to enhance the performance of the proposed Thai signature verification
system. Techniques such as deep learning may be investigated on the datasets. Larger and
supplementary databases will also be created, so a more detailed study can be performed.
The proposed dataset can be also used for Thai signature recognition purposes.
The future plan is to conduct a scientific analysis of this dataset to enrich its usefulness,
by conduction completion and challenges on the dataset. Initially, requests may be sent for
a part of the dataset, which will be available for academic research purposes. The full dataset
will also be made publicly available in due course.
6.2 Wrist Biometrics
One possible and promising upcoming biometrics is the wrist vein pattern, which can be
easily combined with fingerprint or palm print biometrics to make it more universal.
In the literature, few works on the wrist can be found [208- 215]. The authors of [216]
come up with the proposal that the wrist vein can be utilized for biometric authentication.
In [215] the authors proposed a dataset of wrist vein in the infra-red band of 30 individual
and proposed a prototype of for image capturing of wrist vein images by quality
measurement. The first work on the wrist vein biometrics system can be found in [208],
where a large dataset is used to report the result. The low-quality PUT vein images were

Towards Multi-modal Sclera and Iris Biometric Recognition with Adaptive Liveness Detection
192 | P a g e
Figure 6.7. DET the multi-script and single script signature performed employing Thai and Roman signature.
used for biometrics. Binarization was used for enhancement further followed by correlation
for recognition.
In [209] an analysis of the different segmentation technique is performed. For the
segmentation analysis, purpose enhancement was performed by Discrete Fourier
Transformation (DCT) and classification by correlation. In [210] benchmarking of the PUT
dataset was reported. For enhancement Gaussian filter was used.
In [206] minutia feature based wrist vein recognition system was proposed. Whereas in
[204] chain code based fusion is used for wrist vein recognition. In this work different level
of skeleton, fusion is used followed by chain code. In [211] spectral minutia based feature
extraction was used to represent the wrist vein pattern after pre-processing the vein images.
An approach to extract the vein minutiae and to transform them into a fixed-length,

Towards Multi-modal Sclera and Iris Biometric Recognition with Adaptive Liveness Detection
193 | P a g e
translation and scale invariant representation where rotations can be easily compensated is
presented in [213].
To date, this biometric has not been prominently studied and very little is known about
its usefulness. Because of this, in this work, we concentrate to explore this biometric trait.
6.2.1. Proposed Wrist Vein Biometric System
This present work proposes a whole biometric system for personal identification based on
wrist veins. Here wrist vein segmentation was not required. A new pre-processing approach
for vein highlighting is proposed here by the Adaptive Histogram Equalisation and Discrete
Meyer wavelet. Wrist feature extraction based on the Dense Local Binary Pattern (D-LBP)
was used. Support Vector Machines (SVMs) are used for classification.
(a) (b)
Figure 6.8: (a) A wrist vein image. (b) A system design of the proposed system [268].
In order to make the vein pattern clearly visible, image enhancement was performed.
Adaptive histogram equalisation was performed with a window size of 14x14 (the window
value was selected by analysis, window value that produces the best result was used for
experimentation) was performed on the image to make the vein structure more prominent
as shown in Figure 6.9.
Figure 6.9: Image after adaptive histogram equalisation [268]

Towards Multi-modal Sclera and Iris Biometric Recognition with Adaptive Liveness Detection
194 | P a g e
Further, the Discrete Meyer wavelet was used to enhance the vein patterns. A low pass
reconstruction of the above-mentioned filter was used to enhance the image. Figure 6.10
shows the vein enhanced image after applying the filter.
Figure 6.10: The final vein enhanced image [268].
For feature extraction, a local descriptor method was applied in this work for the wrist vein
feature. Feature extraction based on the Dense Local Binary Pattern (D-LBP) was performed.
D-LBP patch descriptors of each training image are used to form a bag of features, to produce
the training model. Next, a K-means clustering technique was applied on the patches on the
training set for the generation of a codebook. The vocabulary size for the experiment was
1024. Descriptors from each training image are used with the codebook to form a bag of
features, further which was used to produce the training model.
Support Vector Machines (SVMs) are used for classification in this work. SVMs are a
popular supervised machine learning technique, which performs an implicit mapping into a
higher dimensional feature space. After the mapping is performed, it finds a linear
separating hyperplane with maximal margins to separate data from this higher dimensional
space.
The Library for Support Vector Machines (LIBSVM) was used here for the SVM
implementation. Though various new kernels are being proposed, the most frequently used
kernel functions are linear, polynomial, and Radial Basis Function (RBF). This work uses
the RBF kernel.
6.2.2. Experimental Results
The experimental setup and the results of the proposed work are explained in this section.
6.2.2.1. Dataset
In order to evaluate the performance of the proposed method, the PUT wrist Vein database
[217] was utilised for the experiments. A framework of the image capturing technique is
given in Figure 6.11 (g). This database consists of 1200 RGB images taken in three distinct
sessions (400 images in each session) from 50 identities (both left and right hand) where
each channel of RGB colour space is represented in grey-scale. In each session 4 images of
each individual wrist vein are captured. This database also consists of 1200 RGB palm vein
images taken in three distinct sessions (400 images in each session) from 50 identities (both

Towards Multi-modal Sclera and Iris Biometric Recognition with Adaptive Liveness Detection
195 | P a g e
left and right hand) where each channel of RGB colour space is represented in grey-scale.
In each session, 4 images of individual palm veins are captured. The database contains
blurred images also. High-resolution images (1024 x 768) are provided in the database. All
the images are acquired in the Infra-red spectrum. All the images are in BMP format.
Different quality wrist vein images were used and some of the sample images are shown
below in Figure 6.11(a-f). The dataset also consists of palm vein images they are not used
in the experiment. Examples of such images is in Figure 6.11(h-m).
(a) (b) (c) (d)
(e) (f) (g)
(h) (i) (j) (k)
(l) (m)
Figure 6.11:(a)- (f) Different quality of wrist vein images used in the experiments, (g) A framework of the
image capturing technique[9].(h)-(m)Images of low resolution palm print from the mention dataset [268].

Towards Multi-modal Sclera and Iris Biometric Recognition with Adaptive Liveness Detection
196 | P a g e
Only the wrist vein images are utilised in this experiment. Some of the wrist vein images
are having good quality of vein regions visibility, some of them are of medium quality and
the third type was of poor quality with respect to vein visibility. In the experiments, all the
images of sessions 1, 2 and 3 were considered.
Here single sessions, as well as multi-session experiments were performed. For the single
session experiments, sessions 1, 2 and 3were considered separately, 2 images from each
class of each session randomly chosen and utilised for training and the remaining 2 images
for testing the performance.
For multisession experiment 4 images from one session were considered for training, and
images from a other session for testing and vice versa. Also tested by two sessions and
trained by one session, and testing by one session and training by other. For single session
experiments 100*2 (100 as because 50 individual left and right hand both and for each
individual left and right hand pattern varies) scores for FRR and 100*99 score for FAR
statistics.
For multisession with two sessions and 100*4 scores for FRR and 100*99 score for FAR
statistics for multisession experiment between two sessions. For multisession experiment
between three session, when two for testing and one for training 100*8 scores for FRR and
100*99 score for FAR statistics are achieved. For multisession experiment between three
session, when one for testing and two for training 100*4 scores for FRR and 100*99 score
for FAR statistics are achieved.
All the simulation experiments performed here were developed in Matlab 2013a on the
Windows 7 platform, core I5 processor having 4 GB of RAM.
6.2.2.2. Results
First adaptive histogram equalisation was performed with a tiled window size of 14x14 at a
clip limit of 0.01, with a full range and distribution exponential to get the best result.
Further, the Discrete Meyer wavelet was used to enhance the vessel patterns more
prominently. Low pass reconstruction with a cut off range of -0.9 * 𝑒10 and a window size
of 3x3. Next, the adaptive histogram equalization with a tiled window size of 14x14 at a
clip limit of 0.01is used again, with full range and distribution exponential is applied to the
filtered image. The result obtained from the different multisession and single session
experiments performed are in the Table 6.12. It can be observed from the above experiment
that result did not varied between the experiments carried out with Single session and
multisession experiment with two training session and one testing session. This signifies
the robustness of the system with variation in time duration and other acquiring conditions
is achieved. Whereas the result for the multisession experiment with one session for training
and two sessions for testing have deteriorated a bit, possible reason can be the ratio of
number of training and testing images.

Towards Multi-modal Sclera and Iris Biometric Recognition with Adaptive Liveness Detection
197 | P a g e
Table 6.12: EER in % of the single and multi-session experiments
Type of experiment EER in %
Single session using session 1 0.8
Single session using session 2 0.83
Single session using session 3 0.75
Multi-session using session 1 as test 2 as train 0.91
Multi-session using session 2 as test 1 as train 0.89
Multi-session using session 1 as test 3 as train 0.88
Multi-session using session 3 as test 1 as train 0.89
Multi-session using session 2 as test 3 as train 0.81
Multi-session using session 3 as test 2 as train 0.84
Multi-session using session 1 as test 2 and 3 as train 0.81
Multi-session using session 2 as test 1 and 3 as train 0.8
Multi-session using session 3 as test 2 and 3 as train 0.79
Multi-session using session 1 and 2 as test and 3 as train 1.31
Multi-session using session 1 and 3 as test and 2as train 1.42
Multi-session using session 3 and 2 as test and 1as train 1,23
Multisession experiment for session 1and 2 for training and session 3 as testing produces
the best result for the multi-session experimental environment. For the single session
experiments, session 3 produces the best results. It can also be concluded from the above
Table that the results for the multisession experiments have deteriorated somewhat. The
possible cause can be the presence of some lighting and other conditions changes in between
the sessions.
6.2.2.3. Comparison with the State-of-the-art
The results of the proposed work are analysed with respect to the state-of-the-art by
comparing it with the most similar work on the PUT hand vein dataset that could be found
in the literature. Table 6.13 reflects a state-of-the-art comparative analysis of the most
similar work on the PUT hand vein dataset.

Towards Multi-modal Sclera and Iris Biometric Recognition with Adaptive Liveness Detection
198 | P a g e
Table 6.13. A state of the art comparison with the proposed work.
Work Equal Error Rate (in %)
Kabaciński et al. [208]
3.51
Kabaciński et al. [209]
2.19
Kabaciński et al. [210] 3.8
Proposed System 0.79 (multisession experiment with all the images)
The proposed technique outperformed the other previous techniques in terms of
recognition and validation which is reflected in the Table 6.14. The result reported in the
previous works was not reported with multisession experiment.
Table 6.14. A state of the art comparison of different methods employed in various stages with the proposed
work.
Work Enhancement
technique
Feature
extraction
technique
Classification
technique
Kabaciński et al. [208]
Binarization Correlation Matching
Kabaciński et al. [209]
Discrete Fourier Transformation
Correlation Matching
Kabaciński et al. et al.
[210]
Gauss filters
Correlation Matching
Proposed System Adaptive histogram equalization and a
low pass Discrete Meyer Wavelet
Dense LBP SVM
Hence the proposed scheme is the most realistic one, since it did not discarded any images
from the dataset used, and the experiments were also performed with multisession data,
where the sessions have variation in change in environmental condition, population, data
accruing technique and time span gap.

Towards Multi-modal Sclera and Iris Biometric Recognition with Adaptive Liveness Detection
199 | P a g e
Another significant novelty of this work is the usage of statistical classifier like SVM in
contrast to the other related work, where correlation matching was used for classification.
In order make a state of art compares with the most similar work that can be found in the
literature on PUT dataset are compares with the different enhancement, feature extraction
and classification used in the previous work with contrast the proposed in the Table 6.14.
6.2.3. Summary of Wrist Biometrics
This work has proposed a novel method of wrist vein recognition. Adaptive histogram
equalisation was used for wrist vein pre-processing and a low pass Discrete Meyer Wavelet
reconstruction filter for establishing appropriate features was employed. Dense LBP is used
here for feature extraction, which provides information about the different pattern structures
followed by clustering by K-means. Identification is achieved by SVM classification. The
proposed approach has achieved high recognition accuracy employing the PUT hand vein
dataset. The future scope will include exploring the multimodal biometric system using all
biometric trait present in hand.
6.3. Script Identification
With the increasing demand for creating a digital world, many Optical Character
Recognition (OCR) algorithms have been developed over the years. The scripts can be
defined in the graphical form of the writing system, which is used to write statements all
around the world. Designing a universal OCR considering all the script, is a challenging
task as the featuring character usually depends on the structural script properties and the
amount of possible classes or characters. Moreover, the size of such classes would be huge.
Therefore, most OCR systems are script dependent.
An option for handling documents in a multiscript environment is a two-step scheme:
first the script identification of the document, in block, line or word level and in the second
phase the appropriate OCR is used. This approach requires a script identifier and a bank of
OCR, one per script. Many Script Identification algorithms have been proposed over the last
years. A survey published in 2010, with a taxonomy of the script identification system can
be found in 0. The script identification can be done offline from the scanned document or
online if the writing sequence is available. The problem can also be divided into printed or
handwritten document. Challenge for handwritten it is more challenging. The script
identification can be performed at different levels, namely: page or document, paragraph,
block, line, word and character level.
The script identification problem depends on the number of possible scripts that can be
found in the document. Bi-script is the most usual problem although tri-scripts scenario are
also found in 0. The presence of more than three scripts in a document is less common.
Other relevant variable for the script identification is the scripts to be identified. The

Towards Multi-modal Sclera and Iris Biometric Recognition with Adaptive Liveness Detection
200 | P a g e
challenge of script identification is not the same for a different combination of script, for
example, the challenge to discriminate between Bengali and Devanagari, than Latin and
Japanese is quite different. The features of script identification methodologies can be
divided into Structure-Based and Appearance-Based Script Recognition. Structure-based
method extracts connected components and analyse their shapes and structures so as to
reveal the intrinsic morphological characteristics of the script. So, usual features are the
script upward or downward concavities, curvatures, etc. Whereas appearance based features
analyse the script by their shape, without analysing character by character. Therefore, usual
parameters are height distribution, bottom and upper line profiles, horizontal and vertical
projection profiles, image texture based on Gabor filtering and so on.
Recently, an approach based on local patterns has been proposed 0. Histograms of local
patterns are used as features describing both the stroke directions distribution and global
appearance. Most of the works claim for identification rates over 92%, but each work uses
different datasets with different scripts. Therefore it is difficult to compare the different
approaches. The databases include usually two to four scripts. A few works include more
than four up to thirteen. Most popular scripts are Latin, Indian Scripts plus Japanese and
Chinese. Also Greek, Russian a Hebrew is found 0. A common database for algorithms
comparison would be desirable. Years ago, it was really costly to build a dataset. Nowadays
it becomes simpler and easier. For instance, documents in different scripts can be generated
using Google translator application as in 0 but their font and size would be unique. To
alleviate this drawback, this work is aimed to offer as a resource for researchers a wide range
database for script identification along with a benchmarking of it with local patterns
features. The dataset has been obtained from different local newspaper and magazines,
containing in this way different fonts, sizes, cursive, bold, etc. A benchmark is given using
local pattern texture based features with a Support Vector Machines as a classifier. Next, to
the traditional Local Binary Pattern and Local Directional Pattern, other features are here
suggested, such as Oriented Local Binary Patterns, Local Derivative Patterns and Dense
Multi-Block Local Binary Patterns, the last ones used for the first time in this work for script
identification.
6.3.1. Database
The database has been recorded from a wide range of local newspapers and magazines so
that the contents are as realistic as possible. The newspapers were collected mainly from
India, which is one of the richest countries in a variety of scripts, Thailand, Japan, UAE and
Europe. It includes 12 different scripts: Arab, Bengali, Gujarati, Gurmukhi, Hindi, Japanese,
Kannada, Malayalam, Oriya, Latin, Telugu and Thai.
The newspapers were scanned at 300dpi resolution. Paragraphs with only one script
were selected for the database. As paragraph, it means the headline and text. In this way,
different text sizes, fonts, cursive, bold, etc. for each script are included in the database. All

Towards Multi-modal Sclera and Iris Biometric Recognition with Adaptive Liveness Detection
201 | P a g e
the text lines are horizontal. The images were saved in TIFF format. The files were named
as script_xxx.tif, being script an acronym for each script and xxx the file number starting at
000 for every script. The script and the number of documents for every script can be found
in table 6.15.
6.3.2. Preprocessing
The benchmarking of the database has been performed at three levels: block, line and word.
The next subsections describe the segmentation procedure to obtain the blocks, lines and
words.
6.3.2.1. Block Segmentation
The document images were cropped and divided into blocks of 128x128 pixels overlapped
15%. An example of the results is given in Figure 6.12. These images are not provided with
the database due to the easiness of the procedure.
Figure 6.12. Block segmented documents

Towards Multi-modal Sclera and Iris Biometric Recognition with Adaptive Liveness Detection
202 | P a g e
Table 6.15. Details about the proposed database
Script Notation Documents lines Words
Arabic Arab 51 1105 8141
Bengali bang 54 472 2674
Gujarati gujr 56 398 2365
Gurmukhi gurm 120 1075 11021
Devanagari hind 67 401 3233
Japanese japa 80 565 2619
Kannada kana 67 597 2357
Malayalam mala 70 730 5502
Oriya oriy 44 560 2401
Latin roma 56 972 8143
Telugu telu 67 494 2209
Thai thai 64 467 4034
Total: 796 7836 54704
6.3.2.2 Text Line segmentation
To segment the line, they are required to be horizontal. If it is not the case, a skew correction
algorithm should be used. The lines have been segmented as follows: each connected object
of the image has been labelled and its convex hull worked out. The result is dilated
horizontally in order to connect the objects belonging to the same line table 6.15.
Then the horizontal histogram is obtained and the line located at the maximums point of the
histogram is located. In each line, a horizontal line is drawn in order to connect distant object
of the same line. The next step is to extract line by line which has been done as follows:
1. Select the top object of the dilated lines and work out its horizontal histogram
2. If its histogram has a single maximum, it is supposed a single line and the dilated object
it is used as a mask to segment the line.

Towards Multi-modal Sclera and Iris Biometric Recognition with Adaptive Liveness Detection
203 | P a g e
3. If the object has several peaks, it is supposed that several lines have been mixed in the
object. To separate them, by the next steps:
a. The object is horizontally eroded until the top object contains single peak.
b. The new top object is dilated to recover the original shape and it is used as mask
to segment the top line
4. The top line is deleted and goes to step 1 until finishing.
The segmentation results were reviewed and the lines wrongly segmented were manually
fixed. The lines were saved and the files named as script_xxx_yyy.tif being yyy the line
number of the document script_xxx. Examples of segmented lines are shown in Figure
6.14.These images are saved in grayscale. The number of lines per script can be found in
table 6.15.
Figure 6.13: Line detection procedure
Figure 6.14. Examples of segmented lines in Latin, Thai, Arab, Malayalam and Japanese, respectively.
6.3.2.3.Word Segmentation
The words were segmented line by line in two steps. The first one was automatic. The lines
were converted to black and white, and the gaps were identified as vertical histogram equal
to zero. The gaps wider than one-third of the line height were labelled as words separations.
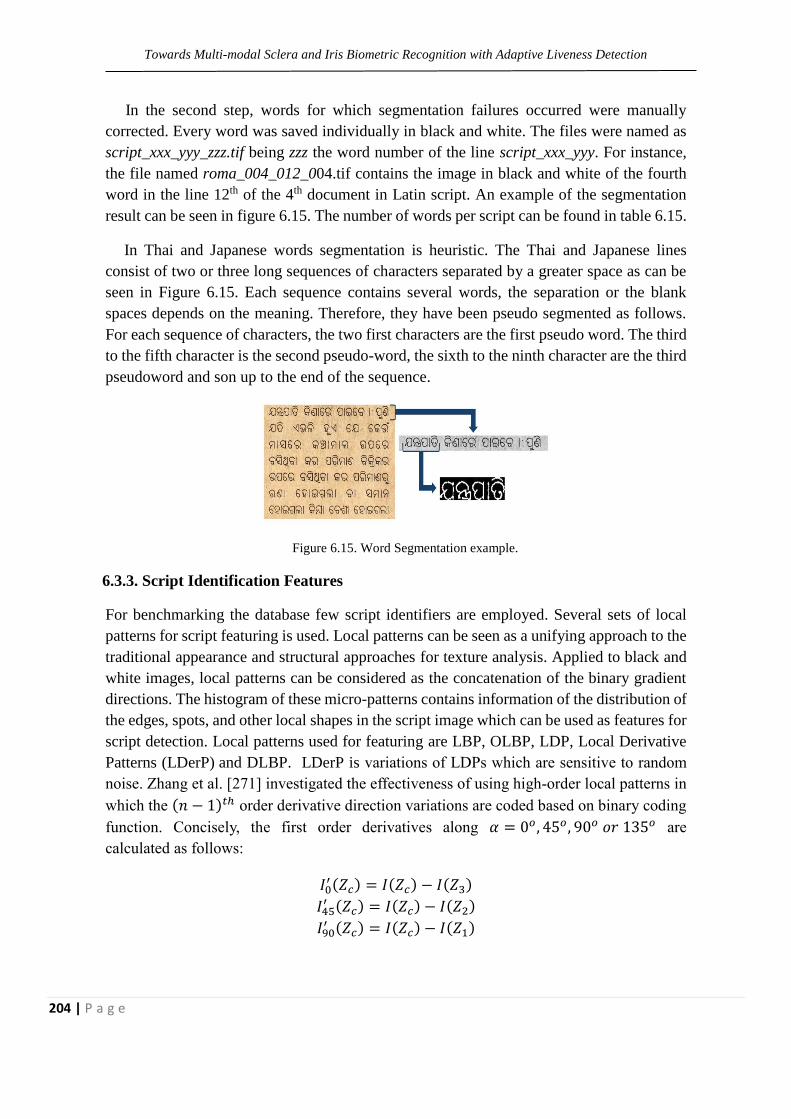
Towards Multi-modal Sclera and Iris Biometric Recognition with Adaptive Liveness Detection
204 | P a g e
In the second step, words for which segmentation failures occurred were manually
corrected. Every word was saved individually in black and white. The files were named as
script_xxx_yyy_zzz.tif being zzz the word number of the line script_xxx_yyy. For instance,
the file named roma_004_012_004.tif contains the image in black and white of the fourth
word in the line 12th of the 4th document in Latin script. An example of the segmentation
result can be seen in figure 6.15. The number of words per script can be found in table 6.15.
In Thai and Japanese words segmentation is heuristic. The Thai and Japanese lines
consist of two or three long sequences of characters separated by a greater space as can be
seen in Figure 6.15. Each sequence contains several words, the separation or the blank
spaces depends on the meaning. Therefore, they have been pseudo segmented as follows.
For each sequence of characters, the two first characters are the first pseudo word. The third
to the fifth character is the second pseudo-word, the sixth to the ninth character are the third
pseudoword and son up to the end of the sequence.
Figure 6.15. Word Segmentation example.
6.3.3. Script Identification Features
For benchmarking the database few script identifiers are employed. Several sets of local
patterns for script featuring is used. Local patterns can be seen as a unifying approach to the
traditional appearance and structural approaches for texture analysis. Applied to black and
white images, local patterns can be considered as the concatenation of the binary gradient
directions. The histogram of these micro-patterns contains information of the distribution of
the edges, spots, and other local shapes in the script image which can be used as features for
script detection. Local patterns used for featuring are LBP, OLBP, LDP, Local Derivative
Patterns (LDerP) and DLBP. LDerP is variations of LDPs which are sensitive to random
noise. Zhang et al. [271] investigated the effectiveness of using high-order local patterns in
which the (𝑛 − 1)𝑡ℎ order derivative direction variations are coded based on binary coding
function. Concisely, the first order derivatives along 𝛼 = 0𝑜 , 45𝑜 , 90𝑜 𝑜𝑟 135𝑜 are
calculated as follows:
𝐼0′(𝑍𝑐) = 𝐼(𝑍𝑐) − 𝐼(𝑍3)
𝐼45′ (𝑍𝑐) = 𝐼(𝑍𝑐) − 𝐼(𝑍2)
𝐼90′ (𝑍𝑐) = 𝐼(𝑍𝑐) − 𝐼(𝑍1)
Towards Multi-modal Sclera and Iris Biometric Recognition with Adaptive Liveness Detection
205 | P a g e
𝐼135′ (𝑍𝑐) = 𝐼(𝑍𝑐) − 𝐼(𝑍0)
The local derivative pattern is defined as:
𝐿𝐷𝑃′(𝑍𝑐) = {𝐿𝐷𝑃𝛼′(𝑍𝑐)| 𝛼 = 0𝑜 , 45𝑜 , 90𝑜 , 135𝑜} (6.4)
being 𝐿𝐷𝑃𝛼′(𝑍𝑐) the local derivative pattern in α direction:
𝐿𝐷𝑃𝛼′(𝑍𝑐) = {𝑠(𝐼𝛼′ (𝑍𝑖) ∙ 𝐼𝛼
′ (𝑍𝑐))| 𝑖 = 0,1, … . ,7} (6.5)
The above definition can be generalised to (𝑛 − 1)𝑡ℎ order derivate.
Block features-The blocks were transformed to 𝐿𝐵𝑃(𝑍), 𝑂𝐿𝐵𝑃(𝑍), 𝐿𝐷𝑃(𝑍) and
𝐿𝐷𝑒𝑟𝑖𝑣𝑃(𝑍) code matrixes. Each code matrix contains information about the structure to
which the pixel belongs: the stroke edge, stroke corners, stroke ends, inside the character or
background, etc. It is supposed that the distribution of these structures define the script.
Therefore, the block features are calculated as the histogram of the 𝐿𝐵𝑃(𝑍), 𝑂𝐿𝐵𝑃(𝑍),
𝐿𝐷𝑃(𝑍) and 𝐿𝐷𝑒𝑟𝑖𝑣𝑃(𝑍) code matrixes which are named as ℎ𝐿𝐵𝑃, ℎ𝑂𝐿𝐵𝑃, ℎ𝐿𝐷𝑃 and
ℎ𝐿𝐷𝑒𝑟𝑖𝑣𝑃𝛼 with 𝛼 = 0𝑜 , 45𝑜 , 90𝑜 , 135𝑜. The histogram of 𝐿𝐵𝑃(𝑍) contains 255 bins which
are the 255 components of the 𝐿𝐵𝑃 feature. The 𝐿𝐷𝑒𝑟𝑖𝑣𝑃 feature is obtained concatenating
the four 255 bins histogram being 255X4=1012 long. In the same way, the 𝑂𝐿𝐵𝑃 and 𝐿𝐷𝑃
featurs contains 20 and 56 components respectively. Take into account that the bin
corresponding to the code of the background has not been considered.
Line and word features- In this case, the script line or word image is transformed to
𝐿𝐵𝑃(𝑍), 𝑂𝐿𝐵𝑃(𝑍), 𝐿𝐷𝑃(𝑍) and 𝐿𝐷𝑒𝑟𝑖𝑣𝑃(𝑍) code matrixes. As at line and word level the
characteristic of the top, bottom and central area of the lines are different and distinctive of
the each script. Therefore it is possible to model the spatial distribution of local pattern by
dividing the line into a number of adjacent regions, calculating the histogram in each region
and concatenating them. After conducting several experiments, testing a range of smaller
and greater region sizes, the best performance was obtained when dividing the image into 4
equal horizontal regions which overlapped by 30%. For each region, calculate the
histograms {ℎ𝐿𝐵𝑃𝑖 }
𝑖=1
4, {ℎ𝐿𝐷𝑃
𝑖 }𝑖=1
4 and {ℎ𝐿𝐷𝑒𝑟𝑖𝑣𝑃𝛼
𝑖 }𝑖=1
4with 𝛼 = 0𝑜 , 45𝑜 , 90𝑜 , 135𝑜 . The
feature is obtained concatenating the histograms of all 4 regions in order to do not loss the
spatial information obtaining the next vectors (nevertheless, experiments accumulating the
histograms have been also done with discouraging results): The LBP feature of dimension

Towards Multi-modal Sclera and Iris Biometric Recognition with Adaptive Liveness Detection
206 | P a g e
1020, the 𝑂𝐿𝐵𝑃 of dimension 80, the 𝐿𝐷𝑃 feature with a dimension equal to 224 and the
LDerP feature of dimension 4080.
In order to obtain scale invariance, the feature vectors are normalised to an area equal to
one. An example of this procedure for 𝐿𝐵𝑃 feature vector calculation is shown in Figure
.16.
Figure 6.16. Example of LBP feature vector
A Support Vector Machine (SVM) has been used as classifier due to the large dimension
of the feature vectors. SVM is a popular supervised machine learning technique which
performs an implicit mapping into a higher dimensional feature space. This is the so-called
kernel trick. After the mapping is completed it finds a linear separating hyperplane with
maximal margin to separate data from this higher dimensional space. Least Squares Support
Vector Machines (LS-SVM) are reformulations to standard SVMs which solve the
indefinite linear systems generated within them. Robustness, sparseness and weightings can
be imposed to LS-SVMs where needed and a Bayesian framework with three levels of
inference is then applied. Though new kernels are being proposed, the most frequently used
kernel functions are linear, polynomial, and Radial Basis Function (RBF). This study uses
the RBF kernel for LBP, OLBP, LDP and LDerP and a linear kernel for Dense LBP. SVM
or LS-SVM makes binary decision and multi-class classification for script identification has
been made in this study by adopting the one-against-all techniques. Carried out grid-search
on the hyper-parameters in the 10-fold cross-validation for selecting the parameters of the
training sequence.
6.3.4. Experimental Results
The script database benchmarking is given in bi-script experiments in three levels: block,
line and word. The scripts pair compared have been Latin with Indian languages and
Devanagari with Indian languages, which are common cases. The training sequences consist
of 30% of each script samples while the remainder 70% is used for testing. The released
dataset includes the training and testing sequences. When a cropped block, line or word
image contain less than the 10% of pixels belonging to strokes the image is discarded.

Towards Multi-modal Sclera and Iris Biometric Recognition with Adaptive Liveness Detection
207 | P a g e
The benchmark results are given in Table 6.16, for block, line and word levels. In
average, the results at block level are worse than at line level. But it doesn’t stand for all the
experiments, for instance in the experiment Devanagari vs. Malayalam. The result from line
to word level, when comparing with Latin the results in average get worse, but comparing
with Devanagari, the results in average improves. In general, there are not clear tendencies
in the results. Therefore, this problem seems a case to case problem and the results are very
dependent on the script to discriminate and the level: block, line, word.
Table 6.16. Benchmark: Hit ratio in % at Block, Line and Word level for different texture features
Block Level Line Level Word Level
Scripts LBP OLPB LDP LDerP DLBP LBP OLPB LDP LDerP DLBP LBP OLPB LDP LDerP DLBP
Lat
in
Arab 94.22 96,60 97,67 94,18 94,74 92,25 92,38 92,31 92,31 99,10 99,67 99,53 99,48 99,54 96,90
Bengali 99,44 99,61 98,88 99,49 89,80 98,94 100,00 100,00 100,00 98,90 99,62 99,43 99,32 99,55 99,70
Gujarati 95,54 96,99 97,92 95,87 89,00 96,39 99,90 99,36 99,18 96,20 97,89 97,68 98,56 97,82 94,20
Gurmukhi 59,79 63,98 63,86 59,33 96,90 92,59 92,86 92,86 92,79 93,40 80,69 80,73 80,60 80,80 87,90
Devanagari 99,52 97,54 98,22 99,52 89,80 99,72 100,00 100,00 100,00 98,60 99,64 99,21 99,26 99,50 99,80
Japanese 99,28 99,77 98,82 99,18 92,70 98,84 99,65 99,95 99,82 98,30 98,04 97,54 96,05 96,02 98,80
Kannada 98,32 98,59 98,82 98,49 93,90 99,49 100,00 98,72 99,70 97,70 98,69 98,62 98,70 98,97 99,50
Malayalam 97,29 91,42 95,19 97,26 81,60 97,48 97,97 96,72 96,06 99,10 91,24 91,41 90,54 92,22 99,70
Oriya 94,18 94,79 93,57 94,51 88,30 98,88 99,82 99,68 99,91 96,20 97,23 98,53 97,58 97,28 99,50
Telugu 97,29 97,15 97,70 97,41 97,90 99,12 100,00 99,29 99,29 99,00 98,85 98,54 98,29 98,53 99,20
Thai 99,13 98,48 98,91 99,02 82,50 98,76 99,64 99,64 100,00 97,00 98,46 96,70 97,14 96,12 91,30
Dev
anag
ari
Bengali 94,41 82,77 86,00 94,65 77,30 87,88 88,19 85,12 88,34 96,70 95,57 95,86 96,19 97,63 99,10
Gujarati 69,32 70,31 73,23 70,95 75,30 92,67 98,71 99,81 97,52 92,40 97,59 98,88 99,09 98,50 99,40
Gurmukhi 51,05 53,02 53,77 50,89 71,50 55,43 55,43 55,43 55,43 81,90 50,00 50,00 50,00 50,00 82,60
Kannada 69,15 83,00 78,40 67,60 96,90 76,41 77,15 77,15 76,53 100,00 98,02 98,46 98,54 97,15 99,80
Malayalam 97,03 99,36 97,88 97,03 100,00 68,23 68,23 68,23 68,23 100,00 70,50 70,39 70,47 70,50 99,90
Oriya 84,37 75,89 77,04 86,82 96,00 80,00 80,00 80,00 80,00 99,90 99,80 99,17 99,53 99,67 99,90
Telugu 85,73 97,39 89,59 82,21 95,70 86,53 86,98 86,83 86,83 99,10 95,12 99,29 98,37 98,30 99,60
The script identification rate between Devanagari and Gurmukhi is around 50% in all the
experiments. At first, it was considered as a lack of training for Gurmukhi. Therefore the
number of Gurmukhi documents in the dataset were increased which yielded a greater

Towards Multi-modal Sclera and Iris Biometric Recognition with Adaptive Liveness Detection
208 | P a g e
training sequence. Still the results remained the same. Analysing in detail both in scripts,
they display a very similar structure in their characters. The similar number of horizontal,
vertical and curved components in both scripts seems to be the origin of the confusion for
texture-based features. Although lesser extent, it also happens with Gujarati. So they need
another descriptor to be distinguished. The Dense LBP works much better than LBP, OLBP,
LDP and LDerP. It can be due to their multi-scale property and greater spatial resolution.
6.3.5. Summary of Script Identification A new printed multiscript dataset for free distribution has been introduced in this work. It
contains realistic samples obtained from local newspaper and magazines. Different fonts,
size, cursive, bold texts are considered in the dataset. The dataset includes scanned
documents at 300dpi, the segmented lines and words along with the training and testing
sequences for fair algorithms comparison.
The benchmarking is provided at the block, line and word level with different texture
based features, which are the well-known LBP, OLBP, LDP and LDerP. Additionally, a set
of parameters never used for script identification called Dense-LBP is proposed in this work
with excellent results due to their multi-scale and denser spatial description.
Just to pint out there is not a clear tendency in the results, so this problem seems a case
to case problem, i.e. there is not a universal solution but the optimal solution for each script
identification problem is different.

Towards Multi-modal Sclera and Iris Biometric Recognition with Adaptive Liveness Detection
209 | P a g e
Towards Multi-modal Sclera and Iris Biometric Recognition with Adaptive Liveness Detection
210 | P a g e
7
Conclusions and Future Scope
This chapter concludes the thesis by summarising the research contributions, limitations and
suggests some areas for future work. The recent popularity of biometric systems in trusted
involuntary security zones, adhere the biometric system to be more reliable in relation to a
spoofing attack. To overcome the spoofing attack several liveness detection methods are
proposed in the literature. However, adaptability of the trait with respect to different changes
and liveness detection is found to be a trade-off. This thesis has made an attempt to solve
the trade-off. The thesis also contributes to advance the multimodal ocular biometric using
the sclera and iris. In addition, the thesis also contributes to other field of pattern recognition:
wrist biometrics, multi-script signature verification and script identification. A summary of
the contribution is listed in the next section.
7.1. Contributions
In Chapter 2, the existing state-of-the-art methods published in the various research areas
within sclera, iris, and multimodal ocular biometrics using sclera and iris are reviewed. After
reviewing iris literature, it was found that the recent trend of research in iris biometrics is
iris recognition in non-ideal conditions. To increase the applicability multimodal iris
biometrics is proposed. Among iris multimodal biometrics, iris combination with sclera is
most popular. The state-of-the-art of sclera biometrics is still not well explored. Therefore,
different challenges in processing sclera trait are discussed followed by a review of its
literature. Specifically, the published methods on the sclera and iris segmentation
enhancement, feature extraction, classification, and information fusion are reviewed. It was
found that multimodal ocular biometrics-based on iris and sclera is a very upcoming

Towards Multi-modal Sclera and Iris Biometric Recognition with Adaptive Liveness Detection
211 | P a g e
research area and has a promising literature. The methodology used on sclera segmentation
can be classified into two categories: intensity based and shape based. Further, sclera feature
can be broadly grouped into two categories: shape based and texture based. Different
databases available and performance on them are discussed. Pros and cons of each of these
approaches are discussed and potential research scope is identified. Followed by a way
forward of research on this subject of research. In the next part of the chapter, 2 literature
review on liveness detection and adaptive biometrics are discussed. Various shortcomings
and open research areas were identified based on the review. The main shortcoming
identified is the trade-off between adaptability and liveness. The problem description and
scope for the current research described in this thesis were finalised based on the identified
open research areas.
In Chapter 3, various segmentations, pattern enhancement, featuring, classification and
information fusion techniques are employed to advance the iris and sclera-based multimodal
biometrics. Intensity-based segmentation techniques were found to be more successful to
produce better sclera segmentation. Wavelet-based bank of filters was found to give best
enhancement for both the sclera and iris pattern. A dictionary based learning feature
extraction was found to best model the traits at the sensor level of information fusion. Two
datasets were employed namely UBIRIS version 1 and MASD. MASD database was
developed as a part of the contribution of the thesis. From the experiments conducted the
effect of gaze angle and acquiring artefacts on the identification performance of the trait is
identified. A state-of-the-art comparison of the proposed advancement is performed, which
inferred effective research contribution. A method for artificial synthesis of sclera pattern is
also proposed. Further, results of the biometric competition organised is analysed and open
research areas are discussed in details.
In Chapter 4, a couple of liveness detection methods were proposed and their results are
discussed. The first liveness detection method an anti-spoofing method using eye gaze angle
sequence was proposed. Next, a framework for liveness detection based on image quality
features is proposed. The framework performs user-level liveness detection is a contrast to
the previous framework proposed in the literature. To conduct the experiment a database
was proposed. The state-of-the-art comparison of the framework is also found to be very
effective in comparison to the previous frameworks. Some limitation and future work of the
proposed framework are also discussed.
In Chapter 5, the online-based classifier was proposed for adaptiveness of biometric trait
with respect to change in position, acquiring artefacts and ageing. Further, a framework
employing the base and the online classier was proposed to curtail the limitation of each of
this classier in AB and proposed a best optimal solution, A dataset was proposed with a

Towards Multi-modal Sclera and Iris Biometric Recognition with Adaptive Liveness Detection
212 | P a g e
large sample and multi-angle eye images to experiment the effectiveness of the proposed
framework.
In Chapter 6, contributions to various other fields of pattern recognition are discussed. In
the first contribution, the influence of script on multi-script signature verification is
investigated. It was found that the multi-script signature verification is a script independent
problem. Several statistical measures, feature extraction techniques and signature databases
from different scripts were employed in the study. In the next study, the wrist vein biometric
was investigated. A whole wrist vein biometric system was proposed and its results were
found to be effective in comparison to the previous works in the literature. The last
contribution of the chapter was on script identification of printed documents. A realistic
dataset was proposed in the work. Three level of script identification was investigated:
document level, line level and word level. Among them, word level was found to be most
effective using the Dense-LBP feature.
7.2. Future Work
A variety of research areas in the field of sclera and iris multimodal ocular biometric and
few other pattern recognition research domains were investigated in this thesis with the
objective of creating a robust and reliable recognition systems. Several research areas and
scope for improvement were identified for future research. Possible future research work
can be summarised as follows:
Various open research areas are identified at the different stages of the sclera biometrics
and a whole set of way forward is also discussed in the thesis which can be considered
for future research.
Liveness detection-based on the fusion of image quality feature, bodily response and the
voluntary signal from individuals can be employed to design more robust anti-spoofing
technique.
Dataset for liveness detection considering larger population size is also required to be
developed.
Different online learning-based classifiers are required to be investigated for finding the
capability of online learning for adaptive biometrics.
Dataset for experimenting adaptive biometrics considering larger population size and
different change in acquiring condition is also required to be developed.
The influence of script on multi-script ASV for other scripts is required to be investigate.

Towards Multi-modal Sclera and Iris Biometric Recognition with Adaptive Liveness Detection
213 | P a g e
Literature of the wrist biometric is very limited, therefore intense research on this field
of biometrics is highly anticipated.
Script identification for handwritten documents can be highly challenging and very
limited research has been conducted. Therefore, intense research on this subject is
required.
7. 3. Criticism of the proposed work
Some limitations of the present work are also identified and critics of this work are
addresses and how they can be solve are summarised as following:
The sclera segmentation are performed by clustering-based and intensity-based shape
techniques. Miss-classification was found in these techniques due to changes in intensity
etc. These challenges can be resolved-based on CNN-based segmentation techniques,
some initial investigations found from the algorithms submitted from the participants of
SSBC 2015 and SSERBC 2017.
The sclera segmentation enhancement techniques proposed were found not perfectly
robust with changes in lighting, illumination, etc. Therefore, more advance image
enhancement techniques like grey scale grouping, Tabu search, etc. can be used.
The performance quality-based features proposed for liveness detection of ocular
biometrics in visible spectrum can fluctuate due to change in illumination. More robust
texture-based feature and signal to action response can also be employed.
The performance of the adaptive biometric in the proposed framework in chapter 5
found to achieve limited performance accuracy. A very initial ground of this subject of
research was founded in the thesis. A wide spectrum of advancement including
designing larger dataset, betterment of the performance can be done by fine tuning the
classifiers.
The experiments conducted on the script recognition were performed on the printed
script, whereas handwritten script recognition can be more challenging in the sense due
to their huge intra-class and inter-class variance.
The experiment conducted for the wrist vain recognition is on a very limited population
size, so a potential research is required to outperform the limitation and push the
boundary of this research.
The vain enactment techniques employed for the wrist biometrics found to not perform
adaptively with respect to change in light and illumination resulting in noise inclusion
in the images. A potential research should be performed to uplift the present research
work conducted.

Towards Multi-modal Sclera and Iris Biometric Recognition with Adaptive Liveness Detection
214 | P a g e
The wrist vain was also experimented without segmentation, so potentiating non-wrist
information was also included

Towards Multi-modal Sclera and Iris Biometric Recognition with Adaptive Liveness Detection
215 | P a g e

Towards Multi-modal Sclera and Iris Biometric Recognition with Adaptive Liveness Detection
216 | P a g e
References:
[1] R. Derakhshani, A. Ross, and S. Crihalmeanu. A new biometric modality based on
conjunctival vasculature. Proceedings of Artificial Neural Networks in Engineering: 1-8,
2006.
[2] R. Derakhshani and A. Ross. A texture-based neural network classifier for biometric
identification using ocular surface vasculature. Proceedings of International Joint
Conference on Neural Networks: 2982–2987, 2007.
[3] Z. Zhou, Y. Du, N. L. Thomas, and E. J. Delp. Multi angled sclera recognition. IEEE
Workshop on Computational Intelligence in Biometrics and Identity Management: 103 –
108, 2011.
[4] Z. Zhou, Y. Du, N. L. Thomas, and E. J. Delp. Multimodal eye recognition. Proceedings
of the International Society for Optical Engineering, 7708(770806):1-10, 2010.
[5] Z. Zhou, Y. Du, N. L. Thomas, and E. J. Delp. A new biometric sclera recognition. IEEE
transaction on System, Man and Cybernatics –PART A: System and Human, 42(3): 571-
583, 2012.
[6] Z. Zhou, Y. Du, N. L. Thomas, and E. J. Delp, Quality Fusion Based Multimodal Eye
Recognition, IEEE International Conference on Systems, Man, and Cybernetics: 1297-
1302, 2012.
[7] M. H. Khosravi and R. Safabakhsh, Human eye sclera detection and tracking using a
modified time-adaptive self-organizing map, Pattern Recognition, 41: 2571 – 2593, 2008.
[8] S. Crihalmeanu and A. Ross, Multispectral sclera patterns for ocular biometric
recognition, Pattern Recognition Letters, 33: 1860–1869, 2012.
[9] S. PavanTankasala, P. Doynov, R. R. Derakhshani, A. Ross and S. Crihalmeanu,
Biometric Recognition of Conjunctival Vasculature using GLCM Features, International
Conference on Image Information Processing : 1-6, 2011.
[10] K. Oh and K.Toh, Extracting Sclera Features for Cancelable Identity Verification, 5th
IAPR International Conference on Biometric: 245-250, 2012.
[11] V. Gottemukkula, S. K. Saripalle, S. P. Tankasala, R. Derakhshani, R. Pasula and A.
Ross, Fusing Iris and Conjunctival Vasculature: Ocular Biometrics in the Visible Spectrum,
IEEE Conference on Technologies for Homeland Security: 150-155, 2012.
[12] U. Park, A. Ross, and A. K. Jain, Periocular Biometrics in the Visible Spectrum: A
Feasibility Study, IEEE 3rd International Conference on Biometrics: Theory, Applications,
and Systems: 1-6, 2009.

Towards Multi-modal Sclera and Iris Biometric Recognition with Adaptive Liveness Detection
217 | P a g e
[13] Z. Zhou, E. Y. Du, and N. L. Thomas, A Comprehensive Sclera Image Quality
Measure, 11th International Conference on Control, Automation, Robotics and Vision: 638-
643, 2010.
[14] S. Crihalmeanu, A. Ross , and R. Derakhshani, Enhancement and Registration Schemes
for Matching Conjunctival Vasculature, Appeared in Procceding of the 3rd IAPR/IEEE
International Conference on Biometrics :1247–1256, 2009
[15] T. F. Chan, and L. A. Vese, Active Contours Without Edges, IEEE Transaction On
Image Proccessing 10(2): 266-277, 2001
[16] J. G. Daugman. High confidence visual recognition of persons by a test of statistical
independence. IEEE Transactions on Pattern Analysis and Machine Intelligence,
15(11):1148–1161, 1993.
[17] H. Shah-Hosseini and R. Safabakhsh, TASOM: a new time adaptive self-organizing
map, IEEE Trans. Syst. Man Cybern. Part B, vol. 33, no. 2, pp. 271-282, 2003.
[18] H. Shah-Hosseini and R. Safabakhsh, A TASOM-based algorithm for active contour
modelling, Pattern Recognition Letter, vol. 24, no. 9, pp. 1361-1373 2003.
[19] Z. Zhou, E. Y. Du, and N. L. Thomas, A Comprehensive Sclera Image Quality
Measure, 11th International Conference on Control, Automation, Robotics and Vision, pp.
638-643, 2010.
[20] S. Lazebnik, C. Schmid, and J. Ponce: Beyond bags of features: Spatial pyramid
matching for recognizing natural scene categories, In Proc. Computer Vision and Pattern
Recognition (CVPR), 2, 2169–2178.
[21] Hugo Proença and, Luís A.Alexandre, UBIRIS: A noisy iris image database, Proceed.
of ICIAP 2005 - Intern. Confer. on Image Analysis and Processing, 1, 970-977,2005.
[22] S. Crihalmeanu and A. Ross, On the use of multispectral conjunctival vasculature as a
soft biometric. In: Proc. IEEE Workshop on Applications of Computer Vision (WACV), pp.
204-211, 2011.
[23] Ko Nishino and Shree K. Nayar. Eyes for relighting. ACM Trans. Graph., vol 23, no.
3, pages 704–711, 2004.
[24] J. Canny. A computational approach to edge detection. IEEE Transactions on Pattern
Analysis and Machine Intelligence, vol. 8, pages 679–698, 1986.
[25] D. Martin-Roche, C. Sanchez-Avila, and R.Sanchez-Reillo. Iris recognition for
biometric identification using dyadic wavelet transform zero-crossing. IEEE Aerospace and
Electronic Systems Magazine, Mag. 17, no. 10, pages 3–6, 2002.

Towards Multi-modal Sclera and Iris Biometric Recognition with Adaptive Liveness Detection
218 | P a g e
[26] A. Bertillon, “La couleur de Piris”.Revue scientifique, vol. 36, no. 3, pp. 65-73, 1885.
[27] J. Daugman, “High confidence personal identification by rapid video analysis of iris
Texture”, Proc. IEEE International Carnaha conf. on security technology, 1992.
[28] J. Daugman,”High confidence visual recognition of persons by a test of statistical
independence,”, IEEE Trans. on Pattern Analysis and Machine Intelligence, vol.15, no. 11,
pp. 1148-1161, 1993.
[29] J. Daugman, “How iris recognition works,” Circuits and Systems for Video
Technology,” IEEE Trans. , Vol. 14, no. 1, pp. 21-30, 2004.
[30] J. Daugman,” New Methods in Iris Recognition,” Proc. IEEE Trans. on the system,
man and cybernetics-part B, vol. 37, no 5, pp. 1167-1175, 2007.
[31] S. Mallat, "A theory for multiresolution signal decomposition: the wavelet
representation," IEEE Pattern Anal. and Machine Intell., vol. 11, no. 7, pp. 674–693. 1989.
[32] J. B. MacQueen,. "Some Methods for classification and Analysis of Multivariate
Observations". Proceedings of 5th Berkeley Symposium on Mathematical Statistics and
Probability, University of California Press. pp. 281–297. MR 0214227. Zbl 0214.46201.
Retrieved 2009-04-07, 1967.
[33] J. C. Dunn : "A Fuzzy Relative of the ISODATA Process and Its Use in Detecting
Compact Well-Separated Clusters", Journal of Cybernetics 3: 32-57, 1973.
[34] J. C. Bezdek : "Pattern Recognition with Fuzzy Objective Function Algoritms", Plenum
Press, New York, 1981.
[35] B.N. Li, C.K. Chui, S. Chang, and S.H. Ong, Integrating spatial fuzzy clustering with
level set methods for automated medical image segmentation. Computers in Biology and
Medicine 41(1) 1-10, 2011.
[36] S. M. Pizer, E. P. Amburn, J. D. Austin: Adaptive Histogram Equalization and Its
Variations. Computer Vision, Graphics, and Image Processing 39 (1987) 355-368.
[37] I. Daubechies, Ten lectures on wavelets, CBMS-NSF conference series in applied
mathematics, SIAM Ed., pp. 117–119, 1992.
[38] H. William; A. Saul; T. William; B. P. Flannery,. "Section 16.5. Support Vector
Machines". Numerical Recipes: The Art of Scientific Computing (3rd ed.). New York:
Cambridge University Press. ISBN 978-0-521-88068-8,2

Towards Multi-modal Sclera and Iris Biometric Recognition with Adaptive Liveness Detection
219 | P a g e
[39] A. Das and R. Parekh “Iris Recognition using a Scalar based Template in Eigen-space”,
International Journal of Computer Science and Telecommunication, vol.3, no.5, pp 74-79.,
May 2012.
[40] A. Das and R. Parekh “Iris Recognition in 2D Eigen-space”, International Journal of
Computer Applications, vol .52,no.19, pp 1-6, August 2012.
[41] K. Oh, B.-S. Oh, K.-A. Toh, H.-L.Eng and W.-Y.Yau, "Combining Sclera and
Periocular Features for Multi-modal Identity Verification", Neurocomputing, vol. 128, pp.
185-198, 2014.
[42] A. Das, Face Recognition in reduced Eigen plane”, International Conference on
Communications, Devices and Intelligent Systems , 620- 623, 2012.
[43] D. Sheet, H. Garud, A. Suveer, J. Chatterjee and M. Mahadevappa, Brightness
Preserving Dynamic Fuzzy Histogram Equalization, IEEE Trans., Consumer Electronics,
6(4), 2475 - 2480, Nov. 2010.
[44] T. Mäenpää, M. Pietikäinen, Texture Analysis with local binary Patterns, in C.H. Chen,
P.S.P. Wang (eds.): Handbook of Pattern Recognition and Computer Vision, 3rd edn. World
Scientific, pp. 197-216, 2005.
[45] W. Bu., X. Wub, E. Gaob: Hand Vein Recognition Based on Orientation of LBP. Proc.
of SPIE, Vol. 8371(83711), pp. 1-12 (2012).
[46] D. G. Lowe, ‘Distinctive image features from scale-invariant keypoints’, Proceedings
of IJCV 2004, 2, (60), pp. 91-110. 2004.
[47] A. Morales, M. A. Ferrer and A. Kumar. “Toward Contactless Palmprint
Authentication”. IET Computer Vision 2011, Volume 5, Issue 6, pp. 407-416.
[48] F. Alonso-Fernandez, P. Tome-Gonzalez, V. Ruiz-Albacete, and J. Ortega-Garcia: Iris
recognition based on sift features. In: Int’l Conf. on Biometrics, Ident. and Sec (BIdS), pp.
1–8 (2009).
[49] Md. H. Kabir, T. Jabid and O. Chae, “A Local Directional Pattern Variance (LDPv)
based Face Descriptor for Human Facial Expression Recognition”, in Proceedings of the
IEEE Advanced Video and Signal Based Surveillance (AVSS), pp. 526–532, August 2010
[50] R. P. Wildes. Iris recognition: an emerging biometric technology. In Proceedings of the
IEEE, vol. 85, no.9, pages 1348–1363, U.S.A., September 1997.
[51] J. Huang, Y. Wang, T. Tan, and J. Cui. A new iris segmentation method for recognition.
In Proceedings of the 17th International Conference on Pattern Recognition (ICPR04), vol.
3, pages 23–26, 2004.

Towards Multi-modal Sclera and Iris Biometric Recognition with Adaptive Liveness Detection
220 | P a g e
[52] W. K Kong and D. Zhang. Accurate iris segmentation method based on novel reflection
and eyelash detection model. In Proceedings of the 2001 International Symposium on
Inteligent Multimedia, Video and Speech Processing, pages 263–266, Hong Kong, May
2001.
[53] W. K Kong and D. Zhang. Accurate iris segmentation method based on novel reflection
and eyelash detection model. In Proceedings of the 2001 International Symposium on
Inteligent Multimedia, Video and Speech Processing, pages 263–266, Hong Kong, May
2001.
[54] L. Ma, Y. Wang, and T. Tan. Iris recognition using circular symmetric filters. In
Proceedings of the 25th International Conference on Pattern Recognition (ICPR02), vol. 2,
pages 414–417, Quebec, August 2002.
[55] L. Ma, T. Tan, Y. Wang, and D. Zhang. Personal identification based on iris texture
analysis. IEEE Transactions on Pattern Analysis and Machin Intelligence, vol. 25, no. 12,
pages 2519–2533, December 2003.
[56] L. Ma, Y. Wang, and D. Zhang. Efficient iris recognition by characterizing key local
variations. IEEE Transactions on Image Processing, vol. 13, no. 6, pages 739–750, June
2004.
[57] Y. Du, R. Ives, D. Etter, T. Welch, and C. Chang. A new approach to iris pattern
recognition. In Proceedings of the SPIE European Symposium on Optics/Photonics in
Defence and Security, vol. 5612, pages 104–116, October 2004.
[58] J. Mira and J. Mayer. Image feature extraction for application of biometric
identification of iris - a morphological approach. In Proceedings of the 16th Brazilian
Symposium on Computer Graphics and Image Processing (SIBGRAPI 2003), pages 391–
398, Brazil, October 2003.
[59] J. Kim, S. Cho, and J. Choi. Iris recognition using wavelet features. Kluwer Academic
Publishers, Journal of VLSI Signal Processing, no. 38, pages 147– 256, November 2004.
[60] W. W. Boles and B. Boashash. A human identification technique using images of the
iris and wavelet transform. IEEE Transactions on Signal Processing, vol. 46, no. 4, pages
1185–1188, April 1998.
[61] D. Martin-Roche, C. Sanchez-Avila, and R.Sanchez-Reillo. Iris recognition for
biometric identification using dyadic wavelet transform zero-crossing. IEEE Aerospace and
Electronic Systems Magazine, Mag. 17, no. 10, pages 3–6, 2002.
[62] R. P. Wildes. Iris recognition: an emerging biometric technology. In Proceedings of the
IEEE, vol. 85, no.9, pages 1348–1363, U.S.A., September 1997.

Towards Multi-modal Sclera and Iris Biometric Recognition with Adaptive Liveness Detection
221 | P a g e
[63] J. Ali and A. Hassanien. An iris recognition system to enhance e-security environment
based on wavelet theory. AMO - Advanced Modeling and Optimization, vol. 5, no. 2, pages
93–104, 2003.
[64 S. Lim, K. Lee, O. Byeon, and T. Kim. Efficient iris recognition through the
improvement of feature vector and classifier. ETRI Journal,
vol. 23, no. 2, pages 61–70, June 2001.
[65] A. Muron, P. Kois, and J. Pospisil. Identification of persons by means of the Fourier
spectra of the optical transmission binary models of the human irises. Elsevier Science,
Optics Communications, no. 192, pages 161–167, June 2001.
[66] K. Nam, K. Yoon, J. Bark, and W. Yang. A feature extraction method for binary iris
code construction. In Proceedings of the 2nd International Conference on Information
Technology for Application, pages 284–288, China, January 2004.
[67] C. Tissue, L. Martin, L. Torres, and M. Robert. Person identification technique using
human iris recognition. In Proceedings of the 25th International Conference on Vision
Interface, pages 294–299, Calgary, July 2002.
[68] Y. Huang, S. Luo, and E. Chen. An efficient iris recognition system. In Proceedings of
the First International Conference on Machine Learning and Cybernetics, pages 450–454,
China, November 2002.
[69] Y. Zhu, T. Tan, and Y. Wang. Biometric personal identification based on iris patterns.
In Proceedings of the 13th International Conference on Pattern Recognition (ICPR00),
pages 2801–2804, Barcelona, September 2000.
[70] L. Ma, T. Tan, D. Zhang, and Y. Wang. Local intensity variation analysis for iris
recognition. Pattern Recognition, vol. 37, no. 6, pages 1287–1298, 2004.
[71] Y. Du, B. Bonney, R. Ives, D. Etter, and R. Schultz. Analysis of partial iris recognition
using a 1-d approach. In Proceedings of the IEEE International Conference on Acoustics,
Speech and Signal Processing (ICASSP’05), pages 961–964, U.S.A., March 2005.
[72] V. Dorairaj, N. Schmid, and G. Fahmy. Performance evaluation of non-ideal iris based
recognition system implementing global ICA encoding. In Proceedings of the IEEE
International Conference on Image Processing (ICIP 2005), pages 285–288, Italy,
September 2005.
[73] E. Sung, X. Chen, and J. Yang. Towards non-cooperative iris recognition systems. In
Proceedings of the Seventh International Conference on Control, Automation, Robotics and
Vision (ICARV’02), pages 990–995, Singapore, December 2002.

Towards Multi-modal Sclera and Iris Biometric Recognition with Adaptive Liveness Detection
222 | P a g e
[74] C. Fancourt, L. Bogoni, K. Hanna, Y. Guo, R. Wildes, N. Takahashi, and U. Jain. Iris
recognition at a distance. In Proceedings of the 2005 IAPR Conference on Audio and Video-
Based Biometric Person Authentication, pages 1–13, U.S.A., July 2005.
[75] Y. Du, B. Bonney, R. Ives, D. Etter, and R. Schultz. Analysis of partial iris recognition
using a 1-d approach. In Proceedings of the IEEE International Conference on Acoustics,
Speech and Signal Processing (ICASSP’05), pages 961–964, U.S.A., March 2005.
[76] D. Ort, H. David, "Development of the Eye". Retrieved 22 April 2015
[77] the University of Bath. University of Bath iris image database, 2004. http://www.
bath.ac.uk/elec-eng/pages/sipg/.
[78] Institute of Automation, Chinese Academy of Sciences. CASIA iris image database,
2004. http://www.sinobiometrics.com.
[79] National Institute of Standards and Technology. Iris challenge evaluation, 2006.
http://iris.nist.gov/ICE/.
[80] Multimedia University. MMU iris image database, 2004. http://pesona.mmu.
edu.my/centre.
[81] M. Dobes and L. Machala. UPOL iris image database, 2004. http://
phoenix.inf.upol.cz/iris/.
[82] A. Ross, S. Crihalmeanu, L. Hornak, and S. Schuckers. A centralized web-enabled
multimodal biometric database. In Proceedings of the 2004 Biometric Consortium
Conference (BCC), U.S.A, September 2004
[85] A. M. Joussen, Vascular plasticity - the role of the angiopoietins in modulating ocular
angiogenesis, Graefe’s Archive for Clinical and Experimental Ophthalmology, vol. 239, no
12, pp. 972 - 975, 2001.
[86] H. Kobayashi and S. Kohshima, Unique morphology of the human eye, Nature, vol.
387, no. 6635, pp. 767-768, 1997.
[87] D. Ort, H. David, "Development of the Eye". Retrieved 22 April 2015’
[88] T.W. Sadler, Langman's medical embryology (6th ed.). Williams and
Wilkins. ISBN 0683074938. (1990)
[89] A. M. V. Keller, "Embryonic Development of the Eye". Retrieved 22 April 2015.
[90] S. Fuhrmann, E. M. Levine, T. A. Reh, “Extraocular mesenchyme patterns the optic
vesicle during early eye development in the embryonic chick”. Development 127, 4599-
4609. 2000.
Towards Multi-modal Sclera and Iris Biometric Recognition with Adaptive Liveness Detection
223 | P a g e
[91] A. Eiraku, "Self-organizing optic-cup morphogenesis in three-dimensional cell
culture", Nature 472, 51–56 (07 April 2011)
[92] K. Trier, Advances in organ biology. The Sclera. The Biology of the Eye, vol. 10.
Elsevier Inc., pp. 353–373, 2006.
[93] J. J. Kanski, Clinical Ophthalmology: A Systematic Approach. Elsevier Science
Limited. 2003.
[94] G. Heath, The episclera, sclera and conjunctiva, Optometry today. Different. Diagnosis
Ocular Dis. 9 (2), 36–42, 2006.
[95] C.G. Owen, R.S.B. Newsom, A.R. Rudnicka, T.J. Ellis, and E.G. Woodward, Vascular
response of the bulbar conjunctiva to diabetes and elevated blood pressure. Ophthalmology
112 (10), 1801–1808. 2005.
[96] C.G. Owen, R.S.B. Newsom, A.R. Rudnicka, T.J. Ellis, and E.G. Woodward, Diabetes
and the tortuosity of vessels of the bulbar conjunctiva. Ophthalmology 115 (6), e27–e32,
2008
[97] A. Ross and A. K. Jain, Multimodal biometrics: an overview, Appeared in Proc. of 12th
European Signal Processing Conference (EUSIPCO), (Vienna, Austria), pp. 1221-1224,
September 2004.
[98] S, U. Uludag, A. Mink, M. Indovina, A. K. Jain, Large-scale evaluation of multimodal
biometric authentication using state-of-the-art systems, IEEE Transactions On Pattern
Analysis And Machine Intelligence, 450-455, 27( 3), MARCH 2005
[99] Md. El-Abed1, C. Charrier , C. Rosenberger, Quality assessment of image-based
biometric information, EURASIP Journal on Image and Video Processing (2015) 2015: 1-
15
[100] Ratha, N., Connell, J., Bolle, R., 2001. An analysis of minutiae matching strength.
Proc. AVBPA, International Conference on Audio- and Video-Based Biometric Person
Authentication III, 223-228.
[101] B. Toth, Biometric Liveness Detection, Information Security Bulletin, 10: 291-297,
2005.
[102] J. Galbally, J. Ortiz-Lopez, J. Fierrez, J. Ortega-Garcia, a. Iris liveness detection
based on quality related features, in Proc. Intl. Conf. on Biometrics, ICB, India, pp. 271-
276, 2012.

Towards Multi-modal Sclera and Iris Biometric Recognition with Adaptive Liveness Detection
224 | P a g e
[103] A. Rattani, B. Freni, G. L. Marcialis, F. Roli, Template update methods in adaptive
biometric systems: A critical review’. Proc. Third Int. Conf. Biometrics, Sardinia, Alghero:
847–856, 2009.
[104] N. Poh, A. Rattani and F. Roli, Critical Analysis of Adaptive Biometric Systems, IET
Biometrics, 1(4): 179 - 187, 2012.
[105] A. Rattani, G. L. Marcialis, E. Granger, F. Roli, A Dual-staged Classification-
Selection Approach for Automated Update of Biometric Templates, Intl Conf. on Pattern
Recognition (ICPR), Japan: 2972 - 2975, 2012.
[106]. A. Rattani, Adaptive biometric system based on template update procedures. PhD
thesis, University of Cagliari, Italy, 2010
[107]. A. Rattani, B. Freni, G. L. Marcialis, F. Roli: Template update methods in adaptive
biometric systems: A critical review. Proc. Third Int. Conf. Biometrics, Sardinia, Alghero,
2009, pp. 847–856
[108]. N. Poh, J. Kittler, S. Marcel, D. Matrouf, J. F. Bonastre.: Model and score adaptation
for biometric systems: coping with device interoperability and changing acquisition
conditions. Proc. Int. Conf.on Pattern Recognition, Istambul, Turkey, 1229–1232, 2010.
[109]. U. Uludag, A. Ross, A. Jain: Biometric template selection and update: A case study
in fingerprints, Pattern Recognition., 37, (7): 1533–1542, 2004.
[110]. X. Jiang, W. Ser: ‘Online fingerprint template improvement’, IEEE Trans. Pattern
Anal. Mach. Intell., 24, (8), .1121–1126, 2008.
[111]. C. Ryu, K. Hakil, A. K. Jain: ‘Template adaptation based fingerprint verification’.
Proc. 18th Int. Conf. on Pattern Recognition, HongKong, 582–585, 2006.
[112]. X. Liu, T. Chen, S. M. Thornton: Eigenspace updating for nonstationary process and
its application to face recognition’, PatternRecognit., 36, (9), 1945–1959, 2003.
[113] F, Roli, L. Didaci, G. L. Marcialis: Template co-update in multimodal biometric
systems. Proc. IEEE/IAPR Int. Conf. on Biometrics, Seoul, Korea, 1194–1202, 2007.
[114] F. Roli, G. L. Marcialis: Semi-supervised PCA-based face recognition using self-
training. Proc. Joint IAPR Int. Workshop on S+SSPR06, HongKong, China, 560–568, 2006.
[115] A. Rattani, G. L. Marcialis, F. Roli: Biometric template update using the graph min-
cut: a case study in face verification. Proc. Sixth IEEEBiometric Symp., Tampa, USA, 23–
28, 2008.

Towards Multi-modal Sclera and Iris Biometric Recognition with Adaptive Liveness Detection
225 | P a g e
[116] M. Une, Y. Tamura, Liveness detection techniques. IPSJ Magazine, 47(6), 605–608.
2006.
[117] E. Lee, K. Park, J. Kim, Fake iris detection by using purkinje image, in Advances in
Biometrics, ser. Lecture Notes in Computer Science. Springer Berlin / Heidelberg, vol.
3832, pp. 397–403. 2005.
[118] J. Fierrez, J. Ortega-Garcia, T. Toledano, J. Gonzalez-Rodriguez, Biosec baseline
corpus: A multimodal biometric database, Pattern Recognition,40(4), 1389–1392. 2007.
[119] A., C., S. Schuckers, K. Bowyer, D Yambay, Liveness Detection - Iris Competition
2013, 2013, http://people.clarkson.edu/projects/biosal/iris/. 2013,
[120] J. Doyle, and K. W. Bowyer, Notre Dame image dataset for contact lens detection in
iris recognition, 2004.
[121] A. Czajka, Database of Iris Printouts and its Application: Development of Liveness
Detection Method for Iris Recognition, Methods and Models in Automation and Robotics
(MMAR), pp. 28-33, 2013.
[122] A. F. Sequeira, J. Murari, J.S. Cardoso. Iris liveness detection methods in mobile
applications, International Conference on Computer Vision Theory and Applications
(VISAPP), 2014.
[123] F. Alonso-Fernandez, J. Fierrez, J. Ortega-Garcia, J. G. Rodriguez, H. Fronthaler, K.
Kollreider, J. Bigun. A comparative study of fingerprint image quality estimation methods.
IEEE Trans. on Information Forensics and Security, 2(4):734–743, 2008.
[124] K. Kollreider, H. Fronthaler, M. Faraj. J. Bigun, Real-time face detection and motion
analysis with application in liveness assessment. IEEE Trans. on Information Forensics and
Security, 2(3-2):548-558, 2007,
[125] M. Kanematsu, H. Takano, K. Nakamura, Highly reliable liveness detection method
for iris recognition, in SICE, Annual Conference. IEEE, pp. 361–364. 2007.
[126] A. Abhyankar, S. Schuckers, Iris quality assessment and biorthogonal wavelet-based
encoding for recognition, Pattern Recognition, 42(9), 1878 – 1894, 2009.,
[127] X. He, S. An, P. Shi, Statistical texture analysis-based approach for fake iris detection
using support vector machines, in Advances in Biometrics. Springer, pp. 540–546. 2007.
[128] L. Ma, T. Tan, Y. Wang, D. Zhang, Personal identification based on iris texture
analysis, IEEE Transactions on Pattern Analysis and Machine Intelligence, 25(12), 1519–
1533. 2003.

Towards Multi-modal Sclera and Iris Biometric Recognition with Adaptive Liveness Detection
226 | P a g e
[129] A.F. Sequeira, J. Murari, J.S. Cardoso, Iris liveness detection methods in the mobile
biometrics scenario, International Joint Conference on Neural Networks, pp. 3002-300,
2004.
[130] A K Jain, A Ross, S Prabhakar, An introduction to biometric recognition IEEE
Transactions on circuits and systems for video technology 14 (1), 4-20
[131] J. Wright, A.Y. Yang, A. Ganesh, S. S. Sastry, Y. Ma, Robust face recognition via
sparse representation, IEEE Trans. PAMI, 31(2), 210–227, 2009.
[132] J. Mairal, F. Bach, J. Ponce, Task-driven dictionary learning, IEEE Trans PAMI,
34(4), 791–804, 2012
[133] Z. Jiang, Z. Lin, L. Davis, Label consistent k-svd: learning a discriminative dictionary
for recognition, IEEE Trans. PAMI 35(11), 2651–2664, 2013
[134] M. Aharon, M. Elad, A. Bruckstein, K-svd: An algorithm for designing overcomplete
dictionaries for sparse representation, IEEE Trans. on Signal Processing, 54(11), 4311–
4322, 2006
[135] J. Mairal, F. Bach, J. Ponce, G. Sapiro, A. Zisserman, “Supervised dictionary learning,”
In NIPS., 1033-1040, 2008
[136] I. Ramirez, P. Sprechmann, G. Sapiro, Classification and clustering via dictionary
learning with structured incoherence and shared features, In CVPR, 3501-3508, 2010
[137] M. Yang, L. Zhang, X. Feng, D. Zhang, Fisher discrimination dictionary learning for
sparse representation, In ICCV, 543-550, 2011
[138] Z. Wang, J. Yang, N. Nasrabadi, T. Huang, A max-margin perspective on sparse
representation-based classification, In ICCV., 1217-1224, 2013
[139] M. Soltanolkotabi, E. Elhamifar, E. Candes, Robust subspace clustering, The Annals
of Statistics, 42(2), 669-699, 2014.
[140] A. Coates, A.Y. Ng, The importance of encoding versus training with sparse coding
and vector quantization, In ICML. 921-928, 2011
[141] L. Zhang, M. Yang, X. Feng, Sparse representation or collaborative representation:
Which helps face recognition?, In ICCV., 471-478, 2011
[142] S.Gu, L. Zhang, W. Zuo, X. Feng., Projective dictionary pair learning for pattern
classification., In NIPS 2014, 1-9, 2014.

Towards Multi-modal Sclera and Iris Biometric Recognition with Adaptive Liveness Detection
227 | P a g e
[143] M. Scholz, R Klinkenberg, Boosting classifiers for drifting concepts, IDA – Special
Issue on Knowledge Discovery from Data Streams 11 (1): 3–28, 2007.
[144] G. Widmer, M. Kubat, Learning in the Presence of Concept Drift and Hidden
Contexts, Machine Learning, 23, 69–101, 1996.
[145] P. P. Rodrigues, J. A. Gama, J. A. Araújo, L. Lopes, L2GClust: local-to-global
clustering of stream sources, in Proceedings of the 2011 ACM Symposium on Applied
Computing, 1006–1011, ACM, 2011.
[146] J. Z. Kolter, M. A. Maloof, Dynamic Weighted Majority: An Ensemble Method for
Drifting Concepts, J. Mach. Learn. Res., 8, 2755–2790, December 2007.
[147] N. W. Street, Y. Kim, A streaming ensemble algorithm (SEA) for large-scale
classification, in KDD ’01: Proceedings of the seventh ACM SIGKDD international
conference on Knowledge discovery and data mining, 377–382, ACM, 2001.
[148] R. Klinkenberg, Learning drifting concepts: Example selection vs. example weighting,
Intelligent Data Analysis, 8, 281–300, 2004.
[149] A. Fern, R Givan, Online ensemble learning: An empirical study, Machine Learning
53: 71–109, 2003.
[150] R. Polikar, Bootstrap inspired techniques in computational intelligence, IEEE Signal
Processing Magazine, 24, 57–72, 2007.
[151] L. I. Kuncheva, Combining Pattern Classifiers: Methods and Algorithms. John Wiley
& Sons, Inc., 2004.
[152] G. Brown, Ensemble learning, Encyclopedia of Machine Learning, 1-9, 2010.
[153] D. H. Wolpert, W. G. Macready, No free lunch theorems for optimization, IEEE
Transactions on Evolutionary Computation, 1(1), 67–82, 1997.
[154] T. G. Dietterich, Machine learning research: Four current directions, Artificial
Intelligence 18(4): 97–136, 1997.
[155] T. G. Dietterich, An experimental comparison of three methods for constructing
ensembles of decision trees: Bagging, boosting, and randomization, Machine Learning
40(2): 139–157, 2000.
[156] L. I. Kuncheva, C. J. Whitaker, Measures of diversity in classifier ensembles and their
relationship with the ensemble accuracy, Machine Learning 51: 181–207, 2003.
[157] L. Breiman, Random Forests, Machine Learning 45: 5–32, 2001.

Towards Multi-modal Sclera and Iris Biometric Recognition with Adaptive Liveness Detection
228 | P a g e
[158] L. L.Minku, A. White, X. Yao, The impact of diversity on on-line ensemble learning
in the presence of concept drift, IEEE Transactions on Knowledge and Data Engineering
(TKDE) 22: 730–742, 2010.
[159] T.M. Martinetz, S.G. Berkovich, K. J. Schulten, Neural-Gas Network for Vector
Quantization and its Application to Time-Series Rrediction, IEEE Trans. Neural Networks,
4(4), 558-569, 1993.
[160] Y. Freund, R. E. Schapire, Experiments with a new boosting algorithm, Proceedings
of the Thirteenth International Conference on Machine Learning (ICML’96), Morgan
Kaufmann, Bari, Italy, 148–156, 1996.
[161] R. Kunwar, U. Pal and M. Blumenstein. Semi-Supervised Online Learning of
Handwritten Characters Using a Bayesian Classifier. Second IAPR Asian Conference on
Pattern Recognition, Okinawa, Japan, 2013.
[162] V. Vladimir, V.Vapnik. Statistical Learning Theory. Springer-Verlag New York,
1998
[163] N. A. Syed, H. Liu, and K. K. Sung. Incremental learning with support vector
machines. In SVM workshop, IJCAI, 1999.
[164] S. Ruping. Incremental learning with support vector machines. Technical Re ¨ port
TR-18, Universitat Dortmund, SFB475, 2002.
[165] L. Ralaivola, F. d’Alche Buc. Incremental support vector machine learning: A local
approach. Lecture Notes in Computer Science, 2130:322–329, 2001.
[166] J. Kivinen, A. J. Smola, R. C. Williamson. Online learning with kernels., Advances
in Neural Inf. Proc. Systems (NIPS 01), 785–792, 2001.
[167] G. Cauwenberghs and T. Poggio. Incremental and decremental support vector
machine learning. Advances in Neural Information Processing Systems,13, 409–415. MIT
Press, 2001.
[168] P. Laskov, C. Gehl, S. Kruger, K.R. Muller. Incremental Support Vector Learning:
Analysis, Implementation and Applications. Journal of Machine Learning Research, 1909–
1936, 2006.
[169] A. Shilton, M. Palaniswami, D. Ralph, A. C. Tsol, Incremental Training of Support
Vector Machines, IEEE Transactions on Neural Networks, 16(1), 114-131, 2005.
[170] M. Muhlbaier, A. Topalis, R. Polikar, Learn++.NC: Combining Ensemble of
Classifiers Combined with Dynamically Weighted Consult-and-Vote for Efficient
Incremental Learning of New Classes,” IEEE Transactions on Neural Networks, 20(1), 152–
168, 2009.

Towards Multi-modal Sclera and Iris Biometric Recognition with Adaptive Liveness Detection
229 | P a g e
[171] T.M. Martinetz, S.G. Berkovich, K. J. Schulten, Neural-Gas Network for Vector
Quantization and its Application to Time-Series Rrediction, IEEE Trans. Neural Networks,
4(4), 558-569, 1993.
[178] Y. Freund, R. E. Schapire, Experiments with a new boosting algorithm, Proceedings
of the Thirteenth International Conference on Machine Learning (ICML’96), Morgan
Kaufmann, Bari, Italy, 148–156, 1996.
[179 ] A. Shilton, M. Palaniswami, D. Ralph, A. C. Tsol, Incremental Training of Support
Vector Machines, IEEE Transactions on Neural Networks, 16(1), 114-131, 2005.
[180] F. Shen and O. Hasegawa, An Incremental Network for Online Unsupervised
Classification and Topology Learning, Neural Networks, 19(1), 90-106, 2006.
[181]F. Shen, K. Sakurai, Y. Kamiya, O. Hasegawa: An Online Semi-supervised Active
Learning Algorithm with Self-organizing Incremental Neural Network, International Joint
Conference on Neural Network (IJCNN), 2007.
[182] T. Kohonen, Self-organized Formation of Topologically Correct Feature Maps, Biol.
Cybern, 43(1), 59-69, 1982.
[183] S. Pal, M. Blumenstein, U. Pal: ‘Non- English and Non-Latin Signature Verification
Systems: A Survey’, Proceedings of the 1st International Workshop on Automated Forensic
Handwriting Analysis, pp. 1-5, Beijing, China, September 2011.
[184] S. Pal, U. Pal, M. Blumenstein: ‘Multi-script Off-line Signature Verification: A Two-
Stage Approach’, Proceedings of the 2nd International Workshop on Automated Forensic
Handwriting Analysis, pp. 31-35, Washington D.C., USA, September 201
[185] R. Plamondon, G. Lorette: Automatic signature verification and writer
identification—the state of the art, Pattern Recognition. No. 22 pp 107–131, 1989.
[186] F. Leclerc, R. Plamondon, Automatic signature verification: the state of the art, 1989–
1993, Int. J. Pattern Recognit. Artif. Intell. Vol. 8, pp. 643–660, 1993.
[187] M. Fairhurst, Signature verification revisited: promoting the practical exploitation of
biometric technology, Electronics. Communication. Eng. J. vol. 9, 273–280, 1997.
[188] R. Plamondon, S.N.,Srihari: On-line and off-line handwriting recognition: a
comprehensive survey, IEEE. Trans. Pattern Anal. Mach. Intell. Vol 22, pp. 63–84, 2000.
[189] D. Impedovo, G. Pirlo, Automatic signature verification: the state of the art, IEEE
Trans. Syst. Man Cybern. Part C: Appl. Rev. vol. 38 no. 5, pp. 609–635, 2008.

Towards Multi-modal Sclera and Iris Biometric Recognition with Adaptive Liveness Detection
230 | P a g e
[190] M. Diaz-Cabrera, A. Morales, M. A., Ferrer: Emerging Issues for Static Handwritten
Signature Biometric, (Eds.), Advances in Digital Handwritten Signature Processing. A
Human Artefact for e-Society, World Scientific, pp. 111-122, 2014.
[191] M. Diaz-Cabrera, M. A. Ferrer, A. Morales, "Modeling the Lexical Morphology of
Western Handwritten Signatures", PLoS ONE 10(4): e0123254, April 2015.
[192] S. Pal, A. Alireza, U. Pal, M. Blumenstein, Multi-script off-line signature
identification”, 12th Int. Conf. on Hybrid Intelligent Systems, Pune, India, pp. 236–240
2012.
[193] S. Pal, U. Pal, M. Blumenstein, ’ Hindi and English Off-line Signature Identification
and Verification”, Proceedings of International Conference on Advances in Computing.
Advances in Intelligent Systems and Computing Ed, vol 174, pp 905-910. 2012.
[194] S. Pal, U. Pal, M. Blumenstein, ’A Two-Stage Approach for English and Hindi Off-
line Signature Verification’, International Workshop on Emerging Aspects in Handwritten
Signature Processing, Naples, Italy, September 9-10, 2013.
[195] S. Pal, A. Alireza, U. Pal, M. Blumenstein, "Off-line Signature Identification Using
Background and Foreground Information," in Digital Image Computing Techniques and
Applications (DICTA), 2011 International Conference on, pp.672-677, 6-8 Dec. 2011.
[196] S. Pal, U. Pal, M. Blumenstein,., ‘Off-line English and Chinese signature
identification using foreground and background features, Proceedings of the 2012
International Joint Conference on Neural Networks, pp.1,7, Brisbane, Australia, June 2012.
[197] M. Ferrer, F. Vargas, A. Morales, A. Ordoñez: ‘Robustness of Off-line Signature
Verification Based on Grey Level Features’, in IEEE Transactions on Information Forensics
and Security, vol. 7, no. 3, pp. 966-977, June 2012.
[198] J. Ortega-Garcia, J. Fierrez-Aguilar, D. Simon, J. Gonzalez, M. Faundez, V. Espinosa,
A. Satue, I. Hernaez, J. Igarza, C. Vivaracho, D. Escudero, Q. Moro: ‘MCYT baseline
corpus: A bimodal biometric database’, in IEE Proceedings Vision, Image and Signal
Processing, Special Issue on Biometrics on the Internet, vol. 150, no. 6, pp. 395-401,
December 2003.
[199] A. Kholmatov, B. Yanikoglu, “SUSIG: an online signature database, associated
protocols and benchmark results”, in Pattern Analysis and Applications, vol. 12, pp. 227-
236, 2009.

Towards Multi-modal Sclera and Iris Biometric Recognition with Adaptive Liveness Detection
231 | P a g e
[200] V. Blankers, C. Heuvel, K. Franke, L. Vuurpijl: ‘Signature verification competition’,
in 10th International Conference on Document Analysis and Recognition, pp. 1403-1407,
Barcelona, Spain, 2009.
[201] D. Yeung, H. Chang, Y. Xiong, S. George, R. Kashi: ‘SVC2004: First international
signature verification competition’, in Lecture Notes in Computer Science: Biometric
Authentication, Ed. by D. Zhang and A. Jain, vol. 3072, pp. 16-22, Springer, Berlin
Heidelberg, 2004.
[202] S. Pal: “Multi-Script Off-line Signature verification”, PhD. Dissertation, Griffith
University, October 2014.
[203] M. Ismail, S. Gad : ‘Off-line Arabic signature recognition and verification’, in Pattern
Recognition, vol. 33, pp. 1727-1740, 2000.
[204] M. Ferrer, M. Diaz, A. Morales, "Static Signature Synthesis: A Neuromotor Inspired
Approach for Biometrics," in Proceedings of IEEE Transactions on Pattern Analysis and
Machine Intelligence, vol. 37, no.3, pp.667-680, March 2015.
[205] M., Ferrer, J. Alonso, C Travieso: ‘Offline geometric parameters for automatic
signature verification using fixed-point arithmetic’, in IEEE Transactions on pattern
analysis and machine intelligence, vol. 27, no. 6, pp 993-997, June 2005.
[206] M. A. Ferrer, M. Diaz-Cabrera, A. Morales, J. Galbally, M. Gomez-Barrero,
"Realistic Synthetic Off-Line Signature Generation Based on Synthetic On-Line Data", 47th
IEEE International Carnahan Conference on Security Technology, Medellin, pp. 116-121,
8-11 October 2013.
[207] M. A. Ferrer, M. Diaz-Cabrera, A. Morales, A., "Synthetic Off-Line Signature Image
Generation", 6th IAPR International Conference on Biometrics, Madrid, pp. 1 – 7, 4-7 June
2013.
[208] R. Kabaciński and M. Kowalski. Human vein pattern segmentation from low-quality
images a comparison of methods. Image Processing and Communications Challenges 2, 84
of Advances in Intelligent and Soft Computing, 105-112, 2010.
[209] R. Kabaciński and M. Kowalski.Human vein pattern correlation - a comparison of
segmentation methods.Computer Recognition Systems 4, 95 of Advances in Intelligent and
[210] R. Kabaciński and M. Kowalski.Vein pattern database and benchmark results.
Electronics Letters, 47(20), 1127-1128, 2011.

Towards Multi-modal Sclera and Iris Biometric Recognition with Adaptive Liveness Detection
232 | P a g e
[211]] D. Hartung, M. A. Olsen, H. Xu, and C. Busch, Spectral minutiae for vein pattern
recognition. In Biometrics (IJCB), 2011 International Joint Conference on, 1 –7, 2011.
[212] D. Hartung, A. Pflug, and C. Busch, Vein pattern recognition using chain codes spatial
information and skeleton fusing.In Sicherheit , 245–256, 2012.
[213] D. Hartung, M. A. Olsen, H. Xu, H. T. Nguyen and C. Busch, Comprehensive analysis
of spectral minutiae for vein pattern recognition. In IET Biometrics
(1), 25–36, 2012.
[214] J. Uriarte-Antonio, D. Hartung, J. Pascual and R. Sanchez-Reillo, Vascular biometrics
based on a minutiae extraction approach. In Security Technology
(ICCST), IEEE International Carnahan Conference on , 1 –7, 2011.
[215] M. Akhloufi . and A. Bendada, Capturing Hand or Wrist Vein Images for Biometric
Authentication Using Low-Cost Devices, Sixth International Conference on Intelligent
Information Hiding and Multimedia Signal Processing (IIH-MSP), 318 – 322, 2010
[216] J.E. Suarez Pascual, J. Uriarte-Antonio, R. Sanchez-Reillo, M.G. Lorenz, Hand and
Wrist Physiological Features Extraction for near Infrared Biometrics, Canadian Conference
on Computer and Robot Vision, CRV '08. 341 – 344, 2008.
[217] PUT vein dataset available at http://biometrics.put.poznan.pl/home/new-news-page/
[218] D. Ghosh, T. Dube, A. P. Shivaprasad, Script Recognition—A Review, IEEE
Transactions on Pattern Analysis And Machine Intelligence, vol. 32, no. 12, December
2010.
[219] U. Pal, B.B. Chaudhuri, Indian script character recognition: a survey, Pattern
Recognition, vol 37, no. 9, Pages 1887-1899. September 2004,
[220] M. A. Ferrer, A. Morales, U. Pal, LBP Based Line-wise Script Identification,
Proceedings of the twelfth IAPR International Conference on Document Analysis and
Recognition, Washington DC, USA, August 23-29th, 2013.
[221] M. A. Ferrer, A. Morales, N. Rodríguz, U. Pal, Multiple Training – One Test
methodology for Handwritten Word Script Identification, 14th International Conference on
Frontiers in Handwriting Recognition, pp. 750-759, Crete, Greece, 1-4 September, 2014.
[222] N. Sharma, U. Pal, M. Blumenstein, A study on word-level multi-script identification
from video frames, 2014 International Joint Conference on Neural Networks, pages 1827-
1833, 6-11 July 2014.

Towards Multi-modal Sclera and Iris Biometric Recognition with Adaptive Liveness Detection
233 | P a g e
[223] S. Alkassar, W. L. Woo, S. S. Daly, J. A. Chambers, Robust Sclera Recognition
System With Novel Sclera Segmentation and Validation Techniques, IEEE Transaction
SMC 1, 47 (3), 474 – 486, 2015
[224] V. Gottemukkula, S. Saripalle, S. P. Tankasala, R. Derakhshani, Method for using
visible ocular vasculature for mobile biometrics, IET Biometrics, Volume: 5, Issue: 1, pp.
3-12, 2016.
[225] S.P.Tankasala, P.Doynov, R. Derakhshani: Visible spectrum, bi-modal ocular
biometrics. Proc. of ICCCS, pp. 564–573, 2012.
[226] K.Oh, B. Oh, K.Toh, W.Yau, H. Eng, Combining sclera and periocular features for
multi-modal identity verification, Neurocomputing, Volume 128, pp 185-198, March 2014
[227] H. Proenc¸ Towards Non-Cooperative Biometric Iris Recognition, Thesis submitted
to University of Beira Interior, October 2006.
[228] T. Tan, Z. He, Z. Sun, Efficient and robust segmentation of noisy iris images for non-
cooperative iris recognition, Image Vis. Comput. 28 (2), 223–230, 2010.
[229] X. Zhang, Z. Sun, T. Tan, Texture removal for adaptive level set based iris
segmentation, in 17th IEEE International Conference on Image Processing, pp. 1729–1732,
2010.
[230] K. Roy, C. Suen, P. Bhattacharya, Segmentation of Unideal Iris Images Using Game
Theory, in 20th International Conference on Pattern Recognition, 2010, pp. 2844–2847.
2010,
[231] S. Pundlik, D. Woodard, S. Birchfield, Iris segmentation in non-ideal images using
graph cuts, Image Vis. Comput. 28 (12) (2010) 1671–1681. 2010,
[232] J. Zuo, N. Schmid, On a methodology for robust segmentation of nonideal iris images,
IEEE Trans. Syst. Man Cybern. Part B: Cybern. 40 (3) (2010) 703–718. 2010,
[233] M. De Marsico, M. Nappi, R. Daniel, ISIS: Iris Segmentation for Identification
Systems, in 20th International Conference on Pattern Recognition, 2010, pp. 2857–2860.
2010,
[234] H. Proença, Iris recognition: on the segmentation of degraded images acquired in the
visible wavelength, IEEE Trans. Pattern Anal. Mach. Intell.32 (8) (2010) 1502–1516. 2010,
[235] J. Koh, V. Govindaraju, V. Chaudhary, A robust iris localization method using an
active contour model and Hough transform, in 20th International Conference on Pattern
Recognition, 2010, pp. 2852–2856. 2010,

Towards Multi-modal Sclera and Iris Biometric Recognition with Adaptive Liveness Detection
234 | P a g e
[236] C.-W. Tan, A. Kumar, Automated segmentation of iris images using visible
wavelength face images, in IEEE Computer Society Conference on Computer Vision and
Pattern Recognition Workshops, 2011, pp. 9–14. 2011.
[237] C.-W. Tan, A. Kumar, a Unified framework for automated iris segmentation using
distantly acquired face images, IEEE Trans. Image Process. 21 (9) (2012) 4068–4079. 2012.
[238] G. Sutra, S. Garcia-Salicetti, B. Dorizzi, The Viterbi algorithm at different resolutions
for enhanced iris segmentation, in 5th IAPR International Conference on Biometrics, 2012,
pp. 310–316. 2012.
[239] H. Li, Z. Sun, T. Tan, Robust iris segmentation based on learned boundary detectors,
in 5th IAPR International Conference on Biometrics, 2012, pp. 317–322. 2012
[240] C.-W. Tan, A. Kumar, Efficient iris segmentation using Grow-Cut algorithm for
remotely acquired iris images, in Fifth IEEE International Conference on Biometrics:
Theory, Applications and Systems, 2012, pp. 99–104. 2012.
[241] A. Uhl, P. Wild, Weighted adaptive Hough and ellipsopolar transforms for real-time
iris segmentation, in 5th IAPR International Conference on Biometrics, 2012, pp. 283–290.
2012.
[242] H. Li, Z. Sun, T. Tan, Accurate iris localization using contour segments, in 21st
International Conference on Pattern Recognition, 2012, pp. 3398–3401. 2012
[243] F. Alonso-Fernandez, J. Bigun, Iris boundaries segmentation using the generalized
structure tensor. A study on the effects of image degradation, in Fifth International
Conference on Biometrics: Theory, Applications and Systems, 2012, pp. 426–431. 2012
[244] C.-W. Tan, A. Kumar, Towards online iris and periocular recognition under relaxed
imaging constraints, IEEE Trans. Image Process. 22 (10) (2013) 3751–3765.2013.
[245] Y. Hu, K. Sirlantzis, G. Howells, A robust algorithm for colour iris segmentation
based on l1-norm regression, in: IEEE International Joint Conference on Biometrics, 2014,
pp. 1–8. 2014
[246] Y. Zhou, A. Kumar, Personal identification from iris images using localized radon
transform, in: 20th International Conference on Pattern Recognition, 2010, pp. 2840–2843.
2010,
[247] K. Roy, P. Bhattacharya, C. Suen, J. You, Recognition of unideal iris images using
region-based active contour model and game theory, in: 17th IEEE International Conference
on Image Processing, 2010, pp. 1705–1708. 2010,

Towards Multi-modal Sclera and Iris Biometric Recognition with Adaptive Liveness Detection
235 | P a g e
[248] M. Zhang, Z. Sun, T. Tan, Deformable DAISY Matcher for robust iris recognition,
in: 18th IEEE International Conference on Image Processing, 2011, pp. 3189–3192.2011.
[249] A. Bastys, J. Kranauskas, V. Krger, Iris recognition by fusing different representations
of multi-scale Taylor expansion, Comput. Vis. Image Underst. 115 (6) (2011) 804–816.
2011.
[250] H. Proença, G. Santos, Fusing color and shape descriptors in the recognition of
degraded iris images acquired at visible wavelengths, Comput. Vis. Image Underst. 116 (2)
(2012) 167–178. 2012.
[251] A. Kumar, T.-S. Chan, C.-W. Tan, Human identification from at-a-distance face
images using sparse representation of local iris features, in: 5th IAPR International
Conference on Biometrics, 2012, pp. 303–309. 2012,
[252] P. Li, G. Wu, Iris recognition using ordinal encoding of log-euclidean covariance
matrices, in: 21st International Conference on Pattern Recognition, 2012, pp. 2420–2423.
2012,
[253] A. Rahulkar, R. Holambe, Half-iris feature extraction and recognition using a new
class of biorthogonal triplet half-band filter bank and flexible k-out-of-n: a post-classifier,
IEEE Trans. Inf. Forensics Secur. 7 (1) (2012) 230–240. 2012,
[254] M. Zhang, Z. Sun, T. Tan, Perturbation-enhanced feature correlation filter for robust
iris recognition, IET Biometrics 1 (1) (2012) 37–45. 2012,
[255] X. Liu, P. Li, Tensor decomposition of SIFT descriptors for person identification, in:
5th IAPR International Conference on Biometrics, 2012,pp. 265–270. 2012,
[256] A. Kumar, T.-S. Chan, Iris recognition using quaternionic sparse orientation code
(QSOC), in: IEEE Computer Society Conference on Computer Vision and Pattern
Recognition Workshops, 2012, pp. 59–64. 2012,
[257] H. Zhang, Z. Sun, T. Tan, J. Wang, Iris image classification based on colour
information, in 21st International Conference on Pattern Recognition, 2012, pp. 3427–3430.
[258] L. Wang, Z. Sun, T. Tan, Robust regularized feature selection for iris recognition via
linear programming, in 21st International Conference on Pattern Recognition, 2012, pp.
3358–3361. 2012,
[259] Z. Sun, H. Zhang, T. Tan, J. Wang, Iris image classification based on a hierarchical
visual codebook, IEEE Trans. Pattern Anal. Mach. Intell. 36 (6)(2014) 1120–1133. 2014
[260] Z. Sun, L. Wang, T. Tan, Ordinal feature selection for iris and palmprint recognition,
IEEE Trans. Image Process. 23 (9) (2014) 3922–3934. 2014

Towards Multi-modal Sclera and Iris Biometric Recognition with Adaptive Liveness Detection
236 | P a g e
[261] C.W. Tan, A. Kumar, Accurate Iris Recognition at a Distance Using Stabilized Iris
Encoding and Zernike Moments Phase Features, IEEE Transactions on Image Processing
23 (9) (2014) 3962–3974. 2014
[262] C.-W. Tan, A. Kumar, Efficient and Accurate At-a-Distance Iris Recognition Using
Geometric Key-Based Iris Encoding, IEEE Transactions on Information Forensics and
Security 9 (9) (2014) 1518–1526, 2014.
[263] A. Das, U. Pal, M. A. Ferrer, M. Blumenstein, A New Method for Sclera Vessel
Recognition using OLBP, appeared in International Conference Chinese Conference on
Biometric Recognition , LNCS 8232, pp. 370–377,2013.
[264] A. Das, U. Pal, M. A. Ferrer, M. Blumenstein, Sclera Recognition Using D-SIFT,
Appeared In 13th International Conference on Intelligent Systems Design and Applications
pp.74-79, 2013.
[265] A. Das, U. Pal, M. A. Ferrer, M. Blumenstein, Fuzey Logic based Sclera Recognition,
pp. 561-568, In IEEE World Congress on Computational Intelligence - IEEE International
Conference on Fuzzy Systems 2014.
[266] A. Das, U. Pal, M. A. Ferrer, M. Blumenstein, Multi-angle Based Lively Sclera
Biometrics at a Distance’. pp. 22-29, IEEE Symposium Series on Computational
Intelligence, December 9-12, 2014, Orlando, USA.
[267] A. Das, U. Pal, M. A. Ferrer, M. Blumenstein, A New Efficient and Adaptive Sclera
Recognition System", pp.1-6, IEEE Symposium Series on Computational Intelligence,
December 9-12, 2014, Orlando, USA.
[268] A. Das, U. Pal, M. A. Ferrer, M. Blumenstein, A New Wrist Vein Biometric System,
pp. 68-75, IEEE Symposium Series on Computational Intelligence, December 9-12, 2014,
Orlando, USA.
[269] A. Das, U. Pal, M. A. Ferrer, M. Blumenstein, Sclera Recognition - A Survey. in
Recent Advancement in Computer Vision and Pattern Recognition, pp. 917 -921, 2013.
[270] A. Das, U. Pal, M. A. Ferrer, M. Blumenstein, SSBC 2015: Sclera Segmentation
Benchmarking Competition, pp. 1-6, at International Conference Biometrics Theory,
Applications and Systems (BTAS), 2015.
[271] A. Das, P. Mondol, U. Pal, M. Blumenstein, M. A. Ferrer, Sclera Pattern Synthesis
Based on Non-parametric Texture Synthesis Technique, at Computer Vision and Image
Processing (CVIP-2016).

Towards Multi-modal Sclera and Iris Biometric Recognition with Adaptive Liveness Detection
237 | P a g e
[272] A. Das, U. Pal, M. A. Ferrer, M. Blumenstein, SSRBC 2015: Sclera Segmentation
and Recognition Benchmarking Competition. at International Conference on Biometrics,
2016.
[273] A. Das, P. Mondol, U. Pal, M. Blumenstein, M. A. Ferrer, Fast and Efficient
Multimodal Eye Biometrics using Projective Dictionary Pair Learning, IEEE World
Congress on Computational Intelligence- IEEE CEC 2016.
[274] A. Das, R. Kunwar, U. Pal, M. A. Ferrer, M. Blumenstein, Book chapter entitled, An
online learning technique for the adaptive biometric system, pp. 73-96, in the book of
Adaptive Biometric Systems to be published by Springer.
[275] A. Das, U. Pal, M. A. Ferrer, M. Blumenstein, A Framework for Liveness Detection
for Direct Attack in Visible Spectrum for Multimodal Ocular Biometrics. Pattern
Recognition Letter, ISSN: 0167-8655, 2015.
[276] A. Das, M. A. Ferrer, U. Pal, S. Pal, M. Diaz and M. Blumenstein, Multi-script vs
single-script scenarios in automatic off-line signature verification. IET biometrics.
[277] H. Proenca and L. A. Alexandre, “Toward noncooperative iris recognition: A
classification approach using multiple signatures,” IEEE Trans. Pattern Anal. Mach. Intell.,
vol. 29, no. 4, pp. 607–612, Apr. 2007.
[288] Z. Zhao and A. Kumar An Accurate Iris Segmentation Framework Under Relaxed
Imaging Constraints Using Total Variation Model, ICCV 2015.
[289] A. Kumar and A. Passi, Comparison and the combination of iris matchers for reliable
personal authentication,’ Pattern Recognition, vol. 43, pp. 1016-1026, 2010.

Towards Multi-modal Sclera and Iris Biometric Recognition with Adaptive Liveness Detection
238 | P a g e

Towards Multi-modal Sclera and Iris Biometric Recognition with Adaptive Liveness Detection
239 | P a g e