towards identifying dyslexia in standard indonesian: … · towards identifying dyslexia in...
TRANSCRIPT
Towards identifying dyslexia in Standard Indonesian:the development of a reading assessment battery
Bernard A. J. Jap1,2,3,4,5,6,7 · Elisabeth Borleffs7 ·Ben A. M. Maassen7
Published online: 11 July 2017
© The Author(s) 2017. This article is an open access publication
Abstract With its transparent orthography, Standard Indonesian is spoken by over
160million inhabitants and is the primary language of instruction in education and the
government in Indonesia. An assessment battery of reading and reading-related skills
was developed as a starting point for the diagnosis of dyslexia in beginner learners.
Founded on the International Dyslexia Association’s definition of dyslexia, the test
battery comprises nine empirically motivated reading and reading-related tasks
assessing word reading, pseudoword reading, arithmetic, rapid automatized naming,
phoneme deletion, forward and backward digit span, verbal fluency, orthographic
choice (spelling), and writing. The test was validated by computing the relationships
Bernard A. J. Jap and Elisabeth Borleffs have contributed equally as first authors to this manuscript.
& Bernard A. J. Jap
Elisabeth Borleffs
Ben A. M. Maassen
1 International Doctorate for Experimental Approaches to Language and Brain (IDEALAB),
University of Groningen, Groningen, The Netherlands
2 University of Potsdam, Potsdam, Germany
3 University of Newcastle, Newcastle upon Tyne, UK
4 University of Trento, Trento, Italy
5 Macquarie University, Sydney, Australia
6 Science, Technology, and Society (STS) Research Group, Tarumanagara University, Jakarta,
Indonesia
7 Center for Language and Cognition Groningen (CLCG) and School of Behavioral and
Cognitive Neurosciences (BCN), University of Groningen, P.O. Box 716, 9700 AS Groningen,
The Netherlands
123
Read Writ (2017) 30:1729–1751
DOI 10.1007/s11145-017-9748-y
between the outcomes on the reading-skills and reading-related measures by means of
correlation and factor analyses. External variables, i.e., school grades and teacher
ratings of the reading and learning abilities of individual students, were also utilized to
provide evidence of its construct validity. Four variables were found to be signifi-
cantly related with reading-skill measures: phonological awareness, rapid naming,
spelling, and digit span. The current study on reading development in Standard
Indonesian confirms findings fromother languages with transparent orthographies and
suggests a test battery including preliminary norm scores for screening and assessment
of elementary school children learning to read Standard Indonesian.
Keywords Standard Indonesian · Dyslexia · Transparent orthography · Dyslexia
assessment
Introduction
Although our understanding of dyslexia has grown in the past decades, in many non-
English speaking parts of the world, the concept and study of dyslexia is still in its
infancy (Lee, 2008). This also holds for Indonesia. With a population estimated to
reach 258.7 million in 2016, Indonesia is the 4th most populous country on earth,
ranking behind China, India, and the US. Figures vary, but numbers as high as 550
(Sneddon, 2003) and 731 (Frederick & Worden, 2011) have been mentioned for the
different languages spoken in the Indonesian archipelago in the early 21st century.
Standard Indonesian (SI) has become the language of schools, government, national
print and electronic media, and of interethnic communication (Frederick & Worden,
2011). For about 23 million Indonesians nationwide SI is their primary language,
while for over 140 million others SI is their second language (Lewis, Simons, &
Fennig, 2013). Most of these first language SI-speakers live in larger cities.
Dyslexia occurs in all languages (Shaywitz,Morris, & Shaywitz, 2008), even though
the consistency in which phonology is represented in the orthography varies and has a
major effect in reading development (Ziegler&Goswami, 2005).TheSI language script
has a high degree of orthographic transparency with an almost one-to-one letter-to-
sound correspondence (Winskel & Widjaja, 2007). Some cross-cultural work suggests
universality in the neurocognitive and neurobiological causes of dyslexia (Peterson &
Pennington, 2012). Based on previous studies conducted in other languages with
transparent orthographies (e.g., Lyytinen,Erskine,Kujala,Ojanen,&Richardson, 2009;
Trenta, Benassi, Di Filippo, Pontillo, & Zoccolotti, 2013; Van der Leij et al., 2013), it
can be assumed that reading difficulties and dyslexia will also occur among the many
Indonesians who (learn to) read SI. However, for those who are experiencing the
negative consequences of these problems on their cognitive development, school
motivation, well-being, and self-esteem (Lovio, Halttunen, Lyytinen, Naatanen, &
Kujala, 2012), reading acquisition in SI has, unfortunately, not been studied widely and
also, to the best of our knowledge, no standardized measures of reading skills and
reading-related cognitive abilities have thus far been developed to diagnose dyslexia.
The development of a reading assessment battery is a crucial first step in the
management of reading problems in Indonesia as knowledge and awareness of
1730 B. A. J. Jap et al.
123
dyslexia in Indonesia are dependent on the accurate identification and treatment of
individuals with or at risk of dyslexia in SI. The aim of the present study
accordingly was to compose a comprehensive test battery to facilitate the
assessment of reading acquisition and an early detection of reading difficulties in
readers of SI. Such a test battery needs to comprise instruments to assess reading
and spelling skills, as well as tools to evaluate cognitive functions known to be
related to these skills.
The orthography of Standard Indonesian
Standard Indonesian is a member of the Western Malayo-Polynesian subdivision of
the Austronesian language family. Monolingual speakers of SI are relatively few in
number; most Indonesians have first learned to speak regional dialects and only
acquire SI through formal education.
The Indonesian alphabet consists of 26 letters that correspond to the English
alphabet. Since the introduction of the Enhanced Indonesian Spelling System (EYD)
in 1972, SI features a highly transparent orthography (formally, not considering
local dialects) with all but one grapheme having a one-to-one grapheme-to-phoneme
correspondence. The only grapheme with two possible phonological counterparts is
the ‘e’, which either represents the schwa /ə/ or the /e/. Additionally, there are
several digraphs (‘gh’, ‘kh’, ‘ng’, ‘ny’, ‘sy’). Indonesian has very few consonant
clusters, only three diphthongs ‘ai’, ‘au’, ‘oi’, and six vowels /i/, /e/, /a/, /ə/, /o/, and/u/ (Moeliono & Dardjowidjojo, 1988). SI is a zero-marking language (Nichols &
Bickel, 2013) without case or gender markers.
The syllable is a salient unit in SI, as multisyllabic forms make up the majority of
words, rendering monosyllabic words uncommon (Winskel & Widjaja, 2007).
Moreover, the syllable structures are simple and have clear boundaries, most
frequently, V, VC, CV, CVC, and CVV (C = consonant; V = vowel; Prentice,
1987). More complex syllable structures and consonant clusters do exist but mainly
through loanwords. Syllabic stress is regular and mostly falls on the penultimate or
the final syllable (Gomez & Reason, 2002).
Indonesian possesses a rich transparent system of morphemes and affixations,
with about 25 derivational affixes (Prentice, 1987). Nonaffixed forms are common
in colloquial (spoken) Indonesian. The affixes have at least one semantic function
and differ depending on the word class of the stem (Winskel & Widjaja, 2007). The
stem word makan (‘to eat’) for example, becomes termakan (‘to be eaten’),
makanan (‘food’), makani (‘devour’), and pemakan (‘eater’). There are irregular-
ities, however, in the spelling of some affixes, which depend on their context. As
many instructions in schoolbooks are written using these forms, Indonesian children
need to be able to cope with long words consisting of various affixes from an early
age (Winskel & Widjaja, 2007).
The salience of the syllable in SI is reflected in the formal teaching method
adopted, which primarily focuses on teaching children about correspondences
between whole spoken and written syllables rather than about grapheme–phoneme
correspondences (Winskel & Lee, 2013). Formal reading instruction typically
proceeds along the following lines: first the alphabet is introduced and children are
Towards identifying dyslexia in Standard Indonesian: the… 1731
123
trained to memorize the names of letters. Next, they are instructed to combine
consonants and vowels into syllables with a simple C and V pattern, such as b + a,
b + i, b + u, b + e, and b + o, producing the syllables ba, bi, bu, be, and bo. Afterrehearsing these syllables, the children are asked to combine the syllables to form a
word, such as i + bu to create the word ibu (mother) (Dewi, 2003).
Conceptual framework of the test battery
To conceptualize reading assessment in SI, we relied on the International Dyslexia
Association’s (IDA) definition of dyslexia (Lyon, Shaywitch, & Shaywitz, 2003).
According to this definition, dyslexia is characterized by problems with accurate
and/or fluent word recognition (i.e., identifying real words), and poor spelling or
decoding abilities (reading aloud pseudowords). These difficulties are often
“unexpected” in view of the child’s other cognitive abilities (i.e., typical general
intelligence) and exist despite the provision of adequate formal classroom
instruction. At the explanatory level, dyslexia typically results from a deficit in
the phonological component of language (Lyon et al., 2003).
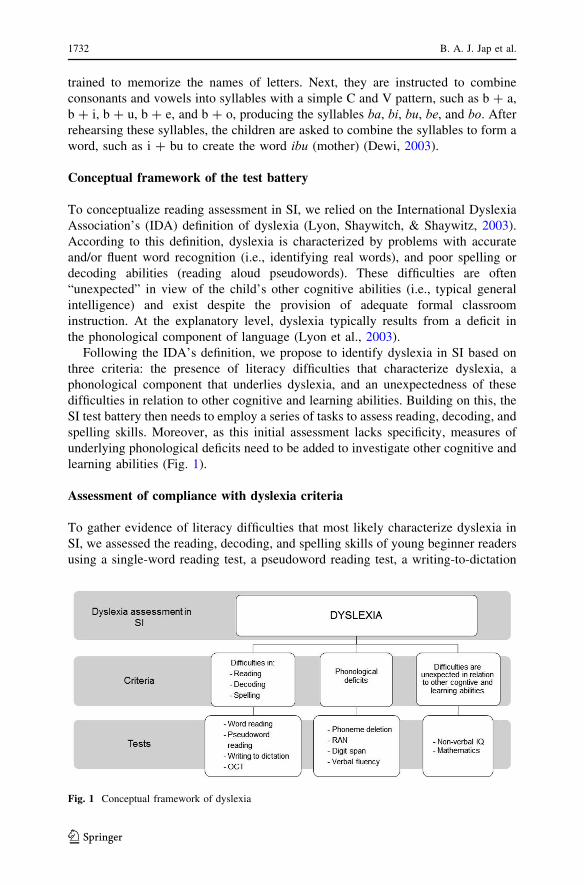
Following the IDA’s definition, we propose to identify dyslexia in SI based on
three criteria: the presence of literacy difficulties that characterize dyslexia, a
phonological component that underlies dyslexia, and an unexpectedness of these
difficulties in relation to other cognitive and learning abilities. Building on this, the
SI test battery then needs to employ a series of tasks to assess reading, decoding, and
spelling skills. Moreover, as this initial assessment lacks specificity, measures of
underlying phonological deficits need to be added to investigate other cognitive and
learning abilities (Fig. 1).
Assessment of compliance with dyslexia criteria
To gather evidence of literacy difficulties that most likely characterize dyslexia in
SI, we assessed the reading, decoding, and spelling skills of young beginner readers
using a single-word reading test, a pseudoword reading test, a writing-to-dictation
Fig. 1 Conceptual framework of dyslexia
1732 B. A. J. Jap et al.
123
task, and an orthographic choice (OCT) test. According to the simple view of
reading, a model proposed by Gough and Tunmer (1986) and Hoover and Gough
(1990), decoding capacity (defined as efficient word recognition) and linguisticcomprehension (the ability to use information at the lexical or word level to achieve
sentence and discourse interpretations) are both considered essential to reading
success, while neither of the two skills is by itself sufficient. A key characteristic of
dyslexia, which is word-level reading difficulties, is then explained by the lack of
decoding skills (Gough & Tunmer, 1986; Rack, Snowling, & Olson, 1992), which
becomes most apparent when words (e.g., pseudowords or non-words) cannot be
read by sight (Snowling, 1995). Apart from lacking word-recognition and decoding
skills, children with dyslexia often have spelling difficulties, which is not surprising
as both theoretical and empirical studies argue that reading and spelling
development are closely related (Ehri, 2005).
We included seven subtests in our battery to investigate potential phonological
deficits underlying dyslexia in SI. Wagner and Torgesen (1987) distinguish three
main types of phonological skills related to reading acquisition: phonological
awareness (the sensitivity for and access to sounds in spoken words), rapid
automatized naming (RAN; retrieval of phonological codes from long-term
memory), and verbal short-term memory (phonological coding in short-term
memory). These phonological abilities are assessed using a phoneme-deletion task,
three different RAN tasks (digits, letters, colors), WISC (backward and forward)
digit span, and a verbal-fluency task. Verbal fluency (e.g., operationalized as: Name
as many words starting with /s/) has been shown to be relatively sensitive in
distinguishing dyslexic readers with a phonological deficit from those with certain
types of visual deficits, with the latter category performing within the normal range
(Cohen, Morgan, Vaughn, Riccio, & Hall, 1999).
To gather evidence for a possible discrepancy between reading and spelling
problems, and other cognitive or learning abilities, we utilized Raven’s “Coloured
Progressive Matrices” (CPM; Raven & Court, 1962) to assess non-verbal IQ. In
Indonesia, the CPM is one of the few standardized IQ tests for children and hence
the most widely used. We furthermore investigated mathematical skills using the
Tempo Test Rekenen [(Speeded Arithmetic Test); De Vos, 1992].
In the current study we aimed to address the following questions: (1) What are
the cognitive factors indicative of typical reading ability in SI? (2) What is the
typical profile of reading and reading-related cognitive skills for young beginner
readers of SI? (3) Which variables distinguish typical young beginner readers from
age peers with or at risk of developing dyslexia? And finally, (4) What are the
optimal criteria for the categorization of reading difficulties in SI?
Methods
Participants
The participants were 75 first-grade students (44 boys; 31 girls) with a mean age of
6;4 (SD: 0.45; range 6;0–7;11) and 64 second-grade students (37 boys; 27 girls)
Towards identifying dyslexia in Standard Indonesian: the… 1733
123
with a mean age of 7;6 (SD: 0.52; range 7;0–9;8). All attended a Catholic private
elementary school in West Jakarta, receiving education in SI, and came from middle
socioeconomic backgrounds. Most were first language speakers of SI, though there
was a small number of bilingual students who spoke a regional dialect at home (e.g.,
Javanese and Sundanese). It is worth noting that this language profile may not fit the
majority of Indonesian speakers in the country, who usually acquire SI as a second
language after the regional language spoken at home. The students were tested one
month after the beginning of the second semester, with the first graders having
received approximately 6 months and the second graders approximately 16 months
of formal instruction.
Materials and procedure
The tests were administered in two sessions, one group and one individual session.
Individual testing times varied from 20 to 30 min, depending on the students’
abilities. The group session took place in the classroom and took approximately 1 h.
The tests were administered by the first author with the assistance of psychologists.
The words used for the reading tasks were drawn from the first-graders’ BahasaIndonesia textbook to ensure that all children were familiar with the terms. Details
of each task are exemplified below.
The group session comprised the following tests:
Raven’s Coloured Progressive Matrices (CPM) The CPM (Raven & Court, 1962)
was used to get an indication of the participants’ non-verbal intellectual capacities.
Individual scores were compared with the average scores for that grade. All students
completed the test and for those falling into the “poor reader” category, it was
verified that they had above or equal-to-average intelligence according to the age-
specific CPM norm scores; students scoring 13 or less (age 6;0) and 14 or less (age
7;0) were categorized as below average. The raw scores reflect the number of
correct responses.
Orthographic choice task (OCT) In this task the children were asked to identify
the correct spelling (by underlining it) from three letter strings that were
phonologically similar, as in bisa (correct; meaning: can), bissa (pseudoword),
byza (pseudoword). A total of 20 sets of three letter strings were presented and the
score was determined by the total number of correct answers.
Writing to dictation Twenty words varying in phonological structure and length
were presented orally in isolation and in sentence context. For example: kaki -Manusia memiliki dua kaki. (foot—Humans have two feet.). The students were
instructed to write down the word using the correct spelling. The task score was
based on the total number of correct answers.
Tempo Test Rekenen (TTR) This arithmetic test (De Vos, 1992) assessed addition,
subtraction, multiplication, and division. The first graders completed the first two
sections (addition and subtraction), while the second graders additionally completed
the multiplication section. The students were instructed to write down the answers
as fast and as accurately as possible and, when the 1-min time limit had expired,
1734 B. A. J. Jap et al.
123
they were told to proceed to the next section. The score was the average number of
correct answers across the subtests administered.
The following tests were completed during the individual session:
Word reading (reading) In this task, the student was presented with a list of 100
words taken from a first-semester grade-1 language textbook that were printed in
columns on an A4-sized sheet. S(he) was asked to read aloud as many words as
possible in 1 min, reading as fast and as accurately as possible. Included were words
with different phonological structures and grapheme–phoneme mappings, with
syllable lengths varying from 1 to 4. Examples of test items include es (ice), mata(eye), baik (good), saudara (sister), and menyenangkan (pleasant). The number of
correctly pronounced words within the 1-min time limit was taken to reflect word-
reading fluency.
Pseudoword reading (decoding) This task used the words of the word-reading
task albeit that several letters of each word have been modified. Examples are: em,mita, boik, peudira, and kenyetangkin. The children were instructed to read aloud as
many pseudowords as possible in 1 min, where the number of correctly pronounced
items was taken to indicate pseudoword reading fluency.
Digit span The forward and backward digit-span tasks we used were adapted
from the Dutch version of the WISC-R (Wechsler, 1974), of which the instructions
were translated into SI. Students were asked to correctly repeat a sequence of digits
immediately after presentation, in forward fashion during the first, and in backward
fashion during the second task. Per trial two sequences with the same number of
digits were presented. A trial was abandoned as soon as two errors were made on the
same span length. Both digit-span scores were based on the number of correctly
reproduced trials.
Verbal fluency Students were asked to produce as many words starting with the
phoneme /s/, excluding names of people and places. Verbal fluency was scored
based on the number of words correctly produced in 1 min.
Phoneme deletion The task consisted of 20 pseudowords that either had the initial,
middle, or final phoneme omitted. The order of trials with different omissions was
pseudo-randomized to prevent the children from being offered the same omission
pattern more than twice in a row, which might cause confusion. For example, if the
omission of an initial phoneme would be repeated multiple times, the participant
might think the task only requires leaving out the first phoneme of each word.
Moreover, to ensure that s(he) had heard the pseudoword correctly, the student was
asked to repeat the pseudoword without the omission, just as it was orally presented
by the experimenter (e.g., piku /pIkʊ/). Next, the student was instructed to repeat the
pseudoword again, but now without the phoneme the experimenter provided. For
example /pIkʊ/without the phoneme /ʊ/, resulting in the pseudoword /pIk/. Because
the task could be challenging for the younger participants, the experimenter ensured
comprehension of instructions in addition to providing multiple examples. The raw
scores indicated the number of correct responses out of 20.
Towards identifying dyslexia in Standard Indonesian: the… 1735
123
Rapid automatized naming (RAN) As in the Van den Bos RAN subtasks (2003),
the children were presented with capital letters, digits, or colors printed on a test
sheet and asked to name these as fast and as accurately as possible. The time needed
to name the total of 50 items constituted the test score. Afterwards, the score was
converted into words per second (wps in Table 1), accounting for any skipped items.
Teacher ratings For each grade, the homeroom teachers rated the students’
general learning, reading, writing, and arithmetic difficulties on a 3-point Likert
scale, with the raw scores indicating the relevant numeric codes (1 = no difficulties,
2 = some difficulties/unable to determine, 3 = apparent difficulties).
School grades Individual grades from the first-semester tests on SI (BahasaIndonesia) and mathematics were made available to the researchers. The grades
assigned were any number out of 100.
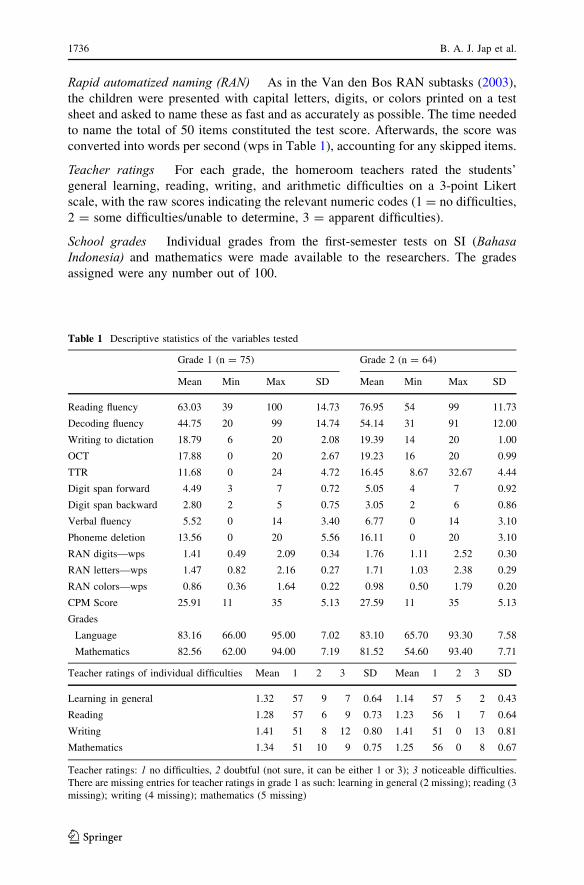
Table 1 Descriptive statistics of the variables tested
Grade 1 (n = 75) Grade 2 (n = 64)
Mean Min Max SD Mean Min Max SD
Reading fluency 63.03 39 100 14.73 76.95 54 99 11.73
Decoding fluency 44.75 20 99 14.74 54.14 31 91 12.00
Writing to dictation 18.79 6 20 2.08 19.39 14 20 1.00
OCT 17.88 0 20 2.67 19.23 16 20 0.99
TTR 11.68 0 24 4.72 16.45 8.67 32.67 4.44
Digit span forward 4.49 3 7 0.72 5.05 4 7 0.92
Digit span backward 2.80 2 5 0.75 3.05 2 6 0.86
Verbal fluency 5.52 0 14 3.40 6.77 0 14 3.10
Phoneme deletion 13.56 0 20 5.56 16.11 0 20 3.10
RAN digits—wps 1.41 0.49 2.09 0.34 1.76 1.11 2.52 0.30
RAN letters—wps 1.47 0.82 2.16 0.27 1.71 1.03 2.38 0.29
RAN colors—wps 0.86 0.36 1.64 0.22 0.98 0.50 1.79 0.20
CPM Score 25.91 11 35 5.13 27.59 11 35 5.13
Grades
Language 83.16 66.00 95.00 7.02 83.10 65.70 93.30 7.58
Mathematics 82.56 62.00 94.00 7.19 81.52 54.60 93.40 7.71
Teacher ratings of individual difficulties Mean 1 2 3 SD Mean 1 2 3 SD
Learning in general 1.32 57 9 7 0.64 1.14 57 5 2 0.43
Reading 1.28 57 6 9 0.73 1.23 56 1 7 0.64
Writing 1.41 51 8 12 0.80 1.41 51 0 13 0.81
Mathematics 1.34 51 10 9 0.75 1.25 56 0 8 0.67
Teacher ratings: 1 no difficulties, 2 doubtful (not sure, it can be either 1 or 3); 3 noticeable difficulties.
There are missing entries for teacher ratings in grade 1 as such: learning in general (2 missing); reading (3
missing); writing (4 missing); mathematics (5 missing)
1736 B. A. J. Jap et al.
123
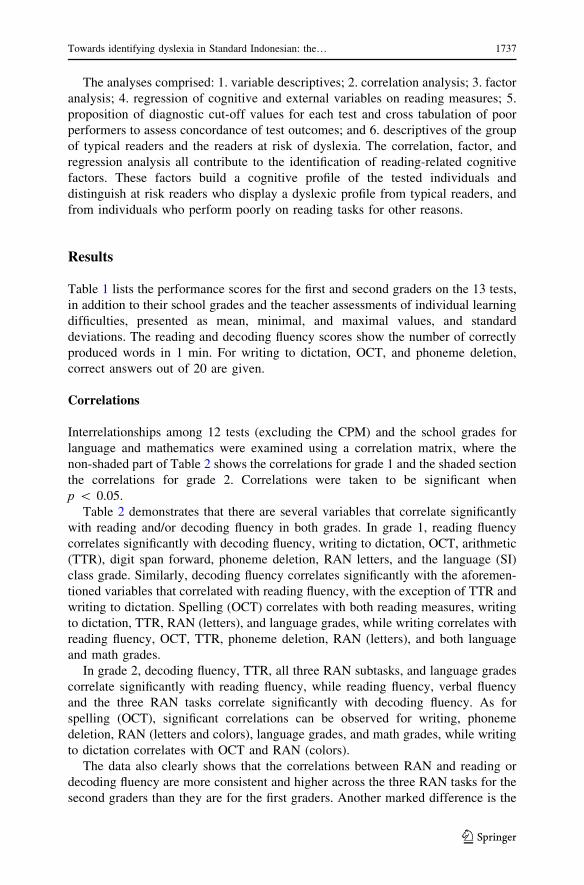
The analyses comprised: 1. variable descriptives; 2. correlation analysis; 3. factor
analysis; 4. regression of cognitive and external variables on reading measures; 5.
proposition of diagnostic cut-off values for each test and cross tabulation of poor
performers to assess concordance of test outcomes; and 6. descriptives of the group
of typical readers and the readers at risk of dyslexia. The correlation, factor, and
regression analysis all contribute to the identification of reading-related cognitive
factors. These factors build a cognitive profile of the tested individuals and
distinguish at risk readers who display a dyslexic profile from typical readers, and
from individuals who perform poorly on reading tasks for other reasons.
Results
Table 1 lists the performance scores for the first and second graders on the 13 tests,
in addition to their school grades and the teacher assessments of individual learning
difficulties, presented as mean, minimal, and maximal values, and standard
deviations. The reading and decoding fluency scores show the number of correctly
produced words in 1 min. For writing to dictation, OCT, and phoneme deletion,
correct answers out of 20 are given.
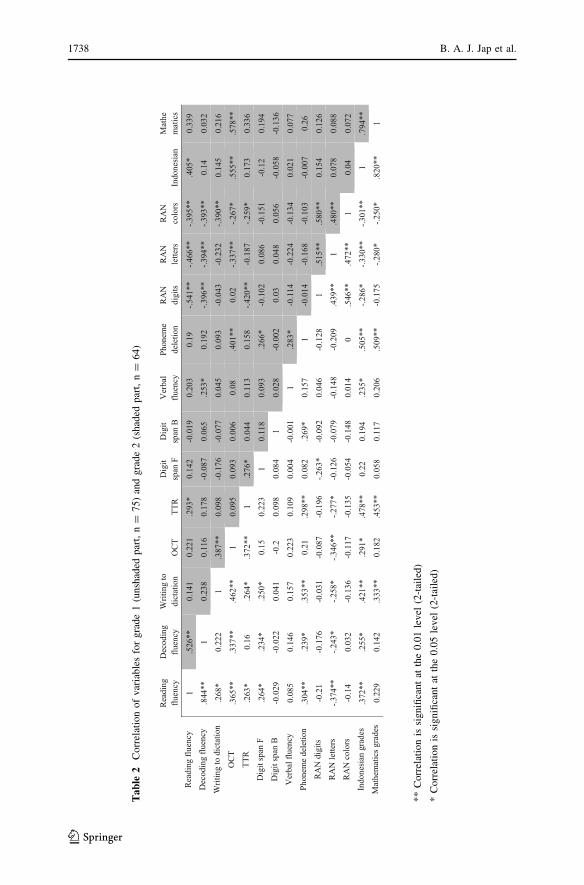
Correlations
Interrelationships among 12 tests (excluding the CPM) and the school grades for
language and mathematics were examined using a correlation matrix, where the
non-shaded part of Table 2 shows the correlations for grade 1 and the shaded section
the correlations for grade 2. Correlations were taken to be significant when
p \ 0.05.
Table 2 demonstrates that there are several variables that correlate significantly
with reading and/or decoding fluency in both grades. In grade 1, reading fluency
correlates significantly with decoding fluency, writing to dictation, OCT, arithmetic
(TTR), digit span forward, phoneme deletion, RAN letters, and the language (SI)
class grade. Similarly, decoding fluency correlates significantly with the aforemen-
tioned variables that correlated with reading fluency, with the exception of TTR and
writing to dictation. Spelling (OCT) correlates with both reading measures, writing
to dictation, TTR, RAN (letters), and language grades, while writing correlates with
reading fluency, OCT, TTR, phoneme deletion, RAN (letters), and both language
and math grades.
In grade 2, decoding fluency, TTR, all three RAN subtasks, and language grades
correlate significantly with reading fluency, while reading fluency, verbal fluency
and the three RAN tasks correlate significantly with decoding fluency. As for
spelling (OCT), significant correlations can be observed for writing, phoneme
deletion, RAN (letters and colors), language grades, and math grades, while writing
to dictation correlates with OCT and RAN (colors).
The data also clearly shows that the correlations between RAN and reading or
decoding fluency are more consistent and higher across the three RAN tasks for the
second graders than they are for the first graders. Another marked difference is the
Towards identifying dyslexia in Standard Indonesian: the… 1737
123
Tab
le2
Correlationofvariablesforgrade1(unshaded
part,n=
75)andgrade2(shaded
part,n=
64)
Rea
ding
flu
ency
Dec
odin
g flu
ency
Writ
ing
to
dict
atio
nO
CT
TTR
D
igit
span
FD
igit
span
BV
erba
l flu
ency
Phon
eme
dele
tion
RA
N
digi
tsR
AN
le
tters
RA
N
colo
rsIn
done
sian
M
athe
mat
ics
Rea
ding
flue
ncy
1.5
26**
0.14
10.
221
.293
*0.
142
-0.0
190.
203
0.19
-.541
**-.4
66**
-.395
**.4
05*
0.33
9D
ecod
ing
fluen
cy.8
44**
10.
238
0.11
60.
178
-0.0
870.
065
.253
*0.
192
-.396
**-.3
94**
-.393
**0.
140.
032
Writ
ing
to d
icta
tion
.268
*0.
222
1.3
87**
0.09
8-0
.176
-0.0
770.
045
0.09
3-0
.043
-0.2
32-.3
90**
0.14
50.
216
OC
T.3
65**
.337
**.4
62**
10.
095
0.09
30.
006
0.08
.401
**0.
02-.3
37**
-.267
*.5
55**
.578
**TT
R
.263
*0.
16.2
64*
.372
**1
.276
*0.
044
0.11
30.
158
-.420
**-0
.187
-.259
*0.
173
0.33
6D
igit
span
F.2
64*
.234
*.2
50*
0.15
0.22
31
0.11
80.
093
.266
*-0
.102
0.08
6-0
.151
-0.1
20.
194
Dig
it sp
an B
-0.0
29-0
.022
0.04
1-0
.20.
098
0.08
41
0.02
8-0
.002
0.03
0.04
80.
056
-0.0
58-0
.136
Ver
bal f
luen
cy0.
085
0.14
60.
157
0.22
30.
109
0.00
4-0
.001
1.2
83*
-0.1
14-0
.224
-0.1
340.
021
0.07
7Ph
onem
e de
letio
n.3
04**
.239
*.3
53**
0.21
.298
**0.
082
.269
*0.
157
1-0
.014
-0.1
68-0
.103
-0.0
070.
26R
AN
dig
its-0
.21
-0.1
76-0
.031
-0.0
87-0
.196
-.263
*-0
.092
0.04
6-0
.128
1.5
15**
.580
**0.
154
0.12
6R
AN
lette
rs-.3
74**
-.243
*-.2
58*
-.346
**-.2
77*
-0.1
26-0
.079
-0.1
48-0
.209
.439
**1
.480
**0.
078
0.08
8R
AN
col
ors
-0.1
40.
032
-0.1
36-0
.117
-0.1
35-0
.054
-0.1
480.
014
0.5
46**
.472
**1
0.04
0.07
2In
done
sian
gra
des
.372
**.2
55*
.421
**.2
91*
.478
**0.
220.
194
.235
*.5
05**
-.286
*-.3
30**
-.301
**1
.794
**M
athe
mat
ics g
rade
s0.
229
0.14
2.3
33**
0.18
2.4
53**
0.05
80.
117
0.20
6.5
09**
-0.1
75-.2
80*
-.250
*.8
20**
1
**Correlationis
significantat
the0.01level
(2-tailed)
*Correlationissignificantat
the0.05level
(2-tailed)
1738 B. A. J. Jap et al.
123
significant correlation between the phoneme deletion task with reading or decoding
fluency in grade 1 and the lack thereof in grade 2.
More reading-associated tasks correlated with actual reading measures in grade 1
than in grade 2. Spelling (OCT) scores correlated with both reading and decoding
fluency in grade 1 but with neither in grade 2. The same can be observed for forward
digit span, which correlated with the reading and decoding outcomes in grade 1 but
not in grade 2.
In addition to the test battery tasks, the classroom language scores uncovered
another distinction between the two groups in that they correlate with decoding
fluency in grade 1 but not in grade 2. The language scores of the first graders
moreover correlate with other analytical reading-related variables such as TTR,
phoneme deletion, verbal fluency, and all three RAN tasks. Such a pattern is not
found in grade 2, where the language score does correlate with the OCT scores and
reading fluency, correlations that are also found in grade 1.
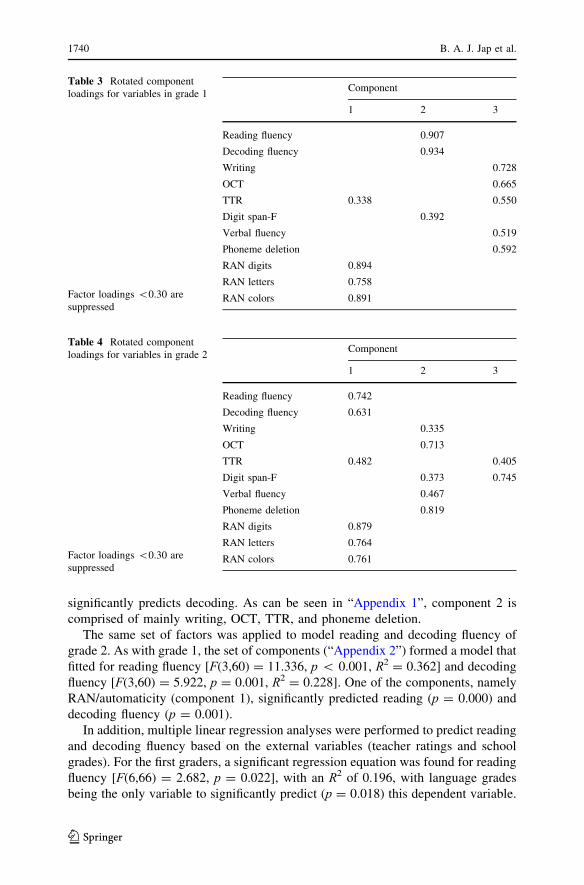
Factor analysis results
A principal component analysis was conducted for the first graders, the results of
which are shown in Table 3.
The analysis resulted in a three-factor solution, with the first factor being
composed of the three RAN tasks and a moderate loading of arithmetic (TTR),
which can be interpreted as the automaticity required to complete these tasks. The
second factor is composed of word reading, pseudoword reading (decoding), and
forward digit span, which, given their loadings, would earmark this factor as a
reading component. The third factor is mainly composed of writing to dictation,
OCT, arithmetic, verbal fluency, and phoneme deletion, and can hence be said to
reflect writing, spelling, and reading-related skills.
The results of the principal component analysis for the second graders are shown
in Table 4.
The analysis yielded three components. The first component comprises two sets
of measures, i.e., the two reading measures (word and pseudoword reading), and the
arithmetic and RAN tasks. Successful performance of all these tasks requires
automaticity and some degree of verbal skills. The second component is much like
the third component for grade 1, comprising writing and spelling, and forward digit
span, verbal fluency, and phoneme deletion (mostly reading-related verbal
measures). The third factor includes arithmetic and forward digit span, again
cognitive reading-related variables.
Regression of cognitive and external variables on reading measures
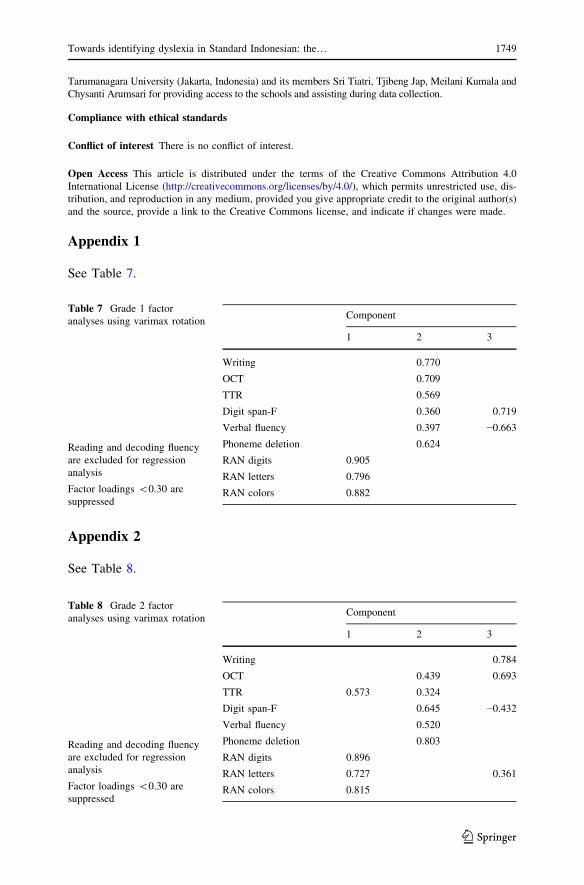
A multiple regression analysis was conducted with the factor scores of grade 1 but
excluding reading and decoding fluency, producing three discernible components
(“Appendix 1”) to predict reading and decoding fluency. The model was a good fit
for reading fluency [F(3,71) = 8.008, p \ 0.001, R2 = 0.253] and components 1
(p \ 0.001) and 2 (p = 0.004) are both significant predictors. As for decoding
fluency [F(3,71) = 4.091, p = 0.010, R2 = 0.147], component 2 (p = 0.002)
Towards identifying dyslexia in Standard Indonesian: the… 1739
123
significantly predicts decoding. As can be seen in “Appendix 1”, component 2 is
comprised of mainly writing, OCT, TTR, and phoneme deletion.
The same set of factors was applied to model reading and decoding fluency of
grade 2. As with grade 1, the set of components (“Appendix 2”) formed a model that
fitted for reading fluency [F(3,60) = 11.336, p \ 0.001, R2 = 0.362] and decoding
fluency [F(3,60) = 5.922, p = 0.001, R2 = 0.228]. One of the components, namely
RAN/automaticity (component 1), significantly predicted reading (p = 0.000) and
decoding fluency (p = 0.001).
In addition, multiple linear regression analyses were performed to predict reading
and decoding fluency based on the external variables (teacher ratings and school
grades). For the first graders, a significant regression equation was found for reading
fluency [F(6,66) = 2.682, p = 0.022], with an R2 of 0.196, with language grades
being the only variable to significantly predict (p = 0.018) this dependent variable.
Table 3 Rotated component
loadings for variables in grade 1
Factor loadings \0.30 are
suppressed
Component
1 2 3
Reading fluency 0.907
Decoding fluency 0.934
Writing 0.728
OCT 0.665
TTR 0.338 0.550
Digit span-F 0.392
Verbal fluency 0.519
Phoneme deletion 0.592
RAN digits 0.894
RAN letters 0.758
RAN colors 0.891
Table 4 Rotated component
loadings for variables in grade 2
Factor loadings \0.30 are
suppressed
Component
1 2 3
Reading fluency 0.742
Decoding fluency 0.631
Writing 0.335
OCT 0.713
TTR 0.482 0.405
Digit span-F 0.373 0.745
Verbal fluency 0.467
Phoneme deletion 0.819
RAN digits 0.879
RAN letters 0.764
RAN colors 0.761
1740 B. A. J. Jap et al.
123
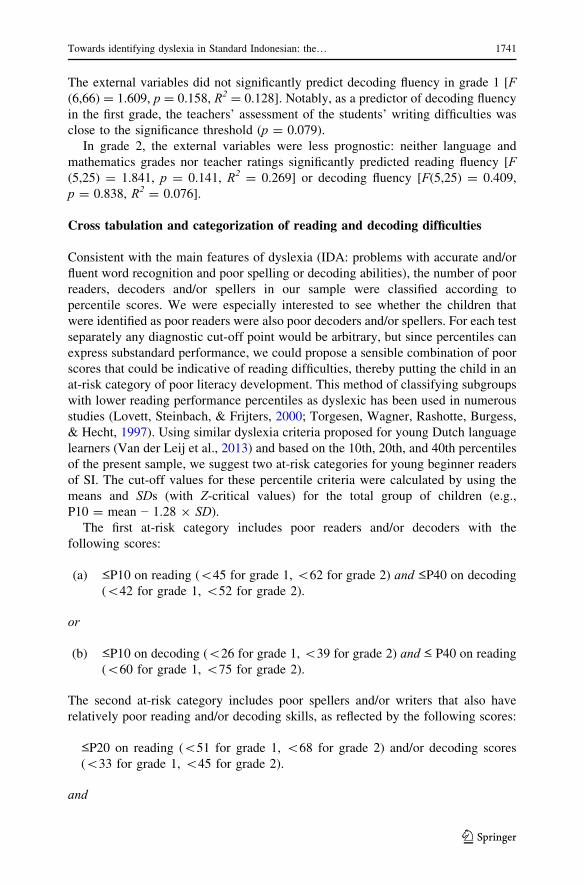
The external variables did not significantly predict decoding fluency in grade 1 [F(6,66) = 1.609, p = 0.158, R2 = 0.128]. Notably, as a predictor of decoding fluency
in the first grade, the teachers’ assessment of the students’ writing difficulties was
close to the significance threshold (p = 0.079).
In grade 2, the external variables were less prognostic: neither language and
mathematics grades nor teacher ratings significantly predicted reading fluency [F(5,25) = 1.841, p = 0.141, R2 = 0.269] or decoding fluency [F(5,25) = 0.409,
p = 0.838, R2 = 0.076].
Cross tabulation and categorization of reading and decoding difficulties
Consistent with the main features of dyslexia (IDA: problems with accurate and/or
fluent word recognition and poor spelling or decoding abilities), the number of poor
readers, decoders and/or spellers in our sample were classified according to
percentile scores. We were especially interested to see whether the children that
were identified as poor readers were also poor decoders and/or spellers. For each test
separately any diagnostic cut-off point would be arbitrary, but since percentiles can
express substandard performance, we could propose a sensible combination of poor
scores that could be indicative of reading difficulties, thereby putting the child in an
at-risk category of poor literacy development. This method of classifying subgroups
with lower reading performance percentiles as dyslexic has been used in numerous
studies (Lovett, Steinbach, & Frijters, 2000; Torgesen, Wagner, Rashotte, Burgess,
& Hecht, 1997). Using similar dyslexia criteria proposed for young Dutch language
learners (Van der Leij et al., 2013) and based on the 10th, 20th, and 40th percentiles
of the present sample, we suggest two at-risk categories for young beginner readers
of SI. The cut-off values for these percentile criteria were calculated by using the
means and SDs (with Z-critical values) for the total group of children (e.g.,
P10 = mean − 1.28 9 SD).The first at-risk category includes poor readers and/or decoders with the
following scores:
(a) ≤P10 on reading (\45 for grade 1, \62 for grade 2) and ≤P40 on decoding
(\42 for grade 1, \52 for grade 2).
or
(b) ≤P10 on decoding (\26 for grade 1, \39 for grade 2) and ≤ P40 on reading
(\60 for grade 1, \75 for grade 2).
The second at-risk category includes poor spellers and/or writers that also have
relatively poor reading and/or decoding skills, as reflected by the following scores:
≤P20 on reading (\51 for grade 1, \68 for grade 2) and/or decoding scores
(\33 for grade 1, \45 for grade 2).
and
Towards identifying dyslexia in Standard Indonesian: the… 1741
123
(a) ≤P10 on spelling (OCT; \15 for grade 1, \19 for grade 2) and ≤P40 on
writing to dictation (\19 for grade 1, \20 for grade 2).
or
(b) ≤P10 on writing to dictations (\17 for grade 1, \19 for grade 2) and ≤P40on spelling (OCT; \18 for grade 1, \20 for grade 2).
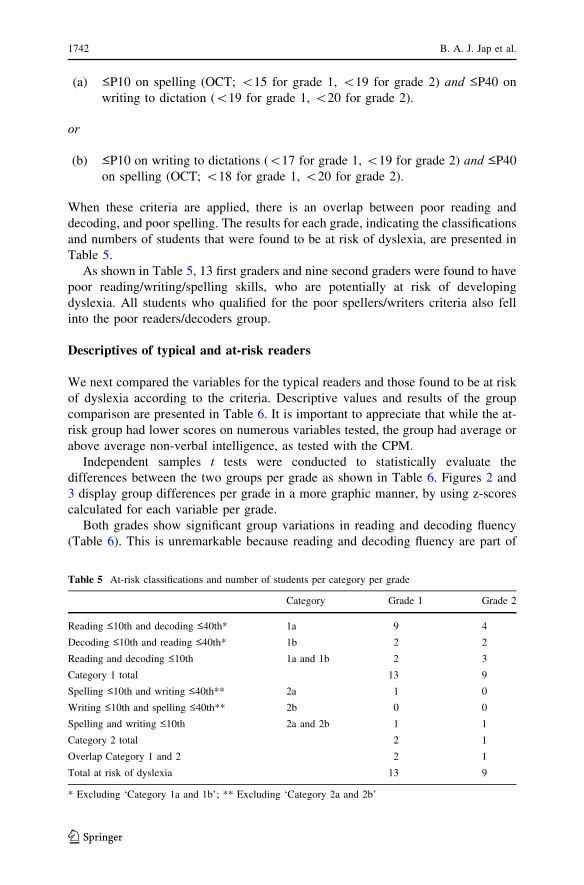
When these criteria are applied, there is an overlap between poor reading and
decoding, and poor spelling. The results for each grade, indicating the classifications
and numbers of students that were found to be at risk of dyslexia, are presented in
Table 5.
As shown in Table 5, 13 first graders and nine second graders were found to have
poor reading/writing/spelling skills, who are potentially at risk of developing
dyslexia. All students who qualified for the poor spellers/writers criteria also fell
into the poor readers/decoders group.
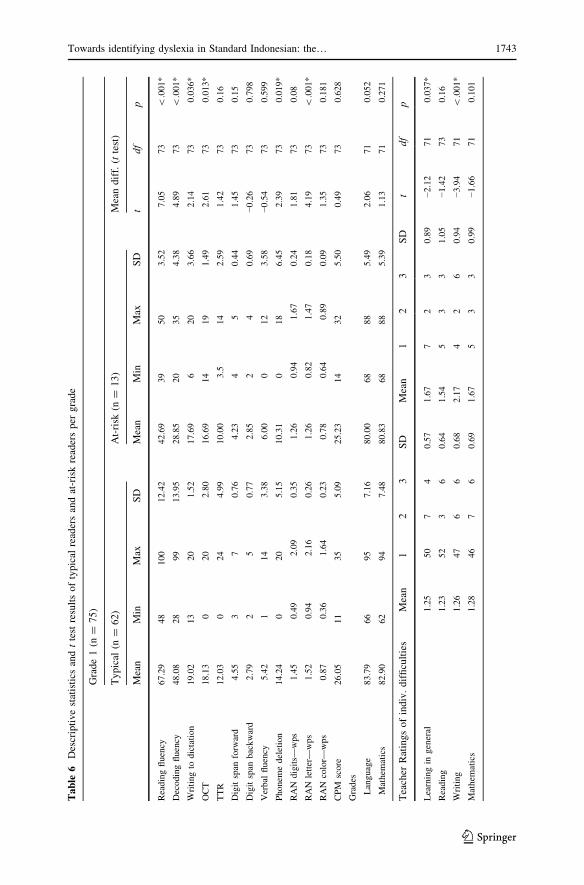
Descriptives of typical and at-risk readers
We next compared the variables for the typical readers and those found to be at risk
of dyslexia according to the criteria. Descriptive values and results of the group
comparison are presented in Table 6. It is important to appreciate that while the at-
risk group had lower scores on numerous variables tested, the group had average or
above average non-verbal intelligence, as tested with the CPM.
Independent samples t tests were conducted to statistically evaluate the
differences between the two groups per grade as shown in Table 6. Figures 2 and
3 display group differences per grade in a more graphic manner, by using z-scores
calculated for each variable per grade.
Both grades show significant group variations in reading and decoding fluency
(Table 6). This is unremarkable because reading and decoding fluency are part of
Table 5 At-risk classifications and number of students per category per grade
Category Grade 1 Grade 2
Reading ≤10th and decoding ≤40th* 1a 9 4
Decoding ≤10th and reading ≤40th* 1b 2 2
Reading and decoding ≤10th 1a and 1b 2 3
Category 1 total 13 9
Spelling ≤10th and writing ≤40th** 2a 1 0
Writing ≤10th and spelling ≤40th** 2b 0 0
Spelling and writing ≤10th 2a and 2b 1 1
Category 2 total 2 1
Overlap Category 1 and 2 2 1
Total at risk of dyslexia 13 9
* Excluding ‘Category 1a and 1b’; ** Excluding ‘Category 2a and 2b’
1742 B. A. J. Jap et al.
123
Tab
le6
Descriptivestatistics
andttestresultsoftypical
readersandat-riskreadersper
grade
Grade1(n
=75)
Typical
(n=
62)
At-risk
(n=
13)
Meandiff.(ttest)
Mean
Min
Max
SD
Mean
Min
Max
SD
tdf
p
Readingfluency
67.29
48
100
12.42
42.69
39
50
3.52
7.05
73
\.001*
Decodingfluency
48.08
28
99
13.95
28.85
20
35
4.38
4.89
73
\.001*
Writingto
dictation
19.02
13
20
1.52
17.69
620
3.66
2.14
73
0.036*
OCT
18.13
020
2.80
16.69
14
19
1.49
2.61
73
0.013*
TTR
12.03
024
4.99
10.00
3.5
14
2.59
1.42
73
0.16
Digitspan
forw
ard
4.55
37
0.76
4.23
45
0.44
1.45
73
0.15
Digitspan
backward
2.79
25
0.77
2.85
24
0.69
−0.26
73
0.798
Verbal
fluency
5.42
114
3.38
6.00
012
3.58
−0.54
73
0.599
Phonem
edeletion
14.24
020
5.15
10.31
018
6.45
2.39
73
0.019*
RAN
digits—
wps
1.45
0.49
2.09
0.35
1.26
0.94
1.67
0.24
1.81
73
0.08
RAN
letter—wps
1.52
0.94
2.16
0.26
1.26
0.82
1.47
0.18
4.19
73
\.001*
RAN
color—
wps
0.87
0.36
1.64
0.23
0.78
0.64
0.89
0.09
1.35
73
0.181
CPM
score
26.05
11
35
5.09
25.23
14
32
5.50
0.49
73
0.628
Grades
Language
83.79
66
95
7.16
80.00
68
88
5.49
2.06
71
0.052
Mathem
atics
82.90
62
94
7.48
80.83
68
88
5.39
1.13
71
0.271
Teacher
Ratingsofindiv.difficulties
Mean
12
3SD
Mean
12
3SD
tdf
p
Learningin
general
1.25
50
74
0.57
1.67
72
30.89
−2.12
71
0.037*
Reading
1.23
52
36
0.64
1.54
53
31.05
−1.42
73
0.16
Writing
1.26
47
66
0.68
2.17
42
60.94
−3.94
71
\.001*
Mathem
atics
1.28
46
76
0.69
1.67
53
30.99
−1.66
71
0.101
Towards identifying dyslexia in Standard Indonesian: the… 1743
123
Tab
le6
continued
Grade2(n
=64)
Typical
(n=
55)
At-risk
(n=
9)
Meandiff.(ttest)
Mean
Min
Max
SD
Mean
Min
Max
SD
tdf
p
Readingfluency
79.73
56
99
10.00
60.00
54
73
5.74
5.74
62
\.001*
Decodingfluency
56.60
40
91
10.78
39.11
31
51
7.34
6.15
62
\.001*
Writingto
dictation
19.53
17
20
0.72
18.56
14
20
1.88
2.85
62
0.006*
OCT
19.36
16
20
0.95
18.44
17
19
0.88
2.87
62
0.015*
TTR
16.82
8.67
32.67
4.53
14.15
10.67
20
3.11
2.2
62
0.043*
Digitspan
forw
ard
5.09
47
0.89
4.78
47
1.09
0.82
62
0.434
Digitspan
backward
3.06
26
0.89
3.00
24
0.71
0.21
62
0.84
Verbal
fluency
6.93
014
3.07
5.78
212
3.31
0.98
62
0.351
Phonem
edeletion
16.46
10
20
2.30
14.00
020
5.85
2.27
62
0.027*
RAN
digits—
wps
1.79
1.11
2.52
0.30
1.61
1.32
1.92
0.23
2.04
62
0.062
RAN
letter—wps
1.74
1.03
2.38
0.29
1.52
1.28
1.92
0.20
2.88
62
0.012*
RAN
color—
wps
1.00
0.63
1.79
0.19
0.85
0.5
1.21
0.21
1.94
62
0.081
CPM
score
27.67
11
35
5.20
27.11
18
33
5.01
0.31
62
0.76
Grades
Language
84.10
65.8
93.3
7.01
73.80
65.7
80.1
7.37
2.409
29
0.023*
Mathem
atics
82.45
68.7
93.4
6.15
72.87
54.6
84.1
15.96
2.17
29
0.038*
Teacher
Ratingsofindiv.difficulties
Mean
12
3SD
Mean
12
3SD
tdf
p
Learningin
general
1.09
51
31
0.35
1.44
62
10.73
−2.36
62
0.021*
Reading
1.15
51
04
0.52
1.78
51
30.97
−2.93
62
0.005*
Writing
1.22
49
06
0.63
2.56
20
70.88
−4.37
62
0.002*
Mathem
atics
1.18
50
05
0.58
1.67
60
31.00
−2.08
62
0.042*
Teacher
ratings:
1nodifficulties,2doubtful(notsure,itcanbeeither
1or3),3noticeable
difficulties
*Meandifference
issignificantat
the0.05level
1744 B. A. J. Jap et al.
123
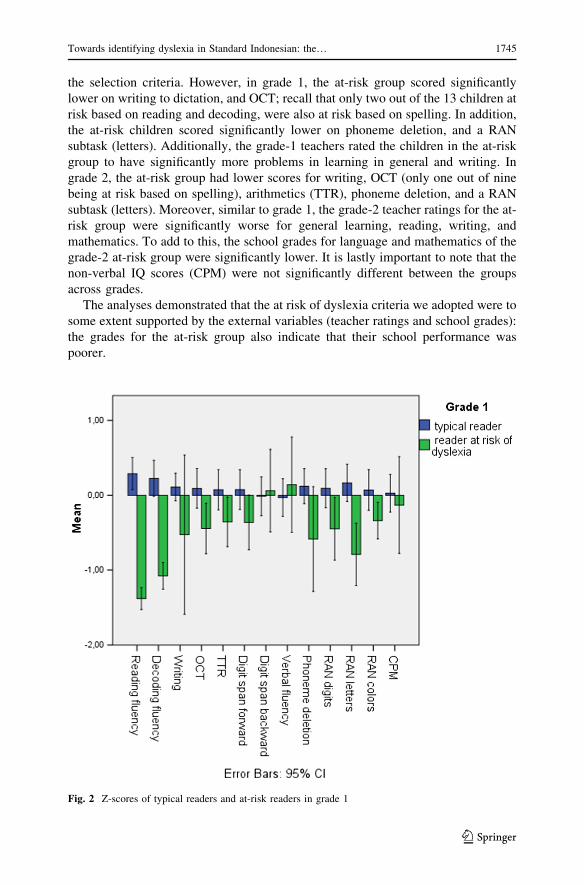
the selection criteria. However, in grade 1, the at-risk group scored significantly
lower on writing to dictation, and OCT; recall that only two out of the 13 children at
risk based on reading and decoding, were also at risk based on spelling. In addition,
the at-risk children scored significantly lower on phoneme deletion, and a RAN
subtask (letters). Additionally, the grade-1 teachers rated the children in the at-risk
group to have significantly more problems in learning in general and writing. In
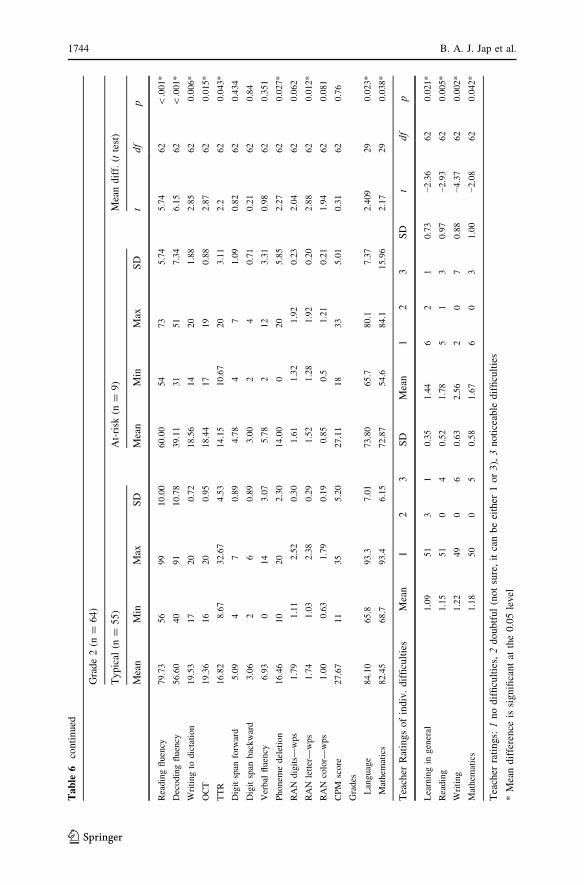
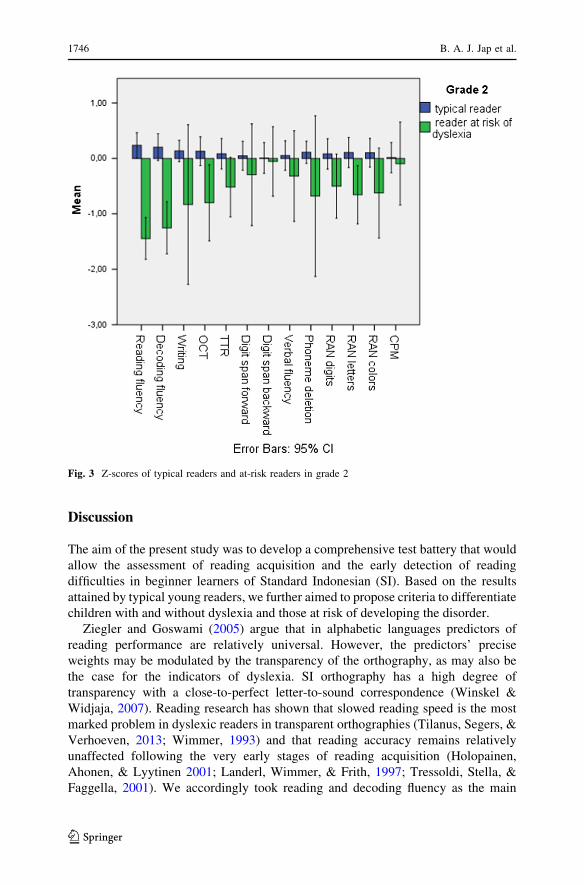
grade 2, the at-risk group had lower scores for writing, OCT (only one out of nine
being at risk based on spelling), arithmetics (TTR), phoneme deletion, and a RAN
subtask (letters). Moreover, similar to grade 1, the grade-2 teacher ratings for the at-
risk group were significantly worse for general learning, reading, writing, and
mathematics. To add to this, the school grades for language and mathematics of the
grade-2 at-risk group were significantly lower. It is lastly important to note that the
non-verbal IQ scores (CPM) were not significantly different between the groups
across grades.
The analyses demonstrated that the at risk of dyslexia criteria we adopted were to
some extent supported by the external variables (teacher ratings and school grades):
the grades for the at-risk group also indicate that their school performance was
poorer.
Fig. 2 Z-scores of typical readers and at-risk readers in grade 1
Towards identifying dyslexia in Standard Indonesian: the… 1745
123
Discussion
The aim of the present study was to develop a comprehensive test battery that would
allow the assessment of reading acquisition and the early detection of reading
difficulties in beginner learners of Standard Indonesian (SI). Based on the results
attained by typical young readers, we further aimed to propose criteria to differentiate
children with and without dyslexia and those at risk of developing the disorder.
Ziegler and Goswami (2005) argue that in alphabetic languages predictors of
reading performance are relatively universal. However, the predictors’ precise
weights may be modulated by the transparency of the orthography, as may also be
the case for the indicators of dyslexia. SI orthography has a high degree of
transparency with a close-to-perfect letter-to-sound correspondence (Winskel &
Widjaja, 2007). Reading research has shown that slowed reading speed is the most
marked problem in dyslexic readers in transparent orthographies (Tilanus, Segers, &
Verhoeven, 2013; Wimmer, 1993) and that reading accuracy remains relatively
unaffected following the very early stages of reading acquisition (Holopainen,
Ahonen, & Lyytinen 2001; Landerl, Wimmer, & Frith, 1997; Tressoldi, Stella, &
Faggella, 2001). We accordingly took reading and decoding fluency as the main
Fig. 3 Z-scores of typical readers and at-risk readers in grade 2
1746 B. A. J. Jap et al.
123
components of the test battery, with speed and accuracy being measured as the
number of correctly read words and pseudowords within 1 min.
To gather evidence of literacy difficulties that may characterize dyslexia in SI, we
assessed reading, decoding, and spelling abilities, in addition to phonological skills
and other cognitive aspects related to reading in beginner learners of SI. The results
indicated that several of our tests correlated significantly with reading and decoding
fluency.Most notably, the correlations between rapid automatized naming (RAN) and
reading or decoding fluency were more consistent and higher across the three RAN
tasks in the grade-2 than they were in the grade-1 readers. Moreover, whereas the
phoneme deletion task correlated significantly with reading or decoding fluency in
grade 1, this was not the case for grade 2. These findings agree with results from earlier
research in languages with transparent orthographies and indicate a decreasing effect
of phonological awareness on reading after starting school (formal instruction) when
the basic decoding rules have been learned (e.g., De Jong & Van der Leij, 2002;
Georgiou, Parrila, & Papadopoulos, 2008; Holopainen et al., 2001), whereas the
importance of RAN over time appears to increase (De Jong & Van der Leij, 1999;
Vaessen & Blomert, 2010). Overall, the correlations between reading and decoding
fluency and other reading-related tasks were higher in grade 1 than in grade 2. The
outcomes on the orthographic choice task (OCT) andwriting to dictation, for example,
correlated significantly with reading fluency (and with decoding fluency for OCT) in
grade 1 but not in grade 2. Note that the results we obtained may have been influenced
by the level of the task content, which for both tasks was based on grade-1 textbooks
and therefore relatively easy for the second graders, which is also reflected in the high
mean scores for these students on the two tasks (Table 1).We consequently propose to
increase the complexity of these spelling tests for grade 2 and above. The principal
component analysis we conducted resulted in a three-factor solution in both grades,
including two separate components for reading and decoding, and for writing and
spelling. Regarding the tasks mentioned under the ‘phonological deficit criterion’ in
Fig. 1, the factor analysis in grade 1 yielded a separate RAN component, whereas in
grade 2 the RAN tasks were incorporated in the reading and decoding component. In
both grades, verbal fluency and phoneme deletion were part of thewriting and spelling
component.
The independent sample t tests showed significant differences between the typicaland the at-risk readers for reading and decoding fluency as well as for phoneme
deletion, writing to dictation, OCT, and RAN in both grades. Additionally, based on
external measures, the at-risk second-graders performedmore poorly on language and
mathematics, and in both grades, teacher ratings pointed out some form of difficulties
in writing, reading, mathematics, or studying in general in the at-risk group.
Based on our categorization criteria, 17.3% of the first graders and 14.1% of the
second graders were found to be at risk of dyslexia. Depending on the definition,
linguistic system, and the stringency of the criteria used, in western populations the
prevalence of developmental dyslexia varies between 5 and 10%, and up to 17.5%
for English speakers (Gilger, Pennington, & De Fries, 1991; Habib, 2000; Shaywitz,
1998). In Finnish, another very transparent orthography, the prevalence rate for
adult speakers was estimated at around 6% (Lyytinen, Leinonen, Nikula, Aro, &
Leiwo, 1995). It is important to bear in mind that the children that were labeled as
Towards identifying dyslexia in Standard Indonesian: the… 1747
123
being at risk of dyslexia in our sample may indeed have been behind in reading,
decoding, and/or spelling, but may not necessarily be dyslexic or develop dyslexia
in the future. We base our criteria solely on the IDA’s definition of a dyslexia
diagnosis, which does not necessarily require an explanation to be provided for the
actual reading and spelling problems experienced. The reading-related cognitive
tasks (i.e., phoneme deletion, RAN, digit span, and verbal fluency) can therefore
provide valuable information to support the diagnostic process as they can help
establish whether the child indeed has a dyslexia-specific cognitive profile, which,
in turn, might explain the literacy problems when they are unexpected in relation to
the student’s other cognitive and learning abilities (similar to the Dutch Protocol for
Diagnostics and Treatment of Dyslexia, Nationaal Referentiecentrum Dyslexie,
2013). Moreover, we have found in the regression analysis that the automaticity
component (component 1) significantly predicts reading in grade 1 and reading and
decoding in grade 2. This is an indication that automaticity or naming speed as with
the task we used, has an impact on reading competence for early readers of SI.
We hope that with this comprehensive first study we have provided a starting point
for future dyslexia research in Indonesia. Of course, our study is limited in that the
sample consisted of students from one elementary school based in one of Indonesia’s
many cities, while there aremany other ethnic groups in other regions that do not speak
SI as their first language. As such, the scores we acquired and the norm scores we
computed may not be representative of young learners of SI in other regions.
Additionally, the size of the sample is also limited to the school investigated. To collect
more and more general normative data, the test battery needs to be applied in other
parts of the country and other ethnic groups of different socio-economic backgrounds.
If these evaluationswere to generate inconsistent results, the test batterywould require
modification. Moreover, it would be recommended to further investigate other factors
that could have contributed to the lower scores attained by the at-risk children, such as
SES, parents’ educational levels, and school attendance of the child. Given the strong
indications of a genetic component in dyslexia, additional data on reading and spelling
difficulties among parents and siblings may also provide valuable information.
Nonetheless, the overall profile of test scores we obtained suggests that the tests yield
valid measures of reading acquisition and dyslexia, while the phoneme deletion and
RAN tasks as well as the spelling and OCT tests appear to provide useful information
to better interpret the reading and decoding fluency outcomes. However, as mentioned
before, the difficulty level of the latter two tests may need to be adjusted for
implementation in higher grades. It would also be interesting to see whether the
addition of a silent reading test (assessing silent reading fluency) would generate
further useful information. Finally, we recommend to always include both individual
teacher ratings and school grades in the final diagnosis as our results showed
significant differences between the typical and the at-risk-of-dyslexia readers on both
variables that supported the test results of the reading assessment battery.
Acknowledgements The first author is supported by an Erasmus Mundus Grant for the International
Doctorate for Experimental Approaches to Language and Brain’ (IDEALAB) by the European Commission
(GrantNumber\2012–1713/001–001-EMIIEMJD[).The projectwas fundedby the IndonesianDirectorate
of Higher Education’s Competitive Research Funds which was awarded to the Institute for Research and
Academic Publications, Tarumanagara University, Jakarta. The authors thank the STS Research Group of
1748 B. A. J. Jap et al.
123
Tarumanagara University (Jakarta, Indonesia) and its members Sri Tiatri, Tjibeng Jap, Meilani Kumala and
Chysanti Arumsari for providing access to the schools and assisting during data collection.
Compliance with ethical standards
Conflict of interest There is no conflict of interest.
Open Access This article is distributed under the terms of the Creative Commons Attribution 4.0
International License (http://creativecommons.org/licenses/by/4.0/), which permits unrestricted use, dis-
tribution, and reproduction in any medium, provided you give appropriate credit to the original author(s)
and the source, provide a link to the Creative Commons license, and indicate if changes were made.
Appendix 1
See Table 7.
Appendix 2
See Table 8.
Table 7 Grade 1 factor
analyses using varimax rotation
Reading and decoding fluency
are excluded for regression
analysis
Factor loadings \0.30 are
suppressed
Component
1 2 3
Writing 0.770
OCT 0.709
TTR 0.569
Digit span-F 0.360 0.719
Verbal fluency 0.397 −0.663
Phoneme deletion 0.624
RAN digits 0.905
RAN letters 0.796
RAN colors 0.882
Table 8 Grade 2 factor
analyses using varimax rotation
Reading and decoding fluency
are excluded for regression
analysis
Factor loadings \0.30 are
suppressed
Component
1 2 3
Writing 0.784
OCT 0.439 0.693
TTR 0.573 0.324
Digit span-F 0.645 −0.432
Verbal fluency 0.520
Phoneme deletion 0.803
RAN digits 0.896
RAN letters 0.727 0.361
RAN colors 0.815
Towards identifying dyslexia in Standard Indonesian: the… 1749
123
References
Cohen, M. J., Morgan, A. M., Vaughn, M., Riccio, C. A., & Hall, J. (1999). Verbal fluency in children:
Developmental issues and differential validity in distinguishing children with attention-deficit
hyperactivity disorder and two subtypes of dyslexia. Archives of Clinical Neuropsychology, 14(5),433–443.
De Jong, P. F., & Van der Leij, A. (1999). Specific contributions of phonological abilities to early reading
acquisition: Results from a Dutch latent variable longitudinal study. Journal of EducationalPsychology, 91(3), 450–476.
De Jong, P. F., & Van der Leij, A. (2002). Effects of phonological abilities and linguistic comprehension
on the development of reading. Scientific Studies of Reading, 6(1), 51–77.De Vos, T. (1992). Tempo Test Rekenen (TTR) [Arithmetic number fact test]. Nijmegen: Berkhout.
Dewi, F. (2003). Membaca menulis (13th ed., Vol. 1). Semarang: Mandira.
Ehri, L. C. (2005). Learning to read words: Theory, findings and issues. Scientific Studies of Reading, 9(2), 167–188.
Frederick, W. H., & Worden, R. L. (2011). Indonesia: A country study. Washington, DC: Federal
Research Division, Library of Congress. https://www.loc.gov/item/2011038834/.
Georgiou, G., Parrila, R., & Papadopoulos, T. C. (2008). Predictors of word decoding and reading fluency
in English and Greek: A cross-linguistic comparison. Journal of Educational Psychology, 100(3),566–580.
Gilger, J. W., Pennington, B. F., & De Fries, J. C. (1991). Risk for reading disabilities as a function of
parental history of learning problems: Data from three samples of families demonstrating genetic
transmission. Reading and Writing, 3(3–4), 205–217.Gomez, C., & Reason, R. (2002). Cross-linguistic transfer of phonological skills: a Malaysian
perspective. Dyslexia, 8(1), 22–33.Gough, P., & Tunmer, W. (1986). Decoding, reading and reading disability. Remedial and Special
Education, 7(1), 6–10.Habib, M. (2000). The neurological basis of developmental dyslexia. An overview and working
hypothesis. Brain, 123(12), 2373–2399.Holopainen, L., Ahonen, T., & Lyytinen, H. (2001). Predicting delay in reading achievement in a highly
transparent language. Journal of Learning Disabilities, 34(5), 401–413.Hoover, W. A., & Gough, P. B. (1990). The simple view of reading. Reading and Writing, 2(2), 127–160.Landerl, K., Wimmer, H., & Frith, U. (1997). The impact of orthographic consistency on dyslexia: A
German-English comparison. Cognition, 63, 315–334.Lee, W. L. (2008). Development and validation of a reading-related assessment battery in Malay for the
purpose of dyslexia assessment. Annals of Dyslexia, 58(1), 37–57.Lewis, M. P., Simons, G. F., & Fennig, C. D. (Eds.). (2013). Ethnologue: Languages of the world
(Seventeenth ed.). Dallas, TX: SIL International.
Lovett, M. W., Steinbach, K. A., & Frijters, J. C. (2000). Remediating the core deficits of developmental
reading disability: A double-deficit perspective. Journal of Learning Disabilities, 33(4), 334–358.Lovio, R., Halttunen, A., Lyytinen, H., Naatanen, R., & Kujala, T. (2012). Reading skill and neural
processing accuracy improvement after a 3-hour intervention in preschoolers with difficulties in
reading-related skills. Brain Research, 1448, 42–55.Lyon, G. R., Shaywitz, S. E., & Shaywitz, B. A. (2003). A definition of dyslexia. Annals of dyslexia, 53
(1), 1–14.
Lyytinen, H., Erskine, J., Kujala, J., Ojanen, E., & Richardson, U. (2009). In search of a science-based
application: A learning tool for reading acquisition. Scandinavian Journal of Psychology, 50(6), 668–675.Lyytinen, H., Leinonen, S., Nikula, M., Aro, M., & Leiwo, M. (1995). In search of the core features of
dyslexia: Observations concerning dyslexia in the highly orthographically regular Finnish language.
In V. W. Berninger (Ed.), The varieties of orthographic knowledge II: Relationships to phonology,reading, and writing (pp. 177–204). Dordrecht: Kluwer Academic Publishers.
Moeliono, A. M., & Dardjowidjojo, S. (Eds.). (1988). Tata bahasa baku bahasa Indonesia. RepublikIndonesia: Departemen Pendidikan dan Kebudayaan.
Nationaal Referentiecentrum Dyslexie. (2013). Protocol Dyslexie Diagnostiek en Behandeling 2.0.[Protocol for Diagnotics and Treatment of Dyslexia 2.0] (original edition Blomert, L., 2006). http://
www.nrd.nu/images/downloads/protocol_dyslexie_%20diagnostiek_en_behandeling_2.0.pdf.
Accessed March 17, 2016.
1750 B. A. J. Jap et al.
123
Nichols, J., & Bickel, B. (2013). Locus of marking: Whole-language typology. In M. S. Dryer & M.
Haspelmath (Eds.), The world atlas of language structures. Munich: Max Planck Digital Library.
Peterson, R. L., & Pennington, B. F. (2012). Developmental dyslexia. Lancet, 379(9830), 1997–2007.Prentice, D. J. (1987). Malay (Indonesian and Malaysian). In B. Comrie (Ed.), The world’s major
languages. London: Croom Helm.
Rack, J. P., Snowling, M., & Olson, R. K. (1992). The nonword reading deficit in developmental dyslexia:
A review. Reading Research Quarterly, 27(1), 29–53.Raven, J. C., & Court, J. H. (1962). Coloured progressive matrices. London: HK Lewis.
Shaywitz, S. E. (1998). Dyslexia. New England Journal of Medicine, 338(5), 307–312.Shaywitz, S. E., Morris, R., & Shaywitz, B. A. (2008). The education of dyslexic children from childhood
to young adulthood. Annual Review of Psychology, 59, 451–475.Sneddon, J. (2003). The Indonesian language: Its history and role in modern society. Sydney: University
of New South Wales.
Snowling, M. J. (1995). Phonological processing and developmental dyslexia. Journal of Research inReading, 18(2), 132–138.
Tilanus, E. A. T., Segers, E., & Verhoeven, L. (2013). Diagnostic profiles of children with developmental
dyslexia in a transparent orthography. Research in Developmental Disabilities, 34(11), 4194–4202.Torgesen, J. K., Wagner, R. K., Rashotte, C. A., Burgess, S., & Hecht, S. (1997). Contributions of
phonological awareness and rapid automatic naming ability to the growth of word-reading skills in
second-to fifth-grade children. Scientific Studies of Reading, 1(2), 161–185.Trenta, M., Benassi, M., Di Filippo, G., Pontillo, M., & Zoccolotti, P. (2013). Developmental dyslexia in
a regular orthography: Can the reading profile be reduced to strategic control? CognitiveNeuropsychology, 30(3), 147–171.
Tressoldi, P. E., Stella, G., & Faggella, M. (2001). The development of reading speed in Italians with
dyslexia: A longitudinal study. Journal of Learning Disabilities, 34(3), 414–417.Vaessen, A. A., & Blomert, L. (2010). Long-term cognitive dynamics of fluent reading development.
Journal of Experimental Child Psychology, 105(3), 213–231.Van den Bos, K. P. (2003). Snel Serieel Benoemen; Experimentele versie. Groningen: Rijksuniversiteit
Groningen.
Van der Leij, A., Van Bergen, E., Van Zuijen, T., De Jong, P., Maurits, N., & Maassen, B. (2013).
Precursors of dyslexia: An overview of the longitudinal Dutch dyslexia program study. Dyslexia, 19(4), 191–213.
Wagner, R. K., & Torgesen, J. K. (1987). The nature of phonological processing and its causal role in the
acquisition of reading skills. Psychological Bulletin, 101(2), 192–212.Wechsler, D. (1974). Wechsler intelligence scale for children, revised: WISC-R; manual. New York:
Psychological Corporation.
Wimmer, H. (1993). Characteristics of developmental dyslexia in a regular writing system. AppliedPsycholinguistics, 14(1), 1–33.
Winskel, H., & Lee, L. W. (2013). Learning to read and write in Malaysian/Indonesian: A transparent
alphabetic orthography. In H. Winskel & P. Padakannaya (Eds.), South and Southeast Asianpsycholinguistics. Cambridge: Cambridge University Press.
Winskel, H., & Widjaja, V. (2007). Phonological awareness, letter knowledge, and literacy development
in Indonesian beginner readers and spellers. Applied Psycholinguistics, 28(1), 23–45.Ziegler, J. C., & Goswami, U. (2005). Reading acquisition, developmental dyslexia, and skilled reading
across languages: A psycholinguistic grain size theory. Psychological Bulletin, 131(1), 3–29.
Towards identifying dyslexia in Standard Indonesian: the… 1751
123