towards a more equal city from mobility to access for …
TRANSCRIPT

From Mobility to Access for All: Expanding Urban Transportation Choices in the Global South
Working Papers contain preliminary research, analysis, findings, and recommendations. They are circulated to stimulate timely discussion and critical feedback and to influence ongoing debate on emerging issues. Most working papers are eventually published in another form, and their content may be revised.
CONTENTSExecutive Summary ....................................................1
Abbreviations ..............................................................7
1. Increasing Motorization and Declining Accessibility ...........................................7
2. The Challenge for Sustainable Cities: Equitable Access to Opportunities .................... 11
3. Confronting the Challenge of Accessible Cities ................................................. 16
4. Enabling Conditions for More Accessible Cities: Governance and Funding ........................ 31
5. Conclusion: Choosing the Right Policy Package ........................................... 36
Endnotes .................................................................. 37
References ............................................................... 40
Acknowledgments ................................................... 48
Suggested citation: Venter, C., A. Mahendra, and D. Hidalgo. 2019. "From Mobility to Access for All: Expanding Urban Transportation Choices in the Global South." Working Paper. Washington, DC: World Resources Institute. Available online at www.citiesforall.org.
EXECUTIVE SUMMARY
Highlights ▸ Access to jobs, services, and people is key to a city’s economic
vitality and quality of life. Many cities are experiencing a decline in accessibility due to a confluence of rapid urbanization and motorization trends.
▸ New analysis of these trends in the global South shows that up to half of urbanites might experience restricted access, leading to either high travel burdens or exclusion from opportunities.
▸ Lack of access afflicts both low-income communities scattered throughout the city and low- to medium-income people living in suburbs and peripheral settlements who use private cars and motorcycles on long, congested commutes.
▸ This paper argues that more-accessible cities stand the best chance of solving the problems of deteriorating environmental quality and economic competitiveness that result from growing traffic congestion and urban sprawl.
▸ We highlight three priorities to address these challenges: rethinking the role of streets and whom they serve, shifting from individual transport modes towards an integrated network of multimodal user-oriented services, and tempering the demand for private vehicle use. Capable governance and leadership, along with durable funding models for transportation, can help enable these priority actions.
Christo Venter, Anjali Mahendra, and Dario Hidalgo
From Mobility to Access for All: Expanding Urban Transportation
Choices in the Global South
WORKING PAPER
TOWARDS A MORE EQUAL CIT Y

2 |
Access to Opportunities Depends on Good TransportationMany urban dwellers in the global South face travel conditions that limit their ability to lead healthy and productive lives. For many, traveling to work, to school, to see healthcare providers, or to engage in social activities requires long or unsafe walks, long waits between poorly connected services in inconvenient locations, or expensive trips in uncomfortable and unsafe vehicles. We define these residents as the under-served: those who face restricted access to opportunities either because of their poor locations relative to activities and services, as a result of poor transport, or both. However, these conditions affect not only the poor who travel by foot or public transport but also many middle-income car and motorcycle users facing rapidly growing traffic congestion on overcrowded roads. Others, particularly affluent car users who live in central urban locations, enjoy much better travel conditions, but impose on society unsustainable costs related to congestion, safety, emissions, and air pollution. This basic inequality in the ability to reach urban opportunities constrains a city’s ability to grow in ways that are socially just, environmentally sustainable, and economically robust.
The problems of the under-served are exacerbated by a confluence of two trends: urbanization and motorization. Cities will add about 2.5 billion more people within the next three decades, of which more than 90 percent will live in Asia and Africa, where much economic growth is yet to occur.1 At the same time, many cities are experiencing rapid growth in car and motorcycle ownership as incomes rise. In 2010 there were 2.5 new motor vehicle registrations for every child born in Latin America;2 there were three new vehicle registrations for every birth in India.3 City governments respond by turning to car-based development and investing in road capacity while neglecting other modes of transport. The situation is worsened by urban growth practices that allow peripheral growth of suburbs and informal settlements—either as a matter of policy or through uncontrolled urban expansion—and leave large areas without adequate roads and public transport services, hampering accessibility. Car-oriented development patterns entrench private vehicle use, locking some residents into car and motorcycle dependency and its high social costs in the long run, even if demand for alternative modes might exist.
About This PaperThis working paper is part of a series of papers comprising the World Resources Report (WRR) Towards a More Equal City, which views sustainability as composed of three interrelated issues: equity, the economy, and the environment. The WRR examines whether the equitable provision of urban services to meet the needs of the under-served can improve the other two dimensions of sustainability. Each paper focuses on actionable solutions that have been proven to work across cities of the global South. The key enabling factors that support these actions are also discussed.
This paper asks what cities can do to change the trajectory of the urban transportation sector so that it provides the under-served with more equitable access to opportunities. We argue that in addition to being more equitable, cities that are built to be more accessible to all stand the best chance of solving the problems of deteriorating environmental quality and economic competitiveness that stem from growing traffic congestion and urban sprawl.
The paper identifies specific actions for promoting multimodal accessibility that are grouped into three action areas: building complete, democratic, and safe street networks;4 integrating public, informal, and private modes into an ecosystem of high quality, user-oriented transport services; and managing the demand for private vehicle use. These actions need to be tailored in scale, pace, and timing to the nature and size of a city’s particular problems. Two cross-cutting conditions are needed to enable effective action: capable and visionary governance and planning institutions need to be nurtured; and sustainable and adequate funding models must be developed.
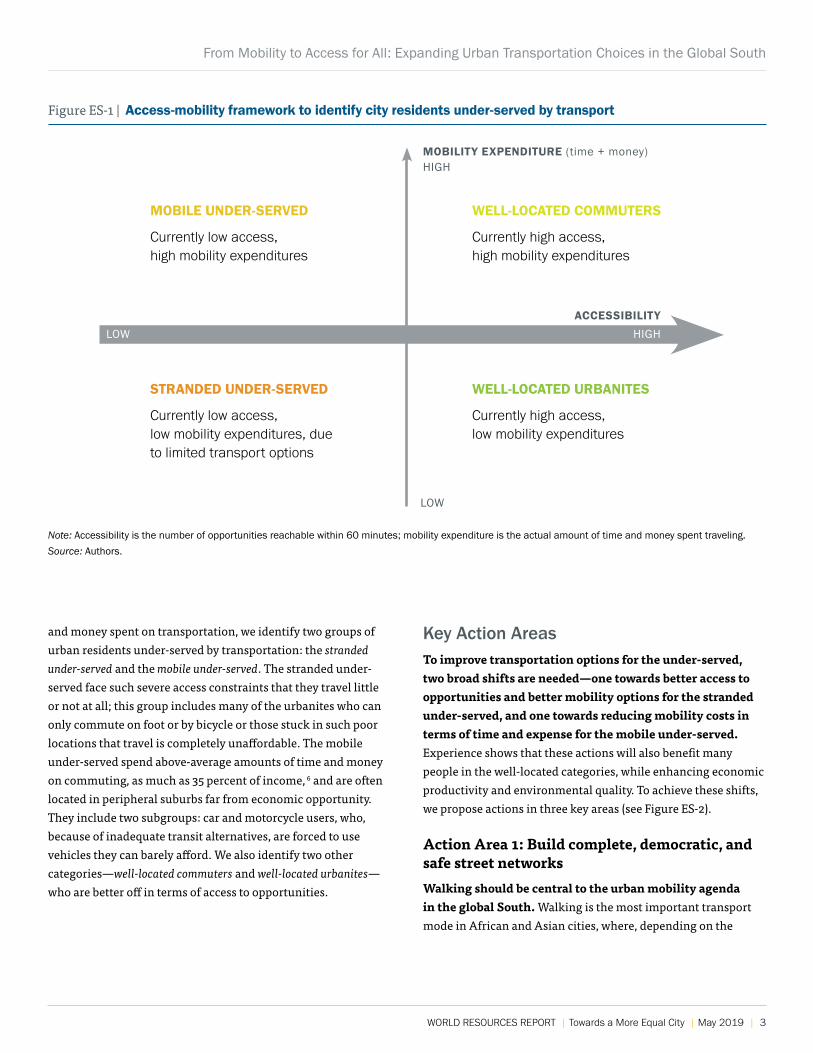
Understanding the Transportation Challenges of the Under-servedWe examine Johannesburg and Mexico City as illustrative case studies of the transportation problems facing the under-served. Using access to jobs as a proxy for access to opportunities more broadly, we estimate that 42 percent and 56 percent of urbanites in Johannesburg and Mexico City, respectively, are under-served in terms of their ability to reach job locations. Using a novel access-mobility framework5 (see Figure ES-1) that examines accessibility levels along with time
WORLD RESOURCES REPORT | Towards a More Equal City | May 2019 | 3
From Mobility to Access for All: Expanding Urban Transportation Choices in the Global South
and money spent on transportation, we identify two groups of urban residents under-served by transportation: the stranded under-served and the mobile under-served. The stranded under-served face such severe access constraints that they travel little or not at all; this group includes many of the urbanites who can only commute on foot or by bicycle or those stuck in such poor locations that travel is completely unaffordable. The mobile under-served spend above-average amounts of time and money on commuting, as much as 35 percent of income, 6 and are often located in peripheral suburbs far from economic opportunity. They include two subgroups: car and motorcycle users, who, because of inadequate transit alternatives, are forced to use vehicles they can barely afford. We also identify two other categories—well-located commuters and well-located urbanites—who are better off in terms of access to opportunities.
Key Action AreasTo improve transportation options for the under-served, two broad shifts are needed—one towards better access to opportunities and better mobility options for the stranded under-served, and one towards reducing mobility costs in terms of time and expense for the mobile under-served. Experience shows that these actions will also benefit many people in the well-located categories, while enhancing economic productivity and environmental quality. To achieve these shifts, we propose actions in three key areas (see Figure ES-2).
Action Area 1: Build complete, democratic, and safe street networksWalking should be central to the urban mobility agenda in the global South. Walking is the most important transport mode in African and Asian cities, where, depending on the
LOW
ACCESSIBILITY
Note: Accessibility is the number of opportunities reachable within 60 minutes; mobility expenditure is the actual amount of time and money spent traveling.Source: Authors.
Figure ES-1 | Access-mobility framework to identify city residents under-served by transport
MOBILE UNDER-SERVED
Currently low access, high mobility expenditures
STRANDED UNDER-SERVED
Currently low access, low mobility expenditures, due to limited transport options
WELL-LOCATED COMMUTERS
Currently high access, high mobility expenditures
WELL-LOCATED URBANITES
Currently high access, low mobility expenditures
HIGHMOBILITY EXPENDITURE (time + money)
LOW HIGH

4 |
city, typically between 35 and 90 percent of trips are made on foot.7 Priority actions include addressing the lack of all-weather paved roads in new neighborhoods, and existing unplanned ones, as such roads are often a crucial first step in providing access to jobs, destinations, and other urban amenities. By democratic streets, we mean streets that are accessible to all users. Street designs should aim to provide adequate and safe space for pedestrians, bicyclists, and other nonmotorized travelers—who are often the most vulnerable people, including children, the elderly, and people with disabilities—rather than only accommodating higher-speed motorized traffic. Physical measures, such as wide, well-lit, and well-drained sidewalks, are important for reducing conflicts between people and vehicles on higher-speed roads. On lower-speed streets and road crossings where conflicts are unavoidable, traffic calming is useful for reducing vehicle speeds to below the threshold of 35 kilometers per hour (kmh), at which point accidents become less frequent and severe.8 The engineering know-how exists to achieve these measures; what is lacking is a combination of political support and community activism to help cities identify and implement them.
Complete street principles require that road space should, on selected arterials and motorways, be reallocated to public transport vehicles. These need not be full-scale bus rapid transit (BRT) or light rail systems; a range of less expensive options—including bus lanes, queue bypass lanes at intersections, and dedicated boarding areas—can be effective, as long as they are planned as part of a network in lockstep with citywide upgrading of public transport alternatives. Priority infrastructure not only improves accessibility for the under-served who use public transport but is also among the few sustainable solutions to the severe congestion confronting the under-served who must depend on private vehicles.
Action Area 2: Develop an ecosystem of integrated, user-oriented transport servicesCities can reap substantial benefits if they piece together a user-oriented, multimodal transport network. Networks are created by connecting existing formal public transport and informal transport modes with fast-growing private transport services that offer shared services and taxi- and ride-hailing alternatives. Specific strategies include building integrated, pedestrian-friendly transfer facilities; reorganizing bus and informal transit routes so they better connect to fixed-route
public systems; and promoting integrated fare-payment solutions to reduce the cost of transferring between systems. Technology can also help improve multimodal efficiency and user experience. New transport models based on open data, shared vehicle ownership, and digital solutions are fundamentally reshaping the mobility environment, and cities should embrace the opportunity to maximize their benefits for all by partnering with the providers of these new mobility services. Demonstrated early wins include cashless ticketing using mobile phones as a way to improve passenger security and reduce transfer costs, and ride-matching and e-hailing services to improve the first/last mile connectivity of formal transit.
Cities need to recognize informal transit or paratransit operators in transport policy and proactively engage them to pursue operational reform. While they provide much-needed mobility and reasonably serve user needs, informal buses and minibuses generally have poor safety records and are not well suited to dense city centers and corridors. No single, clear path has emerged for modernizing or including informal operators in a centrally planned system. However, several short-term measures have reaped benefits for cities, including investing in dedicated infrastructure and transfer locations, changing concessions and service agreements, and training and supporting informal operators.
Game-changing investments play a crucial role in higher-quality formal public transport with dedicated infrastructure, including rail and bus rapid transit systems. Many cities in the global South are moving in this direction to reduce the travel burdens of the mobile under-served. Almost 100 cities in Asia, Africa, and Latin America have already built Bus Rapid Transit systems or enhanced bus corridors with priority lanes.9 It is important that routes are planned to serve communities across a range of income levels from the start, to allow high-income travelers to subsidize some measure of low-income travelers’ expenses. Low-income communities should not be excluded because of poor service coverage and high fares.
Action Area 3: Manage the demand for private vehicle useCities can only make sustainable headway towards equitable access if they manage the demand for private vehicle use. Private car and motorcycle use is systematically underpriced, which translates into a de facto subsidy by all taxpayers for a mode of transport used by a minority of residents. Road pricing

WORLD RESOURCES REPORT | Towards a More Equal City | May 2019 | 5
From Mobility to Access for All: Expanding Urban Transportation Choices in the Global South
Figure ES-2 | Priority actions and enabling conditions for expanding transportation choices in the global South
Source: Authors.
ACTION AREA 1: Build complete, democratic, and safe street networks
▸ Complete street networks
▸ Democratize streets by reprioritizing road space
▸ Improve pedestrian safety and security
ACTION AREA 2: Develop an ecosystem of integrated, user-oriented transport services
▸ Connect existing services into an integrated multimodal network
▸ Invest in priority public transport infrastructure
▸ Proactively upgrade and integrate informal operators
▸ Harness technology to improve productivity and the user experience
ACTION AREA 3: Manage the demand for private vehicle use
▸ Discourage private vehicle use in dense city cores
▸ Price car use and parking
▸ Promote shared mobility solutions
▸ Ensure new development is either transit-oriented or has potential to be well-served by public transport
ENA
BLI
NG
C
ON
DIT
ION
S
Capable, visionary governance and planning institutions
EQUITABLE ACCESS TO OPPORTUNITIES
Adequate and sustainable funding
BUS LANE
BUS
METRO
6 |
where motorists pay charges to reflect the social costs of private vehicle use is a proven remedy for this issue, as demonstrated in cities like London, Singapore, and Stockholm. However, more efficiently pricing private vehicle use is politically very difficult to achieve where political will and public acceptance of such policies remain lacking. Reforming parking rules and pricing is potentially a more effective strategy that can simultaneously address several problems related to equitable access as seen in San Francisco and Paris. It can restrain car use, generate revenue to support sustainable alternatives, and promote walking and cycling by freeing up sidewalk space according to complete street principles. Regulatory options to limit car use in dense urban areas, such as car-restraint schemes seen in multiple Latin American cities, can provide temporary congestion relief, but these need to be complemented by extensive transit investment to avoid reducing overall accessibility. Emerging shared mobility solutions, such as car sharing, bike sharing, and app-based ride matching can help delay or prevent vehicle ownership among medium-income commuters in the mobile under-served category while improving their access, especially in areas under-served by public transport.
City policies need to push for urban land development that is transit oriented, potentially well served by public transport, or near economic opportunities. Together with investments in good quality transit and excellent urban design, well-located affordable housing and more walkable, mixed-use environments provide opportunities to meet future urban growth needs more equitably and sustainably. Cities like Johannesburg and Bogotá have implemented such strategies. Ensuring the availability of affordable land in environmentally secure and well-connected locations helps improve access for the under-served who cannot afford to live in more-accessible locations.10
Enabling Conditions for More Accessible CitiesCapable, visionary governance and planning institutions are essential for more-equitable, sustainable land use and transport systems. Leaders need to articulate a long-term vision because change often challenges the short-term political interests of powerful city residents who are already well served. Leaders also need support from strong public sector institutions
that have technical competence and continuity. An effective strategy is to build a dedicated and empowered multimodal transport authority that has a mandate to plan, fund, and oversee the metropolitan-wide transportation system.
When institutions are strengthened, they can better enable effective, integrated public sector planning that can coordinate between the many entities involved in urban management. These include spatial planning, development control, housing, economic development, and infrastructure departments or agencies. The capacity to control and direct urban expansion must be significantly strengthened; doing so can ensure appropriate densification along high-accessibility nodes and corridors and contain urban sprawl. Many cities with limited governance capacity find it very challenging to manage and enforce land use, but timely and appropriate investments in roads and sustainable transport systems is one way to leverage private sector investments towards a more efficient urban form.
Achieving more-accessible cities requires funding—another area where new thinking is essential. Cities need to grow the funding available for transport and make wiser decisions about how to invest it. Conventional funding sources, which include grants, loans, and subsidies from central governments and funding agencies, may help pay for infrastructure but are often politically uncertain and unable to cover ongoing maintenance and operations costs. New funding strategies could include charging users for private vehicle use, accessing climate finance, and partnering with property developers to share the benefits of increased land value following transport investments. Instruments such as development fees, joint developments, and property taxes have been very successful for funding transit investments in Latin American countries, China, India, and elsewhere.
Wiser investment strategies prioritize projects that reduce funding shortfalls over time. All of the actions described in this paper have this potential because sustainable and equitable transport can generate benefits for cities in terms of overall productivity, safer and healthier environments, and social betterment. Projects that provide alternatives to car-dependent development help cities by avoiding the high costs of congestion, and they ultimately lead to higher economic productivity and larger tax revenues that can be reinvested to achieve more-livable and more- equitable cities.

WORLD RESOURCES REPORT | Towards a More Equal City | May 2019 | 7
From Mobility to Access for All: Expanding Urban Transportation Choices in the Global South
1. INCREASING MOTORIZATION AND DECLINING ACCESSIBILITY
People live in cities to have access—access to livelihood opportunities, to education and personal development, to the cultural and intellectual vibrancy that is created by large agglomerations of people. In turn, city economies thrive on being accessible; businesses gain access to customers and employers gain access to large labor pools, driving improvements in productivity and competitiveness. Without accessibility, cities could not function.
Yet many rapidly growing cities around the world, especially those in the global South, have been experiencing declining accessibility. As cities expand and traffic becomes more congested, many urbanites are spending increasing amounts of time and money traveling to their destinations. This imposes huge costs on cities. Estimates of the value of time lost in congestion range between 2 and 5 percent of gross domestic product (GDP) in Asia and up to 10 percent of GDP in Beijing and São Paulo.11 Declining environmental quality resulting from vehicular air pollution is a related concern. It is estimated that air pollution kills about 3 million people worldwide each year, significantly adding to health care costs and wider environmental degradation.12
This situation is likely to worsen, driven by the confluence of two trends: urbanization and motorization. Between 1990 and 2015 the urban footprint of cities in less-developed countries increased 3.5 times on average, whereas their densities declined at an annual rate of 2.1 percent—faster than the decline in more-developed countries.13 Cities will add about 2.5 billion additional people within the next three decades, of whom more than 90 percent will live in Asia and Africa.14 More and more people need to move around daily; yet many cities are turning to low-capacity, inefficient transport modes, driven by growth in personal incomes and private vehicle ownership. In 2010 there
Abbreviations
BRT bus rapid transit
GIS geographic information system
GPS global positioning system
HCV heavy commercial vehicle
IPT intermediate public transport
ITS intelligent transportation systems
JNNURM Jawaharlal Nehru National Urban Renewal Mission
LCV light commercial vehicle
NMT nonmotorized transport
SACCO savings and credit cooperative organization
SUV sport-utility vehicle
TOD transit-oriented development
WRR World Resources Report
were 2.5 new motor vehicle registrations for every child born in Latin America;15 there were 3 new registrations for every birth in India.16 Motorized two-wheelers (motorcycles, mopeds, and scooters) make up large portions of this mix, accounting for almost half of all vehicles in the Philippines, over 70 percent in India, and an estimated 97 percent in Vietnam.17
City governments commonly respond to the pressures of increasing motorization by allocating more funding to expand road capacity, build overpasses or flyovers, and subsidize parking lots.18 But instead of relieving congestion, such plans tend to lead to more traffic and worsening congestion, reflecting the “triple convergence” principle, which states that people respond

8 |
to added road capacity by driving more.19 Estimates of public investment in urban transportation under the Indian national government’s 2011 Jawaharlal Nehru National Urban Renewal Mission (JNNURM) program illustrate how public budgets are often skewed towards the car-using minority and underinvest in modes used by the majority of travelers, such as public transport, walking, and cycling. Cars and two-wheelers compose about 86 percent of vehicles but account for only 29 percent of trips, with 62 percent of the investment directed at these modes (see Figure 1).20 Walking, cycling, and public transport accounted for about two-thirds of trips made, but received only one-third of the transport funding.
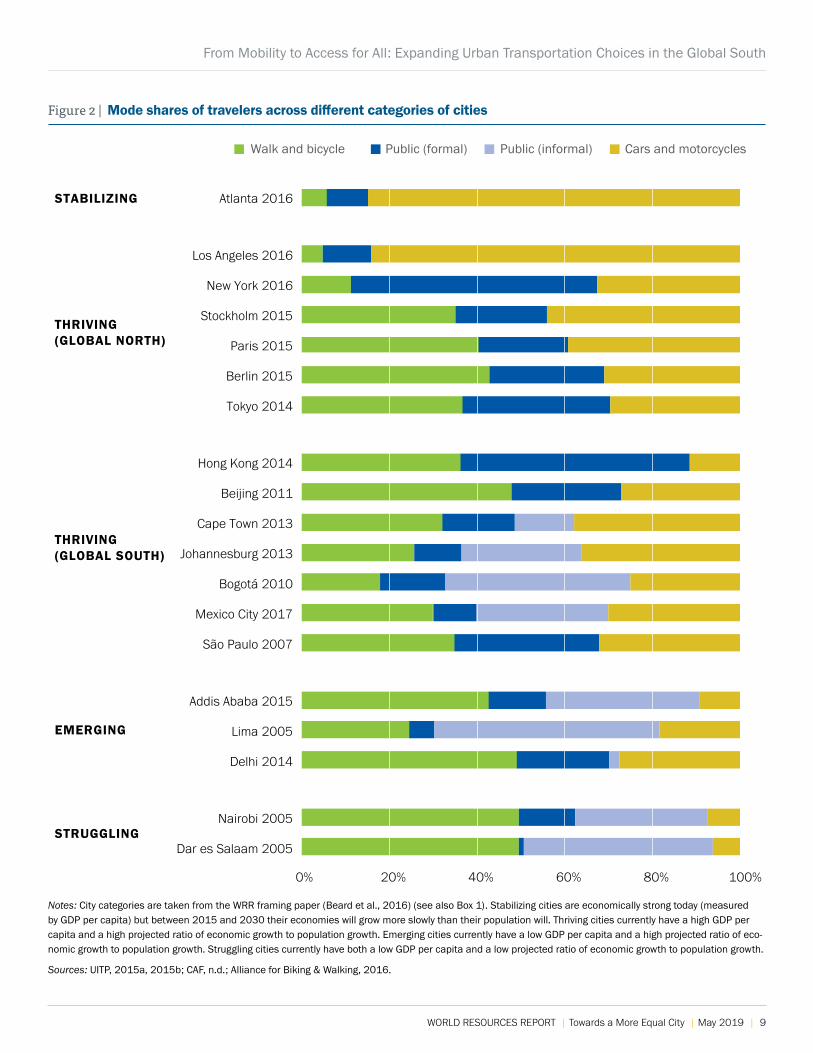
Traffic congestion also contributes to worsening equality in cities. It affects not only the high-income driver or middle-income motorcycle user but also penalizes the low-income bus passenger who faces ever longer commutes and the pedestrian who finds the sidewalk blocked by illegally parked cars. And because non-drivers are in the majority in most cities in the global South (see Figure 2), and because buses carry much larger numbers of people, the aggregate impact of congestion costs on lower-income people is significant. Prevailing land development
patterns further exacerbate inequality: lower-income people often live on the edge of a city, where land may be more affordable but where they face long, unsafe, and costly journeys on public transport or using informal modes.21 When traveling on foot or by bicycle, they are disproportionately exposed to traffic accidents and air pollution.22 In general, sprawling, car-oriented development patterns tend to degrade the availability and attractiveness of public transport, walking, and bicycling.23 Many city transport systems are thus developing in an inherently inequitable way.24 It is unlikely that the situation will improve under the current transport paradigm and the pressures arising from rapid urban growth.25
The use of different transport modes varies considerably across the globe (see Figure 2). Walking is the dominant mode in struggling, emerging, and thriving cities in Africa26 and Asia27 and constitutes between 10 and 35 percent of all trips in Latin American cities.28 Cycling mode shares are much lower, ranging from less than 1 percent in Africa to up to 21 percent in medium and large Indian cities.29 Informal or paratransit modes30 are particularly important in African and some Latin American cities, where they carry up to 95 percent of all public transport
Figure 1 | Mode shares, motorized vehicles, and transport investment in Indian cities
Note: IPT refers to "intermediate public transport," also referred to as informal transport (such as the auto rickshaws typically used in Indian cities); an SUV is a “sport-utility vehicle”; an HCV is a “heavy commercial vehicle”; and an LCV is a “light commercial vehicle.” JNNURM is the Jawaharlal Nehru National Urban Renewal Mission.
Sources: Mahendra et al., 2013; IIHS, 2011.
Mode Shares in Indian
Urban Areas (2008)
Motorized Vehicular
Composition in Indian
Urban Areas (2008)
Distribution of Transport Projects Under
JnNURM
Public Transport
27%
Two- wheeler72%
Car, SUV14%
Three-wheeler5%
LCV5%
Roads/Flyovers
57%
Parking5%
Other Urban Transport5%
Mass Rapid
Transport System
33%
HCV4%
Two-wheeler16%
Car13%
Cycle11%
IPT6%Walking
27%
WORLD RESOURCES REPORT | Towards a More Equal City | May 2019 | 9
From Mobility to Access for All: Expanding Urban Transportation Choices in the Global South
Figure 2 | Mode shares of travelers across different categories of cities
Notes: City categories are taken from the WRR framing paper (Beard et al., 2016) (see also Box 1). Stabilizing cities are economically strong today (measured by GDP per capita) but between 2015 and 2030 their economies will grow more slowly than their population will. Thriving cities currently have a high GDP per capita and a high projected ratio of economic growth to population growth. Emerging cities currently have a low GDP per capita and a high projected ratio of eco-nomic growth to population growth. Struggling cities currently have both a low GDP per capita and a low projected ratio of economic growth to population growth.
Sources: UITP, 2015a, 2015b; CAF, n.d.; Alliance for Biking & Walking, 2016.
0% 20% 40% 60% 80% 100%
Dar es Salaam 2005
Nairobi 2005
Delhi 2014
Lima 2005
Addis Ababa 2015
São Paulo 2007
Mexico City 2017
Bogotá 2010
Johannesburg 2013
Cape Town 2013
Beijing 2011
Hong Kong 2014
Tokyo 2014
Berlin 2015
Paris 2015
Stockholm 2015
New York 2016
Los Angeles 2016
Atlanta 2016
Walk and bicycle Public (formal) Public (informal) Cars and motorcycles
STABILIZING
THRIVING(GLOBAL NORTH)
THRIVING(GLOBAL SOUTH)
EMERGING
STRUGGLING
10 |
trips, but less so in Asian cities, where two-wheelers are more prevalent.31
How can cities address the challenge of reversing the decline in accessibility while simultaneously increasing economic productivity and improving environmental quality? This paper argues that cities of the global South can achieve this triple goal by improving travel conditions for the under-served. We start by offering a novel way of identifying the transport under-served as those residents who have restricted accessibility to destinations within the city. These are typically lower-income, spatially marginalized communities, but they may include higher-income private vehicle users who face severely congested roads. We contend that cities should reframe their vision of a successful
city from one that attempts to move more cars to one that provides more sustainable access for all residents, especially the under-served.
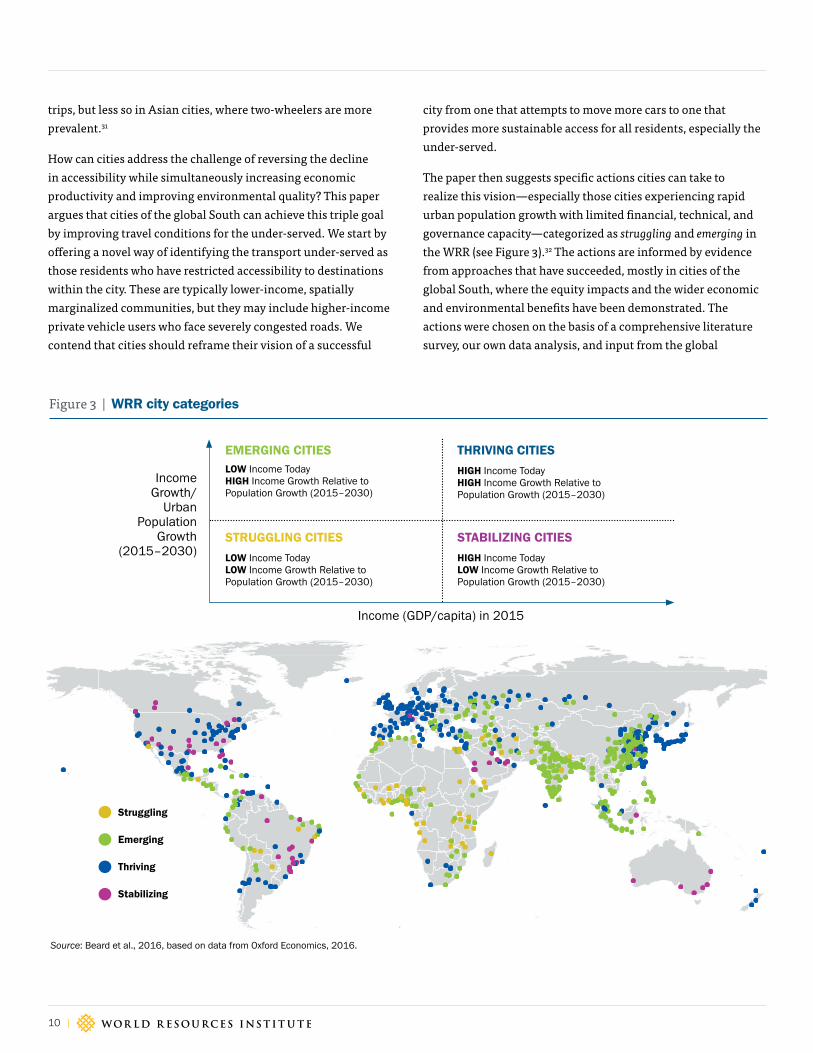
The paper then suggests specific actions cities can take to realize this vision—especially those cities experiencing rapid urban population growth with limited financial, technical, and governance capacity—categorized as struggling and emerging in the WRR (see Figure 3).32 The actions are informed by evidence from approaches that have succeeded, mostly in cities of the global South, where the equity impacts and the wider economic and environmental benefits have been demonstrated. The actions were chosen on the basis of a comprehensive literature survey, our own data analysis, and input from the global
Figure 3 | WRR city categories
Income Growth/
Urban Population
Growth (2015–2030)
Income (GDP/capita) in 2015
EMERGING CITIESLOW Income Today HIGH Income Growth Relative to Population Growth (2015–2030)
STRUGGLING CITIESLOW Income Today LOW Income Growth Relative to Population Growth (2015–2030)
THRIVING CITIESHIGH Income Today HIGH Income Growth Relative to Population Growth (2015–2030)
STABILIZING CITIESHIGH Income Today LOW Income Growth Relative to Population Growth (2015–2030)
Struggling
Emerging
Thriving
Stabilizing
Source: Beard et al., 2016, based on data from Oxford Economics, 2016.

WORLD RESOURCES REPORT | Towards a More Equal City | May 2019 | 11
From Mobility to Access for All: Expanding Urban Transportation Choices in the Global South
community of transport practitioners at WRI Ross Center, who have deep experience working on the ground in cities across the global South.
We recognize that urban mobility operates within a complex lattice of technical, institutional, and socioeconomic factors that vary from city to city and that problems and solutions will vary accordingly. The city-level actions we focus on here are also influenced by national and sometimes international policies that must be taken into account.33 Adding to the complexity is the fact that the urban transport sector is facing a number of external disruptions that will shape the choices cities have to make in coming decades. These include climate disruptions, the advance of digital technologies and their impacts on mobility, and the decarbonization of transport. While we do not focus on actions whose primary goals are technological efficiency (such as autonomous vehicles) or environmental quality (such as clean-fuel vehicles), many of them can provide opportunities for innovation that can further serve the equity-oriented goals we discuss, notwithstanding some risks that may emerge. For instance, replacing bus fleets with electric vehicles provides opportunities to upgrade bus services that serve poor and middle-income communities while reducing particulate pollution exposure.
2. THE CHALLENGE FOR SUSTAINABLE CITIES: EQUITABLE ACCESS TO OPPORTUNITIES
Why Is Accessibility of Central Importance?Accessibility is generally understood as the ease of reaching opportunities or destinations with a given transport system.34 It is a powerful concept, as it provides a way to talk about what people ultimately want from a transport system in terms of what it enables them to do and not just in terms of the amount of transport supply (e.g., kilometers of roads or bus routes) or of travel undertaken (e.g., kilometers traveled per day). Access is more than just the ability to travel or to get to a bus stop. An accessible transport system is one that enables people to reach jobs, clinics, and shops without having to undertake long and costly journeys.35 Accessibility is thus a function of both land use (i.e., the location of households and activities) and of the transport system in terms of the amount of time and money required to travel. Accessibility is increasingly being used to measure the benefits of transport and/or land-use strategies.
There is ample evidence that in cities, accessibility is not equally distributed: households located close to jobs and transit routes can be expected to enjoy much higher accessibility than those farther away.36 Having access to a car may enhance accessibility, but not if congestion significantly restricts travel speeds.37 While cities may not be able to provide every resident with the same level of access; however, access must not become so restricted that residents become unable to fully participate in city life. Of even greater concern is when lack of access predominates among vulnerable groups, including poor and marginalized communities, women, and children, limiting the very opportunities they need to overcome social exclusion and persistent poverty.38
How Can We Measure Equitable Access to Opportunities?This paper defines equity in terms of how accessibility is distributed across residents of a city.39 Accessibility can be measured in multiple ways and ideally should be measured for a range of opportunities, including accessibility to jobs, schools, health centers, food outlets, and green spaces. Since reliable spatial data on these various destinations are not available, we use only job destinations as an indication of access to economic opportunities. We measure accessibility here by counting the number of job opportunities (both formal and informal) that a person can reach from home within 60 minutes of travel time.40 Because this number varies depending on the mode used—people using faster transportation modes will have greater access from the same location—we take the mode most commonly used by each person into account.
We present the analysis of two illustrative case studies: Johannesburg, South Africa, and Mexico City, Mexico.41 Both are large primary cities in their respective regions, chosen to be broadly representative of the range of conditions faced in other parts of the global South. Data on the spatial distribution of people and jobs are obtained from official statistics sources for 2014 (Mexico City) and 2015 (Johannesburg). Data on the transport modes people in each zone use are obtained from citywide origin-destination surveys that were undertaken in 2017 in Mexico City (n=191,121) and in 2013 in Johannesburg (n=8,846).
We considered walking, public transport (both formal and informal transit), and car modes in our calculations—modes used by 90 percent of people in both cities. Less frequently used modes, such as bicycles, taxis, and motorcycles, are not

12 |
included. The public transport modes considered in Mexico City included metro, bus (including BRT), and informal transit (microbus); and in Johannesburg, commuter rail, bus (including BRT), and informal minibus taxis. The public transport travel time is the door-to-door time (including walking on both ends) following the fastest route from an origin to a destination. Travel times were estimated using Conveyal’s Analysis, a geographic information system (GIS)-based tool that uses actual transit routes and transfers provided by operators (for bus and rail) or collected by global positioning system (GPS) surveys (for informal microbus services). A car’s travel time to a destination is calculated using estimated congested road speeds and street
network data obtained from available transport models in each city. The walking time is estimated using an average walking speed of 4 kmh along the street network.
Figure 4 shows the distribution of accessibility levels on the vertical axis. The total number of jobs in the two cities are different, so to facilitate comparison we express accessibility as the percentage (rather than the absolute number) of total jobs within each city that are reachable within 60 minutes of travel time. The horizontal axis shows the percentage of residents enjoying a certain level of access (ordered from low to high) as a percentage of all residents.
Figure 4 | Unequal distribution of accessibility to jobs in Johannesburg and Mexico City
0%
20%
40%
60%
80%
100%
0% 10% 20% 30% 40% 50% 60% 70% 80% 90% 100%
Perc
enta
ge o
f Job
s Ac
cess
ible
in 6
0 m
inut
es
Percentage of Residents
Average access: Johannesburg = 49%
Johannesburg
Mexico City
Average access: Mexico City = 37%
In Johannesburg, 42% of residents have below-average access to jobs
In Mexico City, 56% of residents have below-average access to jobs
Source: Authors.

WORLD RESOURCES REPORT | Towards a More Equal City | May 2019 | 13
From Mobility to Access for All: Expanding Urban Transportation Choices in the Global South
expenditures reflect the extent to which people are actually able to make use of the access they have, or (conversely) the constraints preventing them from enjoying the benefits of better access.44 Both travel times and travel costs are taken into account when assessing mobility expenditures to reflect the tendency of cost-sensitive travelers to use cheaper but slower modes, such as walking. Therefore, people with either long travel times or high travel costs will have high mobility expenditure scores.
To calculate the mobility metric, we first isolate the most frequent trip reported by each person in the recent origin-destination surveys in each city; these are typically a work, education-related, or shopping trip. We then normalize the travel time and travel cost reported for this trip, relative to the average travel time and cost in each city, and take the maximum of these two normalized values to represent the highest of the time or cost expenditure for each person.
Results are aggregated for the city’s transport zones,45 with the size of each circle indicating the number of respondents in each zone, by mode used. Access and mobility indices are constructed such that a positive index indicates higher-than-average access or mobility expenditures; a negative index indicates below-average access or mobility expenditures. For instance, an access index of +0.5 indicates a traveler with 50 percent higher access to jobs than the average resident in that city. A traveler with a mobility expenditure index of +0.5 travels either 50 percent longer or spends 50 percent more money (or both) compared to the average in the city. To include people who did not travel on the survey day, we added a group called “nontravelers.” They were assigned the minimum mobility expenditure score of -1.0, and their access index reflects those of transit users in the same zone, on the assumption that they could have used transit if they chose to travel.
The results for Johannesburg and Mexico City are shown in Figure 5.
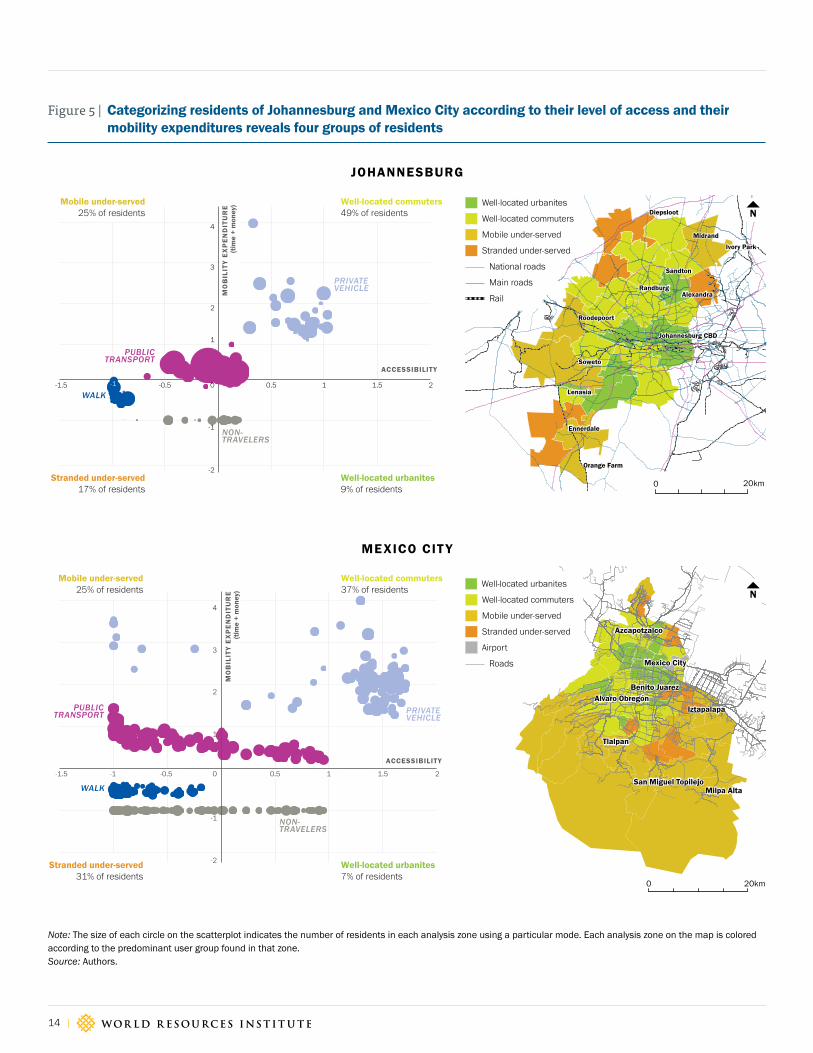
Accessibility is distributed unequally in both cities. In Johannesburg, only a little over 20 percent of sampled residents can access more than 60 percent of jobs within one hour. These superior access levels are mostly due to a combination of faster door-to-door travel times afforded by the use of private vehicles and to their central locations. The remainder of residents have lower access due to their peripheral locations and their dependence on walking and public transport.42
Mexico City displays different patterns of inequality in access. A larger proportion of respondents enjoy good access compared to Johannesburg: 33 percent of the sample have access to more than 60 percent of jobs within a one-hour commute. This is likely due to the presence of a larger central city population that has access to a good network of transit services concentrated in the central city (including metro, BRT, and informal transit). However, those with poor access are worse off, as indicated by the slow rise of the curve at low access levels. As a result, the average Mexico City resident has access to only 37 percent of jobs, as opposed to 49 percent of jobs in Johannesburg.
Who Is Under-served by Transport?Defining the transport under-served is difficult. They could be defined in terms of accessibility, as those urbanites whose access falls below a threshold level required for them to maintain a sufficient level of interaction with the urban economy.43 No such threshold has yet been quantified, so we define the under-served in relative terms as those with lower-than-average access in a city, using the same access measure as above: the number of jobs reachable within a 60-minute travel time by each person’s main mode. In the cases of Johannesburg and Mexico City, this amounts to 42 percent and 56 percent of the respective samples. To further unpack the variation among the under-served, we juxtapose accessibility with people’s mobility expenditures—the actual amount of time and money that people spend in order to reach their chosen destinations. Mobility or transport
14 |
Azcapotzalco
Mexico City
Benito Juarez
IztapalapaAlvaro Obregón
Tlalpan
San Miguel TopilejoMilpa Alta
Azcapotzalco
Mexico City
Benito Juarez
IztapalapaAlvaro Obregón
Tlalpan
San Miguel TopilejoMilpa Alta
0 7.5 15 22.5 303.75Kilometers
Diepsloot
AlexandraRandburg
Roodepoort
Johannesburg CBD
Soweto
Lenasia
Ennerdale
Orange Farm
Midrand
Ivory Park
Sandton
Diepsloot
AlexandraRandburg
Roodepoort
Johannesburg CBD
Soweto
Lenasia
Ennerdale
Orange Farm
Midrand
Ivory Park
Sandton
Figure 5 | Categorizing residents of Johannesburg and Mexico City according to their level of access and their mobility expenditures reveals four groups of residents
-1
-2
1
2
3
4
-1.5 -1 -0.5 0.5 1 1.5 2
ACCESSIBILITY
0
NON-TRAVELERS
PRIVATEVEHICLE
WALK
PUBLICTRANSPORT
Well-located commuters49% of residents
Stranded under-served17% of residents
Well-located urbanites9% of residents
MO
BIL
ITY
EX
PE
ND
ITU
RE
(tim
e +
mon
ey)Mobile under-served
25% of residents
Note: The size of each circle on the scatterplot indicates the number of residents in each analysis zone using a particular mode. Each analysis zone on the map is colored according to the predominant user group found in that zone.Source: Authors.
JOHANNESBURG
MEXICO CIT Y
N
N
-1
-2
-1.5 -1 -0.5 0 0.5 1 1.5 2
ACCESSIBILITY
NON-TRAVELERS
PRIVATEVEHICLE
WALK
PUBLICTRANSPORT
1
2
3
4
Well-located commuters37% of residents
Mobile under-served25% of residents
Stranded under-served31% of residents
Well-located urbanites7% of residents
MO
BIL
ITY
EX
PE
ND
ITU
RE
(tim
e +
mon
ey)
Well-located urbanites
Well-located commuters
Mobile under-served
Stranded under-served
National roads
Main roads
Rail
Well-located urbanites
Well-located commuters
Mobile under-served
Stranded under-served
Airport
Roads
0 20km
0 20km

WORLD RESOURCES REPORT | Towards a More Equal City | May 2019 | 15
From Mobility to Access for All: Expanding Urban Transportation Choices in the Global South
The access–mobility framework allows us to identify four groups of urban dwellers, specifically highlighting how residents of the city might be under-served by the transport system in different ways:
▸ Well-located urbanites
Residents in the bottom-right quadrants of Figure 5—termed here well-located urbanites—enjoy superior levels of accessibility and spend less than the average amount of time and money on daily travel. In terms of transport, these are the most advantaged residents; they are located so close to opportunities and transport networks that their destinations are just a short trip away by car, public transport, or on foot. In both cities, a minority of residents fall within this category. For many low-income urbanites in the city center, high access represents a trade-off with housing options, which are either costly, low quality, or both. This trade-off is commonly observed in well-located slum settlements or pavement dwellers in cities in Asia, Africa, and Latin America, where the main problems relate more to affordable housing than to transport.46
▸ Well-located commuters
Well-located commuters (upper-right quadrants) also enjoy medium to high levels of access, but travel longer distances by car and public transport. These residents live in older neighborhoods close to opportunities, and are typically more affluent—they can afford to travel over a wider area to procure higher wages or superior opportunities. Research in South Africa shows that well-located workers can command up to three times more in wages by extending job searches to distances of up to 40 kilometers (km) from home.47 However, their longer trip distances and car use impose higher costs on the city in terms of congestion, inefficiently used infrastructure, and environmental externalities.48 This is especially problematic in Johannesburg, where about half of all respondents—all car users—fall into this category, as compared to only 37 percent of respondents in Mexico City.
▸ Mobile under-served
Residents in the two left quadrants are under-served in terms of access. The mobile under-served (top-left quadrants) are located farther away from economic opportunities in distant suburbs and informal settlements on the city periphery. In Johannesburg they constitute a quarter of respondents,
mainly poor, who travel long distances by formal and informal transport modes. Uncoordinated transit networks often necessitate multiple transfers, further lengthening travel times. In Mexico City the mobile under-served represent 25 percent of respondents and include many low- to middle-income travelers using cars or motorcycles as an alternative to public transport, but at high cost to themselves (either in terms of travel time or money). In cities across the global South, urban residents spend 8–16 percent of their household income on transport, but this figure rises to as much as 35 percent for the mobile under-served.49 Traffic congestion contributes significantly to high travel times for this segment.
▸ Stranded under-served
The stranded under-served are those who face such severe access constraints that they travel less than the average. In both Johannesburg and Mexico City, the stranded under-served are scattered around various low-access locations and mostly get around on foot or do not travel at all. They account for 17 percent of respondents in Johannesburg and 31 percent in Mexico City. Lower mobility can result from many personal factors, including disability, unemployment, and preference. It might include home-based workers with little need for daily travel. But specific transport barriers might reinforce immobility and reduce one’s ability to participate in the normal activities of urban life.50 Among the very poor, unaffordable transit fares have been linked to immobility (failure to travel on any given day),51 or at least reduced mobility limited to the immediate vicinity of the home.52 In São Paulo, immobility levels are twice as high among the lowest income group as they are among the highest income group.53 Women might reduce their travel if they feel unsafe and fear harassment.54 School attendance or health care visits might suffer from the unavailability of transport.55
Figure 5 shows the spatial distribution of the four categories of residents across the two cities. The maps were created by coloring each zone according to the predominant quadrant it represented. Therefore, showing a zone as predominantly “mobile under-served,” for instance, does not mean the absence of populations represented in the other three quadrants.
These four quadrants are present in all cities, though the specific modes that people use, the proportion of the population in each quadrant, and the severity and causes of the problems may vary.

16 |
The categorization helps to frame the discussion around the types of action needed to support various user groups in the city.
Current Urban Growth Policies Exacerbate Access Problems for the Under-servedCities in the global South are growing fastest at their edges, where developable land—for both formal suburbs and informal settlements—is available and most affordable.56 Land-use regulations are either nonexistent or weakly enforced, leaving private developers free to locate new development in a way that maximizes their economic returns instead of prioritizing access for residents. This often leaves large areas very poorly served by roads and high-quality transit, among other urban services. This is the planning challenge with perhaps the greatest long-term impacts on a city’s quality of life.57
The outcome is that poor and middle-class households become increasingly likely to find themselves on the city’s periphery with poor access to opportunities.58 This is exacerbated by continued concentration of jobs, food markets, and manufacturing in or near central business districts, with few secondary nodes having any significant concentration of economic activity in outer areas.59 Hence, the distances that people and goods have to travel inevitably grow. Consider that the average distance between informal settlements and main job centers is estimated at 9.6 km in Addis Ababa and 7.2 km in Nairobi.60 In the Pretoria-Johannesburg region of South Africa, with its historically segregated land-use patterns, residents of informal settlements travel, on average, between 20 and 23 km to look for work.61 Although Latin American cities tend to have more compact cores than African cities, even Bogotá and Curitiba are surrounded by growing peripheries at distances of up to 20 km from the core.62
The social and economic costs of growing trip distances are significant. Families get locked into years of high travel costs that may prevent them from investing in assets such as better housing.63 Long commutes—whether by informal transit, cars, or two-wheelers with lower safety features—raise the risk of traffic fatalities and serious injuries. By entrenching exclusion from opportunities, long travel distances increase people’s vulnerability to economic shocks.64 Long distances also raise the cost of transporting goods and passengers around the city, reducing the efficiency of both transit and economic production.65 Uncontrolled or deliberate sprawl allows cities to grow, but not in ways that encourage an affordable transport system.
3. CONFRONTING THE CHALLENGE OF ACCESSIBLE CITIES
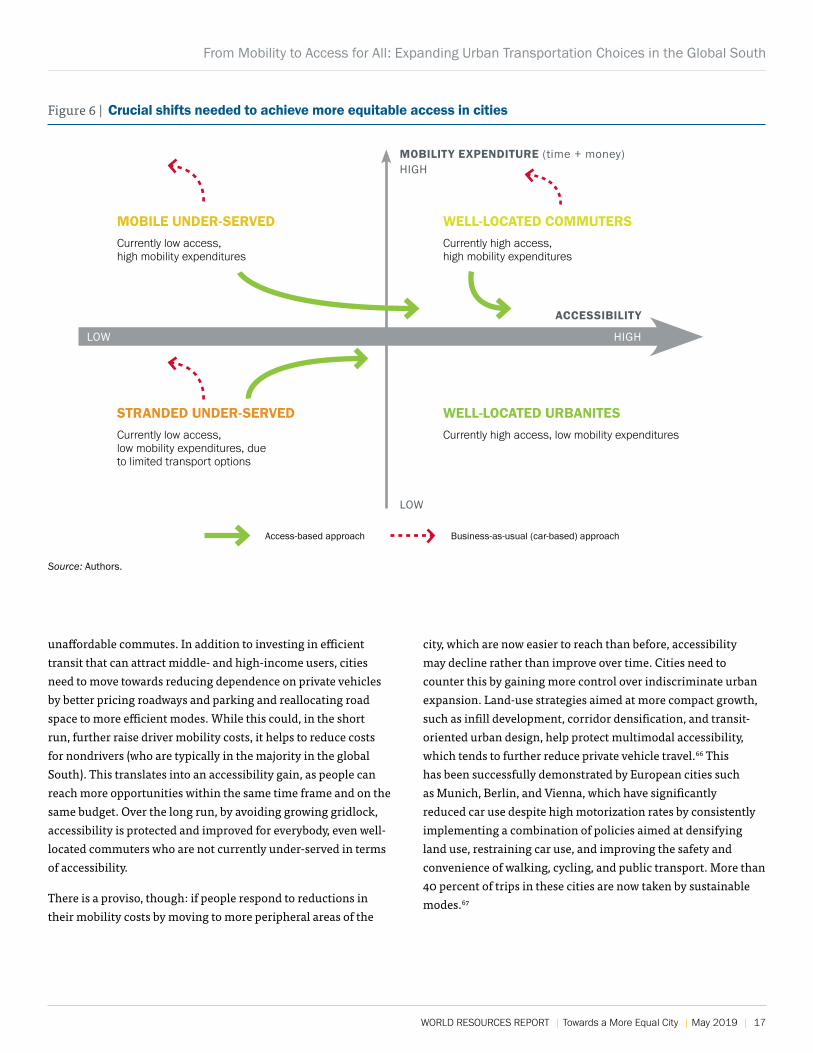
Our four-quadrant analysis suggests that two broad shifts are needed to improve travel conditions for the transport under-served (see Figure 6).
Provide better access to opportunities and better mobility options for the stranded under-served. One way to improve accessibility is to bring opportunities such as job centers, schools, clinics, shops, and social services within easier reach of communities through land-use planning that prioritizes denser, mixed-use development. Land-use strategies that allow both jobs and housing to be located in the city’s well-connected areas can help deliver opportunities within walking distance of poor households and increase access to other parts of the city. Supporting measures are then needed to make it easier and safer for people to walk and bicycle. For longer-distance mobility, public transport services could be extended to marginalized communities as part of transit-oriented development (TOD) plans, or trunk public transport could be combined with informal, private, or nonmotorized services for last-mile access. It is important to ensure that such services operate at a minimum desired level of quality and affordability, especially if provided by informal or private operators.
Reduce mobility costs for the mobile under-served. Making transport faster and more efficient will benefit this segment by reducing the time and/or money they spend traveling. Different actions might be needed for a city’s different user groups. In congested cities, a critical intervention is to get public transport users out of congestion by investing in dedicated infrastructure (either road- or rail-based) and supplying new or expanded transit routes. Door-to-door travel times might be reduced simply by better connecting existing services in terms of transit routes and fare prices. This might require cities to find ways to make formal and informal transit work better together and to integrate them with emerging private sector services such as ride-hailing and bus aggregators. Improved integration and operational efficiencies can be facilitated by adopting appropriate technology, such as intelligent transportation systems (ITS) that enable real-time traveler information and vehicle tracking, and helping to reduce costs and improve affordability for users.
These actions help not only current transit passengers but also private vehicle users who need alternatives to congestion-prone,
WORLD RESOURCES REPORT | Towards a More Equal City | May 2019 | 17
From Mobility to Access for All: Expanding Urban Transportation Choices in the Global South
unaffordable commutes. In addition to investing in efficient transit that can attract middle- and high-income users, cities need to move towards reducing dependence on private vehicles by better pricing roadways and parking and reallocating road space to more efficient modes. While this could, in the short run, further raise driver mobility costs, it helps to reduce costs for nondrivers (who are typically in the majority in the global South). This translates into an accessibility gain, as people can reach more opportunities within the same time frame and on the same budget. Over the long run, by avoiding growing gridlock, accessibility is protected and improved for everybody, even well-located commuters who are not currently under-served in terms of accessibility.
There is a proviso, though: if people respond to reductions in their mobility costs by moving to more peripheral areas of the
city, which are now easier to reach than before, accessibility may decline rather than improve over time. Cities need to counter this by gaining more control over indiscriminate urban expansion. Land-use strategies aimed at more compact growth, such as infill development, corridor densification, and transit-oriented urban design, help protect multimodal accessibility, which tends to further reduce private vehicle travel.66 This has been successfully demonstrated by European cities such as Munich, Berlin, and Vienna, which have significantly reduced car use despite high motorization rates by consistently implementing a combination of policies aimed at densifying land use, restraining car use, and improving the safety and convenience of walking, cycling, and public transport. More than 40 percent of trips in these cities are now taken by sustainable modes.67
Figure 6 | Crucial shifts needed to achieve more equitable access in cities
Source: Authors.
LOW
HIGH
ACCESSIBILITY
MOBILITY EXPENDITURE (time + money)
MOBILE UNDER-SERVEDCurrently low access, high mobility expenditures
STRANDED UNDER-SERVEDCurrently low access, low mobility expenditures, due to limited transport options
WELL-LOCATED COMMUTERSCurrently high access, high mobility expenditures
WELL-LOCATED URBANITESCurrently high access, low mobility expenditures
LOW HIGH
Access-based approach Business-as-usual (car-based) approach
18 |
The Vision: Pathways towards an Equitable, Accessible CityIt is clear that the challenge of moving towards an equitable, accessible city is multidimensional and requires actions across a wide front. To help map out possible pathways, we have grouped the actions together into three action areas, each revolving around a core theme:
▸ Build complete, democratic, safe street networks.
▸ Develop an ecosystem of integrated, user-oriented transport services.
▸ Manage the demand for private vehicle use.
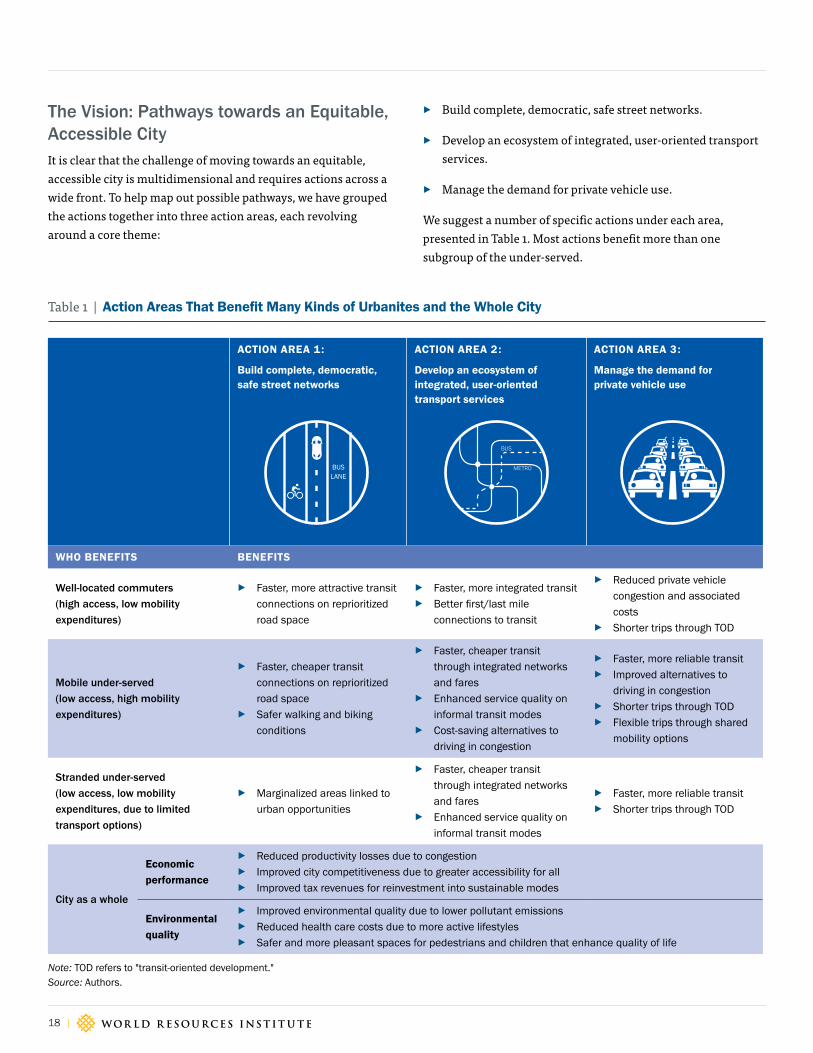
We suggest a number of specific actions under each area, presented in Table 1. Most actions benefit more than one subgroup of the under-served.
Table 1 | Action Areas That Benefit Many Kinds of Urbanites and the Whole City
ACTION AREA 1:
Build complete, democratic, safe street networks
ACTION AREA 2:
Develop an ecosystem of integrated, user-oriented transport services
ACTION AREA 3:
Manage the demand for private vehicle use
WHO BENEFITS BENEFITS
Well-located commuters (high access, low mobility expenditures)
▸ Faster, more attractive transit connections on reprioritized road space
▸ Faster, more integrated transit
▸ Better first/last mile connections to transit
▸ Reduced private vehicle congestion and associated costs
▸ Shorter trips through TOD
Mobile under-served (low access, high mobility expenditures)
▸ Faster, cheaper transit connections on reprioritized road space
▸ Safer walking and biking conditions
▸ Faster, cheaper transit through integrated networks and fares
▸ Enhanced service quality on informal transit modes
▸ Cost-saving alternatives to driving in congestion
▸ Faster, more reliable transit
▸ Improved alternatives to driving in congestion
▸ Shorter trips through TOD
▸ Flexible trips through shared mobility options
Stranded under-served(low access, low mobility expenditures, due to limited transport options)
▸ Marginalized areas linked to urban opportunities
▸ Faster, cheaper transit through integrated networks and fares
▸ Enhanced service quality on informal transit modes
▸ Faster, more reliable transit
▸ Shorter trips through TOD
City as a whole
Economic performance
▸ Reduced productivity losses due to congestion
▸ Improved city competitiveness due to greater accessibility for all
▸ Improved tax revenues for reinvestment into sustainable modes
Environmental quality
▸ Improved environmental quality due to lower pollutant emissions
▸ Reduced health care costs due to more active lifestyles
▸ Safer and more pleasant spaces for pedestrians and children that enhance quality of life
Note: TOD refers to "transit-oriented development."Source: Authors.
BUS LANE
BUS
METRO

WORLD RESOURCES REPORT | Towards a More Equal City | May 2019 | 19
From Mobility to Access for All: Expanding Urban Transportation Choices in the Global South
Action Area 1: Build Complete, Democratic, Safe Street NetworksStreets fundamentally affect how easily people can access a city. Many streets are constructed in such a way that they exclude the under-served, creating inconvenient and unsafe environments that further entrench inequality. Cities need to rethink how, where, and for whom they provide roads and streets.
Problems
Many developing cities have incomplete road networks
Arterial and secondary roads are most often undersupplied because they are the responsibility of cash-strapped municipal governments. Primary roads (supplied by central governments) and tertiary roads (provided by private sector developers) are looked after by better-resourced entities.68 Ad hoc land subdivision and occupation often outpace a municipality’s ability to acquire rights-of-way and build roads that promote accessibility and support other core urban services. In addition, governments are sometimes reluctant to provide infrastructure to unplanned settlements for fear of encouraging uncontrolled urbanization. Satellite mapping shows that the number of paved roads drops off sharply beyond about 12 km from the urban centers like Dar es Salaam and Addis Ababa, which is where many informal settlements are located.69
This affects the stranded under-served in multiple ways. Walking and cycling conditions are poor, reducing trip rates and contributing to social exclusion.70 Poor or absent roads make public transport services more difficult to provide, as in the mountainous areas of Lima, where inadequate road maintenance has been linked to poor formal transit.71 Poor roads may also depress local entrepreneurial activity and restrict essential food and health supplies because it becomes more costly and difficult to move goods and provide services.72
Road designs often ignore the needs of under-served users
Design standards usually assign mobility functions to major arterial and connector roads that link different parts of the city and aim to accommodate higher-speed motorized traffic. Upwards of 95 percent of road space is typically allocated to cars and trucks (including on-street parking).73 This bias results in arterial roads with widely spaced intersections and broad cross sections, leaving little or no space for pedestrians and slow vehicles like bicycles or cycle rickshaws—modes used more frequently by the under-served (see Box 1).74 Large speed differentials between motorized and nonmotorized users contribute to high accident rates on arterials.75 And a disproportionate number of accident fatalities in developing countries are pedestrians, bicyclists, and motorized two- and three-wheeler users.76
Poor road space allocation also contributes to the problems of the mobile under-served. Cyclists need less than a third of the road space that car drivers do; bus passengers need a twentieth of that space.77 Counts on one radial corridor in Delhi showed that buses constitute just 2 percent of all vehicles during the morning peak, but they move 55 percent of the people.78 Yet buses and cars face the same congestion, limiting the efficiency of the entire transport system and providing no viable alternative to drivers looking for a quicker ride.
Priority actions
Complete street networks
Cities should pay closer attention to providing all-weather79 paved road access to new neighborhoods, especially unplanned informal ones with limited connectivity. Governments can gain better control over urban development by providing timely urban roads, and ones that are well fit to their surrounding environment. It also offers an opportunity to add safe and encroachment-free sidewalks that can influence user behavior.80

20 |
Box 1 | Complete Streets Provide Safe Access for All in São Paulo, Brazil
In 2017, WRI Brasil developed a strategy in partnership with the National Front of Mayors to disseminate the concept of complete streets,
which aimed to shift the paradigm of traditional vehicle-focused street design. Eleven cities of the National Network for Low Carbon Mobility
each selected a street to be transformed according to the project’s guidelines. The process began with a diagnosis of each community’s
needs, and the new street design was developed around these inputs. WRI Brasil trained and supported the municipal officials in designing
safe and accessible pilot projects, assessing the socioeconomic and environmental impacts of the intervention as well as an appropriate
financial structure.
São Paulo was the first city in the network to implement an interim intervention. Joel Carlos Borges Street is one of the main access routes
to the Berrini transit station. The street featured narrow sidewalks that could not safely accommodate the heavy pedestrian traffic of around
1,800 people per hour. The interim intervention, which was implemented in just a few weeks, stretched over 150 meters of the road and
featured low-cost materials (around US$20,000). It now provides shorter crossings at the junctions, and sidewalks and curb extensions are
protected with bollards.
The speed limit for vehicles was also lowered to 20 kilometers per hour (kmh). This mirrored a network-wide reduction in speed limits on São
Paulo's arterial roads and expressways, of which 80 percent reduced from 60 kmh to 50 kmh. In 10 percent of roads, especially in areas with
high pedestrian volumes, the limits were reduced to 40 kmh and 30 kmh. Speed limit reductions were carried out in conjunction with the
implementation of exclusive bus lanes, cycle lanes, and additional projects related to road safety.
Between 2014 and 2016 São Paulo experienced 31.9 percent fewer traffic fatalities and 32.8 percent fewer injury crashes, at least partially
attributable to the citywide lowering of speed limits.
Figure B1 | Joel Carlos Borges Street, before the intervention (left) and after (right)
Source: CET, 2017.
WORLD RESOURCES REPORT | Towards a More Equal City | May 2019 | 21
From Mobility to Access for All: Expanding Urban Transportation Choices in the Global South
It is important that new roads do not simply enhance the mobility of the already mobile. New roads should be located in places that directly enhance connectivity and access for the stranded under-served. First priorities would be arterials that connect isolated areas to the existing urban transport network and main roads within settlements that could serve as public transport and freight spines. There is evidence that better connecting roads enhance access of the stranded under-served by attracting more formal and informal operators to those areas. For instance, in South Africa operators of informal minibus taxis often respond to improved road conditions by adding new routes and increasing the frequency of service.81
Democratize streets by reprioritizing road space
The notion of balanced or complete streets suggests that urban roads should offer choices for safe transportation to all road users, and seek balance in their levels of service (see Box 1). New and existing arterial roads should add good-practice elements of pedestrian and bicycle infrastructure, starting with sections where demand for these modes can be demonstrated. Facilities such as wide, well-lit, and well-drained sidewalks and bicycle lanes have been shown to attract more people to nonmotorized transport modes and reducing fatalities.82 For instance, Bogotá's 291 km Cicloruta bicycle network helped grow the percentage of bicycle users sevenfold between the mid-1990s and 2000s, most of whom came from poorer segments of the city.83
Where feasible, priority public transport routes should be provided along key arterials, facilitated by such dedicated infrastructure as may be required to protect and enhance public transport mobility. (For more details on priority infrastructure, see Action Area 2). Good design is essential for ensuring that infrastructure operates effectively. In many developing cities, drivers are less likely to comply with traffic rules and poor enforcement, making physical features such as bollards and unmountable curbs important for preventing unwanted incursions onto pedestrian and public transport spaces.84
More-democratic streets also need to better accommodate the needs of people seeking access to adjoining land. Safe stops for passengers who use formal and informal transit are important. Where space permits, service roads adjacent to higher-speed transit lanes can be an effective strategy for accommodating a mix of nonmotorized and low-speed motorized traffic. This will also help attract businesses and services to the corridor, which have a greater chance of flourishing in beautiful and vibrant streets.85
Improve pedestrian safety and security
Good design guidelines exist that specify the physical and operational measures needed to address traffic safety for vulnerable users.86 Research has shown that lower car speeds, especially those below 35 kmh, dramatically lessen the risk of pedestrian fatalities.87 Where roads operate at higher vehicle speeds, it is important to physically separate motorized and nonmotorized traffic with separate walkways and lanes.88 On wide arterials, medians with pedestrian refuge areas have been shown to reduce crashes by 35 percent.89
Where pedestrians and vehicles come into conflict in shared spaces such as road crossings and on residential roads without sidewalks, traffic speeds should be reduced to below 35 kmh. Features such as reduced lane widths and traffic-calming devices like speed humps, chicanes, and traffic circles have proved effective in improving traffic safety in developing cities such as Beijing.90 Properly designed intersections, raised crossings, or curb extensions (that reduce crossing widths) are similarly effective in reducing vehicle-pedestrian conflicts.91
Complete, democratic, and safe streets need to be integrated into a coherent network and be well coordinated with the city’s public transport system and its existing informal, private, and nonmotorized modes. Doing so can ensure that the resulting benefits extend across a broad range of users.92
22 |
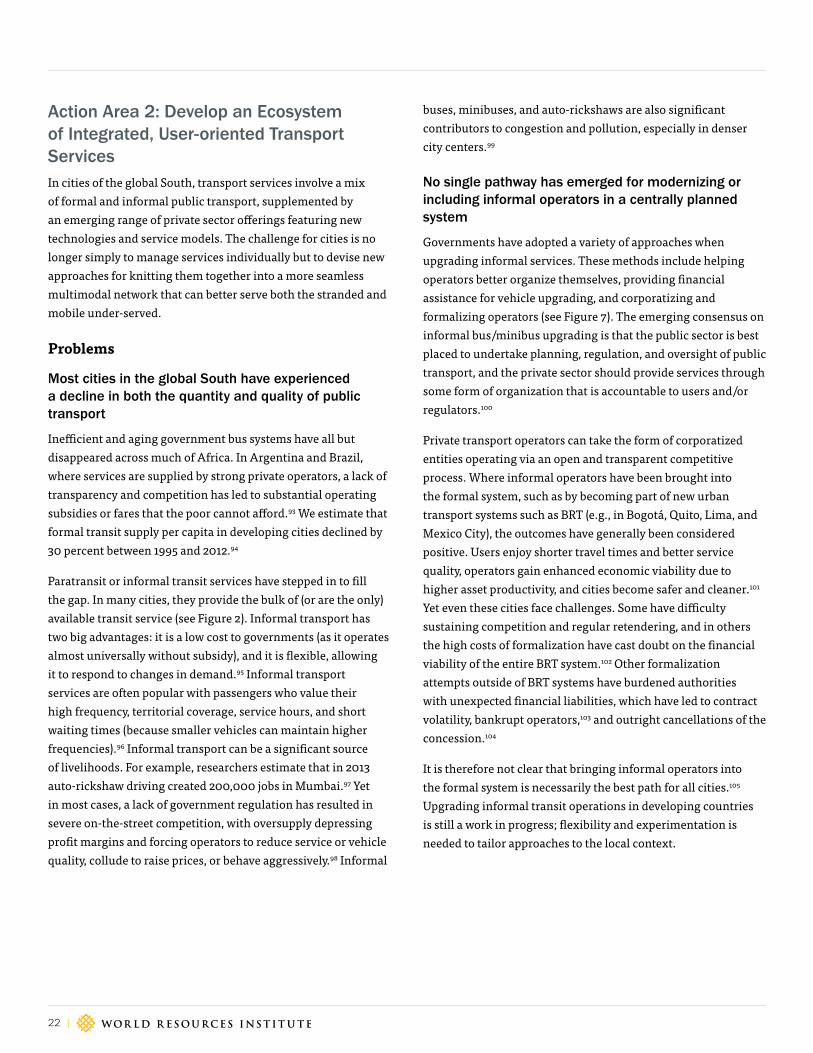
Action Area 2: Develop an Ecosystem of Integrated, User-oriented Transport ServicesIn cities of the global South, transport services involve a mix of formal and informal public transport, supplemented by an emerging range of private sector offerings featuring new technologies and service models. The challenge for cities is no longer simply to manage services individually but to devise new approaches for knitting them together into a more seamless multimodal network that can better serve both the stranded and mobile under-served.
Problems
Most cities in the global South have experienced a decline in both the quantity and quality of public transport
Inefficient and aging government bus systems have all but disappeared across much of Africa. In Argentina and Brazil, where services are supplied by strong private operators, a lack of transparency and competition has led to substantial operating subsidies or fares that the poor cannot afford.93 We estimate that formal transit supply per capita in developing cities declined by 30 percent between 1995 and 2012.94
Paratransit or informal transit services have stepped in to fill the gap. In many cities, they provide the bulk of (or are the only) available transit service (see Figure 2). Informal transport has two big advantages: it is a low cost to governments (as it operates almost universally without subsidy), and it is flexible, allowing it to respond to changes in demand.95 Informal transport services are often popular with passengers who value their high frequency, territorial coverage, service hours, and short waiting times (because smaller vehicles can maintain higher frequencies).96 Informal transport can be a significant source of livelihoods. For example, researchers estimate that in 2013 auto-rickshaw driving created 200,000 jobs in Mumbai.97 Yet in most cases, a lack of government regulation has resulted in severe on-the-street competition, with oversupply depressing profit margins and forcing operators to reduce service or vehicle quality, collude to raise prices, or behave aggressively.98 Informal
buses, minibuses, and auto-rickshaws are also significant contributors to congestion and pollution, especially in denser city centers.99
No single pathway has emerged for modernizing or including informal operators in a centrally planned system
Governments have adopted a variety of approaches when upgrading informal services. These methods include helping operators better organize themselves, providing financial assistance for vehicle upgrading, and corporatizing and formalizing operators (see Figure 7). The emerging consensus on informal bus/minibus upgrading is that the public sector is best placed to undertake planning, regulation, and oversight of public transport, and the private sector should provide services through some form of organization that is accountable to users and/or regulators.100
Private transport operators can take the form of corporatized entities operating via an open and transparent competitive process. Where informal operators have been brought into the formal system, such as by becoming part of new urban transport systems such as BRT (e.g., in Bogotá, Quito, Lima, and Mexico City), the outcomes have generally been considered positive. Users enjoy shorter travel times and better service quality, operators gain enhanced economic viability due to higher asset productivity, and cities become safer and cleaner.101 Yet even these cities face challenges. Some have difficulty sustaining competition and regular retendering, and in others the high costs of formalization have cast doubt on the financial viability of the entire BRT system.102 Other formalization attempts outside of BRT systems have burdened authorities with unexpected financial liabilities, which have led to contract volatility, bankrupt operators,103 and outright cancellations of the concession.104
It is therefore not clear that bringing informal operators into the formal system is necessarily the best path for all cities.105 Upgrading informal transit operations in developing countries is still a work in progress; flexibility and experimentation is needed to tailor approaches to the local context.
FORCECHANGE
FOSTERCHANGE

WORLD RESOURCES REPORT | Towards a More Equal City | May 2019 | 23
From Mobility to Access for All: Expanding Urban Transportation Choices in the Global South
Rail systems generally do not serve low-income, under-served communities very well
The new metro and light rail transit systems in cities such as Delhi, Bangkok, Casablanca, and Addis Ababa have the potential to significantly improve urban mobility. In practice, rail systems do not often serve the poor effectively. Their significant cost usually limits the system (and its benefits) to just one or a few corridors that cover a fraction of the city. Both their routes and fares may exclude the poor, meaning that the already mobile in accessible locations are the ones who benefit most.106 In addition, capital and operating subsidies may burden city finances for years, diverting funds from more socially progressive programs.
Many public transport interventions are undertaken as stand-alone projects and are poorly integrated into other modes and infrastructures
Rail systems, especially when implemented by a dedicated agency, are often superimposed on existing bus networks. There is little planning to realign them so as to efficiently connect passengers with rail stations. BRT systems may do better by planning trunk corridors and bus feeders together, but they often ignore informal modes and nonmotorized connections.107 Some informal transit operators may respond by adapting their routes to serve BRT and rail nodes as feeders. This is the case in Bangkok, where informal modes like songtaews (vans with defined routes), tuk-tuks, and motorcycle taxis offer much-needed last-mile access to Mass Rapid Transit and Skytrain
Figure 7 | Cities use various approaches to manage informal transit operations
Sources: Adapted from Dewey and Zegras, 2012; EMBARQ, 2014; Schalekamp et al., 2015.
General, citywide upgrading of informal transport
Linked to catalytic projects
FORCECHANGE
FOSTERCHANGE
Competitive regulation(concessions, franchises)
Dakar
Competitive tenderingSantiago
Removal and public provisionQuito
Driver & vehicle fitness regulation
Nairobi
Competitive tendering with preference to existing operators
Bogotâ
Formation of operator associations, cooperatives
Many cities
Grandfathering of existing operators into new system
León, Dar es Salaam, Johannesburg, Mexico City, Lagos
Government-assisted fleet renewal
Dakar, Cairo, Indore
Government-assisted professionalization, trainingJohannesburg, Cape Town, Accra

24 |
stations.108 But in many cities informal services operate in parallel with formal operations, with little coordination (and sometimes outright competition) between the two.109 In underregulated cities with only informal operators, operator groups often negotiate to carve out service areas in such a way as to avoid undue competition and maximize revenues, without taking passenger convenience into account.110
Unintegrated systems affect service quality for all passengers, creating difficult or unsafe transfers, lengthy delays, and a lack of whole-journey information. They depress overall transit ridership by discouraging journeys on more than one mode and forgo the potential benefits of service complementarity. The impacts on the under-served are worst when they are forced to pay two or three fares to get to a destination, which can reduce the effective access of poor travelers by up to 33 percent.111 New transit projects that replace direct informal routes with trunk and feeder routes could reduce the access of poor households in peripheral locations by creating additional transfers.112 For instance, in the early phases of Bogotá's TransMilenio, the overall travel time for passengers who required one or more transfers increased by two minutes per trip due to longer waiting and transfer times.113
Priority actions
Connect existing services to form an integrated multimodal network
Cities can start improving access of the under-served by integrating existing informal transit, bus, rail, and nonmotorized services into a more connected network. This approach is often cost-effective because it leverages the benefits of existing and emerging modes and capitalizes on the returns to scale from enlarging the collective catchment area of public transport.
Integration requires a paradigm shift in city government thinking and organization. Governments must take responsibility for developing and nurturing their entire multimodal transport network, including both formal and informal transit and private operators. Moving away from mode-based planning silos is a crucial first step in identifying opportunities to link up services, and for fostering cooperation across stakeholders. Dedicated and empowered multimodal urban transport authorities have proved to be an effective institutional innovation for achieving such cooperation.114
Once the vision for an integrated network exists, it may be achieved via a multitude of interventions, including infrastructure provision (e.g., dedicated transfer facilities or networks of walkways and
bicycle lanes that are well integrated with public transport routes),115 operational adaptations (e.g., reorganizing bus and informal transit routes for better connectivity to rail and BRT systems), regulatory changes (e.g., concession contracts designed with passenger-demand patterns in mind), and enforcement.116
Some of the interventions that are most beneficial to the under-served do not require heavy capital investment at all. Integrating transport facilities with precinct upgrades and providing urban amenities may benefit the social and commercial enterprises of marginalized communities.117 Fare integration is another such action. Instead of each operator jealously guarding its own farebox revenue, cities should move towards establishing a citywide farebox that distributes revenues to operators according to clear rules. This provides opportunities to set fares at consistent levels, introduce free or reduced-fare transfers, reward good operator behavior, and subsidize certain classes of passengers, if desired. To build trust, the revenue clearinghouse can be administered by an independent institution such as a bank.
Passengers benefit even more if integrated fares are coupled with a cashless payment mechanism such as a smart card, which obviates the need to carry cash.118 Informal transit operators in Kenya and Rwanda are leapfrogging the need for expensive smart card systems by experimenting with a low-cost cell phone–based payment.119 Mobile ticketing will provide significant opportunities for knitting together public and private operators, such as e-hailing and ride-sharing services, in the future.
Invest in priority public transport infrastructure
To address the high mobility costs of well-located commuters and the mobile under-served—that is, of private vehicle and public transport users—cities need to deal with traffic congestion.120 Investing in dedicated infrastructure to protect high-efficiency vehicles like buses and trains from congestion can restore their inherent advantages in moving more people efficiently and safely.
Cities need to prioritize infrastructure choices in light of factors such as topography, congestion levels, opportunities to reallocate road space, financial resources, passenger volumes, and available political support. Many cities currently have the opportunity to make game-changing investments in rail or bus priority schemes that will set them on a more sustainable path to urban growth. It is likely that only a small fraction of cities in the global South have the technical capacity and financial muscle to warrant expensive urban rail investments. Many cities have thus adopted BRT as a more suitable approach.

WORLD RESOURCES REPORT | Towards a More Equal City | May 2019 | 25
From Mobility to Access for All: Expanding Urban Transportation Choices in the Global South
BRT systems are capable of delivering substantial benefits to stranded and mobile under-served populations in cities as diverse as Lima, Beijing, Johannesburg, and Indore (see Box 2).121 Two factors are particularly important for pro-poor outcomes: corridor location and fare policy.122 Where sufficient demand densities exist, BRT systems should favor under-served neighborhoods when selecting routes; otherwise, they risk bypassing them. Fare levels and transfer policies should be set with user affordability in mind, adding targeted subsidies if needed.
Smaller or less congested cities have less need for high-capacity BRT systems with extensive dedicated infrastructure. Such cities should exploit another inherent advantage of bus-based systems: their flexibility.123 Available options range from full-specification BRT to more flexible arrangements involving basic bus lanes, queue-jumping lanes at intersections, and bus routes that extend beyond the dedicated corridor.124 In some cases, simply providing working traffic signals at key intersections on bus routes will significantly reduce travel times. Bus routes that connect outlying under-served areas with job centers, only entering or
Box 2 | Bus Rapid Transit Solutions in Rapidly Growing Cities: The Case of Indore
Indore, a booming city in central India with a population of more than 4 million, implemented a bus rapid transit (BRT) system called iBus in
2012. The objectives were to provide mobility for a rapidly growing population and to combat the growing air pollution from two-wheelers and
unorganized public transport, responsible for 65 percent and 20 percent of transport emissions, respectively.a Today the iBus carries more
than 80,000 passengers per day and has won various national and international awards, including the International Sustainable Transport
Award in 2014.b
iBus was designed to be socially inclusive at multiple levels. The city decided to set BRT fares at a level lower than ordinary city buses in
Indore, even as higher levels of service were offered. Lower- and middle-income groups constitute a majority of Indore’s population, so
satisfying their needs was key to securing increased ridership and reducing the use of private vehicles. At present, 80 percent of passengers
use iBus at least three times a week, of whom 47 percent are private vehicle owners (cars or two-wheelers). In terms of modal shift, 24
percent of passengers shifted to iBus from private modes and 18 percent from informal, intermediate modes of transport.c
One of the factors contributing to iBus’s success was the attention paid to public outreach. The implementing authority, Atal Indore City Transport
Services Ltd., a special-purpose entity to operate and manage the public transport system, treated public consultation and outreach as a core activity
rather than as an afterthought. Authorities and the public (citizens, students, media, technical experts) dialogued through focus group discussions,
outreach sessions, and social media, which significantly helped to achieve public understanding and support for the system.
Notes: a. WRI India Sustainable Cities, 2012; b. based on data from Soni, 2014; c. Soni, 2014.
Figure B2 | Indore bus rapid transit system
26 |
connecting to dedicated infrastructure closer to the congested heart of a city, might be the most cost-effective way to marry equity with efficiency. Cities such as Lagos and Ahmedabad have demonstrated the feasibility of incrementally upgrading vehicles, systems, and priority bus lanes according to congestion growth and funding availability, as long as the required road space is protected.125 And there might well be a role for current or former informal operators in such a flexible network.
Make more effort to integrate informal operators
Despite the inherent difficulties in dealing with highly atomized and underresourced informal transit operators, the emerging consensus is that cities are better off proactively including them in the multimodal transport system than either ignoring or trying to suppress them. We think there are great advantages to harnessing the entrepreneurship and experience of this sector while working towards mitigating their negative impacts on city residents.
Approaches vary, as illustrated in Box 3. Cities implementing large formal systems, such as BRT, should help incumbent operators preserve their livelihoods by forming operating companies and contracting them to run parts of the new formal services (such as the trunk services in Lagos, the feeders in Quito, or a combination of both, as seen in Santiago and Cape Town).126 Over time, they could move towards a competitive tendering regime (as in Bogotá).127
In cities with lower technical, political, and financial capacity, it may be more appropriate to upgrade incrementally to improve productivity and service quality without requiring all-out formalization.128 For instance, gradual fleet renewal programs, coupled with funding and institutional support, successfully replaced thousands of old and polluting vehicles in Alwar (India), Kathmandu (Nepal), and Dakar (Senegal).129 Qualifying operators may be given access to infrastructure (like priority lanes at intersections and terminals) to help improve their operating efficiency without losing the flexibility and demand responsiveness of the informal transit model.130 Research in Rio de Janeiro has shown that regulatory reform aimed at distributing route concessions among informal operators on the basis of competitive tendering confers significant benefits,
especially to the poor, because of drastically lowered fares.131 In some cases, where BRT corridors are gradually rolled out across a city, it might be appropriate to adopt a hybrid approach that combines both formalization and incremental upgrading of services.132 The key point is to recognize informal transit in transport policy and to start on a path towards institutional and operational reform to help informal operators play more of a role in the multimodal network.
Harness technology to improve productivity and the user experience
Technology can help knit services together. Mobile apps are already helping passengers find the most efficient ways to travel by offering dynamic trip-planning features that take into account multiple existing and emerging transport modes in cities. Apps are starting to incorporate route and service information on informal transit.133 Digital or crowdsourced mapping is making great strides in providing such data in cities like Nairobi and Mexico City, and common standards, such as the General Transit Feed Specification for transit data, are helping to make it readily available to users.134 Integrated platforms promote seamless integration across an area’s formal, informal, and privately owned shared mobility services while providing planners with better decision-making tools. Cities will benefit from requiring or incentivizing transit operators to provide all route, schedule, and real-time location data in open, standard formats.
Other innovations include e-hailing for boda-boda motorcycle taxi services in Uganda, Thailand, and Vietnam.135 One of the largest services in India, Ola, offers integrated e-hailing and payment for a range of mobility offerings, including motorcycle, auto-rickshaw (aimed specifically at lower-income users), and car rides in more than 100 Indian cities.136 Ola has been innovative in its use of text messaging to get around poor Internet connectivity in India, and it has a technology platform that is available in nine regional languages because few drivers speak English.137 Such technologies could enhance the productivity of informal transit operators by better matching supply with demand, especially during off-peak periods and in locations with poor accessibility.

WORLD RESOURCES REPORT | Towards a More Equal City | May 2019 | 27
From Mobility to Access for All: Expanding Urban Transportation Choices in the Global South
Box 3 | Approaches to Modernize Informal Transit Services
Three cases illustrate the potential and pitfalls of some informal transit modernization strategies.
São Paulo, Interligado: Incorporation into an integrated network
Between 2000 and 2004 the city of São Paulo reorganized its bus routes under an integrated system that included bus priority corridors
and interchange terminals, and it introduced electronic ticketing.a For peripheral areas, existing informal transit services, which were
competing with formal fixed bus routes, were formalized by transforming vehicle owner associations into companies. New companies were
required to modernize their vehicle fleet, follow labor regulations, and provide service according to schedules that the city provided and
supervised. Transformation was successful in the pilot areas where it was implemented, reducing some of the most concerning negative
externalities. But policy changes at the city level and issues with high cost prevented the pilot from being expanded to other areas of the city.
Mexico City, BRT Insurgentes Corridor: Corporatization and contracting for BRT operations
In 2005 Mexico City implemented its first bus rapid transit (BRT) corridor based on the successful experiences of Curitiba and Bogotá.b The
project involved a 15 km BRT corridor on a main north-south avenue in the city. Authorities decided to include informal incumbents in the
system by requiring them to cancel their individual concession titles and route authorizations. Four hundred operators joined to create a
new firm, of which they became shareholders. The firm purchased new BRT buses and received payment for its operations; it also received
a severance payment to retire the minibuses it had operated earlier. The forced transition was implemented without a competitive bidding
process, relying instead on direct negotiation with incumbents. While this allowed the project to move forward and reduced negative impacts
on existing operators, it was costly both in terms of payments for retiring existing minibuses and the inflated payments per kilometer of
service provided.c
Nairobi: Bottom-up consolidation and innovation
Since 2011, all licensed matatu (informally operated minibuses) operators in Kenya have been required to belong to a savings and credit
cooperative organization (SACCO), replicating earlier cooperative models founded by intercity operators.d Members benefit from bulk purchasing,
being able to access loans for vehicle repairs and maintenance, and, in some cases, route coordination and payment of driver salaries, which
helps promote better driver behavior. Besides providing broad institutional support for cooperatives, government has little involvement. More
recently, SACCOs have been instrumental in the development and testing of cashless payment options using cards that can be topped up by using
M-Pesa, a cell phone–based money transfer system. A cell phone–based application called Magic Bus (now called BuuPass) allows passengers to
prebook and pay for matatu rides using mobile money.e During pilot testing it was estimated that the program enables drivers to make two extra
trips per day and double their daily incomes.
Notes: a. Hidalgo, 2009; b. Hidalgo and Carrigan, 2010; c. Dewey and Zegras, 2012; d. Jennings and Behrens, 2017; e. Mehndiratta and Rodriguez, 2017b.
28 |
Digital applications may enhance the attractiveness and efficiency of conventional bus and rail services by providing better options for the first and/or last mile of the trip. This might help broaden access to public transport for the under-served in car-dependent areas while limiting the need for personal motorization and the negative environmental impacts that follow. As noted under Action Area 3, in many cities, new mobility options based on shared ownership, including bicycle, car, and scooter sharing, are already improving the quality of first- and last-mile travel to and from fixed-route transit.138 ITS technologies are also enhancing the ability of transit managers to manage and optimize services, making these more reliable and responsive to real-time conditions.
Innovation in digital technologies is changing the nature of transport provision worldwide, and evidence is still emerging regarding their impacts on cities. Lead cities are partnering with technology providers to maximize the benefits to both public and private transport in their areas.139
Action Area 3: Manage the Demand for Private Vehicle UsePrivate vehicle use is growing even in cities that have made significant investments in public transport, including those in China, India, and Latin America.140 Two factors help explain this growth: aspirations and utility. Owning a private vehicle is widely viewed as a symbol of social mobility and status; a view often reinforced by advertising and popular culture.141 But cars and motorcycles are also capable of providing very high levels of utility in terms of door-to-door convenience, particularly in low-density settings such as suburbs and for traveling while carrying loads.142 The problem is that as soon as trip densities rise, car utility drops exponentially due to congestion. Public transport, by contrast, thrives under density: it reduces costs (per passenger) as volumes rise up to its capacity limits.143
We do not argue that cities should attempt to get rid of cars and motorcycles, as they have a role to play in the ecosystem in urban transport. But it is clear that excessive private vehicle use imposes high costs on society and should be reversed. Some of the problems highlighted earlier in this paper contribute to excessive car use, including unbalanced road space provision and inadequate transit alternatives. We highlight two additional factors: underpricing car use and car-oriented land-use patterns.
Problems
The price that people pay to use a private vehicle undercounts its full cost to society
Consumers do not see the full costs of car and motorcycle travel because of hidden externality costs and hidden fixed user costs.
The externality costs of driving include a portion of accident damages, parking and roadway costs, and a variety of negative environmental, health, and social impacts. Once congestion sets in, the extra costs to society far outweigh the benefits of every extra car trip made. Yet because the driver does not pay the externality costs, there is no incentive to reduce driving, especially if fuel and parking are cheap or subsidized.144
Most of the costs of car and motorcycle ownership, including purchasing a vehicle, licensing and insuring it, and parking it (at home), are fixed—they are paid up front and are not related to the amount of travel undertaken. This incentivizes motorists to drive more because most of the costs are already sunk.145 Furthermore, annual license fees and fixed insurance premiums overcharge motorists who drive their vehicles less than average (which tends to include more low-income drivers).146 The structure of private costs therefore tends to be regressive and pushes up the mobility costs of lower-income users in the mobile under-served and well-located commuter groups (see Figure 6).
Car-oriented development patterns leave many urbanites with few alternatives to using private vehicles
At the macro level, low-density suburban sprawl reduces transit efficiency by increasing trip lengths and travel times. At the micro level, urban design that favors single-use areas, large blocks, unconnected street networks, and low walkability hampers walking and cycling and makes the first- and last-mile part of any transit trip unattractive. These trends are exacerbated by the rise of gated communities and enclosed neighborhoods in response to concerns about crime in many middle- and higher-income areas.147
In combination, these land-use patterns make it more difficult to provide attractive and affordable transit alternatives, thereby locking residents into car and motorcycle dependency, even if a demand for alternative modes might exist.
WORLD RESOURCES REPORT | Towards a More Equal City | May 2019 | 29
From Mobility to Access for All: Expanding Urban Transportation Choices in the Global South
Priority actions
Discourage private vehicle use in dense city cores
The most effective way to prevent and reverse gridlock is to physically reallocate road space from cars to buses, pedestrians, and cyclists (Action Area 1). The creation of transit lanes, nonmotorized ways, and the pedestrianization of entire streets has been demonstrably successful in cities such as London, Vienna, Bogotá, Mexico City, and Buenos Aires.148 Together with investment in attractive public transport options, this demonstrates social priorities in a very visible way.
An alternative is to implement car restriction policies, either through license plate auctions or driving restrictions. License plate auctions have been successful in Singapore and recently in Shanghai as a means of slowing automobile growth.149 Driving restriction policies prohibit vehicles with certain license plate numbers from entering parts of cities on certain days. These schemes deliver short-term reductions in traffic congestion and environmental pollution.150 However, experiences in Bogotá, Tehran, Mexico City, and Jakarta raise doubts over their long-term benefits because people tend to adapt their driving habits and may purchase a second car that is often cheaper, older, and more polluting.151
Price car use and parking
Pricing car use during congested times and places is still considered the best long-term solution to overutilization.152 This has been demonstrated in recent years in cities such as London, Singapore, and Stockholm, where congestion charging has led to substantial reductions in traffic volumes and related congestion.153 By setting the road-use charge closer to the full social cost, motorists receive a more accurate price signal and are more likely to consider alternative forms of transport.154
The concern is that road pricing is very difficult to achieve in cities where the political will and public acceptance of such policies remain lacking.155 Parking reform might offer better chances of success. Successful actions include reduced parking supply in central cities (e.g., in Bogotá),156 dynamic pricing of parking spaces (e.g., in San Francisco),157 or charges imposed on formerly free parking areas.158 In Paris, the on-street parking supply has been reduced by more than 9 percent since 2003, and 95 percent of the remaining parking is paid. This helped contribute to a 13 percent decrease in driving.159
Public resistance to parking reform might be lower than resistance to road charging, as motorists might already be accustomed to the idea of paying for off-street parking. To avoid simply displacing parking to off-street spaces, authorities need to move towards a comprehensive parking policy that includes pricing of both on-street and off-street parking to reflect the true economic cost of the space thus consumed.160 There is also a need for proper enforcement and perhaps physical barriers to prevent illegal parking from blocking public spaces and sidewalks. Parking reform provides an opportunity to address several problems of equitable access at once. It can restrain car use, generate revenue that could be used for sustainable alternatives, and promote walking and cycling by freeing up sidewalk space according to balanced street principles.161
Promote shared mobility solutions that reduce, delay, or prevent car ownership
We refer specifically to the sharing of small vehicles such as cars, minibuses, taxis, auto-rickshaws, bicycles, and delivery vehicles, owned either privately or collectively. Shared mobility services such as car sharing, bike sharing, and ride sharing have been growing fast, making up more than half of new mobility start-ups worldwide.162 They are successful partly because they spread the fixed cost of vehicle ownership across multiple users, so people pay only in proportion to their use. This may improve the accessibility of the middle-income, mobile under-served by giving them access to a car for high-value trips without the need to purchase (and park) their own vehicles. By limiting hidden ownership costs, shared mobility also helps reduce driving.163
Coupled with e-hailing and digital payment platforms, shared services can support fixed-route transit by serving the first- and last-mile part of the trip, which is often a large deterrent to transit use. By pooling rides, shared services may be able to feed passengers to and from transit hubs in low-density suburbs or office parks at lower costs than transit feeders. One estimate in the United States showed that replacing low-performing bus routes with demand-responsive shared minibuses would break even within three to four years, and faster if it attracts additional passengers.164 Shorter vehicle trips would also significantly reduce emissions of greenhouse gases and other pollutants.
That said, there is a danger that e-hailing and ride sharing could discourage people from walking, cycling, or using transit altogether, thus frustrating sustainable transport goals (see
30 |
Box 4).165 Cities need to be circumspect in their support of new mobility initiatives and must consider appropriate regulations to manage this emerging market. However, in areas with low transit access, cities may well benefit from partnering directly with private sector service providers while ensuring that their business models are designed to present a level playing field with other modes.
Ensure that new development is transit oriented, well served by public transport, or located near economic opportunities
Ideas such as TOD are being advanced in many cities. TOD refers to a type of urban development featuring mixed land uses, easy walking and cycling between them, and good connectivity to the rest of the city through high quality public transport services.166 Although there are some proven examples of TOD success, the reality of land governance and markets in cities of the global South, and late investments in high-quality transit systems, mean that TOD is sometimes difficult to achieve in practice.167 With major transit systems being retrofitted in mature cities of the global South after the majority of the city has developed, this concept instead often turns on its head and manifests as development-oriented transit.168 This may create some planning challenges but can still support the objectives of TOD.
Successful TOD requires bringing together a mix of infrastructure, design, finance, and urban management elements to create vibrant and attractive places. Successful projects have demonstrated that TOD requires very good transit that provides access to the rest of the city within walking distance (preferably 500 meters).169 It can thus be coordinated with the upgrading or construction of new urban rail or BRT corridors, such as in Curitiba, where TOD was implemented around the new Linha Verde (Green Line) BRT route.170 By creating a denser mix of land uses, including business, retail, and housing within the precinct, TOD encourages transit use and walking and limits private vehicle use. Excellent urban design, including compact development, attractive frontages and public spaces, and safe and walkable streets, is also essential to the success of TOD.
Affordable housing must be part of the TOD mix because it helps to improve access for the under-served who might otherwise not be able to afford to live in highly accessible locations.171 Under the right conditions, increases in property values in TOD zones can help cross subsidize affordable housing, which is necessary to mitigate any potential negative impacts of gentrification or
Box 4 | Bus Aggregators Provide Microtransit in India
Bus aggregator is a term for companies in India that
use smartphone technology to aggregate demand from
passengers traveling in the same direction at the same
time to a bus and its driver. Bus aggregators such as Shuttl
and ZipGo crowdsource demand for routes and timings;
according to demand, they then enter into operating
contracts with owners of 9- to 40-seat buses to service the
routes.
These companies target young, urban, white-collar workers
and offer routes that connect commercial and residential
hubs in large cities. Commuters are offered an Uber-style
experience with booking, payment, vehicle tracking, and
rating, available via the company’s app.a In 2015 over a
dozen bus aggregators were founded in Bangalore, Delhi,
Hyderabad, Kolkata, and Mumbai, and six continued to
operate as of February 2018.b The largest companies
provide up to 20,000 trips a day.c
Bus aggregators seem to offer commuter-centric services
that discourage people from using private vehicles. A
survey conducted by WRI in 2017 of commuters on board
Shuttl vehicles in Delhi found that 51 percent of those
surveyed would otherwise have used a private vehicle
for their office commute.d However, the growth of such
companies has provoked resistance from transit agencies
and city regulators.e Transit agencies maintain that
these services siphon customers from profitable routes.
Companies counter that their higher price point puts them
in competition with private cars and taxis rather than public
buses. The future of bus aggregator models is uncertain but
warrants exploration as private motorization rates explode
in cities.
Notes: a. Chadha et al., forthcoming; b. Tracxn, 2016; c. Mukul, 2016; d. Chadha et al., forthcoming; e. Bharadwaj and Bhat, 2015; Korde, 2016.

WORLD RESOURCES REPORT | Towards a More Equal City | May 2019 | 31
From Mobility to Access for All: Expanding Urban Transportation Choices in the Global South
displacement. Cities like Curitiba and Johannesburg have started to address the affordability challenge by passing regulations and incentives that promote the inclusion of affordable housing in specific locations, including areas around transit corridors.172 Some Indian and Latin American cities have successfully used land readjustments, whereby the city promotes private sector development of well-located greenfield or brownfield land through rezoning, subdividing, servicing, or relaxing density constraints, in exchange for which a portion of new housing is used as public rental housing.173 In the case of Bogotá's Metrovivienda program, households relocating from peripheral and illegal housing settlements to its BRT-adjacent housing projects achieved a threefold improvement in job accessibility while reducing daily commuting expenditures by approximately 50 percent.174
4. ENABLING CONDITIONS FOR MORE ACCESSIBLE CITIES: GOVERNANCE AND FUNDING
Building and sustaining momentum towards more equitable access in cities requires action on many fronts. We highlight two cross-cutting conditions that enable all the action areas above and are critical to success: capable, visionary governance and planning institutions and strategies for adequate and sustainable funding.
Capable, Visionary Governance and Planning InstitutionsExperiences from cities that have made much progress offer one strong lesson: that it is important to have “consistently strong, vociferous support from politically astute champions.”175 As in other areas of urban life, strong leaders are needed to articulate a vision for equity and sustainability. They have to be willing and able to take the long view, as change often challenges the short-term political interests of a city’s powerful interest groups that are typically well served by transport options. Ultimately, however, a city’s long-term health critically depends on making better, more equitable accessibility choices today.
When crafting their strategies, political champions can learn from successful transformation projects. For instance, they should choose the timing of issues wisely, broaden support by recruiting allies and building broad coalitions, promote transparency, and proactively shape public opinion.176
Successful leaders are supported by capable institutions Growing existing planning departments and agencies into stronger institutions is challenging but crucial to transforming cities. Governments have to start moving away from the fragmentation, unclear lines of responsibility, and inconsistent policies that have hamstrung action in many countries.177 An effective strategy is to create a dedicated and empowered multimodal transport authority that has a mandate to plan and oversee the metropolis-wide transport system.178 The successful implementation of transformative urban transport projects in cities such as Bogotá, Mexico City, and Lagos has been partly attributed to the emergence of strong, integrated institutions.179 Even if responsibilities are gradually assigned as capacity grows, the authority should ultimately have a wide range of functions that include the following:
▸ Gain public responsibility for all aspects of the multimodal network, including planning, regulation, contracting, and monitoring.
▸ Facilitate coordination of land use, land development, and transport plans in alignment with regional economic development plans.
▸ Provide support to informal operators for training, upgrading, access to financing, guiding negotiations, and integration into citywide networks.
▸ Promote data sharing and collaboration across private and public mobility players.
▸ Undertake programming, budgeting, business planning, and subsidy management.
▸ Ensure sufficient revenue-raising capacity through user fees, borrowing, or grants.
▸ Undertake continued monitoring and technical support.
Not all cities have the organizational maturity to establish multimodal agencies. But efforts should be made to functionally integrate projects across the traditional silos of land-use planning and engineering. Evidence shows that projects aimed at under-served communities produce much larger benefits if they are implemented as part of wider interventions that include basic public utilities, public space improvement, public outreach, and crime prevention.180 This requires solid

32 |
coordination between disparate departments responsible for public space, environment, health, law enforcement, and so forth. One effective strategy is to appoint specific individuals as project champions, or “integrators,” located high enough in the metropolitan hierarchy to overcome departmental fragmentation.
Cities need better control over housing and urban expansion Control will be elusive unless cities address the problems of declining accessibility in fast-growing areas. Housing growth needs to be tied to transport provision so that new housing is increasingly steered towards (current and future) well-located areas. Reforms that give poor households land tenure in accessible locations may be far more effective in permanently reducing their transport burden than large-scale investment in roads.181
A location’s accessibility might change over time, and cities need to find the right balance between concentration and controlled decentralization. Infilled vacant land, redevelopment, or progressive densification in locations with already high accessibility in city centers and along transport spines might deliver dividends in terms of access and efficient movement. But once the benefits of agglomeration are exceeded by the costs of congestion, it becomes necessary to selectively decentralize economic opportunities and housing. Decentralized nodes must be contiguous with existing development and should connect to existing and planned transport networks. To achieve this, city authorities should implement clear, enforceable land-use regulations and incentives that steer private development towards high-access locations. These actions should be accompanied by participatory land redistribution mechanisms to generate land within the city for affordable housing and large-scale development. The accompanying WRR paper on urban expansion discusses these strategies in detail.182
Integrated transport planning processes must include under-served communities Real community participation often generates new solutions to problems, increases the legitimacy of decisions, and mitigates implementation risk.183 Local stakeholders can also advocate for quick-win, incremental improvements—proper sidewalks, safe routes to schools—while the more time-consuming and large-scale interventions related to modernizing transit networks are
under way at a systemic level. Local advocacy groups have an important role to play in reimagining what equitable transport should look like.
Adequate and Sustainable FundingFunding is a constraint on the ability of all cities to implement better transport systems. But struggling and emerging cities are especially vulnerable to what has been called the “underfunding trap,” where the up-front investments needed for new transport infrastructure are huge and funding for ongoing maintenance is never sufficient. Financial needs far exceed available revenue, and urban transport systems become trapped in a downward spiral of poor quality and decreasing revenue.184
While acknowledging that transport funding is a complex political and economic issue, we believe cities (with the support of national governments) can make headway by starting to think differently about funding. Two key shifts in thinking are needed. Cities need to grow the funding available for transport and make wiser decisions when dividing it up.
Cities need to grow their revenue sources Cities traditionally depend on a mix of general taxes, farebox revenues, and fuel taxes to fund transport, but these sources are inadequate. Users are generally unable to pay for both the construction and operations of public transport. In the dense travel markets of some Latin American and Asian cities, passenger fares cover the operating costs of improved transit, but this is not the case in many African cities due to a combination of lower densities, low incomes, and transport inefficiencies. Grants, loans, and subsidies from central governments and funding agencies may help pay for infrastructure but are often politically uncertain and unable to cover ongoing maintenance and operations costs.
Successful cities have started cultivating a number of new revenue sources to help fund transport.185 Some draw on international climate-related instruments such as the Clean Development Mechanism and the Global Environmental Facility to fund climate-beneficial projects.186 An effective local alternative is to partner with property developers and share the benefits of increased land value that result from the enhanced accessibility brought by transport investments. Various instruments can achieve this, including development fees, joint developments, and property taxes. Some of these have been very successful in funding transit investments, such as in China
WORLD RESOURCES REPORT | Towards a More Equal City | May 2019 | 33
From Mobility to Access for All: Expanding Urban Transportation Choices in the Global South
and India (see Box 5).187 Partnerships with developers can also help shape new land development into transit-supportive forms, creating a virtuous cycle between increased transit ridership, improved transit financial viability, and enhanced private sector profits.188
Another funding source is to impose direct charges on car usage. How vehicle ownership, parking spaces, and car usage are priced in the congested areas described earlier (see Action Area 3) provide additional revenues that can be spent on sustainable modes and free up municipal funds for other needs, such as low-income housing.189 For instance, 80 percent of net revenues from London’s congestion charge are earmarked for bus improvements, and all parking revenues in Barcelona go to operate the city’s public bike system.190 In this way, charging—as well as dedicating revenues to funding sustainable alternatives—thus creates a virtuous cycle that can greatly improve travel conditions and city performance.191
Cities need to make wiser investment decisionsIncreasing the transport sector’s income should not be the only objective of funding policy. Cities also have to be wiser in how they spend funds. Wise investments look beyond the financing requirements of individual projects and identify long-term planning objectives that will reduce the funding gap over time.192 This requires, firstly, a steady shift in public funding towards collective and nonmotorized transport because sustainable modes generate the most general benefits for cities in terms of overall productivity, safe and healthy environments, and social equity. For example, active lifestyles promoted by investments in walking and biking facilities reduce health care costs and absenteeism.193 The Danish Capital Region estimates that for every kilometer traveled by bicycle instead of by car, Danish society gains one euro in terms of health benefits and experiences 1.1 million fewer sick days annually.194 In Bogotá, bicycling alone saves an estimated 55,000 metric tons of CO2 per year, corresponding to a potential economic value of between US$1 million and $7 million when traded on the carbon market.195 Mexico City’s Metrobús Line 1 eliminates more than 6,000 days of lost work, 12 new cases of chronic bronchitis, and three deaths per year, saving an estimated $3 million per year.196 And across low- and middle-income countries, road accidents consume 5 percent of GDP.197 By investing in safer, more balanced road systems, it is possible to achieve significant savings that may result in higher economic growth and tax revenues.
Wise investment also requires action to reduce the implicit subsidies for the use of private cars and motorcycles, which
represent only a minority of trips but impose large costs on society. Infrastructure for private vehicles should largely be financed through instruments that charge users directly. The issue is not just about sustainable funding but also sustainable transport.
Shifting public funds towards sustainable modes might involve subsidizing the ongoing operations of transit services. Decisions on fares, subsidy levels, and mechanisms are politically complex, but it is generally preferable to target subsidies at specific user groups such as low-income communities for whom affordability is a key constraint on their mobility.198 By using smart cards and carefully screening beneficiaries, it is possible to minimize leakage of the subsidy to higher-income users who can afford to contribute more.199 Bogotá demonstrated this with its National
Box 5 | Financing Transit by Partnering with Real Estate Developers in China
The Chinese city of Shenzhen is among those that have
successfully adopted a rail-plus-property (R+P) strategy
to help finance extensions to their transit system. R+P
models feature a partnership between the public sector,
transit companies, and developers to coordinate planning
and financing of transit systems and adjacent real estate
developments. The approach takes advantage of land-
value increases of between 5 and 20 percent that have
been observed near metro stations in Chinese cities. Using
a mechanism that has evolved over the last decade, the
Shenzhen city government sold transit-adjacent land to the
metro company at below-market prices. After developing
the land in partnership with property developers, the metro
company was required to turn 50 percent of the profit
over to the city to cover the metro’s operational subsidies.
The company was also allowed to raise half of the capital
costs for metro construction itself, after being granted
pieces of undeveloped land by the municipality. This land
was then used as collateral for borrowing on the capital
markets. Since 2011 Shenzhen has financed about half
of the US$1.3 billion required for Phase 3 of its metro by
developing 156 hectares of land using the R+P model.
Source: Xue and Fang, 2015.

34 |
Figure 8 | Balanced multimodal transport policy is an antidote to the vicious cycle of car-oriented development
Note: NMT refers to “non-motorized transport.”Source: Authors.
Increasing population and
city size
Demand for greater mobility and
access
VICIOUS CYCLE OF CAR-ORIENTED TRANSPORT POLICY
Investment only in roads Demand for more roads
Number of under-served grows
Economic productivity and competitiveness declines
Transit performance drops
Traffic congestion grows
Vehicle volume grows
Funding for infrastructure slows
VIRTUOUS CYCLE OF BALANCED, MULTIMODAL TRANSPORT POLICY
Balanced investment in transit, NMT, demand management
Trips spread across modes
Transit performance improvesNumber of
under-served declinesEconomic productivity and
competitiveness grows
New revenue for infrastructure
WORLD RESOURCES REPORT | Towards a More Equal City | May 2019 | 35
From Mobility to Access for All: Expanding Urban Transportation Choices in the Global South
Beneficiary Selection System (Sistema Nacional de Selección de Beneficiarios) subsidy. It provides up to a 60 percent discount on a maximum of 40 trips per month on its integrated public transport network, and the subsidy is aimed at social welfare beneficiaries.200 Early evaluations showed that it is used mostly by people on the outskirts of the city with the highest fare burdens, and that the free transfer has increased overall accessibility levels in the city.201
5. CONCLUSION: CHOOSING THE RIGHT POLICY PACKAGEHow can cities move towards providing more equitable and sustainable access to opportunities for all their residents? They can start by framing the problem differently. The accessibility problem is not a question of how to provide better travel conditions for cars, trucks, and motorcycles. This is an unattainable and ultimately self-defeating vision that locks cities into a vicious cycle of trying to serve the already mobile while ignoring the very actions that are needed to address traffic congestion (see Figure 8). Instead, cities should recognize that they do not have to choose between equity and efficiency. Improving multimodal accessibility offers the best chance of achieving both equitable access and economic growth and competitiveness in the long run while ensuring higher environmental quality and a more sustainable city overall.
In the short run, however, making this shift may require taking on the demands of private vehicle users, who are often very vocal in defense of their privileged access to road space and hidden subsidies.202 The political economy in most countries is such that even would-be car owners—the current mobile under-served—support these demands in the hope of benefiting from them in future. Changing this mindset requires cities to articulate and start implementing a steady program of interventions to demonstrate the benefits of a more balanced policy package to multiple constituencies. A good starting point may be projects that provide improved transit, walking, and biking alternatives to mobile under-served commuters—who use either transit or cars—in order to demonstrate a way out of worsening traffic congestion that affects both groups. Consistent policies and more integrated planning is key, as road space reallocation needs to be coordinated with strategic improvements in public transport alternatives. This helps build coalitions of support for a growing multimodal policy agenda.
This paper has presented a diverse set of potential priority actions that can help achieve this agenda (See Figure 9). Not all actions will be relevant to every city. The nature, scale, and pace of a city’s actions will vary depending on the challenges it faces. As a starting point, the access-mobility framework outlined in this paper may be a useful tool for understanding the local landscape of under-served and well-served communities. A local action agenda can develop from that, tailored to the development stage of the city and the availability of human, political, and financial resources. For instance, for towns and smaller cities, the main priority might be to improve basic accessibility by providing road and nonmotorized infrastructure using the principles outlined under Action Area 1. Medium-sized cities, especially those growing into larger cities, might need to pay more attention to connecting fast-growing edge settlements to the urban fabric via balanced arterials and quality transit services. At the same time, actions aimed at promoting the integration and improvement of informal and formal transit (if any) might be needed, including fare integration and building selected dedicated infrastructure (Action Area 2).
While traffic congestion is still less severe, medium-sized cities can set themselves on a path towards multimodal accessibility that will avoid locking them into costly car-based development patterns later on. Containing the growth in trip distances by pursuing compact and transit-oriented development patterns is a key strategy at this stage. Large cities and metropolitan areas typically have to deal with already severe traffic congestion, so trip densities are likely high enough so that dedicated transit systems can have game-changing benefits for the city as a whole. Integration with private shared mobility services and informal transit providers can produce the same benefits. Lastly, large cities should grasp opportunities to move towards managing the demand for private vehicle use whenever they present themselves. For example, they can reform parking policy, vary charges on existing toll roads by time of day and day of the week, and combine precinct redevelopment with street pedestrianization (Action Area 3). In fact, many large cities face such complex challenges that action is required on all three fronts.
The rapid urbanization and expansion of cities in the global South over the coming decades is a significant challenge. Massive investments will have to be made in housing stock and infrastructure. But with a clear vision of how to serve all residents rather than an elite few, cities can use this challenge as an opportunity to build better, more accessible cities for all their residents, to everyone’s benefit.

36 |
Figure 9 | Priority actions and enabling conditions for expanding transportation choices in the global South
Source: Authors.
ACTION AREA 1: Build complete, democratic, and safe street networks
▸ Complete street networks
▸ Democratize streets by reprioritizing road space
▸ Improve pedestrian safety and security
ACTION AREA 2: Develop an ecosystem of integrated, user-oriented transport services
▸ Connect existing services into an integrated multimodal network
▸ Invest in priority public transport infrastructure
▸ Proactively upgrade and integrate informal operators
▸ Harness technology to improve productivity and the user experience
ACTION AREA 3: Manage the demand for private vehicle use
▸ Discourage private vehicle use in dense city cores
▸ Price car use and parking
▸ Promote shared mobility solutions
▸ Ensure new development is either transit-oriented or has potential to be well-served by public transport
ENA
BLI
NG
C
ON
DIT
ION
S
Capable, visionary governance and planning institutions
EQUITABLE ACCESS TO OPPORTUNITIES
Adequate and sustainable funding
BUS LANE
BUS
METRO

WORLD RESOURCES REPORT | Towards a More Equal City | May 2019 | 37
From Mobility to Access for All: Expanding Urban Transportation Choices in the Global South
ENDNOTES1. Beard et al., 2016: 1.
2. Hidalgo and Huizenga, 2013: 66.
3. Jain, 2011.
4. Francis, 1987: 23–39.
5. The idea that accessibility should be analyzed together with transport use or mobility was suggested earlier by other authors, including Preston and Rajé (2007), Venter (2014), and Martens (2017). Martens further developed the idea into a two-axis plot that was a useful starting place for our analysis. Our analysis is novel, however, in the way we define mobility and the subsequent interpretation of the findings.
6. Bocarejo and Oviedo, 2012; Carruthers et al., 2005; Gwilliam, 2002.
7. Walking accounts for between 36 percent and 90 percent of daily trips in African cities (See Behrens et al., 2004; Stucki, 2015) and between 40 percent and 63 percent of daily trips in Asian cities (See Leather et al., 2011).
8. Rosén and Sander, 2009.
9. Data in this section are from BRTData. (Database.) Porto Alegre: WRI Brasil Ross Center for Sustainable Cities. Accessed April 17, 2019. https://brtdata.org.
10. Mahendra and Seto, 2019. This accompanying World Resources Report (WRR) paper on managing urban expansion in cities of the global South addresses these issues in depth.
11. AfDB, 2012; UN-Habitat, 2013: 8.
12. UN Habitat, 2013: 8.
13. This is according to the Atlas of Urban Expansion, which tracks the change in urban extent in a global sample of 200 cities with populations of more than 100,000 in two periods: 1990–2000 and 2000–2015. The study also projects that in less developed countries, urban extents could increase by 1.8–3.7 times between 2015–2050, depending on whether land consumption per capita remains constant or increases at current rates. See Angel et al., 2016.
14. Beard et al., 2016: 1.
15. Hidalgo and Huizenga, 2013: 66.
16. Jain, 2011.
17. Chin, 2011; Kamakaté and Gordon, 2009; Pai et al., 2014: 7.
18. Ahmed et al., 2008; Hook and Howe, 2005; Sietchiping et al., 2012.
19. Downs, 2004; Goodwin, 1996. The “triple convergence” refers to existing travelers changing their behavior in response to the added road capacity by changing their mode (from public transit, cycling, or walking to driving, or from carpooling to driving alone); changing their travel time from less convenient to more convenient times, when everyone tends to travel; and changing their route from more congested roads or less direct routes they took to avoid congestion to the expanded road. This induced demand is the reason that road widening is a very short-term fix for congestion and is not an effective solution to the problem.
20. Mahendra et al., 2013; IIHS, 2011.
21. Cervero, 2013; Gwilliam, 2002.
22. Hook and Howe, 2005; UNEP, 2011.
23. Newman and Kenworthy, 1996.
24. Banister, 2018; Mahendra, 2014.
25. Candiracci, 2009.
26. Walking accounts for between 36 percent and 90 percent of daily trips in African cities. See Behrens et al., 2004; Stucki, 2015.
27. Walking accounts for between 40 percent and 63 percent of daily trips in Asian cities. See Leather et al., 2011.
28. Hidalgo and Huizenga, 2013; Scholl et al., 2016.
29. Jain and Tiwari, 2010.
30. The term informal transit refers to small-enterprise private transit providers operating substantially outside of the ambit of formal transport planning and regulatory processes. They are also sometimes called paratransit operators (not to be confused with dial-a-ride services in North America). Very common in the global South, these operators employ a range of vehicle types and sizes, ranging from two-wheeler taxis to full-size buses. Operational strategies also range across a continuum from formal to informal, depending on the scope and nature of government control. Without trying to impose a strict definition, we refer to all operations with some measure of informality as informal transit.
31. Salazar Ferro, 2015: 9.
32. Beard et al., 2016.
33. For insights on how national policy frameworks may deal with issues of equity and sustainability, refer to Cartwright et al. (2018) and Rode et al. (2017).
34. Handy, 1994.
35. Many recent research papers have explored the meaning of accessibility, its measurement, and its potential as a conceptual and practical tool for spatial and infrastructure planning. Recent overviews are provided by El-Geneidy and Levinson (2006); Geurs and Van Wee (2004); and Venter (2016b).
36. Andreasen and Møller-Jensen, 2017; Peralta Quirós and Mehndiratta, 2015.
37. Guzman et al., 2017; Campbell et al., 2019.
38. Bocarejo and Oviedo, 2012; Jaramillo et al., 2012; Lucas, 2012.
39. Several researchers have suggested that accessibility may be an appropriate measure of transport equity and have demonstrated it using suitable metrics in global South cities. See Bocarejo and Oviedo, 2012; Guzman et al., 2017; Martens and Bastiaanssen, 2016; Zuidgeest et al., 2013.
40. Defining accessibility using this cumulative opportunity measure has the advantage that it is relatively easy to calculate and interpret and allows direct comparison across cities or times, as noted by El-Geneidy and Levinson (2006). Its main drawback is its sensitivity to the selected threshold parameters, which have varied between 15 and 75 minutes in other studies. (See Abley and Halden, 2013; Fan et al., 2010; Manaugh and El-Geneidy, 2012.) The 60-minute threshold is appropriate for cities with large commute sheds, as recommended by El-Geneidy and Levinson.
41. The extent of the analysis covered only Mexico City (formerly the Federal District of Mexico City) and not the larger metropolitan area.
42. Similar patterns are observed elsewhere in the global South. In Bogotá, for instance, high-income residents enjoy accessibility levels that are 15 percent to 35 percent higher than those of the lowest-income groups (see Guzman et al., 2017.)
43. The existence of an absolute measure of “sufficient accessibility” has been suggested theoretically by Martens (2017) but not quantified.
44. Martens, 2017; Vasconcellos, 2004.

38 |
45. Transport zones are geographical units used in transport models, typically about the size of a single suburb.
46. King et al., 2017.
47. Venter, 2014.
48. Banister, 2008; Ewing et al., 2003; Hidalgo and Huizenga, 2013.
49. Bocarejo and Oviedo, 2012; Carruthers et al., 2005; Gwilliam, 2002.
50. Lucas, 2011; Martens and Bastiaanssen, 2016.
51. In Johannesburg, about 36 percent of nontravelers cited unaffordability of transport relative to their incomes as the main reason for not traveling. See Gotz et al., 2015.
52. Salon and Aligula, 2012.
53. Vasconcellos, 2004.
54. Oviedo Hernandez and Titheridge, 2016.
55. Lucas, 2011.
56. The problems around urban expansion are dealt with in more detail in a recent World Resources Report (WRR) paper on managing urban expansion in the global South. See Mahendra and Seto, 2019.
57. Mahendra, 2018.
58. Gwilliam, 2002.
59. Howe and Bryceson, 2000; Cervero, 2013.
60. In Addis Ababa, Dar es Salaam, Kigali, and Nairobi, the average household in formal housing is even farther away from job centers than is the average slum dwelling, confirming that the “mobile under-served” cuts across lower- and middle-income demographics. See Antos et al., 2016: 6–7.
61. Antos et al., 2016; Gotz et al., 2015.
62. Duarte and Ultramari, 2011; Oviedo Hernandez and Titheridge, 2016.
63. Hook and Howe, 2005.
64. Oviedo Hernandez and Titheridge, 2016.
65. Gwilliam, 2002.
66. Ewing and Cervero, 2010.
67. Buehler et al., 2017.
68. Angel, 2008.
69. Antos et al., 2016: 9–10.
70. Oviedo Hernandez and Titheridge, 2016.
71. Scholl et al., 2016; Stucki, 2015.
72. Scholl et al., 2016.
73. World Streets 3.0, 2011.
74. Hook and Howe, 2005; Howe and Bryceson, 2000; Beukes et al., 2017.
75. Welle et al., 2015.
76. Leather et al., 2011; WHO, 2009.
77. Hook and Howe, 2005; UNEP, 2011.
78. Hidalgo and Pai, 2009: 8.
79. All-weather roads should make adequate provision for drainage, especially in high-rainfall cities prone to flooding.
80. Stucki, 2015.
81. Venter et al., 2014.
82. Howe and Bryceson, 2000; Pucher et al., 2010.
83. Cervero, 2005a: 18; Teunissen et al., 2015.
84. Behrens and Makajuma, 2017.
85. Howe and Bryceson, 2000.
86. See De Langen and Tembele, 2001; UNEP, 2011; Welle et al., 2015.
87. Rosén and Sander, 2009.
88. Howe and Bryceson, 2000; Pucher et al., 2010.
89. Duduta et al., 2015.
90. Changcheng et al., 2010.
91. Duduta et al., 2015; Welle et al., 2015.
92. Pucher and Buehler, 2008.
93. Mehndiratta and Rodriguez, 2017a; Vasconcellos, 2001.
94. Authors’ calculations from UITP, 2015a, 2015b.
95. Salazar Ferro, 2015.
96. Salazar Ferro, 2015.
97. Shlaes and Mani, 2013: 24.
98. Figueroa, 2013.
99. Cervero and Golub, 2007; Gilbert, 2008.
100. Barter, 2008; Mehndiratta and Rodriguez, 2017a.
101. Carrigan et al., 2014; Dewey, 2016; Hidalgo and Gutiérrez, 2013.
102. Hidalgo and Gutiérrez, 2013; Mehndiratta and Rodriguez, 2017a; Scorcia and Munoz-Raskin, 2019.
103. For example, 30 percent of the operators in Bogotá's Integrated Public Transport System declared bankruptcy. See: Rodriguez et al., 2017.
104. For example, in Monterrey, Mexico. See: Mehndiratta and Rodriguez, 2017a.
105. Behrens et al., 2015; Kring and Rothboeck, 2014.
106. Gwilliam, 2003; Gannon et al., 2001.
107. Mahadevia et al., 2012.
108. Salazar Ferro, 2015.
109. EMBARQ, 2014.
110. Behrens et al., 2015; Salazar Ferro, 2015.
111. Bocarejo et al., 2014a; Venter, 2016a.
112. Accessibility may decrease if the time and cost imposed by an additional transfer is not offset by savings on the remainder of the journey (see Salazar Ferro and Behrens, 2015; Hook and Howe, 2005).
113. Lleras, 2003.
114. EMBARQ, 2014.
115. Cervero, 2005b; TERI, 2013.
116. Bocarejo et al., 2014a; Salazar Ferro, 2015; Behrens et al., 2015.

WORLD RESOURCES REPORT | Towards a More Equal City | May 2019 | 39
From Mobility to Access for All: Expanding Urban Transportation Choices in the Global South
117. Wright and Montezuma, 2004.
118. It is worth noting that passengers sometimes benefit from current informal fare practices—for instance, through discretionary discounts or credit allowed by drivers—that are lost when moving to formal payment.
119. Mehndiratta and Rodriguez, 2017b.
120. Hook and Howe, 2005.
121. Scholl et al., 2016; Zuidgeest et al., 2013; Deng and Nelson, 2012; Lionjanga and Venter, 2017.
122. Venter et al., 2018.
123. Scorcia and Munoz-Raskin, 2019.
124. ITDP, 2016; Hidalgo and Gutiérrez, 2013.
125. Kumar et al., 2011.
126. Salazar Ferro and Behrens, 2015.
127. Salazar Ferro, 2015.
128. Behrens et al., 2015; Mehndiratta and Rodriguez, 2017a.
129. TERI, 2013.
130. Salazar Ferro, 2015.
131. Cervero and Golub, 2007.
132. Salazar Ferro and Behrens, 2015.
133. For examples of dynamic trip planning, including informal modes, see the online version of Sakay (https://sakay.ph), which includes Jeep routes in Manila, and Guateng on the Move (https://movinggauteng.co.za/), which includes formal bus and rail and informal minibus-taxis in Gauteng, South Africa.
134. Klopp et al., 2017; Campoy, 2016; Eros et al., 2014.
135. Economist, 2017; Uber, 2018.
136. Bhattacharya, 2018.
137. Bhattacharya, 2018.
138. Shared-Use Mobility Center, 2015.
139. Dasgupta, 2017; Chadha, 2017.
140. Hidalgo and Huizenga, 2013; Jain, 2011; Sustainable Mobility for All, 2017.
141. Schiller and Kenworthy, 2017.
142. Cox, 2017.
143. Vuchic, 1999.
144. Litman, 1997; Vuchic, 1999.
145. Vuchic, 1999.
146. Litman, 1997.
147. Landman and Badenhorst, 2012.
148. Buehler et al., 2017; Hidalgo and Huizenga, 2013.
149. Chen and Zhao, 2013.
150. Hidalgo and Huizenga, 2013; Mahendra, 2008; Yang et al., 2014.
151. Eskeland and Feyzioglu, 1997.
152. Fiscal options for reducing car ownership, such as increased car ownership taxes, import duties, and fuel taxes, are not discussed here as they are usually national rather than city-level policies. See Button and Verhoef, 1998.
153. For studies tracking the impacts of charging in London, Stockholm, and Singapore, see Eliasson et al. (2009), Santos (2005), and the annual impact monitoring reports issued by Transport for London (TfL, 2008).
154. Litman, 1997.
155. Hidalgo and Huizenga, 2013; Mahendra, 2008.
156. Bocarejo et al., 2014b.
157. Pierce and Shoup, 2013.
158. Barter, 2013.
159. Kodransky and Hermann, 2010: 52.
160. Shoup, 2017.
161. Hook and Howe, 2005.
162. Canales et al., 2017.
163. ITF, 2017.
164. Canales et al., 2017.
165. There is some evidence from the United States that ride-hailing services attract users away from bus services (a 6 percent reduction) and light rail services (a 3 percent reduction). See Clewlow and Mishra, 2017.
166. ITDP, 2014; Sarmiento et al., 2014; Carlton, 2007.
167. Cervero and Dai, 2014.
168. Mahendra, 2018.
169. Jacobson and Forsyth, 2008; Sarmiento et al., 2014; ITDP, 2014.
170. Rodriguez and Vergel, 2013.
171. For guidance on inclusive housing and TOD, see “Module 7: Inclusive TOD: Affordable Housing and Job Creation” on the WRI Cities Hub, http://wricitieshub.org/teaching-training-material/transit-oriented-development-tod-corridor-scale.
172. Suzuki et al., 2015; Ballard et al., 2017. See also the WRR case study on the transit-oriented development corridors project in Johannesburg by Pieterse and Owens (2018).
173. See the WRR case study on Ahmedabad’s town planning schemes by Mahadevia et al. (2018) and the WRR paper on urban expansion in the global South by Mahendra and Seto (2019).
174. Cervero, 2005a.
175. Kumar et al., 2011.
176. Davis and Dewey, 2015; Song, 2017.
177. Stucki, 2015.
178. EMBARQ, 2014.
179. Dewey, 2016; Kumar et al., 2011.
180. Bocarejo et al., 2014b; Mahadevia et al., 2012.
181. Hook and Howe, 2005; Howe and Bryceson, 2000.
182. Mahendra and Seto, 2019.
40 |
183. Kash and Hidalgo, 2012; Sagaris, 2016.
184. Ardila-Gomez and Ortegon-Sanchez, 2016.
185. For comprehensive discussions on the range of finance options available for transport and the benefits of each, see Ardila-Gomez and Ortegon-Sanchez (2016), AFD (2014), and Salat and Ollivier (2017).
186. Binsted et al., 2010.
187. Suzuki et al., 2015; Salon and Shewmake, 2011.
188. Suzuki et al., 2015.
189. Hook and Howe, 2005.
190. Leape, 2006; Kodransky and Hermann, 2010: 5.
191. Small, 2005.
192. Ardila-Gomez and Ortegon-Sanchez, 2016.
193. Most of the research on the benefits of active lifestyles is from countries in the global North (see Woodcock et al., 2009). The evidence in the global South is less clear; while chronic diseases linked to sedentary lifestyles are growing fast, trade-offs exist between the health benefits of more walking and the costs of increased exposure to air pollution.
194. Cycling Embassy of Denmark, 2017.
195. Massink et al., 2011: 3.
196. INE, 2008.
197. WHO, 2013.
198. Carruthers et al., 2005.
199. Pucher et al., 2004.
200. Rodriguez et al., 2016.
201. Rodriguez et al., 2016; Bocarejo et al., 2014a; Peralta Quirós and Rodriguez, 2016.
202. Ardila-Gomez and Ortegon-Sanchez, 2016; Paget-Seekins, 2016.
REFERENCESAbley, S., and D. Halden. 2013. The New Zealand Accessibility Analysis Methodology. Wellington, New Zealand: NZ Transport Agency.
AFD (Agence Française de Développement). 2014. Who Pays What for Urban Transport? Handbook of Good Practices. Paris: AFD, Ministry of Ecology, Sustainable Development and Energy, and Cooperation for Urban Mobility in the Developing World.
AfDB (African Development Bank). 2012. “Joint Statement by the Multilateral Development Banks on Sustainable Transport and Climate Change.” Abidjan, Côte d’Ivoire: AfDB.
Ahmed, Q.I., H. Lu, and S. Ye. 2008. “Urban Transportation and Equity: A Case Study of Beijing and Karachi.” Transportation Research Part A: Policy and Practice 42 (1): 125–39.
Alliance for Biking & Walking. 2016. Bicycling & Walking in the United States: 2016 Benchmarking Report. Washington, DC: Alliance for Biking & Walking.
Andreasen, M.H., and L. Møller-Jensen. 2017. “Access to the City: Mobility Patterns, Transport and Accessibility in Peripheral Settlements of Dar es Salaam.” Journal of Transport Geography 62 (June): 20–29.
Angel, S. 2008. “Preparing for Urban Expansion: A Proposed Strategy for Intermediate Cities in Ecuador.” In The New Global Frontier: Urbanization, Poverty and Environment in the 21st Century, edited by G. Martine, G. McGranahan, M. Montgomery, and R. Fernandez-Castilla, 115–30. London: Earthscan.
Angel, S., A.M. Blei, J. Parent, P. Lamson-Hall, and N. Galarza Sánchez. 2016. Atlas of Urban Expansion—2016 Edition. Vol. 1, Areas and Densities. New York: New York University; Nairobi: United Nations Human Settlements Programme; and Cambridge, MA: Lincoln Institute of Land Policy.
Antos, S.E., S.V. Lall, and N. Lozano-Gracia. 2016. “The Morphology of African Cities.” Policy Research Working Paper 7911. Washington, DC: World Bank.
Ardila-Gomez, A., and A. Ortegon-Sanchez. 2016. Sustainable Urban Transport Financing from the Sidewalk to the Subway: Capital, Operations, and Maintenance Financing. Washington, DC: World Bank.
Ballard, R., R. Dittgen, P. Harrison, and A. Todes. 2017. “Megaprojects and Urban Visions: Johannesburg’s Corridors of Freedom and Modderfontein.” Transformation: Critical Perspectives on Southern Africa 95 (1): 111–39.
Banister, D. 2008. “The Sustainable Mobility Paradigm.” Transport Policy 15 (2): 73–80.
Banister, D. 2018. Inequality in Transport. Marcham, UK: Alexandrine.
Barter, P.A. 2008. “Public Planning with Business Delivery of Excellent Urban Public Transport.” Policy and Society 27 (2): 103–14.
Barter, P.A. 2013. “Adaptive Parking: A Flexible Framework for Parking Reform.” Paper presented at the Land Transport Authority–Union Internationale des Transports Publics Singapore International Transport Congress and Exhibition, Singapore, October 7–10.

WORLD RESOURCES REPORT | Towards a More Equal City | May 2019 | 41
From Mobility to Access for All: Expanding Urban Transportation Choices in the Global South
Beard, V., A. Mahendra, and M. Westphal. 2016. “Towards a More Equal City: Framing the Challenges and Opportunities.” Working Paper. Washington, DC: World Resources Institute.
Behrens, R., and G. Makajuma. 2017. “Pedestrian Crossing Behaviour in Cape Town and Nairobi: Observations and Implications.” In Non-motorized Transport Integration into Urban Transport Planning in Africa, edited by W.V. Mitullah, M. Vanderschuren, and M. Khayesi, 27–56. London: Routledge.
Behrens, R., D. McCormick, and D. Mfinanga. 2015. Paratransit in African Cities: Operations, Regulation and Reform. London: Routledge.
Behrens, R., L.D. Olvera, D. Plat, and P. Pochet. 2004. “Meta-analysis of Travel of the Poor in West and Southern African Cities.” Paper presented at the Tenth World Conference on Transport Research, Istanbul Technical University, Istanbul, Turkey, July 4–8.
Beukes, E., M. Vanderschuren, and M. Zuidgeest. 2017. “Access and Mobility: Multi-modal Approaches to Transport Infrastructure Planning.” In Non-motorized Transport Integration into Urban Transport Planning in Africa, edited by W.V. Mitullah, M. Vanderschuren, and M. Khayesi, 126–49. London: Routledge.
Bharadwaj, K.V.A., and A. Bhat. 2015. “App-based Aggregator Suspends Shuttle Bus Services for Want of Permit.” Hindu, September 20. https://www.thehindu.com/news/cities/bangalore/appbased-aggregator-suspends-shuttle-bus-services-for-want-of-permit/article7670500.ece. Accessed June 15, 2018.
Bhattacharya, A. 2018. “As Uber Sputters, Ola Is Really Stepping on the Gas in India.” Quartz Media, February 15. https://qz.com/1200878/with-uber-in-crisis-ola-zooms-ahead-in-indias-taxi-wars. Accessed December 15, 2018.
Binsted, A., D. Bongardt, H. Dalkmann, and K. Sakamoto. 2010. Accessing Climate Finance for Sustainable Transport. Eschborn, Germany: Deutsche Gesellschaft für Internationale Zusammenarbeit.
Bocarejo, J.P., D. Escobar, D.O. Hernandez, and D. Galarza. 2014a. “Accessibility Analysis of the Integrated Transit System of Bogotá.” International Journal of Sustainable Transportation 10 (4): 308–20.
Bocarejo, J.P., and D.R. Oviedo. 2012. “Transport Accessibility and Social Inequities: A Tool for Identification of Mobility Needs and Evaluation of Transport Investments.” Journal of Transport Geography 24 (September): 142–54.
Bocarejo, J.P., J.M. Velasquez, and D.C. Galarza. 2014b. “Challenges of Implementing à la Mode Transport Projects: Case Studies of Bus Rapid Transit and Cable Cars in Colombian Cities.” Transportation Research Record 2451 (1): 131–38.
Buehler, R., J. Pucher, R. Gerike, and T. Götschi. 2017. “Reducing Car Dependence in the Heart of Europe: Lessons from Germany, Austria, and Switzerland.” Transport Reviews 37 (1): 4–28.
Button, K., and E. Verhoef, eds. 1998. Road Pricing, Traffic Congestion and the Environment. Cheltenham, UK: Edward Elgar.
CAF (Corporación Andina de Fomento). n.d. (Database.) Observatorio de Movilidad Urbana. https://www.caf.com/es/temas/o/observatorio-de-movilidad-urbana/ciudades. Accessed April 15, 2016.
Campbell, K.B., J.A. Rising, J.M. Klopp, and J.M. Mbilo. 2019. “Accessibility across Transport Modes and Residential Developments in Nairobi.” Journal of Transport Geography 74 (January): 77–90.
Campoy, A. 2016. “Mexico City Is Attempting to Map Its More than 1,000 Unwieldy Bus Routes with a Crowdsourcing App.” Quartz Media, January 22. https://qz.com/598895/mexico-city-is-attempting-to-map-its-more-than-1000-unwieldy-bus-routes-with-a-crowdsourcing-app. Accessed December 15, 2018.
Canales, D., S. Bouton, E. Trimble, J. Thayne, L. Da Silva, S. Shastry, S. Knupfer, and M. Powell. 2017. “Connected Urban Growth: Public-Private Collaborations for Transforming Urban Mobility.” Working Paper. Washington, DC: Coalition for Urban Transitions.
Candiracci, S. 2009. “Climate Change, Urbanization and Sustainable Urban Transport in Developing Countries Cities.” PowerPoint presentation. Nairobi: United Nations Human Settlements Programme.
Carlton, I. 2007. “Histories of Transit-oriented Development: Perspectives on the Development of the TOD Concept: Real Estate and Transit, Urban and Social Movements, Concept Protagonist.” Berkeley, CA: Institute of Urban and Regional Development.
Carrigan, A., R. King, J.M. Velasquez, M. Raifman, and N. Duduta. 2014. Social, Environmental and Economic Impacts of BRT Systems: Bus Rapid Transit Case Studies from around the World. Washington, DC: EMBARQ, World Resources Institute.
Carruthers, R., M. Dick, and A. Saurkar. 2005. “Affordability of Public Transport in Developing Countries.” Working Paper. Washington, DC: World Bank.
Cartwright, A., I. Palmer, A. Taylor, E. Pieterse, S. Parnell, and S. Colenbrander. 2018. “Developing Prosperous and Inclusive Cities in Africa—National Urban Policies to the Rescue?” Working Paper. Washington, DC: Coalition for Urban Transitions.
CET (Companhia de Engenharia de Tráfego). 2017. “Acidentes de trânsito: Relatório anual 2017.” São Paulo: Prefeitura de São Paulo.
Cervero, R. 2005a. “Accessible Cities and Regions: A Framework for Sustainable Transport and Urbanism in the 21st Century.” Berkeley, CA: UC Berkeley Center for Future Urban Transport.
Cervero, R. 2005b. “Progressive Transport and the Poor: Bogota’s Bold Steps Forward.” Access Magazine 1 (27): 24–30.
Cervero, R., and D. Dai. 2014. “BRT TOD: Leveraging Transit Oriented Development with Bus Rapid Transit Investments.” Transport Policy 36 (November): 127–38.
Cervero, R., and A. Golub. 2007. “Informal Transport: A Global Perspective.” Transport Policy 14 (6): 445–57.
Cervero, R.B. 2013. “Linking Urban Transport and Land Use in Developing Countries.” Journal of Transport and Land Use 6 (1): 7–24.
Chadha, J. 2017. “Beyond Uber: How the Private Sector Is Disrupting Mobility.” City Fix (blog), October 31. http://thecityfix.com/blog/beyond-uber-how-the-private-sector-is-disrupting-mobility-jyot-chadha. Accessed December 15, 2018.

42 |
Chadha, J., O. Shetty, and S. Shastry. Forthcoming. “Assessment of Environmental Impact of Bus Aggregator in India’s National Capital Region.” Washington, DC: World Resources Institute Ross Center for Sustainable Cities.
Changcheng, L., Z. Gaoqiang, Z. Jianjun, and Z. Hao. 2010. “First Engineering Practice of Traffic Calming in Zhaitang Town in China.” Paper presented at the International Conference on Optoelectronics and Image Processing, Haiko, China, November 11–12.
Chen, X., and J. Zhao. 2013. “Bidding to Drive: Car License Auction Policy in Shanghai and Its Public Acceptance.” Transport Policy 27 (May): 39–52.
Chin, H. 2011. Sustainable Urban Mobility in South-Eastern Asia and the Pacific. Nairobi: United Nations Human Settlements Programme.
Clewlow, R.R., and G.S. Mishra. 2017. Disruptive Transportation: The Adoption, Utilization, and Impacts of Ride-Hailing in the United States. Davis: Institute of Transportation Studies, University of California, Davis.
Cox, W. 2017. “Access in the City.” NewGeography, January 27. http://www.newgeography.com/content/005520-access-city. Accessed December 15, 2018.
Cycling Embassy of Denmark. 2017. Danish Cycling Know-How. Copenhagen: Cycling Embassy of Denmark.
Dasgupta, A. 2017. “How Cities Can Harness the Good—and Avoid the Bad—of the New Mobility Movement.” City Fix (blog), November 3. http://thecityfix.com/blog/ohow-cities-can-harness-the-good-and-avoid-the-bad-of-the-new-mobility-movement-ani-dasgupta. Accessed December 15, 2018.
Davis, D.E., and O.F. Dewey. 2015. “Strategies for Constructive Change.” Research Brief 5. Gothenburg, Sweden: Volvo Research and Education Foundations.
De Langen, M., and R. Tembele. 2001. Productive and Liveable Cities: Guidelines for Pedestrian and Bicycle Traffic in African Cities. Rotterdam, Netherlands: A.A. Balkema.
Deng, T., and J.D. Nelson. 2012. “The Perception of Bus Rapid Transit: A Passenger Survey from Beijing Southern Axis BRT Line 1.” Transportation Planning and Technology 35 (2): 201–19.
Dewey, O.F. 2016. How Mexico City Is Transforming a Jitney System into a World Class Bus Rapid Transit System. Cambridge, MA: Harvard University Graduate School of Design.
Dewey, O.F., and C. Zegras. 2012. “The Costs of Inclusion: Incorporating Existing Bus Operators into Mexico City’s Emerging Bus Rapid Transit System.” Paper prepared for the Twelfth Conference on Advanced Systems for Public Transport, Santiago, Chile, July 23–27.
Downs, A. 2004. Traffic: Why It’s Getting Worse, What Government Can Do. Washington, DC: Brookings Institution.
Duarte, F., and C. Ultramari. 2011. “Making Public Transport and Housing Match: Accomplishments and Failures of Curitiba’s BRT.” Journal of Urban Planning and Development 138 (2): 183–94.
Duduta, N., C. Adriazola-Steil, C. Wass, D. Hidalgo, L. Lindau, and V. John. 2015. Traffic Safety on Bus Priority Systems: Recommendations for Integrating Safety into the Planning, Design, and Operation of Major Bus Routes. Washington, DC: EMBARQ, World Resources Institute.
Economist. 2017. “Grab Battles Uber in South-East Asia,” February 9. https://www.economist.com/business/2017/02/09/grab-battles-uber-in-south-east-asia. Accessed December 15, 2018.
El-Geneidy, A.M., and D.M. Levinson. 2006. Access to Destinations: Development of Accessibility Measures. St. Paul: Minnesota Department of Transportation.
Eliasson, J., L. Hultkrantz, L. Nerhagen, and L.S. Rosqvist. 2009. “The Stockholm Congestion-Charging Trial 2006: Overview of Effects.” Transportation Research Part A: Policy and Practice 43 (3): 240–50.
EMBARQ. 2014. Mainstreaming Informal Public Transport (IPT) Systems into Formal Bus Transport: Stage 1—Case Studies of IPT Sector Reforms. Delhi: EMBARQ, World Resources Institute.
Eros, E., S. Mehndiratta, C. Zegras, K. Webb, and M. Ochoa. 2014. “Applying the General Transit Feed Specification to the Global South: Experiences in Mexico City, Mexico—and Beyond.” Transportation Research Record 2442 (1): 44–52.
Eskeland, G.S., and T. Feyzioglu. 1997. “Rationing Can Backfire: The ‘Day without a Car’ in Mexico City.” World Bank Economic Review 11 (3): 383–408.
Ewing, R., and R. Cervero. 2010. “Travel and the Built Environment.” Journal of the American Planning Association 76 (3): 265–94.
Ewing, R., R. Pendall, and D. Chen. 2003. “Measuring Sprawl and Its Transportation Impacts.” Transportation Research Record 1831 (1): 175–83.
Fan, Y., A. Guthrie, and D.M. Levinson. 2010. “Impact of Light Rail Implementation on Labor Market Accessibility: A Transportation Equity Perspective.” Journal of Transport and Land Use 5 (3): 28–39.
Figueroa, O. 2013. “Four Decades of Changing Transport Policy in Santiago, Chile.” Research in Transportation Economics 40 (1): 87–95.
Francis, M. 1987. The Making of Democratic Streets, Public Streets for Public Use. Edited by A.V. Moudon. New York: Columbia University Press.
Gannon, C., K. Gwilliam, Z. Liu, and C.M. Calvo. 2001. Transport: Infrastructure and Services. Washington, DC: World Bank.
Geurs, K.T., and B. Van Wee. 2004. “Accessibility Evaluation of Land-Use and Transport Strategies: Review and Research Directions.” Journal of Transport Geography 12 (2): 127–40.
Gilbert, A. 2008. “Bus Rapid Transit: Is Transmilenio a Miracle Cure?” Transport Reviews 28 (4): 439–67.
Goodwin, P.B. 1996. “Empirical Evidence on Induced Traffic.” Transportation 23 (1): 35–54.

WORLD RESOURCES REPORT | Towards a More Equal City | May 2019 | 43
From Mobility to Access for All: Expanding Urban Transportation Choices in the Global South
Gotz, G., C. Wray, C. Venter, W. Badenhorst, G. Trangoš, and C. Culwick. 2015. Mobility in the Gauteng City-Region. Johannesburg: Gauteng City-Region Observatory.
Guzman, L.A., D. Oviedo, and C. Rivera. 2017. “Assessing Equity in Transport Accessibility to Work and Study: The Bogotá Region.” Journal of Transport Geography 58 (January): 236-46.
Gwilliam, K. 2003. “Urban Transport in Developing Countries.” Transport Reviews 23 (2): 197–216.
Gwilliam, K.M. 2002. Cities on the Move: A World Bank Urban Transport Strategy Review. Washington, DC: World Bank.
Handy, S.L. 1994. “Highway Blues: Nothing a Little Accessibility Can’t Cure.” Access Magazine 5: 3–7.
Hidalgo, D. 2009. “Citywide Transit Integration in a Large City: The Interligado System of São Paulo, Brazil.” Transportation Research Record 2114: 19–27.
Hidalgo, D., and A. Carrigan. 2010. Modernizing Public Transportation, Lessons Learned from Major Bus Improvements in Latin America and Asia. Washington, DC: EMBARQ, World Resources Institute.
Hidalgo, D., and L. Gutiérrez. 2013. “BRT and BHLS around the World: Explosive Growth, Large Positive Impacts and Many Issues Outstanding.” Research in Transportation Economics 39 (1): 8–13.
Hidalgo, D., and C. Huizenga. 2013. “Implementation of Sustainable Urban Transport in Latin America.” Research in Transportation Economics 40 (1): 66–77.
Hidalgo, D., and M. Pai. 2009. Delhi Bus Corridor: An Evaluation. Washington, DC: EMBARQ, World Resources Institute.
Hook, W., and J. Howe. 2005. “Transport and the Millennium Development Goals: A Background Paper to the Task Force on Slum Dwellers of the Millennium Project.” New York: Institute for Transportation and Development Policy.
Howe, J., and D. Bryceson. 2000. Poverty and Urban Transport in East Africa: Review of Research and Dutch Donor Experience. Delft, Netherlands: International Institute for Infrastructural Hydraulic and Environmental Engineering.
IIHS (Indian Institute for Human Settlements). 2011. “Urban India 2011: Evidence.” India Urban Conference, “Evidence and Experience,” Delhi, November 17–21.
INE (Instituto Nacional de Ecología). 2008. The Benefits and Costs of a Bus Rapid Transit System in Mexico City—Final Report. Mexico City: INE.
ITDP (Institute for Transport and Development Policy). 2014. TOD Standard. New York: ITDP.
ITDP. 2016. The BRT Standard. New York: ITDP.
ITF (International Transport Forum). 2017. Transition to Shared Mobility: How Large Cities Can Deliver Inclusive Transport Services. Paris: Organisation for Economic Co-operation and Development.
Jacobson, J., and A. Forsyth. 2008. “Seven American TODs: Good Practices for Urban Design in Transit-oriented Development Projects.” Journal of Transport and Land Use 1 (2): 51–88.
Jain, A. 2011. Sustainable Urban Mobility in Southern Asia. Nairobi: United Nations Human Settlements Programme.
Jain, H., and G. Tiwari. 2010. “Discrete Route Choice Model for Bicyclists in Pune, India.” Urban Transport Journal 9 (2): 1–2.
Jaramillo, C., C. Lizárraga, and A.L. Grindlay. 2012. “Spatial Disparity in Transport Social Needs and Public Transport Provision in Santiago de Cali (Colombia).” Journal of Transport Geography 24 (September): 340–57.
Jennings, G., and R. Behrens. 2017. The Case for Investing in Paratransit: Strategies for Regulation and Reform. Gothenburg, Sweden: Volvo Research and Education Foundations.
Kamakaté, F., and D. Gordon. 2009. Managing Motorcycles: Opportunities to Reduce Pollution and Fuel Use from Two- and Three-Wheeled Vehicles. Washington, DC: International Council on Clean Transportation.
Kash, G., and D. Hidalgo. 2012. “User Perception of Bogotá’s Integrated Public Transport System: Trends and Implications for Program Implementation.” Paper presented at the Transportation Research Board Ninety-First Annual Meeting, Washington, DC, January 22–26.
King, R., M. Orloff, T. Virsilas, and T. Pande. 2017. “Confronting the Urban Housing Crisis in the Global South: Adequate, Secure, and Affordable Housing.” Working Paper. Washington, DC: World Resources Institute.
Klopp, J., D. Orwa, P. Waiganjo Wagacha, S. Williams, and A. White. 2017. “Informal 2.0: Seeing and Improving Urban Informal Practices through Digital Technologies—the Digital Matatus Case in Nairobi.” Field Actions Science Reports 16: 39–43.
Kodransky, M., and G. Hermann. 2010. Europe’s Parking U-Turn: From Accommodation to Regulation. New York: Institute for Transportation and Development Policy.
Korde, K. 2016. “5 App-based Buses Seized in RTO Crackdown.” Hindustan Times, April 21. https://www.hindustantimes.com/mumbai/5-app-based-buses-seized-in-rto-crackdown/story-MJlgdz7FgheBxT9EtJKUXM.html. Accessed December 15, 2018.
Kring, T., and S. Rothboeck. 2014. Promoting Transition Towards Formalization: Selected Good Practices in Four Sectors. New Delhi: International Labour Organization.

44 |
Kumar, A., S. Zimmerman, and O. Agarwal. 2011. “International Experience in Bus Rapid Transit (BRT) Implementation: Synthesis of Lessons Learned from Lagos, Johannesburg, Jakarta, Delhi, and Ahmedabad.” Economist, June 25.
Landman, K., and W. Badenhorst. 2012. Gated Communities and Spatial Transformation in Greater Johannesburg. Johannesburg: University of the Witwatersrand.
Leape, J. 2006. “The London Congestion Charge.” Journal of Economic Perspectives 20 (4): 157–76.
Leather, J., H. Fabian, S. Gota, and A. Mejia. 2011. “Walkability and Pedestrian Facilities in Asian Cities: State and Issues.” Working Paper. Manila: Asian Development Bank.
Lionjanga, N., and C. Venter. 2017. “Time-Series Analysis of Accessibility in the City of Johannesburg.” Paper prepared for the Thirty-Sixth Southern African Transport Conference, Pretoria, July 10–13.
Litman, T. 1997. “Full Cost Accounting of Urban Transportation: Implications and Tools.” Cities 3 (14): 169–74.
Lleras, G.C. 2003. Bus Rapid Transit: Impacts on Travel Behavior in Bogotá. Cambridge, MA: Department of Urban Studies and Planning, Massachusetts Institute of Technology.
Lucas, K. 2011. “Making the Connections between Transport Disadvantage and the Social Exclusion of Low Income Populations in the Tshwane Region of South Africa.” Journal of Transport Geography 19 (6): 1320–34.
Lucas, K. 2012. “A Critical Assessment of Accessibility Planning for Social Inclusion.” In Accessibility and Transport Planning: Challenges for Europe and North America, edited by K. Geurs, K.J. Krizek, and A. Reggiani, 228–42. Cheltenham, UK: Edward Elgar.
Mahadevia, D., R. Joshi, and A. Datey. 2012. Low-Carbon Mobility in India and the Challenges of Social Inclusion: Bus Rapid Transit (BRT) Case Studies in India. Roskilde: United Nations Environment Programme Risoe Centre on Energy, Climate and Sustainable Development, Technical University of Denmark.
Mahadevia, D., M. Pai, and A. Mahendra. 2018. “Ahmedabad: Town Planning Schemes for Equitable Development—Glass Half Full or Half Empty?” World Resources Report Case Study. Washington, DC: World Resources Institute.
Mahendra, A. 2008. “Vehicle Restrictions in Four Latin American Cities: Is Congestion Pricing Possible?” Transport Reviews 28 (1): 105–33.
Mahendra, A. 2014. “Universal Access to Affordable Housing, Social Services, and Public Utilities: Water and Sanitation, Transport, Energy and Waste Management.” Final Issues Paper. Washington, DC: World Resources Institute.
Mahendra, A. 2018. “Balancing Accessibility with Aspiration: Urban Transport Planning in the Global South.” In The Routledge Companion to Planning in the Global South, edited by V. Watson, G. Bhan, and S. Srinivas, 225–40. London: Routledge.
Mahendra, A., M. Raifman, and H. Dalkmann. 2013. “Financing Needs for Sustainable Transport Systems in the 21st Century.” Background Paper for Seventh Regional Environmentally Sustainable Transport Forum in Asia, Bali, Indonesia April 23–25.
Mahendra, A., and K.C. Seto. 2019. “Upward and Outward Growth: Managing Urban Expansion for More Equitable Cities in the Global South.” Working Paper. Washington, DC: World Resources Institute.
Manaugh, K., and A. El-Geneidy. 2012. “Who Benefits from New Transportation Infrastructure? Using Accessibility Measures to Evaluate Social Equity in Public Transport Provision.” In Accessibility Analysis and Transport Planning: Challenges for Europe and North America, edited by K. Geurs, K.J. Krizek, and A. Reggiani, 211–27. Cheltenham, UK: Edward Elgar.
Martens, K. 2017. Transport Justice: Designing Fair Transportation Systems. New York: Routledge.
Martens, K., and J. Bastiaanssen. 2016. “An Index to Measure Accessibility Poverty Risk.” Paper presented at the Transportation Research Board Ninety-Fifth Annual Meeting, Washington, DC, January 22–26.
Massink, R., M. Zuidgeest, J. Rijnsburger, O.L. Sarmiento, and M. Van Maarseveen. 2011. “The Climate Value of Cycling.” Paper presented at the Natural Resources Forum.
Mehndiratta, S.R., and C. Rodriguez. 2017a. “Bus Reform in Developing Countries—Reflections on the Experience Thus Far.” Policy Note. Washington, DC: World Bank.
Mehndiratta, S.R., and C. Rodriguez. 2017b. “From Nairobi to Manila, Mobile Phones Are Changing the Lives of Bus Riders.” Transport for Development (blog), February 14. http://blogs.worldbank.org/transport/nairobi-manila-mobile-phones-are-changing-lives-bus-riders. Accessed December 15, 2018.
Mukul, J. 2016. “Bus Aggregator Shuttl Plans NCR Expansion.” Business Standard, May 23. https://www.business-standard.com/article/companies/bus-aggregator-shuttl-plans-ncr-expansion-116052300036_1.html. Accessed June 15, 2018.
Newman, P.W., and J.R. Kenworthy. 1996. “The Land Use–Transport Connection: An Overview.” Land Use Policy 13 (1): 1–22.
Oviedo Hernandez, D., and H. Titheridge. 2016. “Mobilities of the Periphery: Informality, Access and Social Exclusion in the Urban Fringe in Colombia.” Journal of Transport Geography 55 (July): 152–64.
Paget-Seekins, L. 2016. “Conflict over Public Space.” In Restructuring Public Transport through Bus Rapid Transit: An International and Interdisciplinary Perspective, edited by J.C. Munoz and L. Paget-Seekins, 163–80. Bristol, UK: Policy.
Pai, M., R. Gadgil, A. Mahendra, S. Vernekar, R. Heywood, and R. Chanchani. 2014. “Motorized Two-Wheelers in Indian Cities: A Case Study of the City of Pune.” Working Paper. Mumbai: EMBARQ India, World Resources Institute.
Peralta Quirós, T., and S.R. Mehndiratta. 2015. “Accessibility Analysis of Growth Patterns in Buenos Aires, Argentina: Density, Employment, and Spatial Form.” Transportation Research Record 2512 (January): 101–9.
Peralta Quirós, T., and C. Rodriguez. 2016. “To Measure the Real Impact of Transport Services, Affordability Needs to Be Part of the Equation.” Transport for Development (blog), December 15. http://blogs.worldbank.org/transport/measure-real-impact-transport-services-affordability-needs-be-part-equation. Accessed December 15, 2018.
WORLD RESOURCES REPORT | Towards a More Equal City | May 2019 | 45
From Mobility to Access for All: Expanding Urban Transportation Choices in the Global South
Pierce, G., and D. Shoup. 2013. “Getting the Prices Right: An Evaluation of Pricing Parking by Demand in San Francisco.” Journal of the American Planning Association 79 (1): 67–81.
Pieterse, E., and K. Owens. 2018. “Johannesburg: Confronting Spatial Inequality.” World Resources Report Case Study. Washington, DC: World Resources Institute.
Preston, J., and F. Rajé. 2007. “Accessibility, Mobility and Transport-related Social Exclusion.” Journal of Transport Geography 15 (3): 151–60.
Pucher, J., and R. Buehler. 2008. “Making Cycling Irresistible: Lessons from the Netherlands, Denmark and Germany.” Transport Reviews 28 (4): 495–528.
Pucher, J., J. Dill, and S. Handy. 2010. “Infrastructure, Programs, and Policies to Increase Bicycling: An International Review.” Preventive Medicine 50 (Supplement): S106–25.
Pucher, J., N. Korattyswaroopam, and N. Ittyerah. 2004. “The Crisis of Public Transport in India: Overwhelming Needs but Limited Resources.” Journal of Public Transportation 7 (3): 95–113.
Rode, P., C. Heeckt, R. Ahrend, O. Huerta Melchor, A. Robert, N. Badstuber, A. Hoolachan, and C. Kwami. 2017. “Integrating National Policies to Deliver Compact, Connected Cities: An Overview of Transport and Housing.” Working Paper. Washington, DC: Coalition for Urban Transitions.
Rodriguez, C., T. Peralta‐Quiros, L.A. Guzmán, and S.A.C. Reyes. 2017. “Bogotá’s Bus Reform Process: Accessibility & Affordability Effects, Lessons Learnt & Alternatives to Tackle Informal Services.” In Transportation Research Board 96th Annual Meeting (No. 17-04961).
Rodriguez, C., J.M. Gallego, D. Martinez, S. Montoya, and T. Peralta-Quirós. 2016. “Examining Implementation and Labor Market Outcomes of Targeted Transit Subsidies: Subsidy by Sistema Nacional de Selección de Beneficiarios for Urban Poor in Bogotá, Colombia.‐ Transportation Research Record 2581 (1): 9–17.
Rodriguez, D.A., and E. Vergel. 2013. “Bus Rapid Transit and Urban Development in Latin America.” Land Lines 25 (1): 14–20.
Rosén, E., and U. Sander. 2009. “Pedestrian Fatality Risk as a Function of Car Impact Speed.” Accident Analysis and Prevention 41 (3): 536–42.
Sagaris, L. 2016. “Strategic Participation for Change.” In Restructuring Public Transport through Bus Rapid Transit: An International and Interdisciplinary Perspective, edited by J.C. Munoz and L. Paget-Seekins, 101–26. Bristol, UK: Policy.
Salat, S., and G. Ollivier. 2017. Transforming the Urban Space through Transit-oriented Development: The 3V Approach. Washington, DC: World Bank.
Salazar Ferro, P. 2015. Paratransit: A Key Element in a Dual System. Lyon, France: Cooperation for Urban Mobility in the Developing World.
Salazar Ferro, P., and R. Behrens. 2015. “From Direct to Trunk-and-Feeder Public Transport Services in the Urban South: Territorial Implications.” Journal of Transport and Land Use 8 (1): 123–36.
Salon, D., and E.M. Aligula. 2012. “Urban Travel in Nairobi, Kenya: Analysis, Insights, and Opportunities.” Journal of Transport Geography 22 (May): 65–76.
Salon, D., and S. Shewmake. 2011. “Opportunities for Value Capture to Fund Public Transport: A Comprehensive Review of the Literature with a Focus on East Asia.” Mandaluyong, Philippines, and New York: Asian Development Bank and Institute for Transport and Development Policy.
Santos, G. 2005. “Urban Congestion Charging: A Comparison between London and Singapore.” Transport Reviews 25 (5): 511–34.
Sarmiento, C., L. Zamorano, R. King, A. Lobo, S. Herrera, and J. Clerc. 2014. Transit-oriented Development (TOD) Guide for Urban Communities. Washington, DC: World Resources Institute.
Schalekamp, H., A. Golub, and R. Behrens. 2015. “Approaches to Paratransit Reform.” In Paratransit in African Cities: Operations, Regulation and Reform, edited by R. Behrens, D. McCormick, and D. Mfinanga, 100–124. London: Routledge.
Schiller, P.L., and J.R. Kenworthy. 2017. An Introduction to Sustainable Transportation: Policy, Planning and Implementation. Abingdon, UK: Earthscan.
Scholl, L., C. Bouillon, D. Oviedo, L. Corsetto, and M. Jansson. 2016. Urban Transport and Poverty: Mobility and Accessibility Effects of IDB-supported BRT Systems in Cali and Lima. Washington, DC: Inter-American Development Bank.
Scorcia, H., and R. Munoz-Raskin. 2019. “Why South African Cities Are Different? Comparing Johannesburg Rea Vaya Bus Rapid Transit System with Its Latin American Siblings.” Case Studies on Transport Policy. https://doi.org/10.1016/j.cstp.2019.01.010. Accessed May 7, 2019.
Shared-Use Mobility Center. 2015. “Shared-Use Mobility Reference Guide,” December 10. http://sharedusemobilitycenter.org/research/shared-use-mobility-reference-guide. Accessed December 15, 2018.
Shlaes, E., and A. Mani. 2013. A Case Study of the Auto-Rickshaw Sector in Mumbai. Mumbai: EMBARQ India, World Resources Institute.
Shoup, D. 2017. The High Cost of Free Parking: Updated Edition. London: Routledge.
Sietchiping, R., M.J. Permezel, and C. Ngomsi. 2012. “Transport and Mobility in Sub-Saharan African Cities: An Overview of Practices, Lessons and Options for Improvements.” Cities 29 (3): 183–89.
Small, K. 2005. “Road Pricing and Public Transit: Unnoticed Lessons from London.” Access Magazine 26 (3): 10–15.
Song, L. 2017. “How to Transform Urban Transport: The Role of Political Leadership and Governance.” Cambridge, MA: Harvard University Graduate School of Design.
Soni, S. 2014. “Legal Challenges for BRTS-Indore.” PowerPoint presentation. Indore, India: Atal Indore City Transport Services Ltd.
Stucki, M. 2015. “Policies for Sustainable Accessibility and Mobility in Urban Areas of Africa.” Working Paper. Washington, DC: World Bank Group.
Sustainable Mobility for All. 2017. Global Mobility Report 2017: Tracking Sector Performance. Washington, DC: Sustainable Mobility for All.
46 |
Suzuki, H., J. Murakami, Y. Hong, and B. Tamayose. 2015. Financing Transit-oriented Development with Land Values: Adapting Land Value Capture in Developing Countries. Washington, DC: World Bank Group.
TERI (The Energy and Resources Institute). 2013. Pro-Poor Mobility: Policy Guidelines and Case Studies. Nairobi: United Nations Human Settlements Programme.
Teunissen, T., O. Sarmiento, M. Zuidgeest, and M. Brussel. 2015. “Mapping Equality in Access: The Case of Bogotá’s Sustainable Transportation Initiatives.” International Journal of Sustainable Transportation 9 (7): 457–67.
TfL (Transport for London). 2008. Central London Congestion Charging Impacts Monitoring: Sixth Annual Report. London: Transport for London.
Tracxn. 2016. “Tracxn Report: Transport Tech—India.” PowerPoint presentation. Bengaluru, India: Tracxn.
Uber. 2018. “UberBoda Has Arrived in Kampala.” Uber Blog, March 29. https://www.uber.com/en-UG/blog/uberboda-kampala. Accessed January 15, 2019.
UITP (Union Internationale des Transports Publics). 2015a. Mobility in Cities Database. Full dataset. Brussels: UITP.
UITP. 2015b. Passenger Transport Mode Shares in World Cities. Brussels: UITP.
UNEP (United Nations Environment Programme). 2011. Share the Road: Design Guidelines for Non Motorised Transport in Africa. Nairobi: UNEP.
UN-Habitat (United Nations Human Settlements Programme). 2013. Planning and Design for Sustainable Urban Mobility: Global Report on Human Settlements 2013. Nairobi: UN-Habitat.
Vasconcellos, E.A. 2001. Urban Transport Environment and Equity: The Case for Developing Countries. London: Routledge.
Vasconcellos, E.A. 2004. “Transport Metabolism, Social Diversity and Equity: The Case of Sao Paulo, Brazil.” Journal of Transport Geography 13 (4): 329–39.
Venter, C. 2014. “Access and Mobility in Gauteng’s Priority Townships: What Can the 2011 Quality of Life Survey Tell Us?” Paper prepared for the Thirty-Third Southern African Transport Conference, Pretoria, July 7–10.
Venter, C. 2016a. “Assessing the Potential of Bus Rapid Transit–Led Network Restructuring for Enhancing Affordable Access to Employment—the Case of Johannesburg’s Corridors of Freedom.” Research in Transportation Economics 59 (November): 441–49.
Venter, C. 2016b. Developing a Common Narrative on Urban Accessibility: A Transportation Perspective. Washington, DC: Brookings Institution.
Venter, C., G. Jennings, D. Hidalgo, and A.F. Valderrama Pineda. 2018. “The Equity Impacts of Bus Rapid Transit: A Review of the Evidence and Implications for Sustainable Transport.” International Journal of Sustainable Transportation 12 (2): 140–52.
Venter, C.J., M. Molomo, and M. Mashiri. 2014. “Supply and Pricing Strategies of Informal Rural Transport Providers.” Journal of Transport Geography 41 (December): 239–48.
Vuchic, V. 1999. Transportation for Livable Cities. London: Routledge.
Welle, B., W. Li, C. Adriazola, R. King, M. Obelheiro, O. Sarmiento, and Q. Liu. 2015. Cities Safer by Design: Urban Design Recommendations for Healthier Cities, Fewer Traffic Fatalities. Washington, DC: World Resources Institute, Ross Center for Sustainable Cities.
WHO (World Health Organization). 2009. Global Status Report on Road Safety: Time for Action. Geneva: WHO.
WHO. 2013. Pedestrian Safety: A Road Safety Manual for Decision-Makers and Practitioners. Geneva: WHO.
Woodcock, J., P. Edwards, C. Tonne, B.G. Armstrong, O. Ashiru, D. Banister, S. Beevers et al. 2009. “Public Health Benefits of Strategies to Reduce Greenhouse-Gas Emissions: Urban Land Transport.” Lancet 374 (9705): 1930–43.
World Streets 3.0. 2011. “What Percent of Your City’s Street Space Is Allocated to Non-car Uses.” April 3. https://worldstreets.wordpress.com/2011/03/04/what-percent-of-your-citys-street-space-is-allocated-to-non-car-uses. Accessed May 30, 2018.
Wright, L., and R. Montezuma. 2004. “Reclaiming Public Space: The Economic, Environmental, and Social Impacts of Bogotá’s Transformation.” Paper presented at the Cities for People Conference, “Walk21,” Copenhagen.
WRI (World Resources Institute) India Sustainable Cities. 2012. Public Health and Road Safety Study for BRTS Indore. Gandhinagar India: WRI India Ross Center.
Xue, L., and W. Fang. 2015. “Rail Plus Property Development in China: The Pilot Case of Shenzhen.” Working Paper. Washington, DC: World Resources Institute.
Yang, J., Y. Liu, P. Qin, and A.A. Liu. 2014. “A Review of Beijing’s Vehicle Registration Lottery: Short-Term Effects on Vehicle Growth and Fuel Consumption.” Energy Policy 75 (December): 157–66.
Zuidgeest, M.H.P., N. Gupta, M.J.G. Brussel, A. Salzberg, F.H.M. van den Bosch, T. Munshi, and M.F.A.M. van Maarseveen. 2013. “Measuring Accessibility to Jobs for the Urban Poor.” Paper presented at the Proceedings of the 13th World Conference on Transport Research, Rio de Janiero, July 15–18.
WORLD RESOURCES REPORT | Towards a More Equal City | May 2019 | 47
From Mobility to Access for All: Expanding Urban Transportation Choices in the Global South
ACKNOWLEDGMENTSThe authors are grateful to several people who supported the development of this paper and provided insights on the substance. We are grateful to Ani Dasgupta, Global Director of the WRI Ross Center for Sustainable Cities; Victoria Beard, Fellow; and Holger Dalkmann, former Director of the EMBARQ program at WRI, who helped guide this work in the early stages. Several discussions with them helped us sharpen our focus and arrive at the analytical approach we wished to take. We also thank Robin King, a core member of the WRR team, who provided valuable feedback as we developed our ideas.
From the Ross Center’s Urban Mobility team, we are grateful to Sergio Avelleda, Ben Welle, and Claudia Adriazola-Steil for their insights. We are also grateful to Nahungu Lionjanga, Willem Badenhorst, Thet Hein Tun, David Escalante, Roberto Ascencio Rojas, Vipassana Vijayarangan, and Diego Canales for assisting with the case study analysis for Johannesburg and Mexico City.
Colleagues in WRI’s offices in India, Brazil, and Mexico provided valuable feedback as we shared the data and considered strategies that have or have not worked. From the Ross Center’s Research and Knowledge Exchange team, Jillian Du provided excellent support at different stages in the writing, editing, production, and communications parts of this work. Maria Hart supported us with communications and outreach.
Comments from reviewers helped us sharpen our arguments and enhance our work. External reviewers included Arturo Adrila Gomez, Jeff Gutman, Karen Lucas, and Daniel Rodriguez. Internal reviewers were OP Agarwal, Victoria Beard, Jyot Chadha, Ani Dasgupta, Toni Lindau, and Renata Marson. We also thank Gregory Taff from WRI’s Science and Research team for his review of the paper. Emily Matthews and Lauri Scherer provided strong editorial support. We are grateful to Carni Klirs and Billie Kanfer for excellent support on graphic design and layout. We thank Schuyler Null, Talia Rubnitz, and Tini Tran for communications support. Romain Warnault provided support with production and Craig Brownstein helped us get the word out through timely media engagement.
We express gratitude to the UK Department for International Development for funding this work and are pleased to acknowledge our institutional strategic partners, who provide core funding to WRI: the Netherlands Ministry of Foreign Affairs, the Royal Danish Ministry of Foreign Affairs, and the Swedish International Development Cooperation Agency.
ABOUT THE AUTHORSChristo Venter is Associate Professor in Civil Engineering and a researcher at the Centre for Transport Development at the University of Pretoria in South Africa. His research and teaching interests center on the planning, design, and operations of multimodal transport systems in countries of the global South, with a specific focus on how to balance equity and sustainability concerns in highly unequal societies. He has authored numerous scholarly papers and reports, with some of his recent work examining accessibility metrics for equitable transport planning. He has worked in sub-Saharan Africa, India, and the United States. Anjali Mahendra is the Director of Research, WRI Ross Center for Sustainable Cities. She leads the research agenda, guiding the Ross Center’s worldwide team in conducting robust, innovative, and policy-relevant research on urban issues, including WRI’s flagship World Resources Report Towards a More Equal City. She has authored several publications on urban transport and land-use policies, their public health impacts, their regional economic development and equity impacts, and their potential for climate action. Her recent work has focused on the challenges of urban expansion and improving accessibility in cities of the global South. She has worked in the United States, Latin America, Europe, and India.
Dario Hidalgo is the Executive Director of Fundación Despacio and a senior consultant for the WRI Ross Center for Sustainable Cities’ international team of transport engineers and planners. He was previously the Director of Integrated Transport at WRI. His work is involved in walking, bicycling, public transport, new mobility and demand management projects, and policy support in multiple developing countries, particularly in Colombia, Mexico, Brazil, Turkey, India, and China. He also coordinates the Observatory of the BRT Center of Excellence.
ABOUT WORLD RESOURCES INSTITUTE World Resources Institute is a global research organization that turns big ideas into action at the nexus of environment, economic opportunity, and human well-being.
Our ChallengeNatural resources are at the foundation of economic opportunity and human well-being. But today, we are depleting Earth’s resources at rates that are not sustainable, endangering economies and people’s lives. People depend on clean water, fertile land, healthy forests, and a stable climate. Livable cities and clean energy are essential for a sustainable planet. We must address these urgent, global challenges this decade.
Our VisionWe envision an equitable and prosperous planet driven by the wise management of natural resources. We aspire to create a world where the actions of governments, businesses, and communities combine to eliminate poverty and sustain the natural environment for all people.
ABOUT WRI ROSS CENTER FOR SUSTAINABLE CITIESWRI Ross Center for Sustainable Cities works to make urban sustainability a reality. Global research and on-the-ground experience in Brazil, China, India, Mexico, Turkey, and the United States combine to spur action that improves life for millions of people.
Based on long-standing global and local experience in urban planning and mobility, WRI Sustainable Cities uses proven solutions and action-oriented tools to increase building and energy efficiency, manage water risk, encourage effective governance, and make the fast-growing urban environment more resilient to new challenges.
Aiming to influence 200 cities with unique research and tools, WRI Sustainable Cities focuses on a deep cross-sector approach in four megacities on two continents, and targeted assistance to 30 more urban areas, bringing economic, environmental, and social benefits to people in cities around the globe.
Copyright 2019 World Resources Institute. This work is licensed under the Creative Commons Attribution 4.0 International License. To view a copy of the license, visit http://creativecommons.org/licenses/by/4.0/
10 G Street, NE | Washington, DC 20002 | www.WRIRossCities.org
ABOUT THIS WORLD RESOURCES REPORTThis is the sixth thematic paper in a series of working papers that comprise the World Resources Report (WRR), Towards a More Equal City. It will be followed by other working papers on access to water and sanitation. To obtain an electronic copy of this and/or other working papers, and to view supporting materials under the WRR project, please visit www.citiesforall.org.
FUNDERSWe deeply appreciate the following donors for their generous financial support:
United Kingdom Department for International DevelopmentStephen M. Ross PhilanthropiesDenmark Ministry of Foreign AffairsIreland Department of Foreign Affairs and TradeNetherlands Ministry of Foreign AffairsSwedish International Development Cooperation AgencyUnited Nations Development Programme