torrefaction method and apparatus technology and progress
TRANSCRIPT
Renewable Fuel Technologies, Torrefaction Method and Apparatus Page1/17
Torrefaction Method and Apparatus Technology and progress report on a mobile system
for producing BioCoal from waste biomass September, 2010
Mark Wechsler, Art Shulenberger, Chad Wall, Jim Braig
Renewable Fuel Technologies
10 South Third Street
San Jose, CA 95113 http://www.biocoal.com
Renewable Fuel Technologies, Torrefaction Method and Apparatus Page2/17
Abstract
Torrefaction is considered to be an ideal pre-treatment technology to make biomass suitable for (coal) co-firing applications.i
Torrefaction is a thermo chemical treatment of biomass at 200 to 320 °C. It is carried out under atmospheric conditions and in the absence of oxygen. During the process, the water contained in the biomass as well as volatiles are removed. The biopolymers (cellulose, hemicellulose and lignin) partly decompose giving off various types of volatiles. The final product is the remaining solid, dry, blackened material which is referred to as “torrefied biomass” or “BioCoal”. During the process, the biomass loses typically 30% of its mass while only 20% of the energy content . (The lost energy can be used as a heating fuel for the torrefaction process.)
RFT is developing a mobile torrefaction reactor to convert waste biomass into BioCoal, on site, in the forest, where the waste is generated from lumbering, thinning, or other forest maintenance. An indirectly heated, screw auger reactor with load locks has been designed and constructed in small scale to test and demonstrate the technology. This prototype produces finished product from a mixed input of waste wood, supplied by Northern California’s Pacific Gas and Electric utility, at a rate of 5.0-6.0 lbs/hour with an energy content of 21-22 MJ/kg. This compares favorably to bituminous coal at 24-35 MJ/kg depending on the source region. The prototype is approximately 10’ X 3’ X 6’ incorporating an 8’ long, 4” diameter process auger and operates under computer control using electricity for heat. As of September 2010, the prototype has been in operation for over 300 hours, producing over 1,500 pounds of torrefied wood.
Keywords
Torrefaction, Biomass, BioCoal, Screw reactor, Auger, Mobile torrefaction reactor, Co-firing.
Renewable Fuel Technologies, Torrefaction Method and Apparatus Page3/17
Contents Page Abstract ................................................................................................................... 2 Keywords ................................................................................................................. 2 List of Figures ........................................................................................................... 3 Introduction ............................................................................................................. 4
a. Problem definition ........................................................................................... 4 b. Solution ........................................................................................................ 4 c. Objectives and general approach ....................................................................... 4
Background torrefaction ............................................................................................. 5 The prototype apparatus ............................................................................................ 5
a. Design goals .................................................................................................. 5 b. Input hopper ................................................................................................. 6 c. Input load lock ............................................................................................... 7 d. System purge ................................................................................................ 8 e. Heating zones ................................................................................................ 9
i. Heater technology ....................................................................................... 9 f. Process Auger .............................................................................................. 10
i. Auger design ............................................................................................ 10 ii. Motion Control .......................................................................................... 10
g. Torrefaction Gas ........................................................................................... 10 i. Gas condenser system ............................................................................... 11
h. Exit load lock ............................................................................................... 11 i. Monitored and logged variables ....................................................................... 12 j. Control System ............................................................................................ 13
Operating parameters .............................................................................................. 14 Results .................................................................................................................. 15 References ............................................................................................................. 17
List of Figures Figure 1, Sources of Electricity, from EIA Energy Outlook 2008 ......................................... 4 Figure 2, RFT Prototype Torrefaction Reactor, September 2010. ........................................ 6 Figure 3, Input Hopper ............................................................................................... 6 Figure 4, Input Load Lock, dual pinch valves .................................................................. 7 Figure 5, Loader State Machine, logic of loading biomass via the load lock. ......................... 7 Figure 7, Pinch Valve Operation ................................................................................... 8 Figure 8, Torrefaction zone heater power....................................................................... 9 Figure 9, Dowtherm A vapor pressure ........................................................................... 9 Figure 10, Auger Motion ........................................................................................... 10 Figure 12, RAM for clearing conduit to condenser stack .................................................. 11 Figure 13, Variables Logged ...................................................................................... 12 Figure 14, User Front Panel ....................................................................................... 13 Figure 15, Loader Control Parameter Screen ................................................................ 13 Figure 16, Technical Reference Screen ........................................................................ 13 Figure 17, Standard Operating Parameters .................................................................. 14 Figure 18 , Torrefaction Process Results ...................................................................... 15 Figure 19, Natural and Torrefied Biomass Mid IR Absorbance Spectrum ............................ 16 Figure 20, Biomass, pre torrefaction ........................................................................... 16 Figure 21, BioCoal, post torrefaction ........................................................................... 16
Renewable Fuel Technologies, Torrefaction Method and Apparatus Page4/17
Introduction
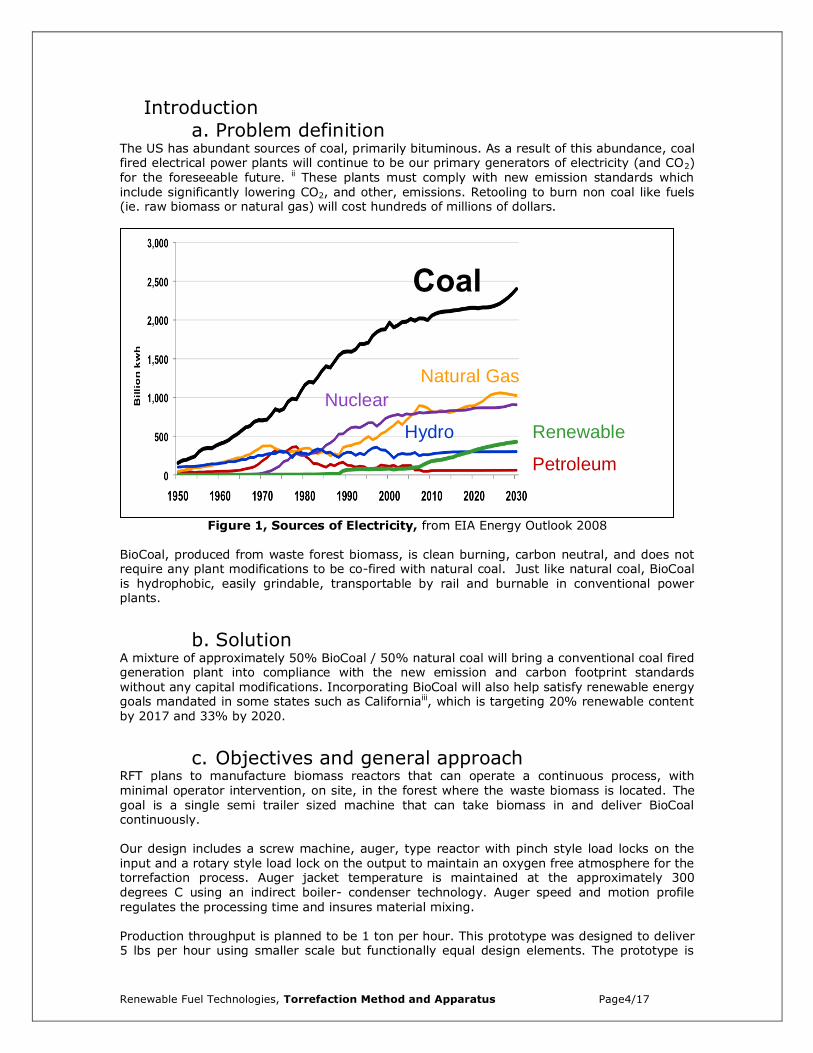
a. Problem definition The US has abundant sources of coal, primarily bituminous. As a result of this abundance, coal fired electrical power plants will continue to be our primary generators of electricity (and CO2) for the foreseeable future. ii These plants must comply with new emission standards which include significantly lowering CO2, and other, emissions. Retooling to burn non coal like fuels (ie. raw biomass or natural gas) will cost hundreds of millions of dollars.
Figure 1, Sources of Electricity, from EIA Energy Outlook 2008
BioCoal, produced from waste forest biomass, is clean burning, carbon neutral, and does not require any plant modifications to be co-fired with natural coal. Just like natural coal, BioCoal is hydrophobic, easily grindable, transportable by rail and burnable in conventional power plants.
b. Solution A mixture of approximately 50% BioCoal / 50% natural coal will bring a conventional coal fired generation plant into compliance with the new emission and carbon footprint standards without any capital modifications. Incorporating BioCoal will also help satisfy renewable energy goals mandated in some states such as Californiaiii, which is targeting 20% renewable content by 2017 and 33% by 2020.
c. Objectives and general approach RFT plans to manufacture biomass reactors that can operate a continuous process, with minimal operator intervention, on site, in the forest where the waste biomass is located. The goal is a single semi trailer sized machine that can take biomass in and deliver BioCoal continuously. Our design includes a screw machine, auger, type reactor with pinch style load locks on the input and a rotary style load lock on the output to maintain an oxygen free atmosphere for the torrefaction process. Auger jacket temperature is maintained at the approximately 300 degrees C using an indirect boiler- condenser technology. Auger speed and motion profile regulates the processing time and insures material mixing. Production throughput is planned to be 1 ton per hour. This prototype was designed to deliver 5 lbs per hour using smaller scale but functionally equal design elements. The prototype is
Natural Gas
Nuclear
Renewable
Petroleum
Hydro
Coal
Renewable Fuel Technologies, Torrefaction Method and Apparatus Page5/17
controlled by computer and multiple temperature, pressure auger position and power sensors provide continuous data output which is used for automatic control and is also logged.
Background torrefactioniv Torrefaction is a thermo-chemical treatment method in the first place earmarked by an operating temperature within the range of 280-300 °C. It is carried out under atmospheric conditions and in absence of oxygen. During the process, the biomass partly decomposes giving off various types of volatiles. The final product is the remaining solid, which is often referred to as torrefied biomass, char or BioCoal. In open literature, torrefaction can be found under several synonyms. Some examples are roasting, slow- and mild pyrolysis, wood cooking and high-temperature drying. Especially the link with pyrolysis is easy to make since torrefaction comprises the very first decomposition reactions of pyrolysis, although process conditions are different. The name torrefaction is adopted from the roasting of coffee beans, which is however performed at lower temperature while using air (oxygen). Nevertheless, an important mechanical effect of torrefaction on biomass is supposed to be similar to its effect on coffee beans, which is the resulting brittle structure. In the 1930’s the principles of torrefaction were first reported in relation to woody biomass and in France research was carried out on its application to produce a gasifier fuelv. Since then, the process received attention again, when it was recognized that torrefied wood could be used as a reducing agent in metallurgic applications. This led to a demonstration plant in 1980’s, which was dismantled in the beginning of the 1990’s of the last century. During the last five years, again torrefaction received attention to upgrade biomass for energy production. Typically, 70% of the mass is retained as a solid product, containing 80% of the initial energy content. A large part of the mass loss is water which boosts the usable energy value significantly. Hence, a considerable energy densification can be achieved, typically by a factor of 3.2 Lower Heating Value (LHV) on mass basis. This example points out one of the fundamental advantages of the process, which is the high transition of the chemical energy from the feedstock to the torrefied product, whilst fuel properties are improved. This is the technology behind the goal of “on site” torrefaction in the RFT system. On site torrefaction reduces transportation cost and renders the biomass stable and hydrophobic, ideal for transport to a power plant.
The prototype apparatus
a. Design goals The goal of any pre-production prototype is to reduce risk by proving technology at a small scale prior to investment in production size systems. To adequately reduce risk the prototype must be constructed using the same technology planned for the production scale system and the “scale up” path must be straight forward. This prototype is designed to deliver 5 lbs per hour, using the same technology as the production device. The prototype goals included unattended operation and delivery of BioCoal grade torrefied biomass plus recovery of the torr gas for analysis. The prototype was also engineered with sensors and data logging capability to help define and understand the process, monitor energy flow and assess effect of variations on process yield.
Renewable Fuel Technologies, Torrefaction Method and Apparatus Page6/17
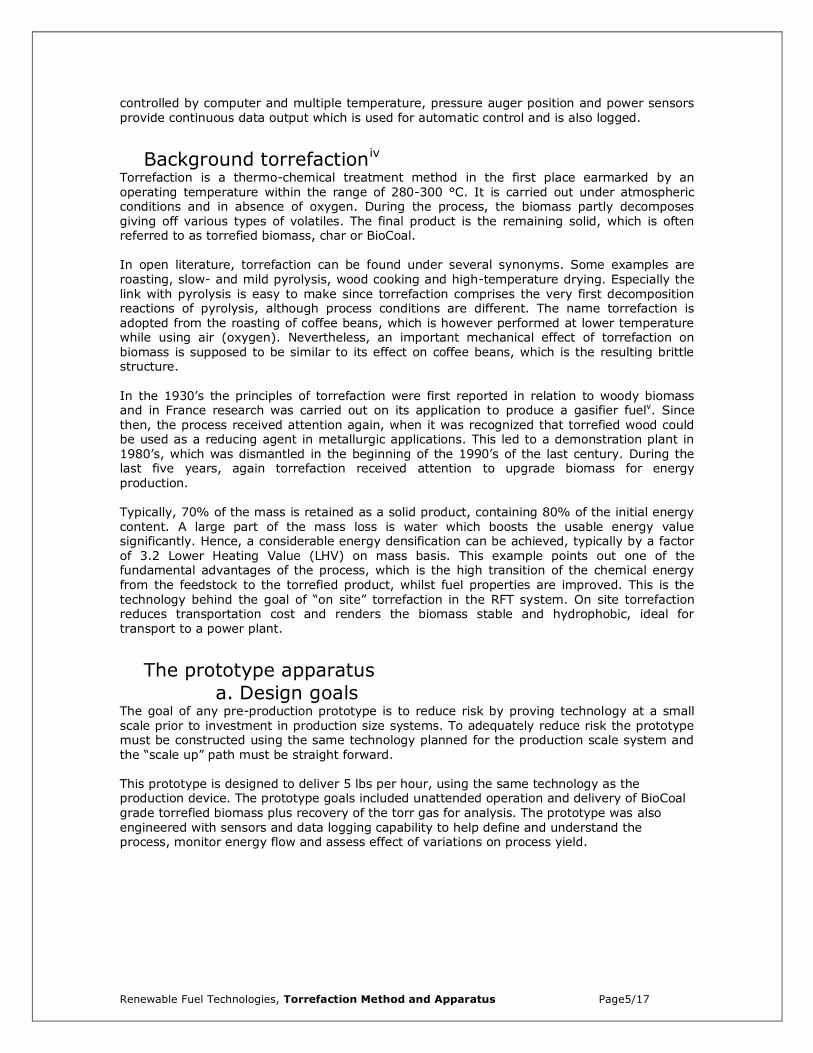
Figure 2, RFT Prototype Torrefaction Reactor, September 2010.
Shown as designed and as built, with input hopper removed to provide clear view of the pinch valve input load lock.
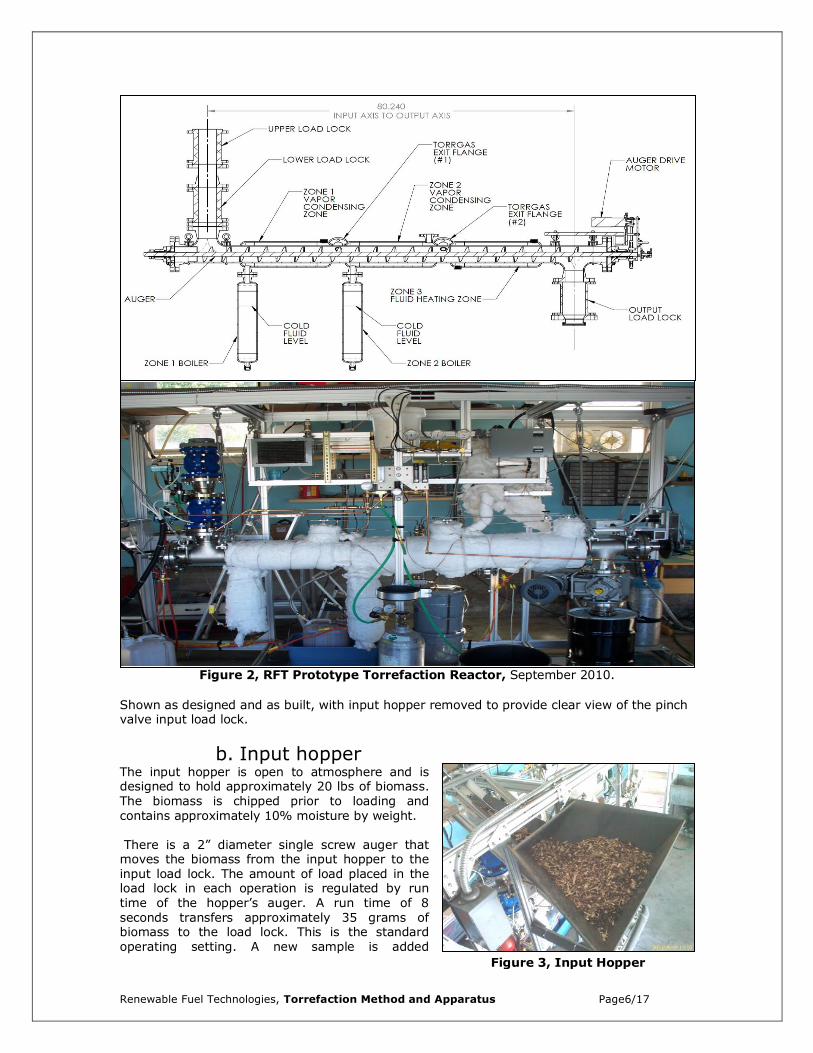
b. Input hopper The input hopper is open to atmosphere and is designed to hold approximately 20 lbs of biomass. The biomass is chipped prior to loading and contains approximately 10% moisture by weight. There is a 2” diameter single screw auger that moves the biomass from the input hopper to the input load lock. The amount of load placed in the load lock in each operation is regulated by run time of the hopper’s auger. A run time of 8 seconds transfers approximately 35 grams of biomass to the load lock. This is the standard operating setting. A new sample is added
Figure 3, Input Hopper
Renewable Fuel Technologies, Torrefaction Method and Apparatus Page7/17
Go To
Automatic
Button
1L. Exhaust Load
Lock
B3L, Run
Bottom Feeder AugerBackground task, needs to finish
before 11L runs again. Tile allowed
is < total – (11L+12L)
Places load on top of PV-1
2L. Purge Empty
Load LockAfter
Preset time
6L. Build
Pressure
in Load Lock
7L, Wait
Ready for Load
Dump
into Auger
8L. Manual
Mode HALT –
5/17/10RFT 001d J. Braig
Loader State Diagram
Per Labview Auger 5.0
After
Preset Time
Loader State Machine Note:
This Loader State Machine will Run simultaneously with the Auger State Machine, but independently. When it reaches state 7L it will stop.
When the Auger control is ready for a load it will force the loader controller into state 10L where it will drop it’s load and proceed to refill and wait at state 7L again.
If Loader state machine is NOT in state 7L when the Auger machine gets to state 4 (Load) the auger state machine will go to manual mode (state 8)
and wait for someone to clear the load lock.
9L. Purge with
Load in LockAfter
Preset Time
10L, Open PV-2
and Drop Load
into Auger
After Preset Time
Go To
Manual
Button
Anytime
on button press
11L, Open PV-1
and drop load into
load lock
12L, Close PV-1 After
Preset time
After
Preset time
13L, Close PV-2
After Preset Time
Transition co
ntrolled by
Auger State M
achine
3L, Trigger B3L
to run Auger
in Background
After
Preset Time
After triggeringB3L
approximately every 45 seconds which produces a raw biomass flow rate of approximately 6 lb/hour.
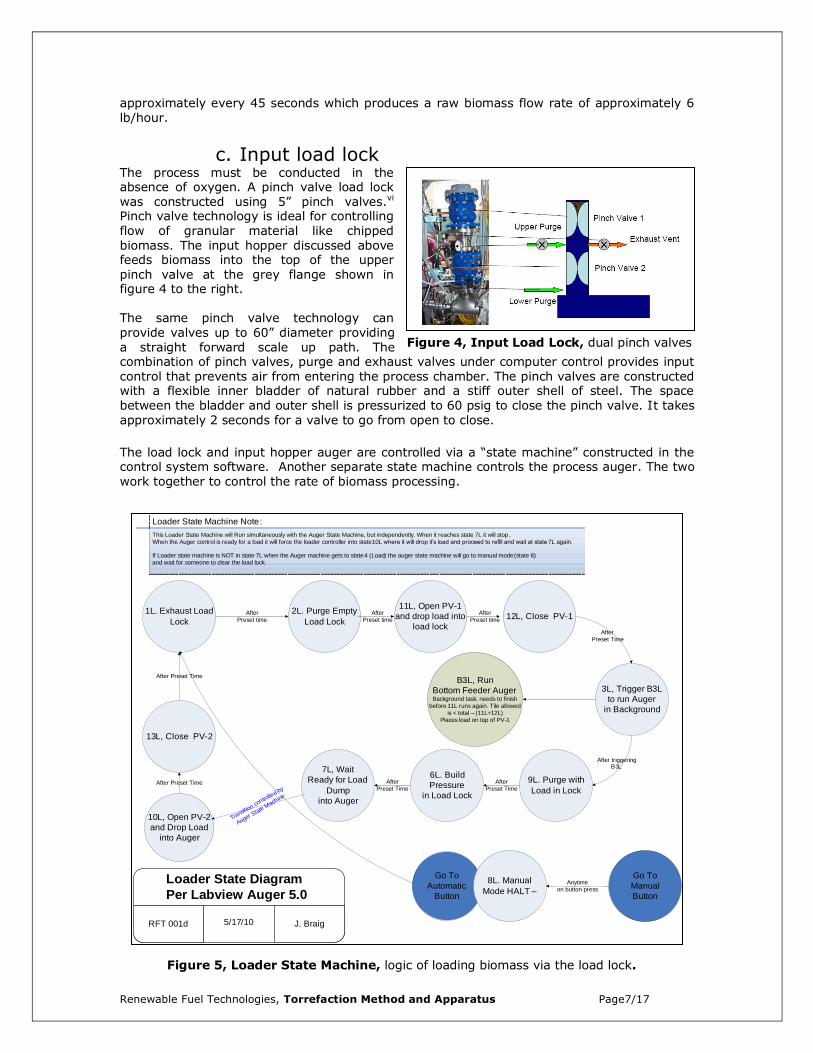
c. Input load lock The process must be conducted in the absence of oxygen. A pinch valve load lock was constructed using 5” pinch valves.vi Pinch valve technology is ideal for controlling flow of granular material like chipped biomass. The input hopper discussed above feeds biomass into the top of the upper pinch valve at the grey flange shown in figure 4 to the right. The same pinch valve technology can provide valves up to 60” diameter providing a straight forward scale up path. The combination of pinch valves, purge and exhaust valves under computer control provides input control that prevents air from entering the process chamber. The pinch valves are constructed with a flexible inner bladder of natural rubber and a stiff outer shell of steel. The space between the bladder and outer shell is pressurized to 60 psig to close the pinch valve. It takes approximately 2 seconds for a valve to go from open to close.
The load lock and input hopper auger are controlled via a “state machine” constructed in the control system software. Another separate state machine controls the process auger. The two work together to control the rate of biomass processing.
Figure 4, Input Load Lock, dual pinch valves
Figure 5, Loader State Machine, logic of loading biomass via the load lock.

Renewable Fuel Technologies, Torrefaction Method and Apparatus Page8/17
1, Forward
7. Stop, 1-3
6, Stop, 5-1
5, Reverse to
Clear Forward
Jam
2. Stop, 1-5
Path if Auger Motor Current
Limit Exceeded while rotating
in forward direction
Path after
prescribed delay
for motor to
stop turning
Path after reversing
prescribed number of
turns to clear
forward jam
4. Load
Force loader to
state 10L
9, Stop, 3-103. Reverse,
Normal
Normal path
after prescribed
number of
reverse
rotations
Path after Prescribed
delay for Motor to
stop turning
8. Manual Mode
Path after Completion of
Prescribed number of
Forward Revolutions
Path if Auger Motor Current
Exceeded While In Reverse
Rotation
Path if Auger Motor Current
Exceeded While In Reverse
Rotation
Path A
fter Loading is
complete.
Crash
Stop
ButtonPath if CRASH STOP button
is pressed
5/17/10RFT 001c J. Braig
Auger Control State Diagram
per LabView Auger 5.0
Path if Auger Motor Current
Exceeded While In Reverse
Rotation
Path if Loader
NOT in state 7L
10 , RAM
Check
The biomass is deposited on top of the upper pinch valve by the input hopper auger. Then after the load lock, space between the upper and lower pinch valve, has been exhausted of any torr gas the upper pinch valve opens and drops the load onto the top of the closed lower pinch valve. To accommodate this drop the upper valve stays open for 20 seconds. The upper pinch valve closes and the load lock space is again purged for 4 seconds and built up to 10 PSI pressure in the following 3 seconds by closing the exhaust valve, this time to remove any oxygen that entered with the load and to provide a positive pressure relative to the process auger. When the process auger is in the proper position the lower pinch valve is opened delivering the load to the process auger. The lower pinch valve is left open for 5 seconds to deliver this load.
d. System purge To maintain the oxygen free atmosphere inside the torrefaction reactor, and to help push the torr gas through the condenser we purge with CO2 gas. Purge gas connects to the system at three places; At the input to the reactor auger purge gas flow is about 2 SCFH. at the output to the reactor auger purge gas is introduced at 2 SCFH. Purge gas is additionally introduced into the bottom of the product barrel, the rate 1 LPM. At the end of the process, when material enters the product barrel it is still very hot and oxygen must be excluded to prevent further oxidation or even open flame combustion.
Figure 7, Pinch Valve Operation
Figure 6, Process Auger State Machine, logic of controlling the reactor.

Renewable Fuel Technologies, Torrefaction Method and Apparatus Page9/17
Biomass Input
Product Output
Zone 1 Zone 2 Zone 3
e. Heating zones The process is conducted at a temperature setpoint between approximately 250 - 300 C. The process auger system is divided into three equally sized zones. The temperature of each zone can be independently controlled and the power consumed independently monitored. The biomass enters through the load lock into zone 1 and exits from zone 3.
In a typical process, all three zones are set to 300 degrees C. and controlled by independent PID loops. The heaters are capable of maximum power of approximately 1,800 watts each. Actual power delivered under steady state operating conditions is tabulated in Figure 10 below. Note the power consumption with no biomass present is significant. This is controllable via insulation and can be reduced significantly. The differential power, that dedicated to the torrefaction process is only about 260 Watts. As tabulated in Figure 20, in the Results section, the energy contained in the output of condensers 1 and 2, discussed below in the Gas Condenser System section (gi) is greater than 1,000 W and so, theoretically, the system can be self powering.
Zone 1 Biomass entry
Zone 2 Zone 3 Biomass exit
Total
System idle (no biomass)
727.5 595.3 410.4 1733.2 watts
Processing biomass
1003.4 657.9 330.2
1991.6
watts
i. Heater technology Dow Therm boiler-condenser heaters were incorporated. The heat is applied indirectly to the outside of the auger cylinder via a sealed, evacuated, non-contact boiler system, shown in the engineering drawing of Figure 2 above. Zones 1 and 2 have independent boilers while Zone 3 uses a direct heating technology. Zone 3 delivers less energy to the process which allows operation without a boiler.
DOWTHERM A is a synthetic organic heat transfer fluid that exists in liquid and vapor phase with vapor pressure dependent on temperaturevii. This fluid is condensed in the hollow wall of the auger tube and vaporized in
Figure 8, Biomass Flow, through heater zones
Figure 8, Torrefaction zone heater power
Figure 9, Dowtherm A vapor pressure
Renewable Fuel Technologies, Torrefaction Method and Apparatus Page10/17
2 1/4 turns forward
1 ¼ turns backward
One Auger Cycle
1 turn forward
plus
equals
boiler below the tube. This type of heater is very scalable because it delivers even heating to all surfaces presented to the vapor. The auger of this prototype was unheated. As the diameter is scaled up the auger will need to be heated internally. The goal being, to maintain a short path between the biomass material and a source of conductive heat transfer. The DowTherm boilers can be operated from 250 – 400C, typically 300C. We monitor the pressure within the boilers. At 300 C, the pressure stays within 2.0 and 2.2 BAR absolute, in agreement with the material specifications shown in the figure to the rightviii. This heat transfer system produces very even heating in the wall of our reactor tube.
f. Process Auger
i. Auger design RFT selected an auger system to provide a continuous process for its torrefaction reactor. Process augers are manufactured from 2” to 36” diameters. This prototype incorporates a 4” diameter auger. The auger is 8’ long with a screw pitch of 4”. The auger is driven by a DC motor with gear reduction head. Typical rotation speed is 4.9 RPM, both forward and reverse, with the motor consuming 9 W.
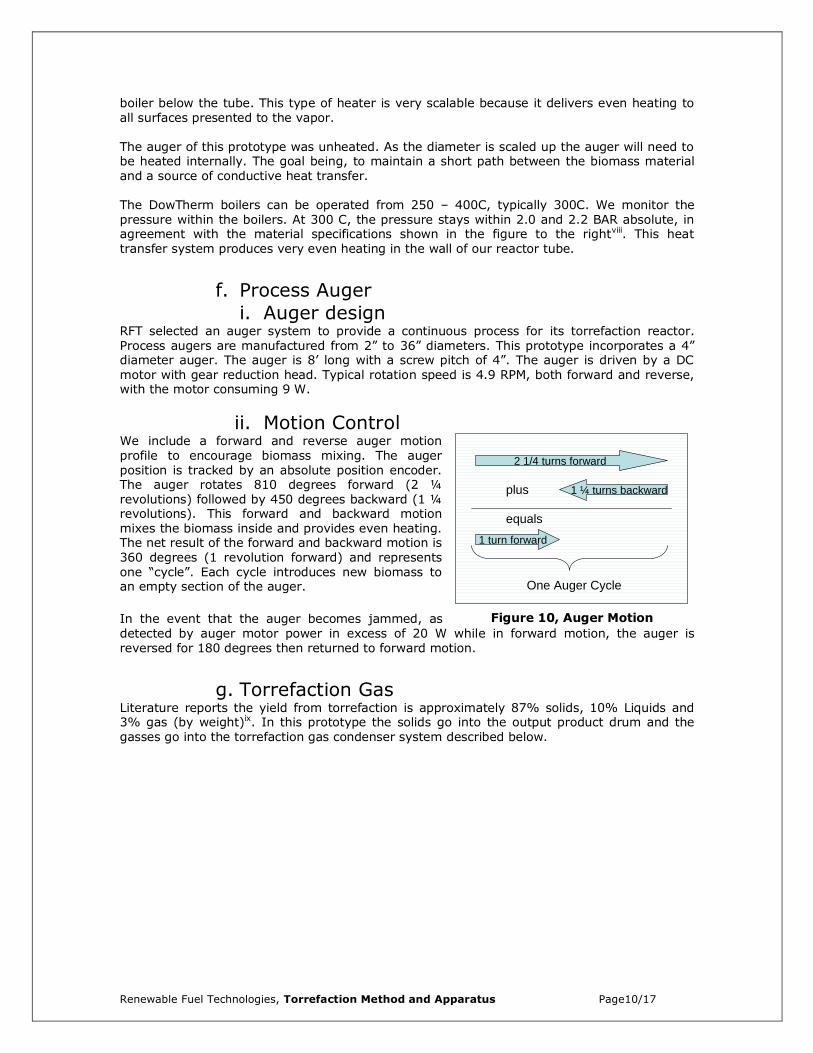
ii. Motion Control We include a forward and reverse auger motion profile to encourage biomass mixing. The auger position is tracked by an absolute position encoder. The auger rotates 810 degrees forward (2 ¼ revolutions) followed by 450 degrees backward (1 ¼ revolutions). This forward and backward motion mixes the biomass inside and provides even heating. The net result of the forward and backward motion is 360 degrees (1 revolution forward) and represents one “cycle”. Each cycle introduces new biomass to an empty section of the auger.
In the event that the auger becomes jammed, as detected by auger motor power in excess of 20 W while in forward motion, the auger is reversed for 180 degrees then returned to forward motion.
g. Torrefaction Gas Literature reports the yield from torrefaction is approximately 87% solids, 10% Liquids and 3% gas (by weight)ix. In this prototype the solids go into the output product drum and the gasses go into the torrefaction gas condenser system described below.
Figure 10, Auger Motion
Renewable Fuel Technologies, Torrefaction Method and Apparatus Page11/17
RAM in conduit leading to condenser stack
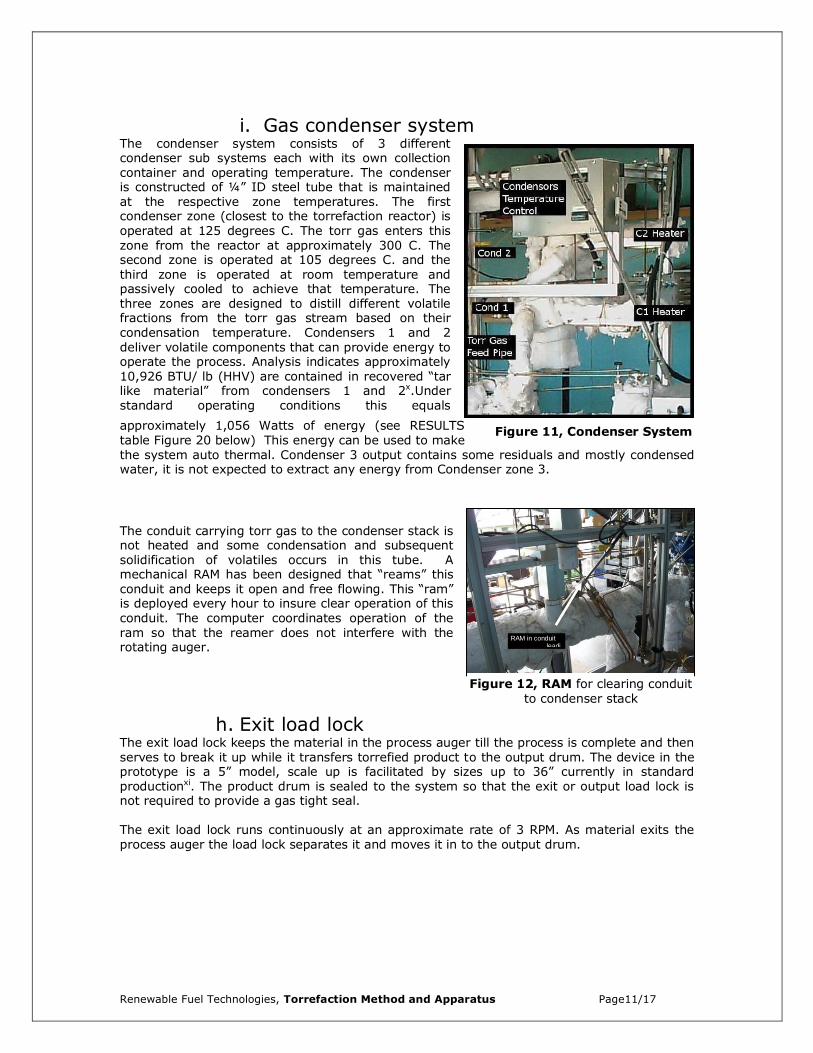
i. Gas condenser system The condenser system consists of 3 different condenser sub systems each with its own collection container and operating temperature. The condenser is constructed of ¼” ID steel tube that is maintained at the respective zone temperatures. The first condenser zone (closest to the torrefaction reactor) is operated at 125 degrees C. The torr gas enters this zone from the reactor at approximately 300 C. The second zone is operated at 105 degrees C. and the third zone is operated at room temperature and passively cooled to achieve that temperature. The three zones are designed to distill different volatile fractions from the torr gas stream based on their condensation temperature. Condensers 1 and 2 deliver volatile components that can provide energy to operate the process. Analysis indicates approximately 10,926 BTU/ lb (HHV) are contained in recovered “tar like material” from condensers 1 and 2x.Under standard operating conditions this equals
approximately 1,056 Watts of energy (see RESULTS table Figure 20 below) This energy can be used to make the system auto thermal. Condenser 3 output contains some residuals and mostly condensed water, it is not expected to extract any energy from Condenser zone 3.
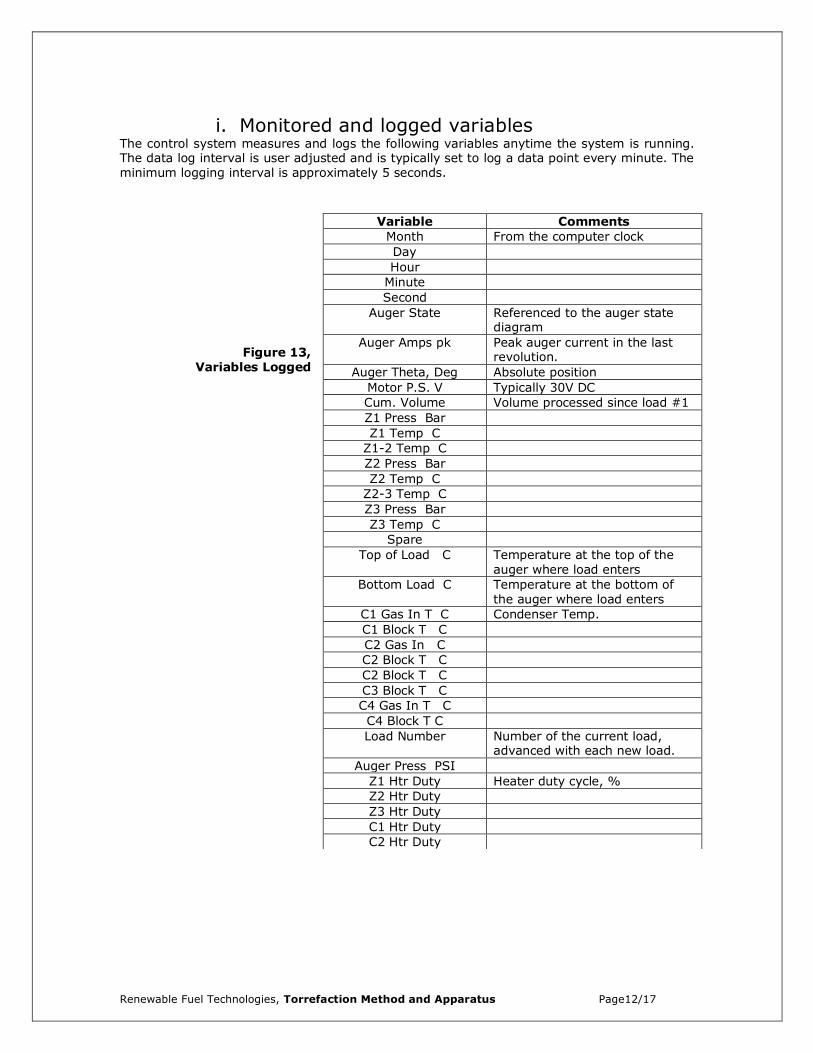
The conduit carrying torr gas to the condenser stack is not heated and some condensation and subsequent solidification of volatiles occurs in this tube. A mechanical RAM has been designed that “reams” this conduit and keeps it open and free flowing. This “ram” is deployed every hour to insure clear operation of this conduit. The computer coordinates operation of the ram so that the reamer does not interfere with the rotating auger.
h. Exit load lock The exit load lock keeps the material in the process auger till the process is complete and then serves to break it up while it transfers torrefied product to the output drum. The device in the prototype is a 5” model, scale up is facilitated by sizes up to 36” currently in standard productionxi. The product drum is sealed to the system so that the exit or output load lock is not required to provide a gas tight seal. The exit load lock runs continuously at an approximate rate of 3 RPM. As material exits the process auger the load lock separates it and moves it in to the output drum.
Figure 12, RAM for clearing conduit to condenser stack
Figure 11, Condenser System
Renewable Fuel Technologies, Torrefaction Method and Apparatus Page12/17
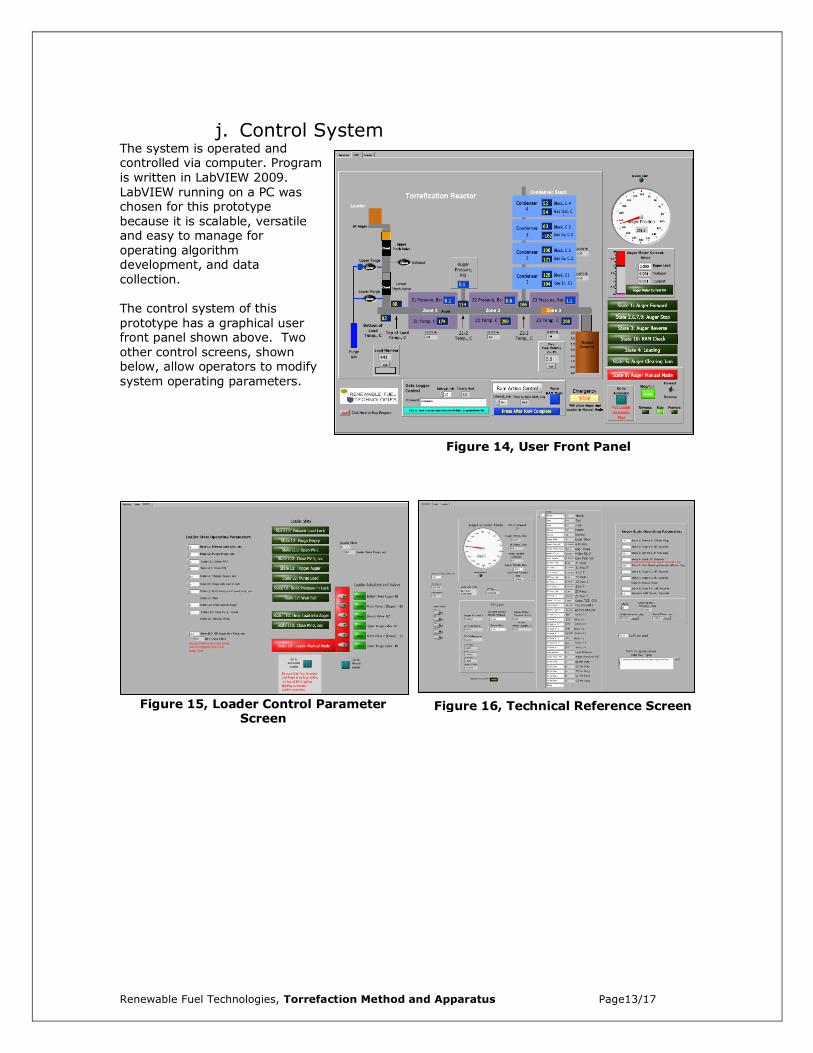
i. Monitored and logged variables The control system measures and logs the following variables anytime the system is running. The data log interval is user adjusted and is typically set to log a data point every minute. The minimum logging interval is approximately 5 seconds.
Figure 13, Variables Logged
Variable Comments
Month From the computer clock
Day
Hour
Minute
Second
Auger State Referenced to the auger state diagram
Auger Amps pk Peak auger current in the last revolution.
Auger Theta, Deg Absolute position
Motor P.S. V Typically 30V DC
Cum. Volume Volume processed since load #1
Z1 Press Bar
Z1 Temp C
Z1-2 Temp C
Z2 Press Bar
Z2 Temp C
Z2-3 Temp C
Z3 Press Bar
Z3 Temp C
Spare
Top of Load C Temperature at the top of the auger where load enters
Bottom Load C Temperature at the bottom of the auger where load enters
C1 Gas In T C Condenser Temp.
C1 Block T C
C2 Gas In C
C2 Block T C
C2 Block T C
C3 Block T C
C4 Gas In T C
C4 Block T C
Load Number Number of the current load, advanced with each new load.
Auger Press PSI
Z1 Htr Duty Heater duty cycle, %
Z2 Htr Duty
Z3 Htr Duty
C1 Htr Duty
C2 Htr Duty
Renewable Fuel Technologies, Torrefaction Method and Apparatus Page13/17
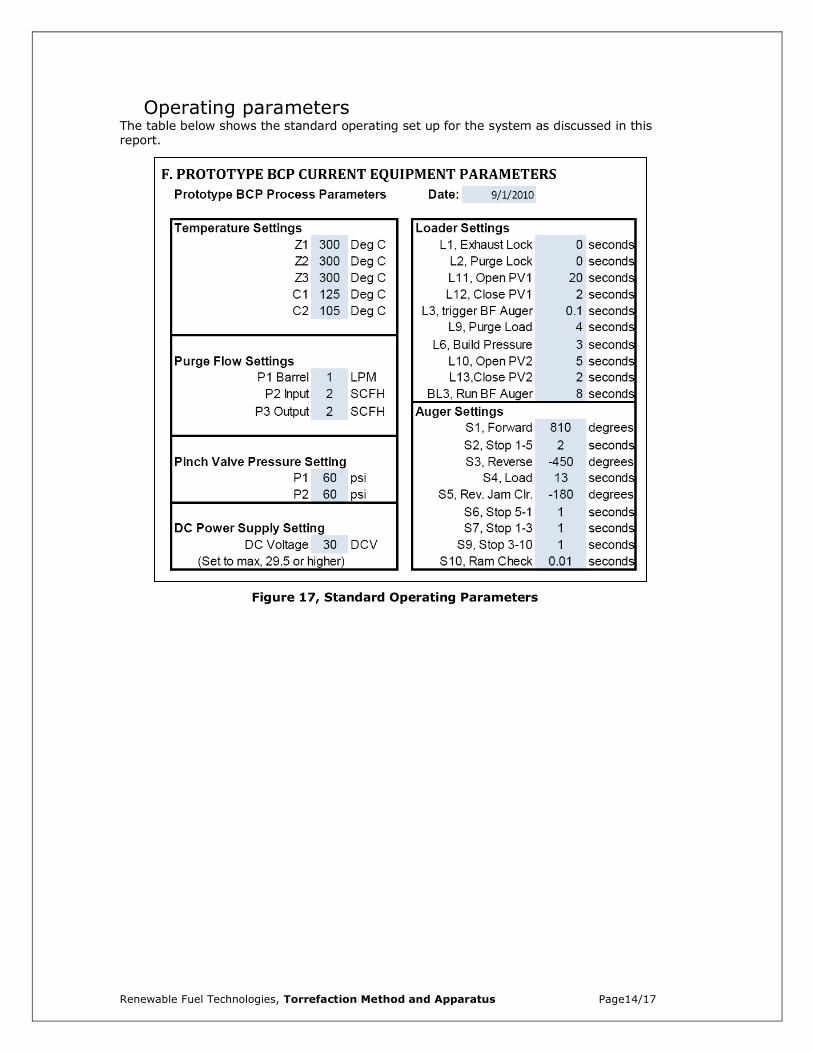
j. Control System The system is operated and controlled via computer. Program is written in LabVIEW 2009. LabVIEW running on a PC was chosen for this prototype because it is scalable, versatile and easy to manage for operating algorithm development, and data collection. The control system of this prototype has a graphical user front panel shown above. Two other control screens, shown below, allow operators to modify system operating parameters.
Figure 14, User Front Panel
Figure 15, Loader Control Parameter Screen
Figure 16, Technical Reference Screen
Renewable Fuel Technologies, Torrefaction Method and Apparatus Page14/17
Operating parameters The table below shows the standard operating set up for the system as discussed in this report.
Figure 17, Standard Operating Parameters
Renewable Fuel Technologies, Torrefaction Method and Apparatus Page15/17
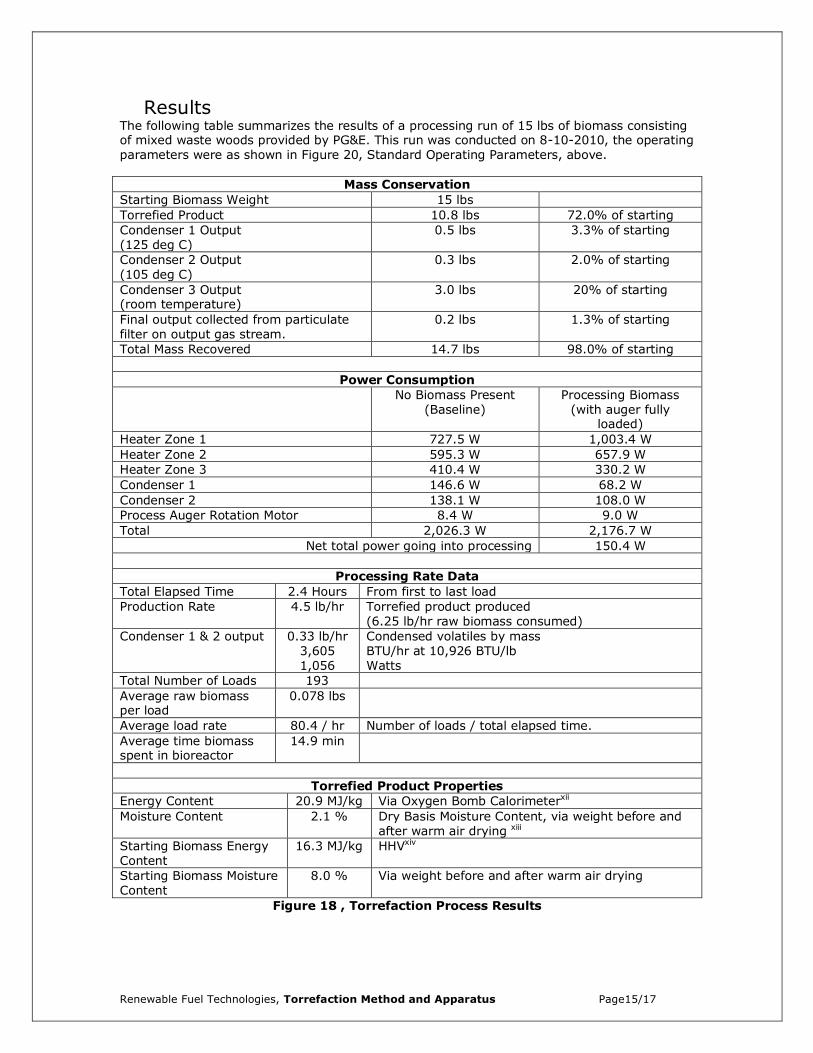
Results The following table summarizes the results of a processing run of 15 lbs of biomass consisting of mixed waste woods provided by PG&E. This run was conducted on 8-10-2010, the operating parameters were as shown in Figure 20, Standard Operating Parameters, above.
Mass Conservation
Starting Biomass Weight 15 lbs
Torrefied Product 10.8 lbs 72.0% of starting
Condenser 1 Output (125 deg C)
0.5 lbs 3.3% of starting
Condenser 2 Output (105 deg C)
0.3 lbs 2.0% of starting
Condenser 3 Output (room temperature)
3.0 lbs 20% of starting
Final output collected from particulate filter on output gas stream.
0.2 lbs 1.3% of starting
Total Mass Recovered 14.7 lbs 98.0% of starting
Power Consumption
No Biomass Present (Baseline)
Processing Biomass (with auger fully
loaded)
Heater Zone 1 727.5 W 1,003.4 W
Heater Zone 2 595.3 W 657.9 W
Heater Zone 3 410.4 W 330.2 W
Condenser 1 146.6 W 68.2 W
Condenser 2 138.1 W 108.0 W
Process Auger Rotation Motor 8.4 W 9.0 W
Total 2,026.3 W 2,176.7 W
Net total power going into processing 150.4 W
Processing Rate Data
Total Elapsed Time 2.4 Hours From first to last load
Production Rate 4.5 lb/hr Torrefied product produced (6.25 lb/hr raw biomass consumed)
Condenser 1 & 2 output 0.33 lb/hr 3,605 1,056
Condensed volatiles by mass BTU/hr at 10,926 BTU/lb Watts
Total Number of Loads 193
Average raw biomass per load
0.078 lbs
Average load rate 80.4 / hr Number of loads / total elapsed time.
Average time biomass spent in bioreactor
14.9 min
Torrefied Product Properties
Energy Content 20.9 MJ/kg Via Oxygen Bomb Calorimeterxii
Moisture Content 2.1 % Dry Basis Moisture Content, via weight before and after warm air drying xiii
Starting Biomass Energy Content
16.3 MJ/kg HHVxiv
Starting Biomass Moisture Content
8.0 % Via weight before and after warm air drying
Figure 18 , Torrefaction Process Results

Renewable Fuel Technologies, Torrefaction Method and Apparatus Page16/17
1 2 3 4
Thousands
Wavenumber, cm-1
-0.5
0
0.5
1
1.5
2
2.5
3
Abs
orba
nce
RAW Torrefied
Mid IR SpectraPG&E Mixed Samples
Torrefaction is a process that breaks bonds. The Mid IR spectra below was made using KBR pellet process showing before and after torrefaction absorbance. The absorbance values are relative. Lower absorbance indicates fewer bonds, different wavelength indicates different type of bonds.
Figure 19, Natural and Torrefied Biomass Mid IR Absorbance Spectrum
Figure 20, Biomass, pre torrefaction Figure 21, BioCoal, post torrefaction

Renewable Fuel Technologies, Torrefaction Method and Apparatus Page17/17
References
i P.C.A. Bergman et al Torrefaction for biomass co-firing in existing coal-fired power stations. ECN Biomass July 2005 Renewable Energy in the Netherlands, SenterNovem project number 2020-02-12-12-001. ii EIA: Annual Energy Review 2007 & Energy Outlook 2008, Calera Analysis
iii In 2002, California established its Renewable Portfolio Standard Program, with the goal of
increasing the percentage of renewable energy in the state's electricity mix to 20 percent by 2017. 2003 Integrated Energy Policy Report recommended accelerating that goal to 20 percent by 2010, and the 2004 Energy Report Update further recommended increasing the target to 33 percent by 2020. The state's Energy Action Plan supported this goal. On November 17, 2008,
Governor Arnold Schwarzenegger signed Executive Order S-14-08 requiring that California utilities reach the 33 percent renewables goal by 2020.
iv P.C.A. Bergman et al Torrefaction for biomass co-firing in existing coal-fired power
stations. ECN Biomass July 2005 Renewable Energy in the Netherlands, SenterNovem project number 2020-02-12-12-001. v Bioenergy, “A new process for Torrefied wood manufacturing”, General bioenergy, Vol. 2,
No. 4, 2000 vi RF Technology, 9017 Mendenhall Court, Columbia Maryland 21045. Model BS6 A50-541S
with natural rubber interior. vii
Dow Chemical Company, DOWTHERM A, http://www.dow.com/PublishedLiterature/dh_0040/0901b80380040b89.pdf?filepath=heattrans/pdfs/noreg/176-01463.pdf&fromPage=GetDoc viii
Dow Chemical Company, DOWTHERM A, product specifications Form number 176-01463-1101 AMS. ix M. Pach et al , Torrefied Biomass as Substitute for Wood and Charcoal, 6
th Asia –Pacific
international Symposium on Combustion and Energy Utilization, 20 May 2002 Kuala Lumpur x Samples analyzed by HAZEN Research Inc, April 19, 2010, Project 002-BNE, Control Number.
D23/10-1, Sample C23/10-9, Identification Tars, for Renewable Fuel Technologies. Energy value reported is HHV. xi Model 12RVCCMA1B000 Rotolok Valves Inc.,2711 Gray Fox Road, Monroe, NC 28110
Phone: (704) 282-4444, www.rotolok.com xii
Samples analyzed by SCHATZ Energy Research Center, August 31, 2010, Test Results of August 10, 2010 test run. Value reported is average energy content of two independent samples. Actual sample data was 21.1 and 20.8 MJ/kg respectively. xiii
Samples analyzed by SCHATZ Energy Research Center, August 31, 2010, Test Results of August 10, 2010 test run. Value reported is moisture content, dry basis, of two independent samples. Actual sample data was 2.08 and 2.09 % respectively. xiv
Samples analyzed by HAZEN Research Inc, April 16, 2010, Project 002-BNE, HRI Series No. D23/10-1, for Renewable Fuel Technologies. Energy value reported is HHV in “as received” condition with 17% moisture content. Sample is PG&E mixed wood chips.