10 06 energy (torrefaction)
DESCRIPTION
kerenTRANSCRIPT
lable at ScienceDirect
Energy 35 (2010) 2580e2586
Contents lists avai
Energy
journal homepage: www.elsevier .com/locate/energy
A study on torrefaction of various biomass materials and its impacton lignocellulosic structure simulated by a thermogravimetry
Wei-Hsin Chen*, Po-Chih KuoDepartment of Greenergy, National University of Tainan, Tainan 700, Taiwan, ROC
a r t i c l e i n f o
Article history:Received 26 November 2009Received in revised form26 January 2010Accepted 28 February 2010Available online 1 April 2010
Keywords:Light and severe torrefactionPyrolysisThermogravimetric analysis (TGA)Thermal decompositionLignocellulosic structureBiomass
* Corresponding author. Tel.: þ886 6 2605031; faxE-mail address: [email protected] (W.-H. C
0360-5442/$ e see front matter � 2010 Elsevier Ltd.doi:10.1016/j.energy.2010.02.054
a b s t r a c t
Torrefaction processes of four kinds of biomass materials, including bamboo, willow, coconut shell andwood (Ficus benjamina L.), were investigated using the thermogravimetric analysis (TGA). Particularemphasis is placed on the impact of torrefaction on hemicellulose, cellulose and lignin contained in thebiomass. Two different torrefaction processes, consisting of a light torrefaction process at 240 �C anda severe torrefaction process at 275 �C, were considered. From the torrefaction processes, the biomasscould be divided into two groups; one was the relatively active biomass such as bamboo and willow, andthe other was the relatively inactive biomass composed of coconut shell and wood. When the lighttorrefaction was performed, the results indicated that the hemicellulose contained in the biomass wasdestroyed in a significant way, whereas cellulose and lignin were affected only slightly. Once the severetorrefaction was carried out, it further had a noticeable effect on cellulose, especially in the bamboo andwillow. The light torrefaction and severe torrefaction were followed by a chemically frozen zone,regardless of what the biomass was. From the viewpoint of torrefaction application, the investigatedbiomass torrefied in less than 1 h with light torrefaction is an appropriate operation for producing fuelswith higher energy density.
� 2010 Elsevier Ltd. All rights reserved.
1. Introduction
Biomass energy or bioenergy is an important energy resource intheworld and it has been extensively employed in underdeveloped,developing and developed countries. In fact, according to thestatistics of International Energy Agency (IEA) [1], biomass andwaste account for around 10% of the primary energy demandworldwide in 2005. To develop bioenergy from biomass, a variety ofconversion techniques such as physical, thermal, chemical andbiological methods have been utilized [2]. In these methods, thethermal conversion is the most commonly used technique.Conventionally, combustion, gasification and pyrolysis of biomass[3e6] aswell as co-firing of biomass and coal [7,8] have beenwidelyapplied for the purpose of getting heat, power, synthesis gas (orsyngas) and biofuels, etc. Before these methods are carried out, it isdesirable to decrease the moisture in fuels. In general, the lessmoisture contained in biomass, the higher the conversion effi-ciency. Regarding the particle size, in some reactors the fuel has tobe greatly meshed to facilitate reaction. For instance, coal is always
: þ886 6 2602205.hen).
All rights reserved.
grinded into the form of pulverized coal before it is used inentrained-bed gasifiers or blast furnaces [9,10].
Generally speaking, the moisture contained in raw biomass ishigh, whereas the energy density of the raw biomass is lowcompared to that of fossil fuels. This results in that the applicationsof raw biomass in industry are restricted and it is difficult tocomminute the biomass into small particles. Besides, raw biomassis generally hygroscopic so that it cannot be stored for a long timeand the utilization efficiency of biomass is relatively lower. Torre-faction is a mild pyrolysis process. In this process, raw biomass isheated at an inert or nitrogen atmosphere with the temperature inthe range of 225e300 �C [11e13]. After undergoing torrefaction, themoisture contained in the biomass is substantially reduced and thecomponents of lowweight organic volatile are liberated. As a result,hydrophobic solids with higher content of fixed carbon areproduced [14]. This implies, in turn, that the energy density of thetorrefied biomass is enlarged and the grindability of the solids isimproved greatly. For example, in the studies of Bergman et al.[15,16], it was reported that electricity consumption for sizereduction of torrefied wood was reduced 50e85% when comparedto that of fresh wood.
In recent years, torrefaction of lignocellulosic biomass hasattracted more interest in research resulting from its potentialapplications. In order to recognize the role played by torrefaction in
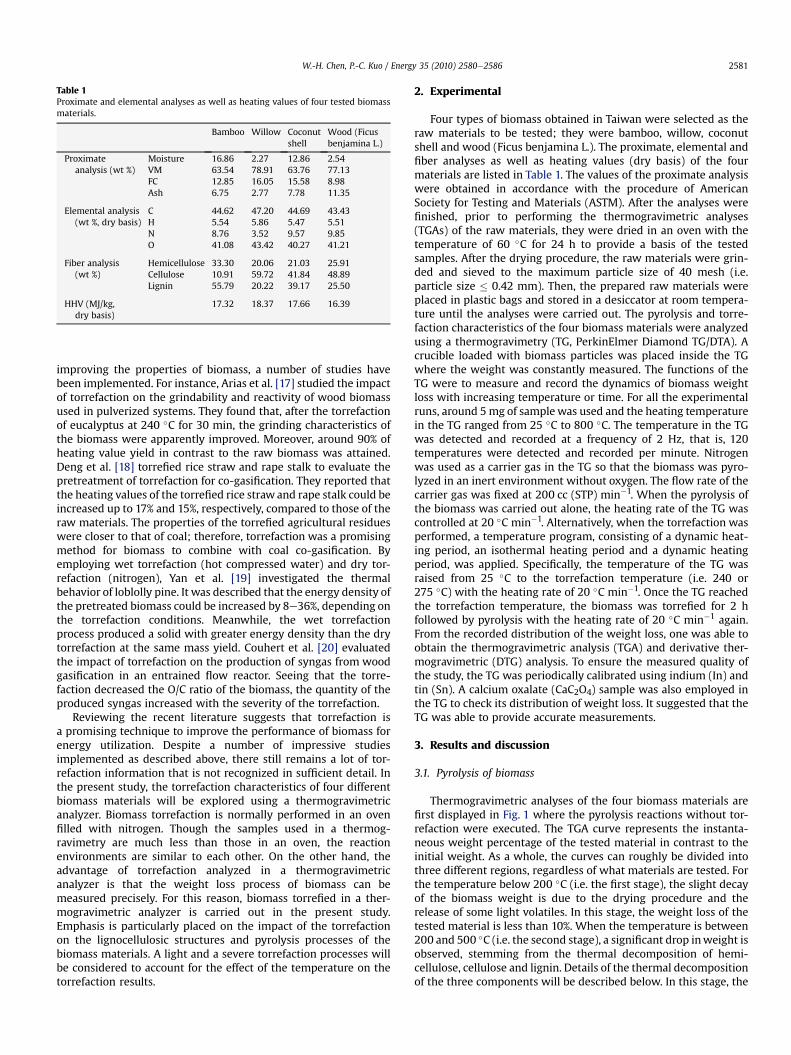
Table 1Proximate and elemental analyses as well as heating values of four tested biomassmaterials.
Bamboo Willow Coconutshell
Wood (Ficusbenjamina L.)
Proximateanalysis (wt %)
Moisture 16.86 2.27 12.86 2.54VM 63.54 78.91 63.76 77.13FC 12.85 16.05 15.58 8.98Ash 6.75 2.77 7.78 11.35
Elemental analysis(wt %, dry basis)
C 44.62 47.20 44.69 43.43H 5.54 5.86 5.47 5.51N 8.76 3.52 9.57 9.85O 41.08 43.42 40.27 41.21
Fiber analysis(wt %)
Hemicellulose 33.30 20.06 21.03 25.91Cellulose 10.91 59.72 41.84 48.89Lignin 55.79 20.22 39.17 25.50
HHV (MJ/kg,dry basis)
17.32 18.37 17.66 16.39
W.-H. Chen, P.-C. Kuo / Energy 35 (2010) 2580e2586 2581
improving the properties of biomass, a number of studies havebeen implemented. For instance, Arias et al. [17] studied the impactof torrefaction on the grindability and reactivity of wood biomassused in pulverized systems. They found that, after the torrefactionof eucalyptus at 240 �C for 30 min, the grinding characteristics ofthe biomass were apparently improved. Moreover, around 90% ofheating value yield in contrast to the raw biomass was attained.Deng et al. [18] torrefied rice straw and rape stalk to evaluate thepretreatment of torrefaction for co-gasification. They reported thatthe heating values of the torrefied rice straw and rape stalk could beincreased up to 17% and 15%, respectively, compared to those of theraw materials. The properties of the torrefied agricultural residueswere closer to that of coal; therefore, torrefaction was a promisingmethod for biomass to combine with coal co-gasification. Byemploying wet torrefaction (hot compressed water) and dry tor-refaction (nitrogen), Yan et al. [19] investigated the thermalbehavior of loblolly pine. It was described that the energy density ofthe pretreated biomass could be increased by 8e36%, depending onthe torrefaction conditions. Meanwhile, the wet torrefactionprocess produced a solid with greater energy density than the drytorrefaction at the same mass yield. Couhert et al. [20] evaluatedthe impact of torrefaction on the production of syngas from woodgasification in an entrained flow reactor. Seeing that the torre-faction decreased the O/C ratio of the biomass, the quantity of theproduced syngas increased with the severity of the torrefaction.
Reviewing the recent literature suggests that torrefaction isa promising technique to improve the performance of biomass forenergy utilization. Despite a number of impressive studiesimplemented as described above, there still remains a lot of tor-refaction information that is not recognized in sufficient detail. Inthe present study, the torrefaction characteristics of four differentbiomass materials will be explored using a thermogravimetricanalyzer. Biomass torrefaction is normally performed in an ovenfilled with nitrogen. Though the samples used in a thermog-ravimetry are much less than those in an oven, the reactionenvironments are similar to each other. On the other hand, theadvantage of torrefaction analyzed in a thermogravimetricanalyzer is that the weight loss process of biomass can bemeasured precisely. For this reason, biomass torrefied in a ther-mogravimetric analyzer is carried out in the present study.Emphasis is particularly placed on the impact of the torrefactionon the lignocellulosic structures and pyrolysis processes of thebiomass materials. A light and a severe torrefaction processes willbe considered to account for the effect of the temperature on thetorrefaction results.
2. Experimental
Four types of biomass obtained in Taiwan were selected as theraw materials to be tested; they were bamboo, willow, coconutshell and wood (Ficus benjamina L.). The proximate, elemental andfiber analyses as well as heating values (dry basis) of the fourmaterials are listed in Table 1. The values of the proximate analysiswere obtained in accordance with the procedure of AmericanSociety for Testing and Materials (ASTM). After the analyses werefinished, prior to performing the thermogravimetric analyses(TGAs) of the raw materials, they were dried in an oven with thetemperature of 60 �C for 24 h to provide a basis of the testedsamples. After the drying procedure, the raw materials were grin-ded and sieved to the maximum particle size of 40 mesh (i.e.particle size � 0.42 mm). Then, the prepared raw materials wereplaced in plastic bags and stored in a desiccator at room tempera-ture until the analyses were carried out. The pyrolysis and torre-faction characteristics of the four biomass materials were analyzedusing a thermogravimetry (TG, PerkinElmer Diamond TG/DTA). Acrucible loaded with biomass particles was placed inside the TGwhere the weight was constantly measured. The functions of theTG were to measure and record the dynamics of biomass weightloss with increasing temperature or time. For all the experimentalruns, around 5mg of samplewas used and the heating temperaturein the TG ranged from 25 �C to 800 �C. The temperature in the TGwas detected and recorded at a frequency of 2 Hz, that is, 120temperatures were detected and recorded per minute. Nitrogenwas used as a carrier gas in the TG so that the biomass was pyro-lyzed in an inert environment without oxygen. The flow rate of thecarrier gas was fixed at 200 cc (STP) min�1. When the pyrolysis ofthe biomass was carried out alone, the heating rate of the TG wascontrolled at 20 �C min�1. Alternatively, when the torrefaction wasperformed, a temperature program, consisting of a dynamic heat-ing period, an isothermal heating period and a dynamic heatingperiod, was applied. Specifically, the temperature of the TG wasraised from 25 �C to the torrefaction temperature (i.e. 240 or275 �C) with the heating rate of 20 �C min�1. Once the TG reachedthe torrefaction temperature, the biomass was torrefied for 2 hfollowed by pyrolysis with the heating rate of 20 �C min�1 again.From the recorded distribution of the weight loss, one was able toobtain the thermogravimetric analysis (TGA) and derivative ther-mogravimetric (DTG) analysis. To ensure the measured quality ofthe study, the TG was periodically calibrated using indium (In) andtin (Sn). A calcium oxalate (CaC2O4) sample was also employed inthe TG to check its distribution of weight loss. It suggested that theTG was able to provide accurate measurements.
3. Results and discussion
3.1. Pyrolysis of biomass
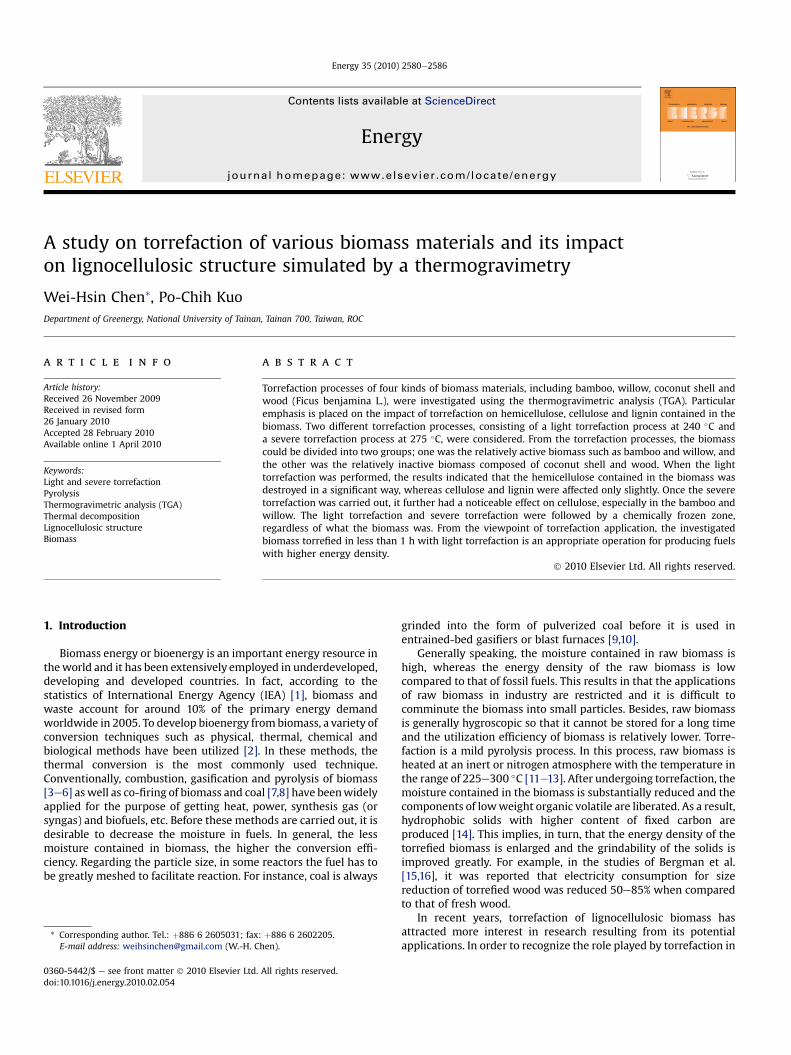
Thermogravimetric analyses of the four biomass materials arefirst displayed in Fig. 1 where the pyrolysis reactions without tor-refaction were executed. The TGA curve represents the instanta-neous weight percentage of the tested material in contrast to theinitial weight. As a whole, the curves can roughly be divided intothree different regions, regardless of what materials are tested. Forthe temperature below 200 �C (i.e. the first stage), the slight decayof the biomass weight is due to the drying procedure and therelease of some light volatiles. In this stage, the weight loss of thetested material is less than 10%. When the temperature is between200 and 500 �C (i.e. the second stage), a significant drop inweight isobserved, stemming from the thermal decomposition of hemi-cellulose, cellulose and lignin. Details of the thermal decompositionof the three components will be described below. In this stage, the
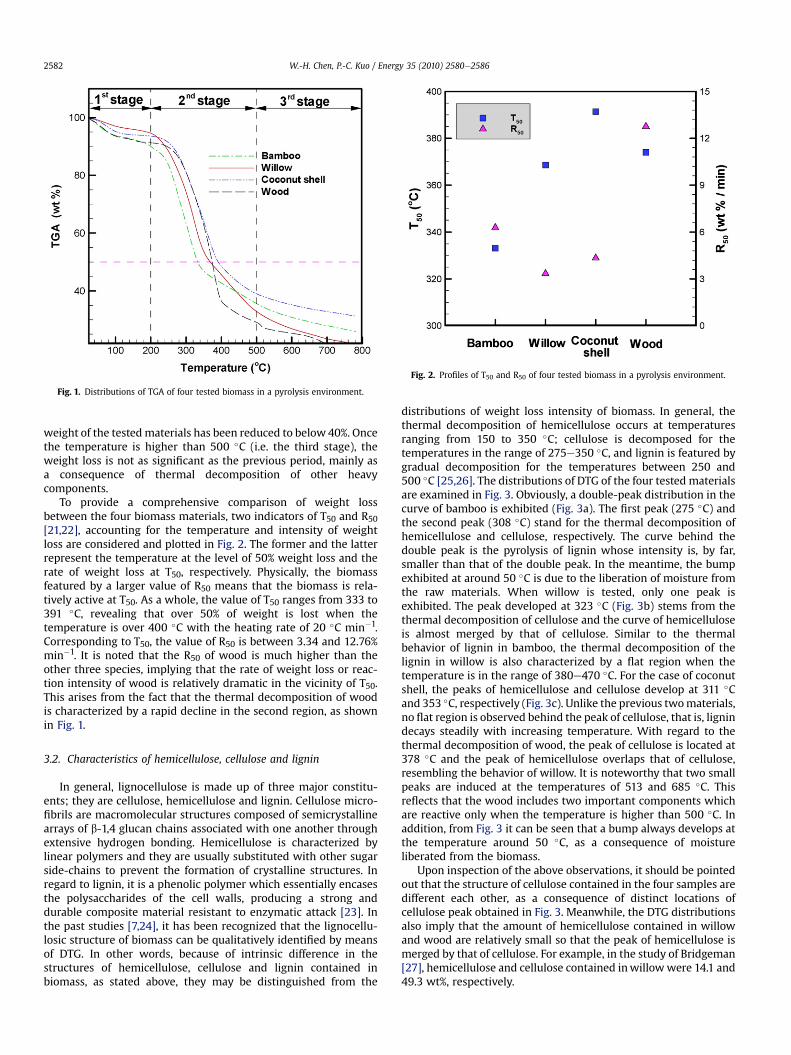
Fig. 1. Distributions of TGA of four tested biomass in a pyrolysis environment.
Fig. 2. Profiles of T50 and R50 of four tested biomass in a pyrolysis environment.
W.-H. Chen, P.-C. Kuo / Energy 35 (2010) 2580e25862582
weight of the testedmaterials has been reduced to below 40%. Oncethe temperature is higher than 500 �C (i.e. the third stage), theweight loss is not as significant as the previous period, mainly asa consequence of thermal decomposition of other heavycomponents.
To provide a comprehensive comparison of weight lossbetween the four biomass materials, two indicators of T50 and R50[21,22], accounting for the temperature and intensity of weightloss are considered and plotted in Fig. 2. The former and the latterrepresent the temperature at the level of 50% weight loss and therate of weight loss at T50, respectively. Physically, the biomassfeatured by a larger value of R50 means that the biomass is rela-tively active at T50. As a whole, the value of T50 ranges from 333 to391 �C, revealing that over 50% of weight is lost when thetemperature is over 400 �C with the heating rate of 20 �C min�1.Corresponding to T50, the value of R50 is between 3.34 and 12.76%min�1. It is noted that the R50 of wood is much higher than theother three species, implying that the rate of weight loss or reac-tion intensity of wood is relatively dramatic in the vicinity of T50.This arises from the fact that the thermal decomposition of woodis characterized by a rapid decline in the second region, as shownin Fig. 1.
3.2. Characteristics of hemicellulose, cellulose and lignin
In general, lignocellulose is made up of three major constitu-ents; they are cellulose, hemicellulose and lignin. Cellulose micro-fibrils are macromolecular structures composed of semicrystallinearrays of b-1,4 glucan chains associated with one another throughextensive hydrogen bonding. Hemicellulose is characterized bylinear polymers and they are usually substituted with other sugarside-chains to prevent the formation of crystalline structures. Inregard to lignin, it is a phenolic polymer which essentially encasesthe polysaccharides of the cell walls, producing a strong anddurable composite material resistant to enzymatic attack [23]. Inthe past studies [7,24], it has been recognized that the lignocellu-losic structure of biomass can be qualitatively identified by meansof DTG. In other words, because of intrinsic difference in thestructures of hemicellulose, cellulose and lignin contained inbiomass, as stated above, they may be distinguished from the
distributions of weight loss intensity of biomass. In general, thethermal decomposition of hemicellulose occurs at temperaturesranging from 150 to 350 �C; cellulose is decomposed for thetemperatures in the range of 275e350 �C, and lignin is featured bygradual decomposition for the temperatures between 250 and500 �C [25,26]. The distributions of DTG of the four tested materialsare examined in Fig. 3. Obviously, a double-peak distribution in thecurve of bamboo is exhibited (Fig. 3a). The first peak (275 �C) andthe second peak (308 �C) stand for the thermal decomposition ofhemicellulose and cellulose, respectively. The curve behind thedouble peak is the pyrolysis of lignin whose intensity is, by far,smaller than that of the double peak. In the meantime, the bumpexhibited at around 50 �C is due to the liberation of moisture fromthe raw materials. When willow is tested, only one peak isexhibited. The peak developed at 323 �C (Fig. 3b) stems from thethermal decomposition of cellulose and the curve of hemicelluloseis almost merged by that of cellulose. Similar to the thermalbehavior of lignin in bamboo, the thermal decomposition of thelignin in willow is also characterized by a flat region when thetemperature is in the range of 380e470 �C. For the case of coconutshell, the peaks of hemicellulose and cellulose develop at 311 �Cand 353 �C, respectively (Fig. 3c). Unlike the previous twomaterials,no flat region is observed behind the peak of cellulose, that is, lignindecays steadily with increasing temperature. With regard to thethermal decomposition of wood, the peak of cellulose is located at378 �C and the peak of hemicellulose overlaps that of cellulose,resembling the behavior of willow. It is noteworthy that two smallpeaks are induced at the temperatures of 513 and 685 �C. Thisreflects that the wood includes two important components whichare reactive only when the temperature is higher than 500 �C. Inaddition, from Fig. 3 it can be seen that a bump always develops atthe temperature around 50 �C, as a consequence of moistureliberated from the biomass.
Upon inspection of the above observations, it should be pointedout that the structure of cellulose contained in the four samples aredifferent each other, as a consequence of distinct locations ofcellulose peak obtained in Fig. 3. Meanwhile, the DTG distributionsalso imply that the amount of hemicellulose contained in willowand wood are relatively small so that the peak of hemicellulose ismerged by that of cellulose. For example, in the study of Bridgeman[27], hemicellulose and cellulose contained inwillowwere 14.1 and49.3 wt%, respectively.
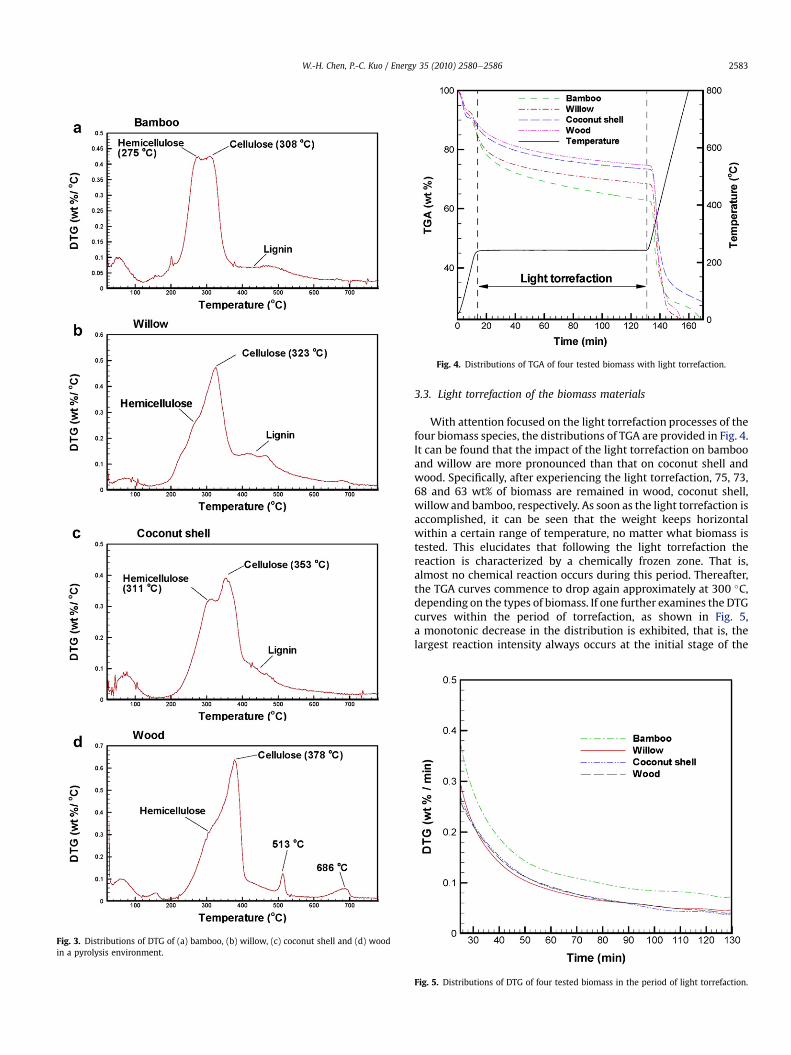
Fig. 3. Distributions of DTG of (a) bamboo, (b) willow, (c) coconut shell and (d) woodin a pyrolysis environment.
Fig. 4. Distributions of TGA of four tested biomass with light torrefaction.
W.-H. Chen, P.-C. Kuo / Energy 35 (2010) 2580e2586 2583
3.3. Light torrefaction of the biomass materials
With attention focused on the light torrefaction processes of thefour biomass species, the distributions of TGA are provided in Fig. 4.It can be found that the impact of the light torrefaction on bambooand willow are more pronounced than that on coconut shell andwood. Specifically, after experiencing the light torrefaction, 75, 73,68 and 63 wt% of biomass are remained in wood, coconut shell,willow and bamboo, respectively. As soon as the light torrefaction isaccomplished, it can be seen that the weight keeps horizontalwithin a certain range of temperature, no matter what biomass istested. This elucidates that following the light torrefaction thereaction is characterized by a chemically frozen zone. That is,almost no chemical reaction occurs during this period. Thereafter,the TGA curves commence to drop again approximately at 300 �C,depending on the types of biomass. If one further examines the DTGcurves within the period of torrefaction, as shown in Fig. 5,a monotonic decrease in the distribution is exhibited, that is, thelargest reaction intensity always occurs at the initial stage of the
Fig. 5. Distributions of DTG of four tested biomass in the period of light torrefaction.
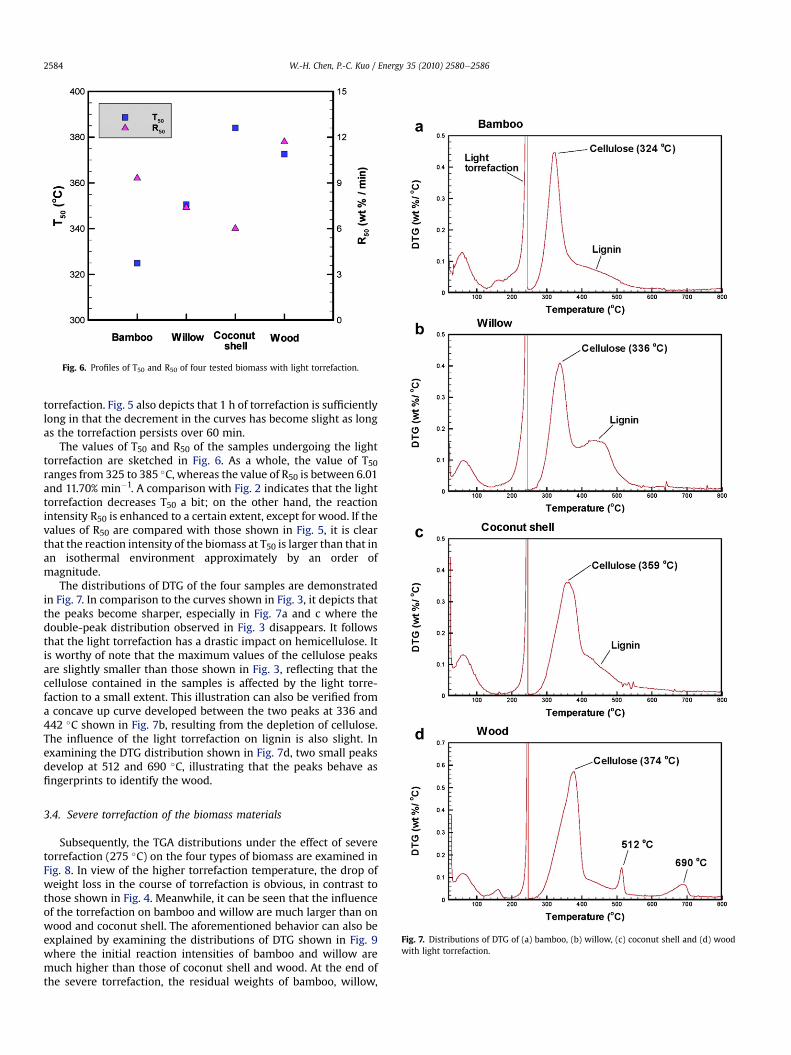
Fig. 6. Profiles of T50 and R50 of four tested biomass with light torrefaction.
W.-H. Chen, P.-C. Kuo / Energy 35 (2010) 2580e25862584
torrefaction. Fig. 5 also depicts that 1 h of torrefaction is sufficientlylong in that the decrement in the curves has become slight as longas the torrefaction persists over 60 min.
The values of T50 and R50 of the samples undergoing the lighttorrefaction are sketched in Fig. 6. As a whole, the value of T50ranges from 325 to 385 �C, whereas the value of R50 is between 6.01and 11.70% min�1. A comparison with Fig. 2 indicates that the lighttorrefaction decreases T50 a bit; on the other hand, the reactionintensity R50 is enhanced to a certain extent, except for wood. If thevalues of R50 are compared with those shown in Fig. 5, it is clearthat the reaction intensity of the biomass at T50 is larger than that inan isothermal environment approximately by an order ofmagnitude.
The distributions of DTG of the four samples are demonstratedin Fig. 7. In comparison to the curves shown in Fig. 3, it depicts thatthe peaks become sharper, especially in Fig. 7a and c where thedouble-peak distribution observed in Fig. 3 disappears. It followsthat the light torrefaction has a drastic impact on hemicellulose. Itis worthy of note that the maximum values of the cellulose peaksare slightly smaller than those shown in Fig. 3, reflecting that thecellulose contained in the samples is affected by the light torre-faction to a small extent. This illustration can also be verified froma concave up curve developed between the two peaks at 336 and442 �C shown in Fig. 7b, resulting from the depletion of cellulose.The influence of the light torrefaction on lignin is also slight. Inexamining the DTG distribution shown in Fig. 7d, two small peaksdevelop at 512 and 690 �C, illustrating that the peaks behave asfingerprints to identify the wood.
Fig. 7. Distributions of DTG of (a) bamboo, (b) willow, (c) coconut shell and (d) woodwith light torrefaction.
3.4. Severe torrefaction of the biomass materials
Subsequently, the TGA distributions under the effect of severetorrefaction (275 �C) on the four types of biomass are examined inFig. 8. In view of the higher torrefaction temperature, the drop ofweight loss in the course of torrefaction is obvious, in contrast tothose shown in Fig. 4. Meanwhile, it can be seen that the influenceof the torrefaction on bamboo and willow are much larger than onwood and coconut shell. The aforementioned behavior can also beexplained by examining the distributions of DTG shown in Fig. 9where the initial reaction intensities of bamboo and willow aremuch higher than those of coconut shell and wood. At the end ofthe severe torrefaction, the residual weights of bamboo, willow,
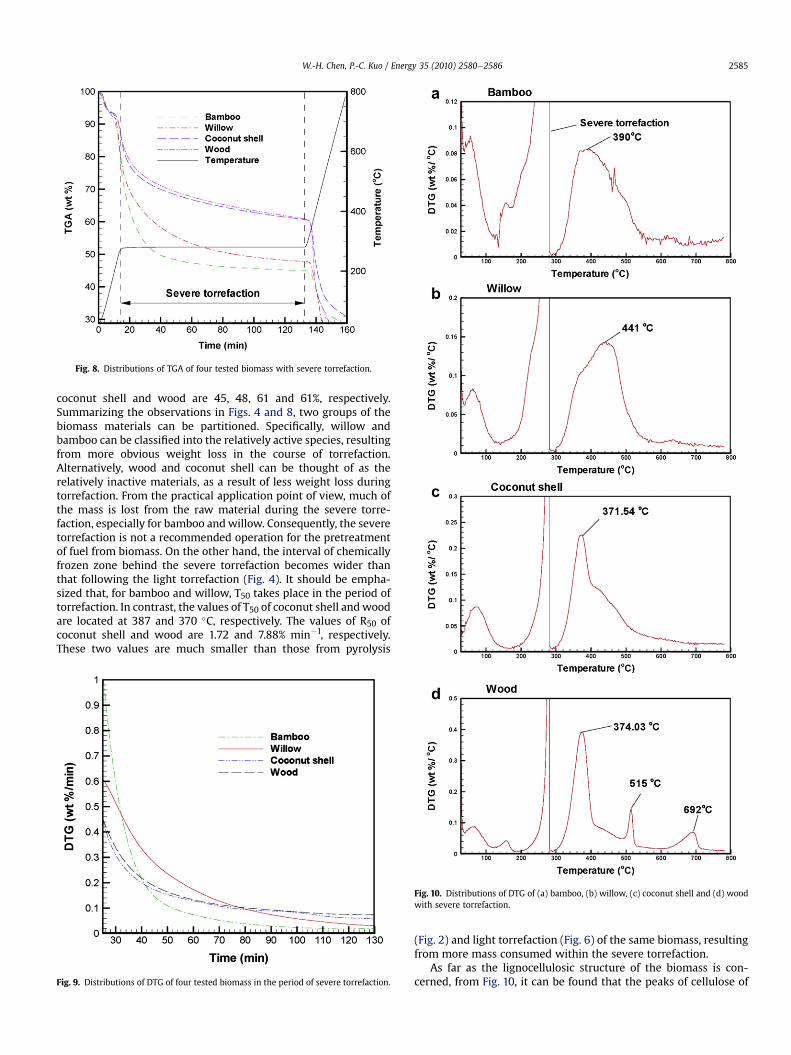
Fig. 8. Distributions of TGA of four tested biomass with severe torrefaction.
W.-H. Chen, P.-C. Kuo / Energy 35 (2010) 2580e2586 2585
coconut shell and wood are 45, 48, 61 and 61%, respectively.Summarizing the observations in Figs. 4 and 8, two groups of thebiomass materials can be partitioned. Specifically, willow andbamboo can be classified into the relatively active species, resultingfrom more obvious weight loss in the course of torrefaction.Alternatively, wood and coconut shell can be thought of as therelatively inactive materials, as a result of less weight loss duringtorrefaction. From the practical application point of view, much ofthe mass is lost from the raw material during the severe torre-faction, especially for bamboo andwillow. Consequently, the severetorrefaction is not a recommended operation for the pretreatmentof fuel from biomass. On the other hand, the interval of chemicallyfrozen zone behind the severe torrefaction becomes wider thanthat following the light torrefaction (Fig. 4). It should be empha-sized that, for bamboo and willow, T50 takes place in the period oftorrefaction. In contrast, the values of T50 of coconut shell andwoodare located at 387 and 370 �C, respectively. The values of R50 ofcoconut shell and wood are 1.72 and 7.88% min�1, respectively.These two values are much smaller than those from pyrolysis
Fig. 9. Distributions of DTG of four tested biomass in the period of severe torrefaction.
Fig. 10. Distributions of DTG of (a) bamboo, (b) willow, (c) coconut shell and (d) woodwith severe torrefaction.
(Fig. 2) and light torrefaction (Fig. 6) of the same biomass, resultingfrom more mass consumed within the severe torrefaction.
As far as the lignocellulosic structure of the biomass is con-cerned, from Fig. 10, it can be found that the peaks of cellulose of
W.-H. Chen, P.-C. Kuo / Energy 35 (2010) 2580e25862586
bamboo and willow wither in a significant way. Though the peaksof cellulose of coconut shell and wood are still clearly observed, themaximum values have been decreased to a certain extent. Forinstance, the maximum values of the peaks shown in Fig. 10c andd are 0.23 and 0.39% �C�1, respectively, whereas they are 0.36 and0.57% �C�1 in Fig. 7c and d, respectively. It is thus concluded that, inaddition to destroying the hemicellulose, the severe torrefactionwill further destroy a part of cellulose contained in the biomass,especially in bamboo and willow.
4. Conclusions
Pyrolysis, light torrefaction and severe torrefaction of four typesof biomass, consisting of bamboo, willow, coconut shell and wood,have been studied to recognize the weight loss dynamics of thebiomass and the impact of the torrefaction processes on the ligno-cellulosic structures. The obtained results suggested that thedistributions of TGA and DTG were able to provide a qualitativeinsight into the relationship among hemicellulose, cellulose andlignin.When thepyrolysis of thebiomasswasperformed, theweightlossprocess couldbepartitioned into threedifferent regions, and thereactions of hemicellulose and cellulose mainly occurred at thetemperatures between 200 and 400 �C. When the light torrefactionheld at 240 �C or the severe torrefaction held at 275 �C was carriedout, a chemically frozen zone was always exhibited after the torre-faction process was accomplished. The light torrefaction hada significant effect on the depletion of hemicellulose, but its impacton cellulose and lignin was slight. Over 60% of mass of the biomasswas preserved from the light torrefaction. Therefore, the light tor-refaction is a proper operation to pretreat biomass for producingfuels. When the severe torrefaction was practiced, more mass fromthe biomasswas consumed, especially in bamboo andwillowwhereT50 occurred in the course of the torrefaction. Some cellulose andlignin in the biomass were further reacted from the severe torre-faction. It is thus concluded that the severe torrefaction is not rec-ommended to pretreat biomass for intensifying its energy density.
Acknowledgements
The authors gratefully acknowledge the financial support ofNational Science Council, Taiwan, ROC, on this study.
References
[1] World energy outlook. International Energy Agency; 2007.[2] Hinrichs RA, Kleinbach M. Energy: its use and the environment. Orlando,
U.S.A: Harcourt; 2006.[3] Demirbas A. Combustion characteristics of different biomass fuels. Progress in
Energy and Combustion Science 2004;30:219e30.
[4] Pröll T, Hofbauer H. H2 rich syngas by selective CO2 removal from biomassgasification in a dual fluidized bed system e Process modelling approach. FuelProcessing Technology 2008;89:1207e17.
[5] Demirbas A. Progress and recent trends in biofuels. Progress in Energy andCombustion Science 2007;33:1e18.
[6] Elliott DC. Historical developments in hydroprocessing bio-oils. Energy &Fuels 2007;21:1792e815.
[7] Chen WH, Wu JS. An evaluation on rice husk and pulverized coal blends usinga drop tube furnace and a thermogravimetric analyzer for application toa blast furnace. Energy 2009;34:1458e66.
[8] Kalisz S, Pronobis M, Baxter D. Co-firing of biomass waste-derived syngas incoal power boiler. Energy 2008;33:1770e8.
[9] Chen WH. A simplified model of predicting coal gasification performance ina drop tube furnace. International Communications in Heat and Mass Transfer2007;34:623e9.
[10] Du SW, Chen WH. Pulverized coal burnout in blast furnace simulated bya drop tube furnace. Energy 2010;35:576e81.
[11] Prins MJ, Ptasinski KJ, Janssen FJJG. Torrefaction of wood. Part 1. Weight losskinetics. Journal of Analytical and Applied Pyrolysis 2006;77:28e34.
[12] Prins MJ, Ptasinski KJ, Janssen FJJG. Torrefaction of wood. Part 2. Analysis ofproducts. Journal of Analytical and Applied Pyrolysis 2006;77:35e40.
[13] Prins MJ, Ptasinski KJ, Janssen FJJG. More efficient biomass gasification viatorrefaction. Energy 2006;31:3458e70.
[14] Felfri FF, Luengo CA, Suarez JA, Beaton PA. Wood briquette torrefaction.Energy for Sustainable Development 2005;9:19e22.
[15] Bergman PCA, Boersma AR, Kiel JHA, Prins MJ, Ptasinski KJ, Janssen FJJG.Torrefaction for entrained flow gasification of biomass. In: Van Swaaij WPM,Fjallstrom T, Helm P, Grassi A, editors. Second world biomass conference.Rome, Italy: ETA-Florence and WIP-Munich; 2004. p. 679e82.
[16] Bergman PCA, Kiel JHA. Torrefaction for biomass upgrading. In: Proceedings ofthe fourteenth european biomass conference and exhibition, 17e21 October2005, Paris, France.
[17] Arias B, Pevida C, Fermoso J, Plaza MG, Rubiera F, Pis JJ. Influence of torre-faction on the grindability and reactivity of woody biomass. Fuel ProcessingTechnology 2008;89:169e75.
[18] Deng J, Wang GJ, Kuang JH, Zhang YL, Luo YH. Pretreatment of agriculturalresidues for co-gasification via torrefaction. Journal of Analytical and AppliedPyrolysis 2009;86:331e7.
[19] Yan W, Acharjee TC, Coronella CJ, Va squez VR. Thermal pretreatment oflignocellulosic biomass. Environmental Progress & Sustainable Energy2009;28:435e40.
[20] Couhert C, Salvador S, Commandre JM. Impact of torrefaction on syngasproduction from wood. Fuel 2009;88:2286e90.
[21] Uslu A, Faaij APC, Bergman PCA. Pre-treatment technologies, and their effecton international bioenergy supply chain logistics. Techno-economic evalua-tion of torrefaction, fast pyrolysis and pelletisation. Energy 2008;33:1206e23.
[22] Osório E, Gomes MLI, Vilela ACF, Kalkreuth W, Almeida MAA, Borrego AG,et al. Evaluation of petrology and reactivity of coal blends for use in pulver-ized coal injection (PCI). International Journal of Coal Geology 2006;68:14e29.
[23] Gomez LD, Steele-King C, McQueen-Mason SJ. Sustainable liquid biofuels frombiomass: the writing’s on the walls. New Phytologist 2008;178:473e85.
[24] Chen WH, Tu YJ, Sheen HK. Impact of dilute acid pretreatment on the struc-ture of bagasse for producing bioethanol. International Journal of EnergyResearch 2010;34:265e74.
[25] Antal MJ. Biomass pyrolysis: a review of the literature. Part I e carbonydratepyrolysis. Advances in Solar Energy 1983;11:61e111.
[26] Mansaray KG, Ghaly AE. Thermal degradation of rice husks in nitrogenatmosphere. Bioresource Technology 1998;65:13e20.
[27] Bridgeman TG, Jones JM, Shield I, Williams PT. Torrefaction of reed canarygrass, wheat straw and willow to enhance solid fuel qualities and combustionproperties. Fuel 2008;87:844e56.