topics for the geohistogram - kansas state university for the geohistogram the geohistogram...
TRANSCRIPT

Topics for the GeoHistoGram
The GeoHistoGram (Geography-History Diagram) offers a consistent way for teachers and
students to place new knowledge into a geographic and historical perspective that they can
tailor to their own learning style. It is not designed as a way to present new knowledge
(although it can be used, sparingly, for that purpose). It is rather intended as a way to
visualize the spatial and temporal location of an event and to note what else was happening
at the same time and/or place. This packet includes a number of topics and activities that
can be examined with the help of the GeoHistoGram.
In addition to the topics suggested in the following activity pages, teachers and students
in specific grades or schools can add many other themes to the GeoHistoGram. These
additional topics might include major paintings, sculptures, or musical compositions
(especially ones with political implications, such as the Drinking Gourd song or Sibelius’
Finlandia), sports (e.g. Olympic Games), styles of dress or food, significant battles, notable
speeches or writings, scientific discoveries, endangered species, pollution events, diseases,
etc. In short, the scope of the GeoHistoGram is limited only by your imagination and the
topics in your state curriculum. Each time a topic is added, the GeoHistoGram helps
students see how that topic is related to other topics already covered (such as empires,
revolutions, or inventions)
The key idea is that the diagram is not a particularly good way of presenting knowledge,
but it is a terrific way of organizing knowledge. It is therefore most appropriately used
frequently, but for only a few minutes at a time (except when it serves as the basis for an
occasional class activity, as outlined on these pages). Each addition to the diagram
reinforces the knowledge already entered, by providing both a visual review and another
set of links to help solidify the memory. See the PowerPoint introduction in this folder for
additional background and application ideas.
The activities on the following pages are initial review drafts of activities that are being
developed by the GeoHistory Project. This project is administered by the Michigan
Geographic Alliance, with collaborators in Texas, Mississippi, and New York, and funding
from the National Geographic Society. For more information about additional products
from this project, contact
http://www.ngsednet.org/community/index.cfm?community_id=177
or


Basic Structure of the GeoHistoGram
A historical timeline is a way to visualize when something occurred. It can also tell you
what else was going on in the world at the same time. Unfortunately, timelines in books
often try to show too many details all at once. Moreover, most of them do not have a
consistent way to include geographic information. To help us organize information in both
a temporal and spatial context, we will use the simple form shown on the next page.
- The horizontal lines indicate dates. The oldest dates are near the bottom of the
diagram; they are crowded together because we do not know as much about what
happened way back then. The timeline “stretches” as we get closer to the present.
That lets us show more of the details that still influence our lives today.
- The vertical boxes show major world regions. They are arranged in rough geographical
order from west to east. The “middle” is the area that has been called Mesopotamia,
the Fertile Crescent, the Promised Land, and the Crossroads of History. It is where
farming first began, iron was first made, and cities were first built. It has been an
area of conflict for many thousands of years, right up to the present day.
To give you a better idea how to use the GeoHistory Diagram, let us add eight key events.
1. People first began planting crops for food in the area that is now called Turkey
and Iran. This happened about 8000 years BCE (“Before the Common Era,”
the “Year One” that people use for calendars). Draw a small oval to
represent a wheat seed in the Middle column about 8000 years ago.
2. The idea of farming spread to southern Europe by 7000 BCE. Draw another small
oval in the Europe column at that time. Later, you will add symbols to the
timeline to show how farming spread to other regions of the world.
3. The Great Pyramids of Egypt were built about 2500 BCE. Draw a pyramid on the
right-hand side of the column for Africa about 2500 BCE. Later, you will
add other globally important buildings to the diagram.
4. A Roman fleet crossed the Mediterranean Sea in 125 BCE and captured Carthage
in northern Africa. This was a key event in the spread of the Roman Empire.
Draw a horizontal line from the Europe column to the Africa one, just below
the BCE/CE line. Later, you will add other empires to the diagram.
5. The Prophet Muhammad traveled to Mecca in the year 622CE. His trip marks
the beginning of the religion called Islam (Year One in the Islamic calendar).
Draw a crescent in the middle column at the year 622CE. Later, you will add
other key religious dates to the diagram.
6. Gunpowder was invented in China about 850 CE. Draw a small explosion in the
second column from the right, a little bit below the line for the year 1000.
Later, you will add other important inventions to the diagram.
7. Columbus sailed from Spain to the Americas in 1492. Draw a line to show that
“bridge” between continents. Later, you will add other important travels.
8. The United States became an independent country in 1776. Draw a star at the
appropriate place in the Americas column to note that event.

Key Reference Points on the GeoHistoGram
A GeoHistory Diagram is a way to visualize when and where something occurred. It can
also tell you what else was going on in the world at the same time. Unfortunately, timelines
in books often try to show too many details all at once. Worse, they often do not show
some of the information we already know. This is unfortunate, because this is the
background knowledge that we can use to put new information in perspective.
In this activity, you will add some of your own information to the diagram. Remember:
- The horizontal lines indicate dates, in thousands of years. The oldest dates are near
the bottom. The timeline gradually “stretches” as it gets closer to the present.
That allows it to show more of the recent details that still influence our lives.
- The vertical columns show the major world regions. They are arranged in rough
geographical order from west to east. In the middle is the area where farming
first began, iron was first made, and cities were first built. It also has been
an area of conflict for many thousands of years, right up to the present day.
Make a list of five key events that you already know well. Try to think of events that
happened in different parts of the world and at very different times:
What Happened When It Happened Where It Happened
___________________ ___________________ ___________________
___________________ ___________________ ___________________
___________________ ___________________ ___________________
___________________ ___________________ ___________________
___________________ ___________________ ___________________
Put a letter or symbol at the appropriate place on your GeoHistoGram to indicate each of
those events. For example, you might know that gunpowder was invented in China about
850 CE. To show that, draw a small explosion below the 1000 CE line in the second column
from the right. The graph can now help you remember other facts about East Asia,
because symbols for those facts will be higher or lower in the same column.
Now comes the harder part: pick five more events to put in some of the “empty” parts of
your space-time form. You may need to do some research to help you locate events that
you consider important. For example, suppose that your graph has no symbol anywhere in
the lower left quarter. You might do a textbook, almanac, or internet search to find an
easy-to-remember fact that you can show in that area. One possibility would be a letter M
in the Americas box to show the start of the Mayan civilization in Mexico about 600 BCE.
Remember, your goal is to have ten well-scattered space-time points to help you organize
new information in a way that makes it easier to remember.

Major Historical Eras on the GeoHistoGram
A GeoHistory Diagram is a way to visualize when and where something occurred. It can
also tell you what else was going on in the world at the same time.
In this activity, you will add some historical information to the diagram. Remember:
- The horizontal lines indicate dates, in thousands of years. The oldest dates are near
the bottom. The timeline gradually “stretches” as it gets closer to the present.
That allows it to show more of the recent details that still influence our lives.
- The vertical columns show the major world regions. They are arranged in rough
geographical order from west to east. In the middle is the area where farming
first began, iron was first made, and cities were first built.
According to the guidelines of the Michigan Department of Education, the history of the
world can be divided into 8 major eras:
1. beginnings – 4000 BCE the beginning of human society
2. 4000 BCE – 1000 BCE early civilizations and cultures
3. 1000 BCE – 300 CE classical traditions and major empires
4. 300 CE – 1500 CE expanding hemispheric interactions
5. 15th – 18th centuries first global age
6. 1776 CE – 1914 CE age of global revolutions
7. 1900 CE – 1945 CE global crisis and achievement
8. 1945 - Cold War and its aftermath
Part 1: Draw horizontal lines in the appropriate positions on the GeoHistoGram to separate
these historical eras. Write the name of each era in the correct space between your lines.
Part 2: Select two or three key events that you think are most characteristic of each era.
Put a dot at the appropriate position on the GeoHistoGram to represent each of your
selected events. Then label the event with its name (or a number code keyed to a separate
list, if you prefer).
Part 3: Select seven key events that you think mark the divisions between these eras. For
example, you might choose the division of the Roman Empire into two parts (with capitals
at Rome and Constantinople) as the event that marks the end of the classical traditions
era and the beginning of the hemispheric interaction era.
Part 4: write the number of the era in which each of these key events occurred:
____ Declaration of Independence ____ Code of Hammurabi
____ Great Pyramid in Egypt ____ Great Wall in China
____ beginning of Islam ____ beginning of Christianity
____ invention of steam engine ____ invention of iron forge
____ bubonic plague in Europe ____ AIDS in Africa
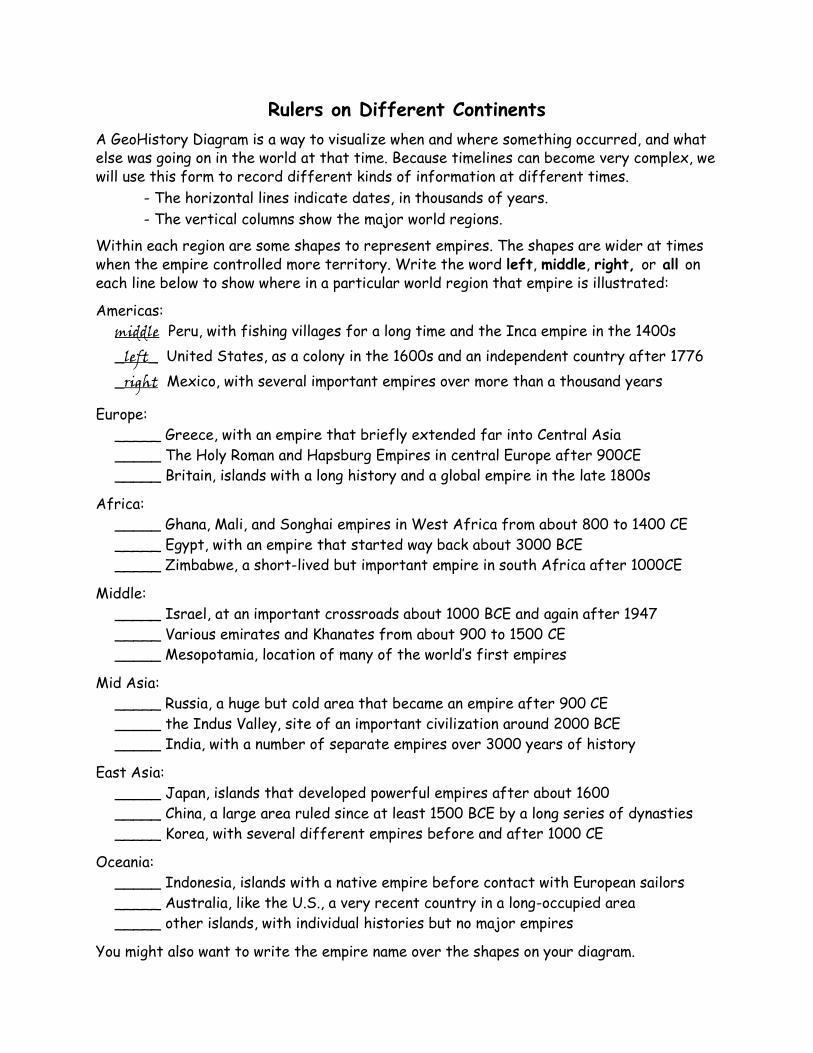
Rulers on Different Continents
A GeoHistory Diagram is a way to visualize when and where something occurred, and what
else was going on in the world at that time. Because timelines can become very complex, we
will use this form to record different kinds of information at different times.
- The horizontal lines indicate dates, in thousands of years.
- The vertical columns show the major world regions.
Within each region are some shapes to represent empires. The shapes are wider at times
when the empire controlled more territory. Write the word left, middle, right, or all on
each line below to show where in a particular world region that empire is illustrated:
Americas:
middle Peru, with fishing villages for a long time and the Inca empire in the 1400s
_left_ United States, as a colony in the 1600s and an independent country after 1776
_right Mexico, with several important empires over more than a thousand years
Europe:
_____ Greece, with an empire that briefly extended far into Central Asia
_____ The Holy Roman and Hapsburg Empires in central Europe after 900CE
_____ Britain, islands with a long history and a global empire in the late 1800s
Africa:
_____ Ghana, Mali, and Songhai empires in West Africa from about 800 to 1400 CE
_____ Egypt, with an empire that started way back about 3000 BCE
_____ Zimbabwe, a short-lived but important empire in south Africa after 1000CE
Middle:
_____ Israel, at an important crossroads about 1000 BCE and again after 1947
_____ Various emirates and Khanates from about 900 to 1500 CE
_____ Mesopotamia, location of many of the world’s first empires
Mid Asia:
_____ Russia, a huge but cold area that became an empire after 900 CE
_____ the Indus Valley, site of an important civilization around 2000 BCE
_____ India, with a number of separate empires over 3000 years of history
East Asia:
_____ Japan, islands that developed powerful empires after about 1600
_____ China, a large area ruled since at least 1500 BCE by a long series of dynasties
_____ Korea, with several different empires before and after 1000 CE
Oceania:
_____ Indonesia, islands with a native empire before contact with European sailors
_____ Australia, like the U.S., a very recent country in a long-occupied area
_____ other islands, with individual histories but no major empires
You might also want to write the empire name over the shapes on your diagram.

Gather It Wild or Grow Your Own?
The real breakthrough that we call agriculture is not just discovering how to put a seed
into the ground – it is knowing what kind of seed is likely to have a chance of surviving in
your environment and still providing useful food when it is fully grown.
Different parts of the world discovered different crop plants at different times. People
who found really good seeds often grew faster and stronger, and in many cases eventually
conquered their less fortunate neighbors. To understand the world today, therefore, it
helps to know about what kinds of seeds were “discovered” in specific parts of the world.
Here is a summary of some important archaeological evidence about farming:
8000 BCE Planting wheat in the hills around Mesopotamia (now called Iraq)
7000 BCE Planting high-protein crops such as lentils and peas in Mesopotamia
6500 BCE Planting rice in the Yangtze Valley (part of modern China)
6000 BCE Farming in the Indus Valley (part of a country now called Pakistan)
6000 BCE Farming in the Nile Valley of Egypt
5000 BCE Irrigating to increase yield in Mesopotamia and Egypt
4500 BCE Farming in the Ganges Valley (the northern part of modern India)
4000 BCE Planting sorghum in what is now called Sudan in northeast Africa
4000 BCE Planting grains in the British Isles
3500 BCE Planting grasses in the coastal areas of Peru
3000 BCE Planting sorghum and millet in west Africa
2700 BCE Planting maize in several parts of what is now called Mexico
2000 BCE Planting a number of crops in the island that is now called New Guinea
1200 BCE Planting maize in several parts of what is now the United States
Part 1: Draw a thick capital letter A (A) on your GeoHistoGram to indicate the time and
place of each of those archaeological records about agriculture.
Part 2: Go to the world map, and:
1. put a easy-to-see capital letter A (A) at each place noted on the list above.
2. write the date and the crop (if known) next to that map symbol
Part 3: Do some Internet research and write a paragraph to describe the changes that
might have occurred when farming arrived in a particular part of the world. Remember
that the technology of farming may have
- been independently invented, if people learned how to use a local plant for food,
- spread from other areas, if people saw the value of farming and learned how to do it,
- spread violently, if people who had food crops came and conquered “your” territory.
At the end of your paragraph, you might make a connection to the present day by noting
how the arrival of some new invention is like the arrival of agriculture in the past. For
example, what happens when people get access to the Internet for the first time?

Wooden Bats and Battle Axes
To appreciate the value of iron, you might think about trying to chop down a tree with a
rock. Or picture yourself trying to cut a board with a sharpened bone. Or imagine that you
have a wooden club, and someone attacks you with a long, sharp sword or a battle-axe.
In short, having iron is a big deal. It changed the way people did many things. Moreover,
people who did not have iron usually lost if they got involved in a war with people who had
iron tools and weapons. The arrival of iron-making technology in an area, therefore, usually
marks a turning point in its history.
Here is a summary of the archaeological evidence about iron:
1550 BCE The Hittites develop iron technology in what is now called Turkey
1200 BCE Iron spreads throughout Mesopotamia (present-day Iraq)
1100 BCE People use iron in the Ganges Valley of northern India
1000 BCE People in Greece make iron tools and weapons
750 BCE Iron is used in the Nile Valley of Egypt
700 BCE Iron-making spreads throughout continental Europe
600 BCE Iron-making starts in west Africa, near what is now called Nigeria
500 BCE People in Scandinavia make iron
400 BCE Iron-making reaches south Africa
. . .
1400s CE First metal-working in the Andean region of South America
Part 1: Draw a thick capital letter I (I) at the appropriate time and place on your
GeoHistoGram to indicate each of those archaeological records.
Part 2: Go to the world map, and:
1. put a small but prominent capital letter I (I) at each place noted on the table above.
2. write the date next to that map symbol
3. draw an arrow to show the likely route of its spread from a place where iron was
used at an earlier time
Part 3: Write a paragraph to describe the changes that might have occurred when iron
arrived in a particular part of the world. Remember that the technology may have spread
quietly (as “your people” saw the value of iron and learned how to make it). On the other
hand, it may have spread violently, if people who had iron weapons came and conquered
“your” territory. You might think of your paragraph as the first pages of a novel which
might go on to tell the story about how some people tried to cope with the changes that
occurred as a result of the arrival of iron.
At the end of your paragraph, you might make a connection to the present day. For
example, you could suggest how some new invention is like the arrival of iron in the past.
For example, what happens when people get access to the Internet for the first time?
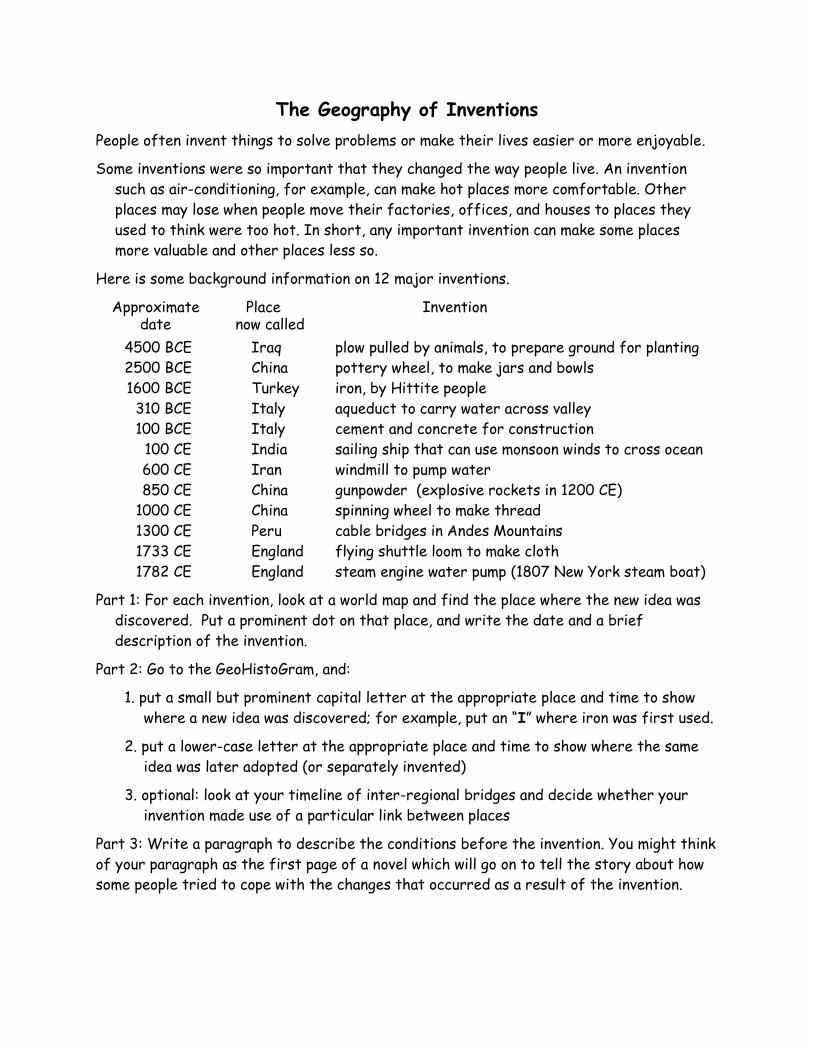
The Geography of Inventions
People often invent things to solve problems or make their lives easier or more enjoyable.
Some inventions were so important that they changed the way people live. An invention
such as air-conditioning, for example, can make hot places more comfortable. Other
places may lose when people move their factories, offices, and houses to places they
used to think were too hot. In short, any important invention can make some places
more valuable and other places less so.
Here is some background information on 12 major inventions.
Approximate Place Inventiondate now called
4500 BCE Iraq plow pulled by animals, to prepare ground for planting
2500 BCE China pottery wheel, to make jars and bowls
1600 BCE Turkey iron, by Hittite people
310 BCE Italy aqueduct to carry water across valley
100 BCE Italy cement and concrete for construction
100 CE India sailing ship that can use monsoon winds to cross ocean
600 CE Iran windmill to pump water
850 CE China gunpowder (explosive rockets in 1200 CE)
1000 CE China spinning wheel to make thread
1300 CE Peru cable bridges in Andes Mountains
1733 CE England flying shuttle loom to make cloth
1782 CE England steam engine water pump (1807 New York steam boat)
Part 1: For each invention, look at a world map and find the place where the new idea was
discovered. Put a prominent dot on that place, and write the date and a brief
description of the invention.
Part 2: Go to the GeoHistoGram, and:
1. put a small but prominent capital letter at the appropriate place and time to show
where a new idea was discovered; for example, put an “I” where iron was first used.
2. put a lower-case letter at the appropriate place and time to show where the same
idea was later adopted (or separately invented)
3. optional: look at your timeline of inter-regional bridges and decide whether your
invention made use of a particular link between places
Part 3: Write a paragraph to describe the conditions before the invention. You might think
of your paragraph as the first page of a novel which will go on to tell the story about how
some people tried to cope with the changes that occurred as a result of the invention.

Inter-regional “Bridges” in History
Major world regions can be separate or linked together in various ways.
At several key moments in history, people made journeys that linked major world regions in
new ways. Depending on the circumstances, these links could lead to the spread of ideas,
trade in food or other goods, movement of people, and more wealth at both ends of the
connection. On the other hand, the links could also lead to war, disease, and death.
In other words, you have to know something about the conditions at both ends of a new
connection in order to understand the consequences of the connection.
Here is some background information on some important “intercontinental bridges”:
1300 BCE Hebrews moved from Egypt to Palestine
325 BCE Alexander led an army from Greece to the Indus Valley
200 BCE Polynesian people sailed from Indonesia to Tahiti
125 BCE Romans crossed the Mediterranean Sea from Italy to Carthage
150 Sea traders traveled from India to east Africa
400 Huns came from central Asia and attacked Rome
711 Moors from Morocco invaded Spain
1099 Crusaders from Europe went to Palestine
1225 Genghis Khan led an army from Mongolia to Iraq and then Europe
1300 Marco Polo traveled from Venice to China
1492 Columbus sailed from Spain to the Caribbean islands
1673 Ottoman Turks advanced into Europe as far as Vienna
Part 1: For each of those intercontinental bridges, look at the map and identify:
1. the source area – the region where the movement began
2. the destination – the region where the movement ended
3. the date – the approximate time of the intercontinental movement
Part 2: Go to the GeoHistoGram, and:
1. put a small but prominent letter S at the place and time of the source.
2. put a small but prominent letter D at the place and time of the destination
3. draw a straight or gently curving arc to connect the source and destination
4. write the name of the leader or group of people who made that link
Part 3: Write a paragraph to describe the general conditions in the source and destination
areas before the connection occurred. You might think of your paragraph as the first
pages of a novel which will go on to tell the story about how some people tried to cope
with the changes that occurred as a result of the new connection.
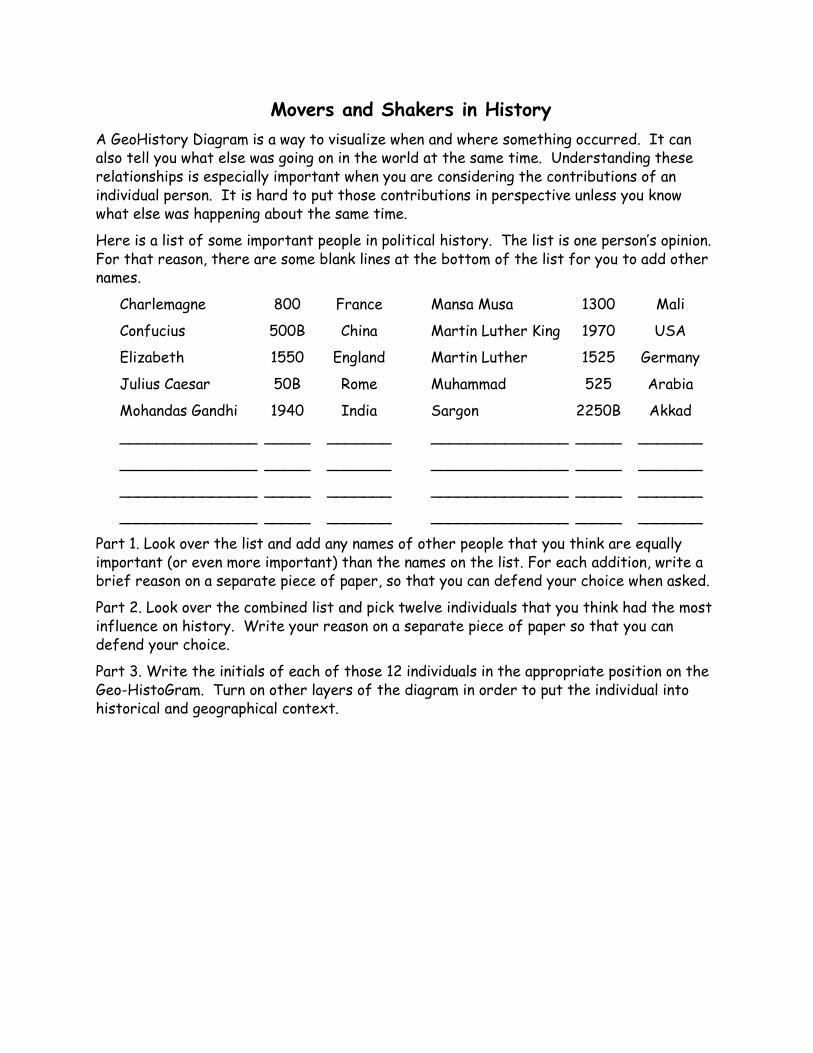
Movers and Shakers in History
A GeoHistory Diagram is a way to visualize when and where something occurred. It can
also tell you what else was going on in the world at the same time. Understanding these
relationships is especially important when you are considering the contributions of an
individual person. It is hard to put those contributions in perspective unless you know
what else was happening about the same time.
Here is a list of some important people in political history. The list is one person’s opinion.
For that reason, there are some blank lines at the bottom of the list for you to add other
names.
Charlemagne 800 France Mansa Musa 1300 Mali
Confucius 500B China Martin Luther King 1970 USA
Elizabeth 1550 England Martin Luther 1525 Germany
Julius Caesar 50B Rome Muhammad 525 Arabia
Mohandas Gandhi 1940 India Sargon 2250B Akkad
_______________ _____ _______ _______________ _____ _______
_______________ _____ _______ _______________ _____ _______
_______________ _____ _______ _______________ _____ _______
_______________ _____ _______ _______________ _____ _______
Part 1. Look over the list and add any names of other people that you think are equally
important (or even more important) than the names on the list. For each addition, write a
brief reason on a separate piece of paper, so that you can defend your choice when asked.
Part 2. Look over the combined list and pick twelve individuals that you think had the most
influence on history. Write your reason on a separate piece of paper so that you can
defend your choice.
Part 3. Write the initials of each of those 12 individuals in the appropriate position on the
Geo-HistoGram. Turn on other layers of the diagram in order to put the individual into
historical and geographical context.

The GeoHistory of Religion
Religion has been a great force in human history. Different religions developed in
different parts of the world. Moreover, at different times and places, religion helped to
unify or divide large numbers of people. When you put those facts together, you can see
how religion helped influence human history.
The first step is to identify the source areas of the great religions. Here is some
background information on several major religions (early dates are approximate):
1900 BCE Epic of Gilgamesh (G) written in Mesopotamia
1200 BCE Vedas written in India – beginning of Hinduism (H)
1200 BCE Moses writes Ten Commandments near border of Africa and Eurasia;
Judaism (J) spreads after Jews are deported to Babylon in 586 BCE
550 BCE Lao Tzu teaches in China; later known as founder of Taoism (T)
500 BCE Siddhartha Gautama, later known as the Buddha, teaches in India:
Buddhism (B) becomes the official religion of India in 256 BCE and
spreads to China about 100 CE, to Japan about 550 CE
500 BCE Confucius teaches in China;
Confucianism (C) becomes the official religion of China in 136 BCE
30 CE Jesus Christ preaches in Palestine; Christianity (X) spreads northwest
to Europe and south to the highlands of east Africa within 100 years
475 CE Shinto (S) shrines established in Japan
622 CE Muhammad travels to Mecca in Arabia – year 1 in the Islamic calendar;
Islam (I) spreads west across north Africa and east to the Indus Valley
within 100 years; Spain, India, and Indonesia become Islamic later
1517 CE Martin Luther writes 95 theses in Germany, a key event in the Reformation
that split Christianity and started Protestantism (P); nearly every other
religion on this list also had at least one major split in its history
Part 1: For each event, look at a map and identify the part of the world where it occurred.
Part 2: Go to the GeoHistGram, and:
1. Put a small but prominent capital letter at the appropriate place and time to show
where a new idea was discovered; for example, put a “B” where Buddhism began.
2. Put a lower-case letter at the appropriate place and time to show where a particular
religion spread away from its origin.
3. Optional: Look at your diagrams of empires and intercontinental bridges and decide
whether your religion spread with a particular empire or bridge.
Part 3: Write a paragraph to describe the conditions when the religion was started. You
might think of your paragraph as the first page of a novel which will go on to tell a story
about how people tried to cope with changes that occurred as a result of the religion.

The GeoHistory of Great Buildings
Monumental buildings are some of the most long-lasting products of great civilizations.
For this reason, a building often is used a kind of symbol to represent a given civilization.
The building itself also reflects the environment in which it was built.
The first step in exploring the geography of great buildings is to identify where and when
they were built. Here is some background information on twenty important buildings
(many dates are approximate, because most buildings took many years to finish):
A 2550 BCE Great pyramids along the Nile River in Egypt
B 2000 BCE Stonehenge in what is now Great Britain
C 470 BCE Parthenon in Athens, Greece
D 300 BCE Great Library in Alexandria, Egypt
E 215 BCE Great Wall (one of several) in northern China
F 80 CE Colosseum in Rome, Italy
G 120 CE Hadrian’s Wall, built by Romans in northern England
H 450 CE Mayan temples at Tikal, Yucatan Peninsula of southern Mexico
I 535 CE Hagia Sophia in Constantinople (later renamed Istanbul)
J 585 CE Horyuji Temple in Japan
K 750 CE Borobudur Temple on the island of Java, Indonesia
L 1050 CE Westminster Abbey in London, England
M 1125 CE Angkor Wat in Cambodia, Southeast Asia
N 1163 CE Notre Dame Cathedral in Paris, France
O 1200 CE Great Zimbabwe in South Africa
P 1406 CE Forbidden City in Beijing, China
Q 1450 CE Machu Picchu, mountaintop city in Peru
R 1452 CE Basilica of St. Peter, Vatican City
S 1632 CE Taj Mahal in northwestern India
T 1889 CE Eiffel Tower in Paris, France
Part 1: For each building, go to the GeoHistoGram, and:
1. Put a small but prominent capital letter at the appropriate place and time to show
where and when it was built.
2. Optional: Look at your timelines of empires and intercontinental bridges and decide
whether your building may have been associated with a particular empire or bridge.
Part 2: Write a paragraph to describe the conditions when the building was started.
You might think of your paragraph as the first page of a novel which will go on to tell
a story about how the building affected the lives of some people who lived near it.