tolerance of isolated rabbit hearts to short ischemic
TRANSCRIPT
1
Tolerance of isolated rabbit hearts to short ischemic periods is affected by
increased LV mass fraction
MIROSLAVA HLAVÁČOVÁ1*, VERONIKA OLEJNÍČKOVÁ2*, MARINA RONZHINA3, TIBOR
STRAČINA2, OTO JANOUŠEK3, MARIE NOVÁKOVÁ2, 4, PETR BABULA2, 4, JANA
KOLÁŘOVÁ3, IVO PROVAZNÍK3, HANA PAULOVÁ1
1Department of Biochemistry, Faculty of Medicine, Masaryk University, Brno, Czech Republic
2Department of Physiology, Faculty of Medicine, Masaryk University, Brno, Czech Republic
3Department of Biomedical Engineering, Faculty of Electrical Engineering and Communication,
University of Technology, Brno, Czech Republic
4International Clinical Research Centre, St. Anne’s University Hospital, Brno, Czech Republic
* Both authors contributed equally.
Corresponding author:
Hana Paulová, Department of Biochemistry, Faculty of Medicine, Masaryk University, Kamenice
753/5, bld. A16, 625 00 Brno, Czech Republic. E-mail: [email protected]
Short Title
Ischemic tolerance in rabbit heart with increased LV mass
Summary
Hypertrophied hearts are known for increased risk of arrhythmias and are linked with reduced
ischemic tolerance. However, still little is known about state characterized only by increased left

2
ventricle (LV) mass fraction. Seventeen isolated rabbit hearts with various LV mass were divided
into two groups according to LV weight/heart weight ratio (LVW/HW ratio), namely group H and L
(with higher and lower LVW/HW ratio, respectively) and underwent three short cycles of global
ischemia and reperfusion. The differences in electrogram (heart rate, QRSmax, mean number, onset
and dominant form of ventricular premature beats) and in biochemical markers of myocardial injury
(creatine kinase, lactate dehydrogenase - LDH) and lipid peroxidation (4-hydroxy-2-nonenal – 4-
HNE) were studied. As compared to group L, hearts in group H exhibited lower tolerance to ischemia
expressed as higher incidence and severity of arrhythmias in the first ischemic period as well as
increase of LDH and 4-HNE after the first reperfusion. In the third cycle of ischemia-reperfusion, the
preconditioning effect was observed in both electrophysiological parameters and LDH release in
group H. Our results showed consistent trends when comparing changes in electrograms and
biochemical markers. Moreover, 4-HNE seems to be good potential parameter of moderate
membrane alteration following ischemia-reperfusion injury.
Key Words
rabbit isolated heart, LV mass, global ischemia, electrogram, 4-hydroxy-2-nonenal
Introduction
Since the coronary artery disease still represents one of the major causes of morbidity and mortality
in many countries, ischemia-reperfusion injury is worth of further research. Using various models, it
has been intensely studied from many aspects, largely employing biochemical and
electrophysiological methods.
Myocardial ischemia-reperfusion injury is a complex pathophysiological process. Ischemic period is
3
characterized mainly by decreased ATP level leading to ion imbalance and cell acidosis. In
cardiomyocytes, the impairment of the membrane transport mechanisms due to lack of ATP results in
a decrease of resting transmembrane potential, action potential (AP), amplitude and duration and
eventually in altered conduction velocity (Elharrar and Zipes 1977; Shaw and Rudy 1997). The
resulting tissue inhomogeneity may lead to arrhythmias, frequently by re-entry mechanism (Elharrar
and Zipes 1977). In reperfusion, the reintroduction of molecular oxygen to the ischemic region leads
to excessive generation of reactive oxygen species (ROS), the central mediators of reperfusion injury
originating from mitochondria (Raedschelders et al. 2012). Superoxide radical (O2·-) is considered
the parent radical from which other radicals originate. The hydroxyl radical (·OH) is particularly
harmful because cells do not have antioxidant enzymes for its removal. ·OH attacks all sorts of
macromolecules. If polyunsaturated fatty acids in membrane lipids are targeted, formation of
secondary peroxidation products such as malondialdehyd, acrolein or 4-hydroxy-2-nonenal (4-HNE)
follows. 4-HNE is known for its high reactivity and cytotoxic potential (Poli et al. 2008) and also its
participation in development of hypertrophy was described (Calamaras et al. 2012). On the other
hand, positive effect of ROS is also known (Kalogeris et al. 2014). In ischemic preconditioning,
several cycles of ischemia and reperfusion provoke certain changes in signaling pathways leading to
protection of the heart. Preconditioned hearts show lower incidence of arrhythmias and reduced
infarct size (Halestrap et al 2007).
A specific situation is observed if a mass of the left ventricle significantly increases. Bigger mass of
myocardium requires higher oxygen and nutrient supply and may therefore potentiate tissue
vulnerability to ischemia. Moreover, higher number of mitochondria may produce even more ROS
and damage during reperfusion may escalate (Muntean et al. 2016). In patients suffering from
hypertrophic cardiomyopathy, significantly decreased tolerance to ischemia and intensification of

4
ischemic heart symptoms was previously reported (Efthimiadis et al. 2014).
In ischemia-reperfusion studies, numerous models including isolated heart are used due to possibility
to analyze multiple parameters in detail without modulation of neurohumoral inputs (Olejníčková et
al. 2015). From experimentally used species, rabbit is appropriate model because of
electrophysiological similarity of its heart with human myocardium (Kaese et al. 2013).
Predisposition of rabbit heart to spontaneous myocardial hypertrophy was previously reported (Chitty
2015). Therefore, the aim of this study was to assess tolerance of isolated rabbit hearts to repeated
ischemic insults with respect to various left ventricle mass fraction. Also biochemical parameters
which describe moderate alteration of myocardial membranes related to ischemic insult were studied.
Materials and Methods
All experiments were carried out with respect to recommendations of the European Community
Guide for the Care and Use of Laboratory Animals. The experimental protocol was approved by
Local Committee for Animal Treatment at Masaryk University, Faculty of Medicine.
Isolated heart preparation
Seventeen adult New Zealand rabbits (both sexes, weight 2.2-3.45 kg) were included to the study.
The animals were purchased from certified supplier (Velaz, Czech Republic). Animals were
premedicated by diazepam (Apaurin, Krka, Slovenia, 2 mg i.m.) and anaesthetized by mixture of
xylazin (Narkamon, Spofa, Czech Republic, 2 mg/kg i.m.) and ketamine (Calypsol, Gedeon Richter,
Hungary, 60 mg/kg, i.m.). Heparin (Heparin Léčiva, Zentiva, Czech Republic, 1000 IU/kg) was
administered intravenously to avoid blood clotting. To avoid ischemia during preparation the animals
were artificially ventilated (ventilator for small laboratory animals, World Precision Instruments,
USA). Bilateral thoracotomy was performed and the hearts were excised and placed into cold Krebs–
5
Henseleit solution (4 °C). The aorta was cannulated, the hearts were fixed to a modified Langendorff
apparatus (Olejníčková et al. 2015) and perfused at constant pressure (70 mmHg) with Krebs-
Henseleit solution (NaCl, 118.1 mM; NaHCO3, 27.1 mM; KCl, 4.8 mM; KH2PO4, 1.0 mM; MgSO4,
1.2 mM; CaCl2, 1.2 mM; glucose, 10.1 mM) continuously aerated by pneumoxyd (95% O2 and 5%
CO2). The temperature was maintained at 37°C. The hearts were stabilized during first 30 minutes of
perfusion. The experimental protocol consisted of 3 repeated ischemia-reperfusion series: 10
minutes-lasting global ischemia induced by stopping of perfusion was followed by 10 minutes-lasting
reperfusion (Fig.1). The flow of coronary effluent was measured as an overflow from the bath in
which the heart was placed.
Electrogram recording and analysis
During the whole experiment, three electrograms (EGs) were recorded simultaneously by touch-less
method using the orthogonal lead system (Kolářová et al. 2010). The signals were amplified by a set
of three biological amplifiers DAM50 (World Precision Instruments, USA) and further
simultaneously digitized by 16-bit AD converters at a sampling rate of 2000 Hz using a data
acquisition multifunction card PCI-6250 (National Instruments, USA).Analysis of electrogram
included heart rate, QRS complex parameters and ventricular arrhythmias assessment. The heart rate
(HR) was calculated in each 5th minute of experiment and normalized to the end of stabilization
period (100%). QRS complexes in EG recorded from middle area of LV were delineated. Duration
and maximal deflection of QRS (QRSd and QRSmax, respectively) were then calculated to evaluate
possible effect of LV mass changes on ventricular electrical activity. The ventricular arrhythmias
were classified into singles, salvos and ventricular tachycardia (VT) according to the Lambeth
conventions (Curtis et al. 2013). The total number of ventricular premature beats (VPBs) in each
6
minute of the experiment was assessed manually.
Biochemical analysis
The samples of coronary effluent were collected at the end of stabilization period and at the end of
the first and the third reperfusion (P0, P1, and P3 in Fig.1, respectively). Levels of two cardiac
enzymes (creatine kinase - CK, lactate dehydrogenase – LDH) were measured immediately using
commercial kits (ErbaLachema, Czech Republic) according to the manufacturer’s instructions. The
results were expressed in nkat.min-1.
All chemicals used in biochemical analyses of 4-hydroxy-2-nonenal (4-HNE) were of the p.a. or
HPLC grade, purchased from Sigma-Aldrich (St. Louis, MO, USA). The standard of 4-HNE was
obtained from Cayman Chemical (Ann Arbor, MI, USA). Determination of 4-HNE was performed
according to Kinter (Kinter 1996) with slight modification as described previously (Hlaváčová et al.
2015). Briefly, the 4-HNE concentration in coronary effluent was measured by HPLC with UV
detection after derivatization by 2,4-dinitrophenylhydrazine and subsequently calculated according to
the standard curve and expressed in nmol.min-1.
Histological evaluation
Immediately after the end of isolated heart experiment, sample of tissue from the LV lateral wall was
collected, embedded in freezing medium and frozen into liquid nitrogen. Samples were then stored at
-20°C until further processing. Sections of 10 um thickness were cut by cryostat, dehydrated and
stained. For general morphology, hematoxylin and eosin staining was used. Masson´s trichrome
staining was used to assess and visualize the extent of fibrosis in myocardium. Microscope Nikon
Eclipse Ti-S/L100 (Nikon, Japan) and NIS elements software (Nikon, Japan) was used to process
images and to evaluate the resultant pictures.
7
Distribution of the animals into groups
The body weight (BW) of animals was assessed before experiment followed by preparation of the
heart. At the end of experiment, various anatomical characteristics of hearts were measured: heart
weight (HW), left ventricle weight (LVW) and left ventricle wall thickness (LVT). Different visual
characteristics were noticed during preparation and course of experiment. Retrospectively, for more
detailed analysis of heart morphology following indexes were calculated: the heart weight to body
weight (HW/BW) ratio, the LV weight to body weight (LVW/BW) ratio and LV weight to heart
weight (LVW/HW) ratio. Based on the abovementioned results animals were distributed into two
groups according to the value of LVW/HW ratio which represents the LV fraction in the whole heart
mass and was the only index suitable for dividing the animals. To calculate the discrimination
threshold value, commonly used receiver operating characteristic analysis (Fawcett 2006) was
performed. As a result, the threshold ratio was set to 0.57 so the animals with ratio below or equal
0.57 belong to group L (N = 8, 2 females and 6 males) and above 0.57 belong to group H (N = 9, 2
females and 7 males).
Statistical analysis
The statistical analyses were performed using GraphPad Prism® 5 (version 5.01, GraphPad Software,
Inc., San Diego, CA, USA) and Matlab R2014b (The MathWorks, Inc., USA). Normality of data
distribution was verified using Shapiro Wilk test. Non-parametric Mann-Whitney U test was used to
test the differences between L and H groups in following data sets: 1) basic characteristics (body
weight, heart weight and others), 2) QRS complex parameters (QRSd and QRSmax) in stabilization
period 3) number of VPBs in each ischemic period, 4) values of biochemical parameters calculated at
the end of stabilization, the first and the third reperfusion periods (see Fig.1). Additionally, the
8
differences in values of biochemical parameters between various periods of experiment were verified
using non-parametric Friedman repeated measurement test followed by multiple comparison Tuky-
Kramer test. Correlation analysis (Spearman's rank correlation coefficient ρ calculated for L and H
group separately) was performed to examine the relationship between values of different biochemical
parameters in particular experimental period and also between values of each parameter calculated in
different periods. The values of heart rate were expressed as mean ± SEM. Differences in the HR
between L and H groups were analyzed by parametric Student’s unpaired t-test. The differences
between consecutive experimental periods were analyzed by paired t-test. Differences between
individual periods of each experiment and its stabilization period were analyzed by one-sample t-test.
For all tests, p< 0.05 was considered significant.
Results
Basic characteristics of data sets
No significant differences in anatomical parameters were found between L and H group. LVW/HW
ratio was the only parameter in which these groups differed significantly (p = 0.002, Mann-Whitney
U test). Spearman's ρ between all pairs of basic characteristics were also calculated. Significant
correlation (p<0.05) was confirmed between body weight and heart weight (ρ=0.86 in H group), heart
weight and left ventricle weight (ρ=0.97 and ρ=0.84 in L and H group, respectively).
Electrophysiological assessment of ischemic tolerance
As expected, HR was affected by ischemic insult. In H and L groups, HR decreased in ischemic
periods and was almost restored during the reperfusion periods. In group L, the decrease was
significant in all ischemic periods with better recovery after the first ischemia when compared with
group H. On the other hand, the HR decrease in group H was lower in all ischemic periods with better

9
recovery in the second and the third reperfusion periods. Almost all HR changes were significant
when comparing two consecutive periods of experiment in both groups. However, no significant
changes between the L and H groups were found when comparing the same period of experiment (see
Fig. 2).
The change in LV anatomy was reflected in value of QRSmax only. QRSmax calculated in H group
reached significantly higher value (p < 0.05) than that in L group (mean ± SEM): 2.54 ± 1.37 mV and
4.46 ± 1.52 mV in L and H group, respectively.
Last, arrhythmias were evaluated to assess tolerance of hearts to ischemia-reperfusion injury. During
the first ischemia, the mean number of VPBs was higher in group H (32.9 ± 17.9 vs. 14.5 ± 11.0 in L,
respectively). The difference has been found in the onset of VPBs (the 6th minute vs. the 5th minute in
H and L, respectively). Salvos dominated in H and singles in L group. During the second ischemia,
decrease of the mean number of VPBs was observed in both groups (to 96% and 15% in H and L,
respectively). The onset of arrhythmias was delayed (to the 7th minute in both groups). Although the
dominant form of arrhythmias during the second ischemia remained unchanged in both groups, there
was a worsening in the severity of arrhythmias during the third ischemia (VT in group H and salvos
in group L, respectively). In group H, the decrease of total VPBs and also delay of onset of
arrhythmias continued (to 14 % and the 9th minute). In group L, the onset of arrhythmias remained
the same (the 7th minute), however the total VPBs slightly increased (see Table 1 and Fig.3). None
arrhythmias were observed in any reperfusion period in both groups.
Biochemical assessment of ischemic tolerance
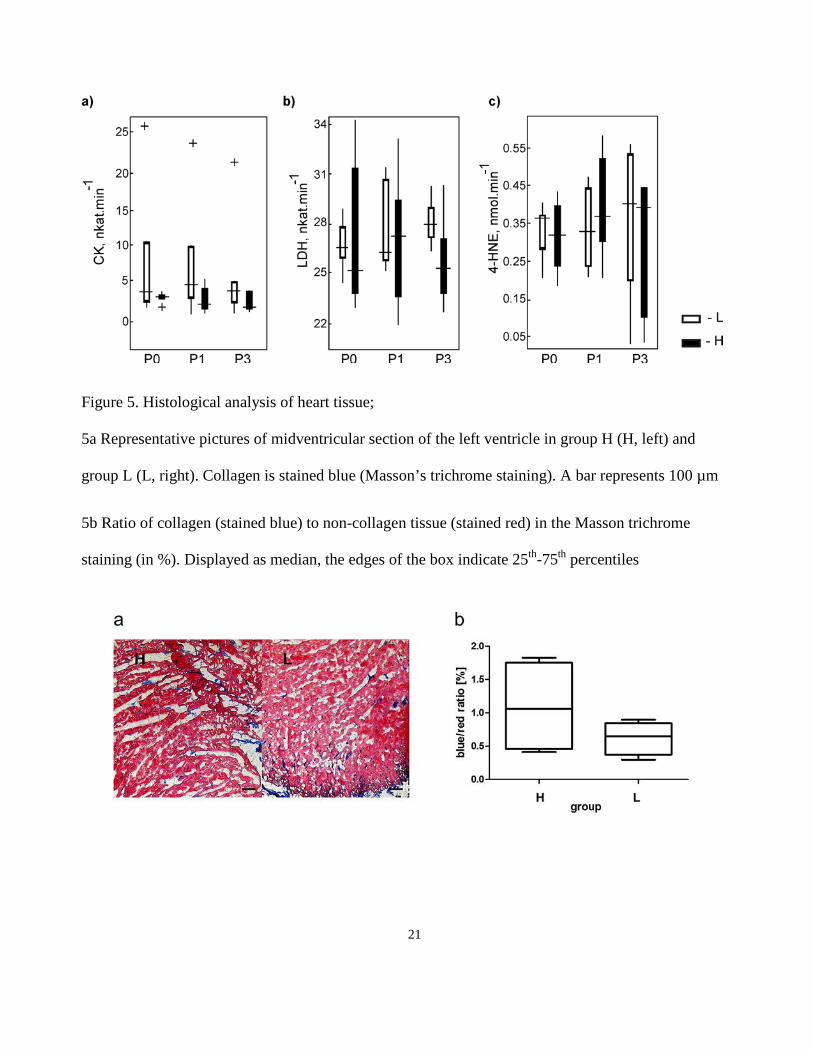
The values of biochemical parameters (CK, LDH and 4-HNE) related to flow of coronary effluent are
shown in Figure 4. There was no significant difference between group L and H in any determined
parameter and phase of experiment. Nevertheless in group H slightly increasing trend in the level of

10
LDH and 4-HNE after the first ischemic period was found. The trend was more visible in values of 4-
HNE, where the difference between stabilization period and the first reperfusion was close to
significant (p = 0.055). But in the third reperfusion period the trend in levels of LDH and 4-HNE was
not the same: while the level of LDH started to decrease slightly, values of 4-HNE showed
continuing increase. The increasing trend of 4-HNE and LDH after the first ischemia was not visible
in group L. On the contrary, values of biochemical parameters in the first reperfusion were the same
(LDH) or even lower (4-HNE) with slight increase of both parameters in the third reperfusion period.
The values of CK don’t show any trend in any group due to wide dispersion of values.
Correlation analysis was performed among values of studied biochemical parameters in particular
experimental periods between group L and H and no correlations were found. We also examined the
relationship between values of each parameter calculated in different periods in the same group. The
correlations were calculated separately for group H and L. Relevant correlations were found only in
group H. Positive correlation between values of 4-HNE and LDH in samples P0 and P1 were
observed. Moreover, from all followed biochemical parameters, only values of 4-HNE positively
correlate among all experimental periods (see Table 2).
Histological evaluation
Histological analysis revealed that the cardiomyocytes from H vs. L group did not differ as the short
axis dimension is concerned. Representative pictures of midventricular sections stained with
Masson´s trichrome are shown in Fig. 5a. In the content of collagen, apparent although insignificant
difference between group H and L was found (%blue 1.09 ± 0.69% vs. 0.62 ± 0.25%, for group H
and L, respectively, see Fig.5b).
Discussion
11
Cardiovascular diseases are still a leading cause of morbidity and mortality. It is well known that
pathologically hypertrophic hearts are at high risk of arrhythmias and sudden cardiac death and may
develop into heart failure (Verdecchia et al. 2001, Lorell et al. 2000). Besides other consequences
hypertrophy is characterized by increased oxidative stress via production of ROS, which are involved
both in the progress of cardiac hypertrophy and also alter directly the function of ion channels
(Giordano 2005). Therefore, cardiac hypertrophy is widely studied in experimental and clinical
medicine. However, it is still little known about state which precedes manifested hypertrophy. The
aim of this study was to find whether even slight increase of LV mass expressed as LVW/HW ratio
may change myocardial tolerance to ischemia Biochemical markers suitable for detection of
moderate alteration of membranes during ischemia-reperfusion injury were searched for.
In this work we first focused on characterization of hearts with slight increase of LV mass, which
might be therefore at higher risk of later progress in hypertrophy. After more detailed statistical
analysis the animals were divided according to LVW/HW ratio into group L (lower values of ratio)
and H (higher values of ratio). The assessment of LV enlargement in humans is generally based on
calculation of LVW using LV volume parameters estimated noninvasively by echocardiographic or
magnetic resonance techniques. Because of large differences in body size of subjects and its close
relation to LVW, various formulas have been proposed for LVW normalization by parameters
representing the body size, such as body weight (BW), body surface area or body mass index (Foppa
et al. 2005). Wolk and co-workers reported a rabbit model of induced hypertrophy where the increase
of LVW/BW ratio in group with induced hypertrophy was about 25% comparing to control group
(Wolk et al. 2001). In the present study, in group H (animals with spontaneously increased LV mass
fraction) the increase is only 4%. So it is evident that elevation of this parameter is not as significant
as in hypertrophied hearts. It is in agreement with the results of statistical analysis, in which the

12
LVW/HW ratio is the only index affected by increase of the LV mass fraction. Our distribution to the
group with higher (group H) and lower (group L) LV mass fraction is also supported by a trend
toward increased content of collagen in myocardium and significant increase of maximal amplitude
of QRS under non-ischemic condition. Correlation between quantity of collagen and sudden cardiac
death in patients with LV hypertrophy was shown in study of Tamarappoo and co-workers
(Tamarappoo et al. 2012). Increased QRSmax reflects increased LV mass; the Framingham study
reported that only the increased voltage of QRS complex is independent risk of cardiovascular
mortality (Kannel 1970). These findings support the distribution according to the left ventricle weight
to heart weight ratio, which more sensitively demarks hearts with bigger left ventricle mass and
changes connected with this condition.
After distribution of animals into group L and H the tolerance of hearts in both groups to ischemia-
reperfusion injury was examined. In group H, hearts were more susceptible to ischemic insults
expressed both by higher mean number of arrhythmias and their higher severity in both the first and
the second ischemic period. Different redox signaling in the hearts with increased LV mass (Sag et al.
2014) may explain their higher susceptibility to ischemia and reperfusion. This is consistent with
other studies, where the relation between left ventricular hypertrophy and higher incidence of
arrhythmias was manifested (Chatterjee et al. 2014). In the third ischemic period, reduced total VPBs
number and the delayed onset was observed in group H. This effect may result from ischemic
preconditioning. It is supported by better recovery of HR after the second ischemia and lower
decrease of heart rate in the third ischemic period in this group.
For biochemical analyses, three parameters were chosen. Creatine kinase and lactate dehydrogenase
(LDH) are rough parameters of direct myocardial injury and cell necrosis. The third parameter - 4-
hydroxynonenal (4-HNE) - is a marker of lipid peroxidation which occurs mainly in reperfusion
13
(Eaton et. al. 1999). From abovementioned parameters, only the values of LDH and 4-HNE showed
some differences. In group H, the increase of LDH and 4-HNE after the first reperfusion, in case of 4-
HNE nearly significant, confirms higher susceptibility of these hearts to the ischemic insult
comparing with group L. This finding is supported by study of Blasig and co-workers where
significantly higher release of 4-HNE in group of hypertrophic hearts compared with control group
after global ischemia was proven (Blasig et al. 1995). It is also known that cardiac hypertrophy is
characterized by increased glucose uptake with reduction in phosphocreatine/ATP ratio described
even in patients without developed hypertrophy (Crilley et al 2003). It is possible that this situation of
bioenergetic deficit is a stimulus, which causes higher susceptibility of hearts in group H to another
energetically complicated condition, which ischemia undoubtedly is. In the third reperfusion, the
level of LDH restores more or less to the stabilization level, but the amount of 4-HNE keeps slight
increase and shows wider variability as demonstrated in correlation analysis. It might indicate that
preconditioning affected LDH release, while moderate and fast non-enzymatic changes of
lipoperoxidation on membrane continue with further ischemic periods despite the preconditioning.
Such a rough parameter as LDH does not reflect these changes. In addition, there are some
associations among electrophysiological and biochemical changes, as described in our previous work
discussing correlations between ischemic-induced arrhythmias and production of hydroxyl radicals,
which are known precursors of lipid peroxidation (Paulová et al. 2013). For comparison, the animals
were divided according to their body weight as a rough anatomical parameter (below and above 3kg).
Results revealed that the differences in electrophysiological as well as biochemical results were
minimized and less homogenous than when groups H and L were compared, even when the animals
differed significantly not only in body weight but also in LV weight, which is used in assessment of
LV enlargement.

14
In summary, certain trends in incidence and severity of arrhythmias and values of biochemical
markers were found between the groups with lower and higher left ventricle mass expressed by
LVW/HW ratio, which attenuate after dividing the animals into groups according to body weight.
Hearts with higher LV mass fraction showed lower tolerance to ischemic insult. From biochemical
markers studied, 4-hydroxynonenal is a promising marker of moderate membrane alteration
following ischemia-reperfusion injury. Outcomes of this study may be beneficial for future research
in the field of the first pathological steps of developing myocardial hypertrophy.
Conflict of Interest
There is no conflict of interest.
Acknowledgements
This publication was written at Masaryk university as part of the project “Příspěvek chemických a
biochemických metodik ke studiu molekulární podstaty vybraných patologických stavů a
onemocnění“ no. MUNI/A/1056/2015 and “Kardiovaskulární systém očima molekulární fyziologie“
no. MUNI/A/1355/2016 with the support of the Specific University Research Grant, as provided by
the Ministry of Education, Youth and Sports of the Czech Republic in the year 2016. This work was
also supported by the grant projects of the Grant agency GAČR P102/12/2034 and by the project no.
LQ1605 from the National Program of Sustainability II (MEYS CR).
References
BLASIG IE, GRUNE T, SCHÖNHEIT K, ROHDE E, JAKSTADT M, HASELOFF RF, SIEMS
WG: 4-Hydroxynonenal, a novel indicator of lipid peroxidation for reperfusion injury of the

15
myocardium. Am J Physiol Heart Circ Physiol 269: H14–22, 1995.
CALAMARAS TD, LEE C, SIWIK DA, COLUCCI WS: The lipid peroxidation product 4-hydroxy-
2-nonenal (HNE) causes cardiac myocyte hypertrophy and activates hypertrophic MAP kinase
signaling. Free Radic Biol Med 53: S156, 2012.
CHATTERJEE S, BAVISHI C, SARDAR P, AGARWAL V, KRISHNAMOORTHY P,
GRODZICKI T, MESSERLI FH: Meta-analysis of left ventricular hypertrophy and sustained
arrhythmias. Am J Cardiol 117: 1049–1052, 2014.
CHITTY J: Cardiovascular disease in rabbits. Companion Anim 20: 74–78, 2015.
CRILLEY JG, BOEHM EA, BLAIR E, RAJAGOPALAN B, BLAMIRE AM, STYLES P,
MCKENNA WJ, ÖSTMAN-SMITH I, CLARKE K, WATKINS H: Hypertrophic cardiomyopathy
due to sarcomeric gene mutations is characterized by impaired energy metabolism irrespective of the
degree of hypertrophy. J Am Coll Cardiol 41: 1776–1782, 2003.
CURTIS MJ, HANCOX JC, FARKAS A, WAINWRIGHT CL, STABLES CL, SAINT DA,
CLEMENS-JEWERY H, LAMBIASE PD, BILLMAN GE, JANSE MJ, PUGSLEY MK, NG GA,
RODEN DM, CAMM AJ, WALKER MJA: The Lambeth conventions (II): Guidelines for the study
of animal and human ventricular and supraventricular arrhythmias. Pharmacol Ther 139: 213–248,
2013.
EATON P, LI JM, HEARSE DJ, SHATTOCK MJ: Formation of 4-hydroxy-2-nonenal modified
proteins in ischemic rat heart. Am J Physiol Heart Circ Physiol 276: H935–H943, 1999.
EFTHIMIADIS GK, PAGOURELIAS ED, GOSSIOS T, ZEGKOS T: Hypertrophic cardiomyopathy
in 2013: Current speculations and future prospectives. World J Cardiol 6: 26–37, 2014.
ELHARRAR V, ZIPES DP: Cardiac electrophysiologic alterations during myocardial ischemia. Am J
Physiol Heart Circ Physiol 2: H329–H345, 1977.

16
FAWCETT T: An introduction in FOC analysis. Pattern Recogn Lett 27:861–874, 2006.
FOPPA M, DUNCAN BB, ROHDE LEP: Echocardiography-based left ventricular mass estimation.
How should we define hypertrophy? Cardiovasc Ultrasound 3: 1-13, 2005.
GIORDANO FJ: Oxygen, oxidative stress, hypoxia and heart failure. J Clin Invest 115: 500–508,
2005.
HALESTRAP AP, CLARKE SJ, KHALIULIN I: The role of mitochondria in protection of the heart
by preconditioning. Biochim Biophys Acta 1767: 1007–1031, 2007.
HLAVÁČOVÁ M, GUMULEC J, STRAČINA T, FOJTŮ M, RAUDENSKÁ M, MASAŘÍK M,
NOVÁKOVÁ M, PAULOVÁ H: Different doxorubicin formulations affect plasma 4-hydroxy-2-
nonenal and expression of aldehyde dehydrogenase 3A1 and thioredoxin reductase 2 in rat. Physiol
Res 64/suppl.5: S653–S660, 2015.
KAESE S, FROMMEYER G, VERHEULE S, VAN LOON G, GEHRMANN J, BREITHARDT G,
ECKARDT L: The ECG in cardiovascular-relevant animal models of electrophysiology.
Herzschrittmacherther Elektrophysiol 24: 84–91, 2013.
KALOGERIS T, BAO Y, KORTHUIS RJ: Mitochondrial reactive oxygen species: A double edged
sword in ischemia/reperfusion vs preconditioning. Redox Biol 2: 702–714, 2014.
KANNEL WB, GORDON T, CASTELLI WP, MARGOLIS JR: Electrocardiographic left ventricular
hypertrophy and risk of coronary heart disease. The Framingham study. Ann Intern Med 72: 813–822,
1970.
KINTER M: Quantitative analysis of 4-hydroxy-2-nonenal. In: Free Radicals: A Practical Approach,
NA PUNCHARD, GJ KELLY (eds.), Oxford University Press, Oxford, pp. 133–145, 1996.
KOLÁŘOVÁ J, FIALOVÁ K, JANOUŠEK O, NOVÁKOVÁ M, PROVAZNÍK I: Experimental
methods for simultaneous measurement of action potentials and electrograms in isolated heart.
17
Physiol Res 59/suppl.1: S71–S80, 2010.
LORELL BH, CARABELLO BA: Left ventricular hypertrophy - Pathogenesis, detection, and
prognosis. Circulation 102: 470–479, 2000.
MUNTEAN DM, STURZA A, DĂNILĂ MD, BORZA C, DUICU OM, MORNOŞ C: The role of
mitochondrial reactive oxygen species in cardiovascular injury and protective strategies. Oxid Med
Cell Longev, doi: 10.1155/2016/8254942, 2016.
OLEJNÍČKOVÁ V, NOVÁKOVÁ M, PROVAZNÍK I: Isolated heart models: cardiovascular system
studies and technological advances. Med Biol Eng Comput 53: 669 - 678, 2015.
PAULOVÁ H, STRAČINA T, JARKOVSKÝ J, NOVÁKOVÁ M, TÁBORSKÁ E: Hydroxyl
radicals' production and ECG parameters during ischemia and reperfusion in rat, guinea pig and
rabbit isolated heart. Gen Physiol Biophys 32: 221–228, 2013.
POLI G, SCHAUR R, SIEMS W, LEONARDUZZI G: 4-hydroxynonenal: A membrane lipid
oxidation product of medicinal interest. Med Res Rev 28: 569–631, 2008.
RAEDSCHELDERS K, ANSLEY DM, CHEN DDY: The cellular and molecular origin of reactive
oxygen species generation during myocardial ischemia and reperfusion. Pharmacol Ther 133: 230–
255, 2012.
SAG CM, SANTOS CXC SHAH AM: Redox regulation of cardiac hypertrophy. J Mol Cell Cardiol
73: 103–111, 2014.
SHAW RM, RUDY Y: Electrophysiologic effects of acute myocardial ischemia: a theoretical study
of altered cell excitability and action potential duration. Cardiovasc Res 35: 256–272, 1997.
TAMARAPPOO BK, JOHN BT, REINIER K, TEODORESCU C, UY–EVANADO A, GUNSON
K, JUI J, CHUGH SS: Vulnerable myocardial interstitium in patients with isolated left ventricular
hypertrophy and sudden cardiac death: A postmortem histological evaluation. J Am Heart Assoc 1: 9

18
pages, doi.org/10.1161/JAHA.112.001511, 2012.
VERDECCHIA P, CARINI G, CIRCO A, DOVELLINI E, GIOVANNINI E, LOMBARDO M,
SOLINAS P, GORINI M, MAGGIONI AP: Left ventricular mass and cardiovascular morbidity in
essential hypertension: the MAVI study. J Am Coll Cardiol 38: 1829–1835, 2001.
WOLK R, SNEDDON KP, DEMPSTER J, KANE KA, COBBE SM, HICKS MN: Regional
electrophysiological effects of left ventricular hypertrophy in isolated rabbit hearts under normal and
ischaemic conditions. Cardiovasc Res 48: 120–128, 2000.
Table 1. Mean number of different types of VPBs in group L and H.
Period Group Singles Salvos VT Total
I1 L 11.1 ± 11.1 3.1 ± 2.6 0.3 ± 0.3 14.5 ± 11.0
H 6.8 ± 3.7 22.2 ± 14.3 3.9 ± 3.3 32.9 ± 17.9
I2 L 2.2 ± 1.5 0 0 2.2 ± 1.5
H 3.3 ± 2.3 23.8 ± 14.8 4.7 ± 0.9 31.8 ± 18.1
I3 L 2.6 ± 2.4 4.2 ± 3.8 0 6.8 ± 5.9
H 0.2 ± 0.2 1.0 ± 1.0 3.3 ± 3.3 4.5 ± 3.4
Values are means ± SEM; I1, I2, I3 – ischemia; VT – ventricular tachycardia.
Table 2. Correlations between the values of different biochemical parameters within experimental
period and correlations between the values of biochemical parameter from various experimental
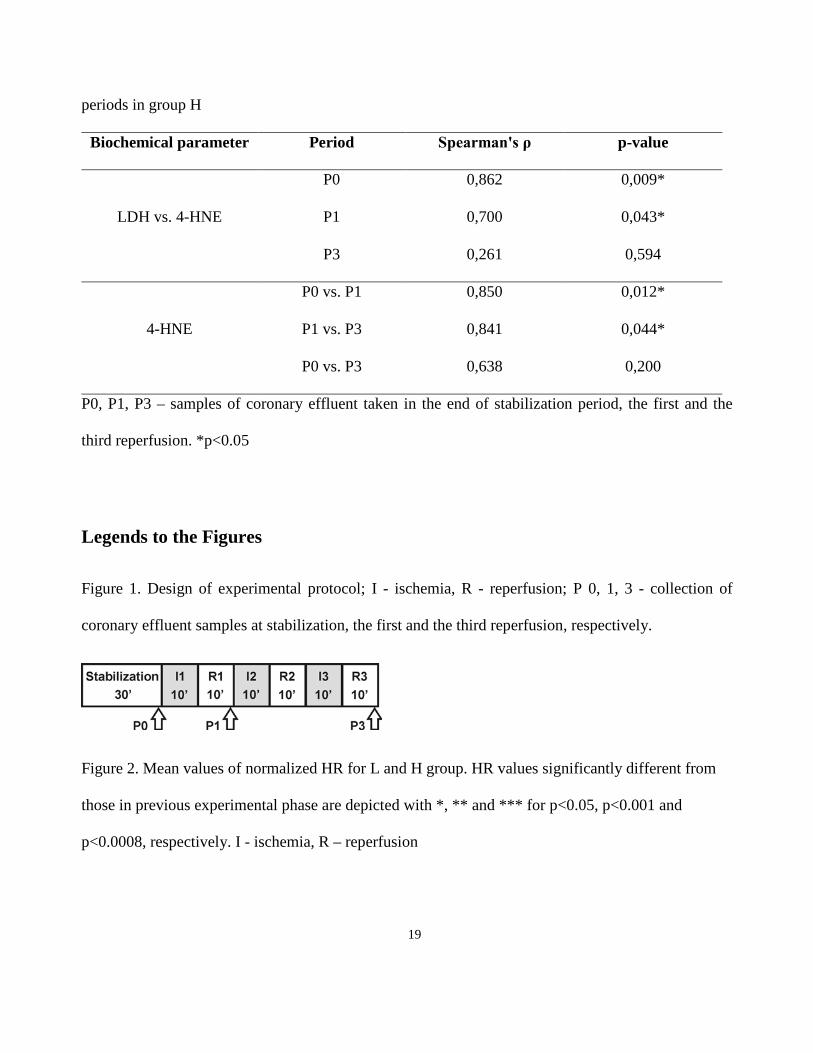
19
periods in group H
Biochemical parameter Period Spearman's ρ p-value
LDH vs. 4-HNE
P0 0,862 0,009*
P1 0,700 0,043*
P3 0,261 0,594
4-HNE
P0 vs. P1 0,850 0,012*
P1 vs. P3 0,841 0,044*
P0 vs. P3 0,638 0,200
P0, P1, P3 – samples of coronary effluent taken in the end of stabilization period, the first and the
third reperfusion. *p<0.05
Legends to the Figures
Figure 1. Design of experimental protocol; I - ischemia, R - reperfusion; P 0, 1, 3 - collection of
coronary effluent samples at stabilization, the first and the third reperfusion, respectively.
Figure 2. Mean values of normalized HR for L and H group. HR values significantly different from
those in previous experimental phase are depicted with *, ** and *** for p<0.05, p<0.001 and
p<0.0008, respectively. I - ischemia, R – reperfusion

20
Figure 3. Distribution of VPBs in each minute over the first, the second and the third ischemia (top,
middle and bottom panel, respectively) in group L and H.
Figure 4. Values of biochemical parameters CK (a), LDH (b) and 4-HNE (c) for L and H group in
different periods of experiment. Displayed as median, the edges of the box indicate 25th-75th
percentiles. P0, P1 and P3 – samples of coronary effluent at the end of stabilization, the first and the
third reperfusion, respectively.
21
Figure 5. Histological analysis of heart tissue;
5a Representative pictures of midventricular section of the left ventricle in group H (H, left) and
group L (L, right). Collagen is stained blue (Masson’s trichrome staining). A bar represents 100 µm
5b Ratio of collagen (stained blue) to non-collagen tissue (stained red) in the Masson trichrome
staining (in %). Displayed as median, the edges of the box indicate 25th-75th percentiles