tognum’s resilience business model unicredit german ... · pdf filetognum’s...
TRANSCRIPT
Tognum’s resilience business modelUniCredit German Investment Conference
Joachim Coers Achim SchneiderExecutive Vice President & CFO Head of Investor Relations
September 24/25, 2008

Slide 2 | Tognum – UniCredit GIC 2008 | September 2008
Legal disclaimer
This presentation is for information purposes only and does not constitute an offer to sell or a solicitation for an offer to buy any securities. The shares of Tognum AG will not be registered under the U.S. Securities Act of 1933.
This presentation includes certain forward-looking statements. These forward-looking statements can be identified by the use of forward-looking terminology, including the words "believes", "estimates", "anticipates", "expects", "assumes", "predicts", "intends", "may", "will" or "should", and similar expressions. Such forward-looking statements involve risks and uncertainties because they relate to events and depend on circumstances that may or may not occur in the future. Such forward-looking statements do not represent any guarantees of future performance. Tognum's actual results of operations, including its financial condition and profitability as well as the development of the general economic conditions in which it operates, may differ materially from (and be more negative than) those made in or suggested by the forward-looking statements contained in this presentation.
This presentation also includes certain market and market share data. To our knowledge, there is no single, comprehensive source that reliably describes the overall market and its sub-markets or the competitive situation in the market breakdown presented herein. Unless indicated otherwise, all the statements herein concerning the market and competition are therefore based on our own estimates, some of which have in turn been derived from a variety of sources. It is possible that the actual market conditions and competition may differ from the situation described herein, or that other market participants may come up with different estimates of the market and competitive conditions.

Slide 3 | Tognum – UniCredit GIC 2008 | September 2008
Strategic summary and outlook
Slide 4 | Tognum – UniCredit GIC 2008 | September 2008
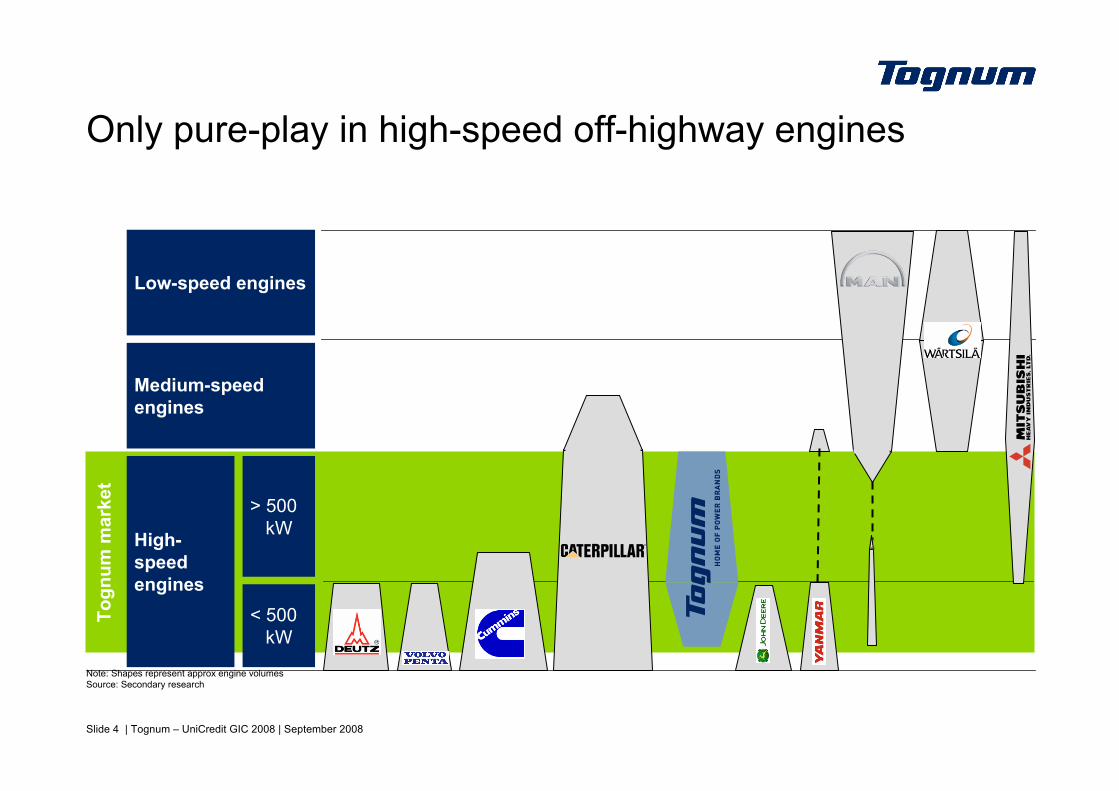
Only pure-play in high-speed off-highway enginesTo
gnum
mar
ket
Low-speed engines
Medium-speed engines
> 500kW
< 500kW
High-speed engines
Note: Shapes represent approx engine volumesSource: Secondary research
Slide 5 | Tognum – UniCredit GIC 2008 | September 2008
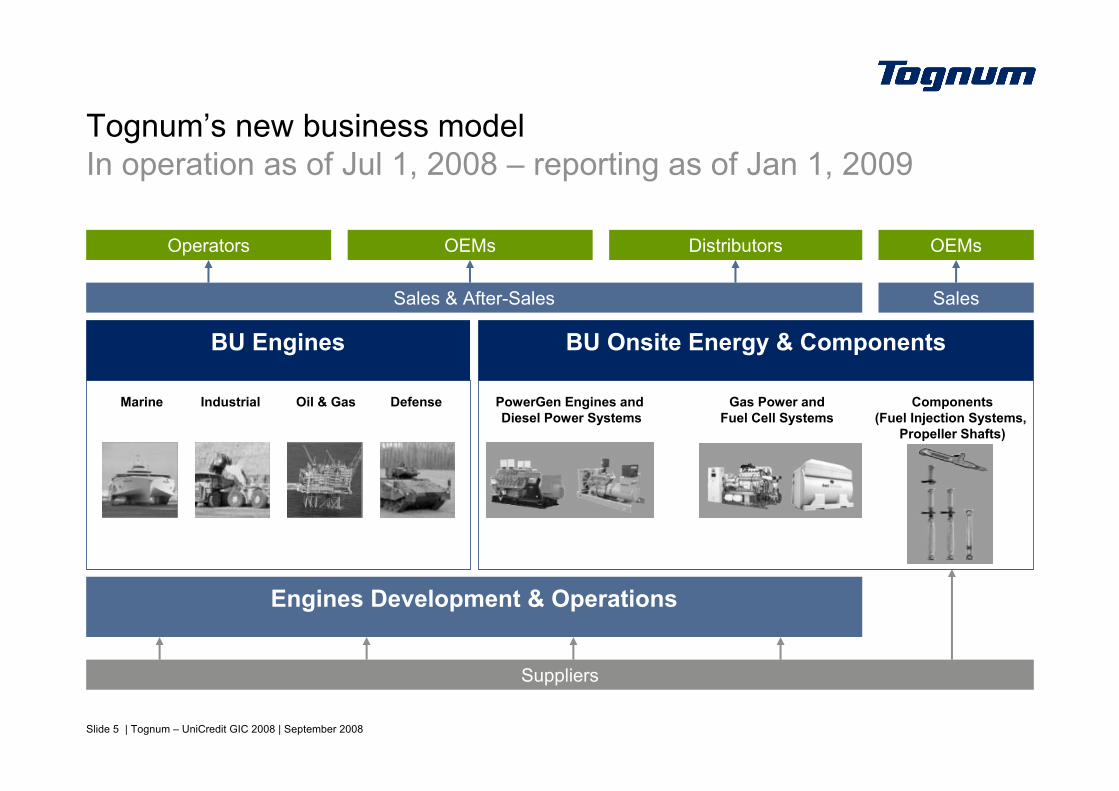
Tognum’s new business modelIn operation as of Jul 1, 2008 – reporting as of Jan 1, 2009
Marine Industrial Oil & Gas Defense PowerGen Engines andDiesel Power Systems
Gas Power andFuel Cell Systems
Components(Fuel Injection Systems,
Propeller Shafts)
Operators OEMs Distributors OEMs
Sales & After-Sales Sales
BU Engines BU Onsite Energy & Components
Engines Development & Operations
Suppliers

Slide 6 | Tognum – UniCredit GIC 2008 | September 2008
Consolidated group performanceFY 2007 and H1 2008
200-916199EBIT adj.
€1.58EPS adj.
€1.01EPS adj.
1,517
1,648
390
2,835
3,107
Tognum Group
300
317
31
527
539
OES&C
-701,401Order intake
-1172,684Order intake
-1082,416Revenue
-14373EBIT adj.
H1 2008 (Jun 30)
-691,286Revenue
FY 2007 (Dec 31)
Consolidation/Corp. Service
Enginesin €m

Slide 7 | Tognum – UniCredit GIC 2008 | September 2008
Outlook FY 2008Adj. EPS target confirmed at >€2.00
+25 % to >€ 2.0013–15 %11–13 %
8.0–9.0 %6.5–7.0 %
1.38$/€ - 1.45 $/€
2008 GuidancePlan 12/07 - 05/08
+25 % to >€ 2.00≥ 13 %≥ 11 %
~8 %~7 %
1.55 $/€
2008 OutlookUpdate 08/08
€ 1.5813.8 %
+11.8 %
~9.5 %~8 %
1.37 $/€
2007 Actual
Revenue growth rate
Avg. USD/EUR fx rate*Market growth diesel engines
Return on Sales (adj.)Earnings per share (adj.)
Market growth OES business
* Tognum estimates based on banks consensus

Slide 8 | Tognum – UniCredit GIC 2008 | September 2008
Source: Company data, Analyst estimates
Limited regional riskGlobal footprint supports stable growthRevenue split 2007 [%]
RoW
AsiaNorth America
Europe
0
10
20
30
40
50
60
70
80
90
100
Tognum MAN Diesel Deutz Wärtsilä Cummins CaterpillarEngines

Slide 9 | Tognum – UniCredit GIC 2008 | September 2008
Uniquely balanced portfolio mitigates cyclical sensitivity45-50% of sales are non-cyclical
Service / Repairs
Split byregion
Europew/o Germany
After Sales/Others
Defense
Marine
PowerGen
Components
OES
CommercialRail
Yacht
C&IAgricultureTrucks
Mining
HeavySpare parts
Medium / Light
Naval / Governmental
Oil & Gas IndustryGas PowerGenDiesel PowerGen
Propeller Shafts
Fuel CellDiesel Genset
Injection SystemsGas Genset
– Broad & well balanced portfolio with >20 different application areas– Financially highly attractive end markets with some high barriers to entry– Excellent growth perspectives regarding energy/power, raw materials/
transportation and industrial development in emerging countries
Rest of World
27%
17%
28%
7%
21%
Asia/Pacific
NAFTA
Germany
Components
OES
Split by subapplication
Split by end markets
After Sales/Others
Defense
Industrial
Marine
PowerGen
Components
OES
Split by subapplication
Split by end markets
After Sales/Others
Defense
Industrial
Marine
PowerGen
Components
OES
Split by subapplication
Split by end markets
After Sales/Others
Defense
Industrial
Marine
PowerGen
Components
OES

Slide 10 | Tognum – UniCredit GIC 2008 | September 2008
Flexible engine & production concept
Gas Marine Mining Rail Genset
Core engine (S4000)

Slide 11 | Tognum – UniCredit GIC 2008 | September 2008
Rail / Locomotives Mining trucks
Why do our customers pay premium prices?
Tognum’s customers benefiting from MTU strengthsin reducing their life cycle costs and engine emissions
– Initial purchase price often makes up only approx. 1.5-2.0% of total life cycle costs– The fuel price is the determining factor for life cycle cost of engines with very long running hours – Accordingly, fuel consumption is a major decision factor when buying engines for applications such as
– Rail (Locomotives)– Mining trucks– Work boats and ferries– PowerGensets (for permanent power)
Fuel 90.5%
Preventive Maintenance 6.8%
Corrective Maintenance 1.1%
Engine price 1.7%
Fuel 92.5%
Preventive Maintenance 4.9%
Corrective Maintenance 0.8%
Engine price 1.8%
Source: MTU FN, customer feedback

Slide 12 | Tognum – UniCredit GIC 2008 | September 2008
Resilient business model succeeds in challenging environmentFY08 guidance confirmed despite currency and cost headwinds
After-Sales
Asia/China
Portfolio
PG/OES
After-Sales
Asia/China
Portfolio
PG/OES
Uniquely balanced portfolio
USD weakness Rising input costs Business units realignment, Rotorion spin-off
Management of mitigating factors:+++ Flexible hedging policy +++ Price increases 2008 and 2009 +++ 2008 sourcing secured for higher volume +++ TOP program execution +++ Increasing global sourcing & production +++
Split by sub-application
Split by end markets
Split byregion
– Balanced geographical split– Diversified product and
production mix– ~22 different subapplications– Flexible production
and allocation set-up
– Financially attractive end markets– Long-term growth perspectives– Turning established positioning into
sustainable earnings growth
Strategic growth initiatives

Slide 13 | Tognum – UniCredit GIC 2008 | September 2008
Product portfolio After Sales
PowerGen/Onsite Energy SystemsAsia & China strategy
Strategic growth initiativesReview of YTD 2008 measures
– New organization structure implemented effective July 1st; reporting to change per January 1, 2009
– R&D for gas engines to enable all engine versions for PowerGen applications
– Initiative to further build out diesel systems– Increased capacity at Katolight installed,
preparation for export (50Hz) in 2009
– JV w/ Hug for exhaust gas after treatment – Delivered propulsion system for the world’s
cleanest Diesel locomotive– Upgraded “Iron Man” (16V4000) for workboats to
higher power output at even lower fuel consumption– First “HotModule Hybrid” offered, a cogeneration
heat/power unit based on gas engine and fuel cell
– Development & production JV concluded and subsidiary established
– First major NPP contracts expected in 2008– Growing demand of premium engines for Chinese
market, e.g. Industrial and PowerGen– Growing export of engines from Asia into other
regions, e.g. PowerGen
– Spare parts centre for improved availability and reduced response times
– SKL expands remanufacturing business for MTU, expecting major order for PowerGen engines
– Malaysian JV for Asian remanufacturing centre – Strengthening European distribution and after sales
Slide 14 | Tognum – UniCredit GIC 2008 | September 2008
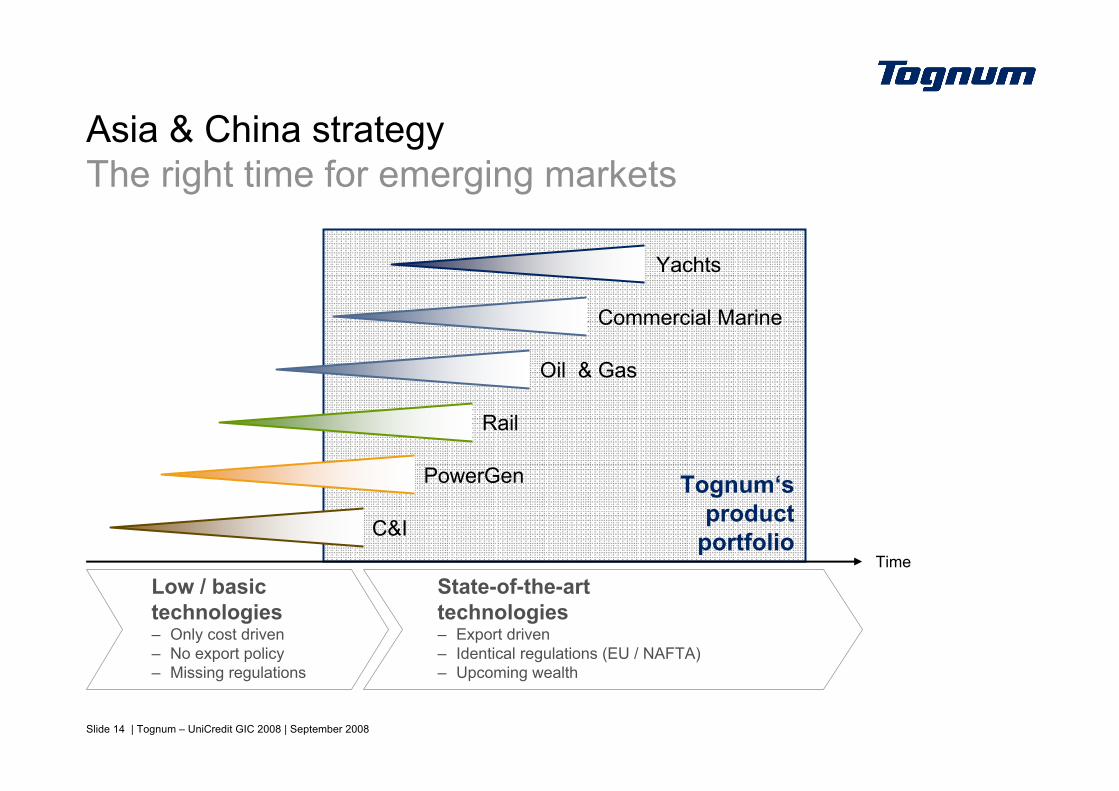
Tognum‘sproduct
portfolio
Asia & China strategyThe right time for emerging markets
Time
C&I
PowerGen
Rail
Oil & Gas
Commercial Marine
Yachts
Low / basictechnologies– Only cost driven– No export policy– Missing regulations
State-of-the-arttechnologies– Export driven– Identical regulations (EU / NAFTA)– Upcoming wealth

Slide 15 | Tognum – UniCredit GIC 2008 | September 2008Existing Next step Flexibility
USA(New)
Further expansion of manufacturing capacity to secure growth, flexibility and localisation
Germany(Friedrichshafen)
Asia/Pacific(Suzhou)
Implementation
– Install components manufacturing in Turkey at existing facility
– Selection of new site in USA as first step to built-up components manufacturing in the USD area
– Increase manufacturing capacity in Germany for key components
– Expansion of local sourcing in respective regions
Internationalization of components manufacturing
Existing global assembly footprint
North America(Detroit)
Europe(FN, Turkey)
Turkey(New)
Focus on internationalization
– Install manufacturing capacity first-time outside Germany and increase global sourcing
– Transition to flexible manufacturing sites– Increase local content to further improve sales
(e.g. governmental projects) and natural hedging– Strengthening competitiveness (efficiency, wages)
Investment rationale
– Added capacity in 2008 >25% higher than in 2006– In 2007/2008, Tognum grows faster than expected– In 2009, max. utilization again incl. 3-shift operation
and extended Sunday work in bottleneck areas– Decision taken to further expand capacity now in
order to meet market demand in 2010
Slide 16 | Tognum – UniCredit GIC 2008 | September 2008
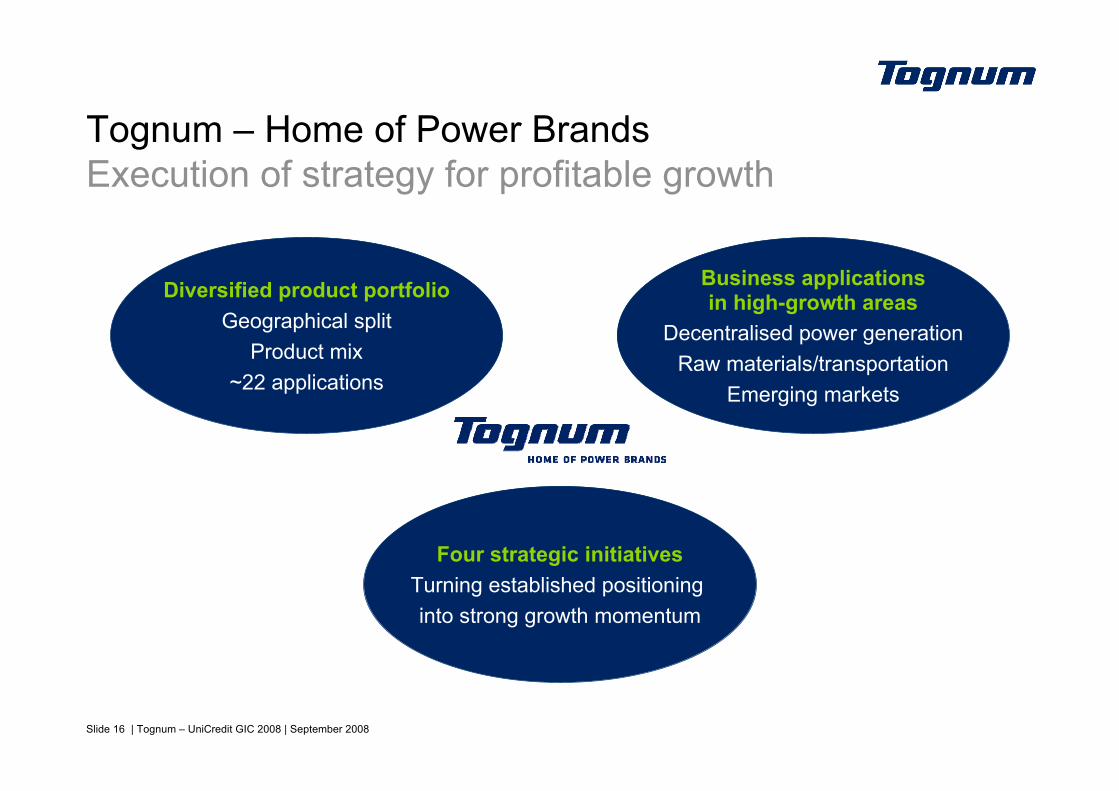
Tognum – Home of Power BrandsExecution of strategy for profitable growth
Diversified product portfolioGeographical split
Product mix~22 applications
Four strategic initiativesTurning established positioninginto strong growth momentum
Business applicationsin high-growth areas
Decentralised power generationRaw materials/transportation
Emerging markets

Slide 17 | Tognum – UniCredit GIC 2008 | September 2008
Tognum AG shareholder structureTotal free float of 65.5%*; MDAX weight ~2%**
Daimler AG25.0 % + 1 Share*
Seeker Management-beteiligung GmbH & Co. KG9.5 % (Group Management)
Schmid Maybach LLC2.7 % (Free float)
Others62.8 % (Free float)
Including– ING Groep > 5 %*– FIL/Fidelity > 3 %*
* According to their releases of Voting Rights (Article 21, Section 21 of the German Securities Trading Act, WpHG) until Sep 17, 2008** As of Sep 22, 2008 according to Deutsche Börse AG
Slide 18 | Tognum – UniCredit GIC 2008 | September 2008
Engines Development & Operations
Slide 19 | Tognum – UniCredit GIC 2008 | September 2008
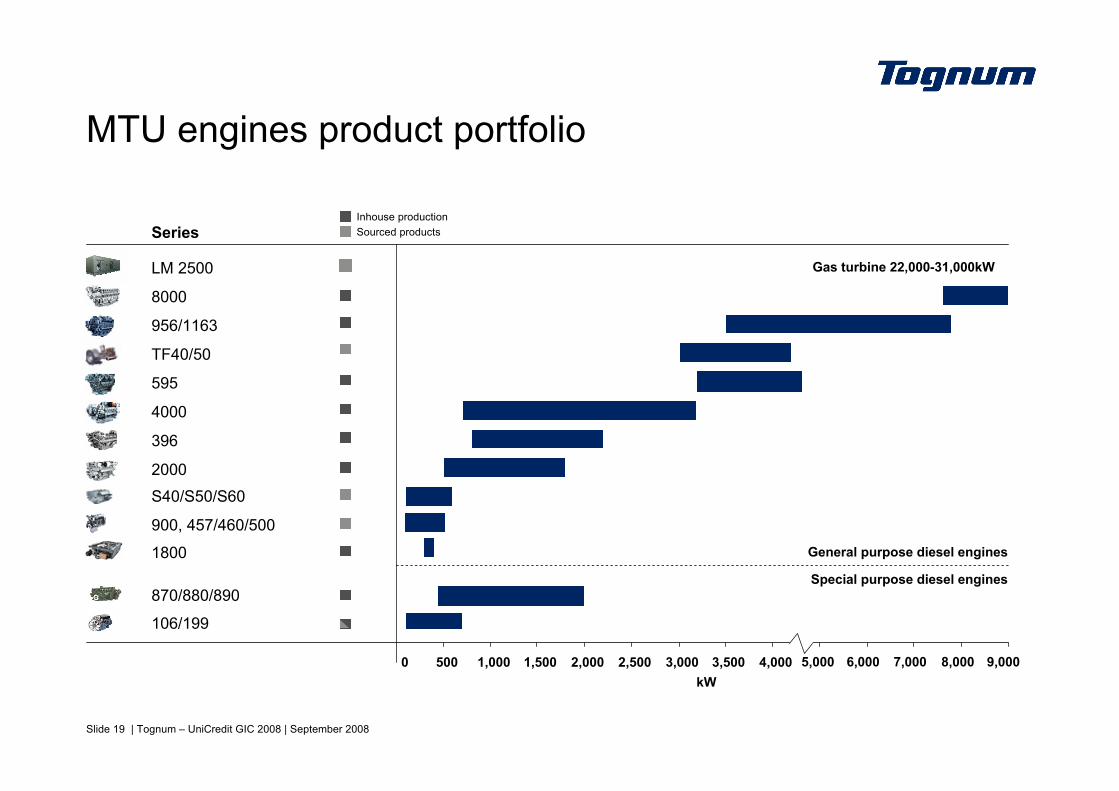
MTU engines product portfolio
870/880/890
900, 457/460/500
S40/S50/S60
2000
396
4000
595
TF40/50
956/1163
8000
LM 2500
1800
Inhouse production
General purpose diesel engines
Special purpose diesel engines
Gas turbine 22,000-31,000kW
5,000 6,000 7,000 8,000 9,0000 500 1,000 1,500 2,000 2,500 3,000 3,500 4,000kW
Series Sourced products
106/199

Slide 20 | Tognum – UniCredit GIC 2008 | September 2008
IN PROGRESS: Exhaust aftertreatment
Benefits– Fuel consumption– Cost– Maintenance– Size and weight
EXISTING: Combustion process
Fuel injection Turbo charging Electronics
Reducing LCC (life cycle cost)
+Build-up of R&D capacity and know-how + JV in exhaust after treatment (with CH-based Hug Engineering)
+
NO2O2NO
Exhaust before Treatment
N2 H2O
after Treatment
SCR-Kat
(NH2)2CO+ H2O
Add-onUrea
NO2O2NO
Exhaust before Treatment
N2 H2O
after Treatment
SCR-Kat
(NH2)2CO+ H2O
Add-onUrea
Meeting emission regulations by – Developing engine and exhaust aftertreatment as one system– System optimization
Key technologies in diesel enginesTognum with internally integrated approach

Slide 21 | Tognum – UniCredit GIC 2008 | September 2008
Benchmarking S4000 vs. competition– Analysis of fuel consumption in same truck model,
in same mine and at same power rating– Long-term fuel economy advantage of 2.5%– At $2.50 per gallon and 6,500 operating hours per
year, this represents annual savings to the customer of ~$23,000 per each haul truck powered by a MTU 16V4000 engines
70.0%
75.0%
80.0%
85.0%
90.0%
95.0%
100.0%
Goldmine -USA
High A ltitude(1) - Chile
High A ltitude(2) - Chile
High A ltitude(3) - Chile
Other
Higher operational availability of trucks High fuel savings for mining companies
Superior characteristics of MTU engines leadingto lower fuel consumption and less service time
Benchmarking S4000 vs. competition– Additional availability of mining fleets
Source: MTU FN, customer feedback
Competition
S4000 2700 HP
CompetitorS4000
Source: MTU FN, customer feedback
Slide 22 | Tognum – UniCredit GIC 2008 | September 2008
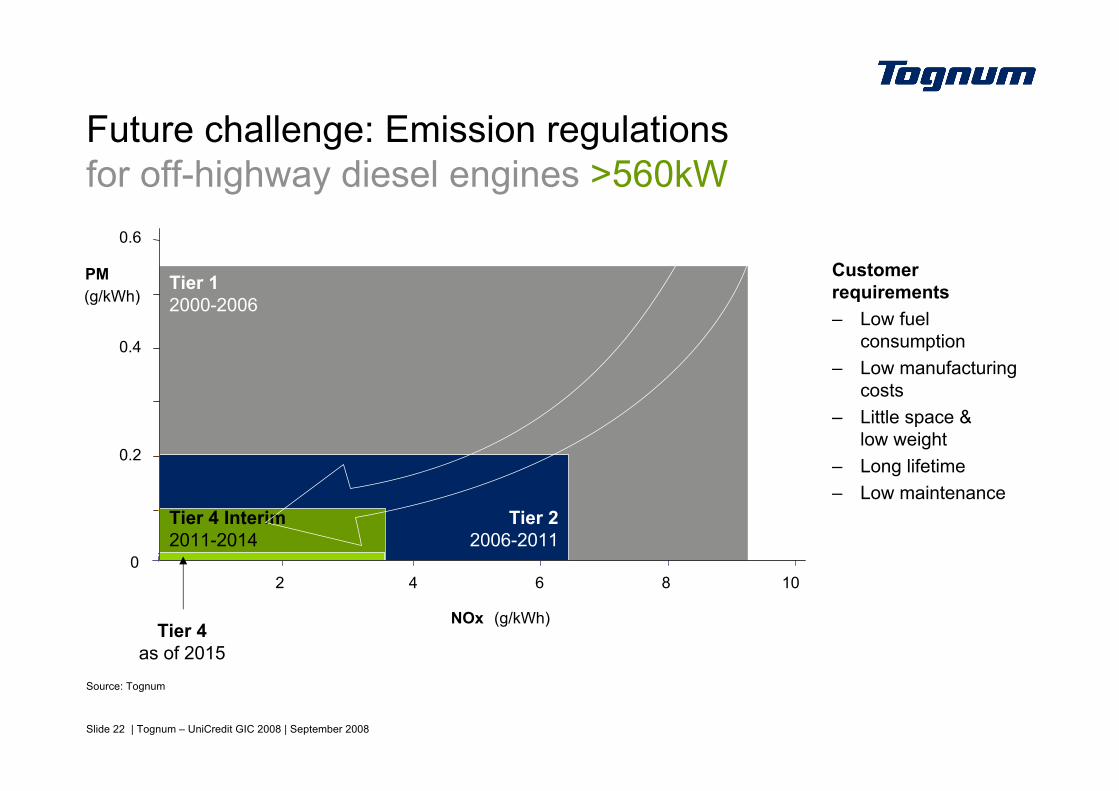
Customer requirements– Low fuel
consumption– Low manufacturing
costs– Little space &
low weight– Long lifetime– Low maintenance
Future challenge: Emission regulationsfor off-highway diesel engines >560kW
(g/kWh)
NOx
PM Tier 12000-2006
2 4 6 8
0.2
0.4
0.6
100
(g/kWh)Tier 4
as of 2015
Tier 4 Interim2011-2014
Tier 22006-2011
Source: Tognum
Slide 23 | Tognum – UniCredit GIC 2008 | September 2008
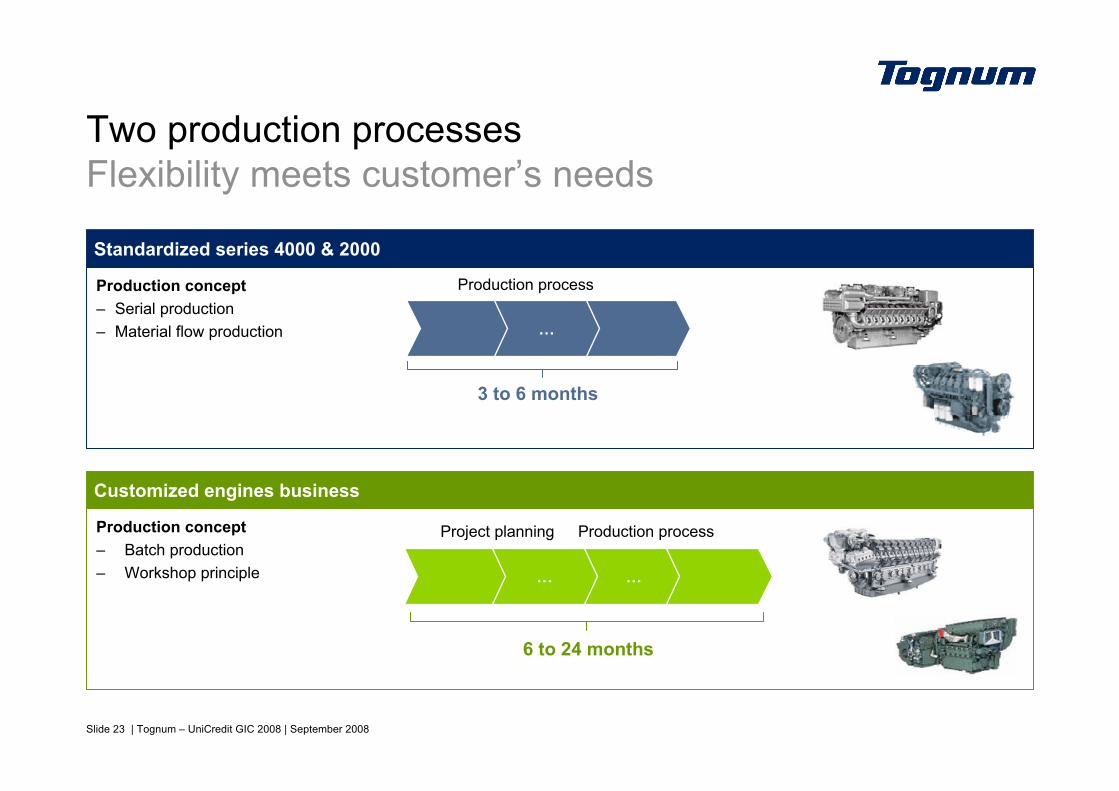
Production concept– Batch production– Workshop principle
Production concept– Serial production– Material flow production
Two production processesFlexibility meets customer’s needs
3 to 6 months
Project planning Production process
Standardized series 4000 & 2000
Customized engines business
……
Production process
…
6 to 24 months

Slide 24 | Tognum – UniCredit GIC 2008 | September 2008
Business Unit Engines
Slide 25 | Tognum – UniCredit GIC 2008 | September 2008
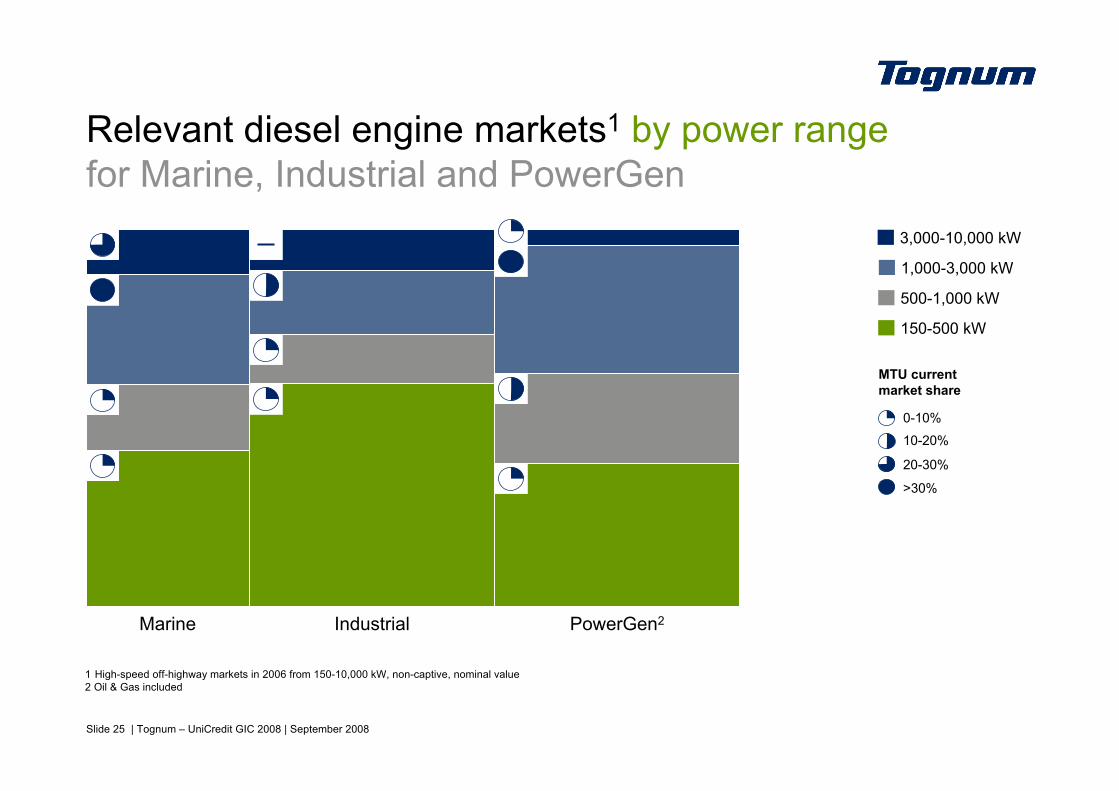
IndustrialMarine PowerGen2
500-1,000 kW
1,000-3,000 kW
3,000-10,000 kW
Relevant diesel engine markets1 by power rangefor Marine, Industrial and PowerGen
150-500 kW
20-30%
>30%
0-10%
10-20%
MTU current market share
1 High-speed off-highway markets in 2006 from 150-10,000 kW, non-captive, nominal value2 Oil & Gas included

Slide 26 | Tognum – UniCredit GIC 2008 | September 2008
Application Marine
1 Freight boats include a.o. freighter, tanker and container vessels; work boats include a.o. tug, fishery and fire-fighting
YachtMega Yachts, Customised and Serial Yachts, Race Boats, Sport Fishing Boats
CommercialFerries, Freight and Work Boats1, Tug and Crew Boats
NavalFrigates, Coast Guards, Submarines
Slide 27 | Tognum – UniCredit GIC 2008 | September 2008
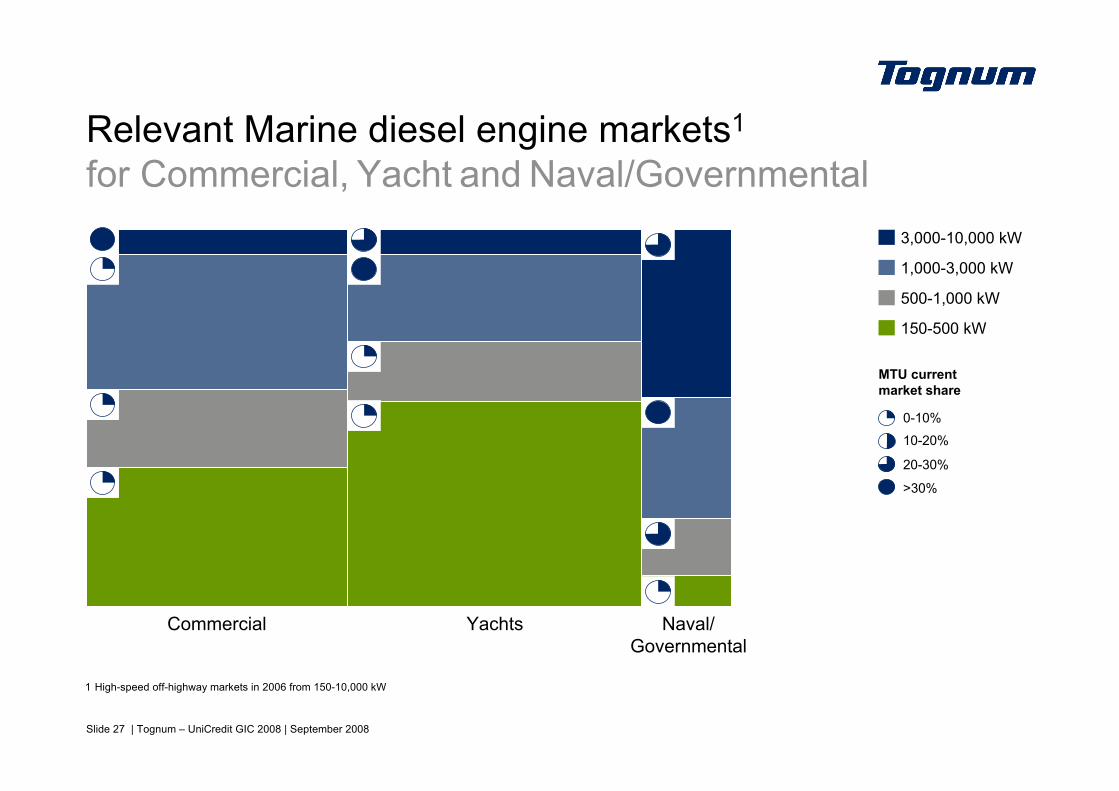
Relevant Marine diesel engine markets1
for Commercial, Yacht and Naval/Governmental
500-1,000 kW
1,000-3,000 kW
3,000-10,000 kW
150-500 kW
Commercial Yachts Naval/Governmental
1 High-speed off-highway markets in 2006 from 150-10,000 kW
20-30%
>30%
0-10%
10-20%
MTU current market share

Slide 28 | Tognum – UniCredit GIC 2008 | September 2008
Applications Industrial and Oil & Gas
Construction & Industry
Mining Rail Oil & GasExploration
Agriculture

Slide 29 | Tognum – UniCredit GIC 2008 | September 2008
500-1,000 kW
1,000-3,000 kW
3,000-10,000 kW
Relevant Industrial diesel engine markets1
for Agriculture, C&I, Mining, Rail, Oil & Gas
150-500 kW
Agriculture C&I Mining Rail
1 High-speed off-highway markets in 2006 from 150-10,000 kW
20-30%
>30%
0-10%
10-20%
MTU current market share
Oil & Gas
Slide 30 | Tognum – UniCredit GIC 2008 | September 2008
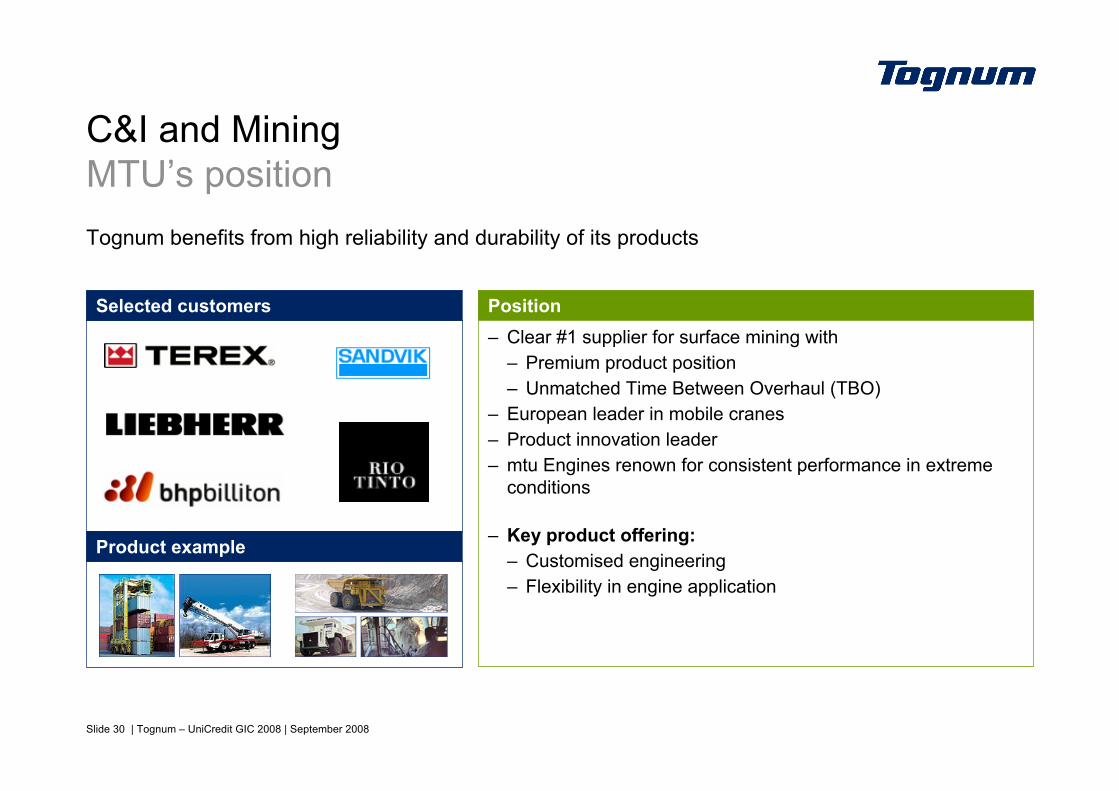
C&I and MiningMTU’s positionTognum benefits from high reliability and durability of its products
Position– Clear #1 supplier for surface mining with
– Premium product position– Unmatched Time Between Overhaul (TBO)
– European leader in mobile cranes– Product innovation leader– mtu Engines renown for consistent performance in extreme
conditions
– Key product offering: – Customised engineering– Flexibility in engine application
Selected customers
Product example
Slide 31 | Tognum – UniCredit GIC 2008 | September 2008
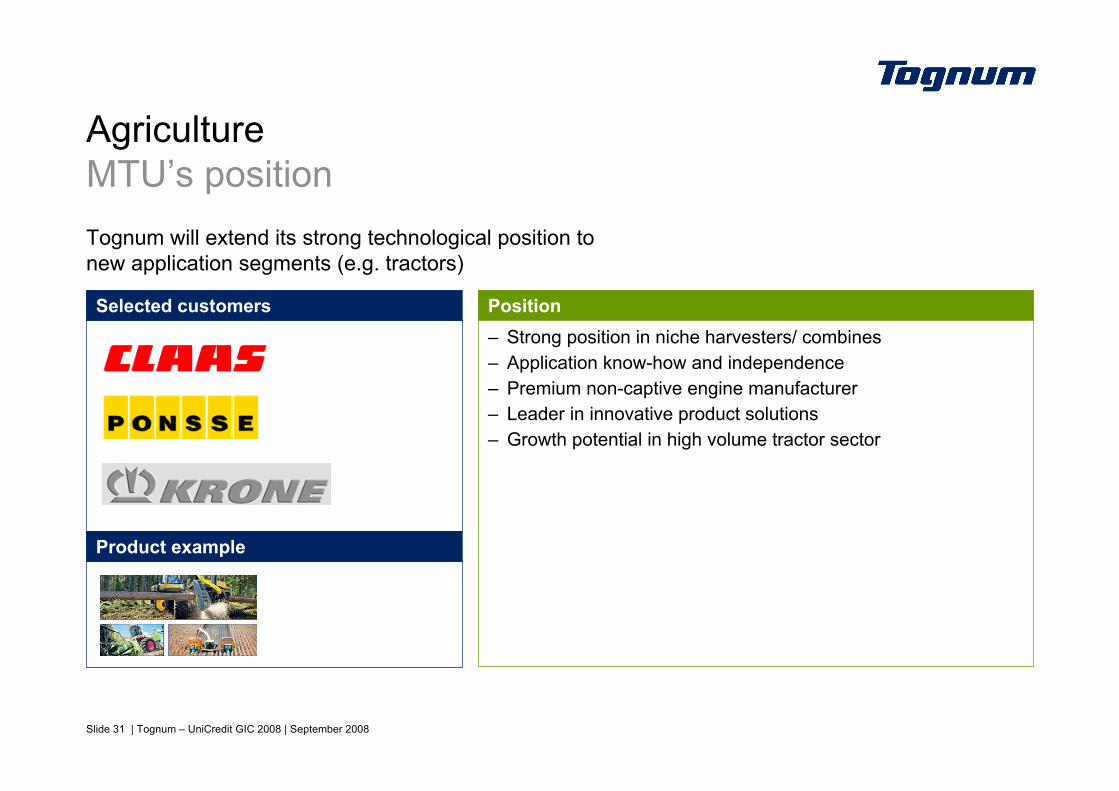
AgricultureMTU’s positionTognum will extend its strong technological position to new application segments (e.g. tractors)
Position– Strong position in niche harvesters/ combines– Application know-how and independence– Premium non-captive engine manufacturer– Leader in innovative product solutions– Growth potential in high volume tractor sector
Selected customers
Product example

Slide 32 | Tognum – UniCredit GIC 2008 | September 2008
RailMTU’s positionTognum will leverage its strong European position and advanced system offerings competence into North American and Emerging Markets
Position– Strong position in European rail market
(esp. rail cars and shunting locomotives)– Market leader for rail powerpacks– Benchmarks for fuel consumption by fulfilling
NOx and particulate emissions standards– In 2007, U.S. locomotive market was entered successfully with
first independently certified EPA Tier 2 (green) engine– Key product offering:
– PowerPack 1800– Series 4000 (e.g. 12V, 2.250 HP/1.680 kW)– Rail automation
Selected customers
Product example
Pacific Harbour Lines (California)

Slide 33 | Tognum – UniCredit GIC 2008 | September 2008
Application Defense
Heavy Medium Light Heavy Truck
Slide 34 | Tognum – UniCredit GIC 2008 | September 2008
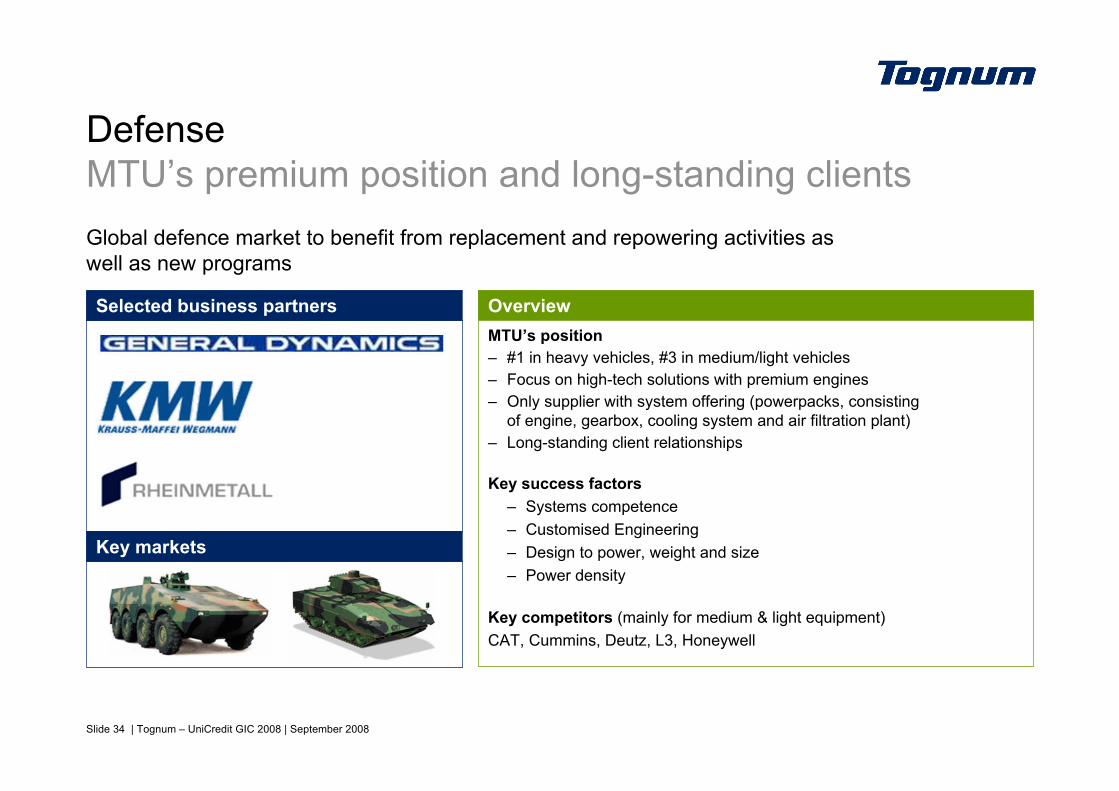
DefenseMTU’s premium position and long-standing clientsGlobal defence market to benefit from replacement and repowering activities aswell as new programs
OverviewMTU’s position– #1 in heavy vehicles, #3 in medium/light vehicles– Focus on high-tech solutions with premium engines– Only supplier with system offering (powerpacks, consisting
of engine, gearbox, cooling system and air filtration plant)– Long-standing client relationships
Key success factors– Systems competence– Customised Engineering– Design to power, weight and size– Power density
Key competitors (mainly for medium & light equipment)CAT, Cummins, Deutz, L3, Honeywell
Selected business partners
Key markets

Slide 35 | Tognum – UniCredit GIC 2008 | September 2008
Further growth potential in services & remanSpare parts w/ high market share– Competition generally limited– No access to Daimler engines– Grey market <5%
– Attractive monopoly business model– Potential to further reduce cost
– Proactive business model towards self-servicing end-customers, OEMs and 3rd parties
– Now fully exploiting business potential– Installed MTU engine base ~40,000 engines
After SalesNew growth strategy with focused services
New Services– Service contracts– Remanufacturing– …
Enhancement of organisationand processes– After Sales sales force– Logistics– Network (density, quality)
+ +

Slide 36 | Tognum – UniCredit GIC 2008 | September 2008
Business Unit Onsite Energy & Components

Slide 37 | Tognum – UniCredit GIC 2008 | September 2008
Onsite EnergyA main growth initiative for Tognum Group

Slide 38 | Tognum – UniCredit GIC 2008 | September 2008
Drivers
– Globally increasing energy demand– Resources (oil, gas, renewables) are less readily available– Climate discussion will be impacting markets
Diesel Gas Fuel Cell
Emergency powerPeak power
Continuous power
Decentralised energy systemsDrivers for profitable growth
Tognum focus– Efficient technologies– Growing demand for decentralized energy
Strong upside potential for Tognum as focused and growing technology player
Consequence: energy price for consumers will rise further

Slide 39 | Tognum – UniCredit GIC 2008 | September 2008
– Reliability, availability,maintainability
– Cost of ownership
– Rental and construction companies< 3,000 kW< 3,000 hrs of operation p.a.
Diesel Prime PowerDiesel
– Price-performance ratio– Availability, reliability– Service network
– Hotels, casinos, government, retailstores, data centres, hospitals
– Agricultural (lifestock)
< 3,000 kW< 500 hrs of operation p.a.
Diesel Stand-By Power
– Exceptional availability– Certification, reference
requirements– Application engineering
– NPPs/Nuclear Power Plants< 500 hrs of operation p.a.Diesel Stand-By Power for NPPs
– Reliability, availability, maintainability
– Life Cycle Cost (TBO/time between overhaul,specific fuel consumption)
– Service network
– Decentralised power supply companies
> 3,000 hrs of operation p.a.as combined heat and power(CHP)
Continuous base load power station
Diesel/ Gas
– Cost of ownership– Reliability, availability– Efficiency
– Municipalities– District heating, swimming pools,
sports facilities, facility supply
< 3,000 kWNatural GasGas
– Efficiency– Sustainability– Image: environmental aspects
– Cost of ownership– Reliability, availability; efficiency
Key buying criteria
Fuel Cell(Gas)
– Agriculture– Municipalities
< 3,000 kWBiogas
– Cogen/Trigen applications with biogas, natural gas (and other fuels)
– Hospitals, hotels, industry, data centres, airports
250–2000 kWHot Module
Typical applicationCharacteristics
Onsite Energy Systems Differentiation of market segments

Slide 40 | Tognum – UniCredit GIC 2008 | September 2008
Relevant PowerGen and Onsite Energy markets1
for diesel engines, diesel and gas power, fuel cells
500-1,000 kW
150-500 kW
1,000-3,000 kW
3,000-10,000 kW
20-30%
>30%
0-10%
10-20%
Tognum currentmarket share
Diesel PowerSystems
Gas PowerSystems
FuelCells
1 High-speed off-highway market in 2006/2007 from 150-10,000 kW, nominal value
Diesel PowerGenEngines
Slide 41 | Tognum – UniCredit GIC 2008 | September 2008
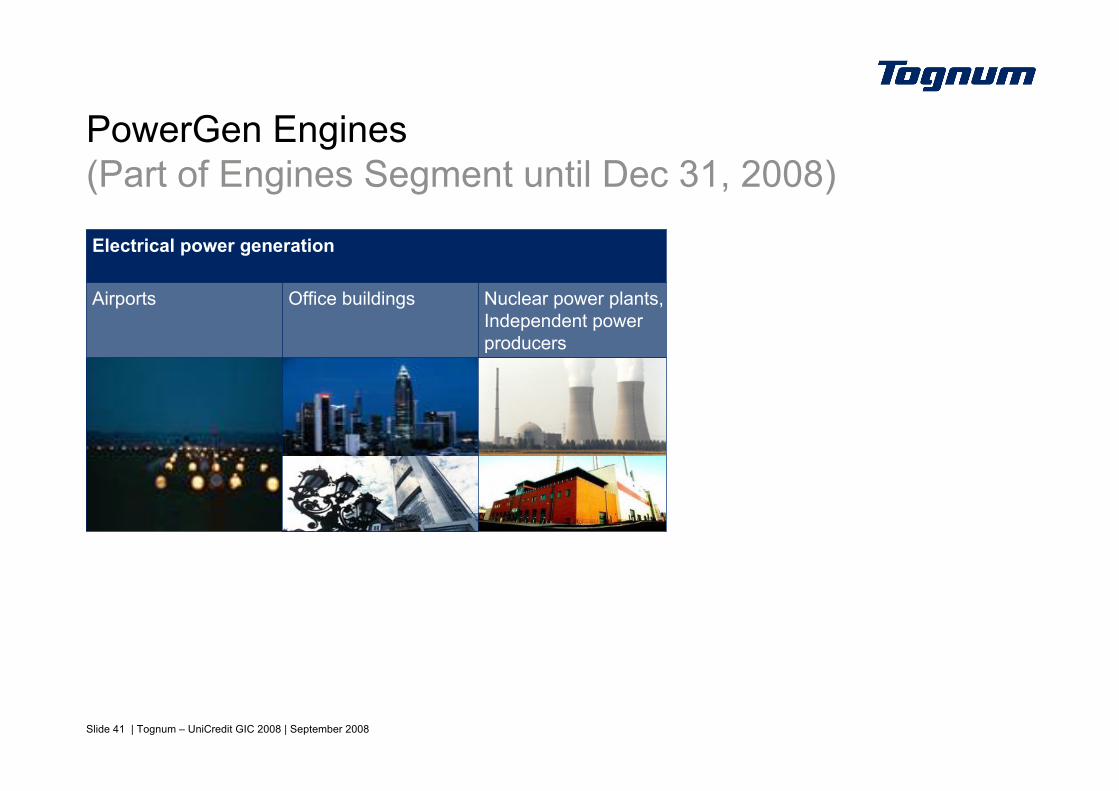
PowerGen Engines(Part of Engines Segment until Dec 31, 2008)
Electrical power generation
Airports Office buildings Nuclear power plants,Independent power producers

Slide 42 | Tognum – UniCredit GIC 2008 | September 2008
Cogeneration based on decentralised systemsoffers highest energy efficiency solutions
Losses from transmission and conversion100% Prime energy Usable energy
+
+
NuclearPower Plant
DistrictCogeneration
Plant
LocalCogeneration
Plant
-68%
-25%
-4%

Slide 43 | Tognum – UniCredit GIC 2008 | September 2008
Tognum’s HotModule fuel cell systemis ready to enter the commercial level– Accumulated operating experience
of ~41 years
– > 20 installations in Europe
– Demonstrated co-generation, tri-generation,DC applications and multi fuel capabilities

Slide 44 | Tognum – UniCredit GIC 2008 | September 2008
Injection SystemsL‘Orange (Components)

Slide 45 | Tognum – UniCredit GIC 2008 | September 2008
L‘Orange market positioningoffers further growth opportunities
Engine speed (rpm)
20 – 150
Low-speed< 300
150 – 500 500 – 1,000 1,000 – 3,0003,000 – 5,0005,000 – 7,5007,500 – 10,00010,000 – 15,00015,000 – 30,000> 30,000
Medium-speed 300 – 1,000
High-speed > 1,000Power range (kW)
Tognum’sengine market
Engine market
~ 1,000 ~ 10,000 ~ 30,000*~ number of rel. engines per year * Off-highway > 800kW
Main growth options:
- Medium-speed areas
- MTU’s expansion in high-speed area
- Spare part business

Slide 46 | Tognum – UniCredit GIC 2008 | September 2008
34%
20%14%
6%
14%
6%6%
L’Orange is the leading supplier in its core marketsMarket participants in focused diesel engine areas*
Estimated market volume for fuel injection equipment- Total: < € 600m- Non-captive: > € 400m
Bosch 20%
Woodward 14%
Duap 6%
L‘Orange 34%
OMT 6%
Others 14%
Nico 6%
* Source: Tognum market intelligence, best estimates
On-high-way
Automotive
Off-high-way
Trucks
Truck derivatives(industrial applicat.)
High-speed
Medium-speed
Low-speed

Slide 47 | Tognum – UniCredit GIC 2008 | September 2008
Propeller ShaftsRotorion (Components)

Slide 48 | Tognum – UniCredit GIC 2008 | September 2008
PCs~75%
LCVs~25%
Propeller shaft customer portfolio
Revenues 2007 of > € 200mn
MercedesC-Class
Volvo V70
Mercedes E-Class
Alfa Spider
Mercedes S-Class
Maybach
Mercedes Viano
Mercedes Sprinter
VW Crafter
Mercedes VITO
Luxury Class
High Luxury Class
Medium LCV
Heavy LCV
Upper Medium Near Luxury Class
Vehicle examplesPassenger Cars (PCs) incl. SUVs
Light Commercial Vehicles (LCVs)

Slide 49 | Tognum – UniCredit GIC 2008 | September 2008
FinancialsTognum Group

Slide 50 | Tognum – UniCredit GIC 2008 | September 2008
Business model allows for high visibilitydriven by frame agreements and projectsHigh visibility of sales expectation not fully captured in order backlog
= Business set-up allows for high visibility of salesBacklog not representative because not all elements of sales visibility included !
– Marine– High-power range engines
+ Long delivery periods
– Industrial– Propeller Shafts
+ Close connection and interdependence with OEMs
Level of visibilityMost applicable for application
DriversOrder sizeDelivery pointDuration
– C&I– PowerGen
Order backlog
– Yacht+ Long-term Memorandum of Understanding
– Defense– Navy
+ Long-term contracts
( )( )( )– All applications+ System businessStrongly dependent on specific client

Slide 51 | Tognum – UniCredit GIC 2008 | September 2008
667 727
669790
709
790
815 875
785 773
828
679
2007 2008
Revenues (in €m)
Strong topline growth in H1/08
Order intake (in €m)
+3%
790
709
22%
27%
25%
26%
2,8353,107
28%
25%
24%
23%
1,648 1,517
+14%
Q4
Q3
Q2
Q1
2007 2008
Q4
Q3
Q2
Q1

Slide 52 | Tognum – UniCredit GIC 2008 | September 2008
Outlook development: Revenue guidanceH1/08 growth rate ex-USD headwinds at +18%
2007Actual
Aug ’08Outlook
FX Adj.Outlook
2008Outlook
FX Impact(€7m/$ct)
Add. Volume
€ 2,835 m
1.37
Lower range of 11–13% corridor
FX $/€ 1.38 1.45 1.55
+12%(+/-1pp)
Additional volume compensates partly for fx-related impact
Y-y growth ratesabove > / below < group average
> Marine> PowerGen> OES
< Industrial< Defense< After Sales< Components

Slide 53 | Tognum – UniCredit GIC 2008 | September 2008
48 58
5775
51
44
100 100
107 100
96
88
EBIT adj.1 (in €m) Net profit adj.1 (in €m)
Continued earnings momentum in H1/08Despite USD/EUR fx rate at 1.53 vs. 1.33 in H1/07
1 Excludes any effects from purchase price allocation and one-off items 1 Excludes any effects from purchase price allocation and one-off items
+28%
4451
88
96
RoSH1 15.5% 13.2% EPS
adjH1
€0.87 €1.01
390199
23%
25%
27%
26%
22%
26%
29%
24%
- 3%
200133
2007 2008 2007 2008
Q4
Q3
Q2
Q1
Q4
Q3
Q2
Q1

Slide 54 | Tognum – UniCredit GIC 2008 | September 2008
Outlook development: Adj. EBIT guidanceAdj. EPS guidance stable at >€ 2.00
2007Actual
Aug ’08Outlook
FX Adj.Outlook
2008Outlook
Add. volume
7x77x10
13.8% 14%(+/-1 pp)
Bottom of 13-15%
corridor
€ 390 m
RoS (in %) Additional volume compensates partly for fx-related impact
Deterioratingfactors
– Cost drivers- Commodities- Labour cost
– Expenses for US sourcing & cap. expansion
– BUs realignment– Rotorion
- Spin-off- Warranty
1.37 1.38FX $/€
FX Impact(€2m/$ct)
1.45 1.55
Det.Factors
Slide 55 | Tognum – UniCredit GIC 2008 | September 2008
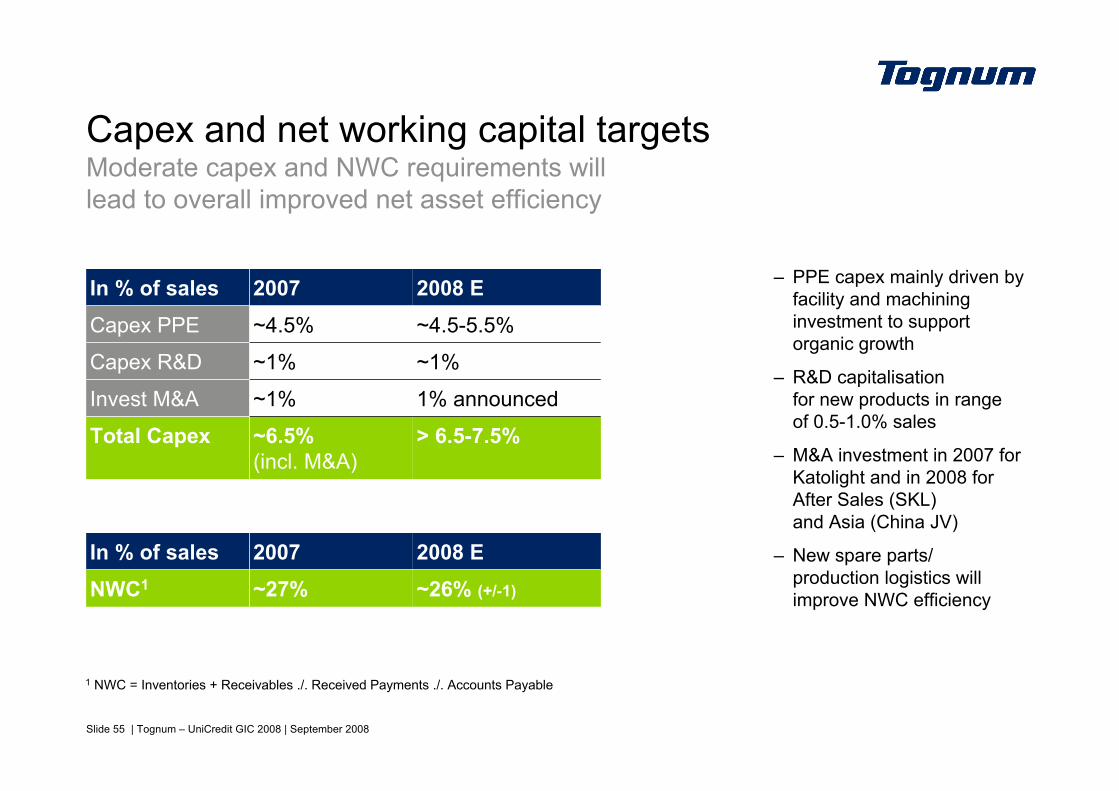
Capex and net working capital targetsModerate capex and NWC requirements will lead to overall improved net asset efficiency
> 6.5-7.5%~6.5%(incl. M&A)
Total Capex1% announced~1%Invest M&A
~1%~1%Capex R&D
~4.5-5.5%~4.5%Capex PPE
2008 E2007In % of sales
~26% (+/-1)~27%NWC1
2008 E2007In % of sales
– PPE capex mainly driven by facility and machining investment to support organic growth
– R&D capitalisationfor new products in rangeof 0.5-1.0% sales
– M&A investment in 2007 for Katolight and in 2008 for After Sales (SKL) and Asia (China JV)
– New spare parts/ production logistics will improve NWC efficiency
1 NWC = Inventories + Receivables ./. Received Payments ./. Accounts Payable

Slide 56 | Tognum – UniCredit GIC 2008 | September 2008
Q2 segmental performance Engines
+19%653549External revenues
15.4%
25%
10%
18%
21%
26%
% of revenue
17.0%
29%
9%
18%
21%
22%
% of revenue
+8%10395Adj. EBIT
+2%
+32%
+17%
+18%
+43%
+20%
-2%
Change
669558Segment revenues
174122Marine
141120PowerGeneration
119102Industrial
7053Defense
165162After Sales/Other
650664Order intake
Q2/2008Q2/2007in €m

Slide 57 | Tognum – UniCredit GIC 2008 | September 2008
Q2 segmental performance Onsite Energy Systems & Components
+14%137120External revenues
3.8%
42%
25%
33%
% of revenue
7.3%
41%
26%
33%
% of revenue
-40%610Adj. EBIT
+20%
+11%
+18%
+16%
+13%
Change
157135Segment revenues
5244Onsite Energy
3935Injection Systems
6655Propeller Shafts
161143Order intake
Q2/2008Q2/2007in €m

Slide 58 | Tognum – UniCredit GIC 2008 | September 2008
Q2 consolidated group performance
100-96103EBIT adj.
790
773
107
669
785
Tognum Group
157
161
10
135
143
OES&C
-38650Order intake
-22664Order intake
-23558Revenue
295EBIT adj.
Q2/2008
-36669Revenue
Q2/2007
Holding/ Consolidation
Enginesin €m

Slide 59 | Tognum – UniCredit GIC 2008 | September 2008
Q2 2008 adjustment bridge
(1) PPA depreciation & amortisation(€ 11.1m)
Adjusted forhedges for FX cashflows (€ 5.7m)
(2) Valuation of FX loans (-€ 0.3m)
(3) Higher incometaxes resulting fromlower EBIT at 25% tax rate (€ -4.6m)
(4) PPA depreciation & amortisation(€ 11.1m)
in €mReported
Q2/2008 AdjustmentsAdjusted Q2/2008
Revenues 790.2 790.2Cost of sales (617.1) 16.8 (1) (600.3)Gross profit 173.1 16.8 189.9SG&A (68.5) (68.5)
(21.4) (21.4)Other operating expenses 0.5 0.5
83.7 16.8 100.5(1.2) (1.2)
Other financial income 3.6 (0.3) (2) 3.3Other financial expenses (2.4) (2.4)
83.7 16.5 100.2Interest income 0.8 0.8Interest expenses (1.3) (1.3)Earnings before taxes 83.2 16.5 99.7Income taxes (20.3) (4.6) (3) (24.9)Net profit / loss 62.9 11.9 74.8
Depreciation and Amortization (28.5) 11.1 (4) (17.4)EBITDA 112.2 5.4 117.6
Research and development costs
Results from operating activitiesShare of profit from investments (equity method)
Earnings before interest and taxes

Slide 60 | Tognum – UniCredit GIC 2008 | September 2008
Tognum Group balance sheet 31.12.2007 vs. 30.06.2008
30.06.200831.12.2007€m
827743Inventories
462465Accounts receivables
5661Cash & cash equivalents
1,4861,385Total short-term assets2,4872,361Total assets
430407PP&E
9591Other long-term assets
Assets
1,001976Total long-term assets141116Other short-term assets
475478Intangible assets
30.06.200831.12.2007€m563535Shareholders' equity394389Pension provisions
268241Accounts payables
445449Short-term provisions and received payments
1612Other short-term liabilities
899782Total short-term liabilities2,4872,361Total liabilities
297345Long-term financial liabilities
135125Other long-term liabilities
Liabilities
1,0251,044Total long-term liabilities17081Short-term financial and
other liabilities
199185Other provisions

Slide 61 | Tognum – UniCredit GIC 2008 | September 2008
294326
389394
31.12.2007 30.06.2008
(245)
(326)
(38)
(79)
36
Net debt/adj. LTM EBITDA
H1 (Q2) 2008 net (financial) debt development€ 79m dividend payment Q2 2008 for FY 2007
Net debt31.03.08
CF fromoperatingactivities
Dividendpayment
Net debt30.06.08
CF frominvestingactivities
Net financial debt (in €m) and leverage
1.6x1.5x
Pensions
Net financialdebt
0.6x 0.7x

Investor contact
Achim SchneiderHead of Investor Relations (CIR)
Phone: +49 (0)7541 90-3318Fax: +49 (0)7541 9090-3318mailto:[email protected]://www.tognum.com
Tognum AG88040 Friedrichshafen/Germany
Financial calendar *Nov 11, 2008 Q3/08 final report & conf. call
Mar 26, 2009 Release of Annual Report 2008
May 13, 2009 Q1/09 final report & conf. call
Jun 09, 2009 Annual General Meeting 2009
* All dates are preliminary and subject to change
Thank you very much!