todd wagner joe doyle (mit) steve ewer (u wisconsin) is physician organization related to efficiency...
TRANSCRIPT
Todd Wagner
Joe Doyle (MIT)
Steve Ewer (U Wisconsin)
Is Physician Organization Related to Efficiency and
Patient Outcomes?
June 2011
Thanks to Andrew Siroka for research assistance.

Premise The key to improving the effectiveness of healthcare
lies with clinicians.
Although they often lack information and resources to provide optimal care,1 and often face perverse incentives to overtreat, they are responsible for the production and distribution of care.2
Major gains in effectiveness requires understanding and changing clinicians’ behavior.
1. Committee on Quality Health Care in America IoM. Crossing the quality chasm: a new health system for the 21st century. Washington, DC: National Academics Press; 2001.
2. Fuchs VR. Who shall live? Health, economics, and social choice. New York,: Basic Books; 1974.

Clinician Behavior A large literature has focused on using incentives to
change clinician behavior.1
Less work has focused on culture.
Culture matters because it shapes clinicians’ judgment, communication, and teamwork.
1. Rosenthal MB, Dudley RA. Pay-for-performance: will the latest payment trend improve care? JAMA. Feb 21 2007;297(7):740-744.

Contribution of this Study We follow a natural experiment in which patients are
randomly assigned to one of two residency teams in the same VA hospital
We explore differences in practice patterns and patient outcomes.
Doyle JJ, Jr., Ewer SM, Wagner TH. Returns to physician human capital: Evidence from patients randomized to physician teams. J Health Econ. Aug 24 2010;29(6):866–882.

Outline
Background Description of the natural experiment Methods Results Discussion

Background People in the US receive substantially different
amounts and types of medical care depending on where they live
– Wennberg, J. and A. Gittelsohn (1973)
This work launched new fields of research including health disparities and quality of care

Causes of Small Area Variation Observed
– Patient outcomes
– Facility resources
– Patient characteristics Partially observed or unobserved
– Physician characteristics
– Organization of clinical teams
– Patient preferences
– Patient risk
– Patient’s selection of provider
Physician Training A considerable share of variation in practice patterns
and patient outcomes can be attributed to physician practice styles
Practice styles are influenced by training and organization
If we can understand the role of training and organization, we can improve system performance and patient health

Natural Experiment
A large, urban VA hospital is affiliated with two residency programs and patients are assigned to a residency team based on the last digit of their SSN (odd or even)
Random assignment only happens at the main hospital– not at substations
Random assignment happens for most specialties, but not all (e.g., neurology)

Residency Program
Anecdotally: program A and B do not get along
Rounds are conducted at different times so there is minimal overlap
Different attending physicians
Ancillary staff (e.g., nurses) are the same

Methods
Linked real SSN to all discharges at VAMC
Random assignment: – Odd ending SSN = program A– Even ending SSN = program B
At this time, we don’t have information about residents

Data
Utilization data from Patient Treatment Files (1993-2009)
Cost data from HERC Average Cost Data and Decision Support System (1998-1999)
Mortality data from VA Vital Status File

Outcomes
Length of stay (logged)
Cost (logged 2006$): total and DSS subtotals
28 day and 1 year hospital readmission
30 day and 1 year mortality
Timing of procedures

Subsamples
Chronic heart failure (CHF) Acute myocardial infarction Chronic obstructive pulmonary disease (COPD) Gastro-intestinal bleed (Volpp, 2007)
Stroke patients Patients at substations
No randomization;Robustness check

Control Variables Age Gender Race (white, nonwhite) Marital status (married, divorced, other) Disease severity (Deyo-modified Charlson Index) Time, day, month, and year of admission Zip code characteristics (education, age, race,
density)

Analytical Questions
Was randomization applied consistently?
Do outcomes differ by residency programs? And if so, why?
Is the quality of care different?

Analytical Models
Continuous and count data– Semi-log models
– General linear models (log link and gamma distributions)
Logistic models for dichotomous outcomes
Model choice has no effect on results

Random Assignment: DemographicsProgram A Program B(Odd SSN) (Even SSN) p-value
age 63.0 62.8 0.35 18-34 0.019 0.022 0.15 35-44 0.074 0.075 0.80 45-54 0.186 0.186 0.94 55-64 0.229 0.229 0.92 65-69 0.134 0.131 0.50 70-74 0.149 0.146 0.57 75-84 0.179 0.184 0.39 84+ 0.030 0.027 0.24
male 0.976 0.978 0.19white 0.466 0.472 0.42married 0.443 0.446 0.65divorced 0.271 0.269 0.80Observations (discharges) 35932 36434

Random Assignment: Admission info
Assigned to Higher- Assigned to Lower-Ranking Program Ranking Program
(Odd SSN) (Even SSN) p-valueComorbidities Charlson index = 0 0.294 0.290 0.52
Charlson index = 1 0.274 0.278 0.37Charlson index = 2 0.433 0.432 0.91
Admission Time Midnight-6am 0.096 0.098 0.566am-12 noon 0.237 0.233 0.2912 noon-6pm 0.420 0.425 0.286pm - Midnight 0.247 0.245 0.59
Day of the week weekend 0.163 0.162 0.72Observations (discharges) 35932 36434

Random Assignment: Zip Code InfoAssigned to Higher- Assigned to Lower-
Ranking Program Ranking Program(Odd SSN) (Even SSN) p-value
ZIP Code median HH Income 33714 33945 0.24 Characteristics fraction HS dropout 0.249 0.247 0.18
fraction HS only 0.317 0.318 0.34fraction Some College 0.271 0.272 0.024*fraction white 0.628 0.633 0.48fraction black 0.331 0.327 0.52fraction aged 19-34 0.214 0.213 0.21fraction aged 35-64 0.368 0.369 0.38fraction aged 65+ 0.141 0.141 0.22population per 1000 sq meters 1.102 1.072 0.09Observations (discharges) 35932 36434

Summary of Randomization
Patients treated by the two residency programs are not statistically different.
“Successful” randomization

Results: Length of Stay
Dependent Variable:(1) (2) (3)
Assigned to 0.108 0.114 0.113Lower Ranking Program [0.0086]** [0.0075]** [0.0072]**
Diagnosis Fixed Effects No Yes YesFull Controls No No Yes
Observations 72366Mean of Dep Var 1.4309
log(length of stay)
Models estimated using OLS. Robust standard errors in brackets, clustered by patient. Full controls include variables listed in Table 1, as well as month, year, and day-of-the-week indicators. * significant at 5%; ** significant at 1%
Program B
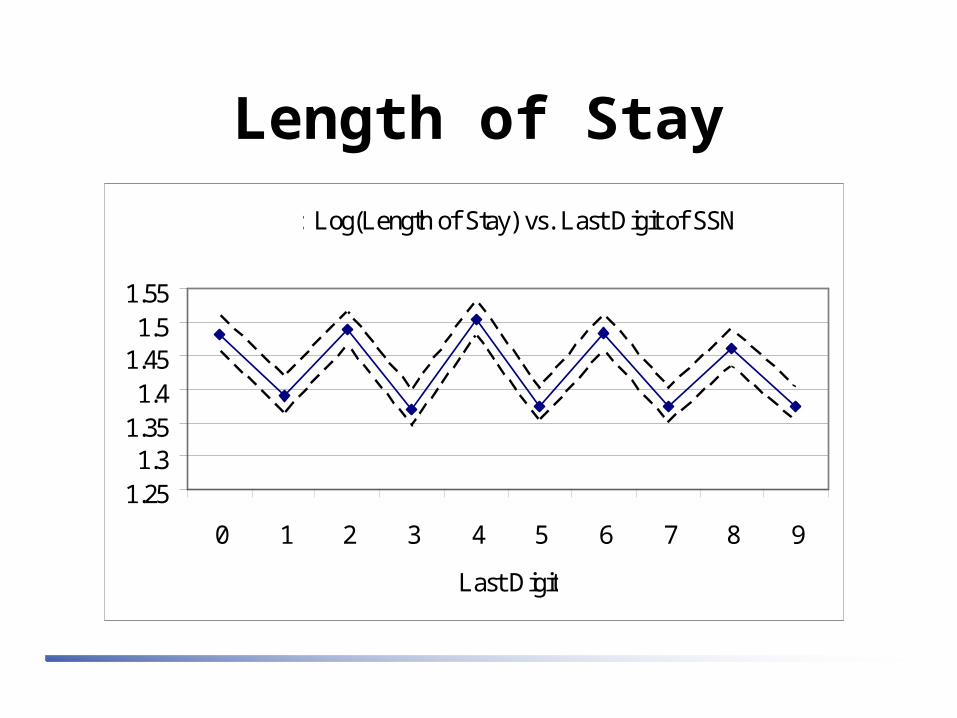
Length of Stay
Figure 1: Log(Length of Stay) vs. Last Digit of SSN
1.251.3
1.351.4
1.451.5
1.55
0 1 2 3 4 5 6 7 8 9
Last Digit

Effect over Time
Not significant; every other year is significant
Not part of JHEpaper

Results: CostDependent Variable:
(4) (5) (6)Assigned to 0.113 0.123 0.125Lower Ranking Program [0.0136]** [0.0116]** [0.0114]**
Diagnosis Fixed Effects No Yes YesFull Controls No No Yes
Observations 34098Mean of Dep Var 8.6297
log(accounting cost)
Models estimated using OLS. Robust standard errors in brackets, clustered by patient. Full controls include variables listed in Table 1, as well as month, year, and day-of-the-week indicators. * significant at 5%; ** significant at 1%
Program B

Costs
Figure 2: Log(Accounting Cost) vs. Last Digit of SSN
8.3
8.4
8.5
8.6
8.7
8.8
1 2 3 4 5 6 7 8 9 10
Last Digit
Figure 3: Log(Est. Expenditure) vs. Last Digit of SSN
8.4
8.5
8.6
8.7
8.8
8.9
1 2 3 4 5 6 7 8 9 10
Last Digit
DSS HERC

Cost Subtotals
Models estimated using OLS. Robust standard errors in brackets, clustered by patient. Full controls include variables listed in Table 1, as well as month, year, and day-of-the-week indicators. * significant at 5%; ** significant at 1%
DSS Cost subtotal
Assigned to
Program B ObservationsMean of Dep
VarNursing 292 [88.2776]** 34098 4145Surgery -123 [30.5502]** 34098 1354Radiology 40 [12.1013]** 34098 483Lab 53 [8.8733]** 34098 415Pharmacy 112 [48.6039]* 34098 982All Other 253 [46.0791]** 34098 2431

Readmission
Dependent Variable:(1) (2) (3) (4) (5) (6)
Assigned to -0.002 -0.002 -0.002 0.006 0.006 0.006Lower Ranking Program [0.0032] [0.0031] [0.0030] [0.0058] [0.0053] [0.0051]
Diagnosis Fixed Effects No Yes Yes No Yes YesFull Controls No No Yes No No Yes
Observations 71954 66938Mean of Dep Var 0.1315 0.4287
30-day Readmission 1-year Readmission
Models estimated using OLS. Robust standard errors in brackets, clustered by patient. Full controls include variables listed in Table 1, as well as month, year, and day-of-the-week indicators. * significant at 5%; ** significant at 1%
Program B

Readmission
Figure 4: 30-Day Readmission vs. Last Digit of SSN
0
0.05
0.1
0.15
0.2
1 2 3 4 5 6 7 8 9 10
Last Digit

MortalityDependent Variable:
(1) (2) (3) (4) (5) (6)Assigned to -0.001 -0.001 -0.001 -0.007 -0.006 -0.007Lower Ranking Program [0.0020] [0.0019] [0.0019] [0.0051] [0.0045] [0.0044]
Diagnosis Fixed Effects No Yes Yes No Yes YesFull Controls No No Yes No No Yes
Observations 71954 66938Mean of Dep Var 0.0642 0.2418
30-day Mortality 1-year Mortality
Models estimated using OLS. Robust standard errors in brackets, clustered by patient. Full controls include variables listed in Table 1, as well as month, year, and day-of-the-week indicators.* significant at 5%; ** significant at 1%
Program B
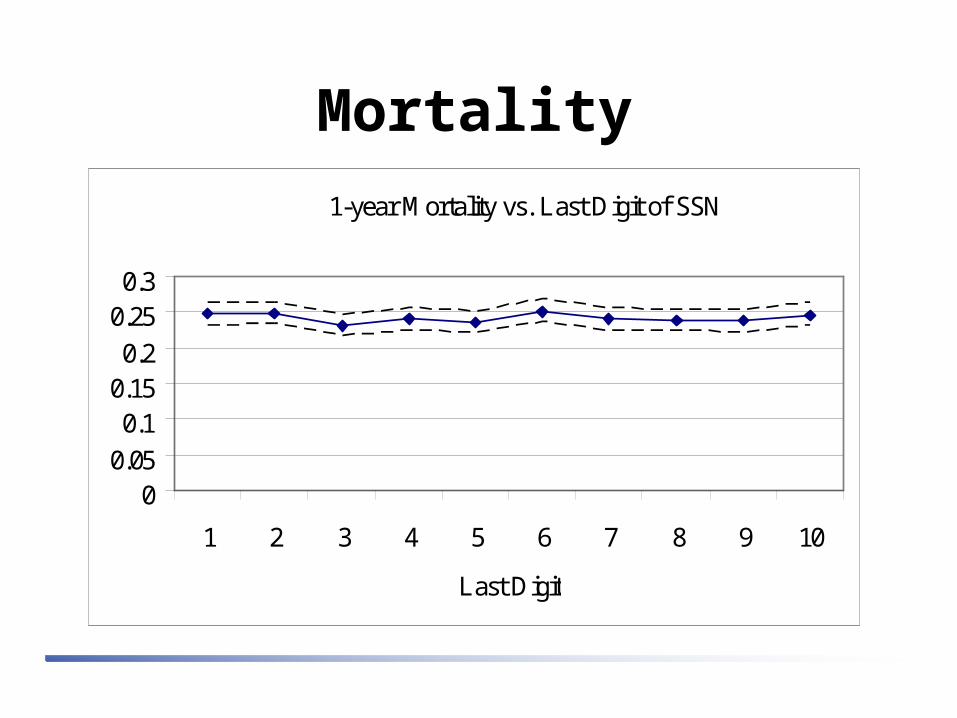
MortalityFigure 5: 1-year Mortality vs. Last Digit of SSN
00.05
0.10.150.2
0.250.3
1 2 3 4 5 6 7 8 9 10
Last Digit
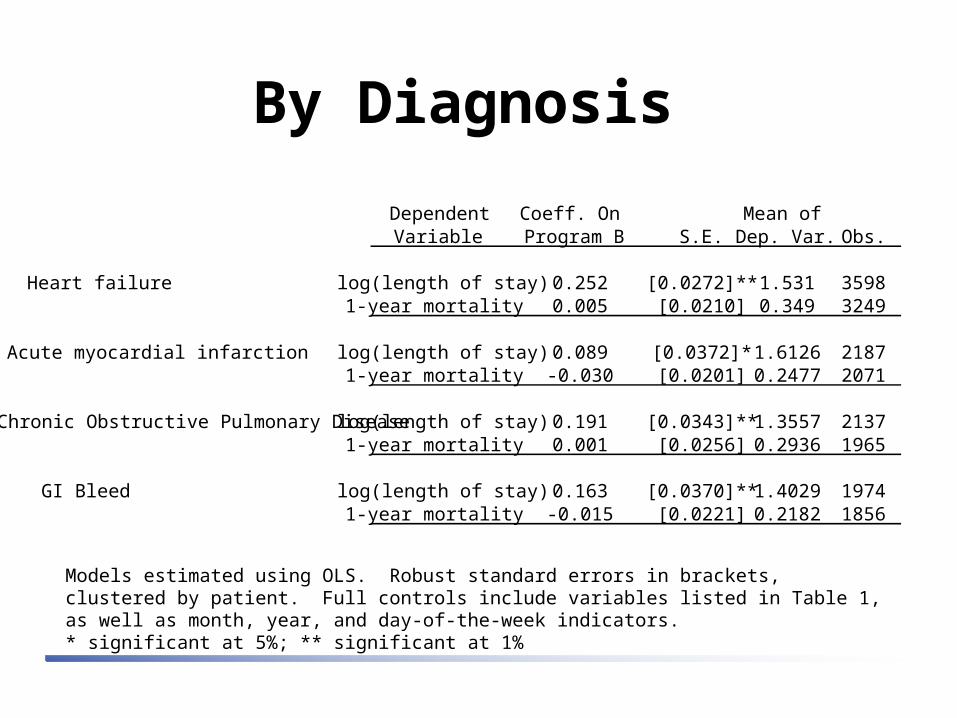
By Diagnosis
Models estimated using OLS. Robust standard errors in brackets, clustered by patient. Full controls include variables listed in Table 1, as well as month, year, and day-of-the-week indicators. * significant at 5%; ** significant at 1%
Dependent Coeff. On Mean ofVariable Program B S.E. Dep. Var. Obs.
Heart failure log(length of stay) 0.252 [0.0272]** 1.531 35981-year mortality 0.005 [0.0210] 0.349 3249
Acute myocardial infarction log(length of stay) 0.089 [0.0372]* 1.6126 21871-year mortality -0.030 [0.0201] 0.2477 2071
Chronic Obstructive Pulmonary Disease log(length of stay) 0.191 [0.0343]** 1.3557 21371-year mortality 0.001 [0.0256] 0.2936 1965
GI Bleed log(length of stay) 0.163 [0.0370]** 1.4029 19741-year mortality -0.015 [0.0221] 0.2182 1856

Robustness Checks
Models estimated using OLS. Robust standard errors in brackets, clustered by patient. Full controls include variables listed in Table 1, as well as month, year, and day-of-the-week indicators. * significant at 5%; ** significant at 1%
Coeff. On Mean ofDependent Variable Program B S.E. Dep. Var. Obs.
Sample: nervous system patients log(length of stay) 0.047 0.048 1.34 135330-day readmission -0.011 0.022 0.191 13451-year mortality -0.040 0.021 0.153 1284
Sample: Outside main facility log(length of stay) -0.012 0.014 1.89 707751-year mortality 0.005 0.004 0.141 63299
Sample: Drop transferred patients. log(length of stay) 0.114 0.007** 1.42 6945130-day readmission -0.003 0.003 0.129 690471-year mortality -0.007 0.004 0.241 64177
Summary of Results
Patients treated by program A have 8-20% lower LOS than patients treated in program B
Cost differences also exist and remain after controlling for LOS
No differences in readmission and mortality
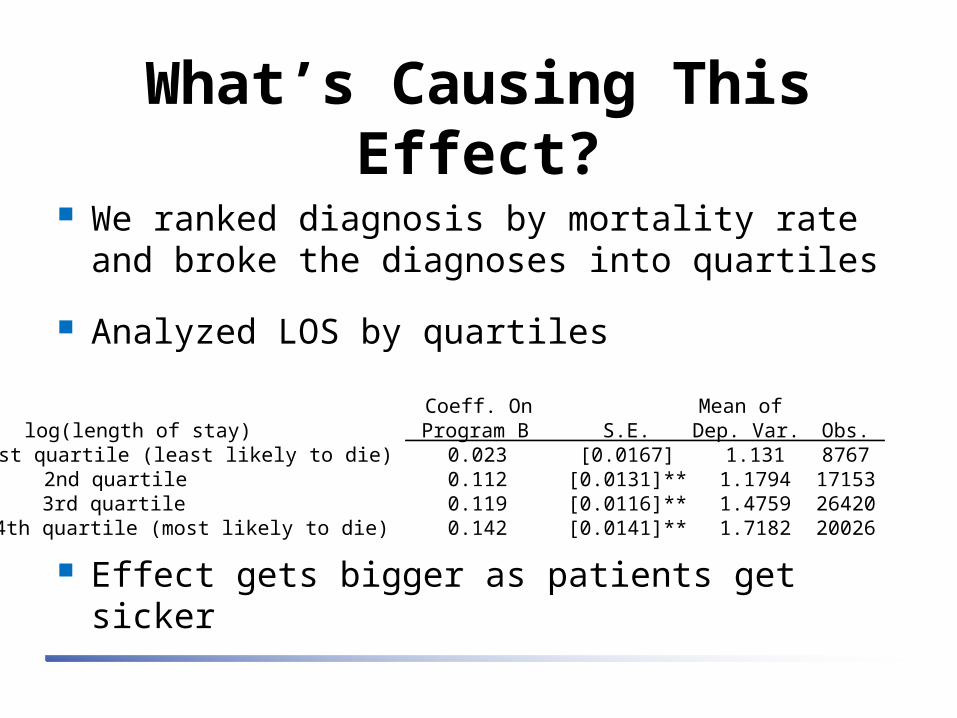
What’s Causing This Effect?
We ranked diagnosis by mortality rate and broke the diagnoses into quartiles
Analyzed LOS by quartiles
Effect gets bigger as patients get sicker
Coeff. On Mean oflog(length of stay) Program B S.E. Dep. Var. Obs.1st quartile (least likely to die) 0.023 [0.0167] 1.131 87672nd quartile 0.112 [0.0131]** 1.1794 171533rd quartile 0.119 [0.0116]** 1.4759 264204th quartile (most likely to die) 0.142 [0.0141]** 1.7182 20026
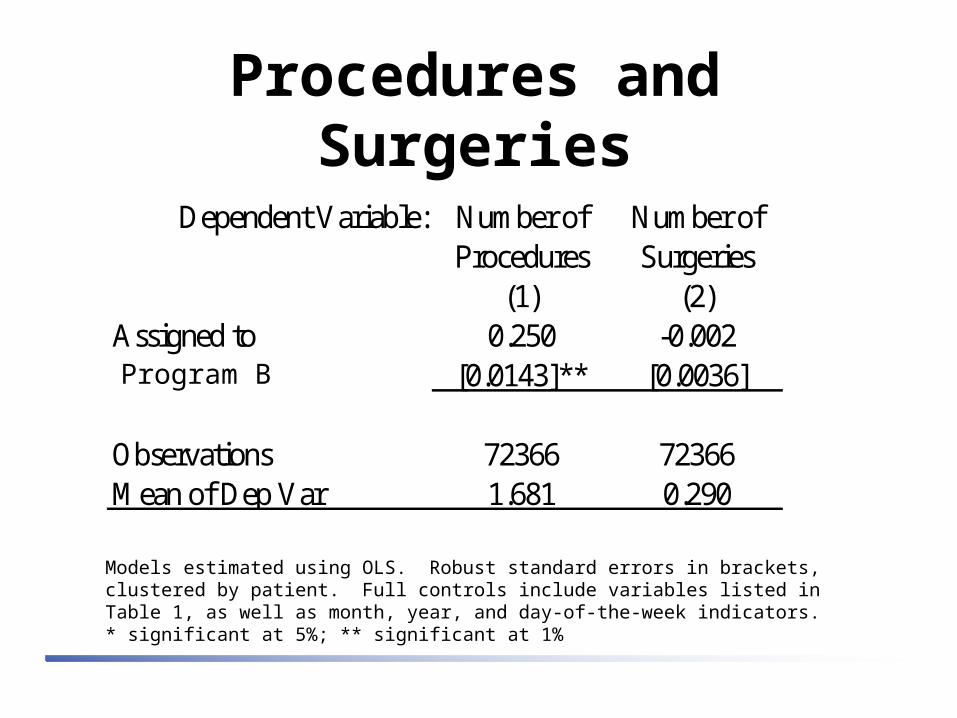
Procedures and Surgeries
Models estimated using OLS. Robust standard errors in brackets, clustered by patient. Full controls include variables listed in Table 1, as well as month, year, and day-of-the-week indicators. * significant at 5%; ** significant at 1%
Dependent Variable: Number of Number ofProcedures Surgeries
(1) (2)Assigned to 0.250 -0.002Lower Ranking Program [0.0143]** [0.0036]
Observations 72366 72366Mean of Dep Var 1.681 0.290
Program B

Use and Timing of ProceduresA B A B A B
All casesobservations 35932 36434
any diagnostic 68.4% 73.1% ** 2.99 3.25 ** 1.41 1.55 **xray 22.4% 25.1% ** 1.77 1.77 3.04 3.17chest xray 6.3% 7.5% ** 1.11 1.13 * 4.39 4.69 *endoscopy 5.2% 5.7% ** 1.26 1.30 ** 4.90 4.89angiography 8.1% 8.3% 2.70 2.67 3.16 3.53 **cardiac stress test 6.4% 7.8% ** 1.02 1.02 3.96 4.39 **Other cardiac test, including echo 12.7% 15.0% ** 1.12 1.11 1.39 2.21 **
days to first testPr (test) # | any
• Story within AMI, COPD, CHF and GI bleed patients is consistent.

Residency Programs Program A (treats odd-ending SSNs)
– MCAT ranking 1/126 (mean 12.2) in 2006
– NIH funding ranking 4/126 in 2006
– Supposedly greater use of specialists as attendings
Program B (treats even-ending SSNs)– MCAT ranking 48/126 (mean 10.4) in 2006
– NIH funding ranking 79/126 in 2006
– Supposedly more international medical graduate residents
UCSF (for comparison’s sake)– MCAT ranking 17/126 (mean 11.1)
– NIH ranking 3/126
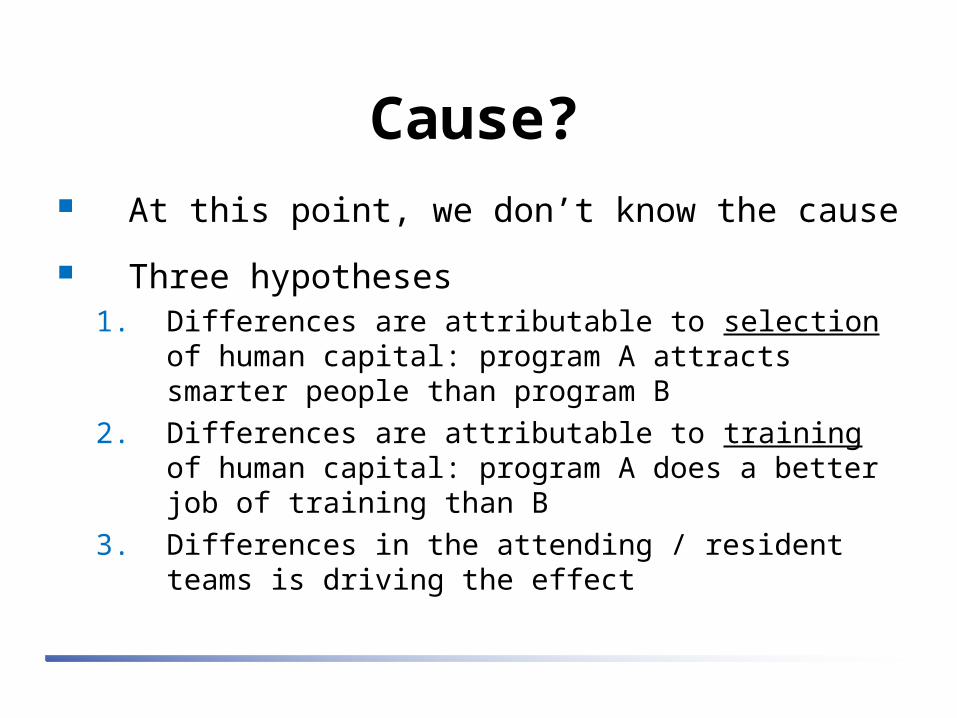
Cause? At this point, we don’t know the cause
Three hypotheses1. Differences are attributable to selection of human
capital: program A attracts smarter people than program B
2. Differences are attributable to training of human capital: program A does a better job of training than B
3. Differences in the attending / resident teams is driving the effect
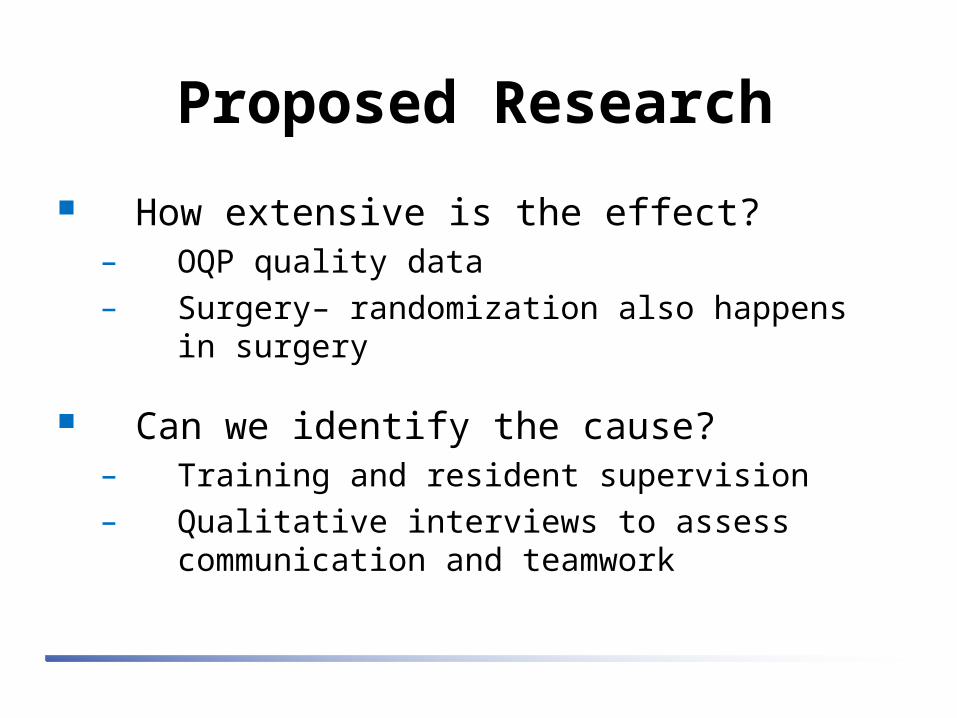
Proposed Research
How extensive is the effect?– OQP quality data
– Surgery– randomization also happens in surgery
Can we identify the cause?– Training and resident supervision
– Qualitative interviews to assess communication and teamwork

Limitations & Criticisms
We have heard two criticisms1. Results may not generalize to non-VA
2. These data come from a single VA hospital and may not generalize to other VA’s
VA is a critical component of provider training.1
– 17,000 medical students are trained in VA facilities every year (16,139 med school graduates in 2007)
– 30% of all US residents receive training in VA facilities each year
This is a “mouse model”– a very unique opportunity to gain insights on clinician behavior and teamwork
1. AAMC; Winship D, Ullian E. Advisory Committee on Veterans Health Administration (VHA) Resident Evaluation, Report to the Secretary of Veterans Affairs

Summary Cost and length of stay differ, and the differences are
biggest with sickest patients
No differences with regard to readmission or mortality
Notable differences in the use and timing of procedures
Would love your feedback on extending this research