tlengelhardt compuserve.com kgertig ci.fort …
TRANSCRIPT
Particle Counting: It’s Just One Piece of the QualityControl Puzzle
T. L. Engelhardt, Drinking Water SpecialistCorresponding authorPacific Scientific Instruments19 Old Town Square, Suite 238Fort Collins, Colorado 80524Phone: 970-493-5470Fax: [email protected]
K. Gertig, Water Production ManagerCity of Fort Collins4316 West LaPorte AvenueFort Collins, Colorado 80521Phone: 970-221-6690Fax: [email protected]
Presented at the Association of State Drinking WaterAdministrators annual conference, Keystone, CO.
Pacific Scientific Instruments Paper No. 57
May 1999

2 Pacific Scientific Instruments • One Piece of the Quality Control Puzzle
Abstract
There are numerous measurement tools currently available to treatment plantoperators and managers to evaluate the performance of water treatment processes.Some tools, including turbidity and pH, have been used for decades. Others, likeparticle counting, are relatively new.
With increased regulation and more focus on process control, treatment plantoperators need to use a combination of indicators to meet today’s challenges. Infact, the modern-day treatment process and its management require a wide varietyof both old and new tools.
Rather than searching for new measurement tools to replace old ones, watertreatment professionals need to study the benefits of every available toolincluding particle counting, microscopic particulate analysis, turbidity and pH. Bygathering information about individual measurement tools, plant operators canfind ways to integrate these tools to create a more detailed picture of the treatmentprocess.
Particle counters are fast becoming a critical measurement in achieving andmaintaining optimal performance at water treatment plants. Information from aparticle counter is most valuable when used in combination with the many otheron-line and laboratory measurements
This paper, which focuses on one utility, shows how combining particle countingdata with information from other measurements can help achieve consistent, highquality treated water effluent at reasonable cost to the utility and its customers.

Pacific Scientific Instruments • One Piece of the Quality Control Puzzle 3
The Study
Discovering new tools
About 400 years ago, Sir Francis Bacon observed, “He that will not apply newremedies must expect new evils; for time is the greatest innovator.” This iscertainly true with water treatment.
When Sir Francis Bacon made this observation, the germ theory of disease wasmore than 200 years away. When slow sand filtration was initiated in the early1800s, the germ theory of disease was not yet known. While chlorination wasused against disease by the 1830s, its initial application was to control odors. Inthe early 1900s, the real value of both filtration and chlorination became clearwhen these tools helped defeat the occurrence of waterborne typhoid.
So the art and science of water treatment has progressed. And as we understandmore about waterborne diseases and the organisms that cause these diseases, newtools are invented and put in place.
Developing better processes
Filtration technologies and chemical treatment to enhance efficiency of thefiltration process continue to develop. Until recently, chemical and physicalprocesses relied on the same basic set of process control tools. However, it’s timeto apply new measurement technologies.
Among recent innovations in measurement are particle counting, zeta potential,streaming current, total organic carbon and microscopic particulate analysis(MPA). These new tools don’t replace existing successful tools. Instead, newtools are most beneficial when integrated with tools that have been usedsuccessfully for many years.
Optimizing the treatment process
During the past two decades, there has been a lot of emphasis on achievingeffluent water that meets a set of numeric standards known as MaximumContaminant Limits (MCLs). These standards are for both primary and secondarychemical and physical parameters and microbiological organisms. However,many waterborne disease outbreaks have occurred when these maximumstandards have not been exceeded.

4 Pacific Scientific Instruments • One Piece of the Quality Control Puzzle
So the industry is becoming increasingly aware that simply meeting numericstandards is not enough; it’s time to optimize the entire treatment process. Manyfactors are involved in optimization, including application and control ofappropriate treatment technologies, a properly trained and motivated workforce,protection of source water and a variety of both new and old chemical, physicaland microbiological measurements.
Source water in Fort Collins
The City of Fort Collins is located north of Denver, at the base of Colorado’sFront Range. The City draws raw water from two primary sources: HorsetoothReservoir and Cache la Poudre River.
Horsetooth Reservoir is manmade and its water is relatively constant in quality. Itis constructed as part of the Colorado-Big Thompson Project, a transmountaindiversion plan that diverts water from Colorado’s western slope of the RockyMountains to the water-short Front Range. The City withdraws water from adepth of about 250 feet below the reservoir’s surface.
The Cache La Poudre (Poudre) River is subject to wide fluctuations in quality andquantity. Historically, annual peak flows occur from about May 1 to June 15. Thepeak flow is due to natural springtime runoff from snowmelt high in the RockyMountains. Were it not for manmade reservoirs at high elevations and sometransmountain diversion water, the Poudre River could dry up for many monthsof the year.
The headwaters of the Poudre River begin at over 10,000 feet above sea levelwith very clean snowmelt. The river flows through a combination of igneous,metamorphic and sedimentary geological formations on its way to Fort Collins(elevation 5,003 feet) and the plains of eastern Colorado.
Sudden storms anywhere along the river’s path can cause wide fluctuations inwater quality. Depending on where a storm occurs in the watershed, the river canturn white from glacial till or muddy-red from iron-rich clay. Total OrganicCarbon (TOC) is one of the biggest challenges when using Poudre water,particularly during spring runoff.

Pacific Scientific Instruments • One Piece of the Quality Control Puzzle 5
Since there are no significant industrial sources of pollutants near HorsetoothReservoir or the Poudre River, it’s possible that chemical, physical andmicrobiological contaminants in both water sources are caused by human contact,open range cattle and wildlife, among other factors. In an effort to monitorpollutants, Fort Collins maintains an active surveillance of both water sources,including chemical and physical testing as well as microbiological examinationssuch as MPAs.
Treating the water
Providing consistent, high quality water from Horsetooth Reservoir and thePoudre River is an ongoing challenge for Fort Collins. To treat the raw water, theCity uses conventional sedimentation, coagulation, flocculation and filtrationprocesses. Multiple process trains are in place, using sedimentation enhanced bysettling tubes and Lamella plates, as well as dual and multimedia filters. Currentcapacity is about 74 million gallons per day (MGD). Plans are underway toreplace all filter beds with a deep-bed dual media design, and to expand capacityto about 92 MGD.
The City, using an extensive pilot program, developed much of the watertreatment plant’s physical processes and controls. This program tested such thingsas filtration designs and chemical feed configurations. Even the plant’ssupervisory control and data acquisition (SCADA) program was developed inhouse by the City’s ICE Team (Instrumentation/Controls and Electrical). SCADAis based on a plug-and-play scheme where every unit operation and processinstrument in the plant has a unique “tag” in the system. These tags identify theparts and pieces of the system. (See figure 1 for an example of a tag.) This degreeof control extends to laboratory and on-line process measurements.

6 Pacific Scientific Instruments • One Piece of the Quality Control Puzzle
Figure 1. Each process operation and process instrument has a unique tag inthe control system. An example of a tag appears to the left in the figure.
To maintain objectivity, a central laboratory operates independently from thetreatment plant. Process control tests are performed within the plant. Whethermeasurements are made at the central laboratory, in the plant’s process controllaboratory or with on-line instruments, rigid standards for quality assurance (QA)and quality control (QC) are always followed.
Integrating particle counting
Considering Fort Collins’ thorough approach to measurement, it’s not surprisingthat the City pays careful attention when validating all measurements, and that itadded particle counting to its long list of process measurements.
Fort Collins purchased its first laboratory particle counter in the mid-1970s. Atthat time, particle counters were not well suited for use in water treatment, so theCity abandoned its initial effort. In the early 1990s, Fort Collins purchased asecond laboratory particle counter, which was more suited for water treatmentand proved more encouraging. By mid-1995, the City tested an on-line system.Again, the results looked promising, so the city purchased some on-lineinstruments.
As experience and confidence has grown, the City has continued to add moreunits for measurement. Today, Fort Collins owns a new laboratory particlecounter, along with 24 on-line units. In the future, the City will equip every filtereffluent with individual particle counters.

Pacific Scientific Instruments • One Piece of the Quality Control Puzzle 7
Though the City has adopted large-scale particle counting, it hasn’t abandonedother ways to measure. On the contrary, efforts to provide diligent QA/QC haveprompted researchers to study how particle counting complements and correlateswith other measurements. So far, these efforts have paid off.
0.01
0.1
1
10
100
3-5
µm
5-7
µm
7-10
µm
10-1
5 µm
15-2
0 µm
> 20
µm
Tot
al >
2µm
Size Ranges
Par
ticle
s/m
l
Lab
Filt#12
Figure 2. Comparison of laboratory versus the on-line unit on Filter 12. As with other measurements, high standardsfor QA/QC are followed for particle counters. The calibration date is clearly marked on each particle counter.Operators can see at a glance whether or not the calibration is current.
Sending data on-line
Data from on-line particle counters are collected by both analog and digitaloutputs from the instruments. A digital signal through a daisy-chain RS485network is sent to WQS Vista, a dedicated software program provided by themanufacturer of the particle counter. Data are also sent directly from on-lineparticle counters by way of a 4-20 MA analog signal. This scheme provides aredundant measurement and reporting system. The digital signal allows up to 32channels of particle count information from each on-line particle counter sent toWQS Vista software. The City currently uses seven channels as follows:
• Two cumulative channels of >2 µ and >20 µ
• Five differential channels of 2-3 µ, 3-5 µ, 5-7 µ, 7-10 µ and 10-15 µ
8 Pacific Scientific Instruments • One Piece of the Quality Control Puzzle
For each on-line particle counter, up to eight analog signals from other devices,including turbidity, flow and headloss, can also be transmitted over the digitalnetwork, though no other devices are currently being monitored this way.
As a result of the City’s initial study, only one particle count channel (>2 µ) fromeach instrument is being sent to the SCADA by way of an analog signal. For day-to-day monitoring and control, the City found just one particle count channel wassufficient when transmitting data to the SCADA. However, if a more detailedstudy should be needed, additional more specific information is available fromthe independent digital system through the software.
When the Fort Collins’ study team considered using on-line particle counters, ittook into account sample point and instrument location and design for apreventive maintenance program. The team also made sure that the staff acceptedon-line particle counters and was trained in their use.
Note On-line measurements are most valuable when taken as close as is practicalto a sample point. This is especially true for particle counters. In the City’s study,the sample lines were made as short as possible, and small diameter sampletubing was used to maintain high velocity, minimize accumulation of solids,minimize volume and provide rapid response. Various sample points wereinitially tested to ensure that a representative sample was being monitored.
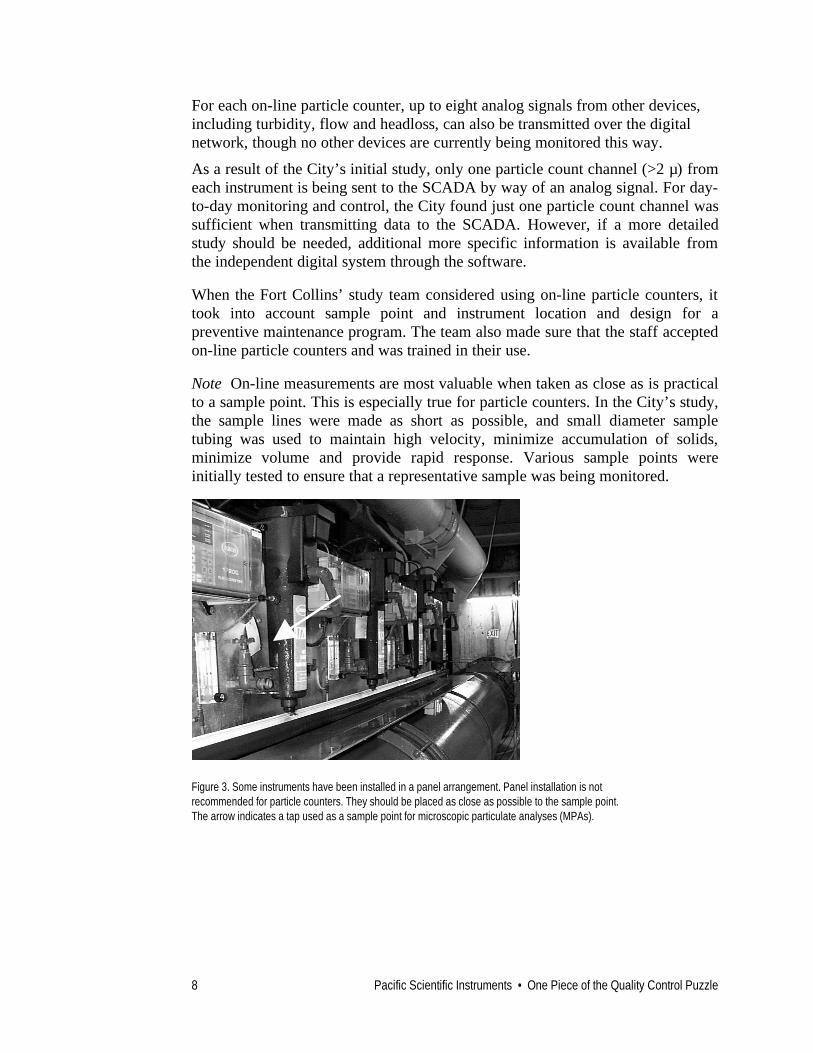
Figure 3. Some instruments have been installed in a panel arrangement. Panel installation is notrecommended for particle counters. They should be placed as close as possible to the sample point.The arrow indicates a tap used as a sample point for microscopic particulate analyses (MPAs).

Pacific Scientific Instruments • One Piece of the Quality Control Puzzle 9
Figure 4. It is important to install particle counters as close as is practical to asample point. The arrow indicates quick-connect wiring configuration forease of maintenance.
Maintaining particle counters
Particle counters require regular maintenance as do any other precision analyticaltool. The sensor cell must be kept clean to ensure proper flow rates and accuratemeasurement. On average, particle counters used for filter effluent should becleaned about once a month. At Fort Collins, cleaning frequency varies, though itaverages about once a week.
When Fort Collins personnel selected mounting locations for particle counters,they made sure the counters were easily accessible for routine maintenance. Aspart of their extensive QA and QC, each sensor is removed and returned to thefactory for annual calibration. The City’s ICE Team also installed allcommunications wiring with quick-connect fittings to help make the maintenanceprocess easier.
Training staff
Staff training and acceptance of on-line particle counters was an importantelement in the Fort Collins project. When the City decided to add particlecounters to its system, a representative of the instrument manufacturer and aconsulting engineer met with the City’s key management personnel. Togetherthey formed a strategy for integration.

10 Pacific Scientific Instruments • One Piece of the Quality Control Puzzle
Integration involved the City’s maintenance, operations and laboratorydepartments and the Information Technology Group (IT). An introductoryseminar familiarized the Fort Collins’ operations and maintenance staff with thebasic concepts of particle counting. After a year of continued testing andexperimentation, a second seminar featured a particle counter manufacturer’srepresentative and a laboratory manager from another utility. The representativediscussed particle counters in detail, while the laboratory manager talked aboutproblems and successes of his utility’s particle counting program.
Setting operational goals
Based on progress to date, operational goals for particle counting have been set.For example, filter effluent particle counts are expected to be less than 10particle/mL for cumulative particles greater than 2 µ. If particle counts exceed 10,filter runs are terminated.
Filter evaluation using particle counters helped eliminate the need for a multi-million dollar filter media replacement project at Fort Collins. Prior to usingparticle counters, filters were breaking through almost immediately afterbackwashing. The City initially thought that the media was not properlyspecified.
1.0
10.0
100.0
1000.0
0.0
0.5
1.0
1.5
2.0
2.5
3.0
3.5
4.0
4.5
5.0
5.5
6.0
6.5
7.0
7.5
8.0
8.5
9.0
9.5
10.0
10.5
11.0
11.5
12.0
12.5
13.0
Filter Run Length (hrs.)
Par
ticle
s/m
l Total Count Before Media Addition Ma y 3, -June 1, 1997 (Avera ge Count )
Figure 5. Filter number 15, Average Filter Run, Total Particles >2 µm. Comparing filter particle counts before mediaaddition.

Pacific Scientific Instruments • One Piece of the Quality Control Puzzle 11
The City didn’t expect an increase in particle counts because previousmeasurements using other tools hadn’t revealed this phenomenon. The filters aredeclining rate design. When the filters were initially designed, sufficientfreeboard was provided to permit addition of media, if needed.
This design proved to be a fortunate bit of foresight. When the City added fiveinches of anthracite, the filters maintained a steady state for the entire filter run.Therefore, the need for a multi-million dollar filter rehabilitation program waseliminated. However, as a result of information provided by the pilot studies, aproject is underway to replace all beds with a deep-bed dual media design.
0.1
1.0
10.0
100.0
1000.0
0.0
0.5
1.0
1.5
2.0
2.5
3.0
3.5
4.0
4.5
5.0
5.5
6.0
6.5
7.0
7.5
8.0
8.5
9.0
9.5
10.0
10.5
11.0
11.5
12.0
12.5
13.0
13.5
Filter Run Length (hrs.)
Par
ticle
s/m
l
Total Count After 5 Inches of Media Addition, June 9 - July 2, 1997 (Avera ge Count)
Total Count Before Media Addition, May 3 - June 1, 1997 (Avera ge Count)
Figure 6. Filter number 15, Average Filter Run, Total Particles >2 µm. Comparing particle counts before and after mediaaddition.
Using the Borescope
Aside from using particle counting in the Fort Collins study, City staff adapted aninnovative tool for physically investigating filter media. The Borescope helpedthe study team examine the media’s integrity and its proper stratification.

12 Pacific Scientific Instruments • One Piece of the Quality Control Puzzle
Figure 7. Borescope Video Unit (left to right: Borescope fitted in an insertion tube, CRTand VHS system) played an important role in Fort Collins’ filter investigation. Thisinnovative tool was adapted by City staff for filter inspections. A clear Plexiglas tube islowered into the expanded media during backwash. After backwash, a video camera islowered inside the tube so that the media can be photographed and examined.
Identifying causes of manganese
As Horsetooth Reservoir has aged and the biota has been established, it hasbecome a source of manganese. Uniformity of the reservoir in traditionalmeasures such as suspended solids, turbidity, temperature and pH, has allowedthe identification of the causes of the manganese.
The City found that when manganese levels increase, there’s a direct increase inthe population of two groups of bacteria associated with manganese:
• Metallogenium, an aerobic chemolithotrophic bacteria
• Plantomyces, a budding and/or appendaged bacteria
Both bacteria are now common in Horsetooth water. Again, because most otherparameters are relatively stable, the City has isolated and studied this bacteriaproblem in more detail. When particle counts increase in the Horsetooth rawwater, the population of these bacteria increase in a similar way.

Pacific Scientific Instruments • One Piece of the Quality Control Puzzle 13
Particle counting has not replaced any other type of measurement. When particlecounting, turbidity and MPAs are used regularly, each checks and confirms theother. Some additional measurement tools regularly used include ORP, pH,Streaming Current, Zeta Potential and TOC.
Figure 8. Turbidity versus Total Count >2 µm for Filter number 9 on September 7, 1998. The particle counts are real time,while turbidity measurements lag about 15 minutes behind the actual reading. The delay is a result of the panelarrangement illustrated in figure 3. Fort Collins has yet to adopt a single tool to replace another. Instead, new tools arebeing added to complement existing ones.
0.1
1
10
100
1000
0.00
0.25
0.50
0.75
1.00
1.25
1.50
1.75
2.00
2.25
2.50
2.75
3.00
3.25
3.50
3.75
4.00
Filter Run - Hours
Par
ticle
s P
er M
illili
ter
00.020.040.060.080.10.120.14
Tur
bidi
ty (
ntu)
Turbidity
Particle Counts

14 Pacific Scientific Instruments • One Piece of the Quality Control Puzzle
Conclusion
Using the information
The City of Fort Collins uses information it collects for more than just recordkeeping. Staff is constantly sorting through data to uncover problems and to findsolutions. One challenge with implementing particle counting is that the processis data intensive, providing more data than any other analytical measurement usedin water treatment. Therefore, information management is critical and requires awell-developed plan for its use. Otherwise, volumes of data will quicklyoverwhelm the user, leading to frustration and eventual loss of interest in themeasurement.
Thanks and acknowledgement
The authors thank and acknowledge Grant Jones for his help in preparing thispaper. Mr. Jones is a Quality Specialist for the City of Fort Collins and isresponsible for collecting much of the information presented in this paper.