title: the future of coal generation in great britain impact · pdf file ·...
TRANSCRIPT

1
Title: The Future of Coal Generation in Great Britain IA No: BEIS023(F)-17-ESNM
RPC Reference No: RPC16-DECC-3350(1)
Lead department or agency: Department for Business, Energy and Industrial Strategy
Other departments or agencies:
Impact Assessment (IA)
Date: 20/11/2017
Stage: Government response
Source of intervention: Domestic
Type of measure: Primary legislation
Contact for enquiries: Thomas Carlucci-Davies; [email protected]
Summary: Intervention and Options
RPC Opinion: Not required
Cost of Preferred (or more likely) Option
Total Net
Present Value1
Business Net Present Value
Net cost to business per year (EANDCB in 2014 prices)
One-In, Three-Out
Business Impact Target Status
-£24m £170m -£11m TBC TBC
What is the problem under consideration? Why is government intervention necessary?
Two market failures mean that coal-fired power generation is overvalued relative to other forms of power generation. This leads to an inefficient outcome, with harmful and costly impacts of coal generation not accounted for by relative prices in the market:
(i) the externality arising from emissions of carbon dioxide and other harmful pollutants; and (ii) imperfect information leading to investor uncertainty for new build plant. Without Government intervention there could be an excessive delay in the switch from coal-fired power generation to less carbon-intensive forms of generation such as gas and renewables.
What are the policy objectives and the intended effects?
The policy objectives are to: (i) reduce emissions of carbon dioxide and other harmful pollutants from the UK power sector; (ii) increase revenue certainty for investment in lower carbon plant; (iii) maintain security of electricity supply.
The policy intends to lead to the retirement of unabated coal-fired power plants by the end of 2025, to be replaced by cleaner, flexible forms of generation capacity without risking security of electricity supply.
What policy options have been considered, including any alternatives to regulation? Please justify preferred option (further details in Evidence Base)
Options considered are: (0) do nothing; (1) regulation mandating unabated coal plant closure by 2025. Further options for restricting coal generation ahead of 2025 have been ruled out, as noted in the Government response to the consultation accompanying this IA, following a public consultation in 2016.
Will the policy be reviewed? Yes If applicable, set review date: 2030, five years after provisions come into effect
Does implementation go beyond minimum EU requirements? Yes
Are any of these organisations in scope? MicroYes
SmallYes
MediumYes
LargeYes
What is the CO2 equivalent change in greenhouse gas emissions? (Million tonnes CO2 equivalent)
Traded: -15
Non-traded: 0
I have read the Impact Assessment and I am satisfied that, given the available evidence, it represents a reasonable view of the likely costs, benefits and impact of the leading options.
Signed by the responsible MINISTER: Date:
11 Dec 2017
1 We consider that this policy shall have a net positive impact but the NPV figure for this updated IA does not include some non-monetised
benefits which cannot be quantified.
2
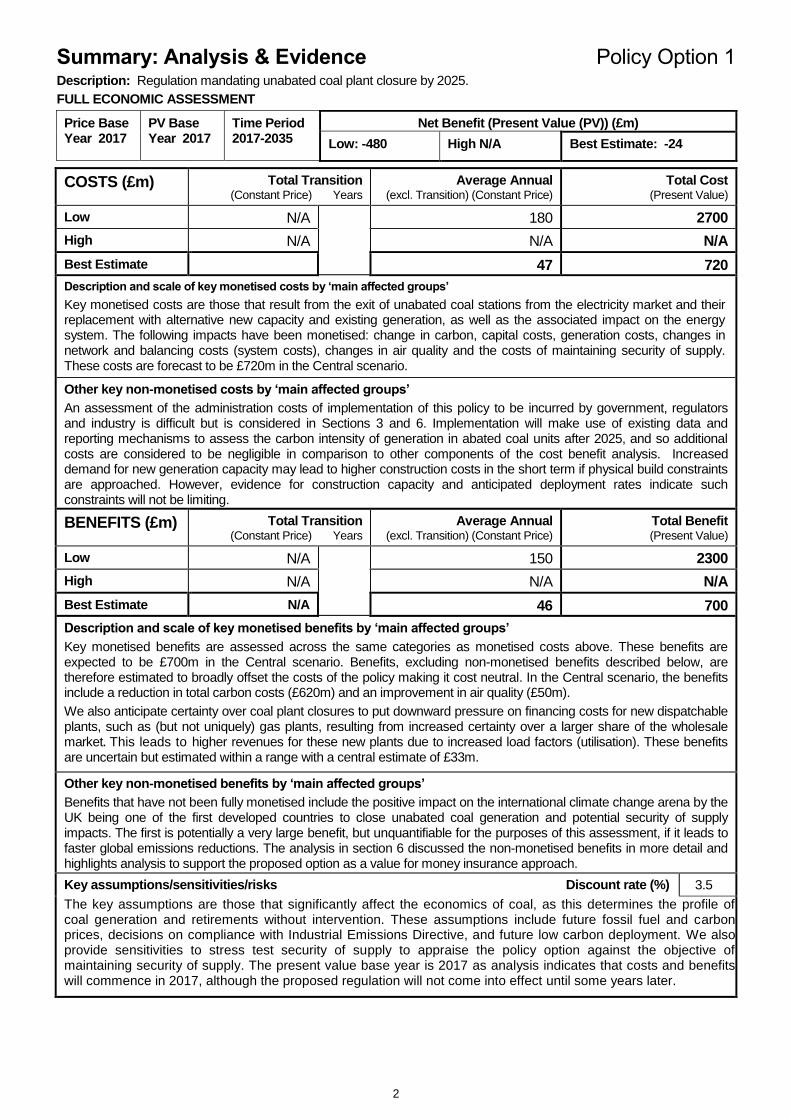
Summary: Analysis & Evidence Policy Option 1 Description: Regulation mandating unabated coal plant closure by 2025.
FULL ECONOMIC ASSESSMENT
Price Base Year 2017
PV Base Year 2017
Time Period 2017-2035
Net Benefit (Present Value (PV)) (£m)
Low: -480 High N/A Best Estimate: -24
COSTS (£m) Total Transition (Constant Price) Years
Average Annual (excl. Transition) (Constant Price)
Total Cost (Present Value)
Low N/A
180 2700
High N/A N/A N/A
Best Estimate
47 720
Description and scale of key monetised costs by ‘main affected groups’
Key monetised costs are those that result from the exit of unabated coal stations from the electricity market and their replacement with alternative new capacity and existing generation, as well as the associated impact on the energy system. The following impacts have been monetised: change in carbon, capital costs, generation costs, changes in network and balancing costs (system costs), changes in air quality and the costs of maintaining security of supply. These costs are forecast to be £720m in the Central scenario.
Other key non-monetised costs by ‘main affected groups’
An assessment of the administration costs of implementation of this policy to be incurred by government, regulators and industry is difficult but is considered in Sections 3 and 6. Implementation will make use of existing data and reporting mechanisms to assess the carbon intensity of generation in abated coal units after 2025, and so additional costs are considered to be negligible in comparison to other components of the cost benefit analysis. Increased demand for new generation capacity may lead to higher construction costs in the short term if physical build constraints are approached. However, evidence for construction capacity and anticipated deployment rates indicate such constraints will not be limiting.
BENEFITS (£m) Total Transition (Constant Price) Years
Average Annual (excl. Transition) (Constant Price)
Total Benefit (Present Value)
Low N/A
150 2300
High N/A N/A N/A
Best Estimate
N/A 46 700
Description and scale of key monetised benefits by ‘main affected groups’
Key monetised benefits are assessed across the same categories as monetised costs above. These benefits are expected to be £700m in the Central scenario. Benefits, excluding non-monetised benefits described below, are therefore estimated to broadly offset the costs of the policy making it cost neutral. In the Central scenario, the benefits include a reduction in total carbon costs (£620m) and an improvement in air quality (£50m).
We also anticipate certainty over coal plant closures to put downward pressure on financing costs for new dispatchable plants, such as (but not uniquely) gas plants, resulting from increased certainty over a larger share of the wholesale market. This leads to higher revenues for these new plants due to increased load factors (utilisation). These benefits are uncertain but estimated within a range with a central estimate of £33m.
Other key non-monetised benefits by ‘main affected groups’
Benefits that have not been fully monetised include the positive impact on the international climate change arena by the UK being one of the first developed countries to close unabated coal generation and potential security of supply impacts. The first is potentially a very large benefit, but unquantifiable for the purposes of this assessment, if it leads to faster global emissions reductions. The analysis in section 6 discussed the non-monetised benefits in more detail and highlights analysis to support the proposed option as a value for money insurance approach.
Key assumptions/sensitivities/risks Discount rate (%)
3.5
The key assumptions are those that significantly affect the economics of coal, as this determines the profile of coal generation and retirements without intervention. These assumptions include future fossil fuel and carbon prices, decisions on compliance with Industrial Emissions Directive, and future low carbon deployment. We also provide sensitivities to stress test security of supply to appraise the policy option against the objective of maintaining security of supply. The present value base year is 2017 as analysis indicates that costs and benefits will commence in 2017, although the proposed regulation will not come into effect until some years later.

3
BUSINESS ASSESSMENT (Option 1)
Direct impact on business (Equivalent Annual) £m: Score for Business Impact Target1 (qualifying
provisions only) £m: Costs: £96 Benefits: £107 Net: £-11
TBC
1 The Business Impact Target scoring schema has not yet been confirmed for the current Parliament. We therefore present the score for the BIT
target on the basis of the method set previously.

4
Table of Contents Impact Assessment (IA) ............................................................................................................ 1
RPC Opinion: Not required ....................................................................................................... 1
Section 1: Introduction .............................................................................................................. 5
Rationale for intervention .......................................................................................................... 5
Policy objectives ....................................................................................................................... 5
Next steps: ............................................................................................................................... 6
Options considered .................................................................................................................. 6
Section 2: Analytical approach ................................................................................................. 6
Modelling assumptions and counterfactual scenarios ....................................................................... 7
Section 3: Monetised costs and benefits ................................................................................. 8
Section 4: Security of Supply Assessment ........................................................................... 10
Section 5: Reduced hurdle rates for new build capacity ...................................................... 11
Section 6: Unmonetised costs and benefits .......................................................................... 13
International Climate Change leadership ........................................................................................ 13
Familiarisation, implementation and monitoring costs ..................................................................... 14
Macroeconomic impacts ................................................................................................................. 14
Health and Safety Impacts .............................................................................................................. 15
Section 7: Distributional Impacts ........................................................................................... 16
Local Impacts ................................................................................................................................. 17
Section 8: Overall assessment ............................................................................................... 20
Section 9: Small and micro business assessment ............................................................... 20
Section 10: Business Impacts ................................................................................................ 20
Annex A: Impacts on consumer bills ..................................................................................... 22
Annex B: Dynamic Dispatch Model ........................................................................................ 23
Annex C: Revenue certainty benefits ..................................................................................... 25

5
Evidence Base
Section 1: Introduction
Rationale for intervention 1. Coal has historically played an important role in meeting the UK’s needs for electricity.
However, recently the utilisation of coal has declined with the growth of the renewables sector and the construction of new gas power stations. Coal is the most carbon intensive fossil fuel, producing around twice the carbon dioxide (CO2) per unit of electricity as natural gas. The burning of coal also produces other harmful pollutants such as particulate matter (PM), Sulphur Dioxide (SO2) and Nitrogen Dioxide (NO2).
2. The government is committed to reducing greenhouse gas emissions by at least 80 per
cent by 2050 when compared to 1990 levels, and wants to see an orderly transition away from unabated coal generation to help achieve these targets. Government is committed to maintaining the security of our electricity supplies. Our analysis suggests that taking action will not lead to such risks materialising and we have the tools in place to manage any unforeseen developments.
i. Intervention to facilitate a transition from unabated coal-fired plant in Great Britain3 to
lower carbon alternatives is justified by two key market failures. Carbon dioxide, and other harmful pollutants, are not priced by the market at the level of their full economic cost. Without intervention, this leads to continued coal-fired power generation, which emits around twice the level of carbon per unit of electricity generated than gas power plants; and
ii. Imperfect information about the future role of coal in the energy mix creates significant uncertainty for lower-carbon new build plant, increasing hurdle rates and discouraging investment.
These market failures mean that coal-fired power generation is overvalued relative to other forms of power generation. This leads to an inefficient outcome, with harmful and costly impacts of coal generation not accounted for by relative prices in the market:
3. Furthermore, the policy options considered would all provide a strong signal on the UK’s
commitment to reducing its carbon emissions both in the UK and to the international community. This policy is a clear signal of Government’s intent to reduce emissions in the power sector.
Policy objectives
4. The Government consulted in November 2016 on proposals to end unabated coal generation by 2025, and on the merits of setting a constraint on coal generation ahead of this date. The end date of 2025 balances the desire for affordability, security of supply and decarbonisation. The objectives of intervening to ensure the closure of unabated coal by 2025, and of constraining its use in the preceding years, are to:
i. reduce emissions of carbon dioxide and other harmful pollutants from the UK power
sector; ii. increase revenue certainty for investment in new lower-carbon, flexible generation
capacity;
3 The policy to end unabated coal generation from 2025 applies to Great Britain but not Northern Ireland.
6
iii. maintain security of electricity supply; and iv. demonstrate international climate policy leadership, encouraging other countries to
move away from their use of coal on climate change and air quality grounds.
Next steps: 5. A summary of responses to the consultation was published on 12 October 20174. A
Government response to the consultation is being published alongside this updated Impact Assessment. As noted in the Government response, the Government is considering the appropriate legislative vehicle for putting this policy into effect. In order to provide certainty and to prevent unabated coal units from entering into the Capacity Market auctions held in late 2021/early 2022 for the 2025/26 delivery year, and subsequent auctions for delivery years beyond that, the Government will prepare the required legislation in good time before these 2021/22 auctions. A final Impact Assessment will be published at that time.
Options considered
6. The proposed approach to intervention has developed and been informed following a public consultation. The previous IA and consultation document considered a number of options, including constraints ahead of 2025 in order to manage an orderly transition ahead of a 2025 backstop. Revised analysis has shown that under the proposed option, the expected level of coal-fired generation capacity in 2025 is low enough to mean that gradual reductions in the run up to 2025 are not necessary for an orderly transition. The range of options presented is narrower. Two policy options are considered in this impact assessment:
i. Option 0: Do nothing. The impact of the policy options below are compared to this
do nothing option in the cost benefit analysis. ii. Option 1: Mandated closure of unabated coal plant in 2025. The policy is that
the intervention would take effect from 1 October 20255.
Section 2: Analytical approach
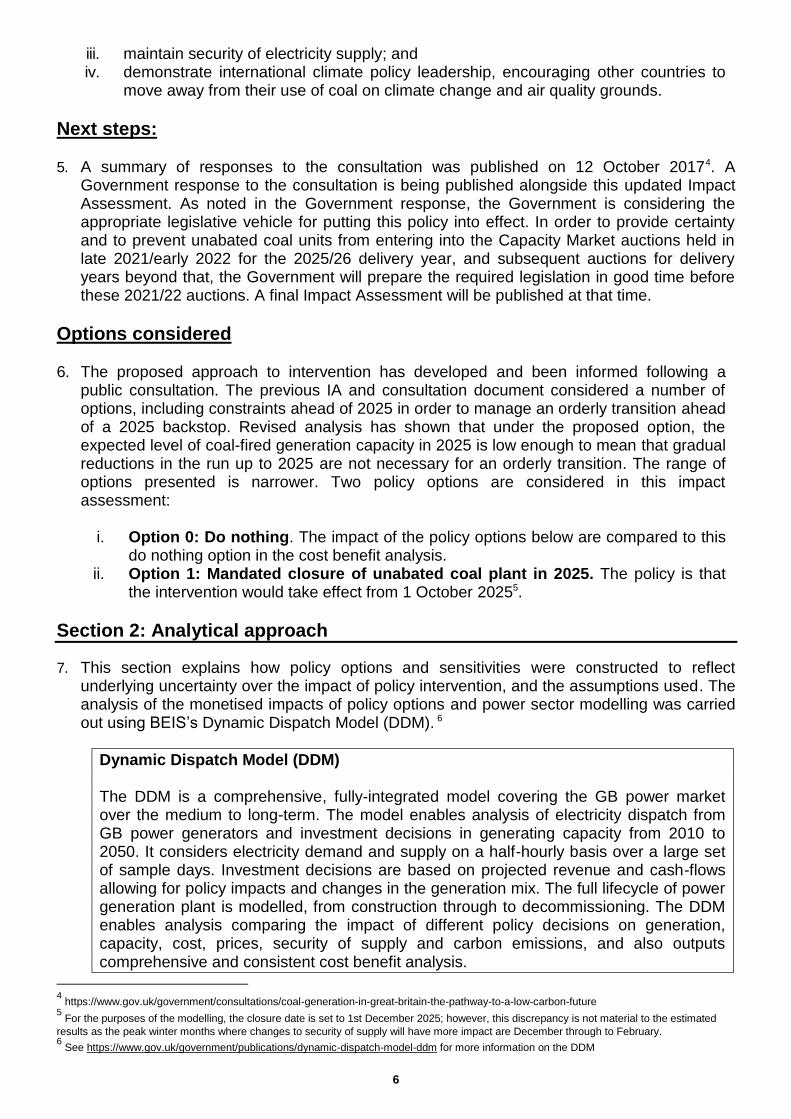
7. This section explains how policy options and sensitivities were constructed to reflect underlying uncertainty over the impact of policy intervention, and the assumptions used. The analysis of the monetised impacts of policy options and power sector modelling was carried out using BEIS’s Dynamic Dispatch Model (DDM). 6
Dynamic Dispatch Model (DDM) The DDM is a comprehensive, fully-integrated model covering the GB power market over the medium to long-term. The model enables analysis of electricity dispatch from GB power generators and investment decisions in generating capacity from 2010 to 2050. It considers electricity demand and supply on a half-hourly basis over a large set of sample days. Investment decisions are based on projected revenue and cash-flows allowing for policy impacts and changes in the generation mix. The full lifecycle of power generation plant is modelled, from construction through to decommissioning. The DDM enables analysis comparing the impact of different policy decisions on generation, capacity, cost, prices, security of supply and carbon emissions, and also outputs comprehensive and consistent cost benefit analysis.
4 https://www.gov.uk/government/consultations/coal-generation-in-great-britain-the-pathway-to-a-low-carbon-future
5 For the purposes of the modelling, the closure date is set to 1st December 2025; however, this discrepancy is not material to the estimated
results as the peak winter months where changes to security of supply will have more impact are December through to February. 6 See https://www.gov.uk/government/publications/dynamic-dispatch-model-ddm for more information on the DDM

7
8. Standard DDM analysis does not necessarily reflect the full range of uncertainty around the impact of intervention; nor does it monetise all relevant costs and benefits. For this policy, some elements of the benefits – international leadership, for example – are not monetised, but evidence for these benefits is presented. We describe how we have taken account of un-monetised costs and benefits in Section 6.
9. The DDM models the future investment deployment and operation of electricity generating
capacity and reports the various system impacts expected, categorised to estimate costs and benefits for different agents in the energy system. The policy option was analysed by restricting coal-fired generation after 2025. Modelling of policy scenarios is possible through adjustments to the model’s various input parameters and assumptions. DDM analysis provides outputs which allow comparison to the counterfactual, and the categorisation of costs and benefits is designed for integration into policy appraisal. Tables 2 and 4 below summarise expected impacts and are transposed directly from modelling outputs.
10. The appraisal period is 18 years (2017-2035). Although the policy measures take effect in
2025, the modelled impacts on industry of the proposed policy to end unabated coal-fired generation start in 2017. The chosen appraisal period allows for analysis of impacts up to the point at which the measures take effect and extends this for a suitable period to examine the effects of the policy after these measures come into force.
Modelling assumptions and counterfactual scenarios 11. This IA compares the impact of policy intervention using a ‘Central’ scenario, which reflects
our current view of how the UK electricity market is most likely to evolve without intervention. Table 1 compares the assumptions used in this scenario. This Central scenario is intended to reflect established Government policy and Central expectations.
Table 1: Central scenario assumptions
Assumption Central Scenario
Fossil Fuel Prices BEIS 2017 fossil fuel price Assumptions7
Industrial Emissions Directive8 decisions
Two coal plants have elected to comply with the stricter air pollution emissions limits in the Industrial Emissions Directive (IED) and will therefore not face a constraint on load factor from 2020. Load factor is the ratio of average load to capacity and is a measure of the output of a power plant compared to the maximum output it could produce. All other but one coal plants will face a 17% constraint on annual load factor from 2020, equivalent to a 1500 hour annual operating limit. A further plant must close by end-2023. We are confident of this assumption, due to the associated cost and time requirement for compliance ahead of restrictions associated with the IED coming into effect.
Deployment of low-carbon generating capacity
Rates of deployment of new low-carbon generation are consistent with the ambition set out in the Clean Growth Strategy and the most recent Contracts for Difference Allocation Round9.
Carbon costs Carbon Price Floor (CPF) capped from 2021/22. Note that this level of carbon pricing is used for modelling purposes only and is not an indication
7 https://www.gov.uk/government/publications/fossil-fuel-price-assumptions-2017
8 On 23 June 2016, the EU referendum took place and the people of the United Kingdom voted to leave the European Union. Until exit
negotiations are concluded, the UK remains a full member of the European Union and all the rights and obligations of EU membership remain in force. During this period the Government will continue to negotiate, implement and apply EU legislation. The outcome of these negotiations will determine what arrangements apply in relation to EU legislation in future once the UK has left the EU. 9 https://www.gov.uk/government/publications/clean-growth-strategy and https://www.gov.uk/government/publications/contracts-for-
difference/contract-for-difference

8
of policy direction or intent. Carbon prices to 2025 were set out in the Budget in November 201710.
Section 3: Monetised costs and benefits 12. Figure 1 shows the level of coal capacity in Great Britain under the Central scenario under
the intervention and for the counterfactual. Poor profitability in the wholesale electricity market due in large part to more competitive gas-fired generation displacing coal means the majority of coal power stations are expected to close before the backstop on unabated coal takes effect in 2025.
Figure 1: Coal plant capacity in the Central scenario under Option 1 and the counterfactual.
13. In the Central scenario presented, installed coal capacity in Great Britain reduces from
13.8GW in 2017 to around 1.5GW in 2025 in analysis of both the counterfactual and Option 1 as modelled by the DDM. This is due to a combination of the economics of generation and commercial decision making by firms, including the retirement of some existing coal plants due to their age. Efficiencies vary across existing plants and this, along with other aspects of the policy environment including carbon pricing, works to smooth the profile of retirements as operators exit the market at different times. In the absence of intervention, our Central scenario projects it would be commercially viable for this remaining coal generating capacity to stay on the system for a period after 2025.
14. Under the preferred policy option, the remaining ca. 1.5GW of coal generating capacity retires in 2025. We anticipate that any shortfall in generation capacity as a result of the policy would be covered by some gas plants remaining online that were otherwise due to retire on economic grounds. Additional capacity would be provided by new gas plants which would have been replacing retiring gas plants in the absence of intervention, as well as other generating technologies. Analysis and the assessment of security of supply (Section 4) provide assurance of this.
10
https://www.gov.uk/government/publications/autumn-budget-2017-documents
9
15. We modelled the dynamics of the energy system undertaken to examine the impacts of the proposed intervention and estimate the monetised change to welfare resulting from the preferred policy option to be broadly neutral (net. -£24m NPV) in the Central scenario. However there is considerable uncertainty around forecasting.
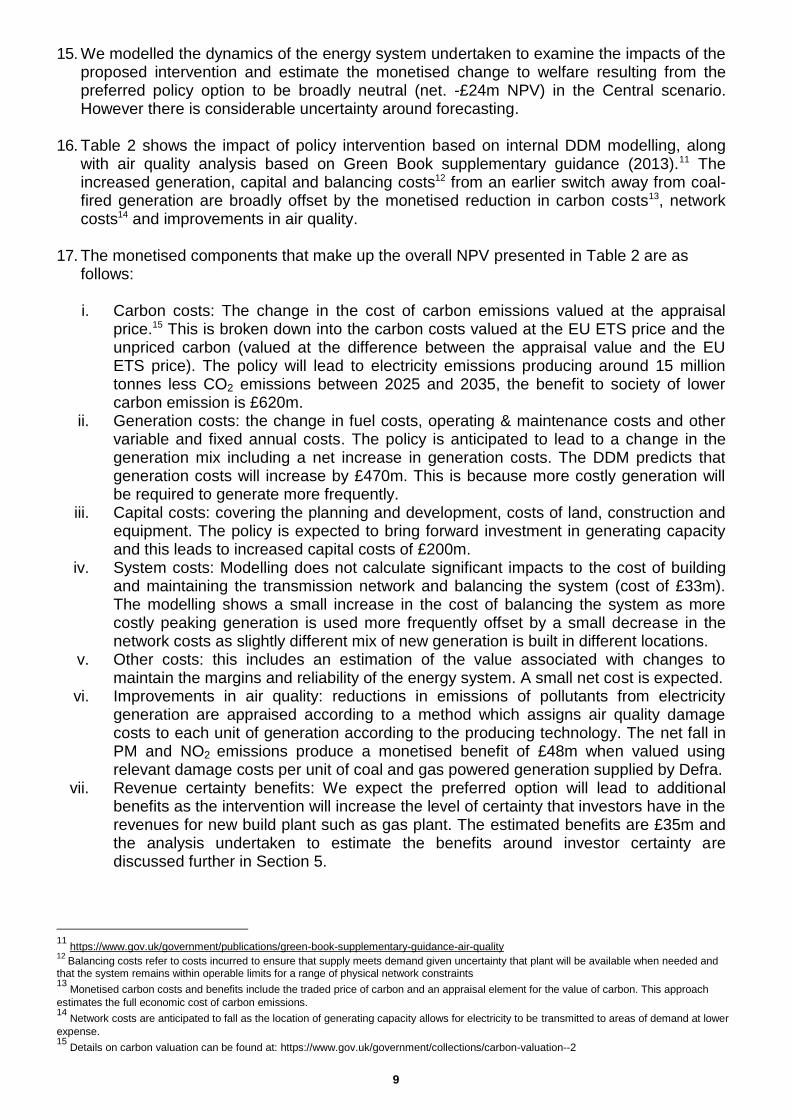
16. Table 2 shows the impact of policy intervention based on internal DDM modelling, along
with air quality analysis based on Green Book supplementary guidance (2013).11 The increased generation, capital and balancing costs12 from an earlier switch away from coal-fired generation are broadly offset by the monetised reduction in carbon costs13, network costs14 and improvements in air quality.
17. The monetised components that make up the overall NPV presented in Table 2 are as
follows:
i. Carbon costs: The change in the cost of carbon emissions valued at the appraisal price.15 This is broken down into the carbon costs valued at the EU ETS price and the unpriced carbon (valued at the difference between the appraisal value and the EU ETS price). The policy will lead to electricity emissions producing around 15 million tonnes less CO2 emissions between 2025 and 2035, the benefit to society of lower carbon emission is £620m.
ii. Generation costs: the change in fuel costs, operating & maintenance costs and other variable and fixed annual costs. The policy is anticipated to lead to a change in the generation mix including a net increase in generation costs. The DDM predicts that generation costs will increase by £470m. This is because more costly generation will be required to generate more frequently.
iii. Capital costs: covering the planning and development, costs of land, construction and equipment. The policy is expected to bring forward investment in generating capacity and this leads to increased capital costs of £200m.
iv. System costs: Modelling does not calculate significant impacts to the cost of building and maintaining the transmission network and balancing the system (cost of £33m). The modelling shows a small increase in the cost of balancing the system as more costly peaking generation is used more frequently offset by a small decrease in the network costs as slightly different mix of new generation is built in different locations.
v. Other costs: this includes an estimation of the value associated with changes to maintain the margins and reliability of the energy system. A small net cost is expected.
vi. Improvements in air quality: reductions in emissions of pollutants from electricity generation are appraised according to a method which assigns air quality damage costs to each unit of generation according to the producing technology. The net fall in PM and NO2 emissions produce a monetised benefit of £48m when valued using relevant damage costs per unit of coal and gas powered generation supplied by Defra.
vii. Revenue certainty benefits: We expect the preferred option will lead to additional benefits as the intervention will increase the level of certainty that investors have in the revenues for new build plant such as gas plant. The estimated benefits are £35m and the analysis undertaken to estimate the benefits around investor certainty are discussed further in Section 5.
11
https://www.gov.uk/government/publications/green-book-supplementary-guidance-air-quality 12
Balancing costs refer to costs incurred to ensure that supply meets demand given uncertainty that plant will be available when needed and that the system remains within operable limits for a range of physical network constraints 13
Monetised carbon costs and benefits include the traded price of carbon and an appraisal element for the value of carbon. This approach
estimates the full economic cost of carbon emissions. 14
Network costs are anticipated to fall as the location of generating capacity allows for electricity to be transmitted to areas of demand at lower
expense. 15
Details on carbon valuation can be found at: https://www.gov.uk/government/collections/carbon-valuation--2
10
18. The DDM-based analysis does not capture some aspects of costs or benefits including familiarisation costs and security of supply impacts, which are discussed below. We consider non-monetised benefits and costs are still likely to accrue, such as those around international leadership, and these are discussed in Section 6.
Table 2: Monetised impact of the Policy Option on Net Total Welfare relative to the baseline, £m discounted to 2017, rounded to two significant figures
NPV of monetised changes to consumer and producer surplus, cumulative to 2035
Option 1 - 2025 stop
Net Welfare Carbon costs 620 Generation costs -470 Capital costs -200 System costs -33 Other costs -18
Improvements in Air Quality 48
Gas certainty benefits 33
Total change in Net Welfare £m -2416
Section 4: Security of Supply Assessment 19. One question about the proposed policy is whether it could make it more costly to ensure
security of electricity supply. This section provides more detail on how the security of supply impacts from coal plant retirement as a result of proposed policy can be mitigated by the Capacity Market and capability to build new plant.
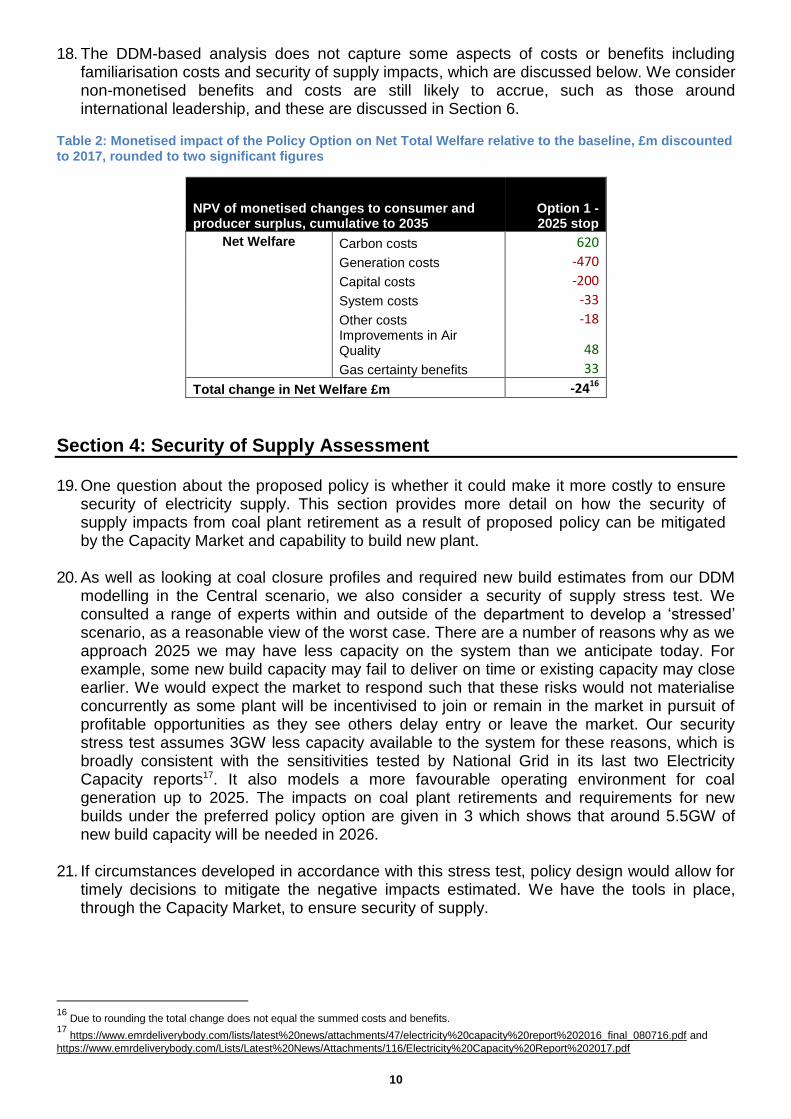
20. As well as looking at coal closure profiles and required new build estimates from our DDM
modelling in the Central scenario, we also consider a security of supply stress test. We consulted a range of experts within and outside of the department to develop a ‘stressed’ scenario, as a reasonable view of the worst case. There are a number of reasons why as we approach 2025 we may have less capacity on the system than we anticipate today. For example, some new build capacity may fail to deliver on time or existing capacity may close earlier. We would expect the market to respond such that these risks would not materialise concurrently as some plant will be incentivised to join or remain in the market in pursuit of profitable opportunities as they see others delay entry or leave the market. Our security stress test assumes 3GW less capacity available to the system for these reasons, which is broadly consistent with the sensitivities tested by National Grid in its last two Electricity Capacity reports17. It also models a more favourable operating environment for coal generation up to 2025. The impacts on coal plant retirements and requirements for new builds under the preferred policy option are given in 3 which shows that around 5.5GW of new build capacity will be needed in 2026.
21. If circumstances developed in accordance with this stress test, policy design would allow for timely decisions to mitigate the negative impacts estimated. We have the tools in place, through the Capacity Market, to ensure security of supply.
16
Due to rounding the total change does not equal the summed costs and benefits. 17
https://www.emrdeliverybody.com/lists/latest%20news/attachments/47/electricity%20capacity%20report%202016_final_080716.pdf and
https://www.emrdeliverybody.com/Lists/Latest%20News/Attachments/116/Electricity%20Capacity%20Report%202017.pdf

11
Table 3: Coal plant retirements and new build fossil fuel plants under policy intervention in the Central coal scenario (rounded to the nearest 0.5GW)
Central Scenario 2018 2019 2020 2021 2022 2023 2024 2025 2026
Coal plant retirements -2 -2.5 - -5 -0.5 - - -1.5 -
New build Fossil fuel plant 1 1 1.0 1.5 - - - 2.5 0.5
Security Stress Test
Coal plant retirements -2 - -0.5 -2 -0.5 -0.5 - -5.5 -
New build Fossil fuel plant 1 1 1.0 1.5 - - - 2 5.5
22. The Capacity Market is designed to provide the economic incentives required to ensure
there is sufficient capacity to meet peak electricity demand.18 Auctions are held four years ahead of the delivery year to allow competition from new build technologies which need the lead time for construction, with further auctions held one year ahead of delivery year.
23. A 2014 study commissioned by DECC suggests that between 4-6GW of new build
Combined Cycle Gas Turbines (CCGT) and Open Cycle Gas Turbines (OCGT) could be brought online per year, with the key constraint being obtaining sufficient skilled labour for the construction and commissioning phase.19 It is acknowledged that there is uncertainty around this rate of new build; BEIS considered further evidence on this matter during the consultation. There was a general consensus that these rates were feasible, but that they might not be sustainable over a period of more than 2-3 years.
24. We are content that even under the stress test, there would be sufficient scope for new build
capacity to replace the loss of more than 5GW of coal in a single delivery year. We anticipate that in such a scenario the advised limit to new build capacity would be tested only in a single year and not over consecutive years. Stakeholders also highlighted that additional technologies such as interconnection, Demand Side Response (DSR) and electricity storage are expected to have a role in safeguarding security of supply by increasing the flexibility and responsiveness of the energy system.
25. Under coal closure scenarios, the demand for any new gas build in the mid-2020s may
temporarily lead to higher construction costs for new build plants. This could occur, for example, if skilled labour is required to be diverted from other industries, pushing up labour costs. A report commissioned by the department and prepared by Parsons Brinckerhoff provides estimates of the supply curve for CCGT and OCGT plants that is used within our modelling. The possibility of increased capital costs is viewed as low risk, as the highest estimated build rate of new fossil fuel power plant in the UK during the 2020s under the Central coal closure scenario is 2.5 GW in 2025.
Section 5: Reduced hurdle rates for new build capacity 26. Coal and gas plants compete for wholesale market revenue and there remains a degree of
uncertainty around the expected revenue for power stations because of the dependency on factors such as fossil fuel prices.
27. Clarifying the closure date for coal provides revenue certainty to other technologies, which
reduces risk and subsequently the cost of capital. This helps to mitigate the effects of the market failure arising from imperfect information, reducing the hurdle rate that investors require to invest in new build plant.
18
Further information on the Capacity Market can be found at https://www.gov.uk/government/collections/capacity-market-2016 19
https://www.gov.uk/government/uploads/system/uploads/attachment_data/file/315717/coal_and_gas_assumptions.PDF

12
28. Monetising the reduction in uncertainty for investors in new build capacity is difficult as
uncertainty in new build cash flows is driven by a number of market factors. Where new capacity is financed through corporate debt, these financing costs will depend more on overall company investment profiles. While each lender/investor may have views that differ from the others in the market, we attempt to quantify the effect of this certainty for new gas plant (CCGT) using DDM scenarios and rates of returns assumed based on recent market experience of investment in related assets20. This analysis is summarised below but more detail can be found in Annex C.
29. When deciding how much to lend, lenders are likely to take a pessimistic view of wholesale
market revenues of other technologies and consider a case wherein coal eats into the utilisation rate of other technologies. The utilisation rate is the ratio of the time that the capacity is generating energy and earning revenue, to the total time that it could be generating. With unabated coal in the generation mix the upside revenues as an equity holder will be regarded as riskier and will be discounted by investors more heavily (i.e. at an equity rate that is higher than the hurdle rate).
30. The estimated benefits are calculated for a single proxy gas plant as indicative of the
benefits stemming from the reduction of risk and the effects on cost of capital. While impacts may be felt more widely, the benefits are uncertain and we consider the impact on one proxy plant as a conservative estimate of the expected benefits.
31. Our analysis looks at two financing scenarios to estimate conservative benefits of certainty to the gas plant from coal closure:
1) No coal closure:
a. Wholesale market revenues from the coal favouring sensitivity baseline – Using the
coal favouring baseline reflects conservative assumptions that lenders may use to lend to a gas plant at the project hurdle rate; this assumes lower carbon price floor trajectory and low fossil fuel price assumptions for coal than the Central baseline scenario. Under these assumptions coal continues to generate after 2025, wholesale prices are lower and gas plant get a lower share of these revenues.
b. Additional revenues from the Central baseline – This is to estimate the upside revenues that a lender would perceive as more risky due to competitiveness in relation to coal being sensitive to uncertain fossil fuel prices, for which an equity rate would be more appropriate (see Section 4).
c. Capacity market revenues from Central baseline – Using the Central baseline reflects a conservative view as capacity market revenues are lower than under a coal favouring scenario where the capacity market21 clears at a higher level to compensate for lower wholesale price revenues. We assume these can be leant against at project hurdle rate.
2) Coal closure:
20
The project hurdle rate used to estimate the benefits is the Weighted Average Cost of Capital (WACC) of 7.8% assumed in the DDM for new
CCGT. The equity return is calculated as 11.8%. The table below shows the steps and results for estimating certainty benefits for proxy gas plant. For further information see: http://www.nera.com/content/dam/nera/publications/2016/NERA_Hurdle_Rates_for_Electricity_Generation_Technologies.pdf 21
The Capacity Market is fixed payment per kW of capacity determined in an auction to ensure there is enough capacity to ensure security of
supply. It differs from the wholesale market which is based on units of kWh of generation and ensures there is sufficient investment signals to build new plant or keep existing plant open. If plants are expected to be well remunerated in the wholesale market, we would expect capacity market bids to be low. More information on the capacity market can be found at: https://www.gov.uk/government/collections/electricity-market-reform-capacity-market
13
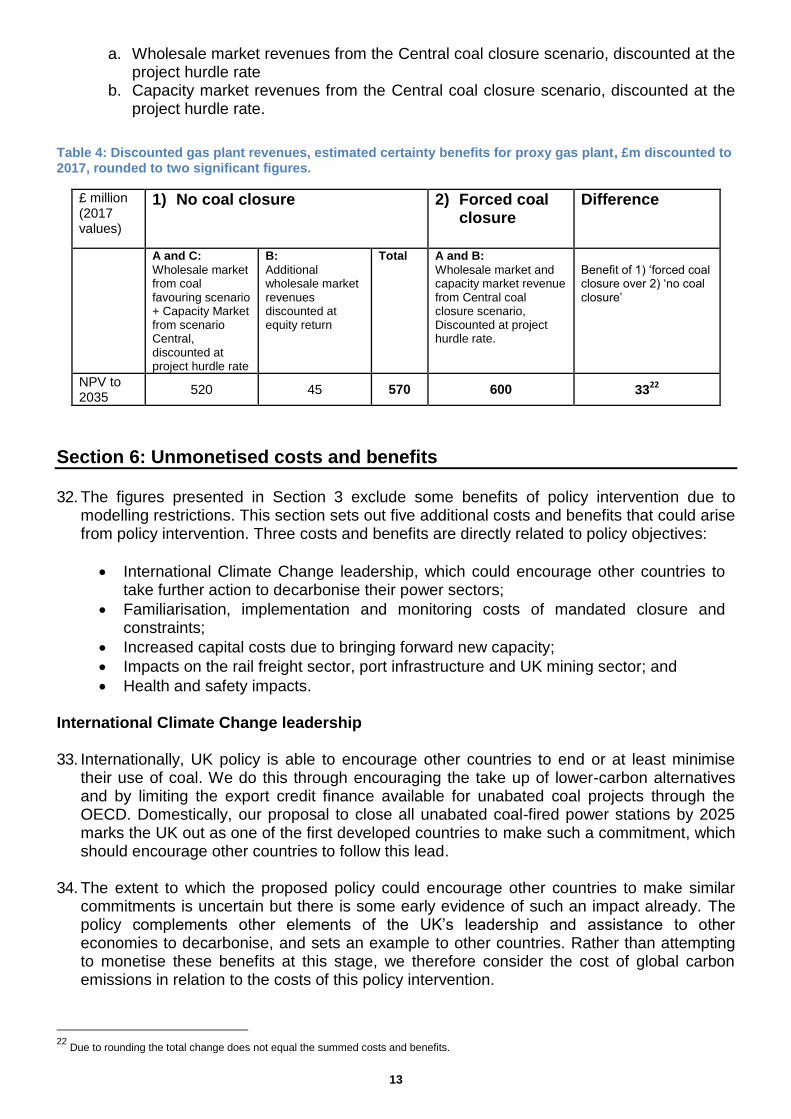
a. Wholesale market revenues from the Central coal closure scenario, discounted at the project hurdle rate
b. Capacity market revenues from the Central coal closure scenario, discounted at the project hurdle rate.
Table 4: Discounted gas plant revenues, estimated certainty benefits for proxy gas plant, £m discounted to 2017, rounded to two significant figures.
£ million (2017 values)
1) No coal closure 2) Forced coal closure
Difference
A and C:
Wholesale market from coal favouring scenario + Capacity Market from scenario Central, discounted at project hurdle rate
B:
Additional wholesale market revenues discounted at equity return
Total A and B:
Wholesale market and capacity market revenue from Central coal closure scenario, Discounted at project hurdle rate.
Benefit of 1) ‘forced coal closure over 2) ‘no coal closure’
NPV to 2035
520 45 570 600 3322
Section 6: Unmonetised costs and benefits 32. The figures presented in Section 3 exclude some benefits of policy intervention due to
modelling restrictions. This section sets out five additional costs and benefits that could arise from policy intervention. Three costs and benefits are directly related to policy objectives:
International Climate Change leadership, which could encourage other countries to take further action to decarbonise their power sectors;
Familiarisation, implementation and monitoring costs of mandated closure and constraints;
Increased capital costs due to bringing forward new capacity;
Impacts on the rail freight sector, port infrastructure and UK mining sector; and
Health and safety impacts.
International Climate Change leadership 33. Internationally, UK policy is able to encourage other countries to end or at least minimise
their use of coal. We do this through encouraging the take up of lower-carbon alternatives and by limiting the export credit finance available for unabated coal projects through the OECD. Domestically, our proposal to close all unabated coal-fired power stations by 2025 marks the UK out as one of the first developed countries to make such a commitment, which should encourage other countries to follow this lead.
34. The extent to which the proposed policy could encourage other countries to make similar
commitments is uncertain but there is some early evidence of such an impact already. The policy complements other elements of the UK’s leadership and assistance to other economies to decarbonise, and sets an example to other countries. Rather than attempting to monetise these benefits at this stage, we therefore consider the cost of global carbon emissions in relation to the costs of this policy intervention.
22
Due to rounding the total change does not equal the summed costs and benefits.
14
35. Global carbon emissions from the power sector are forecast to be around 13GtCO2 per year between 2020 and 203023. Monetising the cost of these emissions using BEIS’s social cost of carbon estimates results in an approximate NPV of £5,960bn over this time period. Even a small proportionate reduction in global carbon emissions as a result of the proposed policy would therefore have significant benefits. Although the direct benefits will accrue outside the UK’s boundaries, and so are not included in NPV figures for this Impact Assessment, there will be indirect benefits for the UK from lower global emissions.
Familiarisation, implementation and monitoring costs 36. In addition to the consideration of familiarisation costs, implementing and monitoring
regulations would involve further impacts for government, regulators and businesses in terms of labour and resource requirements.
37. Stakeholders provided limited information on these impacts during the consultation (none of
the responses to consultation flagged significant one-off impacts from this policy change). As mentioned above, this policy will be taken forward with future legislation; therefore the government will continue to work with stakeholders as this policy is refined in order to robustly estimate these impacts. However, we think these impacts may be small when compared to wider NPV estimates. This is because:
The long forward notice provided to industry of the preferred policy option
The small number of coal power station operators who operate wide energy portfolios
The government is committed to minimise the implementation impacts on all stakeholders involved from this regulatory change
Macroeconomic impacts
38. The DDM analysis in Section 3 presents estimated change in net present value of relevant
economic activity. Whilst this provides comprehensive quantification of the costs and benefits from changing electricity sector activity, it does not take into account:
Frictions involved in moving resources from one sector to another, which can reduce economic activity in the short term and create local impacts as described in the local impacts section below; and
Whether the value added and the supply chain is in the UK or abroad.
39. Two sectors that may be impacted are the transport and coal mining sectors. The distributional and localised impacts in these sectors are discussed further in Section 7. Transport
40. Coal has historically accounted for a significant portion of rail freight activity. It accounted for 8% of rail freight demand (on a net-tonne-km basis) in 2016/17, falling sharply from 29% in 2014/15. We would expect a further decline in the quantity of rail freight in future in the absence of the intervention, as shown by analysis of the expected trajectory for coal capacity in the counterfactual24. According to this trajectory, if other components of rail freight were maintained at 2016/17 levels, coal would account for 3-5% of rail freight demand in the period after 2025 in the absence of intervention. Whilst these figures include
23
IEA World Energy Outlook (2016) 24
Office of Rail Regulation (ORR), Rail Freight Statistics http://orr.gov.uk/statistics/published-stats/statistical-releases

15
coal transport for all end uses, the power sector accounted for 78% of UK coal demand in 2015 and 67% in 2016 25 this fall in relative proportions is likely to continue.
41. Coal imports have also generated a level of activity around UK ports which we expect to
decline in future along similar trajectories both for the preferred option and the counterfactual. We have already witnessed a significant fall in activity; from 2013 to 2016 coal imports fell from 51m tonnes to 8.5m tonnes. In anticipation of a further reduction in demand for coal imports, some ports have found new markets and made efforts to re-orientate their business. The effect on ports overall will depend on the opportunities presented and their ability to find new markets but there is evidence of growth potential in biomass, recycled materials and materials to support new low carbon renewable generation. For example, Peel Ports is investing £100m at Liverpool to handle biomass imports for Drax power station26.
42. Although the prospects for demand for coal transport are negative under the proposed policy
option, a similar trajectory for decline is anticipated in the counterfactual. The increased activity anticipated from alternative technologies and new generation could offset this reduction to a considerable degree.
UK coal mining
43. The power sector is the major consumer of coal mined in the UK: in 2016 88% of the coal
mined in the UK was steam coal, and the power sector accounts for 86% of steam coal consumption in the UK.27
44. UK demand for steam coal for power generation fell by 59% in 2016 compared to 2015, and
UK production fell by 51% between 2015 and 2016. We expect utilisation of steam coal to continue to fall ahead of the 2025 intervention; this decline will be correlated with the decline in coal capacity outlined in Figure 1. This evidence suggests the proposed policy option is therefore unlikely to have a significant impact on the UK coal mining sector. While after 2025 there will be no demand for steam coal for power generation, we anticipate there will remain demand for coal in other sectors.
Health and Safety Impacts
45. The beneficial health impacts of the preferred option are demonstrated as a monetised
benefit from air quality improvements. This benefit is considerable and valued at £40m in the Central case, with the benefits concentrated in the locality of the power stations. The air quality impacts are estimated on the basis of bespoke modelling of coal powered generation in GB. This estimates an air quality damage cost associated with each unit of electricity generated from coal. The total air quality benefit is the result of the reduction in damage costs associated with coal fired generation after taking into account any offsetting impacts from non-coal generation. In addition to this significant benefit, wider health impacts were considered.
46. Considerable regulation governs employment in coal-fired power stations to ensure
employee health and safety. This is shown by a very strong track record on accidents and injuries at work. We anticipate that the preferred option will encourage the move away from coal generation among the technologies that generate electricity. The likely replacement
25
DUKES 2017 Table 2.4 https://www.gov.uk/government/statistics/solid-fuels-and-derived-gases-chapter-2-digest-of-united-kingdom-energy-
statistics-dukes 26
Financial Times, accessed October 2017. https://www.ft.com/content/e1315d6e-29a1-11e6-8b18-91555f2f4fde?mhq5j=e5 27
DUKES 2017 Table 2.4 https://www.gov.uk/government/statistics/solid-fuels-and-derived-gases-chapter-2-digest-of-united-kingdom-energy-
statistics-dukes
16
technologies are not considered to represent working conditions which are materially more or less rigorously safe for employees. The health and safety impacts of the proposed option on current and future staff in the electricity generating industry are therefore not considered to be material.
47. Although the health impacts of coal mining have been well publicised and are historically
significant, safety and working practices in the industry are now heavily regulated. The effect of updated practices, in addition to the reduction in employment in coal mining, has seen considerable reductions in the rates of injury. However, seven fatalities have been recorded in UK coal mines in the last 25 years. As highlighted above, evidence suggests the proposed policy option is unlikely to have a significant impact on the UK coal mining sector and the knock on effects through health and safety in mines are not considered to be material.
Section 7: Distributional Impacts
48. In the Central scenario, the policy intervention will have some distributional impact on market participants. Modelling suggests the policy will lead to a transfer from consumers to producers. This indicates that the additional generation and capital costs that occur from the restriction on coal plant are partly passed on to consumers. The intuition behind this is that the model assumes the marginal plant sets prices in the wholesale and capacity market, so cost increases to plants around the margin can be passed on to consumers.
49. This suggests that the policy has the effect of removing some supply from the market
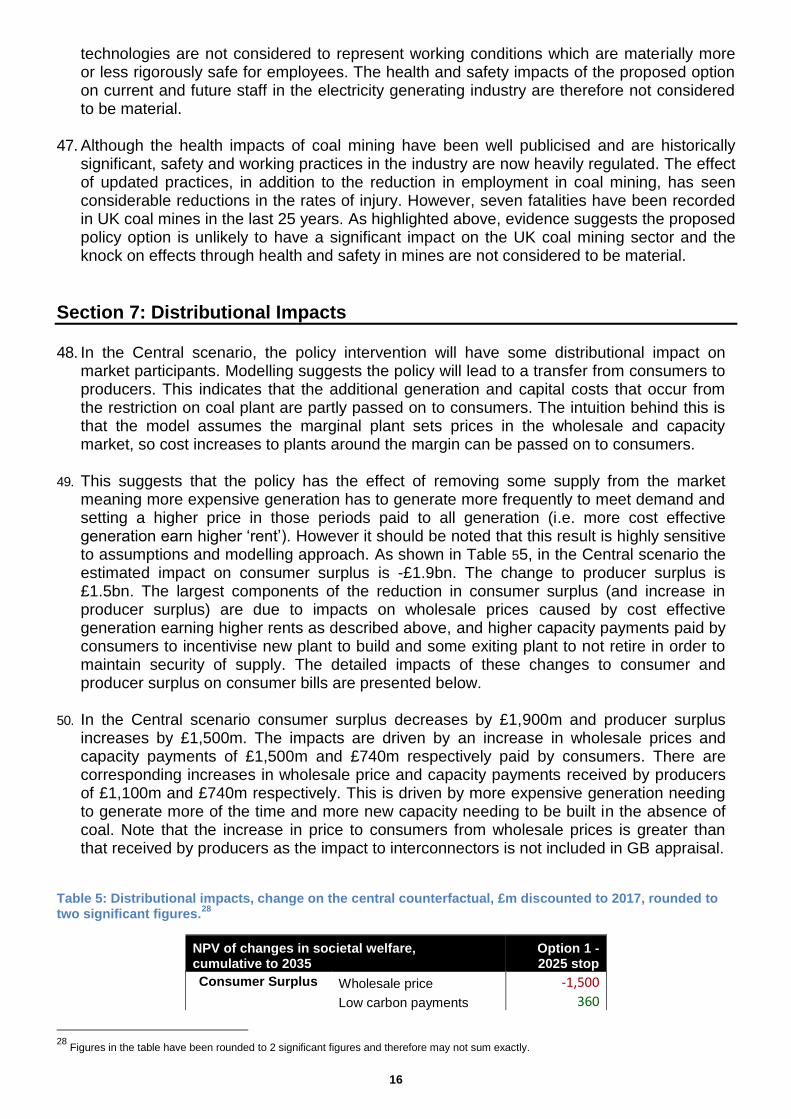
meaning more expensive generation has to generate more frequently to meet demand and setting a higher price in those periods paid to all generation (i.e. more cost effective generation earn higher ‘rent’). However it should be noted that this result is highly sensitive to assumptions and modelling approach. As shown in Table 55, in the Central scenario the estimated impact on consumer surplus is -£1.9bn. The change to producer surplus is £1.5bn. The largest components of the reduction in consumer surplus (and increase in producer surplus) are due to impacts on wholesale prices caused by cost effective generation earning higher rents as described above, and higher capacity payments paid by consumers to incentivise new plant to build and some exiting plant to not retire in order to maintain security of supply. The detailed impacts of these changes to consumer and producer surplus on consumer bills are presented below.
50. In the Central scenario consumer surplus decreases by £1,900m and producer surplus
increases by £1,500m. The impacts are driven by an increase in wholesale prices and capacity payments of £1,500m and £740m respectively paid by consumers. There are corresponding increases in wholesale price and capacity payments received by producers of £1,100m and £740m respectively. This is driven by more expensive generation needing to generate more of the time and more new capacity needing to be built in the absence of coal. Note that the increase in price to consumers from wholesale prices is greater than that received by producers as the impact to interconnectors is not included in GB appraisal.
Table 5: Distributional impacts, change on the central counterfactual, £m discounted to 2017, rounded to two significant figures.
28
NPV of changes in societal welfare, cumulative to 2035
Option 1 - 2025 stop
Consumer Surplus Wholesale price -1,500
Low carbon payments 360
28
Figures in the table have been rounded to 2 significant figures and therefore may not sum exactly.

17
Capacity payments -740
System costs (demand) -69
Other costs -18
Change in Consumer Surplus -1,900
Producer Surplus Wholesale price 1,100
Low carbon support -360
Capacity payments 740
Producer costs 15
Change in Producer Surplus 1,500
Environmental Tax Change in Environmental Tax Revenue -12
Societal benefit Change Carbon Externality 370
Improvements in Air Quality 48
Total change in Net Welfare -24
Local Impacts 51. It is important to consider the local impacts of the policy option to close coal plants as the
frictions involved in the changes in economic activity resulting from coal closure can have significant impacts at a local level where this activity was previously concentrated. A qualitative approach is used to examine the local impacts of the policy to close coal, with reference to the additionality of the policy against the counterfactual.
52. In October 2017 there were 13 mines operating - 3 (minor) underground29 mines and 10
surface mines. Total employment was 62930. UK domestic coal production in 2016 was at a record low of 4 million tonnes. This compares to around 30 million tonnes at the beginning of the 2000s.
53. Direct employment at coal fired power stations was estimated as ~2,900 in 2015, based on
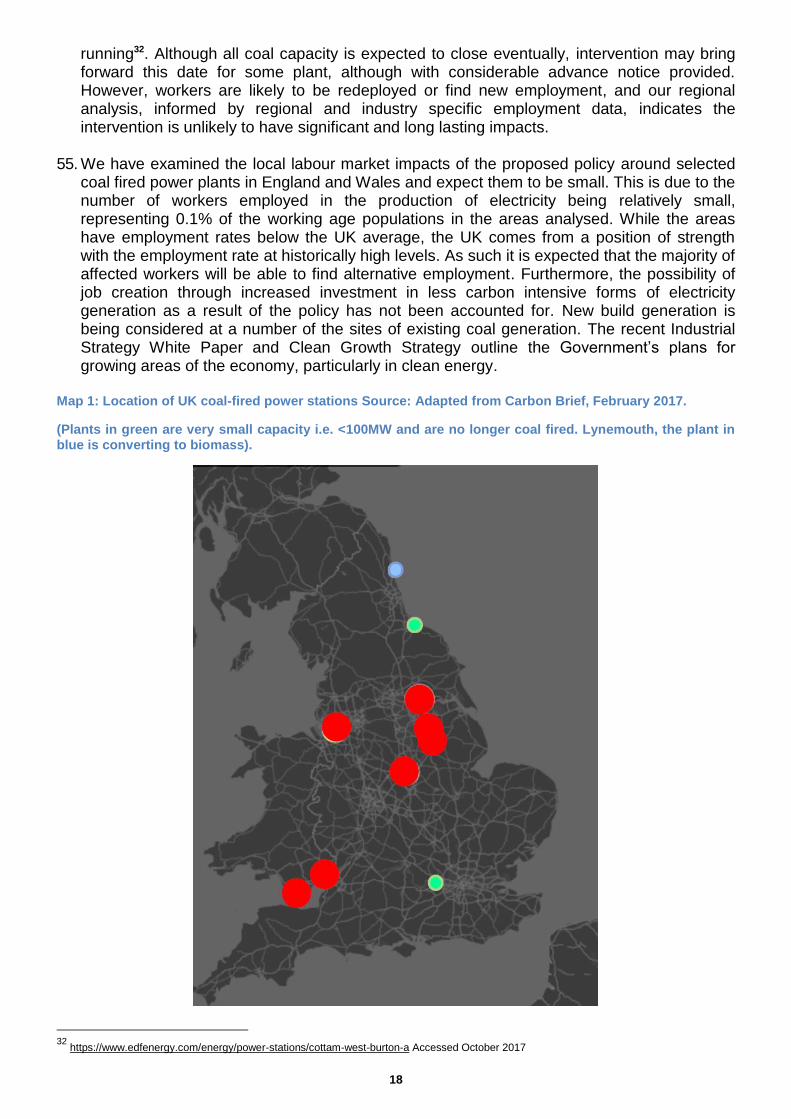
published employment figures by operators. This figure has since fallen due to further plant closures in 2016. As of mid-2017, the best estimates of employment in coal mining and power generation are 2500-3000 in total. Given the decline in coal generation, and following predicted retirements of coal plants prior to 2025 in the central scenario, we therefore expect the additional reductions in power generation employment as a direct result of the proposed policy to be limited. Furthermore, more employment may potentially be created in less carbon intensive power generation sectors. Map 1 below shows the location of UK coal power stations in the UK, and demonstrates a relative concentration in the north of England, with a relatively large generator in Wales.
54. Analysis of our Central scenario indicates that the preferred policy option may have an effect
on employment. Analysis of the counterfactual indicates coal generating capacity of around 1.5GW would otherwise stay online beyond 2025. In general terms, based on data published by EDF Energy31, we understand that a power station with capacity of 2GW has between 220 and 250 employees, and around 175 contract partners employed to keep the station
29
The remaining underground mines are not large scale commercial operations (all of which are closed as of December 2015). Data available
for 2017 (covering January to July) show that underground mines have produced less than 1% of total UK coal output over the period. 30
Coal authority data provided to BEIS 31
For example, see www.edfenergy.com/energy/power-stations/cottam-west-burton-a
18
running32. Although all coal capacity is expected to close eventually, intervention may bring forward this date for some plant, although with considerable advance notice provided. However, workers are likely to be redeployed or find new employment, and our regional analysis, informed by regional and industry specific employment data, indicates the intervention is unlikely to have significant and long lasting impacts.
55. We have examined the local labour market impacts of the proposed policy around selected
coal fired power plants in England and Wales and expect them to be small. This is due to the number of workers employed in the production of electricity being relatively small, representing 0.1% of the working age populations in the areas analysed. While the areas have employment rates below the UK average, the UK comes from a position of strength with the employment rate at historically high levels. As such it is expected that the majority of affected workers will be able to find alternative employment. Furthermore, the possibility of job creation through increased investment in less carbon intensive forms of electricity generation as a result of the policy has not been accounted for. New build generation is being considered at a number of the sites of existing coal generation. The recent Industrial Strategy White Paper and Clean Growth Strategy outline the Government’s plans for growing areas of the economy, particularly in clean energy.
Map 1: Location of UK coal-fired power stations Source: Adapted from Carbon Brief, February 2017.
(Plants in green are very small capacity i.e. <100MW and are no longer coal fired. Lynemouth, the plant in blue is converting to biomass).
32
https://www.edfenergy.com/energy/power-stations/cottam-west-burton-a Accessed October 2017

19
20
Section 8: Overall assessment
56. The impact of this policy depends on the balance between two sets of factors:
i. The monetised costs and benefits on the electricity system, impact on new build plant and security of supply.
ii. The non-monetised benefits and costs, including international climate leadership, localised economic impacts and effects on capital costs.
57. In the Central scenario, the policy affects the electricity generation mix by eliminating coal-
fired generation. We consider that the monetised costs and benefits result in the policy having a broadly cost neutral impact on society. It is important to note that this does not take account of the positive impact these proposals have allowed us to have on forming an alliance to phase out coal global coal use.
Section 9: Small and micro business assessment
58. The policy will apply to SMEs; however, none are expected to be affected by the policy
change, as coal plant owners and operators are large business. These are therefore not analysed within this Impact Assessment as no coal plants operators qualify as a small or micro business, which under the Better Regulation framework are businesses that employ fewer than 50 FTE employees.
Section 10: Business Impacts 59. The Business Impact Target for this parliament still needs to be agreed. Table 6 below
shows indicative impact to businesses in the Central and sensitivities scenarios, relative to the counterfactuals ordered from most direct to least direct where it has been possible to monetise them. A positive value means an increase in business costs relative to the counterfactual and a negative value means a saving. By direct we mean that the impact is incurred as a result of the policy option without further actions by government or industry as a conscious response. Once the new metric is decided for the Business Impact Target, further work will be undertaken on estimating the business impact from this change.
60. Impacts relating to electricity generator profits and electricity consumer costs have been calculated using the outputs from the DDM power sector Central and sensitivities scenarios described in Section 3. It is important to note that the reduced financing costs for new build plant are not accounted for below as our current view is that they are not classified as a direct impact. The appraisal period is 18 years (2017-2035) as although the policy measures take effect in 2025 the modelled impact on industry of the planned policy to close unabated coal starts in 2017.
61. The most direct costs are the lost profits to coal plant from closing. We estimate these
foregone profits to cost £250m in the Central Scenario. 62. The reduction in profits for coal plant will lead to an increase in profits for other forms of
generation, which in some cases will be owned by the same companies that own coal plants. The resulting change in profitability could be classed as a transfer between businesses. For other generating technologies, the estimated impact on profits in the Central scenario is an increase of £1,700m.
21
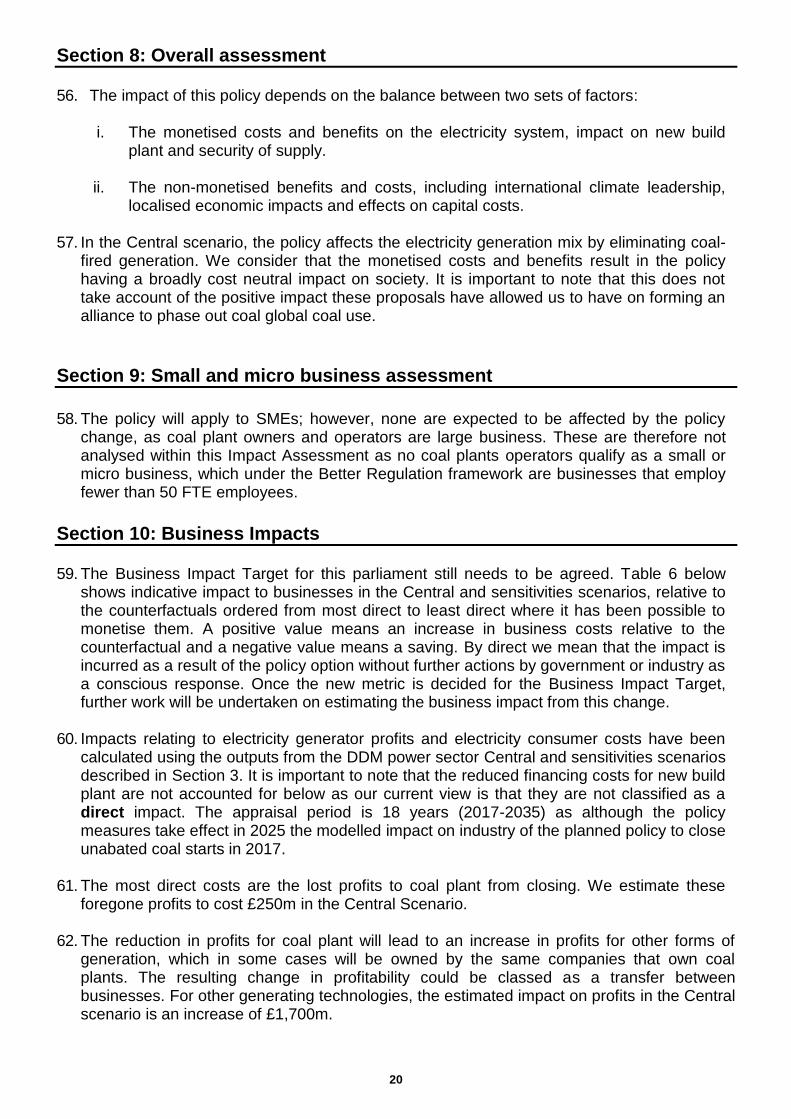
63. We also consider the impact to business consumers of energy which in the Central scenario we estimate to be around £-1,300m. 33
64. Overall, this leads to net impact to generators and business consumers in the Central scenario of £170m, which gives an EANDCB of -£11m.
Table 6: Net direct costs and benefits to plants under the proposed intervention for the central scenario, NPV and EANDCB, £m, rounded to two significant figures.
NPV EANDCB
Central Low Coal Price
Security Stress Test
Central Low Coal Price
Security Stress Test
Coal generators -250 -1000 -1300 16 63 79
Other generators 1700 2500 870 -110 -160 -55
Total generators 1400 1500 -380 -91 -95 24
Business consumers -1300 -2100 -850 80 140 54
Total generators and business consumers 170 -640 -1200 -11 41 7834
33
The DDM calculates impacts to consumers covering all elements of the bill including wholesale prices, costs of policy to support low carbon
generation and costs to maintain and operate the system. Costs to maintain and operate the system include expenditure on transmission networks to connect up new generation and reinforce existing networks and operational expenditure to continually keep the system operating within a number of physical engineering constraints on a minute by minute basis. Currently around two thirds of consumption is by non-domestic users, which is the assumption we use to estimate the proportion of impact falling to business consumers here. 34
Figures in the table have been rounded to 2 significant figures and therefore may not sum exactly.
22
Annex A: Impacts on consumer bills
1. Impacts of policy options on consumer electricity bills have been estimated using BEIS’s Prices & Bills model, that takes into account the changes in wholesale and retail prices and policy pass-through costs that result from implementing the regulation. The analysis covers the appraisal period.
2. The consumer bill impacts estimated to result from the policy intervention in the Central
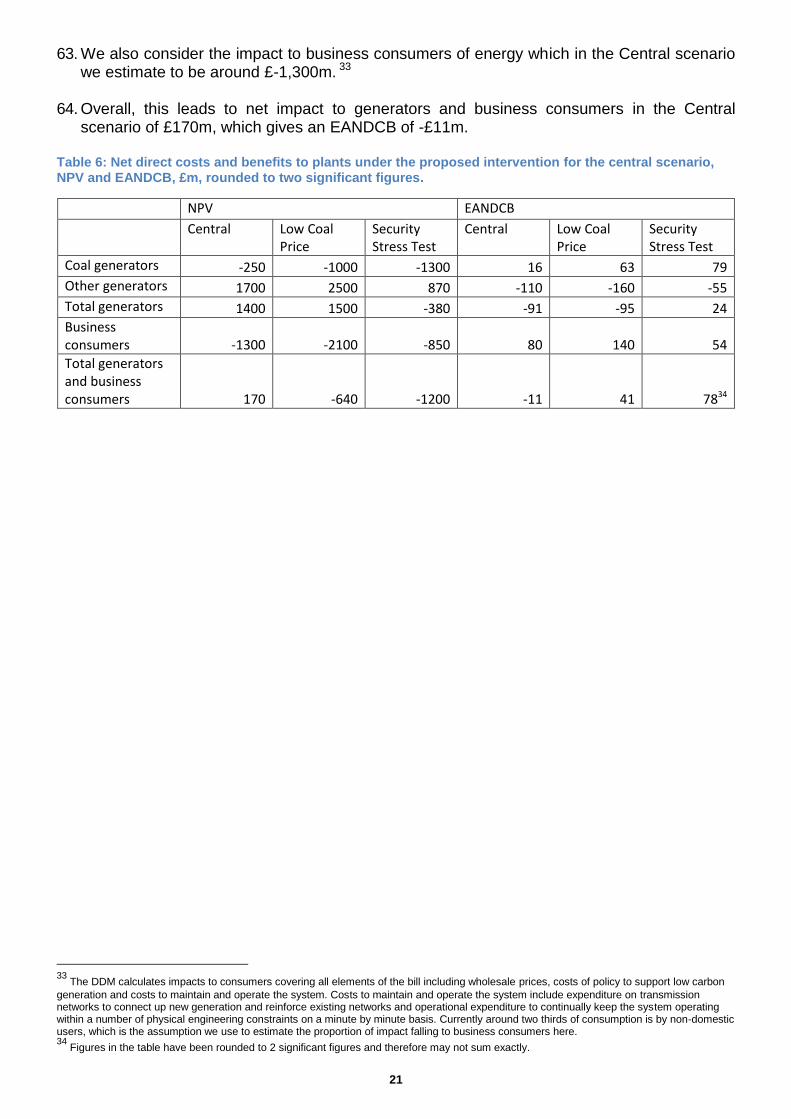
scenario are summarised in Figure 1 below and are expected to be minimal. On average, the policy to end unabated coal electricity generation accounts for less than 1% of a household energy bill. The total share of policy costs on an average household energy bill is estimated to be highest in 2026 where it will add 2% to an average bill. For businesses the expected impact is also very small, also accounting for less than 1% of energy bills on average over the appraisal period. Quantification of bill impacts into monetary values is not undertaken due to the uncertainty around the counterfactual.
Figure 1: Impact of monetised elements of proposed option on consumer bills, % change relative to the counterfactual, average over 2021-2030
23
Annex B: Dynamic Dispatch Model The DDM is an Electricity Supply Model, which allows analysis of the impact of different policy decisions on dispatch and investment decisions. The DDM models the power sector in Great Britain in the medium to long term - out to 2050. This allows us to answer questions about the impact of policies on:
Electricity supply
Emissions
Wholesale electricity prices
Balancing costs
Network costs The DDM employs two key algorithms: Dispatch algorithm:
Determines which plants generate electricity in each half hour based on their running costs/short run marginal cost.
Makes adjustments to generation levels to maintain system security. Investment algorithm:
Determines the amount of capacity based on expected costs and revenues. The model can run up to 2050 (although assumptions after 2030 are particularly difficult). The wide range of outputs from the model includes:
Generation by technology (N.B. total demand is an input)
Total capacity
Retirements (economic and regulatory)
New build
Wholesale prices
Emissions
Policy costs
CBA - cost benefit analysis Limitations
Deterministic – assumes certainty about the state of the world – investment decisions based on 5 year foresight from decision point
Does not model generator portfolios
Does not tell us the optimal mix of technologies to decarbonise or ensure security of supply – strike prices are a user-defined input.
Modelling of interconnectors is simplistic. European prices are not modelled.
It can be sensitive to small changes in assumptions - results are highly dependent on initial parameters.
There are many assumptions. The model is reliant on a possibly suboptimal evidence base for some assumptions
CBA excludes costs post-2050, so need similar decarbonisation trajectory between scenarios (otherwise delaying decarbonisation looks good as more costs post-2050)

24
The uncertainty inherent in energy modelling mean that results should be used to explore the possible impact of different scenarios / test the impact on a proposed policy; not to predict the future. This is why we try to look at the difference in model outputs (particularly CBA) not absolute values.

25
Annex C: Revenue certainty benefits Hypothesis Legislated coal closures make revenues for new build CCGTs more certain and improve their investment case. Qualitative Arguments
Gas is kept competitive compared to Coal by means of Carbon Price Support, which is a tax policy and usually discounted by lenders
When deciding how much to lend, lenders are likely to take a pessimistic view of wholesale market revenues of CCGT and consider a consider a case wherein Coal eats into the load factors for Gas
The upside revenues as an equity holder may see will be regarded as riskier and will be discounted by investors more heavily
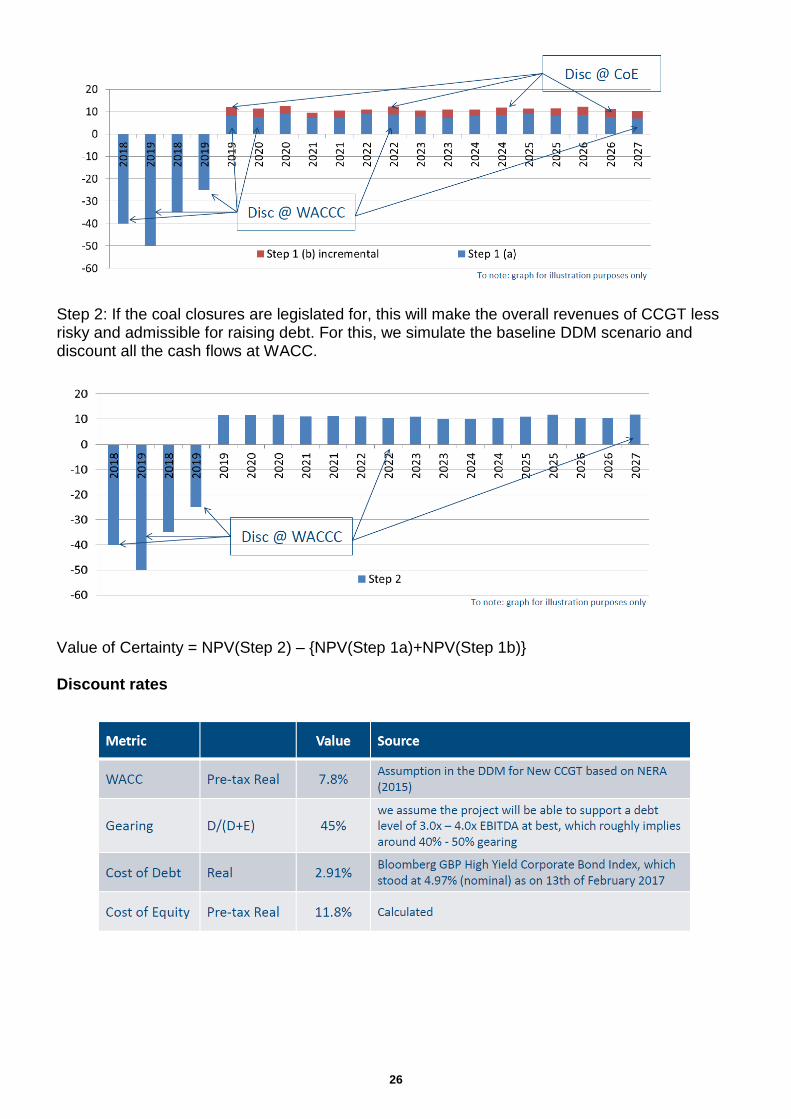
While each lender/investor may have in-house views that differ from the others in the market, we attempt to quantify the effect of this certainty using DDM scenarios and rates of returns assumed based on recent experience. Quantitative Analysis Step 1a: We start with simulating a Coal favouring case using DDM and record the wholesale market revenues for CCGT. We expect the load factors for CCGT to be lower as coal takes more of the market share. This is the sort of scenario that lenders may consider when sizing their debt (determining how much to lend).
We discount the cash flows at the Weighted Average Cost of Capital (WACC). Step 1b: Revenues over and above that from the conservative simulation will be deemed risky and will be discounted more heavily by the investors. We use the Cost of Equity (CoE) as the high discount rate for incremental revenues.
26
Step 2: If the coal closures are legislated for, this will make the overall revenues of CCGT less risky and admissible for raising debt. For this, we simulate the baseline DDM scenario and discount all the cash flows at WACC.
Value of Certainty = NPV(Step 2) – {NPV(Step 1a)+NPV(Step 1b)} Discount rates