title of the phd thesis - opus 4 · title of the phd thesis cultural landscape changing due to...
TRANSCRIPT

Brandenburg University of Technology at Cottbus Faculty of Environmental Sciences and Process Engineering Department of Ecosystems and Environmental Informatics International Study Course Environmental and Resource Management
Title of the PhD Thesis
Cultural Landscape Changing due to Anthropogenic Influences on Surface
Water and Threats to Mangrove Wetland Ecosystems: A Case Study on the
Sundarbans, Bangladesh A thesis approved by the Faculty of Environmental Sciences and Process
Engineering at the Brandenburg University of Technology at Cottbus in partial
fulfillment of the requirement for the award of the academic degree of Doctor of
Philosophy (Ph.D.) in Environmental and Resource Management.
By
B.Sc. (Honours), M.Sc., M.A.
Md. Shafi Noor Islam
From Jamalpur, Bangladesh
Supervisor : Professor Dr. rer. nat. habil. Albrecht Gnauck Supervisor : Professor Dr. rer. nat. habil. Hans-Jürgen Voigt Date of the oral examination: 25th June 2008

Brandenburgische Technische Universität Cottbus Fakultät für Umweltwissenschaften und VerfahrenstechnikLehrstuhl für Ökosysteme und Umweltinformatik Internationale Studiengang Umwelt-und Ressourcen Management
Titel der Dissertation
Veränderung einer Kulturlandschaft infolge anthropogener Einflüsse auf
Oberflächengewässer und Bedrohung von Mangrovenökosystemen am Beispiel
der Sundarbans, Bangladesch
Von der Fakultät für Umweltwissenschaften und Verfahrenstechnik der
Brandenburgischen Technischen Universität Cottbus zur Erlangung des
akademischen Grades eines Doktor of Philosophy (Ph.D.)
genehmigte Dissertation.
Von
B.Sc. (Honours), M.Sc., M.A.
Md. Shafi Noor Islam
Aus Jamalpur, Bangladesch
Gutachter : Professor Dr. rer. nat. habil. Albrecht Gnauck Gutachter : Professor Dr. rer. nat. habil. Hans-Jürgen Voigt
Tag der mündlichen Prüfung : 25th June 2008
ii
Brandenburg University of Technology at Cottbus Faculty of Environmental Sciences and Process Engineering Department of Ecosystems and Environmental Informatics International Study Course Environmental and Resource Management
Declaration
I, Shafi Noor Islam, hereby declare that this thesis has been written independently. It has not been published anywhere before. Where materials of other authors were used as, due reference and acknowledgement has been stated properly. ......................................... Md. Shafi Noor Islam Cottbus, 30th November 2007
iii

Acknowledgements
A Doctorate research endeavour is always accomplished with the assistance of many experts, so any attempt to acknowledge them by name who rendered services is impossible and for this I am sorry and ask for their understanding. It is my ardent task to record my debt to my supervisors Professor Dr. rer. nat. habil. Albrecht Gnauck, Chair of Ecosystems and Environmental Informatics and Professor Dr. rer. nat. habil. Hans-Jürgen Voigt, Chair of Environmental Geology, Brandenburg University of Technology at Cottbus, Germany. I must acknowledge in stimulating my ideas in different ways and remain obliged for the energetic care with which they have gone over the manuscript of my research and for improving and clarifying the exposition of the statements.
I got background information from; Mangrove Ecosystems, Functions and Management by Lacerda, L.D.D, Springer Verlag, Berlin. The Mangrove of Sundarbans, Volume Two: Bangladesh by Zakir Hossain and Gaytri Acharia, IUCN, Bangkok. Mangrove Forestry in Bangladesh by Siddiqi, N.A, University of Chittagong, Surface Water Modelling of Sundarbans Biodiversity Conservation Project Report 2003 supplied by IWM-Dhaka, with important technical-hydrological terms, informations, definitions and data to these books which I used very openly in my dissertation, I acknowledge my debt. Beside these Soil Resource Development Institute-SRDI, Bangladesh Centre for Advance Studies, CEGIS-Dhaka, Forest Department, Department of Environment and Forestry, Centre for Integrated Rural Development Programme for Asia and the Pacific-CIRDAP, Rupantar, CDS, BARCIK the national NGOs in Bangladesh they supplied me a lot of information and reference reports.
I am grateful to Professor Dr. Maudood Elahi, Professor Mesbah-Us-Saleheen, Department of Geography and Environment, Jahangirnagar University, Dhaka. Professor Dr.A.H.M.A. Baqee University of Dhaka, Professor Dr.A.K.M. Kalam University of Waterloo Canada, Dr. Nieaz Ahmed Siddiqi and Dr. Luthfe Alam of Bangladesh Forest Research Institute Chittagong, Amirul Islam and Abdur Rahman of Institute of Water Modelling (IWM) Dhaka, Dr. Hero Heering Consultant of IPAWAM Bangladesh, Dr. Beth Middleton, Secretary General of Society of Wetlands Scientists, USGS, USA.
I acknowledge the assistance of the professors and staff of BTU Cottbus, Germany especially to Professor Dr. Michael Schmidt-Head of ERM- PhD programme, Professor Dr. Gerhard Wiegleb and Professor Dr. Marie-Theres Albert of World Heritage Studies, Ms. Kathryn Prouty M.A, Beata Körner M.A, and Dipl.-Ing. R. Schuhr of International Office, Dipl.-Geogr. Ralph Heinrich, Dipl.-Ing. Harmut Nemitz and Katya Rösch, Dept. of Ecosystems and Environmental Informatics, Bernadett Hoppe Co-ordinator of ERM PhD programme and my colleagues and friends specially Jean Duclos Alegue Feugo (Cameroon), Irene Sachs, Nicole Link(Germany), Raynah Burke (Panama), Wie Shouke (China), Delphine Oliver, Anne Bousquet (France), Iana Debora (Brazil), Alena Kiptsevich (Belarus), Agnieszka Bukowska, Agnieszka Plwowarczyk, Aneta Grabanska, Marta Janeczko, Magdalina Pybaczewska, Margaret Frackowiak (Poland), Pierre Burtin (Sweden), Virginia Appendino (Argentina), Tijani, Frank, Seth, Francis, Effah (Ghana), Masgidi (UAE), Badre Ichrak (Morocco), Collins (Nigeria) and Engel Berth Soto (Mexico). My sincere thanks to Bangladeshi students in Germany like Rumana, Sharif, Lipon and others from different parts in Europe, USA and Canada those always encouraged me to finish my Doctorate dissertation in time.
I am very grateful to my mother, brothers, sisters and relatives for their constant support and encouragement during my studies and research at Brandenburg University of Technology at Cottbus, Germany. Md. Shafi Noor Islam 30th November ’07 Cottbus, Germany
iv
Table of Contents
Declaration .........................................................................................................................iii
Acknowledgements.............................................................................................................iv
Table of Contents.................................................................................................................v
Abstract ............................................................................................................................. viii
Zusammenfassung...............................................................................................................ix
List of Figures .................................................................................................................... xi
List of Tables .................................................................................................................... xiii
List of Abbreviations and Units ...................................................................................... xiv
Chapter 1 Introduction 1 1.1 General background....................................................................................................... 1
1.2 Problems identification and data materials.................................................................... 4
1.3 Objectives of the study and organisation of the thesis .................................................. 9
Chapter 2 Cultural Landscapes and Mangrove Wetlands in the Tropical
Zone 12 2.1 The concept of cultural landscapes and understanding of wetlands............................ 12
2.2 Mangrove origin, diversification and distribution in the world. ................................. 14
2.3 The challenge of cultural landscapes and mangrove wetland ecosystems.................. 19
2.3.1 Socio-economic and cultural aspects of wetlands and cultural landscapes ....... 21
2.3.2 Benefits of mangrove ecosystems management................................................. 22
2.4 Ecology and biological settings of mangrove forest ecosystems ............................... 23
2.4.1 Physical factors of mangrove forest development............................................. 24
2.4.2 Ecosystem concept and adaptive mangrove ecosystems management ............. 25
2.4 .3 Mangrove wetlands performance as dynamic network and functional benefits 30
2.4.4 Salient features of the deltaic mangrove wetlands ecosystems ......................... 32
2.4.5 Deltaic mangrove ecosystems a unique marginal and fragile system ............... 32
2.5 The natural and human threats to mangrove wetlands ecosystems............................. 32
2.5.1 Unplanned policies and destruction of mangrove ecosystems .......................... 33
2.5.2 Management and conservation of world mangrove wetlands areas .................. 33
2.5.3 The threatened landscapes and mangrove wetlands ecosystem ........................ 34
v

Chapter 3 The Sundarbans Study Area 36 3.1 Mangrove wetlands in Bangladesh .............................................................................. 36
3.1.1 Geography and climatic condition of the Sundarbans .................................... 38
3.1.2 The origin and geological history of the Sundarbans mangroves ................... 41
3.2 The Flora, fauna and vegetation dynamics in the Sundarbans.................................... 42
3.2.1 The faunal diversity......................................................................................... 49
3.2.2 Mangrove forest type and classification.......................................................... 50
3.2.3 Forest canopy classes ...................................................................................... 52
3.3 Hydrology and River Systems of the Sundarbans....................................................... .55
3.3.1 The source of freshwater supply into the Sundarbans..................................... 58
3.3.2 Transboundary Ganges water withdrawal and salinity intrusion .................... 58
3.3.3 Quality and quantity of fresh water in the Sundarbans Rivers........................ 62
3.3.4 State of salinity of the investigation area ........................................................ 64
3.3.5 Scarcity of upstream freshwater and its impacts in the downstream .............. 69
3.4 Threats to the Sundarbans ........................................................................................... .71
3.4.1 Human influences and negative impacts in the Sundarbans ........................... 71
3.4.2 The conceptual model of threatened mangrove ecosystems ........................... 73
3.4.3 Pressure, problems and substantial uses of natural resources ......................... 74
3.5 Existing management strategies for the Sundarbans mangroves ................................ .75
Chapter 4 Modelling of Water Salinity 78
4.1 Water salinity modelling in the Sundarbans Rivers ..................................................... 78
4.2 Fourier polynomial method.......................................................................................... 80
4.3 Data used ...................................................................................................................... 82
4.4 Result of water salinity modelling of the Sundarbans rivers........................................ 89
4.4.1 Water salinity modelling of Passur - Mongla River ...................................... 89
4.4.2 Water salinity modelling of Baleswar - Bogi River…… ................................ 92
4.4.3 Water salinity modelling of Selagang - Harintana River ................................ 94
4.4.4 Water salinity modelling of Sibsa - Nalianala River....................................... 95
4.4.5 Water salinity modelling of Bal - Jhalia River................................................ 97
4.4.6 Water salinity modelling of Passur - Passakhali River ................................... 99
4.4.7 Water salinity modelling of Betmargang - Kathka River ............................. 100
4.4.8 Water salinity modelling of Chunar - Munchiganj River ............................. 102
4.4.9 Water salinity modelling of Kholpetua - Kobadak River ............................. 103
vi

4.4.10 Water Salinity modelling of Notabakikhal - Notabaki River........................ 105
4.4.11 Water salinity modelling of Arpongasia - Deboki River .............................. 107
4.4.12 Water salinity modelling of Nilkamal - Hironpoint River ............................ 107
4.4.13 Water salinity modelling of Malancha - Mandarbaria River ....................... 110
4.5 Overall discussions .................................................................................................... 111
Chapter 5 Proposals for the Sundarbans Ecosystems Development 122 5.1 Some specific proposals ............................................................................................. 122
5.2 Integrated sustainable management of mangrove ecosystems................................... 124
Chapter 6 Conclusions 130
References ...................................................................................................................... 136
Appendix 1 ........................................................................................................................ 153
Appendix 2 ........................................................................................................................ 155
Appendix 3 ........................................................................................................................ 157
Appendix 4 ........................................................................................................................ 159
Appendix 5 ........................................................................................................................162
vii

Abstract
Cultural landscapes are areas of exceptional beauty, containing superlative natural phenomena and are of ecological importance. At present cultural landscapes and wetlands are the most spectacular global issues for economic growth and balancing of ecosystems. The Sundarbans has an outstanding universal value where the cultural landscape was shared by the indigenous pastoral society over thousand years ago and it is still visible. The site is representing significant ongoing ecological and biological processes in the evolution and development of mangrove ecosystems and communities of plants and animals. It is situated in the Ganges transboundary catchment which is known as the single largest stretch of productive mangrove ecosystems in the world. It covers 10,000 km² between Bangladesh and India. The Sundarbans portion of Bangladesh is about 62 % and covers an area of 6017 km². It was declared as world natural heritage site by the UNESCO in 1997 and as a Ramsar site in 1992 already.
There is an agglomeration of biodiversity with 66 different species of mangroves growing there. For comparison: 70 species of mangroves are found in the world. A large part of mangrove wetlands in Bangladesh, almost 45 %, have disappeared within the last three decades. The Gorai River is the main tributary of the Ganges which supplies downstream freshwater to the Sundarbans and ensures the ecosystems balance in the coastal region. Since the diversion of the Ganges water at Farakka Barrage in India from early 1975, the salinity level has increased drastically in the south western part of the region. Due to the reduction of the Ganges flows the industries are facing serious problems. Inequality control of the products and fragile affects are demonstrating on agriculture, fisheries, navigation, and hydromorphology, quality of drinking water and mangrove wetlands ecosystems. As a result, about 170,000 hectares (20.4%) of new land has been affected by various degrees of salinity during the last three decades. 38 % of the country’s territory and 33 % of its population is already affected by salinity intrusions.
The saline front defined by the 0.5 dS/m isohaline has penetrated in the Nabaganga River as far north as Magura is far from the coast (240 km). Similarly about 6 dS/m has penetrated 173 km from the Sea in the Atharobanka River to the vicinity of the off-take from the Madhumati River. The research findings are showing 10805-21610 dS/m salinity is the best productive range in Sundarbans, where only 20 % of the area is within 32415 dS/m range of salinity and 80 % of the area (4813.60 km²) has a salinity rate over 32414 dS/m. The dominant species Heritiera fomes and Ceriops decendra are affected by top-dying disease which is recognised as key management concern. Procedures of water salinity modelling of 13 rivers in the Sundarbans region lay out increasing salinity trends.
Fourier Polynomial Models have been done on 13 rivers where the time series approach (4 years) has been considered. The results show that only one river has crossed the salinity threshold line of 20 ppt or 43,220 dS/m which was the maximum value in 2000. Whereas 6 rivers have crossed in 2001, 8 rivers have crossed in 2002 and important 11 rivers have crossed the water salinity threshold line in 2003. According to average peak values of river water salinity there are 4 rivers (basin 1, 2, 3 and 4) that are in good condition, two rivers (basin 7 and 9) carry the moderate situation and 7 rivers (basin 5, 6, 7, 8, 10, 12 and 13) carry the high salinity rate in the dry season, which are major threats for mangrove ecosystems in the Sundarbans. The high salinity zone is located in the south-western corner of the Sundarbans; the previous values were 38,898-54,025 dS/m while the present values are 54,025 – 69,152 dS/m. Furthermore the area has been extended from South to North and East to West direction. The Fourier Polynomial models show the cyclic increasing behaviour of water salinity in the Sundarbans Rivers.
viii
Considering the results of all models and threshold values of water salinity for the Sundarbans case, it is clearly indicated and forecasted the message that upstream fresh water supply is necessary and emergent for the protection of cultural landscapes and mangrove wetlands ecosystems in the Sundarbans region. As priority is given by surface water salinity modelling, statements are formulated to support planning activities and to protect a special natural heritage site. The findings of this study would be a potential contribution to make a comprehensive management plan for the long-term conservation and protection of the cultural landscape and mangrove wetlands ecosystem in the Sundarbans region. Zusammenfassung
Kulturlandschaften sind oft Gebiete von außergewöhnlicher Schönheit, die sowohl natürliche Phänomene repräsentieren, als auch von ökologischer Bedeutung sind. Kulturlandschaften und insbesondere Feuchtgebiete zählen zu den wichtigsten globalen Kernpunkten für Wirtschaftswachstum und für das Gleichgewicht von Ökosystemen. Das Ökosystem der Sundarbans hat einen überragenden universellen Wert. Bereits vor über tausend Jahren wurde diese Kulturlandschaft von der einheimischen Landbevölkerung genutzt. Dies ist auch heute noch sichtbar. Am Ökosystem der Sundarbans lassen sich die biologischen Prozesse und die ökologische Entwicklung der Mangrovenökosystem und der Lebensräume von Pflanzen und Tieren erkennen. Die Sundarbans liegen im Einzugsgebiet des die nationalen Grenzen überschreitenden Ganges. Sie sind weltweit bekannt als größtes und ergiebiges Mangrovenökosystem. Das Mangrovenökosystem umfasst eine Fläche von 10.000 km² zwischen Bangladesch und Indien. Der Anteil von Bangladesh an den Sundarbans beträgt 62% und umfasst ein Gebiet von 6017 km². Im Jahr 1997 wurde es von der UNESCO zum Weltnaturerbe erklärt und gemäß der Ramsar-Konvention als Ramsar-Feuchtgebiet im Jahr 1992. Das Gebiet schließt eine Artenvielfalt mit 66 Mangrovenarten ein. Zum Vergleich: Es gibt bislang 70 bekannte Mangrovenarten auf der Erde. Ein sehr großer Teil, fast 45 % der Mangrovenfeuchtgebiete von Bangladesch, sind in den letzten drei Dekaden verschwunden.
Der Gorai-Fluß ist der Hauptarm des Ganges, der die Sundarbans stromabwärts mit Frischwasser versorgt und das Gleichgewicht des Ökosystems in der Küstenregion gewährleistet. Seit Anfang des Jahres 1975 wird der Ganges im Farakka Stauwehr (Indien) umgeleitet. Seitdem ist der Salzgehalt im westlichen Teil der Region drastisch gestiegen. Durch die Verringerung des Flussbetts des Ganges steht die Industrie vor ernsthaften Problemen bezüglich der Qualitätskontrolle der Produkte. Auswirkungen sind auch für die Landwirtschaft, die Fischerei, den Schiffsverkehr, die Hydromorphologie, die Qualität des Trinkwassers und die Ökosysteme der Feuchtgebiete der Mangrovenwälder zu verzeichnen. Durch die Versalzung sind bereits ca. 170,000 Hektar (20.4%) Neuland während der letzten drei Dekaden betroffen. Das entspricht 38 % des Hoheitsgebiets von Bangladesch. Die Versalzung hat sich bereits auf 33% der Bevölkerung ausgewirkt. Die Salzfront, die durch die 0.5 dS/m Isohaline definiert wird, ist bereits in den Nabaganga Fluss bis zur Stadt Magura, die 240 km von der Küste entfernt ist, eingedrungen. Im Atharobanka Fluss, der 173 Kilometer vom Meer entfernt ist, wird nahe des Abzweiges des Madhumati Rivers ein Salzgehalt von ca. 6 dS/m gemessen. Die Untersuchungsergebnisse zeigen, dass das Ökosystem der Sunderbans einen mittleren Salzgehalt von 10805-21610 dS/m aufweist, wobei 20 % des Gebietes einen Salzgehalt von 32415 dS/m und 80 % des Gebiets (4814 km²) einen Salzgehalt über 32414 dS/m aufweisen. Die dominierenden Arten Heritiera fomes und Ceriops decendra sind davon intensiv betroffen. Dies gilt als auffälligstes Ereignis in den Sundarbans. Die Modelle für den Salzgehalt von 13 Flüssen in der Region der Sundarbans zeigen steigende Tendenzen des Salzgehaltes.
ix

Die Ergebnisse der Fourier-Modelle zeigen, dass nur ein Fluss den Grenzbereich des Salzwassergehaltes (20 ppt oder 43,220 dS/m) im Jahr 2000 übersteigt. Dagegen überschreiten bereits im Jahr 2001 6 Fließgewässer, im Jahr 2002 8 Fließgewässer und im Jahr 2003 11 Fließgewässer den Grenzwert des Salzgehalts. Entsprechend den mittleren Höchstwerten des Salzgehaltes sind 4 Fließgewässer (Bassin 1, 2, 3 und 4) in gutem Zustand, 2 Fließgewässer (Bassin 7 und 9) im mittleren und 7 Fließgewässer (Bassin 5, 6, 7, 8, 10, 12 und 13) im schlechten Zustand während der trockenen Jahreszeit. Dies ist eine der Hauptbedrohungen für die Ökosysteme der Mangrovenwälder in den Sundarbans. Die Zone mit dem hohen Salzgehalt liegt im südwestlichen Teil der Sundarbans. Lagen die Werte früher bei 38898-54025 dS/m, so sind es aktuell Werte von 54025 - 69152 dS/m, des Weiteren hat sich das Gebiet von Süden nach Norden und von Osten nach Westen vergrößert. Die Fourier-Modelle zeigen eine kreisförmige Zunahme des Salzgehaltes in den Flüssen der Sundarbans.
Fasst man die Ergebnisse der Dissertation zusammen, so lässt sich folgendes feststellen: 1. Es ist eindeutig zu erkennen, dass die Süßwasserversorgung lebenswichtig für den
Schutz der Kulturlandschaft und des Ökosystems der Sundarbans ist. 2. Zur Vorhersage der Entwicklung der Sunderbans hat die Modellierung der
Wassergüte, insbesondere des Salzgehaltes, höchste Priorität. 3. Administrative Anweisungen zum Schutz dieses Weltkulturerbes sind auszuarbeiten. 4. Die Erkenntnisse dieser Forschungsarbeit tragen dazu bei, einen langfristigen
Managementplan für die Erhaltung und den Schutz der Kulturlandschaften und des Ökosystems der Sundarbans zu erstellen.
x

List of Figures
Figure 2.1 The environmental relationship framework......................................................... 13
Figure 2.2 Origin of mangrove and distribution in the world. .............................................. 15
Figure 2.3 The present mangroves distribution and location in the world............................ 16
Figure 2.4 Mangrove distribution according to the region.................................................... 17
Figure 2.5 Mangrove distribution according to major 10 countries...................................... 18
Figure 2.6 World mangroves economic zone........................................................................ 20
Figure 2.7 The schematic diagram of an ecosystem ............................................................. 26
Figure 2.8 The general scheme of mineral cycling in wetland ecosystems...........................27
Figure 2.9 The conceptual model of mangrove wetlands ecosystems .................................. 28
Figure 2.10 Ecosystems relationship....................................................................................... 29
Figure 2.11 Ecosystem-human economy model ..................................................................... 30
Figure 2.12 Mangrove wetlands ecosystems structure............................................................ 31
Figure 2.13 Heritiera types of forests are affected 35
Figure 3.1 The geographical location of the Sundarbans mangrove..................................... 38
Figure 3.2 The Sundarbans mangrove wetlands location and characteristics....................... 39
Figure 3.3 The eastern part of Sundarbans and wildlife sanctuary ....................................... 43
Figure 3.4 The middle part of Sundarbans and wildlife sanctuary ....................................... 44
Figure 3.5 The western part of Sundarbans and wildlife sanctuary ...................................... 45
Figure 3.6 Vegetation compositions in the Sundarbans ........................................................ 46
Figure 3.7 The causes of vegetation dynamics...................................................................... 47
Figure 3.8 The vegetation succession.................................................................................... 48
Figure 3.9 Predominant canopy density ................................................................................ 52
Figure 3.10 Forest canopy class in 1933 ................................................................................. 53
Figure 3.11 Forest canopy class in 1960 ................................................................................. 53
Figure 3.12 Forest canopy height class in 1985 ...................................................................... 54
Figure 3.13 River systems and estuaries in the Sundarbans.................................................... 56
Figure 3.14 The Ganges water level at Hardinge Bridge in the dry season ............................ 59
Figure 3.15 The Ganges water flows at Hardinge Bridge....................................................... 59
Figure 3.16 Water scarcity and salinity increase at Passur-Mongla point ............................. 61
Figure 3.17 State of salinity of the investigation area ............................................................ 65
Figure 3.18 Water salinity trends in the Sundarbans in 1968 – 1976 ..................................... 67
Figure 3.19 Location of salinity samples collection in Sundarbans region .............................68
Figure 3.20 Water salinity at 9 sites in the Sundarbans in 2003..............................................68
xi

Figure 3.21 Soil salinity at 9 sites in the Sundarbans region in 2003.....................................69
Figure 3.22 Reduced fresh water flow and impact on ecosystems ........................................70
Figure 3.23 The ecological and social impact structure of the Sundarbans............................72
Figure 3.24 The conceptual model of threatened ecosystems on Sundarbans.........................73
Figure 3.25 Substantial mangrove wetlands resource usage in the Sundarbans......................75
Figure 4.1 Location of water salinity samples collection on 13 rivers..................................79
Figure 4.2 Water salinity of 4 rivers (basins 1- 4).................................................................85
Figure 4.3 Water salinity of 4 rivers (basins 5-8) .................................................................86
Figure 4.4 Water salinity of 5 rivers (basins 9-13)................................................................87
Figure 4.5 Fourier approximation of water salinity of Mongla-Passur River........................90
Figure 4.6 Fourier approximation of water salinity of Baleswar-Bogi River........................92
Figure 4.7 Fourier approximation of water salinity of Selagang-Harintana River................94
Figure 4.8 Fourier approximation of water salinity of Sibsa-Nalianala River.......................96
Figure 4.9 Fourier approximation of water salinity of Bal-Jhalia River................................97
Figure 4.10 Fourier approximation of water salinity of Passur-Passakhali River...................99
Figure 4.11 Fourier approximation of water salinity of Betmargang-Kathka River.............100
Figure 4.12 Fourier approximation of water salinity of Chunar-Munchiganj River.............102
Figure 4.13 Fourier approximation of water salinity of Kholpetua - Kobadak River...........104
Figure 4.14 Fourier approximation of water salinity of Notabakikhal-Notabaki River........106
Figure 4.15 Fourier approximation of water salinity of Arpongasia-Deboki River..............107
Figure 4.16 Fourier approximation of water salinity of Nilkomal-Hironpoint River............108
Figure 4.17 Fourier approximation of water salinity of Malancha-Mandarbaria River........110
Figure 4.18 Result of water salinity modelling in the Sundarbans........................................113
Figure 4.19 Salinity increasing in rivers water in different direction....................................114
Figure 4.20 Water salinity isohaline in three ecological zones.............................................115
Figure 4.21 Comparative salinity range in three ecological zones in Sundarbans................116
Figure 5.1 Proposed upstream water supply plan for Sundarbans and Navigation route…127
Figure 5.2 Considerable lines of water flows and salinity intrusion..………………...…...128
xii

List of Tables Table 3.1 The physical characteristics of three ecological zones ......................................... 40
Table 3.2 The Sundarbans forest and landuse types ............................................................. 40
Table 3.3 Status of mammals, birds, reptiles and amphibians.............................................. 49
Table 3.4 Area of major forest types in blocks km².............................................................. 51
Table 3.5 Forest vegetation quality class in the Sundarbans ................................................ 51
Table 3.6 Special number in blocks within 10cm diameters ................................................ 51
Table 3.7 Rules of allocation of water on 1996 treaty .......................................................... 60
Table 3.8 Limits of water pollutants ..................................................................................... 62
Table 3.9 Salinity stress during 2001 - 2002 inside the Sundarbans .................................... 66
Table 3.10 Sundarbans area covered by different salinity range ............................................ 66
Table 4.1 Data arrangement in a structural frame................................................................. 84
Table 4.2 Result of Fourier approximation of water salinity in the Sundarbans rivers ........ 88
Table 4.3 Highest water salinity rate (dS/m) in river basins in the Sundarbans ....... ….….112
Table 4.4 In general vegetation types in respect of soil saline zones……………………..119
Table 4.5 Classification of coastal salinity……………………………………………......120
Table 4.6 The crops production and reduced rate based on soil salinity dS/m…………....120
xiii

List of Abbreviations and Units ACF – Additional Conservator of Forest
ADB – Asian Development Bank
ADFO – Additional Divisional Forest Officer
ADP – Annual Development Plan
AWB – Asian Wetlands Bureau
BARC – Bangladesh Agricultural Research Council
BBS – Bangladesh Bureau of Statistics
BIDS – Bangladesh Institute of Development Studies
BFRI – Bangladesh Forest Research Institute
BIWTA – Bangladesh Inland Water Transport Authority
BWDA – Bangladesh Water Development Authority
BWPAA – Bangladesh Wildlife Preservation Amendment Act
CARMDMA – Coastal Area Resource Development and Management
CCF – Chief Conservator of Forest
CEGIS – Centre of Environmental Geographical Information Systems
CF – Conservator of Forest
CITES – The Convention of International Trade in Endangered Species
DCCF – Deputy Chief Conservator of Forest
DFO – Divisional Forest Officer
DMA – Damaged Mangrove Areas
DoF – Department of Forest
EGIS – Environmental Geographical Information System
EORC – Earth Observation Research and Application Centre
EQS – Environmental Quality Standard
ESP – Exchangeable Sodium Percentage
FAP – Flood Action Plan
FEMAT – Forest Ecosystems Assessment Management Team
FRMP – Forest Resources Management Project
GBM – Ganges, Brahmaputra and Meghna Basin
GEF – The Global Environment Facility
IBP – International Biological Programme
ICOMOS – International Council on Monuments and Sites
IUCN – International Union for the Conservation of Nature
xiv

IWM – Institute of Water Modelling
MAB – Man and Biosphere
MAF – Million Acre Feet
MCPFE – Ministerial Conference on the Protection of Forest in Europe
MCR – Mangrove Conservation Reserve
MFR – Mangrove Fisheries Reserve
MFR – Mangrove Forest Reserve
MoEF – Ministry of Environment and Forestry
MPO – Master Plan Organisation
NGO – Non Governmental Organisation
ODA – Overseas Development Authority
PRA – Participatory Rural Appraisal
RMSE – Root Mean Square Error
SAR – Sodium Absorption Ratio
SBCP – Sundarbans Biodiversity Conservation Project
SLR – Sea Level Rise
SPARRSO – Space and Remote Sensing Organisation
SRDI – Soil Resource and Development Institute
SSE – Some Squared Error
UNCED – United Nations Conference on Environment and Development
UNDP – United Nations Development Programme
UNECE – United Nations Economic Commission for Europe
UNEP – United Nations Environmental Programme
UNESCAP – United Nations Economic and Social Council for Asia and the Pacific
UNIPCC – United Nations Intergovernmental Panel on Climate Change
USGS – United States Geological Survey
WHC – World Heritage Convention
dS/m – deci Siemens per metre
ppm – Parts per million
ppt – Parts per thousand
1 ppt = 2161 dS/m (for NaCl)
1000 ppm = 1 dS/m
640 ppm = 1 ppt
1 dS/m = 1000 EC (µS/cm)
xv

1 dS/m = 1 milli Siemens per centimetre (mS/cm)
ECw dS/m – Electrical Conductivity of Water dS/m
ECs dS/m – Electrical Conductivity of Soil dS/m
100 hectares = 1 km²
xvi

Chapter 1 Introduction
1
Chapter 1 Introduction 1.1 General Background In the analysis of cultures there are a number of threats in current conceptualisations of
landscapes. The properties of cultural landscapes are linked to and represented by human
observation and realisation. At present cultural landscapes are the most spectacular global
issue for economic growth and balanced ecosystems. On the other hand water is a
fundamental issue needed for human survival and their cultural development. There is an
inter-linkage between cultural landscape development and water availability. Water is a
critical resource for life and essential for economic success and sound ecosystems in an
environmentally friendly society. Of the world’s water about 97.5 % exists as saline water in
the oceans and seas. Only 2.5 % exists as fresh water and 99 % of this is trapped in glaciers
and ice caps. Water is required for domestic consumption, sanitary use, industrial use,
hydroelectric power generation, agriculture, irrigation and protection of the ecology and
ecosystems (Gleick, 1998). Presently more than 31 countries around the world, representing 8
% of the world population are facing chronic fresh water shortage (Biswas et al., 2000). Water
related ecosystems, such as mangrove wetlands, meadows, marshlands are playing an
important role in water resources management and drinking water supply in the community.
But almost half of the world’s wetlands have been destroyed in the past 100 years (Barbier,
1993). It has been estimated that 60 % of wetlands have been lost in America alone
(Jenderedjiar, 2004). Mangrove swamps are some of the richest and most productive areas for
the food chain in the sea and coastal water (Dickinson and Murphy, 1998). The floral
elements in mangrove wetlands forests are responsible for primary productivity in
phytoplankton and marine algae while those responsible for secondary and tertiary
productivity are zooplankton and benthic animals respectively (Parikh and Datye, 2003).
Considering all the elements of mangrove wetlands, the Sundarbans which stands over the
Ganges basin is playing an incomparable role in balancing and protecting the coastal wetland
ecosystems in the Bengal basin (Banerji, 1981; Islam, 2001). The coastal deltaic zone, an area
of transition, is an ecotone between air, land and sea, and between terrestrial fresh water and
marine saline water (Das, 1989). The three major rivers namely the Ganges, the Brahmaputra
and the Meghna (GBM river systems) account for 85 % of the total dry season flow passing
Chapter 1 Introduction
2
through the coastal zone of Bangladesh. In the Sundarbans there are rivers, streams, channels,
canals and creeks which together number around 430. The names of the major rivers are
included in the appendix (Appendix 5) and play an influential role in the economy and
environment. The Ganges deltaic morphology of the south western region of Bangladesh is
characterised by its funnel shaped vast network of rivers, strong tidal and wind action and
enormous river discharge laden with bed, and suspended sediments. The hydro-
geomorphology of the region has very active dynamics and complex nature (Mafizuddin,
1993). The Sundarbans mangrove forest is situated in the Ganges river catchment area in
Bangladesh. The southern part (1,400 km²) of the Sundarbans has been declared by the
UNESCO as a natural world heritage site in 1997. The Sundarbans were declared as the
world’s 560th Ramsar site wetlands in 1992 (Figure3.2) and includes the following wetland
types: F (Estuarine Wetlands), G (Intertidal mud and, sand, or salt flats), I (Intertidal forested
wetlands), and M (permanent rivers/ streams /creeks). The international importance and
inclusion of the Sundarbans as a Ramsar Wetlands site was based on Ramsar wetlands
selection criteria 1c, 2a, 2b, 2c, 3b, and 4b. It provides habitats and nurseries to numerous
wildlife and fishery resources (Holmgren, 1994). It stated in a FAO report (1995) that the
Sundarbans is the first mangrove wetlands forest in the world which was brought under
scientific management in 1892 (Rahman, 1995). In spite of the well-meaning sustainable
management practices, a sign of anthropogenic stress is evident in the forest, such as
substantial use of forest resources, damage of forest products and rapid expansion of shrimp
cultivation around the forest; people have largely contributed to severe depletion of the forest
resources. Biotic and abiotic factors have further exacerbated the hostile ecological and
environmental damage (Holmgren, 1994).
The Sundarbans Ramsar site is part of the Ganges delta, including extensive productive
mangrove forests and major river deltas flowing into the Bay of Bengal. The tidal
management swamp is inundated twice daily. The depth and duration of tidal inundation
depend on many factors like distance from the main rivers the sea including local relief and
sediment load in the inundating water (Rahman, 1995; SBCP, 1997; Rahman and Chowdhury,
2001). The Sundarbans mangrove wetlands hold two world records. It is the world’s largest
expanse of mangroves and the world’s largest tiger reserve. The cultural landscapes of
Sundarbans receive frequent international attention after being afflicted by natural disasters
such as massive flooding, tidal storm and surges and its vulnerable environmental ecological
issues such as saline water intrusion in the Sundarbans areas, rapid siltation of major river’s

Chapter 1 Introduction
3
beds, and river bank erosion (Islam, 2001). Bangladesh is known as “land of water” or better
“water in land” (Novak, 2001) is now facing acute water shortage during the dry season. The
Ganges provides fresh drinking water, productive agriculture, industrial activity, forestry,
fisheries, and navigation, prevents salinity penetration from the Bay of Bangal and above all,
maintains the ecological balance of the country. The livelihood and ecology in the Ganges
catchment of Bangladesh portion depends on the Ganges fresh water supply which is now
under threat (Hasna et al., 1995).
Mangrove wetlands and their elements are a gift of nature. Natural beauty and the universal
value of the wetlands property give us natural heritage. It is important for its floristic
composition, economic uses and a wildlife habitat that has created for it a unique position not
only in mangrove forestry but also in terms of cultural landscapes, culture and heritage.
Natural resources have created culture and civilisation for human beings (Chapman, 1975;
Drengsen and Taylor, 1997). At the same time human influence on nature, and on the planet,
is indelible. In the case of the Sundarbans “Ganges water withdrawal during the dry season is
one of the most critical environmental problems in Bangladesh, and while water loss is a
concern for human beings, its ecological impact has never been assessed, an ecological
damage since the construction of Farakka Barrage in 1975 will take decades to recover even if
we get water now” (Hasna et al., 1998). In recent years with reduced freshwater discharge at
the Farakka Barrage on the Ganges, more areas have been affected by stream flow salinity.
Increasing water salinity is one of the significant and widespread forms of surface and ground
water pollution, which are primarily effects of upstream freshwater withdrawal and salt
intrusion in the coastal areas (Perry and Vanderklein, 1992; Nishat, 1993). The Gorai-
Madhumati basin is directly affected by withdrawal of water from the Ganges. It was
observed that substantial changes in the Ganges River flow generated effects on the Gorai
River and the area depended on it. In the dry season, reduces flow in the Gorai River
exacerbated problems of salinity in the Sundarbans region (Mirza, 1998). Increase in salinity,
adversely affected agriculture, forestry, industrial production, and quality of drinking water
and mangrove ecosystems (Khan, 1993). The River Balaswar in the east is the main source of
fresh water although several others also bring water from the Ganges during the rainy season.
These rivers are therefore, more susceptible to dry season reduction in stream flow and tidal
intrusion of saltwater (Das, 2000; Hasan et al., 2001). Anthropogenic disturbances of nature
have transformed natural landscapes through the process of fire, hunting, agriculture, climate
change and industrial pollution. Some natural areas or sites have natural, cultural and
Chapter 1 Introduction
4
economical values. These are important resources and heritage of the world communities and
it is the responsibility of the world community to protect these invaluable natural resources
and ecosystems.
1.2 Problems identification and data materials The surface water flow in the rivers of the Sundarbans area mainly comes from the Ganges at
the off-take of Gorai-Madhumati and from the lower Meghna through Swarupkati Kocha
River. Salinity is the amount of dissolved salts present in river. It reflects the dominant
forcing functions of freshwater discharge and oceanic exchange. Salinity content of river in
the Sundarbans shows a special variability (Karim, 1988; Dewan, 1998; Ahsan and Biswas,
2001). Water salinity increase acts as a barrier to the natural growth of the plants and animals
of the Sundarbans. Salinity posses physiological limit on the growth, survival and
regeneration of mangroves plants. A general decline of the physiognomic structure of the
forest is due to restricted growth of trees, which is related to salinity in soil and river water. If
the present trend of salinity increase continues, some important trees like Sundari (Heritiera
fomes) and Goran (Ceriops decandra) might vanish within 47 years (Iftekher and Islam,
2002). Moreover, some animals might not be able to adapt to the increasing trend of the water
salinity in the region (Blasco, 1975). Salinity increases can cause changes in landscapes
pattern of the areas adjoining the Sundarbans. Such land was previously used for crop
production, and is now being converted to shrimp cultivation. Increasing salinity in the
Sundarbans can hamper safe drinking water supply in Khulna city (Khan, 1993; Ahsan and
Biswas, 2001). The scarcity of safe drinking water can force some people to drink unclean
water which might cause some water bone diseases like cholera and diarrhoea (FAP, 1993).
The water and soil salinity in the Sundarbans mangrove forest is rising. This trend is a serious
threat to the ecological balance of the Sundarbans and cultural landscapes protection. For
future generation benefits, proper management planning and controlling measures should be
undertaken beforehand to maintain the water and soil salinity in the Sundarbans heritage site
within an acceptable level. About 170,000 hectares or 1700 km² (20.4 %) new land has been
affected by various degrees of salinity during the last three decades. The water management
problem in Bangladesh is a complex phenomenon. Water resources in Bangladesh consist of
three main components: rainfall, stream flows and groundwater storage. These components
are closely interrelated. The main problems are centred on two issues a) The need for a
mechanism that will optimally meet competing demands during the dry season, and b)

Chapter 1 Introduction
5
planning and implementation of appropriate drainage and flood control measures during the
wet season. In addition, adequate water management must also be predicated on the
maintenance of water quality (Quazi et al., 1992). The surface water flow of the major source,
the Ganges is reduced in Bangladesh due to upstream water diversions. Multiple factors are
involved in compounding the issue of reduced river flow. Reduced flow of water in major
rivers during the dry season has increased salinity encroachment in coastal areas, by reducing
the fresh water pressure that normally counteracts the landward migration of salt water into
underground aquifers. Indeed, aquifer salinity in the south-western region including the
Sundarbans has increased significantly during the dry season in recent years. About 38 % of
the country’s territory and 33 % of its population is already affected by salinity in the water
supply. The mangrove resources are generally considered as open access resources. Existence
of species has social and ecological value: hence there is a need for their preservation. The
goal of this research is the contribution of a comprehensive management plan for the long-
term conservation and protection of the cultural landscapes and mangrove wetlands
ecosystems in the Sundarbans. The results of water salinity modelling of the Sundarbans
rivers will support planning by decision makers to protect the especial natural heritage site
and mangrove wetlands ecosystems in the Sundarbans region in Bangladesh. The study was
conducted at the field level and saline water and soil samples were collected for laboratory
test for analysing the salinity situation and ecological and ecosystems degradation in the
whole Sundarbans area. The study also involved discussions and interviews with the
stakeholders, tourists and tour operators, shrimp cultivators, farmers, fishermen, shrimp
collectors, business groups, local people, NGO leaders and decision makers and planners in
the Sundarbans region. More than 3 months were spent in the Sundarbans in different
sensitive areas where the ecosystems are under pressure and threatened due to human
influences on surface water and environmental degradation. Areas and important locations
include Munchiganj, Mirgang, Koira, Kasiabad, Mongla, Kathka, Kochikhali, Hironpoint,
Dublar Char, Mundarbaria, Burigoalini and Saronkhola were covered during the survey and
data collection in the Sundarbans. Primary data for surface water salinity were obtained from
samples which had been collected from the 13 rivers of the Sundarbans by the Institute of
Water Modelling (IWM) and BIWTA. This raw data was made available with the permission
of the Asian Development Bank (ADB). The collected data has been used for water salinity
modelling of the rivers in the Sundarbans. To understand the present ecological situation,
other ongoing research activities and human influences which are harmful to the mangrove

Chapter 1 Introduction
6
wetland ecosystems and what is relevant for data collection, a reconnaissance survey was
conducted. As part of this survey the Ministry of Environment and Forest, Department of
Forest, Sundarbans Bio-diversity Conservation Project (SBCP), Bangladesh Parjaton
Corporation, tour operating organisations and other relevant environmental research
organisations and different libraries in Dhaka, Chittagong, Rajshahi and Khulna cities were
contacted. This survey helped to realise the present situation and provided the preliminary
data on the existing environmental condition of the area to assist further research and
development.
This study is an interdisciplinary environmental and natural resource management related
research so I had to collect data and information based on interdisciplinary approach. The aim
of this study is to work on surface saline water modelling in the Sundarbans region and find a
relationship between salinity intrusion and the cultural landscapes changing pattern in the
mangrove wetland ecosystems. This is why data samplings have been collected from river
waters and changing landscapes field areas in the Sundarbans region. There is an ongoing
interdisciplinary research project by name Sundarbans Biodiversity Conservation Project
(SBCP). Some relevant data has been collected and used by SBCP, and will also be used in
this study. Water salinity related data has been collected from IWM (Institute of Water
Modelling) of Bangladesh. Besides these, data has also been collected through personal
interviews with the stakeholders and management authorities at field level. The secondary
data and Sundarbans related environmental information have been collected from different
university libraries and NGOs working in the same field within Bangladesh and abroad. The
Sundarbans resources and tourism related information have also been collected through
personal interviews with direct beneficiaries and stakeholders. Tourism is one of the harmful
activity for the fauna and flora so data and information has also been collected from the tour
operators and tourists within the forest as when data collection was been done. About 21 tour
organisations are involved in the Sundarbans tourism operations and annually 120,000 tourists
visit the heritage site in the Sundarbans (Chaves, 2002; BPC, 2002; BPC, 2001). This
information was summarised based on a survey carried out 2003 (January-April). The study
used multiple techniques for data collection. The techniques used are sample surveys, semi-
structured interviews, and focus group discussions, transect walk and observation in the case
areas. Basically three different types of data have been collected through these collection
techniques. For environmental data and information, there was a long discussion with the
forest officials working in the field such as in the forest stations surrounding the Sundarbans.

Chapter 1 Introduction
7
The survey was done between February-July 2003 at different intervals and took into
consideration the wet and dry seasons. The tested results from SRDI-Dhaka have been used in
water salinity modelling.
To aid in acquiring field level data, a set of questionnaires had been developed which covered
the information necessary for this study. There were 40 basic questions, including both open
structured and semi-structured for the stakeholders. Open discussions have been made with
administrative, managerial and business groups, tour operators, tourists, NGOs, and relevant
research organisations. There were some trips with the tourists and shrimp farmers and
resource users in the Sundarbans for collecting information through personal interviews.
Beside these interviews, there was a special observation with the stakeholders involved with
the Sundarbans for their every day life information for the environmental investigation.
Besides questionnaires PRA (Participatory Rural Appraisal) and RRA methods were also
followed for accurate data collection from the stakeholders (PRA, 2002). Non structured
questionnaires surveys, discussions and interviews were employed to obtain data and
information from important administrative, decision and policy makers and research
personalities who are working on saline water, Ganges water sharing, and mangrove forest
and management of coastal ecology in Bangladesh. For the sample collection, 75 samples of
water and soil from 9 important sites inside and outside the Sundarbans were collected and
tested in the Soil Resource Development Institute (SRDI) laboratories in Dhaka and the
results have been shown in graphical presentation using EXCEL, SPSS, GIS ArcView, and
MATLAB software.
Secondary data and information such as in published books, journals, statistical data, research
reports, and maps were collected from various Government and non Government
organisations, universities, educational institutions and research organisations. The secondary
data as well as published materials and relevant books on the Sundarbans were collected from
book markets, universities libraries and research organisation in Dhaka, and Khulna. Some
primary and secondary data and information; and maps were obtained from international
environmental research organisations and water modelling institute such as Earth Observation
Research and Application Centre (EORC), Japan, Global Digital Data from Pennsylvania
State University, USA and USGS Louisiana, USA. Information on resource extraction,
environmental degradations, saline water, soil and revenue within the Sundarbans were
obtained from the Ministry of Environment and Forest and Institute of Forest Research in
Chittagong, Bangladesh Bureau of Statistic (BSS), Soil Resource Development Institute

Chapter 1 Introduction
8
(SRDI), Saline Water Research Centre Khulna, Department of Forest in Dhaka, Sundarbans
Biodiversity Conservation Project (SBCP) in Khulna, EGIS in Dhaka, Institute of Water
Modelling (IWM) Dhaka, BIWTA, BWDB, BARC libraries, BIDS, BIWTA, IUCN,
UNESCO, UNDP and Sundarbans related research institutions, universities and NGOs in
Bangladesh. The Satellite imageries MSS-5 TM 1980, TLS-5 1985, LANDSAT-5 TM BAND
2 1991, LANDSAT-5 TM BAND 2 3 4 colour, LANDSAT-5 TM BAND 2 3 4, 2002 colour
(collected from SPARRSO Ministry of Defence of Bangladesh, Satellite and Remote Sensing
Centre Bangkok, Thailand.) have been observed in papers and the areas/features depicted in
them visited physically. Methodological analyses have also been carried out on the satellite
imageries to understand the landscapes changing pattern(s) in the mangrove forests and
wetlands region. Journals and relevant research reports study area from NGOs, university
libraries, international and national organisations and various governmental offices from
Dhaka and outside of Dhaka in Bangladesh. GISArcView 9.1 applications have been
introduced for mapping and data visualisation on the Sundarbans mangroves wetlands
ecosystems. Papers and publications of international organisations and journals have been
used through internet and BTU libraries.
After completion of data collection, relevant data was processed and analysed both manually
and on the computer. MS excel, SPSS, GISArcView 9.1 and MATLAB version 7.1 software
were used for computer based analysis, data visualisation, graphics and development of
Fourier polynomial models. The results of interpretation are presented in tables and graphs,
visualisation maps and models. The methodologies followed for the research are presented in
the following steps. The concept development was based on the research project proposal and
conceptualisation of problems identification, selection of the study area, and preparation for
reconnaissance survey, realising and understanding existing conditions, field investigation and
data collection. Three types of data have been collected primary data from field investigation,
secondary data from institutions and published materials and tertiary data from recognised
published volumes from university libraries and research institutions. Finally data processing,
analysis and interpretation were done using relevant software in the development of
modelling and final report presentation.
1.3 Objectives of the study and organisation of the thesis The objective of the study is to contribute to the preparation of an adequate management plan
of cultural landscapes and surface water salinity in the Sundarbans, in combination with
sustainable use of natural resources and water salinity modelling which will contribute to
Chapter 1 Introduction
9
protect the mangrove wetlands ecosystems and ensure long-term conservation of cultural
landscapes and wetlands ecosystems in the south-western region in Bangladesh.
The specific objectives are as follows;
• To identify problems with the current situation of Sundarbans mangrove wetlands
ecosystems. The problem analysis is done primarily from an ecological perspective. With
additional socio-economic and transboundary governance analysis, there could be a better
understanding of the Sundarbans coastal mangrove wetlands ecosystems and means of
improving management policies to protect these globally significant wetland resources.
• To analyse of the present inadequate water salinity management systems, cultural
landscapes, mangrove wetlands ecosystems management and conservation strategies for
environmental resources in the Sundarbans.
• Investigation of the problems of landscapes changing pattern with in soil and water
salinity intrusion such as water quality, vegetation covering and shrimp cultivation at the
specific case areas in the Sundarbans.
• Explore the concept of cultural landscapes protection, and mangroves wetlands
ecosystems management; research applicability of the concept to the site.
• GIS application and environmental data analysis and visualization for having the real
scenarios of the Sundarbans mangrove wetland ecosystems.
• Time series modelling of water salinity (NaCl) in the Sundarbans rivers and analysing the
model results. Fourier polynomial models analysis, forecasting the salinity trends and
behaviour for different ecological zones in the Sundarbans mangrove wetlands for the
development of mangrove wetlands ecosystems.
• Water salinity Modelling using signal approximation by Fourier polynomials to describe
the actual status and contribute to the preparation of a comprehensive management plan
for the protection of cultural landscapes and mangrove wetlands ecosystems in the
Sundarbans region.
The study will make recommendations on the future development of the site and its
ecosystems, especially with regard to sustainable development, long-term conservation and
the management of cultural landscapes and contribute to the drawing of an adequate national
management plan for the protection of mangrove wetlands ecosystems in the Sundarbans
region.
In the present research, an effort has been made to analyse the mangrove wetlands ecosystems
and cultural landscapes changing pattern considering the salinity intrusion in the whole

Chapter 1 Introduction
10
Sundarbans area in Bangladesh. Based on the environmental impacts in the region salinity
modelling has been considered as priority issue for decision makers to make adequate
management plans for Sundarbans in respect to protecting the cultural landscapes and
mangrove wetlands ecosystems in the Sundarbans. The study is organised into 6 chapters.
Following a brief introduction, Chapter 1 outlines the goal and objectives of the study. For an
understanding of mangrove background, the problems identification and specific objectives of
this study have been discussed. The Sundarbans mangrove wetlands and its environmental
problems, deltaic characters, tidal floods slack and ebb slack, river bank erosion and
accretion, data collection methodology have been analysed. Chapter 2 studied the concept and
understanding of cultural landscapes and mangrove wetlands, cultural landscapes of
outstanding universal values and human layout and their distributions in tropic and subtropic
areas, the factors and forces of changing features of cultural landscapes, mangrove wetlands
performance as a dynamic network and functional benefits, socio-economic and cultural
aspects of wetlands and cultural landscapes, analysis of mangrove wetlands ecosystems and
discussions on cultural landscapes and the challenge of mangrove wetlands ecosystems.
Chapter 3 deals exclusively with the Sundarbans study area which is the case base studies of
this research. It includes an overview and distribution of mangrove wetlands in Bangladesh,
the geographical location and climatic condition, hydrology and geological formation of the
Sundarbans, deltaic mangrove ecosystems as unique marginal and fragile systems, salient
features of the deltaic mangrove ecosystems; and world heritage site and tourism development
and as an analysis of their socio-economic importance and local interdependency correlation.
In the same chapter the existing management strategies and pressure, problems and substantial
use of natural resource has been recognised as one of the major threats to ecosystems. The
present environmental degradation in the Sundarbans areas due to shortage of fresh water and
withdrawal of the Ganges water from upstream at the Farakka Barrage in India and the
negative impacts on the mangrove ecosystems and cultural landscapes in the down stream in
the Bangladesh Sundarbans regions have been identified and analysed. In Chapter 4 the
modelling of surface water salinity in the Sundarbans areas is comprehensively analysed.
There are 13 important rivers which have been selected as water salinity sampling points and
at every river point salinity samples have been collected and analysed based on salinity
intrusion rate on each point. The influential 13 rivers have been chosen for modelling and
include the Passur-Mongla River, Baleswar-Bogi River, Selagang-Harintana River, Sibsa-
Nalianala River, Bal-Jhalia River, Passur-Passakhali River, Betmargang-Kathka River,
Chapter 1 Introduction
11
Chunar-Munchiganj River, Kholpetua-Kobadak River, Notabakikhal-Notabaki River,
Arpongasia-Deboki River, Nilkamal-Hironpoint River and Malancha-Mandarbaria River.
Based on the scientific sophisticated data collection from those rivers in the dry season and
wet season, the time series models approach have been analysed using Fourier Polynomial
Models. In the use of Fourier Polynomial Models, these 13 rivers in the Sundarbans mangrove
wetlands, became representative of the whole mangrove wetlands area and depict river
salinity behaviour in the region. The salinity behaviour Models were developed and compared
and analysed with other points. The seasonal and yearly model behaviours were analysed
considering the seasonal upstream fresh water supply, yearly rainfall, temperature and others
climatic factors and environmental parameters. The Fourier Polynomial Models were
developed at the 13 important rivers and the strategically important locations where long-time
data is available. Through this polynomial modelling, a discussion and analysis has been done
using statistical approaches for forecasting the situation. These analyse are used in
observations of time series data and yearly salinity behaviour. As part of this study, a time
series salinity modelling was done which will aid in forecasting future salinity trends in the
regional ecosystems. The results of surface saline water modelling in the Sundarbans areas
have also been discussed more concisely and critically in Chapter 4. The elaborate discussion
tried to find out the goal oriented solution for ecosystems based management of the
Sundarbans mangrove wetlands. In Chapter 5 due consideration and observation have been
given some constructive integrated proposals and recommendations which have been
recognised for future implementation and ecosystems development and which will carry out a
way of sustainable fresh water supply and natural resource management in the Sundarbans.
Finally in Chapter 6 which is the concluding chapter of my thesis, summary and concluding
remarks have been highlighted. The summary of this research work shows the fundamental
solution and policies for the adequate management of the Sundarbans mangrove wetland
ecosystems.
Chapter 2 Cultural landscapes and mangrove wetlands in the tropical zone 12
Chapter 2 Cultural Landscapes and Mangrove Wetlands in the Tropical Zone
2.1 The concept of cultural landscapes and the understanding of wetlands
The term of landscape, which means both “perception of aesthetic view” and “mosaic of
interacting natural elements”, seems to be a source of discussion even in landscape ecology
(Naveh and Lieberman, 1984). A landscape is a natural topography and a set of heterogeneous
characters, which is perceptively, linked to the existential being of the body in societal space
and a cultural code for living, and a space for human praxis, and a mode of dwelling (Tilley,
1994). The term landscape was regio-regionis which emphasised a geographic aspect and
scenery. The concept of landscape was reintroduced in Italy in the 15th century with new
interest (Ingegnoli, 2002). The recent origin of thought clearly explained the naturalistic view
of landscapes as a backdrop of activities. A cultural view of landscapes as a highly specific,
symbolic and cognitive ordering of space offers far more potentials in understanding
(Fairbrother, 1974). Cultural landscape as an area of exceptional natural beauty, containing
superlative natural phenomena are means of linking local landscapes, actions events and
experiences together, providing a synthesis of heterogeneous phenomena (Head, 2000 ;
Buhman and Ervin, 2003). There is a wider relationship between social practices and
landscapes. The environmentalists, anthropologists and archaeologists have been interested for
a long time in the relationships between people and the landscape conceived by environmental
milieu (Figure 2.1). The local people and their landscapes are drawn on in the daily lives and
encounters. The landscape is embedded in the social and individual times of memory. Figure
2.1 shows an integrated correlation among the people-landscape and ecosystems such as
relation between people and landscapes, people and ecosystems, landscapes and ecosystems.
Analysis this integrated triangular relationship framework, the definition of cultural
landscapes can be considered based on these three elements of environment. Therefore,
cultural landscapes reflect interactions between people and their natural environment over
time and space. The term kulturlandskap or Kulturlandschaft would therefore immediately
explains itself and today the concept has become so well defined and become a term on its

Chapter 2 Cultural landscapes and mangrove wetlands in the tropical zone 13
own (Birks et al. 1999). Narrative is a means of understanding and describing the world in
relation to culture, heritage and civilisation. The great scholar bio-geographer Alexander von
Humboldt was the first to give a scientific definition in 1840 to the concept of landscape
(Landschaft) as “the total character of a region of the earth”, which is still considered
acceptable. Surface (landscape) is basically nature and culture is a fabric of human peculiarity.
Landscapes People
Ecosystems/ Ecological Processes
Figure 2.1 The environmental relationship framework
Presently, cultural landscape is the most spectacular global issue for economic growth and
balance ecosystems. By the late 20th century landscape had been embedded with a range of
meanings and values (Miening, 1979). The general meaning of landscape exists at two levels;
every day landscape and iconic landscape. The every day landscape refers to the ordinary
landscape, which is normally used in every day life whereas iconic landscape refers to
landscape iconography. Wetlands are a major feature of the landscape in almost every part and
in most important ecosystems on the earth. Nowadays, wetlands are described as the heart of
the landscape and it is called the biological centre because of the extensive food chain and rich
biodiversity. Wetlands function as the downstream receiver of water and waste from both
natural and human sources (Ahmed, 1995; Annette, 2000). The Ramsar Convention defined
Chapter 2 Cultural landscapes and mangrove wetlands in the tropical zone 14
wetlands as “areas of marsh, fen, peatland, or water, whether natural or artificial, permanent or
temporary, with water that is static or flowing, fresh, brackish, or salty, including areas of
marine water the depth of which at low tide does not exceed 6 metres” (Ramsar Bureau,
2005). Wetland sites are unique because of their hydrologic conditions. They serve as
reservoirs for water and help in ameliorating floods and drought. Cultural landscapes have
gained recognition because of their outstanding universal, natural and cultural values.
“Different types of cultural landscapes can be recognised around the world from the Mongolia
semi-desert Prairies to the upland Prairies of the Southern-European mountains, from the olive
orchards of the Mediterranean, to the rice terraces of the Philippine mountains and the
Sundarbans mangrove wetlands in Bangladesh and India where human presence and its related
influence, modification and disturbance have a long history of co-evolutionary process”
(Farina, 1998). The World Heritage Convention (1972) has defined three categories of cultural
landscapes (UNESCO, 1999). The most easily identifiable is the clearly defined landscape
designed and created intentionally by humans. The second category is generally evolved
landscape. This results from an initial social, economic, administrative, or religious imperative
and has developed its present from association with and in response to its natural environment.
There are two subcategories of such landscapes: a) A relict landscape; an outstanding example
is the Hortobagy National Park in Hungary. The Sundarbans mangroves (a Ramsar site) can be
categorised as a relict cultural landscape (Islam, 2003). b) A continuing landscape; there is an
example of continuing landscape in Europe: Öland in Sweden (Droste et al., 1995). The final
category is the associative cultural landscapes where powerful religious, artistic or cultural
associations of the natural element exist rather than material cultural evidence, which may be
insignificant or even absent. The Uluru-Kata Tjuta national park is of outstanding significance
to Australia’s indigenous people (Droste et al., 1995; Rössler, 2000; UNESCO, 2000; 2001).
A forest or wetland which is frequented and which natural resources are utilised by people
directly could also be classified as a cultural landscape. Based on this criterion the Sundarbans
has been considered both as a cultural landscape and a natural heritage site.
2.2 Mangrove origin, diversification and distribution in the world There are some theories and hypothesis of the origin and distribution of mangrove in different
part of the world. But to recognise and identity of the actual time and space of mangrove

Chapter 2 Cultural landscapes and mangrove wetlands in the tropical zone 15
species is quite hard for the scientist. In general the origin of the mangroves and some of the
imagine routs to the new world which showing fossil sites, as far as possible believed that the
end of Cretaceous (100-70 Ma). According to Chapman (1975; 1976) the migration routes
through the Tethys Sea and to the new world it would be supported by the fossil investigation
and it is acceptable than the Trans-Pacific migration routs (Figure 2.2). It is very difficult to
say the exact time when the mangroves appeared and diversified in the geotops. Until now
there are some contradictory hypotheses concerning the mangroves distribution and
origination. According to Rull in 1998 the Nypa mangrove plam is the oldest mangrove of the
region and from the cretaceous period. During the Eocene period the Nypa flora extended to
higher latitudes. It was very common along the north eastern Brazilian coast (Wijmstra, 1969).
Figure 2.2 Origin of mangroves and distribution in the world (after Lacerda, 2001)
(Note: A - Southeast Asia origin centre, B - Tethys sea origin centre. 1 - Migration through the
Tethys Sea to the Atlantic and TransPacific migration, 2 - Migration from the Tethys Sea to
Southeast Asia and the Atlantic through the Panama isthonus, 3 - Antarctica / South Africa
and surrounding islands route).

Chapter 2 Cultural landscapes and mangrove wetlands in the tropical zone 16
“The rich mangrove flora and fauna for Indo - Pacific acquired its mangrove species about 80
million years ago. The genera Rhizophora and Avicenna are thought to have evolved earlier
and may have spread through the Tethys Sea (which is now called the Mediterranean Sea),
east coast of America and west coast of Africa. In general, the hypothesis of the distribution of
mangroves in the American continent has been developed in Pleistocene time. Figure 2.2
shows the location of migrations and the origin of mangroves. For example the common
species Nypa frutican was alone in the Caribbean basin to north-western Brazilian coast. The
Eocene mangrove suddenly disappeared at the end of this epoch and post Eocene species was
totally different than before. The two kind of species of post Eocene period that is Pelliciera
and the post Eocene mangles where Rhizophora prevailed and associated with acrosticchum.
It is suspected that perhaps they have reached the Caribbean by early Eocene (50-55 Ma).
Contemporaneous to Pelliciera, extensive Rhizophora and Avicennia forests covered the
northern South American coast. The Americas show abundant mangroves which have
confirmed the early Eocene as the probable date of mangrove arrival to the new world”
(Figure 2.3) (Lacerda, 2001).
Mangrove Zone
Figure 2.3 The present mangroves distribution and location in the world
There are different views on the origin of mangroves and some of the proposed routes to the
new world. The possible origins and migratory routes of mangroves are depicted in Figures
2.2 and 2.3. Mepham (1983), one of the mangrove experts made very strong argument against

Chapter 2 Cultural landscapes and mangrove wetlands in the tropical zone 17
some hypotheses of the origin of mangrove flora in East Asia and their distributions.
According to Lacerda (2001), Tethyan was the region where mangroves first accumulated and
some are still present in this region. According to Duke (1995), the origin and evolution of
Avicennia ancestor appeared during the early Cretaceous period, along the northwest coast of
Gondwanaland. The distribution of mangroves along the American continent prior to the full
development of glaciations in the Pleistocene seems to reflect the climatic conditions of that
time (Lacerda, 2001). Considering the world distribution of mangroves the highest dominating
part of the world is the south and south East Asia where 42 % of mangroves are found and the
second highest part is the American continents where 27 % of mangroves are found. Only 15
% of mangroves are found in West Africa and 10 % in Australia and only 6 % are found in
East Africa and the Middle East areas (Figure 2.4).
Australia10%
Americas27%
West Africa15%
East Africa and Middle East
6%South and South
East Asia42%
South and South East Asia Americas West Africa Australia East Africa and M iddle East
Figure 2.4 Mangrove distributions according to the region
Until now there are 70 species of mangroves that have been recognised in the world whereas
37 species are found in Australia and the Asia-Pacific region. This represents 52 % of the
world mangrove species. In the Sundarbans mangrove forest, 66 mangrove species have been
recognised, where 36 are mangrove species and 30 are mangrove obligate plant species
(Appendix 2). By comparison, in America and Africa only 7 to 8 obligatory mangrove plant
species are found, while in the Indo-West Pacific region, this is typically 20 to 40 species
(Appendix 3). In this sense, Sundarbans is very rich in mangrove biodiversity considering to
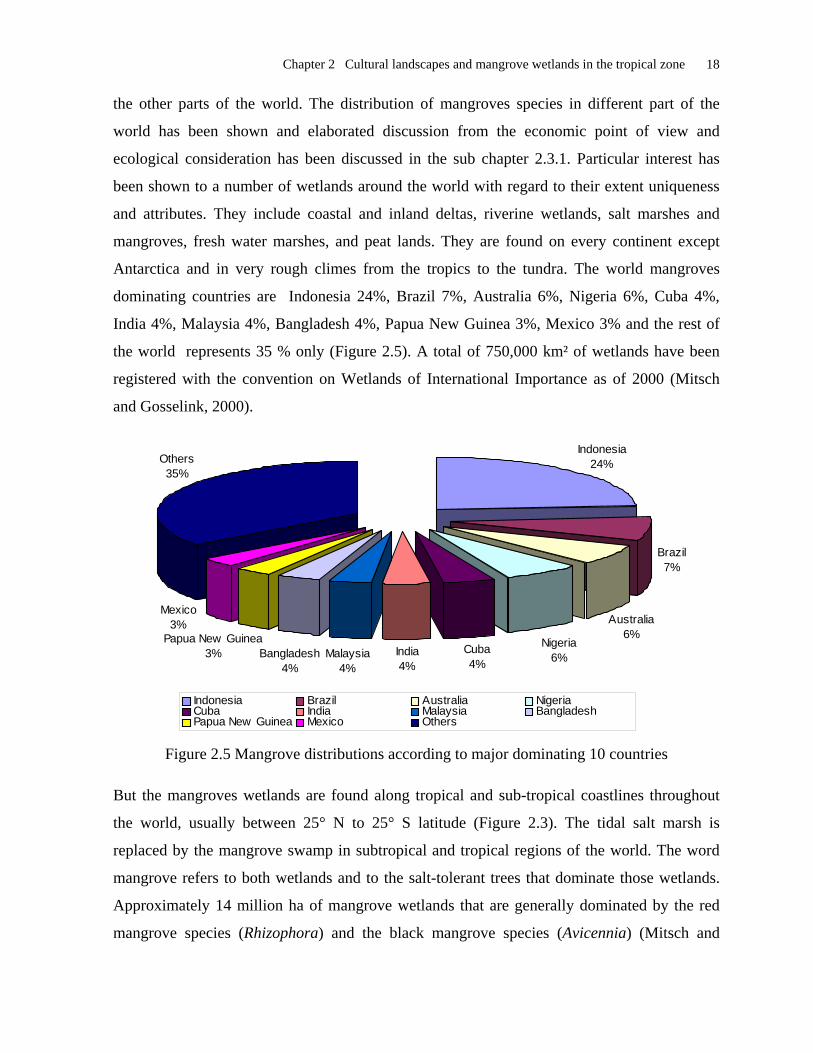
Chapter 2 Cultural landscapes and mangrove wetlands in the tropical zone 18
the other parts of the world. The distribution of mangroves species in different part of the
world has been shown and elaborated discussion from the economic point of view and
ecological consideration has been discussed in the sub chapter 2.3.1. Particular interest has
been shown to a number of wetlands around the world with regard to their extent uniqueness
and attributes. They include coastal and inland deltas, riverine wetlands, salt marshes and
mangroves, fresh water marshes, and peat lands. They are found on every continent except
Antarctica and in very rough climes from the tropics to the tundra. The world mangroves
dominating countries are Indonesia 24%, Brazil 7%, Australia 6%, Nigeria 6%, Cuba 4%,
India 4%, Malaysia 4%, Bangladesh 4%, Papua New Guinea 3%, Mexico 3% and the rest of
the world represents 35 % only (Figure 2.5). A total of 750,000 km² of wetlands have been
registered with the convention on Wetlands of International Importance as of 2000 (Mitsch
and Gosselink, 2000).
India4%
Nigeria6%
Cuba4%
Malaysia4%
Brazil7%
Others35%
Indonesia24%
Australia6%
Bangladesh4%
Papua New Guinea3%
Mexico3%
Indonesia Brazil Australia NigeriaCuba India Malaysia BangladeshPapua New Guinea Mexico Others
Figure 2.5 Mangrove distributions according to major dominating 10 countries
But the mangroves wetlands are found along tropical and sub-tropical coastlines throughout
the world, usually between 25° N to 25° S latitude (Figure 2.3). The tidal salt marsh is
replaced by the mangrove swamp in subtropical and tropical regions of the world. The word
mangrove refers to both wetlands and to the salt-tolerant trees that dominate those wetlands.
Approximately 14 million ha of mangrove wetlands that are generally dominated by the red
mangrove species (Rhizophora) and the black mangrove species (Avicennia) (Mitsch and

Chapter 2 Cultural landscapes and mangrove wetlands in the tropical zone 19
Gosselink, 2000). The present world’s mangrove vegetation cover has been estimated with an
average of about 17 million ha, of which about half are in the Asia-Pacific region. The
remaining 50 % is equally distributed in Africa (25 %) and the America (25 %) (Lacerda,
2001).
2.3 Challenge of cultural landscapes and mangrove wetlands ecosystems
Developmental activities in the wetland areas are mainly aimed at the reduction of flood level
and the size of wetlands to facilitate irrigation and agricultural cropping development.
Formerly, this was done naturally by wetlands and today it is done by dames and other
hydraulic engineering measures. The flood protection embankments have hydraulic regime for
sustainable management of wetlands (Ahmed, 2000). The process of continual losses of
wetlands threatens to maintain life resulting in the reduction of wildlife habitat and replacing
and displacing of wetlands based socio-economic activities. The threats are especially strong
in the mangrove forests where huge areas are already converted to shrimp cultivation with
disastrous consequences for the forests as well as for natural fishes (Khan et al. 1994; Dugan,
1993). In Bangladesh, the wetlands have suffered from human population and approximately
2.1 million ha of wetlands have been lost to flood control, drainage, irrigation development
and other human developmental activities (Nishat, 1993). The scale of mangrove depletion
and its causes vary from country to country. Coastal habitats and human stress are the vital
reasons for exploitation of terrestrial aquatic and mangroves resources. Some main factors
have been identified which are responsible for the decline of mangrove resources;
i) Mangroves converted to shrimp farms and fishing
For the last 40 years shrimp farming has been highly popular and profitable agro fishing
business in the tropic and sub-tropic region. Mangroves in the South Asian countries
especially in Thailand, the Philippines, Vietnam, Indonesia, Malaysia and Sri-Lanka have
been converted to shrimp ponds and farms. Approximately 1000 km2 of land now utilised for
shrimp culture in Bangladesh was originally mangrove forest (Philip, 1999; Choudhuary et al.,
1990). In recent years areas occupied by mangrove have declined by 34% in India, 45% in
Bangladesh, 45% in Thailand and 99 % in the Indus delta in Pakistan (Siddiqi, 2001).
ii) Agricultural extension and urbanisation
Mangrove forest reclamation for agriculture is quite common in high population density
countries in the tropic and sub-tropic region. High proportion of mangroves lands have been

Chapter 2 Cultural landscapes and mangrove wetlands in the tropical zone
20
converted to agricultural lands. Historically the boundary of the present Sundarbans boarder
was at the suburban of Calcutta and near Khulna in Bangladesh. In many countries the
mangroves have been converted to urban areas, ports, airports, industrial estate, tourism
complex and wild life watching tower. The Mongla port and Munchiganj were recently
developed as urban growth centres (Siddiqi, 2001).
iii) Conversion of mangrove forest to salt pans and mining activities
In most countries the salt production industries have been constructed in the coastal zone and
in the mangrove forest sites. Salt production areas in mangrove are spread over the tropical
coasts of Asia and Africa including India, Benin, Thailand, the Philippines, Senegal, Brazil
and Venezuela etc (Siddiqi, 2001). In the Sundarbans the oil and gas mining activities are on
going practice which could be harmful for the mangrove habitats, biodiversity and ecosystems.
iv) Human influences and substantial use of mangrove resources
In the greater sense the mangrove world can be divided into two major economic zones such
as Indian - Pacific Ocean mangrove economic zone, which is the larger economic zone in the
world and where most of the mangroves dominated countries are situated. On the other hand,
geographically mangroves world has been divided into 6 important zones (Figure 2.6) such as
(i) Indo-Malaysia (ii) Australasia (iii) Western Coast of Americas (iv) Eastern coast of
Americas (v) Western coast of Africa and (vi) Eastern Coast of Africa and Middle East.
1
3 4 5 6 2
1
2
Atlantic East Pacific (AEP) Indo-West Pacific (IWP)
Figure 2.6 World mangroves economic zone (after Morley, 2000; Eco-world Organisation, 2004)
Chapter 2 Cultural landscapes and mangrove wetlands in the tropical zone 21
The countries that fall within the greater mangroves economic zone include Indonesia,
Malaysia, Australia, New Zealand, Thailand, the Philippines, Taiwan, China, Vietnam,
Myanmar, Bangladesh, India, Pakistan, Srilanka, the Maldives, Kuwait, UAE, Egypt, Kenya,
Madagascar etc. The Atlantic-Pacific mangrove economic zone is situated in between these
two oceans and covers mangroves dominated countries like Nigeria, Ghana, Togo, Ivory
Coast, Gambia, Brazil, USA, Cuba, Mexico, Venezuela, Colombia, Panama, Costa Rica, and
France Guinea. The coastal dwellers of these countries generally use the mangroves resources
very openly.
v) Upstream diversion and dam construction
In many mangroves region withdrawal of fresh water from the upstream rivers for irrigation
and other purpose has serious negative impact on mangroves and cultural landscapes. The
extensive mangroves of Bangladesh, Gambia and Nigeria are facing the problem of upstream
fresh water crisis.
vi) Tourism and recreational activities
Globally, coastal mangrove forests serve as an important spot of recreation and tourism. It is
an attractive location because of sea beach, forest and water, which create wonderful
combination of natural phenomena. Conversely this has a huge negative impact when a large
number of tourists are attracted to the ecologically sensitive region without considering the
value of ecosystems (WTO, 2002).
vii) Natural calamities
Cyclones, Tsunami and tidal surges are the most devastating threats for mangrove wetlands.
(Huq et al., 1991; Salar et al., 1994). In recent times, the Tsunami has come as an issue of
natural calamity. On the 26th December 2004 a Tsunami affected the Asia Pacific region, the
Bay of Bengal and the Indian Ocean (Alam et al., 1998). The cyclone Cidr on 15th November
2007 destroyed huge mangroves and natural resources were severely affected and almost
10,000 peoples were killed in the Sundarbans coastal zone in Bangladesh.
2.3.1 Socio-economic and cultural aspects of mangrove wetlands and
cultural landscapes
Wetlands are of great ecological and socio-economic importance. Wetlands also provide
habitat for a variety of resident and migratory waterfowl, a significant number of endangered
Chapter 2 Cultural landscapes and mangrove wetlands in the tropical zone 22
species of international interest and large number of commercially important ones. Wetlands
also support a significant range of other activities such as extraction of reed, harvesting of
edible aquatic vegetation and their products, medicinal herbs, shells etc (Salar et al., 1994).
There are some 60 % of the world’s population living within 60 km of the sea or in the coastal
region and the socio-economic and environmental significance of the boundary between the
land and the ocean is widely recognised (Brown, 1997). In Bangladesh over 10 million people
live in the coastal region and offshore islands, although this rate is much lower than other
coastal part of the world. The inhabitants of the coastal region are mainly involved in fishing,
cattle rearing, traditional agriculture, forest resource collection and mangrove handicrafts
making practices (Mondal, 1992). Chan et al., (1996) noted that the Matang mangrove in
Malaysia plays an important role in the socio-economic sector. The 1400 ha Matang
mangroves provides employment for about 12500 workers and generate an annual revenue of
about US $ 42 Million (Chan et al., 1993; 1996). The Sundarbans mangrove forest is exploited
for a range of forest products, of which most important are saw-timber, industrial raw
materials, thatching materials and fuel wood. One of the most important non-wood forest
products is Nypa fruticans leaf that is used for posts and frames of walls of local houses. The
forest provides livelihood and employment to woodcutters, fishermen, honey and wax
collectors, shell collectors, timber traders and other workers. It has been estimated that about
600,000 people are employed in every 6 months in a year (UN ESCAP, 1988; 1999).
Furthermore over 6 million people depend directly or indirectly on the Sundarbans natural
resources (Anon, 1995; MAP, 2000). This information indicates that the socio-economic
aspects of the Sundarbans are linked with different communities (Alam, 2001). The annual
value of the wood products removed from the Sundarbans mangrove forest is worth 100
million US dollars. The annual value of fish caught is 304 million US dollars, which is three
times larger than the annual value of forest product (Alam, 2001; Hussain et al., 1994;
Helalsiddiqi, 1999). The Sundarbans mangrove forest, Mekong river delta and mangrove are
good examples of socio-economic interaction which depends on mangrove wetlands.
2.3.2 Benefits of mangrove ecosystems management Ecosystems management is the only way to get past the piecemeal approach to environmental
management. Traditional approaches tend to take the symptoms of one problem at a time,
Chapter 2 Cultural landscapes and mangrove wetlands in the tropical zone 23
usually when problems become crises. The mangroves wetlands are affected by polluted water
which is a threat for balancing the mangrove wetlands ecosystems. It becomes the most
ecological priority issue to the communities. Some specific public beneficial issues are
discussed here;
• Ecosystems management provides an opportunity to avoid ecological, social and
economical crisis management.
• Ecosystems management would allow making a framework of flexible management and
environmental information systems as well as a sustainable ecosystems management plan.
• Ecosystems management is a system which can minimise the negative impacts that occur
within the environmental and resource management field.
• Ecosystem management allows natural resource management systems for a long term or a
sustainable management of ecosystems functions of a specific area.
As a whole ecosystem management allows to minimize or reduce the future threats through
forecasting and risk by addressing very potential environmental problems as well as
anticipating catastrophe, and maintaining functional ecosystems.
2.4 Ecology and biological setting of mangrove forest ecosystems Mangrove plants include trees, shrubs, ferns and palms. These plants are found in the tropics
and subtropics on the river banks and coastlines. They are usually adapted to anaerobic
conditions of both salt and fresh water environment and have developed growing roots which
absorb oxygen. Considering the world mangrove characteristics, some important
environmental settings have been classified in which mangrove colonization often occurs in
different parts of the world.
a) The deltaic region which is dominated by the river flows and that extends seawards away
from land, is one of the settings in which mangrove are found along a tropical coastline.
Such important deltas receive a huge quantity of waters and sediments from the interior
such as from the Mississippi, Ganges, Brahmaputra, Indus and Amazon River’s delta.
b) The delta which is dominated by the coastal tide does not extend into the sea but it is
formed within the confines of the coast.

Chapter 2 Cultural landscapes and mangrove wetlands in the tropical zone 24
c) The mangroves colonize the heads of drowned tributary valleys and grow along the shores
of lagoons behind bay barriers near the estuary mouth.
2.4.1 Physical factors of mangrove wetlands and forest development In the case of mangrove forest development there are various types of biotic and abiotic
factors that are responsible for development of floral and fauna species migration and
distribution and luxuriance of the mangrove ecosystems. According to Chapman (1975) and
Hutchings (1987), abiotic factors influence the establishment and development of mangroves
in different parts of the world. These factors are explained below;
i) Temperature
The mangroves are very sensitive to frost in the freezing temperatures. The temperature
regulates a large number of internal energy processes including salt regulation and excretion
and root respiration. A very extensive mangrove only occurs when the average temperature of
winter month is 20° C and where seasonal range does not exceed 10° C.
ii) Shallow shores
Mangrove plants require huge quantity of water. At the primary stage shallow water areas are
suitable for the establishment of seeds and germination. The mangroves seedlings cannot
anchor in deep water. Shore mangroves occupy a very narrow zone only.
iii) Mud substrate and aridity
Mangroves are able to grow on sand, peat and coral, the most extensive mangroves are
invariably associated with mud and muddy soils. The high flow of the rivers, upstream water
flows of rivers carry alluvial sands, mud to tidal flats thus, forming substrate for mangrove
colonization and succession (Choudhury and Chaudhury, 1994).
iv) Salinity
Saline water or salt is the most essential requirement for mangrove production and
development. As a whole salinity plays an influential role in mangrove germination, survival,
growth, distribution, reduction and zonation of mangrove species. Different kinds of mangrove
species development depend on different levels of salinity. The species Rhizophora is an
obligate halophyte with poor production because of the reduction rate of salt. On the other
hand heritiera fomes has strong preference for low salinity and its growth rate depend on tidal
inundation and fresh water supply and the production rate can be decreased with increase level
of salinity (Siddiqi, 2001; Brammer, 1999).

Chapter 2 Cultural landscapes and mangrove wetlands in the tropical zone 25
2.4.2 Ecosystem concept and adaptive mangrove ecosystems management The present management of natural resources has entered in a period of change and
uncertainty. The paradigm emphasises sustainable ecosystems rather than sustainable yield
and focuses on management of whole systems for different kind of purposes. An integral part
of ecosystem management is the realisation that the social system ultimately puts boundaries
and constraints on our ability to manage the biological system. Some American geologists also
highlighted and concurred with the famous Russian geologist Dokuchaev’s theory on
ecosystem, who also initiated and developed the concept of soil genesis and formation in 19th
century. The proposed soil development was influenced by soil-forming factors such as
climate, parent material, organisms, relief or topography and time (Vogt et al., 1996).
Dokuchaev also expressed this relationship in a mathematical format; where he tried to define
soil. Soil formation is the combined function of climate, parent material, organism, and relief
and a period of time. The integrated functions with these elements of soil formation are
depicted by the mathematical formula below;
S = f (cl, pm, o, r, t, .............)
Where cl - climate, pm - parent material, o - organism, r - relief or topography and t - time
(Glink, 1927 and Vorg et al., 1996).
According to Dokuchaev the soil forming equation can be readily converted to an equation
expressing the parts of ecosystems that should be considered as part of the management:
Ecosystems = f (S, cl, pm, o, r, t, ..……...)
Where S - soil, cl - climate, pm - parent material, o - organism, r- relief or topography and t-
time.
Considering the definition of Dokuchaev and Vogt, the sophisticated definition of ecosystems
can be structured on the following formula;
Thus ecosystems mean the functions of biotic and abiotic systems as shown in the following:
Ecosystems = f (biotic and abiotic)
= f (plant, animal, micro organism, water, soil, energy, ...)
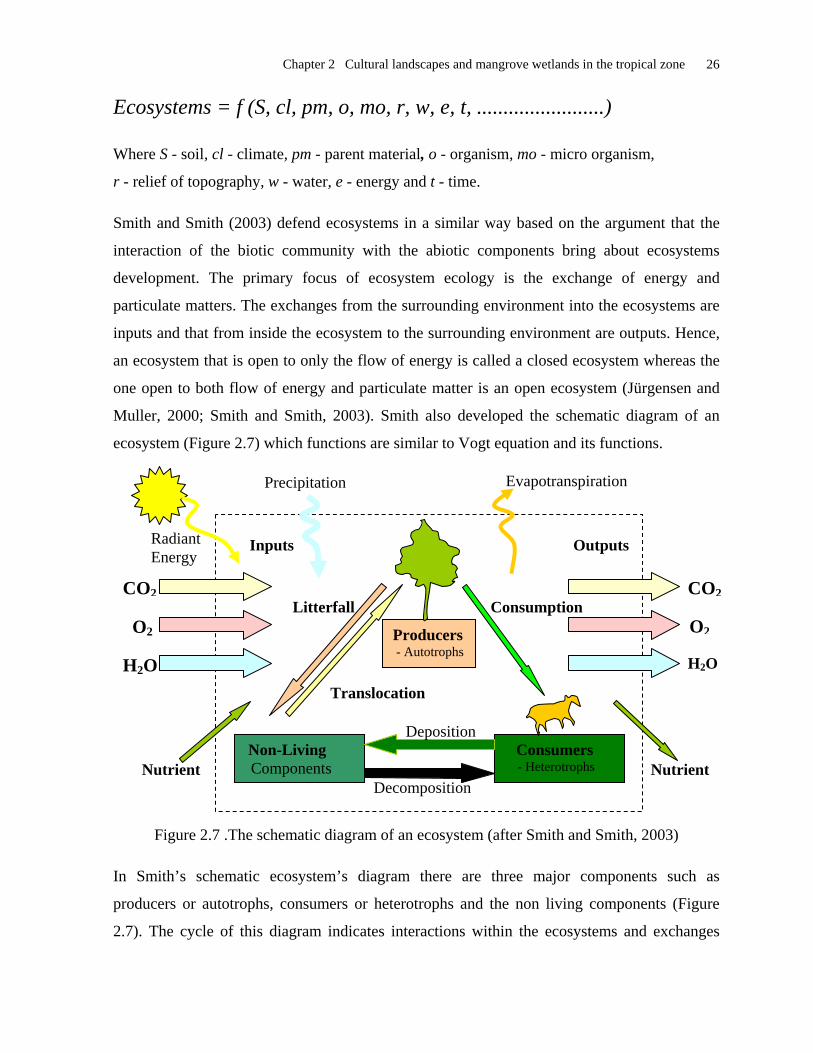
Chapter 2 Cultural landscapes and mangrove wetlands in the tropical zone 26
Ecosystems = f (S, cl, pm, o, mo, r, w, e, t, ........................)
Where S - soil, cl - climate, pm - parent material, o - organism, mo - micro organism,
r - relief of topography, w - water, e - energy and t - time.
Smith and Smith (2003) defend ecosystems in a similar way based on the argument that the
interaction of the biotic community with the abiotic components bring about ecosystems
development. The primary focus of ecosystem ecology is the exchange of energy and
particulate matters. The exchanges from the surrounding environment into the ecosystems are
inputs and that from inside the ecosystem to the surrounding environment are outputs. Hence,
an ecosystem that is open to only the flow of energy is called a closed ecosystem whereas the
one open to both flow of energy and particulate matter is an open ecosystem (Jürgensen and
Muller, 2000; Smith and Smith, 2003). Smith also developed the schematic diagram of an
ecosystem (Figure 2.7) which functions are similar to Vogt equation and its functions.
CO2
H2O
Inputs Outputs
Producers - Autotrophs
Non-Living Components
Consumers - Heterotrophs
O2 O2
Nutrient Nutrient
Litterfall
Translocation
Decomposition
Radiant Energy
Evapotranspiration
Deposition
Consumption
Precipitation
CO2
H2O
Figure 2.7 .The schematic diagram of an ecosystem (after Smith and Smith, 2003)
In Smith’s schematic ecosystem’s diagram there are three major components such as
producers or autotrophs, consumers or heterotrophs and the non living components (Figure
2.7). The cycle of this diagram indicates interactions within the ecosystems and exchanges

Chapter 2 Cultural landscapes and mangrove wetlands in the tropical zone 27
with the external environment. An ecosystem is fundamentally made up of a physiochemical
environment called the biotope and a set of living species, animal and plants, called the
biocoenosis. Furthermore Smith and Smith (2003) mentioned two types of ecosystems; the
aquatic ecosystem and the terrestrial ecosystem with both consisting of three basic
components namely, the autotrophs, the heterotrophs, and the non living components, which
are essential elements in ecosystem development. Wetland ecosystems combine many
structural and functional attributes of both terrestrial and aquatic ecosystems. A functioning
that comprises all the transformations linked to the energy cycle, the cycle of water and soil or
minerals. Figure 2.8 shows a combined relationship within atmosphere, water and soil cycling
in wetland ecosystems.
Atmosphere Water Soil
AbsorptionRainfall
Evapotranspiration
Decomposition oforgannic molecules
Leaching Uptake
Dissolution
DenitrificationVolatilization
Figure 2.8 The general scheme of mineral cycling in a wetland ecosystems (after Dykyjova
and Ulehlova, 1998)
Similar characteristics and relationships process within mangrove wetlands ecosystems can be
seen in Figure 2.9. The mangroves are composed of trees and shrubs remarkably adapted to
tidal and coastal land through their ability to live in poorly oxygenated sediment and can
tolerate inundation by salt water through physiological chemical mechanisms (Morley, 2000).

Chapter 2 Cultural landscapes and mangrove wetlands in the tropical zone 28
Water Column
Direct precipitation
Solar
Phytoplankton
White Mangrove
Black Mangrove
Red Mangrove
Waterfowl,birds
Larger fish
Juvenil-e fish
Crabs
Vertebrate
Mosquitos
Bottom Detritus
Standing dead
Active Sediments Deep
Sediments
Benthos Im
igra
tion
/ Im
mig
ratio
n
Outwelling
Energy /water
Organic C/ Nutrients
Evapotranspiration
Dissolvednutrients
DOC Particulate nutrients
Salinity
Zoo- plankton
Tidal exchange
Upland inflow
Terrestrial Carbon
Hurricane
Figure 2.9 The conceptual model of mangrove wetlands ecosystems (after Mitsch and
Gosselink, 2000)
The conceptual model of the mangrove wetland ecosystem diagram (Figure 2.9) shows the
interconnection among fresh water inflow, tidal exchange, crabs, salinity and nutrients
interaction within this process. In general the wetland ecosystems are physical links between

Chapter 2 Cultural landscapes and mangrove wetlands in the tropical zone 29
terrestrial and aquatic resources (Figure 2.10). As such they receive from the following
schematic way; the diagram (Figure 2.10) shows the integrated relationship between two types
of ecosystems namely aquatic ecosystems and terrestrial ecosystems. In the figure arrows
represent the transfer of materials and energy from one ecosystem to another.
Terrestrial ecosystems Aquatic ecosystems
Wetlands Ecosystems
Figure 2.10 Ecosystems relationship (adapted from Erickson, 1994)
There are physical and dynamic links between terrestrial and aquatic resources and wetlands
ecosystems (Erickson, 1994; Curry and Mcguire, 2002). Mangrove forest ecosystem
management is one of the new approaches to environmental and natural resource management.
According to Vogt et al., (1996) 10 potential principles have been identified that characterize
the ecosystems approach. The principles are as follows; the definition of ecosystems
management where the concept would be clear that humans are part of the ecosystems and
consider their values and demand. Ecosystems management boundaries, Development of
ecosystems management plan, policies, rules and regulations. Ecosystems management tools
and technologies, collection of economic social and ecological information for decision
making, recognition of ecological constraints, strong co-ordination between stakeholders and
property owners, develop feedback mechanisms in all steps for promoting adaptive
ecosystems management. Adaptive management is a term that occurs in most written
discussions ecosystems management. It can be said that the meaning of adaptive ecosystems
are measurable objectives in ecosystems functions and in social desire by scientifically using
current data, monitoring and adjustment with management practice of ecosystem capacity
(Vogt et al., 1996; Folk, 1998).

Chapter 2 Cultural landscapes and mangrove wetlands in the tropical zone 30
2.4.3 Mangrove wetlands performance as dynamic network and functional
benefits
The mangrove wetlands have a unique mosaic of habitats with an extremely rich diversity of
flora and fauna, and yet most of the forests areas are undiscovered. Mangrove wetlands also
support the livelihood of millions of people from such diverse activities such as fishing,
collection of natural honey, materials for thatching and fuel wood. Mangroves wetlands serve
as filtering system to clean up polluted water, protect coastlines from erosion and act as
barriers against storm surges besides providing people with wide range of staple food plants,
grazing lands and fuel (Khan et al., 1994).
Mangrove Processes Nursery habitats Primary productivity Sedimentation Nutrient cycling Succession Biomass Litter dynamics Organic matter export
Mangrove Functions Habitat quality Water quality Shoreline protection Prevent erosion Flood water reservoir Natural productivity Indigenous livelihood Aesthetics consequenceProductive ecosystems Delicate balance Soil formation Vegetation harvesting Cleanup polluted waterAct as barrier Develop human society
Mangrove Uses and Values Shrimp pond/ prawn Extraction of reed Fishing Timber and wood Fuel /Energy Salt production Agriculture field Silviculture Tourism Biodiversity Natural heritage Signs of civilization Medicinal herbs Aquatic shelter Raw materials
Soci
o- E
cono
mic
Impr
ovem
ent
Socio-Cultural and Environmental Impacts
Figure 2.11 Ecosystem-human economy model (after Mitsch and Gesselink, 2000)
The process of mangroves and major roles and functions of mangroves ecosystems are as
follows (Figure 2.11). Mangroves help in soil formation by trapping debris, They serve as
sieve for rich organic soil washed down through river systems into the sea, provide
appropriate ecosystem and nutrient shelters for fish, marine invertebrates, mollusca and birds,
they contribute detritus which enhances the productivity of the ecosystem. The functions of
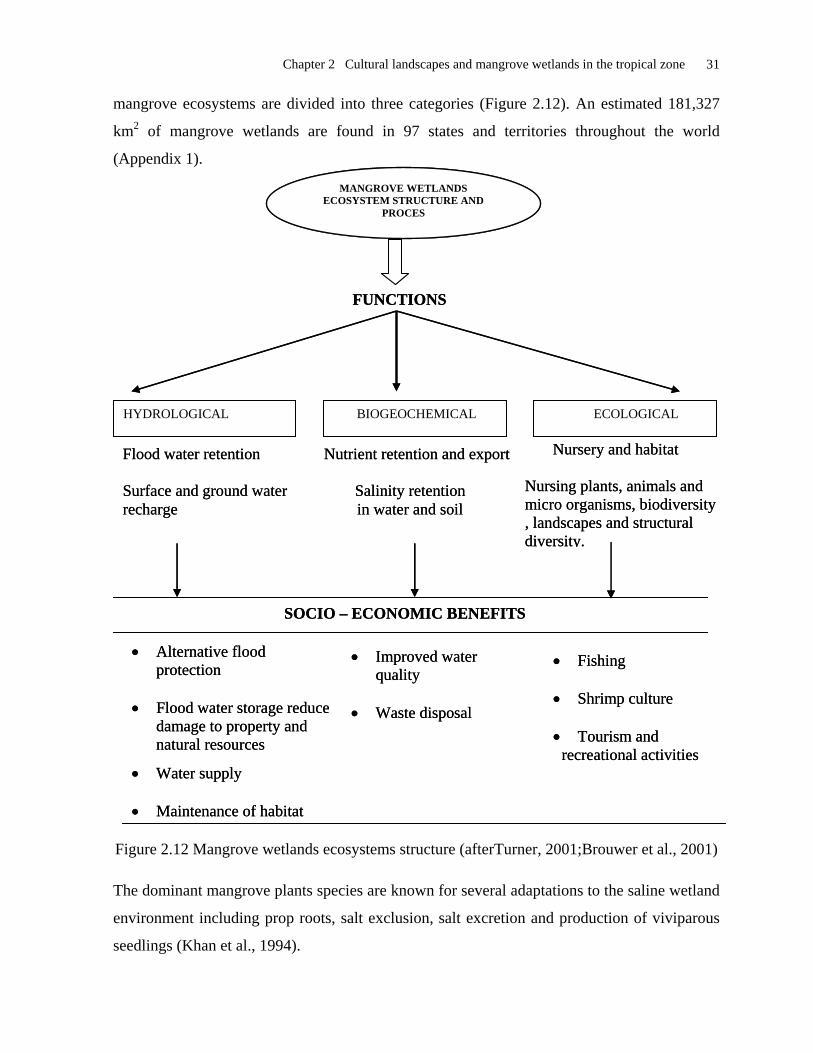
Chapter 2 Cultural landscapes and mangrove wetlands in the tropical zone 31
• Improved water quality
• Waste disposal
• Fishing • Shrimp culture • Tourism and recreational activities
• Alternative flood protection
• Flood water storage reduce
damage to property and natural resources
• Water supply • Maintenance of habitat
MANGROVE WETLANDS ECOSYSTEM STRUCTURE
AND PROCESS
FUNCTIONS
HYDROLOGICAL BIOGEOCHEMICAL ECOLOGICAL
Nursery and habitat Nursing plants, animals and micro organisms, biodiversity , landscapes and structural diversity.
Flood water retention Nutrient retention and export Surface and ground water Salinity retention recharge in water and soil
SOCIO – ECONOMIC BENEFITS
• Improved water quality
• Waste disposal
• Fishing • Shrimp culture • Tourism and recreational activities
• Alternative flood
mangrove ecosystems are divided into three categories (Figure 2.12). An estimated 181,327
km2 of mangrove wetlands are found in 97 states and territories throughout the world
(Appendix 1).
MANGROVE WETLANDS ECOSYSTEM STRUCTURE AND
PROCES
FUNCTIONS
protection • Flood water storage reduce
damage to property and natural resources
• Water supply • Maintenance of habitat
HYDROLOGICAL BIOGEOCHEMICAL ECOLOGICAL
Nursery and habitat Nursing plants, animals and micro organisms, biodiversity , landscapes and structural diversity.
Flood water retention Nutrient retention and export Surface and ground water Salinity retention recharge in water and soil
SOCIO – ECONOMIC BENEFITS
Figure 2.12 Mangrove wetlands ecosystems structure (afterTurner, 2001;Brouwer et al., 2001)
The dominant mangrove plants species are known for several adaptations to the saline wetland
environment including prop roots, salt exclusion, salt excretion and production of viviparous
seedlings (Khan et al., 1994).
Chapter 2 Cultural landscapes and mangrove wetlands in the tropical zone 32
2.4.4 Salient features of the deltaic mangrove wetlands ecosystems
The landscapes of the Sundarbans consist of a large number of fluvial and tidal
geomorphologic features created by the GBM river systems. Mudflats are formed along the
estuaries or riverbanks and are subjected to direct wave action, flow and turbulence of the
water currents in the river. The lower parts of mudflat remains submerged during all high
tides. Ridges or levees are found because of sediment deposition on the edge of riverbanks.
The erosion and accretion balance in the Sundarbans has been estimated to be 146 km² for
period 1960-1984 (Jabbar, 1992; Siddiqi, 2002). The causes of alluvial deposition are owing to
the rise of the forest floor and irregular flow of tidal water as a result, seedling and mangrove
regeneration do not take place properly (Coleman, 1964). A close network of interconnected
tidal rivers and creeks dissect the Sundarbans in a north-south direction (Chaffey et al., 1985;
Karim, 1988). 2.4.5 Deltaic mangrove ecosystems as a unique marginal and fragile system
The deltaic swamp of the Sundarbans is flat with micro topographical exceptions only. The
sanctuaries are divided by a complex networking of tidal waterways, into 3 separate areas,
which are of distinct interest; mud flats, small islands of salt and latent mangrove forests. This
is an excellent and influential example of an on-going ecological progress; it displays the
effects of a monsoon rain forest (Rashid et al., 1994; Christensen, 1984; Amin & Khan, 2001;
Christensen, 1984). In the Sundarbans area this natural heritage site plays a role in opening up
the regional culture, heritage, improvement of social condition and ecological balance in the
coastal environment (Siddiqi and Baksha, 2001; Chowdhury, 2001).
2.5 The natural and human threats to mangrove wetlands ecosystems The climatic change such as increase of global temperature, rainfall rating and local weather
are the major threats to the development of mangroves in all over the world. It has been noted
by many mangroves experts in the Asia-Pacific region that the natural hazards, salinity
increase and fresh water depletion are the reasons for the severe depletion of mangroves in the
Asia-Pacific countries (Siddiqi, 2001; Lacerda, 2001). On the other hand most of the countries
in the Sahelian zone have gone through severe drought period since 1968 (Siddiqi, 2001;
Lacerda, 2001). This climatic phenomena affected many coastal region and reduced the

Chapter 2 Cultural landscapes and mangrove wetlands in the tropical zone 33
mangrove areas in Africa. A similar phenomenological affect has been recognised in
American and Australian mangrove areas. Coastal areas offered specialised mangroves
ecosystems, coral reefs, and sea grasses among others. Most of the mangrove swamps are near
to the village settlements and inhabitants are totally dependent on the mangroves resources.
The human and natural phenomenons cause damage and destroy the mangrove wetlands
simultaneously in the tropic and subtropical region.
2.5.1 Unplanned policies and destruction of mangrove ecosystems
The natural resource management in the developing countries has become a more critical issue
in recent years. Especially the coastal resources which are under Government control are not
used properly and there is no adequate management plan for such sensitive vegetation covered
areas. Owing to high forest resource demand by the people on a daily basis, they use these
very desperately. Such situations have been observed in the coastal mangrove ecosystems in
Asia Pacific region, Africa and Latin American region. The growth of population and huge
resource use is one of the major causes of depletion of mangrove resources. In Latin American
mangroves have also been destroyed owing to the similar reasons, now people are protesting
to stop the destruction of the natural mangrove wetlands that had been supporting their
livelihood. A practical example in Bangladesh is the Chakoria Sundarbans. It was a unique
mangrove patch in the coastal district of Cox’s Bazar in the south eastern corner of
Bangladesh. Today its name remains only in memory of the coastal people in Chakoria. As
early as 1976, there was no sign of mangrove vegetation and wildlife as it had been replaced
by hundreds of shrimp farms, giving it the appearance of a saline desert. It was a much
unexpected rush to cut the mangroves forest in the late seventies and early eighties when the
Asian Development Bank (ADB) and the World Bank came forward with the investment to
promote shrimp farming as a cash crop. Consequently, 210 km2 of Chakoria Sundarbans
mangrove wetland was destroyed because of unplanned polices (Philip, 1999; Siddiqi, 2001).
2.5.2 Management and conservation of world mangrove wetlands areas The mangroves remained neglected and exploited in an unplanned way in most of the
countries of the world. In fact the productive mangroves occur in Southeast Asia and they are
managed under different silvicultural systems. In recent years, there has been some

Chapter 2 Cultural landscapes and mangrove wetlands in the tropical zone 34
afforestation of mangroves in some countries (Siddiqi, 2001; 2002). In most Caribbean
countries, legislation specifically covering mangroves is lacking, and in many countries of
Latin America, regulation is more normal than practical. The management guidelines
proposed four general categories for management such as a) Mangrove Conservation Reserve
(MCR), b) Mangrove Forest Reserve (MFR), c) Mangrove Fisheries Reserve (MFR), and d)
Damaged Mangrove Areas (DMA). Mangrove Conservation Reserve (MCRs) includes those
forests set aside for conservation, tourism, recreation, and scientific studies. Thus,
management of mangroves and its impact on regeneration and stocking of the forests are
insufficient (Siddiqi, 2001). Anon (1987) and Siddiqi (2001) stated that the mangrove forest of
Africa and Madagascar were never under a systematic forest management. The mangroves of
Ghana in the Volta River delta area are now considered for methodological planned
silviculture. The only suitable condition of mangrove forest can be considered in Tanzania.
The exploitation of mangrove resources in Australia is extremely limited, forests are not
exploited commercially. The threatened causes of sustainable management in the Indian
Sundarbans are human influences. Almost 3 million people live inside the forests and they are
dependent on forest resources (Choudhury, 1995; Siddiqi, 2001; 2002). The success story of
the sustainable forest management in Matang is mainly due to intensive reforestation efforts.
Other mangrove forests in Malaysia are not regularly managed (FAO, 1985). The mangrove
forests of Pakistan are confined in the Indus delta and there is no management system in force
(Annette, 2000; Siddiqi, 2001).
2.5.3 The threatened landscapes and mangrove wetlands ecosystems The increasing salinity and the reduced of fresh water has been reorganised as one of the
major threats for the health of the forest, of which the top-dying of Sundari (Heritiera fomes)
trees is one visible evidence. The outbreak of top-dying disease of Heritiera fomes in recent
decades is now a major concern among ecologists and forest managers (Hoque, 2001). Top
dying of Heritiera fomes is considered to the most serious of all diseases and disorders of trees
and a complex interaction of abiotic factors (Rahman et al., 1990, 1995; Chowdhury, 1995;
Hartung et al., 1998). According to Rahman (2001) in the Sundarbans case the small
management unit, which is called component, has been affected by top dying Heritiera fomes
and other plants. There are 55 components still visible and 22 components have been badly

Chapter 2 Cultural landscapes and mangrove wetlands in the tropical zone 35
affected. It has broken out as epidemic only in the last few decades (Rahman et al., 1990).
Preliminary estimates of the top-dying Heritiera fomes state that approximately 17% of the
stems are moderately or severely affected by top-dying disease, 265 km² areas are moderately
and 210 km² areas are severely affected. The affected areas are located in the map (Fig. 2.13).
Figure 2.13 Heritiera type of forests are affected by Top-dying disease
It can be stated that salinity intrusion and damage of water quality and soil fertility in the
Sundarbans are one of the major reasons for top-dying and die back disease although there are
lots of contradictions and arguments behind this top-dying and die back disease. Each one of
the components of the environment namely climate, salinity, fresh water supply, siltation,
erosion, substrate and nutrient have a first order reaction on the flora and fauna of the
ecosystems (Huq et al., 1999). Salinity of the intertwine zone has long been recognised as an
important factor regulating growth, height and territory of mangroves (Bowman, 1917;
Semeniuk, 1983; Hasan et al., 2001). Salinity undoubtedly affects the general health of
mangrove and non-mangrove plants (Anon, 1973; Hossain et al., 2001). The detail information
of salinity intrusion, its impacts and surface water salinity modelling and model results will be
elaborately analysed and discussed in Chapter- 4.

Capter 3 The Sundarbans study area 36
Chapter 3
The Sundarbans Study Area
3.1 Mangrove wetlands in Bangladesh
The Sundarbans forest is the largest continuous productive mangrove wetland ecosystems
in the world. It is located at the extreme end of the southern Ganges delta and it is about
10, 000 km² in southwest Bangladesh and West Bengal of India. A total area of 62 % lies
in the Khulna region of the south western part of Bangladesh, while the remaining 38 % is
in India (Siddiqi, 2001; Lacerda, 2001). This present Sundarbans area is approximately
half the size of the area of mangrove that existed 200 years ago when the area was 17,000
km² the other half being cleared reason of human activities (Hussain and Acharya, 1994).
The Bangladesh portion of Sundarbans covers an area of 6017 km² of mangrove forests,
wildlife sanctuaries and sand bars, out of this 1874 km² are made up rivers, creeks and
canals (Wahid, 1995). The land area of Bangladesh Sundarbans is about 4,017 km²
(Katebi, 2001). The meaning of the Sundarbans in Bengali language is “beautiful forest”,
where Sundar means beautiful and Ban means “forest” (Choudhury, 2001). The exact
origin of the name is very hard and difficult to determine. It can only be explained in terms
of how the forest was named by Sundarbans. The most acceptable and popular theory is
that it was named after its principal plant species Sundari (Heritiera fomes) which in
Bengali means beautiful. The other theory is that this forest was named after the river
“Sundhya” or “Samundraban” meaning sea forest. The great economist Kautillya described
the forest as Kalikaban, and in the eighth century it used to be known as the Tiger coast
(Choudhury et al., 2001). Later on the British adopted the present name Sundarbans for the
mangrove forest (Choudhury et al., 2001; Siddiqi, 2002; Islam, 2003). The forest occupies
a flat mud swamp which is submerged by high spring tide most of the year and almost all
high tides during the rainy season (Hussain, 1992). The Sundarbans landscapes consist of a
large number of fluvial and tidal lands, features created by the three mighty rivers, the
Ganges, the Bramaputra and the Meghna.
A large number of channels and creeks flow into larger rivers in the Sundarbans. The
largest of these rivers are the remains of the Ganges which has shifted eastward and the
Gorai River the main tributary of the Ganges is connected to Passur River and indirectly
with Sibsa River which are playing an influential role in the Sundarbans ecosystems. The
Baleswar River is connected to the Ganges River in the eastern part of the forest and as a

Capter 3 The Sundarbans study area 37
result receives lot of fresh water from it. The distance between the two extreme ends of the
Sundarbans is about 100 km. while the vertical distance between the east and west within
Bangladesh is about 80 km. By nature only the Sundarbans and the Chokoria Sundarbans
have the main mangrove forest resources in Bangladesh and they are distributed in the
south western part and south eastern part of the country (Ali, 1996). On the basis of the
geo-morphology of the delta, mangrove wetlands forests can be categorised into the
following types;
i) Fringe forest: It occurs along shoreline and tidal channels where there is a
topographic slope and the inundating tidal water flows in the same direction.
ii) Basin forest: It occurs in the subside depressions.
iii) Riverine forest: It occurs on the islands and completely inundated by tidal water.
iv) Dwarf forest: It occurs in the form of sparse, scattered community of shrubs like
mangrove species in carbonated environment and in arid areas.
On the other hand based on salinity distribution the mangrove forest of the Sundarbans can
be classified into their district types, namely;
i) Fresh water forest: It occurs on the north and the eastern portion of the Sundarbans.
ii) Moderate salt water forest: It consists of the forest near the sea-face and where less
saline is available in the monsoon and in the lean period.
iii) Salt water forest: It occurs in the west of the Malancha River where goran and
gewa dominate the forest.
The entire Sundarbans mangroves extend to a large area along the coast and characterises
the most spectacular environmental unit of the area (SRDI, 2000).
In transverse profile - from the mainland to the sea - the important geomorphic units of the
Sundarbans delta include;
i) Distributary channels with lag, sub-arial and sub-aqueous leaves and tidal flat.
ii) Marginal marshy areas above mean tidal level
iii) Tidal sand bars and islands with their network of tidal channels
iv) Sub-aqueous distal bars and
v) Pro-delta clays and silts.
According to Sharmila (1989) the soils texture of the Sundarbans region has been
classified into the following group; i) Clay soil, ii) Loamy soil, iii) Sandy loam, iv) Sandy
soil and v) Silty soil. On the other hand based on chemical analysis the soils in this region
can be classified into the different groups; i) Saline soil, ii) Saline-alkaline soil, iii) Non-
saline-alkaline soil and iv) Degraded alkaline soil. Saline soils are found in the flood

Capter 3 The Sundarbans study area 38
plains as well as in the natural depressions along the banks of the rivers and creeks. Saline-
alkaline soils are found in high salinity affected areas (Anon, 1975; 1998). The mangrove
flora and fauna plays a potential role in the creation of micro morphological features which
are high significant for trapping sediments and mangrove seeds. On the other hand the
morphology and evolution are controlled by an abundance of xerophytes vegetation
(Bhattacharya and Chowdhury, 1985).
3.1.1 Geography and climatic condition of the Sundarbans Most parts of the Bengal Basin and Ganges delta are floored with quaternary sediments
eroded from the highlands on three sides and deposited by the Ganges, Brahmaputra and
the Meghna rivers and their tributaries and distributaries. The Ganges River originated in
Gangotri glacier in the southern slopes of the Himalayas and caries discharge from a
catchment of about 865,000 km² in India, to Bangladesh (Figure 3.1) (Joseph, 2006). The
area of GBM drainage basin is 1.76 million km² of which 62 % in India, 18 % in China,
7.5 % in Nepal, 7.5 % in Bangladesh and only 4% in Bhutan (Elahi et al., 1998).
Geographically Sundarbans lies between latitudes 21° 31´ N and 22° 30`N and between
longitudes 89° 01` E and 90° 18`E (Figure 3.2) (Katebi, 2001; Islam, 2003).
Alahabad
Gangotri
Figure 3.1 The geographical location of the Sundarbans in the Ganges catchment.
This river is the main source of silt deposits and delta formation in the Bay of Bengal. The
Brahmaputra originates in the northern slopes of the Himalayas and travels into China to
the east, then turning southward, it enters India before Bangladesh. Its catchment area is
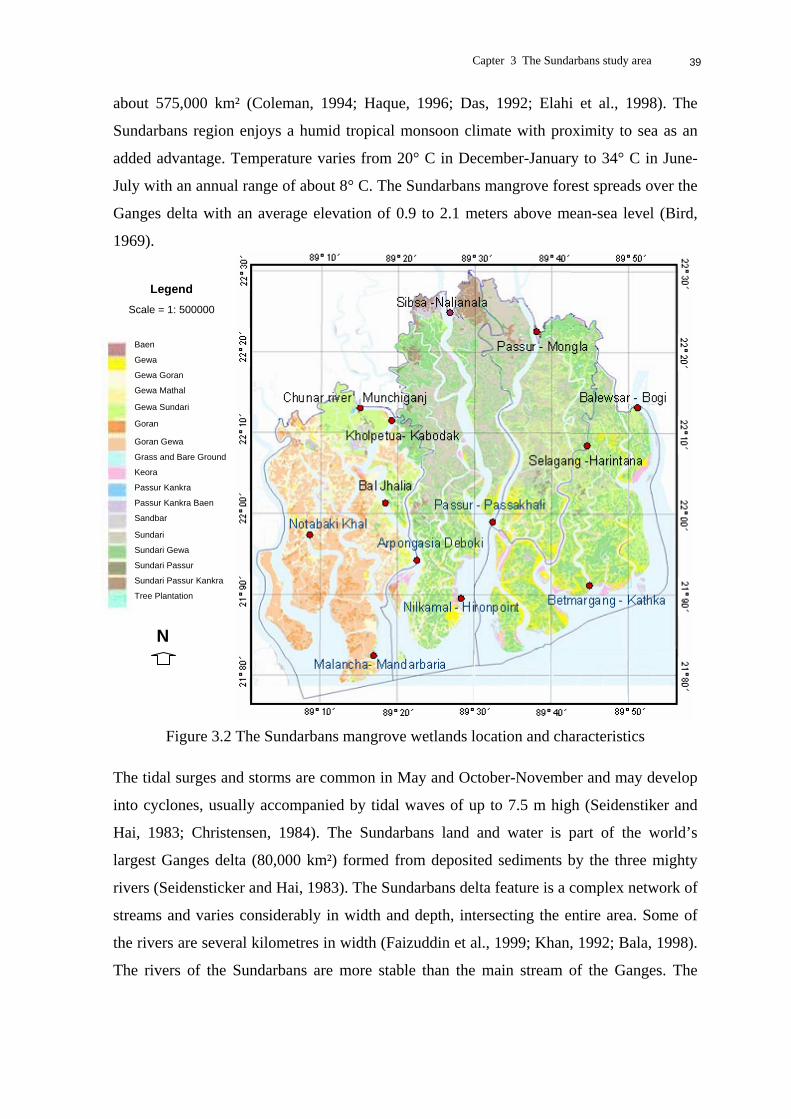
Capter 3 The Sundarbans study area 39
about 575,000 km² (Coleman, 1994; Haque, 1996; Das, 1992; Elahi et al., 1998). The
Sundarbans region enjoys a humid tropical monsoon climate with proximity to sea as an
added advantage. Temperature varies from 20° C in December-January to 34° C in June-
July with an annual range of about 8° C. The Sundarbans mangrove forest spreads over the
Ganges delta with an average elevation of 0.9 to 2.1 meters above mean-sea level (Bird,
1969).
N
Baen
Gewa
Gewa Goran
Gewa Mathal
Gewa Sundari
Goran
Goran Gewa
Grass and Bare Ground
Keora
Passur Kankra
Passur Kankra Baen
Sandbar
Sundari
Sundari Gewa
Sundari Passur
Sundari Passur Kankra
Tree Plantation
Legend
Scale = 1: 500000
Figure 3.2 The Sundarbans mangrove wetlands location and characteristics
The tidal surges and storms are common in May and October-November and may develop
into cyclones, usually accompanied by tidal waves of up to 7.5 m high (Seidenstiker and
Hai, 1983; Christensen, 1984). The Sundarbans land and water is part of the world’s
largest Ganges delta (80,000 km²) formed from deposited sediments by the three mighty
rivers (Seidensticker and Hai, 1983). The Sundarbans delta feature is a complex network of
streams and varies considerably in width and depth, intersecting the entire area. Some of
the rivers are several kilometres in width (Faizuddin et al., 1999; Khan, 1992; Bala, 1998).
The rivers of the Sundarbans are more stable than the main stream of the Ganges. The
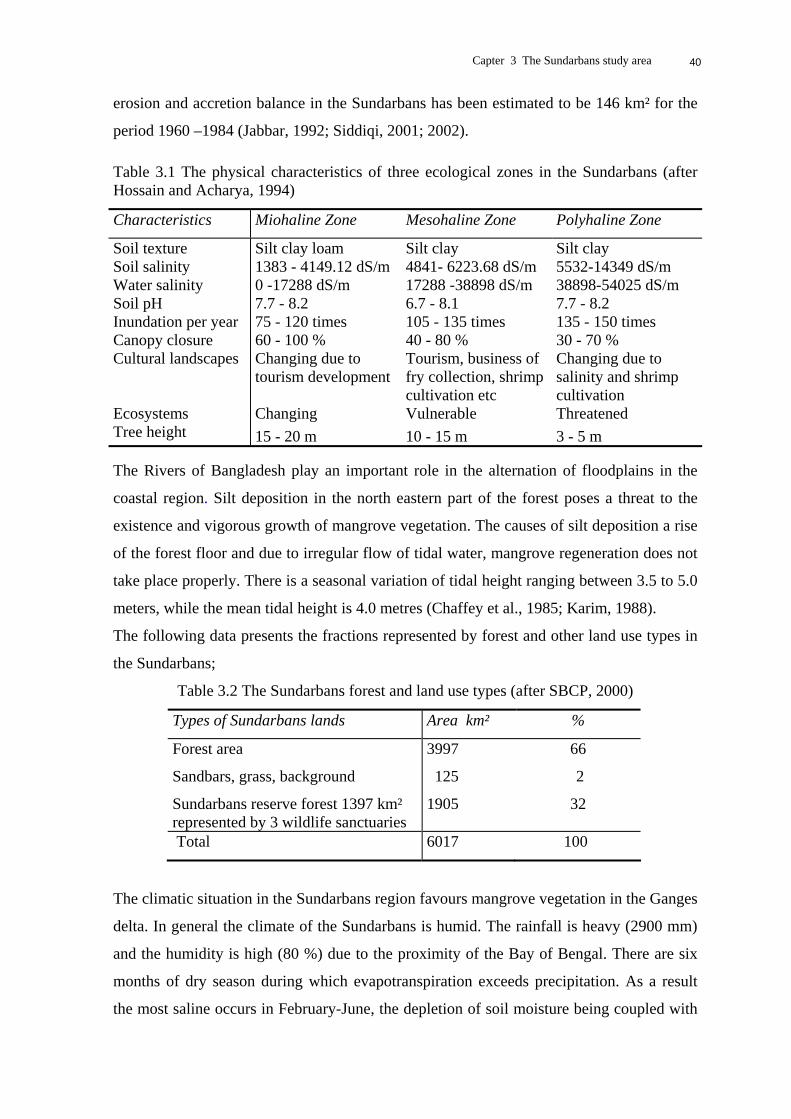
Capter 3 The Sundarbans study area 40
erosion and accretion balance in the Sundarbans has been estimated to be 146 km² for the
period 1960 –1984 (Jabbar, 1992; Siddiqi, 2001; 2002).
Table 3.1 The physical characteristics of three ecological zones in the Sundarbans (after Hossain and Acharya, 1994)
Characteristics Miohaline Zone Mesohaline Zone Polyhaline Zone
Soil texture Soil salinity Water salinity Soil pH Inundation per year Canopy closure Cultural landscapes Ecosystems Tree height
Silt clay loam 1383 - 4149.12 dS/m 0 -17288 dS/m 7.7 - 8.2 75 - 120 times 60 - 100 % Changing due to tourism development Changing
15 - 20 m
Silt clay 4841- 6223.68 dS/m 17288 -38898 dS/m 6.7 - 8.1 105 - 135 times 40 - 80 % Tourism, business of fry collection, shrimp cultivation etc Vulnerable
10 - 15 m
Silt clay 5532-14349 dS/m 38898-54025 dS/m 7.7 - 8.2 135 - 150 times 30 - 70 % Changing due to salinity and shrimp cultivation Threatened
3 - 5 m
The Rivers of Bangladesh play an important role in the alternation of floodplains in the
coastal region. Silt deposition in the north eastern part of the forest poses a threat to the
existence and vigorous growth of mangrove vegetation. The causes of silt deposition a rise
of the forest floor and due to irregular flow of tidal water, mangrove regeneration does not
take place properly. There is a seasonal variation of tidal height ranging between 3.5 to 5.0
meters, while the mean tidal height is 4.0 metres (Chaffey et al., 1985; Karim, 1988).
The following data presents the fractions represented by forest and other land use types in
the Sundarbans;
Table 3.2 The Sundarbans forest and land use types (after SBCP, 2000)
Types of Sundarbans lands Area km² %
Forest area
Sandbars, grass, background
Sundarbans reserve forest 1397 km² represented by 3 wildlife sanctuaries
3997
125
1905
66
2
32
Total 6017 100
The climatic situation in the Sundarbans region favours mangrove vegetation in the Ganges
delta. In general the climate of the Sundarbans is humid. The rainfall is heavy (2900 mm)
and the humidity is high (80 %) due to the proximity of the Bay of Bengal. There are six
months of dry season during which evapotranspiration exceeds precipitation. As a result
the most saline occurs in February-June, the depletion of soil moisture being coupled with
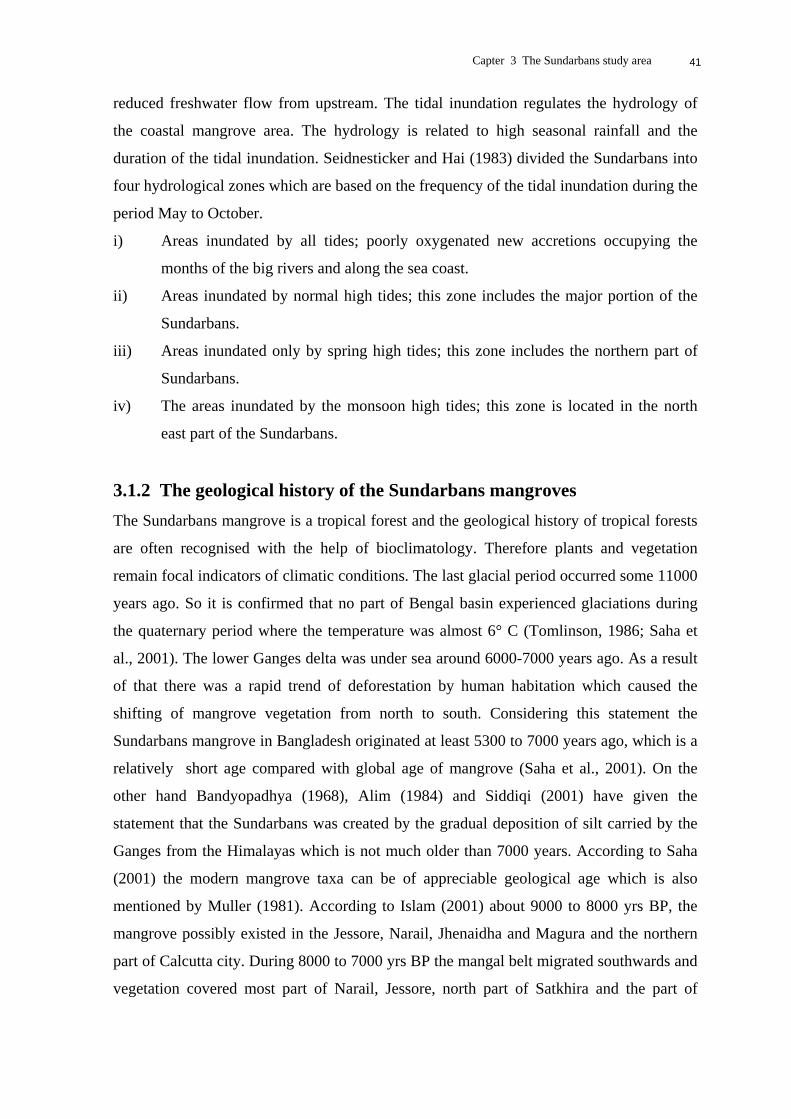
Capter 3 The Sundarbans study area 41
reduced freshwater flow from upstream. The tidal inundation regulates the hydrology of
the coastal mangrove area. The hydrology is related to high seasonal rainfall and the
duration of the tidal inundation. Seidnesticker and Hai (1983) divided the Sundarbans into
four hydrological zones which are based on the frequency of the tidal inundation during the
period May to October.
i) Areas inundated by all tides; poorly oxygenated new accretions occupying the
months of the big rivers and along the sea coast.
ii) Areas inundated by normal high tides; this zone includes the major portion of the
Sundarbans.
iii) Areas inundated only by spring high tides; this zone includes the northern part of
Sundarbans.
iv) The areas inundated by the monsoon high tides; this zone is located in the north
east part of the Sundarbans.
3.1.2 The geological history of the Sundarbans mangroves The Sundarbans mangrove is a tropical forest and the geological history of tropical forests
are often recognised with the help of bioclimatology. Therefore plants and vegetation
remain focal indicators of climatic conditions. The last glacial period occurred some 11000
years ago. So it is confirmed that no part of Bengal basin experienced glaciations during
the quaternary period where the temperature was almost 6° C (Tomlinson, 1986; Saha et
al., 2001). The lower Ganges delta was under sea around 6000-7000 years ago. As a result
of that there was a rapid trend of deforestation by human habitation which caused the
shifting of mangrove vegetation from north to south. Considering this statement the
Sundarbans mangrove in Bangladesh originated at least 5300 to 7000 years ago, which is a
relatively short age compared with global age of mangrove (Saha et al., 2001). On the
other hand Bandyopadhya (1968), Alim (1984) and Siddiqi (2001) have given the
statement that the Sundarbans was created by the gradual deposition of silt carried by the
Ganges from the Himalayas which is not much older than 7000 years. According to Saha
(2001) the modern mangrove taxa can be of appreciable geological age which is also
mentioned by Muller (1981). According to Islam (2001) about 9000 to 8000 yrs BP, the
mangrove possibly existed in the Jessore, Narail, Jhenaidha and Magura and the northern
part of Calcutta city. During 8000 to 7000 yrs BP the mangal belt migrated southwards and
vegetation covered most part of Narail, Jessore, north part of Satkhira and the part of

Capter 3 The Sundarbans study area 42
Calcutta. Between 7000 to 5000 yrs BP the coastal belt of Bangladesh region covered the
Gopalganj and Madaripur districts and northern part of Khulna and Satkhira district. Gupta
(1981) also reported that the northern limit of the present day Sundarbans was established
at 3000 yrs BP. The Sundarbans mangroves grow on soil formations of recent origin
consisting of alluvium washed down from the Himalayas. The surface geology consists
entirely of quaternary sediments, sand and silt, intercalated with marine salt and clay
(Umitsu, 1997; Islam, 2001). The geological and tectonic relations of the Sundarbans can
be traced to the common genesis of the whole of the deltaic plain of the Bengal basin
which is surrounded by the Cenozoic Indo-Burman ranges in the east, the Pre-Cambrian
Indian shield on the west and the Shillong plateau on the north-east (Rob, 1997).
3.2 The Sundarbans flora, fauna and vegetation dynamics The mangrove of Sundarbans is unique when compared to non-deltaic coastal mangrove
forest. The Rhizophoraceae are of only minor importance and the dominant species are
Sundari- Heritiera fomes, from which Sundarbans takes its name, and Gewa - Excoecaria
agallocha. The only reason for this difference is the large fresh water influence in the
north-eastern part and the elevated level of the ground surface. There are four categories of
forest; low salinity mangrove forests, tree mangrove forests, salt water mangrove forests,
and fresh water Heritiera forests. The Heritiera fomes trees dominate the Chandpai Range
at its northern end. The remaining area is a mixture of Heritiera fomes and Excoecaria
agallocha. Virtually the entire Sarankhola Range is covered by mixed Heritiera fomes and
Excoecaria agallocha. Plants species like Excoecaria agallocha grows at the peripheral
region and the Heritiera fomes in the inner part of each forest cluster. Heritiera fomes
dominate most of the area from north to south of the Khulna range (EGIS, 2000). The
western part of the Sundarbans which coincides with the salt-water zone, supports species
like Ecoecaria agallocha, a dense undestroy of Ceriops decendra and dense patches of
Hantal palm Phoenix paludosa on drier soil. Xylocarpus and Bruguiera occur sporadically
throughout the area. Species like Heritiera fomes and Excoecaria agallocha cover most
part of the Sundarbans but Oryza coarctta, Nypa fruticans and Imperata cylindrica are
preferred on mud flats and Sonneratia apetala are found on newly accreted mudbanks
(Figure 3.3) (Khan, 1986; Salter, 1987). The Sundarbans can be classified as moist tropical
forest comprising a mosaic of beach forest and tidal forest (Champion, 1965). The
vegetation in the Sundarbans has been classified into three categories concerning salinity
tolerance of mangrove species. Fresh water-loving species with narrow ecological
Capter 3 The Sundarbans study area 43
amplitude (Heritiera fomes, Bruguiera species); The map of the eastern part of the
Sundarbans (Figure 3.3) shows that the water and soil salinity level is lower than in the
other two western parts.
Figure 3.3 The eastern part wildlife sanctuary with less saline water. Source: BARCIK, 2003
The vegetation succession is stronger than in other parts. Moderate saline water tolerating
species with wide ecological amplitude (Excoecaria agallocha, Cariops decandra,
Sonneratia apetala, Xylocarpus species) and saline water loving species with narrow
ecological amplitude (Avicennia species, Agialistis rotundifolia, Rrhizophora apicultura)
(Karim, 1995). The Sundarbans can be classified as moist tropical forest comprising a
mosaic of beach forest and tidal forest (Champion, 1965). The vegetation in the
Sundarbans have been classified into three categories concerning on salinity tolerancy of
mangrove species. Fresh water loving species with narrow ecological amplitude (Heritiera
fomes, Bruguiera species); Moderate saline water tolerating species with wide ecological
amplitude (Excoecaria agallocha, Cariops decandra, Sonneratia apetala, Xylocarpus
species) and saline water loving species with narrow ecological amplitude (Avicennia
species, Agialistis rotundifolia, Rrhizophora apicultura) (Karim, 1995). The map (Figure
N
Legend
Sundari
Sundari Gewa
Sundari Passur
Sundari Passur Kankra
Gewa
Gewa Mathal (Coppice)
Gewa Goran
Gewa Sundari
Goran
Goran Gewa
Passur Kankra
Passur Kankra Baen
Baen
Keora
Tree Plantation

Capter 3 The Sundarbans study area 44
3.4) shows the middle southern part of the Sundarbans where the salinity level is the
moderate level. The vegetation succession and the deltaic landscapes pattern are different
from the eastern part.
N
Legend
Sundari
Sundari Gewa
Sundari Passur
Sundari Passur Kankra
Gewa
Gewa Mathal (Coppice)
Gewa Goran
Gewa Sundari
Goran
Goran Gewa
Passur Kankra
Passur Kankra Baen
Baen
Keora
Tree Plantation
Figure 3.4 The middle part wildlife sanctuary with moderate salinity. Source: BARCIK, 2003
The lower part of these ranges is composed of Heritiera fomes and Excoecaria agallocha.
The north eastern part of the Burigualini range under Shatkhira district is mainly
Excoecaria agallocha but goran species (Ceriops decandra) dominates the remaining area.
There are different types of species available in the surroundings of the Saronkhola Ranges
and the northernmost part of the Khulna range (EGIS, 2000). The western part of the
Sundarbans (Figure 3.5) has been recognised as highly saline zone. The salinity is one of
the vital factors in the Sundarbans mangroves wetlands that is controlling the growth and
succession of mangrove plants, its height, survival, distribution and species composition of
plants in the mangroves. Higher concentration of salt affects plant growth by accumulation
of ions in toxic concentration with the plant tissue. Increased salinity not only affects plant
association but it impacts on productivity. Timber productivity has reduced with increased

Capter 3 The Sundarbans study area 45
water and soil salinity rate in the middle and western part of the Sundarbans (EGIS, 2000).
The vast ecological research has been done by EGIS in 2000 and the report has mentioned
very clearly that there is a strong relationship between salinity and timber production.
Although some mangrove researchers gave their statements that there is no relation to
growth of mangroves plants with salinity increase.
N
Legend
Sundari
Sundari Gewa
Sundari Passur
Sundari Passur Kankra
Gewa
Gewa Mathal (Coppice)
Gewa Goran
Gewa Sundari
Goran
Goran Gewa
Passur Kankra
Passur Kankra Baen
Baen
Keora
Tree Plantation
Figure 3.5 The western wildlife sanctuary in high saline zone. Source: BARCIK, 2003
This statement is not proven because it is still subject to application and investigation
(EGIS, 2000). On an average 10805 dS/m to 21610 dS/m salinity is the best productive
range that means this range could not cross the threshold value of mangrove production in
the Sundarbans case (EGIS, 2000). The salinity range 21610 dS/m to 32415 dS/m can be
treated as average production level. But above 32415 dS/m the production drops to very
low. On the base line condition only 20 % of area is within 32415 dS/m range of salinity.
The major part of the Sundarbans mangrove is above 32415 dS/m range where the low
production, regretted growth rate, lowers percentage of plant succession and density. On
the flip side, this has given way to an increasing number of salt resistant plant species to
replace others Heritiera fomes, which is the most single dominant and important species of
the Sundarbans. Marginal vegetation of the Sundarbans ecosystems are much diversified.

Capter 3 The Sundarbans study area 46
The composition of the common marginal vegetation types are found throughout the forest.
There are 5 factors are dominated the vegetation dynamic process (Figure 3.7). The
diagramme (Figure 3.6) shows the vegetation composition including Sundari (Heritiera
fomes-21%), Sundari-Gewa (Heritiera fomes-Excoecaria agallocha-29%), Sundari-Passur
(Heritiera fomes -X. mekongensis-1%), and Sundari-Passur-keora (Heritiera fomes- X.
mekongesis - Sonneratia apetala-2%), Gewa (Excoecaria agallocha-5%), Gewa-Sundari
(E.agallocha-H.fomes-15%), Goran - Gewa (Ceriops decandra-E. agallocha-14%), Gewa-
Goran (E. agallocha-C. decandra-9%), keora (Sonneratia apetala-1%), Goran (Ceriops
deceandra-2%), and others 1% only.
Sundari21%Sundari-Passur-
Keora2%
Gew a5%
Gew a-Sundari15%
Gew a-Goran9%
Goran -Gew a14%
Sundari -Gew a29%
Goran 2%
Keora1%
Others1% Sundari-Passur
1%
Sundari -Gew a Sundari Sundari-Passur-Keora Gew aGew a-Sundari Goran -Gew a Gew a-Goran KeoraGoran Others Sundari-Passur
Figure 3.6 Vegetation compositions in the Sundarbans (Data source: Chaffey et al., 1995;
Hossain and Acharya, 1994)
As single species Heritiera fomes covers 52.7 % of the area and constitutes about 63.8% of
the standing volume and a huge percentage is covered by the Nypa frutican plants
(Rahman, 2001). As pure crop and in mixture with Excoecaria agallocha, Heritiera fomes
occupy about 18.2 % and 62.4 % of the Sundarbans respectively. On the other hand it is
recognised that the general composition of the mangrove vegetation of the forest in the
Figure 3.6 shows the dominating mangrove species such as Heritiera fomes which includes
73 % and 16 % of Excoecaria agallocha, Nypa fruticans while the rest of all other species
together make only 11 % (Faizuddin et al., 1999). Vegetation succession is a fundamental
concept in ecology. The vegetation dynamics has many causes. The biological causes can
be cast in terms of conditional for example if a certain condition holds then a certain result
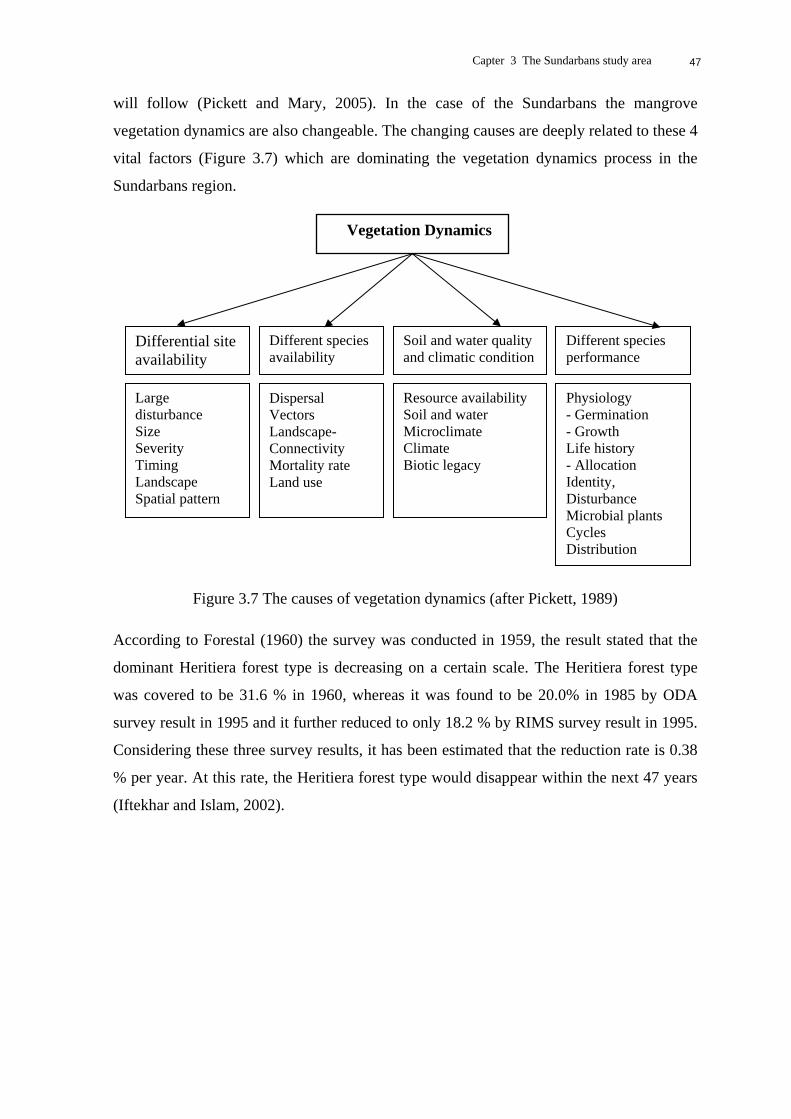
Capter 3 The Sundarbans study area 47
will follow (Pickett and Mary, 2005). In the case of the Sundarbans the mangrove
vegetation dynamics are also changeable. The changing causes are deeply related to these 4
vital factors (Figure 3.7) which are dominating the vegetation dynamics process in the
Sundarbans region.
Vegetation Dynamics
Differential site availability
Different species availability
Different species performance
Soil and water quality and climatic condition
Large disturbance Size Severity Timing Landscape Spatial pattern
Dispersal Vectors Landscape- Connectivity Mortality rate Land use
Resource availability Soil and water Microclimate Climate Biotic legacy
Physiology - Germination - Growth Life history - Allocation Identity, Disturbance Microbial plants Cycles Distribution
Figure 3.7 The causes of vegetation dynamics (after Pickett, 1989)
According to Forestal (1960) the survey was conducted in 1959, the result stated that the
dominant Heritiera forest type is decreasing on a certain scale. The Heritiera forest type
was covered to be 31.6 % in 1960, whereas it was found to be 20.0% in 1985 by ODA
survey result in 1995 and it further reduced to only 18.2 % by RIMS survey result in 1995.
Considering these three survey results, it has been estimated that the reduction rate is 0.38
% per year. At this rate, the Heritiera forest type would disappear within the next 47 years
(Iftekhar and Islam, 2002).

Capter 3 The Sundarbans study area 48
Vegetation succession in three ecological zones in the Sundarbans
Phragmites karka Typha elephantina
S. apetala
A. officinelis H. fomes E. agallocha
H. fomes E. agallocha
H. fomes A. cuculata C. ramiflora
Miohaline Mesohaline Polyhaline
S. apetala
A. officinelis H. fomes E. agallocha
H. fomes E. agallocha
H. fomes A. cuculata C. ramiflora
Porteresia coarctata
S. apetala A. marina S. apetala A. marina
E. agallocha C. decandra H. fomes
E. agallocha H. fomes C. decandra
MHWN
LHWS
H. fomes E. agallocha
Primary Succession
H. fomes B. gymnorhiza
Climax
H. fomes
Degraded Succession
E. agallocha C. decandra
MHWST
MXHWD
E. agallocha C. decandra
C. decandra E. agallocha
Nypa Nypa
Porteresia coarctata Phragmites Karka
Salinity
Lan
d E
leva
tion
to T
idal
Hei
ght
Figure 3.8 The vegetation succession (after Hussain and Acharya, 1994; Karim, 1994) (Special note: MHWS - Mean high water of spring tides; MHXWD - Maximum high water of spring tides during dry season; LHWS - Low high water of spring tide during dry season; and MHWN - Mean high water of neap tides).

Capter 3 The Sundarbans study area 49
The other two forest types (Heritiera- Xylocarpus-Bruguiera and Excoecaria-Ceriops) are
also diminishing but at a very slow rate. The Sundarbans is however of significant
importance for many species that currently have populations elsewhere, but are likely to
disappear in these other sites within the next few decades (Gonzalo, 1998). The plants
species of the Sundarbans mangroves wetland is not made up of one homogenous specie
group it has a unique heterogeneity combination of different species. The flora of the
Sundarbans was thoroughly explored by Heining (1992) as mentioned by Das (1980).
Heining (1992) reported 70 species from 34 families, whereas Chaffey and Sandom (1985)
enlisted 66 species in the Sundarbans (Appendix - 2).
3.2.1 The faunal diversity The Sundarbans is the only remaining habitat in the lower Bengal Basin for a variety of
faunal species. With regard to wildlife, the Sundarbans possesses a rich faunal diversity
even after disappearance of a good number of interesting species (Table 3.3 and Appendix-
4). With regard to mammals, birds, reptiles and the amphibians, the Sundarbans shares 45,
42, 46 and 36 percent with the rest to the country. However, seven species have become
extinct in the beginning of the last century. Besides, 10 species of mammals, 11 species of
birds, 16 species of reptiles and one species of amphibian is endangered (Siddiqi, 2001).
They include Royal Bengal Tiger (Panthera tigers), Jungle Cat (Felis chaus), Irrawaddy
dolphin (Orcaella brevirostris), Blyth’s Kingfisher (Alcedo hercules), Estuarine Crocodile
(Crocodilus porosus), Yellows Monitor (Varanus flavescens), Rock python (Python
molurus), Green Frog (Euphlyctis hexadactylus) and others (Siddiqi, 2001).
Table 3.3 Status of mammals, birds, reptiles and amphibians in the Sundarbans (after
Rashid et al., 1994; Siddiqi, 2001)
Class Total number of species in Bangladesh
Existing species in Sundarbans (No)
Sundarbans share with Bangladesh (%)
Extinct species (No)
Endangered species (No)
Mammalia 110 49 45 4 10 Aves 628 261 42 2 11 Reptilia 109 50 46 1 16 Amphibian 22 8 36 - 2
At present 49 mammals species have been recognised, and of these no less than eight
spectacular species, namely Javan rhinoceros (Rhonoceros sondaicus), Single horned
rhinoceros (Rhinoceros unicornis) Water buffalo (Bubalus bubalis), Swamp deer (Cervus

Capter 3 The Sundarbans study area 50
duvauceli), Mugger crocodile (Crocodylus palustris), Gaur (Bos frontalis) and Hog deer
(Axis porcinus) have become extirpated in the Sundarbans since the last century (Salter,
1987; Sarker, 1992). Generally, the wildlife population of the Sundarbans is under stressed
that is why evaluation and better wildlife management strategies are needed as soon as
possible and should be immediately implemented for the protection of natural heritage
and the ecosystem. The terrestrial type of animals is available for its suitable periodic
inundation environment. The river terrapin (Betagur baska), Indian flap-shelled turtle
(Lissemys punctata), Peacock soft-shelled turtle (Trionyx hurum), yellow monitor
(Varanus flavescens), water monitor (Varanus salvator), Indian Python (Python molurus)
and the Bengal tiger (Panthera tigris trigis) are some of the resident species.
3.2.2 Mangrove forest type and classification A mangrove forest is a vegetation unit having characteristics in physiognomy and structure
sufficiently pronounced to permit its differentiation from other such units. The Sundarbans
mangroves forest has been divided into 13 main floristic types of forest and four non forest
types which were investigated by ODA in 1985. The Heritiera fomes - Excoecaria
agallocha and Heritiera forest types are the most common plants species which cover 50 %
of the area. On the other hand according to Das and Siddiqi (2000), economically
important plants of the Sundarbans are Heritiera fomes which account for 73 % while
Excoecaria agallocha also account for 16 % and other species such as Xylocarpus
mekongenesis, Sonneratia apetala, Avicennia officinalis, Bruguiera gymnorrhiza, Ceriops
decandra and Nypa fruticans are in the minority and form (11%) of the forest. This
particular forest inventory divided the Sundarbans into 11 types (Table 3.4), depending
upon the predominant species present at a particular place. The area which is divided into 9
blocks (Table 3.4) exclusive of the mangrove species is available in these blocks and it has
been measured in km² of the forest areas. The Sundarbans has been differentiated into 13
main floristic types of forest and four non-forest types (ODA, 1985). The Heritiera fomes-
Excoecaria agallocha and Heritiera type of forests are the most common species of
vegetation covering the Sundarbans. The Table 3.5 shows the quality class of vegetation.
The stocking of the mangrove forest area in the present day of the Sundarbans can be
reflected in a table showing the number of stems of major species per hectares in different
blocks, from the blocks situation we can calculate the total number of trees down to 10 cm
diameter at breast height of different species (Table 3.6). Stem number is showing bellow;

Capter 3 The Sundarbans study area 51
Table 3.4 Area of major forest types in blocks km² (after ODA, 1985; Siddiqi; Das, 2000 and Chaffey et al., 1985)
Area by Block km² Forest Type
1 2 3 4 5A 5B 6 7 8 All Heritiera fomes 83100 00 34 192 01230 22141200 H. fomes –X. agallocha 116400 00 201 112 35203257118240 H. fomes -X.mekongensis 2200 00 01 02 0211 00 05 00 H. fomes- X.mekongensis-B. gymnorrhiza
6500 00 04 00 0060 00 00 00
X. agallocha 19604 17 22 04 1001115 13 10 X. agallocha –H. fomes 58503 01 120 2410924 66116121 X.agallocha –C. decandra 36231 113 127 005500 22 13 00 C.decandra – X.agallocha 572268 203 48 005000 00 03 00 Ceriops decandra 9358 24 07 000400 00 00 00 Sonneratia fomes 3301 01 06 030003 16 02 01 Others 3201 02 05 011510 01 00 00
Total Forest 582 411 499 542 281 338 575 361 366 3955
Table 3.5 Forest vegetation quality class in the Sundarbans (after Forestal, 1960)
Quality Class Total Area (ha) Percentage
I 102 607 25 II 93 822 22 III 182 838 45 Immature forest 1 215 1 Non- commercial cover 21 194 5 Char-land 5 020 1 Clear land 198 1
Table 3.6 Species number in blocks with in 10 cm diameter (after ODA, 1985)
Stems / Hectares by Species Species Type
1 2 3 4 5A 5B 6 7 8 All
Heritiera fomes 485 452 341 365 67 491 231 16 29 2477
Excoecaria agallocha 278 220 322 126 184 102 197 294 268 1991
Sonneratia apetala 1 2 9 3 1 2 3 2 3 26
Xylocarpus mekongensis, Bruguiera gymnorrhiza and Avicennia officinalis etc
14 13 13 84 38 28 16 20 7 233
Total 778 687 685 578 290 623 447 332 307 4727
In the table the important mangroves species show the mean number of stem per ha of the
merchantable species d.b.h. 10 cm and above in each block.

Capter 3 The Sundarbans study area 52
3.2.3 Forest canopy classes
The predictable changes in plants and animal communities are referred to as ecological
succession. Ecologically succession is essentially driven by those physical and chemical
changes that communities make in their environment for subsequent different
communities, until the ecosystem reaches a long-term stability with respect to its
compassing climate. When climate dictates that grassland will turn into a forest land, the
grass must be moved. As for plant succession proceeds from early pioneer stages through
developmental stages, habitat changes will result in the loss of certain animal population
(Erickson, 1994). The mangrove forest canopy structure in the Sundarbans was remarkable
than the other parts of the world mangrove forests. In 1960 where forestall classified 78 %
of the forest having a canopy closure of 75 % or more (Figure 3.11). A Forest survey in
1985 by Overseas Development Authority (ODA) of United Kingdom showed that 65 % of
the forest has a canopy closure of 70 % or more (Figure 3.9 and Figure 3.12). Figures at
the subsequent pages show the distribution of three canopy classes and height classes.
Figure 3.9 Predominant canopy densities in the Sundarbans (Data source: ODA, 1985)
Predominant canopy classes are those having 30 % or more closure and in that the forest is
more closed in the east than in the west and the canopy closure in the east. The forest is
more closed in the east than west and the canopy closure in the east is more than 70 % in

Capter 3 The Sundarbans study area 53
Figure 3.10 Forest Canopy class in 1933 (Data Source: Curtis, 1933)
Figure 3.11 Forest canopy class in 1960 (Data Source: Forestal, 1960)

Capter 3 The Sundarbans study area 54
the middle part of the forest which is 30 % and more than 70 % and the western part have
30 % less than 70 % (Figures 3.9, 3.10, 3.11 and 3.12). The Sundarbans forest canopy is
seldom 10m above ground level. The major portion of the forest can be categorised into
two storied with scattered emergent trees attaining a height of up to 20m. The diameters
are generally less than 20 cm at breast height (dbh) in very few cases diameter can be
shown up to 1m. The vegetation is in three different height classes such as a) height > 15
m, b) > 10 m, but < 15m and c) > 5m but < 10m.The height of the Sundarbans wetlands
mangrove forest is much higher in the east than in the western part of the forest where the
salinity rate is lower than in other parts of the forest. The forest height decreases towards
the west. It is very clear and understandable that the forest height class is greater where the
water and soil salinity is low and the forest height is smaller where the soil and water
salinity is higher.
Figure 3.12 Forest canopy height class in 1985 (Data Source: ODA, 1985)
It is an empirical research finding that few trees can be removed from a forest canopy by
several kinds of events, as well as wind may snap trees, lighting may destroy the trees,
old trees may die and even parasites may kill one species where a mixed species stand and
leave a gap in the canopy. In this situation within the gaps the resource availability may be
altered and environmental signals may change. In the Sundarbans case of top-dying disease

Capter 3 The Sundarbans study area 55
is an example of parasites attacking special tree species like Heritiera fomes and other
ones. Besides, water may be either more or less available depending on whether the rainfall
can better reach the forest floor compared to the rate of soil moisture removal by roots of
neighbouring canopy trees and undestroyed plants that remain in the gap. The nutrient like
nitrogen can be available in the gap, reason for soil microbes. Soil temperature extremes
may increase and soil moisture availability acting germination of demand seeds in forest.
As a result, the diversity and productivity of mangrove forest annual plants is greatly
enhanced in the deltaic mudflat in the Sundarbans.
3.3 Hydrology and river systems of the Sundarbans The Sundarbans mangrove wetland is intersected by an elaborate network of rivers,
channels and creeks (Chaffey et al., 1985). A complex net of streams and rivers varying
considerably width and in depth intersects the entire area. Some of the big rivers are
several kilometres in width (Siddiqi, 2001). Rivers tend to be long and straight, also a
consequence of the strong tidal forces and the clay and silt deposits which resist erosion.
The width of these estuaries sometimes extends to about 10 km. The rivers such as the
Passur, Sibsa and Raimangal are deep and wide (Hussain and Acharya, 1994). Generally
the rivers flow from north to south and are connected with a large number of side channels.
These side channels connect two rivers and facilitate exchange of water between them. The
larger rivers, while passing through the Sundarbans forest, join together and form estuaries
at the confluence where they meet near the sea (Figure 3.13). The Sundarbans receives
large volumes of freshwater from inland rivers flowing from the north and of saline water
from the tidal incursions from the sea. The salinity of tidal water is the major force in the
productivity of mangrove forest ecosystems. At a comparatively recent period all rivers
were connected with the Ganges. The Baleswar River’s waterways carry little fresh water
as they are cut off from the Ganges; the main outflow has shifted from the Hoogly-
Bhagirathi channels in India (Seidenstiker and Hai, 1983).
Currently the Baleswar and Gorai Rivers have direct connection with eastern part of the
Sundarbans carrying with them a substantial amount of fresh water to the area (Siddiqi,
2002). These ecological niches occur mainly along the Baleswar, Bhola, Passur, Marjata,
Arpongasia, Shibsa, Jamuna and Raimangol Rivers. A number of rivers namely Passur,
Sibsa, Selagang, Arpongasia, Kobadak, and Malancha and to a lesser extent Jamuna and
Raimangal have indirect connections and receive the overflow of the Ganges during the

Capter 3 The Sundarbans study area 56
rainy season. The three sub-systems are based on the hydrological regime of the
Sundarbans;
BAY OF BENGAL
N Bangra
Kunga
Raimangal Malancha
Estuary
Baleswar
Figure 3.13 Major rivers, river systems and estuaries in the Sundarbans
i) Western sub-system
This area represents the western part of Aura Sibsa and the east of the Raimangal River is
connected with the part of upstream moribund delta of Kobadak-Betna River system.
ii) Central sub-system
It is located east of Aura Sibsa and west of the Passur River. It is directly connected with
the Ganges through the Gorai River. After constructing the Farakka Barrage the connection
between Passur and Gorai has blocked due to settled down of floating particulars and
sedimentation.
iii) Eastern sub-system
The eastern subsystem represents the east part of the Passur River and the west part of the
Baleswar River. This sub-system receives freshwater from the Ganges through the Gorai-
Madumati River. The river systems in the Sundarbans can be divided into 5 estuaries. The
estuaries are as follows;

Capter 3 The Sundarbans study area 57
i) Bangra estuary
The Bangra River estuary is found within a large number of tributaries of which Passur,
Kanga, Barashiala, Sela gang and Bhola are the prominent ones. A complex network of
rivers and channels are connected to these tributaries of the Bangra with Passur in the West
and Baleswar in the East. The Sela gang and Bhola River are the two major tributaries
which used to carry freshwater from the Ganges through the Bhairab system and Jewdhara
and the Dhansagar khal from the Baleswar-Madhumati system at Morelganj (Hussain and
Acharya, 1994).
ii) Kunga estuary
The Passur and Sibsa Rivers formed the Mardat River which then flows into the Kunga
River. The Kunga flows down and receives the Hansharaj and Kaga near Hiron point. A
large number of rivers originated in the catchment areas and which outside of the
Sundarbans meet the Passur and Sibsa which drained estuary. Passur has influence on the
Bhairab and is connected with Gorai-Madhumati systems through Atarabanki and
Nabaganga Rivers. The Gorai-Madhumati is the major spill river of the Ganges and carries
out 12 % of flow of the Ganges (Hussain and Acharya, 1994).
iii) Malancha estuary
Before entering the Sundarbans, the Malancha River known as Chunar River joins up with
Ichamati River before entering into the Sundarbans forest near the Kadamtala station.
Malancha and Jamuna are connected through the Firingi River. The Kobadak and Kolpetua
Rivers are connected with the Arpongachia and the Bal River. The Bal and the
Arpongachia Rivers join the Malancha River further downstream.
iv) Raimangal estuary
The Kalindi River is used as an international boundary between India and Bangladesh and
is renamed as Raimangal towards the south when it flows inside the Sundarbans. Jamuna
originates from Kishenganj in India, bifurcates at Bangsipur where it is called Madargang
near the north of the Sundarbans (Hussain and Acharya, 1994).
v) Baleswar estuary
The Baleswar River is one of the major rivers in the Sundarbans region. The Gorai River
flows from the Ganges in the downstream after Bardia point. It is named Madhumati River
which is flowing at the east boarder of the Sundarbans. At present only the Baleswar River
carrys fresh water from upstream through the Gorai-Madhumati Rivers and from the lower
Meghna River and flows into the eastern part of the Sundarbans.

Capter 3 The Sundarbans study area 58
3.3.1 The Source of freshwater supply into the Sundarbans areas
The sources of fresh water in the Sundarbans region are upstream rivers water, surface
water ground water and rain water. The quantities of rain water around the region is still
satisfying, the annual rain fall is 2700 mm which is the highest density in the south-western
part in Bangladesh. There are 430 rivers in the Sundarbans region and some are big rivers,
almost two large rivers are connected with the Ganges (Appendix-5). The Gorai River is
one of the major tributary of the Ganges which joins the Passur River downstream. The
lower part of Gorai is called Madhumati and carrys fresh water to the Baleswar River.
Besides these, there are five other rivers carrying various quantities of freshwater into the
Sundarbans (Figure 3.13). These are the Kobadak River, Kholpetua River, Passur River,
Sibsa River, and Baleswar River. The Kholpetua and Kabadak River receive fresh water
mainly from the runoff and the polder areas in addition a proportion of the Gorai inflow.
The Passur and Sibsa receive fresh water from Gorai off take, while the Baleswar is fed
partially by the Gorai and also from right bank spill channels of the Ganges and Meghna
Rivers. This is the only major source now which is carrying upstream fresh water from the
Ganges. These 5 major rivers jointly carried between them freshwater of 1175 m³/sec in
1995 and 1320 m³/sec in 2001 (IWM, 2003). These small rivers have their sub-catchment
area and this area is collecting water from rainfall and from neighbouring big rivers, all the
waters are emptied into the Sundarbans.
3.3.2 Transboundary Ganges water withdrawal and salinity intrusion The Ganges is one of the major transboundary rivers in the South Asia and it plays an
important role in the regional economy and floodplain fertility and agricultural production.
The Ganges occupies the most important basin in India and Bangladesh. The total length of
the Ganges from its sources to its outfall into the sea is 2,525 km. The area of the total
basin area is 861,404 km2 and about 303 million people are settled here in the catchment
area. The length of the main channel of the Ganges (Padma) in Bangladesh is only 141 km
excluding the common boundary of 112 km. The Ganges basin in Bangladesh contains
only 6.1 million acres, and supports a population of over 12 million people (Begum, 1987).
The proportion of the Ganges catchment area in Bangladesh is only 7.5 %. Melting snow
from the Himalayas also contributes to the perennial flow of the Ganges River but the flow
condition is highly subject to the seasonal variation. In the Ganges sub-basin the per capita
river flow is 1254 m³/year and the depth of the flow per hectares of cultivable area is 0.58
m. There is an alteration of landscapes due to the loss of saline-fresh balance when the off

Capter 3 The Sundarbans study area 59
take points of Mathabhanga, Kobadak and other rivers bringing fresh water from the
Ganges to the southern region were silted up and lost their connection with the Ganges.
The Ecological situation became further imbalanced when India constructed the Farakka
Barrage in 1975 on the Ganges River, 17 km upstream from the Bangladesh border, and
began diverting more then half of water (more than 57 %) (Figure 3.14) to the Hooghly
2389
1964
860616 588 510 447 450 364
2507
910
267
991
0
500
1000
1500
2000
2500
1962 1968 1970 1973 1975 1980 1985 1989 1993 1996 1998 2000 2002 2004 2006Time (Year)
Wat
er D
isch
arge
m³/s
ec
3700 3600
3000
3500
4000Water f low s
Polynomial (Water f low s)
Figure 3.14 Ganges water levels at Hardinge Bridge in the dry season
y = -226.62x + 3169.3, R² = 0.8835
y = 0.013x6 - 0.5196x5 + 6.8624x4 - 27.134x3 - 47.404x2 - 107.11x + 3915.4, R² = 0.9859
-500
0
500
1000
1500
2000
2500
3000
3500
4000
1962 1968 1970 1973 1975 1980 1985 1989 1993 1996 1998 2000 2002 2004 2006
Time (Year)
Wat
er D
isch
arge
m³/s
ec
Water flowsLinear
Polynomial
Figure 3.15 The Ganges water flows at Hardinge Bridge during the dry season. (Data:
Nishat, 2006; Muniruzzaman, 2001; Jabbar, 1995; Ben, 1995).

Capter 3 The Sundarbans study area 60
River in India. This blocked the perennial flow of the Ganges and diverts its water through
a feeder canal into the Bhagirathi-Hoogly River for the improvement of navigation for the
Calcutta port (Farzana and Nadia, 2001). Historically the upstream flows was normal for
example the Ganges River discharge at Hardinge Bridge in 1962 was 3,700 m3/sec and in
1968 (Figure 3.14) when the average monthly flow of the Gorai in the dry season exceeded
3,600 m3 /sec and after this period the flow of Gorai River dropped in 1976 (Ben, 1997;
Abbas, 1982).
The Ganges recorded the lowest flow of 267.33 m3/sec on 6 April, 1993 against a flow of
1841.35 m3/sec as the pre diversion period. In 1995 it was less than 500 m³/sec and of
recent years flows recorded shows a figure of 364 m³/sec (Figure 3.15) (Khan, 1995;
Nishat, 2006). Bangladesh and India have had been having conflicts over the Ganges water
resources for about 30 years. These two nations have signed three different treaties within
a span of 21 years 1975, 1977 and 1996 about water resources usage of the Ganges after
the construction of the Farakka Barrage (Sakamoto et al., 2001; Khan, 1995). These
agreements have not been all that smooth, because of different political social perceptions
of both countries. Many times these agreements favoured the Indian part considering the
supply of water already available in the down stream. Bangladesh is more vulnerable to
flood and drought than India by reason of the Farakka Barrage. Both countries have been
suffering from a lack of water and unplanned usage. The temporary water sharing treaty
was concluded between two countries in 1975 for the first time, this treaty indicated that
India draws 310-350 m³/sec of water from the Farakka Barrage and discharges 1245 -1400
m³/sec of water to the downstream from April 21 to 30 which happens to the lean period of
the year (Farzana and Nadia, 2001; Begum, 1987). The shares of Bangladesh and India
based on the flows reaching Farakka at 75% availability are given as follows (Farzana and
Nadia, 2001; Ben, 1997). After 1984 there was no rule for the Ganges River water
resources utilisation between the two countries and the treaty concluded again in 1996.
Table 3.7 Rules of allocation of water on 1996 Treaty (m³/sec) (Source: Sakamoto et al., 2001; Khan, 1995)
Availability at Farakka India Bangladesh
1,982 less 50 % 50 % Balance of flow 991 1,982 ∼2,124
2,124 more 1,133 Balance of flow
During the time when the total amount of flow is less than 1,982 m³/sec, India and

Capter 3 The Sundarbans study area 61
Bangladesh draw almost 50% according to the agreement (Table 3.7). A thirty year
agreement which was signed in 1996 bought settlement to the dispute of the two countries
for the time being, but the conflict does not seem to be completely resolved. The Figure
3.16 shows the salinity increasing trends after Farakka at Passur-Mongla point. The
amount of the Ganges water flow in Bangladesh remarkably reduced that has negative
environmental effects in the downstream.
y = -0,2129x6 + 10,473x5 - 190,96x4 + 1552,9x3 - 5083,2x2 + 6040,7x + 7R2 = 0,9326
R2 = 0,8753
0
10000
20000
30000
1962 1968 1970 1973 1975 1976 1980 1985 1989 1993 1996 1998 2000 2002 2004 2006Time (Year)
Salin
ity D
ensi
ty E
y = 2938,1x + 540000
50000
60000
Cw
dS/
m
ds/mPolynomial (Salinity dS/m)Linear (ds/m)
Figure 3.16 The Ganges water scarcity and salinity increase at Passur-Mongla point
The Ganges water flow in 1962 was 3700 m³/sec whereas it was 364 m³/sec in 2006. In
Figure 3.14 and Figure 3.15 the polynomial model shows the reduction discharge for a
long duration and the regression value R² = 0.9859 is found in the early stage of 1970’s
when the discharge was greater. On the other hand the regression value R² = 0.8835 was
found in 1980 when water flow rates were already at a reduced level. Accordingly water
salinity was increasing (Figure 3.16) simultaneously at Passur-Mongla point, where the
regression value R²= 0.9326 was found in 1993 whereas the regression value R²= 0.8753
was found in 1993. Figure 3.16 shows that the salinity trend was normal at Passur-Mongla
point (entry point of Sundarbans) until 1975 just before the construction of the Farakka
Barrage, and after withdrawal the Ganges fresh water from the basin; as a result water
salinity increased from 4322 dS/m to 32415 dS/m, this trend continued until 1988. There
was an acute shortage of fresh water in 1993 (Figure 3.14; 3.15) and immediately the
salinity rates increased in greater heights. The salinity rates suddenly decreased from 1996-
Capter 3 The Sundarbans study area 62
1998, the reason for that, in 1996 the Gages water sharing agreement had been done
between Bangladesh and India. It is an indicative of the fact that the agreement was in
place for a short period of time, after this three year duration, water flow gradually reduced
again and corresponding salinity levels increased accordingly.
3.3.3 Quality and quantity of freshwater in the Sundarbans rivers The main sources of freshwater in the Sundarbans forest areas are the major 5 rivers and
these rivers are carrying fresh water from upstream. At the upstream the Ganges River is
the most important and a huge fresh water supplier to the Sundarbans. The other rivers like
Madhumati Baleswar River, Passur River, Sibsa River, Kobadak and Kalindini Rivers play
a vital role in the supply of water to the Sundarbans. Historically, these rivers do contribute
to the balancing of the ecosystems in the whole region. The excess water flow of the
Ganges during the wet season could be stored and potentially used in the dry season. It is
estimated that the requirement of Ganges fresh water supply to Sundarbans is 48.49 MAF
(Million Acre-Feet) and other rivers like Kobadak and others also supplying similar
quantities of surface waters to the Sundarbans (Begum, 1987). It is clear that the upstream
rivers surface water does mix with the sea water and makes it difficult to estimate the
quantity of river water in the Sundarbans region. The Sundarbans is a vast area and the
water body is 2000 km2 in the form of rivers and creeks. The quality of waters in the
Sundarbans mangrove wetland is low considered on high concentration of NaCl in water.
The other parameters of water quality have not been considered in my research. In some
cases the elective conductivity, pH and organic matters in waters were recognised for
consideration of water quality analysis. For considering water quality other parameters like
pH, BOD, DO and inorganic components like COD, NH -N, PO3 4-P and heavy metal like
Cr, Pb, Hg etc are important components. Some water qualities tests have been done by the
Institute of Water Modelling and results were collected. The Ministry of Environment and
Forest (MoEF) defines Environmental Quality Standards (EQS) in Bangladesh. The DOE
Gazette has defined the limiting values for only 4 parameters in 1997 such as pH, BOD,
DO, total Caliform, and inorganic compound, heavy metals like COD, NH -N, PO3 4-P and
Cr, Pb, Hg etc in 1991. Table 3.8 shows the defined limiting values for the parameters of
water quality; Some results of water quality parameters were found in IWM investigation
in 2003. The maximum BOD concentration occurs in April and the minimum is found in
November-December (2001-2003). The overall range was 2-120 mg/L and average range

Capter 3 The Sundarbans study area 63
Table 3.8 Limits of water pollutants (Source: DOE - EQS Report, 1991; 1997; IWM SBCP
Report, 2003).
Parameters Considerable limit
BOD 2-10 mg / L
Coliform - total 50-500 nos/ 100 ml
DO 5 - 6 mg /L
pH 6.5 - 8.5
COD 4 - 8 mg /L
NH - N 0.025 - 3 mg /L 4
PO -P 6 -10 mg /L 4
Hg 0.001 mg /L
Cr 0.05 mg /L
Pb 0.01- 0.2 mg /L
Oil and Grease 0.001-15 mg/L
was 11.3 mg/L which was exceeding the upper limit of EQS. The COD concentration
range was found to be from 5 to 255.4 mg/L with an average of 35.96 mg/L it also
exceeded the permissible limit of 4-8 mg/L. The DO concentration (2001) was found to be
at a very high rate in the east rivers while there was a low concentration in western rivers
(2002), DO ranges from 4.90 to 6.90 mg/L with average value of 5.99 mg/L (Table 3.8).
The range was within the allowable limit in the marginal condition. The concentration
range of NH3-N is found 0.001 to 0.33 mg/L and the average range was 0.043 mg/L but
the concentration rate of NH4-N was between 0.040 - 6.74 mg/L and the average value
was 2.183 mg/1. The average value of total Ammonia (NH3 + NH4) was found to be 2.2
mg/L and in some places it was found to be even more than 3 mg/L. The pH value of river
systems was found to be 7.5; the river water was a little alkine. The PO4-P concentrations
were generally found in the low range like 0.009 - 0.582 mg/L and the average value was
0.115 mg/L. The concentration values of heavy metals like Cr, Pb and Hg are higher than
the permissible limit 0.05 mg/L, the Pb concentrations exceeded the allowable limit 0.2 mg
/L. Oil and Gas concentration value was found to be at the higher value of 0.001 mg/L
(Table 3.10). As a whole, the rivers water quality in the Sundarbans region is gradually
degrading which is also a threat for ecosystems. NaCl is one of the most important
parameter for water quality and water is the key element for ecosystems. Water salinity
modelling has been analysed more detailed in the following chapter.

Chapter 3 The Sundarbans study area 64
3.3.4 State of salinity of the investigation area The case area of the Sundarbans is situated in the southwestern part of Bangladesh; the area is
bigger than the Netherlands. The area has been affected by the reduced flows of the river
Ganges. It is a complex part of the delta of the rivers Ganges, Brahmaputra and Meghna. It is
the moribund region of the delta. Many small rivers and canals are no longer, tributaries of the
river Ganges; for a long time they had no flowing water only some are active and flowing in
the rainy season. There are three sources of water flowing into the south-west region of
Bangladesh. The flow of the major rivers coming from India, primarily the rivers Ganges,
second, rainfall draining from the surrounding countryside and finally a contribution from
water stored in the ground. The Ganges River is the largest source of water flowing across the
boarder from India. The Gorai and Arial Khan Rivers are two tributaries draw water from the
Ganges in Bangladesh. In the case of the Gorai-Madhumati, the discharge in its upper reaches,
the Gorai is influenced by the movement of the channel of the river Ganges near Khustia and
the extent to which the off-take of the Gorai is blocked by sand banks. It was reported that at
different times a monthly average discharge of less than 30 m³/sec has been recorded for all
months between December and May.
Owing to the high sensitivity of the salinity model the dispersion coefficients for the dry and
wet period has made little different scenarios. The density induced contribution to the
pressure, gradients increases linearly with the water depth, so the effect is stronger in the
deeper rivers, where the density driven flows develop during slack water with a negligible
surface slope (IWM, 2003). The investigation area is divided into three ecological zones
(Figure 3.17) (Karim, 1995; 1988). These zones are oligohaline where salinity from 0 - 1085
dS/m, mesohaline where salinity from 1085 - 38898 dS/m and polyhaline where salinity >
38898 dS/m. The closed boundaries with consideration of rainfall runoff have been treated as
closed in the salinity model. In the southern part of the model areas, all the tidal boundaries
have been considered as open, where salinity concentrations have been specified from the
observed data. The observed data which has been collected from the influential 13 rivers
points out of 29 rivers in the case area has been shown in the investigation area map (Figure
3.17). The surface water flow in the rivers of the Sundarbans area mainly comes from the
Ganges-Padma at the off take of Gorai through the Passur River in the Sundarbans and Gorai-
Madhumati and from the lower Meghna through the Swarupkati-Kocha River. Few other

Chapter 3 The Sundarbans study area 65
sources from the local river surface flows from the local catchment areas. Some of the rivers
in the catchments area like Bhairab, Bhadra, Chitra, Chunar, Kobadak and Khulpetua among
others normally receive runoff water from their own catchment area. Salinity is defined as the
amount of dissolved salts present in water. It reflects the dominant forcing functions of
freshwater discharge and oceanic exchange. Salinity content of river in Sundarbans shows
great spatial variability.
Figure 3.17 State of salinity of the investigation area in the Sundarbans
In the estuaries salinity is an integrated index of mixing process of rainfall, freshwater surface
and subsurface flow, tidal water and evaporation. During pre-monsoon (March-May) the
conductivity of river water is high and ranges between 9681.28 dS/m to 71918.08 dS/m. In the
post monsoon season (August-October) the conductivity of rivers water decreases 0-29735.36
dS/m. These results are found in my study. These seasonal patterns and their spatial variability
of river water salinity have been largely attributed to three factors according to Karim (1988),

Chapter 3 The Sundarbans study area 66
i) Seasonal precipitation,
ii) Evapotranspiration regime,
iii) The river discharge fluctuation and tidal regime.
Conductivity of saturated soil samples from the north and middle of the Sundarbans regions
varies between 898.97 and 12405.86 dS/m. This conductivity is much higher than that of
surface soil (Cheffey et al., 1985; Hassan, 1990). In the entire Sundarbans the salinity
intrusion has been increasing after upstream freshwater withdrawal. Actually there is no
enough in-depth research on the Sundarbans based on particular environmental sectoral issues.
The salinity intrusion in the Sundarbans has been shown bellow in a structure format;
Table 3.9 Salinity stress during 2001–2002 inside the Sundarbans (after IWM, 2003)
Percentage of area ( %) under different salinity (dS/m) level Duration in days > 54025
dS/m 43220 –54025 dS/m
32415-43220 dS/m
21610-32415 dS/m
10805- 21610 dS/m
<10805 dS/m
Area %
120 0 25 28 19 15 13 100 90 6 31 28 15 14 6 100 60 6 31 28 15 15 5 100 45 28 30 17 11 10 4 100 30 29 30 17 11 9 4 100 15 29 30 17 11 9 4 100
On the other hand the area covered by salinity and range of salinity which has been showing in
the water salinity model investigation areas is not satisfying (Table 3.10).
Table 3.10 Sundarbans area covered by different salinity range (Data source: EGIS, 2000)
Area km² Salinity dS/m Percentage of area cover 4813.60 421.19 421.19 361.02
> 32415 21610 -32415 10805 - 21610 < 10805
80 7 7 6
Beside these the overall situation of rivers water salinity in the Sundarbans mangrove forest
area has been shown in the graphs below (Figure 3.18). The 13 important river basins have
been recognized for their potential role to decrease and increase the salinity at different points.
The diversion of upstream waters resulted in falling water table and greater water salinity
downstream of Bangladesh especially in the Sundarbans region.

Chapter 3 The Sundarbans study area 67
The saline water intrusion was constructed by the upland flows, with a decrease in the upland
flows the salinity has increased and advanced for distances inland (Ben et al., 1995). There has
been a comparison of the salinity intrusion from 1967- 68 with the situation which occurred
during 1976 and 1977 because the unimpaired dry season flows of these years were
comparable and better records were available for these years.
0
2000
4000
6000
8000
10000
12000
14000
16000
18000
20000
Jan Feb Mar Apr May Jun Jul Aug Sep Oct Nov DecTime
Rupsha -1968Rupsha -1976Mongla -1968Mongla -1976Nalianala -1968Nalianala -1976Morelganj-1968Morelganj-1976Bhairab-1970Bhairab-1976
Wat
er S
alin
ity E
Cw
µS
/cm
Salinity range after Farakka in 1975
Salinity range before 1975
Figure 3.18 Water salinity trends in the Sundarbans region before and after construction of
Farakka Barrage 1968-1976. (Data: Khan, 1983; Ansarul, 1995; FAO/UNDP, 1995)
The most dramatic saline intrusion during 1976 and 1977 occurred in the Passur estuary and
up the Rupsha-Passur to the Nabaganga, the Atharabanka and the upper Gorai-Madhumati and
is connected with the Ganges water withdrawal. Figure 3.18 shows the general trends of
salinity in 1968 with 5256 µS/cm registered only 4 miles downstream of Khulna city, the
maximum salinity rate in Khulna was about 1383 µS/cm. But when the Gorai River flows
dropped in 1976 the high salinity rate moved to Khulna and up to Bardia point (173 km far
from the coast). The maximum salinity measured at Khulna in 1976 was about 18809.34
µS/cm in Figure 3.18. The salinity intrusion has been gradually increasing in every dry season.
However, the estuaries intermixing pattern of river salinity is very complex. The rise and fall
of salinity in all the rivers does not take place simultaneously. The salinity situation in the
Sundarbans investigation area has been done considering the salinity increasing trends in the
period 1968 to 1976. The figure (Figure 3.18) shows the different salinity increasing and

Chapter 3 The Sundarbans study area 68
decreasing situation at the potential places and rivers in this area. They are influenced by
salinity increasing processes. A general survey was conducted on water and soil salinity of the
Sundarbans in 2003 (Figure 3.19). The findings show that the soil salinity is increasing
slightly from east to west and from north to south.
Figure 3.19 The location of salinity samples in the Sundarbans investigation area
0
10000
20000
30000
40000
50000
60000
70000
80000
Jan Feb Mar Apr May Jun Jul Aug Sep Oct Nov DecTime
Sal
inity
Den
sity
EC
w d
S/m
MunchiganjMirgangKoramjalRupsha RiverKasiabadPassur - MonglaNilkamalSibsa -Paik.Kaligonj
Threshold Line 43220 dS/m
Figure 3.20 Water salinity at 9 sites in the of Sundarbans region in 2003

Chapter 3 The Sundarbans study area 69
The survey samples were collected from 9 different sites (Figure 3.19) such as Munchiganj,
Mirgang, Koramjal, Rupsha River, Kasiabad, Passur-Mongla, Nilkamal, Sibsa - Paikgacha and
Kaliganj points. The survey results are shown in the graphs in Figure 3.20 and Figure 3.21.The
results in the graphs have shown that until February the water salinity rate has been less than
27660.8 ECw dS/m and the highest density over 74684.16 ECw dS/m was found in Mirgang
and Munchiganj which is situated in the west-north part of the Sundarbans forest. Water
salinity increased rapidly and varied from east to west and north to south.
0
10000
20000
30000
40000
50000
60000
Jan Feb Mar Apr May Jun Jul Aug Sep Oct Nov DecTime
Sal
inity
Den
sity
EC
s dS
/m
MunchiganjMirgangKoramjalRupsha RiverKasiabadPassur-MonglaNilkamalSibsa - Paik.Kaliganj
Figure 3.21 The soil salinity at 9 sites in the Sundarbans region in 2003
Whereas the threshold value of water salinity for most of the mangrove plants and animals is
43220 ECw dS/m. The soil samples were also collected from the same 9 water sample sites
(Figure 3.19) The soil salinity increasing rates are also similar in trends which is depicted in
(Figure 3. 21), the real scenarios in the Figure 3.20 where the highest rate of ECs is 55321.6
ECs dS/m was found at Mirgang and the second highest rate of soil salinity ECs is 41629.50
dS/m was found at Kaligonj point it is situated out side of the Sundarbans (Figure 3.19).
3.3.5 Scarcity of upstream freshwater and its impacts in the downstream The shortage of water in the Ganges catchment area is one of the major environmental hazards
which have been recognised recently. Considering the requirements of water, India needs
14,647 m³/sec water for irrigation in addition to 1133 m³/sec which is needed for the
preservation of Calcutta port.
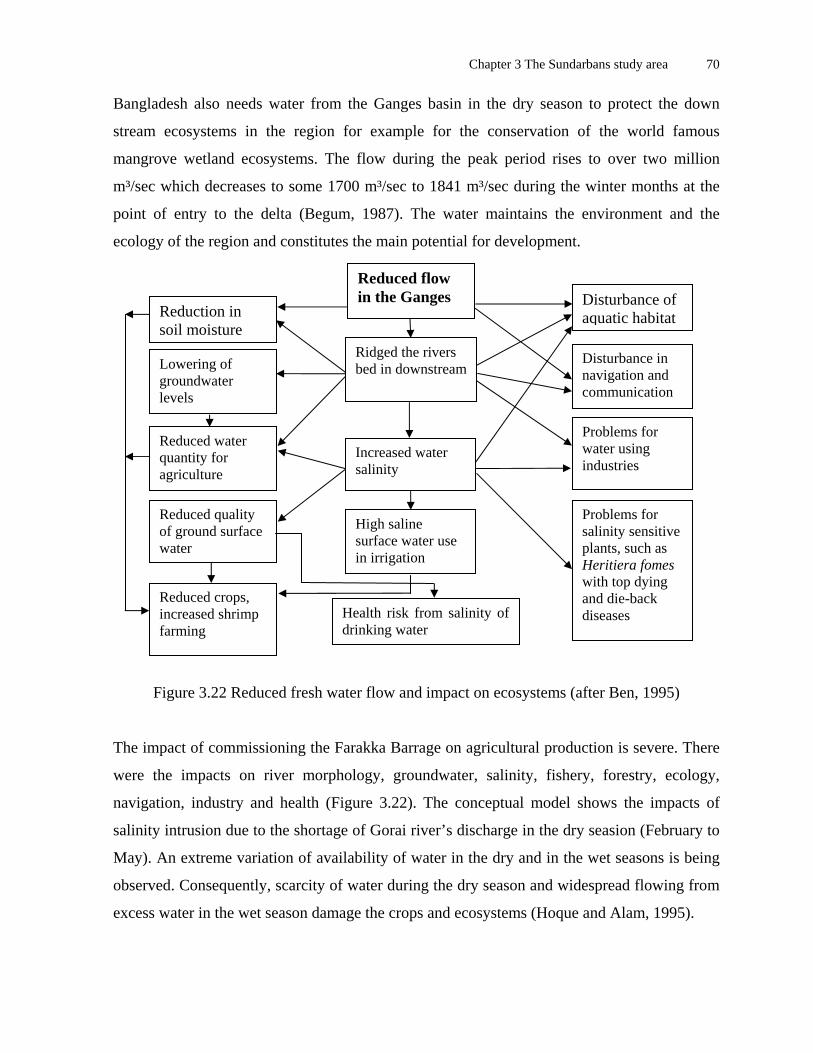
Chapter 3 The Sundarbans study area 70
Bangladesh also needs water from the Ganges basin in the dry season to protect the down
stream ecosystems in the region for example for the conservation of the world famous
mangrove wetland ecosystems. The flow during the peak period rises to over two million
m³/sec which decreases to some 1700 m³/sec to 1841 m³/sec during the winter months at the
point of entry to the delta (Begum, 1987). The water maintains the environment and the
ecology of the region and constitutes the main potential for development.
Reduction in soil moisture
Lowering of groundwater levels
Reduced water quantity for agriculture
Reduced quality of ground surface water
Reduced crops, increased shrimp farming
Reduced flow in the Ganges
Ridged the rivers bed in downstream
Increased water salinity
High saline surface water use in irrigation
Health risk from salinity of drinking water
Disturbance of aquatic habitat
Disturbance in navigation and communication
Problems for water using industries
Problems for salinity sensitive plants, such as Heritiera fomes with top dying and die-back diseases
Figure 3.22 Reduced fresh water flow and impact on ecosystems (after Ben, 1995)
The impact of commissioning the Farakka Barrage on agricultural production is severe. There
were the impacts on river morphology, groundwater, salinity, fishery, forestry, ecology,
navigation, industry and health (Figure 3.22). The conceptual model shows the impacts of
salinity intrusion due to the shortage of Gorai river’s discharge in the dry seasion (February to
May). An extreme variation of availability of water in the dry and in the wet seasons is being
observed. Consequently, scarcity of water during the dry season and widespread flowing from
excess water in the wet season damage the crops and ecosystems (Hoque and Alam, 1995).

Chapter 3 The Sundarbans study area 71
3.4 Threats to the Sundarbans The scarcity of the Ganges water flows in the Sundarbans region is a challenge for cultural
landscapes, biodiversity and wetlands ecosystems of the coastal environment. The biota of the
Sundarbans mangrove wetlands are highly influenced by salinity regime of surface and
groundwater systems and more significantly of water and soil. The vegetation of the particular
area can be dominated due to high salinity intrusion. Natural regeneration of vegetation and
forest succession also depends on salinity regime (Karim, 1994). Continuous water and soil
salinity increasing, the loss of biodiversity and degrading the quality of water and soil of the
entire area is creating threats to ecosystems (Curry and Mcguire, 2002). The water quality and
the analytical results of water pH in the Sundarbans region was found to be 6.0 to 7.0 which
were considered under neutral acidic reaction class, and for the soil analytical result analysis
the Soil pH which was 7.10 to 7.70 were considered under neutral and saline alkali. The
organic matter was found 0.88 % to 1.34 % which was a very low concentration. The
concentration of Nitrogen (N) was 0.07 % to 0.08 % which was very low comparing to other
places in the coastal region and Zinc (Z) concentrations was 2.6 mg/g to 5.0 mg/g which was
very high for mangrove plants production and growth. The other values of water quality
parameters including NaCl, BOD, COD and NH3-N have crossed the considerable limits of
standard. As a whole the elements of ecosystems are being affected through salinity intrusion
inside and outside of the Sundarbans. The Ganges fresh water supply and policy is
consequently a strategic and political issue between Bangladesh and India. For this reason the
stability of ecology and ecosystems balance could deepend on the Ganges fresh water supply
in the downstream. Otherwise this could be in turn effects on the long-term sustainability of
wetlands ecosystems management in the whole region.
3.4.1 Human influences and negative impacts in the Sundarbans The inadequate water resources management in the Sundarbans has evolved under the
influence of human activities and reduced salinity, which used to be maintained by huge
amounts of fresh water flow into the downstream rivers. The basin is an area of strategic
economic and development importance, marked by socio-economic disparities and
environmental vulnerabilities. The optimisation and harmonisation of competing water uses,
power generation, irrigation, fishing, tourism, waste dilution, household and industrial water

Chapter 3 The Sundarbans study area 72
supply and other, including environmental uses has been a constant challenge for the basin
stakeholders. The continuous freshwater reducing process in the Ganges transboundary
catchment has occurred for the last three decades (Joseph, 2006).
WILDLIFE
V E G E T A T I O N
W A T E R
Animal breeding Hunting Landscape level Disturbance Wild sanctuary
Organism Moisture Erosion-fertility Salinity intrusionCrop cultivation
Quantity Quality
Pollution Flora fauna
Salinity intrusion Navigation
Agri-product Fisheries
Indust.-product
Species diversityGrowth rate Germination Regeneration Nonmangrove Top dying Die back and Succession and Health risk
Human influences on the Ganges fresh water and mangrove wetlands resources
Threats on Sundarbans Mangrove Wetlands Ecosystems
SOIL
Figure 3.23 The ecological and socio impact structure of the Sundarbans mangrove forest
(Souce: after Islam, 2003)
Mangrove ecosystems are under stress by reason of human activity both within and outside the
ecosystems. The abnormal quantity of reduction of the Ganges water due to the Farakka
Barrage and other dams that were constructed caused the reduction of fresh water flows to the
Sundarbans. As a result increased salinity and alkalinity have damaged vegetation, agricultural
cropping pattern and changed the landscapes in the Sundarbans region. The inadequate
management of the Sundarbans natural resources has negative impacts on environmental,
ecological, geological, geomorphologic, social and cultural issues. The impact of soils starts

Chapter 3 The Sundarbans study area 73
with the destruction of surface organic matter and of soil fertility for mangrove plants
production.
The changes alter basic soil characteristics related to aerations, temperature, moisture and the
organisms that live in the soil. The diagram (Figure 3.23) is showing the interaction between
the four vital elements of ecosystems and the negative effects of ecosystems in the Sundarbans
case. The figure displays 4 core elements of ecosystem such as soil, water, vegetation and
wildlife which are natural resources in the Sundarbans and has a strong relation between fresh
water and human influence. Down to shortage of fresh water in the Ganges upstream and the
degradation of the water quality, the quality of these core elements of ecosystems is damaging.
3.4.2 The conceptual model of threatened Sundarbans ecosystems An extreme variation of availability of water in the dry seasons is being observed.
Consequently, scarcity of water during the dry season and widespread flowing from excess
water in the wet season damage the crops and ecosystems (Hoque and Alam, 1995). The water
maintains the environment and the ecology of the region and constitutes the main potential for
development.
Increased water and soil salinity, shrimp farming and health risk in Sundarbans
Reduction of water flows in the Ganges basin
Threats to Sundarbans Mangrove Ecosystems
Shortage of surface water, ground water levels, quality of water and soil fertility
Disturbance of fish habitat, navigation, industrial products, mangrove forest resources
Figure 3.24 The conceptual model of threatened ecosystems in the Sundarbans
The elements of biotic and abiotic functions are affected by reduced fresh water flows in the
downstream of the Ganges River in Bangladesh. The following conceptual model (Figure
3.24) is showing the environmental problems in the practical field. The reduction of Ganges
Chapter 3 The Sundarbans study area 74
water in the basin and the substantial use of natural resources are the main problems posing
threats to the elements of the ecosystems. In reality the Ganges water is receding in an
abnormal rate and it is the main reason for fresh water reduction from the upstream river
basins. Massive negative impacts are affecting the mangrove ecosystems in the Sundarbans
region. The main impacts have been clearly mentioned in the previous sub chapter.
3.4.3 Pressure, problems and substantial uses of natural resources The Sundarbans mangrove forest has been exploited for the past few centuries. But bit
attentions have been paid to the improvement of the mangrove forest and its wetlands
resources. On the other hand the forest has been deteriorated in recent decades. The mangrove
forest has been over-cut and exploited though it is meant to be managed on a sustained yield
basis. The harvesting could not be properly regulated because of the demand of the people.
Wildlife populations have declined greatly and no effective step has yet been taken for
adequate management and conservation of wildlife. The fishery sector of the Sundarbans is
playing a potential role for fish culture, but no attention has been paid to the improvement of
this important natural resource. The surrounding environmental condition of the forest area is
under continuous degree of change by reason of global warming, salinity intrusion and
shortage of fresh water flows in the upstream and natural calamities in the coastal areas. These
have posed serious threat to sustainable management of the Sundarbans (Siddiqi and Das,
2000; Siddiqi, 2001). The problems and pressures of the Sundarbans are diverse including,
ecological, economical, management, regeneration, mortality of trees, sedimentation, tourism,
water and soil salinity, water pollution and research activities etc.
• Wetland ecosystems have historically been considered as wastelands, unworthy of
consideration for conservation. As a result, wetlands have frequently been altered or lost
because their ecological functions and resulting values to society have not been understood
(Siddiqi, 1994).
• Deforestation of mangroves as result of shrimp farming, salt farming and agriculture
adversely affects marine fisheries production and leads to a loss of biodiversity and
landscape changing and the livelihood of over 6 million people who depend on mangrove
resources directly in the coastal region in Bangladesh (Anon, 1995).
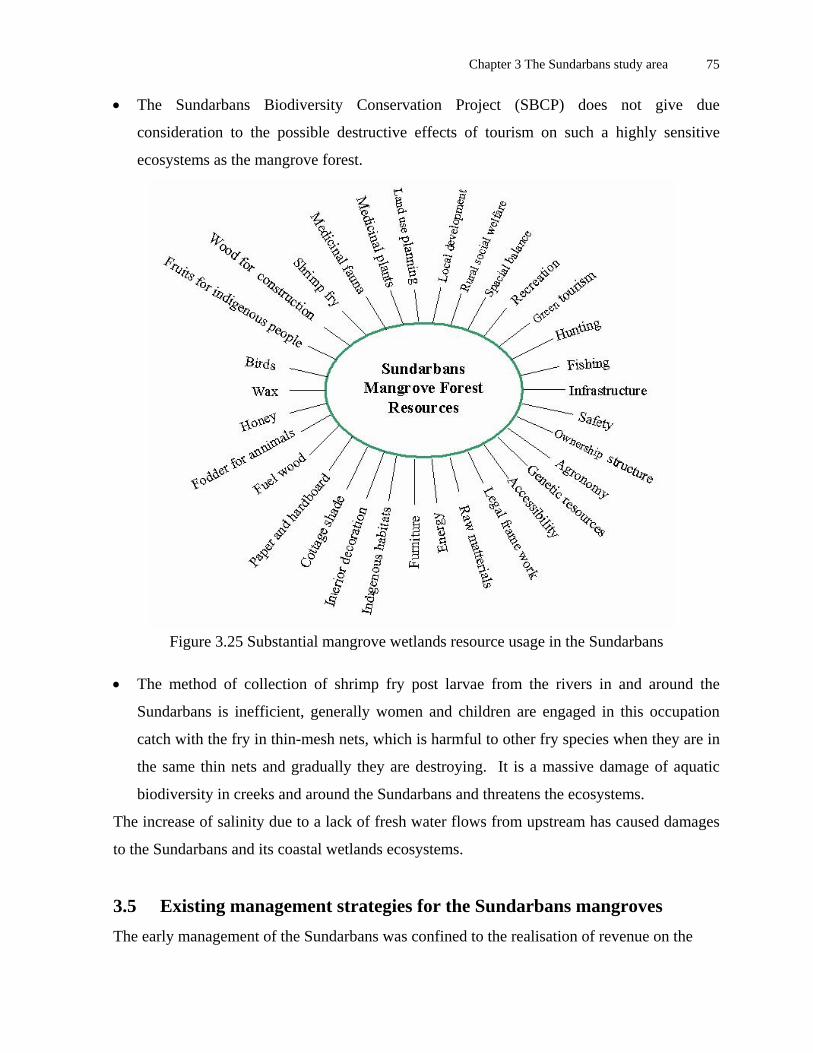
Chapter 3 The Sundarbans study area 75
• The Sundarbans Biodiversity Conservation Project (SBCP) does not give due
consideration to the possible destructive effects of tourism on such a highly sensitive
ecosystems as the mangrove forest.
Figure 3.25 Substantial mangrove wetlands resource usage in the Sundarbans
• The method of collection of shrimp fry post larvae from the rivers in and around the
Sundarbans is inefficient, generally women and children are engaged in this occupation
catch with the fry in thin-mesh nets, which is harmful to other fry species when they are in
the same thin nets and gradually they are destroying. It is a massive damage of aquatic
biodiversity in creeks and around the Sundarbans and threatens the ecosystems.
The increase of salinity due to a lack of fresh water flows from upstream has caused damages
to the Sundarbans and its coastal wetlands ecosystems.
3.5 Existing management strategies for the Sundarbans mangroves The early management of the Sundarbans was confined to the realisation of revenue on the
Chapter 3 The Sundarbans study area 76
export of forest produce from the area. A large scale deforestation and destruction of wild life
habitats and indiscriminate hunting caused a great decline in population size of animals and
drew attention to the Government and the Sundarbans and was declared as a reserved forest in
1878 under the Forest Act VII of 1865 (Siddiqi and Das, 2000; Siddiqi, 2001). The decline in
forest cannot recover itself with proper management further deterioration of the status of the
mangrove wildlife habitats can be prevented. The first management plan of the Sundarbans
came into force from 1893-98 (Heining’s working plan). This working plan was revised from
1903-04 (Lloyd’s working scheme) and again from 1906-07 (Farrington’s Working Scheme).
A regular working plan was prepared by Trafford for the period from 1912-13 to 1931-32 and
his plan divided the whole forests into two working circles (Eastern and western) covering
saline areas and relatively poor and less saline areas with good qualities trees. The plan of
Curtis came into existence in 1931; a large volume of data was collected for this working plan
(Curtis, 1933). The aim of this plan was managing the production of timber, fuel wood and
thatching materials and the exploitation diameter was fixed for different site quality. A 20
years felling cycle for less saline areas and 30 years for moderate saline areas was prescribed.
Choudhury’s modification plan came into being when felling was maintained as forest
management systems but it expired in 1947. A forest inventory of the Sundarbans was
completed in 1960 based on aerial photographs (Choudhury, 1968; Siddiqi and Das, 2000).
The present working plan (1960 -1980) was prepared by Choudhury in 1968 from the data of
that inventory. The working plan divides the forest into Gewa (Excoecaria agallocha) Sundri
(Heritiera fomes) and Keora (Sonneratia apetala) working circles. The whole Sundarbans is
divided into 4 ranges namely Saronkhola range area 1309.98 km², Chandpai range area
1000.21 km², Khulna-Nalianala range area 1613.45 km², and Shatkhira-Burigoalini range area
1849.92 km² (Hossain and Acharya, 1994. The modified management plan was redeveloped
in 1980 and is still in use. The management plan divides the forest into Gewa (Excoecaria
agallocha) Sundri (Heritiera fomes) and Keora (Sonneratia apetala) working circles. The
felling cycle is 20 years and yield is regulated by area. The Sundarbans mangrove wetlands
ecosystems are managed maintained and preserved by the forest department under the
Ministry of Environment and Forests (MoEF) by application of the Forest Act 1927 and the
Forest Amendment Act in 1960. Currently the Ministry of Environment and Forest with the
co-operation of IUCN has drafted a national wetlands policy framework, which has not yet

Chapter 3 The Sundarbans study area 77
been implemented. The objectives and the main features of this policy include the following
issues;
• Maintenance of biodiversity in the reserve forest
• Conservation and maintenance of soil, water resources and ecosystems health and vitality
• Maintenance of ecosystems functions, and ecological process in the coastal wetlands
• Promotion of economical development through stakeholders participation and
• Principles for sustainable natural resources utilisation and management.
• Maintenance of evolutionary process and accommodating human use in light of the
previous issues.
• Development of the legal, instrumental and economic frame work for mangrove wetlands
conservation and sustainable management.
Summing up, it appears that a number of physio-chemical factors are involved in mangrove
growth and its ecosystems development. Considering the present environmental condition, an
integrated resource management and development approach will be appropriate for improving
the existing management situation. After a close observation it has been confirmed that the
management systems in the Sundarbans mainly aims to manage the plant resources of the
forest. The other important aspects of ecosystems such as wildlife, mangrove fauna, fishery,
shrimp and fry collection, tourism, biodiversity protection, conservation of natural world
heritage site location and socio-economic of the surrounding population have not yet been
taken into account or due consideration.

Chapter 4 Modelling of water salinity 78
Chapter 4 Modelling of Water Salinity 4.1 Water salinity modelling in the Sundarbans Rivers
In the Sundarbans mangrove wetland forest region there are creeks, channels and rivers
making a total of 430 available in the region. Once all the canals and rivers were connected
with each other and carrying fresh water from one place to another such as from the northern
upstream to southern downstream and eastern to western side of the forest area (Siddiqi,
2001). There are 29 large rivers which forms the major portion of the Sundarbans rivers. They
are located at different areas of the forest and they converge at the Bay of Bengal. There are
13 important rivers and their basins that play an influential role in balancing the Sundarbans
ecosystems. For this reason these 13 rivers were chosen for water salinity modelling using
time series of Fourier polynomial approximation method. The location of these selected rivers
represents the major portion of the case study area. The rivers have influential role in
balancing the mangrove ecosystems and on the coastal environment as well. The location of
the rivers and their distribution network pattern covers the whole Sundarbans region. The
detail methodology of water salinity modelling has been discussed in the following sub-
chapters. The general conception and the meaning of model is the abstraction of reality. A
model can be considered as a synthesis of elements of knowledge about a system. Models are
able to provide new knowledge, about the reactions and properties of the entire systems, which
is useful for the development of ecosystem theory. The quality of the model is therefore very
dependent on the extent of knowledge about the elements of the systems and the available data
(Jörgensen and Müller, 2000). A model is therefore nessecary for any kind of problem solving
and an adequate management planning (Gnauck, 2000). Water salinity model is the analysis of
salinity intrusion in water. This long time salinity intrusional behaviour in water is possible
through salinity simulation and modelling and it can be measured with technical approaches.
With such approach, the behaviour of salinity in water for a long time period is shown in a
graph which is defined as a water salinity model. The time series model is one of the popular
models for such interesting field of investigation. Time series curves which are of cyclic
nature often arise when monitoring salinity intrusion of a process. Time series methods take

Chapter 4 Modelling of water salinity 79
into account the nature of the data collected. In time series models there are some fundamental
approaches for analysing models. Generation of river water salinity data can be frequently
observed in time series behaviour and an ordered sequence of values of variable at equally
spaced time intervals are also generated. The use of time series models are two folds, firstly
obtain an understanding of the underlying forces and structure that produced the observed
data, and secondly fit a model and proceed to forcasting, monitoring or even feedback and
feedforward control. Time series analysis is used for many applications in different environm-
Basin - 1 Passur - Mongla
Basin - 2 Baleswar - Bogi
Basin - 3 Betmargang -Kathka
Basin – 4 Sibsa - Nalianala
Basin -5 Bal - Jhalia
Basin - 6 Passur - Passakhali
Basin - 7 Betmatgang-Kathka
Basin - 8 Chunnar - Munchiganj
Basin - 9 Kholpetua -Kobadak
Basin -10 Notabaki khal - Notabaki
Basin -11 Arpongasi -Deboki
Basin -12 Nilkamal - Hiron Point
Basin - 13 Malancha - Mandarbaria BAY OF BENGAL
N
Figure 4.1 Location of water salinity samples collection in 13 river’s basins
-ental and economical fields. There are many methods used to model and forcast time series.
The Fourier polynomial time series model is one of the appropreate approaches for analysing
the models. In the Sundarbans rivers water salinity modelling, the Fourier polynomial time
series model has been considered for water salinity approximation analysis. This model has a
cycling behaviour, which makes it easy to understand the cyclic process of water salinity. This

Chapter 4 Modelling of water salinity 80
technique has strong appreciation for periodic cycling behaviour of a particular interval of
time. The Fourier model is one of the scientific approach, by which it is possible to forecast
the future situation and possibly to make a long term management plan for natural resources
stabilization such as maintain the ecosystems. The closed boundaries with consideration of
rainfall runoff have been treated as closed in the salinity model. In the southern part of the
model areas, all the tidal boundaries were considered as open and salinity concentrations were
specified from the observed data. Out of 29 rivers in the case study area, the observed data
were collected from 13 influential rivers which are shown in the investigated area. The surface
water flow in the rivers of the Sundarbans area mainly comes from the Ganges-Padma at the
off take of Gorai through the Passur River in the Sundarbans and Gorai-Madhumati and from
the lower Meghna through the Swarupkati-Kocha River. Some other sources are from the local
rivers surface flows of the local catchment areas. Some rivers that are in the catchment areas
like Bhairab, Bhadra, Chitra, Khulpetua etc normally receive runoff water from their own
catchment area. Salinity is the amount of dissolved salts present in water. It reflects the
dominant forcing functions of freshwater discharge and oceanic exchange.
4.2 Fourier polynomial method
Considering the data which were recorded over some interval of time, it will be necessary to
choose a model that is periodic. In analogy to the “polynomials of best fit” it is possible to
write down a model that consists of a sum of sine and cosine finctions that best fit the given
data. It is necessary to decide with time, how many sines and cosines needs to be used in the
model approximation. At the same time it is also necessary to decide on the degree of the
polynomial model which best fit the data. The model which consists of trigonometric
functions is called Fourier Polynomials. These models are widely used in engineering, physics
and applied sciences to approximate process that are periodic.
According to the theory development by Fourier, any periodic function F(X), with period T,
may be represented by an infinite series of the form
F(X) = 2o∂ + ∑ ( cos nw
=
m
n 1
n∂ T X+ bn sin nwT X)
Where the coefficients and bn for a given periodic function F(X) are calculated by the formulas.
,o∂ n∂

Chapter 4 Modelling of water salinity 81
a0 = Τ2 F( ) dt ∫
Τ
οΧ
T -2π - π 0 π 2 π T
ƒ(x) 1 2
1
- 2
1
-1
Tπω 2
=
an = Τ2 F( ) cos nw∫
Τ
oΧ Tx dt n = 1, 2, ……………...m
Τ2∫Τ
obn = F( ) sin nw x dt n = 1, 2, ......................m Χ T
It should be noted that the first coefficient a0 is twice the average of the function F(X) over one
period. This series is called the Fourier series and the coefficients are called the Fourier
coefficients.
The general Fourier polynomial approximation of order 1 to 8 models were considered to
generate results for the water salinity model of the Sundarbans. In most cases the 8th order
approximation was found to produce the best results and it therefore dominated all other
models. The Fourier polynomial approximation of 8th order is given by the following equation;
f(x) = a0 + a1*cos(x*ω) + b *sin(x*ω) + 1
a2*cos (2*x*ω) + b2*sin (2*x*ω) + a3*cos (3*x*ω) + b3*sin (3*x*ω) +
a4*cos (4*x*ω) + b4*sin (4*x*ω) + a5*cos (5*x*ω) + b5*sin (5*x*ω) +
a6*cos (6*x*ω) + b6*sin (6*x*ω) + a7*cos (7*x*ω) + b7*sin (7*x*ω) +
a8*cos (8*x*ω) + b8*sin (8*x*ω)
In the research the Fourier polynomial approximation is carriedout based on data and different
Fourier polynomial approximation orders.
4.3 Data used

Chapter 4 Modelling of water salinity 82
In writing this dissertation, it was necessary to collect data and information from different
sources. The general data and information about the case study area have been used in the
introductory chapter and chapter three. The specific data, information about river water
samples which were collected from the selected 13 rivers from Sundarbans are extensively
discussed in chapter 4, which is the core chapter of this dissertation. The rivers water salinity
data were collected from the Institute of Water Management (IWM, 2003) in Dhaka. In the
Sundarbans area, there are 29 potential rivers that protect the coastal mangrove ecosystems
and cultural landscapes. Considering the availability and the number of samples data and
missing values, only 13 important rivers were selected for salinity modelling. The major rivers
(29 rivers) in the Sundarbans extend their flows across the three ecological zones in the entire
forest area. All the rivers are located within three ecological boundaries, the following map
(Figure 3.17) and the ecological boundaries shows the accurate basin and flow direction.
Water samples were collected from 3 important rivers out of 8 rivers in the less saline zone
such as Passur-Mongla River, Baleswar-Bogi River, and Selagang-Harintana River; 4
potential Rivers out of 10 rivers in the moderate saline zone like Sibsa-Nalianala River, Bal-
Jhalia River, Passur-Passakhali River, Betmargang-Kathka River; and 6 potential rivers out of
11 rivers from high saline zone such as Chunnar-Munchiganj River, Kholpetua-Kobadak
River, Notabakikhal-Notabaki River, Nilkamal-Hironpoint River and Malancha-Mandarbaria
Rivers. These 13 rivers which are 45% of the 29 important rivers in Sundarbans are playing an
incomparable role in balancing the mangrove ecosystems. Every selected river has 4 years (in
average) continuous similar intervals data and information which is comfortable and
acceptable to work with time series modelling through Fourier polynomial approximation.
Fourier polynomial model has a cyclic behaviour which is appropriate for realizing and
understanding the real situations. Through this Fourier polynomial model it can be possible to
forecast the future trends of increasing and decreasing rate of salinity. After selection of the 13
potential rivers, data and information on every rivers were processed and analysed with
computer based excel programme, finally the missing values of all the rivers were identified
through interpolation in excel. The missing values were replaced by approximation
procedures, using interpolation methods. Table 4.1 shows the data rearrangement structure and
other information of 13 river basins (Figure 4.1). All these rearranged and reconstructed data
were used for developing the Fourier Polynomial time series model on every river (13 rivers)

Chapter 4 Modelling of water salinity 83
of the Sundarbans region. As an example the specific data collection methods of the Passur-
Mongla River are given bellow.
Data of Passur-Mongla River
The Passur-Mongla River water data collection is important for assessing the quality of water
interms of pollutant particles. The river water data from the selected source were collected at
various intervals of time. The data were collected during inundation period, a condition which
is known as flood slack. The data were collected from 2nd January 2002 to 30th August 2003.
During the period of data collection, the 4 seasons of the year were considered, the raining
season or wet season is the lowest salinity season and the dry season is the most important
time for salinity intrusion. The data collection methods were on monthly basis. In every
month, 20 samples were collected. The data collection frequency is every 1.5 days or every 36
hours. Data collection process was continuously carriedout during the 20 months duration.
Data were collected in the early morning, noon and evening time. For example data collection
process in the month of January 2002 are as follows: 1st day-salinity 7779.6 dS/m, 2nd day-
salinity 7779.6 dS/m, 3rd day-salinity 7995.7 dS/m, 4th day-salinity 7995.7 dS/m, 5th day-
salinity 8211.8 dS/m, 6th day-salinity 8211.8 dS/m, 7th day-salinity 4105.9 dS/m, 8th day-
salinity 8644 dS/m, 9th day-salinity 8860.1 dS/m, 10th day salinity 10805 dS/m, 11th day-
salinity 10588.9 dS/m, 12th day-salinity 9940.6 dS/m, 13th day-salinity 9940.6 dS/m, 14th day-
salinity 10156.7 dS/m, 15th day-salinity 10372.8 dS/m, 16th day-salinity 10588.9 dS/m, 17th
day-salinity 11453.3 dS/m, 18th day-salinity 12317.7 dS/m, 19th day-salinity 11453.3 dS/m,
20th day-salinity 12533.8 dS/m. The missing values in the Excel structure were replaced
through approximation procedures, by interpolation methods. Having discussed the detail
procedure about data collection methodology for Passur-Mongla River, the same method of
data collection is adopted for the rest of the 12 rivers, namely, Baleswar-Bogi River,
Selagang-Harintana River, Sibsa-Nalianala River, Bal-Jhalia River, Passur-Passakhali River,
Betmargang-Kathka River, Chunnar-Munchiganj River, Kholpetua-Kobadak River, Notabaki
khal-Notabaki River, Arpongasia-Deboki River, Nilkamal-Hironpoint River and Malancha-
Mandarbaria River. A summary of the detail information about data collection procedure of 13
rivers can be found in Table 4.1. Figure 4.2, 4.3 and 4.4 shows the variation of the water
salinities of the data collected from the 13 rivers found in the Sundarbans rivers.
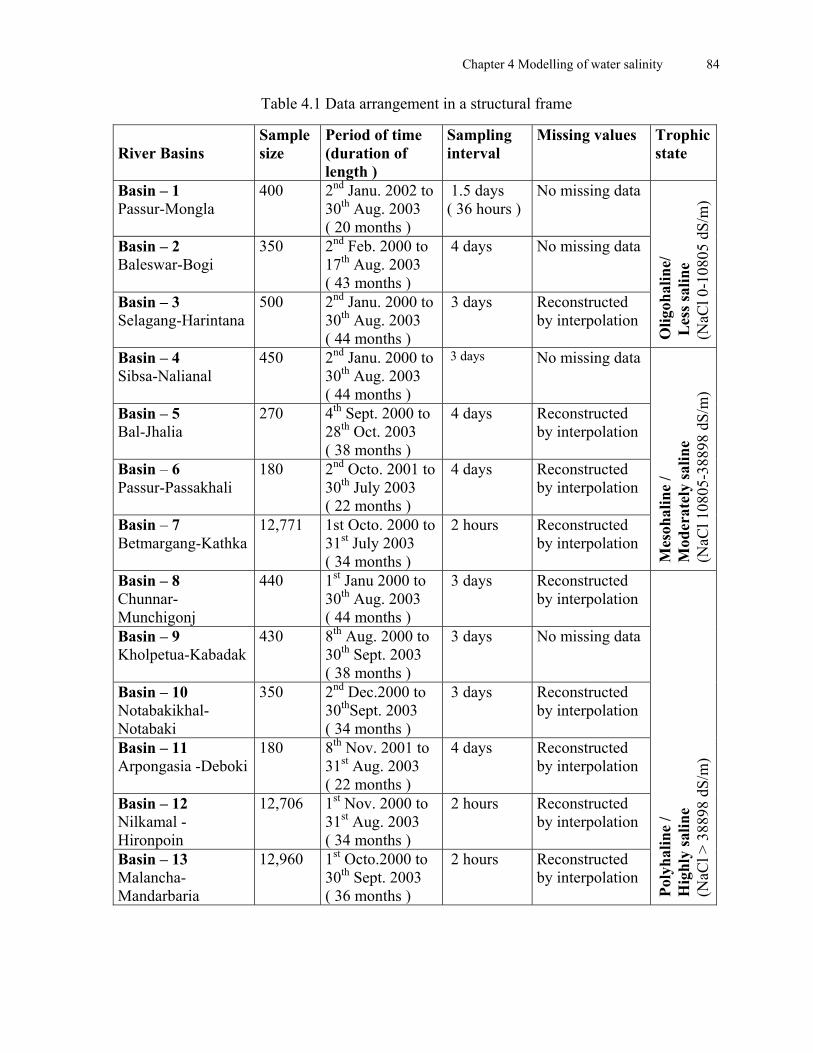
Chapter 4 Modelling of water salinity 84
Table 4.1 Data arrangement in a structural frame
Sample Period of time (duration of length )
Sampling interval
Missing values Trophic state
River Basins size
Basin – 1 Passur-Mongla
400 2nd Janu. 2002 to 30
1.5 days No missing data th Aug. 2003
( 20 months ) ( 36 hours )
Basin – 2 Baleswar-Bogi
350 2nd Feb. 2000 to 17th Aug. 2003 ( 43 months )
4 days
No missing data
Basin – 3 Selagang-Harintana
500 2nd Janu. 2000 to 30th Aug. 2003 ( 44 months )
3 days
Reconstructed by interpolation
Olig
ohal
ine/
L
ess s
alin
e
(NaC
l 0-1
0805
dS/
m)
No missing data Basin – 4 Sibsa-Nalianal
450 2nd Janu. 2000 to 30
3 days th Aug. 2003
( 44 months ) Basin – 5 Bal-Jhalia
270
4th Sept. 2000 to 28th Oct. 2003 ( 38 months )
4 days
Reconstructed by interpolation
Basin – 6 Passur-Passakhali
180 2nd Octo. 2001 to 30th July 2003 ( 22 months )
4 days
Reconstructed by interpolation
Basin – 7 Betmargang-Kathka
12,771
1st Octo. 2000 to 31st July 2003 ( 34 months )
2 hours
Reconstructed by interpolation
Mes
ohal
ine
/ M
oder
atel
y sa
line
(N
aCl 1
0805
-388
98 d
S/m
)
Basin – 8 Chunnar-Munchigonj
440 1st Janu 2000 to 30
3 days Reconstructed by interpolation th Aug. 2003
( 44 months ) No missing data thBasin – 9 3 days 430 8 Aug. 2000 to
30Kholpetua-Kabadak th Sept. 2003 ( 38 months )
ndBasin – 10 350 2 Dec.2000 to 30
3 days Reconstructed by interpolation thNotabakikhal-
Notabaki Sept. 2003
( 34 months ) thBasin – 11 180 8 Nov. 2001 to
31 4 days Reconstructed
by interpolation Arpongasia -Deboki st Aug. 2003 ( 22 months )
Basin – 12 Nilkamal -Hironpoin
12,706
1st Nov. 2000 to 31st Aug. 2003 ( 34 months )
2 hours
Reconstructed by interpolation
Basin – 13 Malancha-Mandarbaria
12,960 1st Octo.2000 to 30th Sept. 2003 ( 36 months )
2 hours
Reconstructed by interpolation
Poly
halin
e /
Hig
hly
salin
e
(NaC
l > 3
8898
dS/
m)
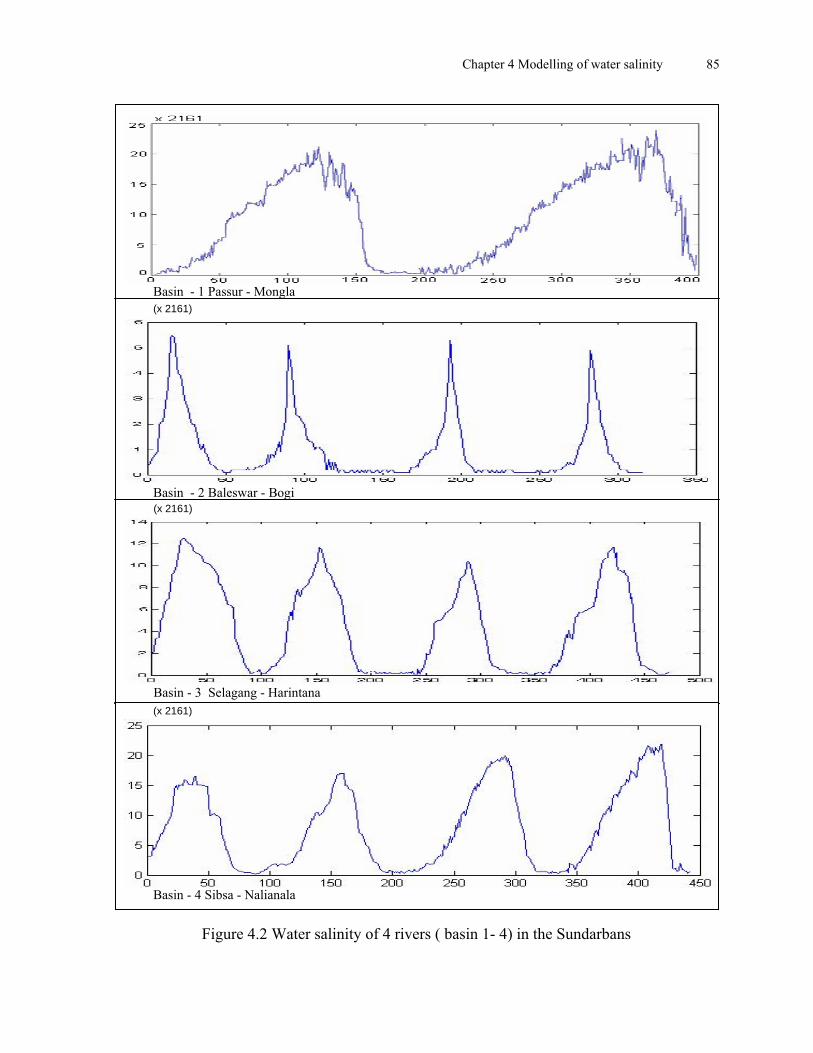
Chapter 4 Modelling of water salinity 85
(x 2161)
Basin - 2 Baleswar - Bogi (x 2161)
Basin - 3 Selagang - Harintana (x 2161)
Basin - 4 Sibsa - Nalianala
Basin - 1 Passur - Mongla
Figure 4.2 Water salinity of 4 rivers ( basin 1- 4) in the Sundarbans

Chapter 4 Modelling of water salinity 86
Basin - 5 Bal - Jhalia
Basin – 6 Passur - Passakhali
( x 2161)
( x 2161)
( x 2161)
( x 2161) Basin - 7 Betmargang - Kathka
Basin – 8 Chunnar - Munchiganj
Figure 4.3 Water salinity of 4 rivers (Basin 5 - 8) in the Sundarbans

Chapter 4 Modelling of water salinity 87
Basin - 10 Notabakikhal - Notabaki
Basin - 11 Arpongasia - Deboki
Basin - 12 Nilkomal - Hironpoint
Basin -13 Malancha - Mandarbaria
Basin - 9 Kholpetua - Kobadak
( x 2161)
( x 2161)
( x 2161)
( x 2161)
( x 2161)
Figure 4.4 Water salinity of 5 rivers (Basin 9 -13) in the Sundarbans
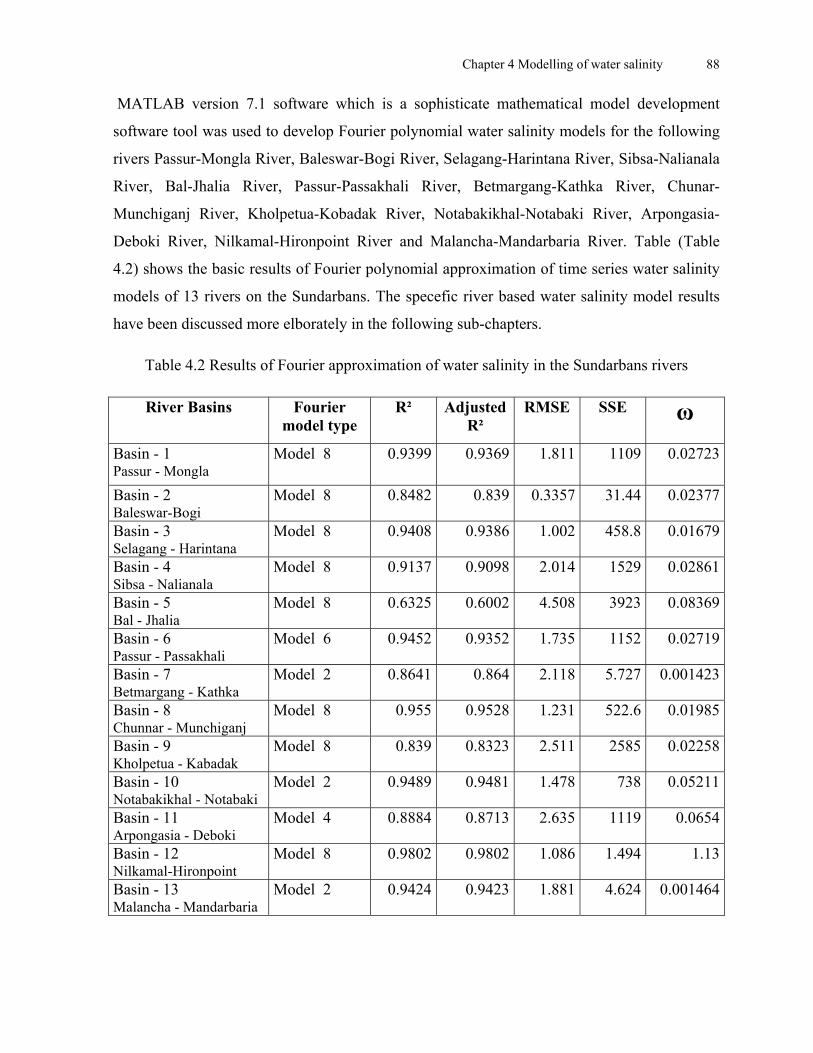
Chapter 4 Modelling of water salinity 88
MATLAB version 7.1 software which is a sophisticate mathematical model development
software tool was used to develop Fourier polynomial water salinity models for the following
rivers Passur-Mongla River, Baleswar-Bogi River, Selagang-Harintana River, Sibsa-Nalianala
River, Bal-Jhalia River, Passur-Passakhali River, Betmargang-Kathka River, Chunar-
Munchiganj River, Kholpetua-Kobadak River, Notabakikhal-Notabaki River, Arpongasia-
Deboki River, Nilkamal-Hironpoint River and Malancha-Mandarbaria River. Table (Table
4.2) shows the basic results of Fourier polynomial approximation of time series water salinity
models of 13 rivers on the Sundarbans. The specefic river based water salinity model results
have been discussed more elborately in the following sub-chapters.
Table 4.2 Results of Fourier approximation of water salinity in the Sundarbans rivers
ω River Basins Fourier model type
R² Adjusted RMSE SSE R²
Basin - 1 Model 8 0.9399 0.9369 1.811 1109 0.02723Passur - Mongla
Basin - 2 Model 8 0.8482 0.839 0.3357 31.44 0.02377Baleswar-Bogi Basin - 3 Model 8 0.9408 0.9386 1.002 458.8 0.01679Selagang - Harintana Basin - 4 Model 8 0.9137 0.9098 2.014 1529 0.02861Sibsa - Nalianala Basin - 5 Model 8 0.6325 0.6002 4.508 3923 0.08369Bal - Jhalia Basin - 6 Model 6 0.9452 0.9352 1.735 1152 0.02719Passur - Passakhali Basin - 7 Model 2 0.8641 0.864 2.118 5.727 0.001423Betmargang - Kathka Basin - 8 Model 8 0.955 0.9528 1.231 522.6 0.01985Chunnar - Munchiganj Basin - 9 Model 8 0.839 0.8323 2.511 2585 0.02258Kholpetua - Kabadak Basin - 10 Model 2 0.9489 0.9481 1.478 738 0.05211Notabakikhal - Notabaki Basin - 11 Model 4 0.8884 0.8713 2.635 1119 0.0654Arpongasia - Deboki Basin - 12 Model 8 0.9802 0.9802 1.086 1.494 1.13Nilkamal-Hironpoint Basin - 13 Model 2 0.9424 0.9423 1.881 4.624 0.001464Malancha - Mandarbaria

Chapter 4 Modelling of water salinity 89
4.4 Result of water salinity modelling of the Sundarbans rivers The ecological state of mangrove wetland ecosystem is the result of the complex interaction
between physical, chemical and biological components or processes. To investigate the water
salinity (NaCl) approximation in the Sundarbans rivers the Fourier polynomial approach has
been used to recognised and monitors the salinity increasing trends. The collected data of 13
potential rivers of the Sundarbans was analysed usinging the Fourier polynomial approach.
The time series data of the 13 rivers show the different type of salinity trends. As a whole, al
most all the rivers of the Sundarbans region are carrying the increases rate of water and soil
salinity in the case study area. Water salinity (NaCl) modelling was done using Fourier
polynomial method (where MATLAB software) as a sopesticative tool for the development of
water salinity modelling. The selected 13 rivers choosed for water salinity modelling on
Passur-Mongla River, Baleswar-Bogi River, Selagang-Harintana River, Sibsa-Nalianala River,
Bal-Jhalia River, Passur-Passakhali River, Betmargang-Kathka River, Chunnar-Munchiganj
River, Kholpetua-Kobadak River, Notabakikhal-Notabaki River, Arpongasia-Deboki River,
Nilkamal-Hironpoint River and Malancha-Mandarbaria River.
The result of water salinity approximation of 13 rivers showed increaging trends of salinity in
the whole Sundarbans mangrove wetlands. This is the major issue for ecosystems protection in
the Sundarbans. As a whole, water and soil salinity trends in the Sundarbans show the rapid
increasing behaviour. The eastern part of the Sundarbans getting moderate saline, and the
middle part is losing its moderate saline behaviour and becoming high saline zone.The
increase in salinity in the northern area could be attributed to capillary upwards movement of
solable salt, which is strong threats for agricultural cropping system and drinking water for the
local community. The results of the water salinity models of 13 rivers in the Sundarbans were
analysed separately and more elaborately in the following sub-chapters.
4.4.1 Water salinity modelling of Passur - Mongla River The Passur-Mongla River is one of the biggest and important rivers in the Sundarbans region.
It is the largest fresh water supplier into the Sundarbans. The Gorai River is one of the
tributary of the Ganges is connected with Passur River. The largers rivers like Passur and
Sibsa have sandy beds and mud banks along the shore whereas the tidal creeks tend to be
choked with very fine sediment. In the tidal rivers, suspended sediments are mainly composed

Chapter 4 Modelling of water salinity 90
of silt and clay. In the Sibsa River, the sizes of suspended sediments are finer than that of the
Passur River. The sediments at Kabadak and Bhairab are very fine and sediment concentration
is also very low, less than 21610 dS/m, even in the monsoon, while the sediment concentration
along the Nabganga, Rupsha and Passur Rivers, range from 32415 dS/m to 43220 dS/m during
the monsoon. During the dry season the suspended sediment does not vary significantly and
concentration at Bardia is less than at Khulna and Mongla. In the dry season sediment
concentration in the Passur River varies from 1080.5 dS/m to 21610 dS/m. The grain sizes in
the Passur systems are coarser than in the Kabadak-Malancha sub systems. Therefore it is
clear that the Passur River is carries huge volume of fresh water from upstream to the
Sundarbans. When water velocity is much higher under this condition it can carry out coarser
gain sizes of sediments.
The collected data of Passur-Mongla River was analysed using the Fourier polynomial
method. The Fourier Polynomial has given the following 1 to 8 orders of models and out of
these 8th orders one can be considered as the best approximation of water salinity.
Models R-square Error Model 1 0.8361 2.931 Model 2 0.894 2.363 Model 3 0.9248 1.996 Model 4 0.9301 1.931 Model 5 0.9354 1.861 Model 6 0.9375 1.836 Model 7 0.9383 1.829 Model 8 0.9399 1.811
All the Fourier models were developed and checked one after another. The Fourier model 8 is
showing the best approximation considering the goodness of fits, the highest r-square value is
0.9399 and lowest error value is 1.811. In the model the graph shows the best condition of
goodness of fit in Fourier order 8. The Fourier polynomial approximation 8th order is given by
the following equation;
f(x) = a0 + a *cos (x*ω) + b1 1*sin (x*ω) + a2*cos (2*x*ω) + b *sin (2*x*ω) + a2 3*cos (3*x*ω) + b3*sin (3*x*ω) + a4*cos (4*x*ω) + b *sin (4*x*ω) + a4 5*cos (5*x*ω) +b *sin 5 (5*x*ω) + a6*cos (6*x*ω) + b *sin (6*x*ω) + a6 7*cos (7*x*ω) + b *sin (7*x*ω) + 7 a8*cos (8*x*ω) + b *sin (8*x*ω) 8

Chapter 4 Modelling of water salinity 91
Coefficients (with 95 % confidence bounds):
Wat
er S
alin
ity (x
216
1[dS
/m])
Thresholdline
Time (X 1.5 d) Samples
95 % Confidence Value 95 % Confidence Value Coefficients Value Coefficients Value Lower Upper Lower Upper
a 8.171 7.965 8.377 b 3.051 2.623 3.478 0 1
a -9.058 2.623 -8.754 b 0.5036 0.1421 0.865 1 2
a 2.519 2.227 2.811 b -1.696 -1.973 -1.419 2 3
a -0.1494 -0.5027 0.204 b 0.4909 0.1849 0.797 3 4
a -0.5579 -0.8558 -0.26 b 0.4075 0.09572 0.7193 4 5
a 0.5586 0.2621 0.8551 b -0.4226 -0.698 0.0221 5 6
a -0.01796 -0.3328 0.2969 b 0.1422 -0.1556 0.4401 6 7
a -0.258 -0.5381 0.0221 b 0.1071 -0.1902 0.4045 7 8
a 0.4081 0.1296 0.6866 ω 0.02723 0.02707 0.02739 8
f (t) = 8.171 – 9.058 cos (0.02723 t) + 3.051 sin (0.02723 t) + 2.519 cos (0.05446 t) + 0.5036 sin (0.05446 t) – 0.1494 cos (0.08169 t) – 1.696 sin (0.08169 t) – 0.5579 cos (0.10892 t
) + 0.4909 sin (0.10892 t ) + 0.5586 cos ( 0.13615 t) + 0.4075 sin (0.13615 t) – 0.01796 cos (0.16338 t) – 0.4226 sin (0.16338 t) – 0.258 cos (0.19061 t) + 0.1422 sin (0.19061 t) + 0.4081 cos (0.21784 t ) + 0.1071 sin (0.21784 t)
Figure 4.5 Fourier approximation of water salinity of Passur-Mongla River
The Fourier approximation shown in Figure 4.5 and has produced an acceptable result. Several
external and internal environmental driving forces are responsible for this behaviour. The best
approximation was found by a Fourier polynomial of eight order, where r2 = 0.9399 and

Chapter 4 Modelling of water salinity 92
adjusted r2 = 0.9369, Sum Square Error (SSE) = 1109 and Root Mean Square Error (RMSE) =
1.811 and ω = 0.02723.
In time series data analysis, the Fourier polynomial model 8 shows the best approximation
where the polynomial graph indicate the highest salinity value in April is 45381 dS/m in 2002
and 51864 dS/m in April 2003. The difference of silinity increase between two years is 6483
dS/m. The highest salinity values normaly are identified in the dry season from February to
June when a small volume of upstream fresh water flows in the downstream areas. In the
graph the highest salinity values are in the marginal level of threshold value of 43220 dS/m.
The same methodology applied for Passur-Mongla River in developing the Fourier polynomial
models 1- 8 with MATLAB software was also applied for the other 12 rivers namely Baleswar
Bogi River, Selagang-Harintana River, Sibsa-Nalianala River, Bal-Jhalia River, Passur-
Passakhali River, Betmargang-Khatka River, Chunnar-Munchiganj River, Kholpetua-Kabadak
River, Notbakikhal-Notabaki River, Arpongasia-Deboki River, Nilkamal-Hironpoint River
and Malancha-Mandarbaria River.
4.4.2 Water salinity modelling of Baleswar - Bogi River
The surface water flow of the rivers of the Sundarbans mainly comes from the Ganges-Padma
through Gorai which splits from the Ganges 16 km downstream of the Hardinge Bridge. Gorai
then passes through Kustia and Faridpur districts and divides at Bardia in the Jessor district.
Some portion, almost 16 % of the flow of Gorai River meets the Haringhata-Baleswar estuary
system at Madhumati River and the other 85 % of the flow through to join the Passur estuary
at Nabaganga River. The Baleswar River is one of the biggest river in the Sundarbans region.
It flows in the eastern boarder of the Sundarbans mangrove forest. It is the boarder between
Sundarbans deltaic landscapes and the local settlements and agricultural fields. Baleswar River
has an influential role informing the eastern river subsystems in the Sundarbans region. The
area east of the Passur River and west of the Baleswar River represents this subsystem. The
Baleswar River receives water from the Gages-Madhumati and from the lower Meghna.
The rearranged data of the Baleswar-Bogi River was used to develop the Fourier polynomial
model. The Fourier Model-8 (Figure 4.6) is the most suitable and appropriate model for this
river. In the model the highest R-square value is 0.8482 and the lowest value of Root Mean

Chapter 4 Modelling of water salinity 93
Square Error is RMSE = 0.3357, Sum Square Error-SSE = 31.44, and ω = 0.02377. The
Fourier polynomial approximation of 8th order is given by the following equation;
f(t) = 0.7354 + 0.04717 cos (0.02377 t) + 0.2023 sin (0.2377 t) – 0.1584 cos (0.4754 t) + 0.05841 sin (0.4754 t) + 0.46 cos (0.7131 t) + 0.7545 sin (0.7131 t) – 0.157 cos (0.9508 t) + 0.2484 sin ( 0.9508 t) – 0.2806 cos (1.1885 t) – 0.1866 sin (1.1885 t) – 0.2197 cos (1.4262 t) + 0.2344 sin (1.4262 t) – 0.164 cos (1.6639 t) + 0.05642 sin (1.6639 t) + 0.008994 cos (1.9016 t) – 0.2473 sin (1.9016 t)
Wat
er S
alin
ity (x
216
1[dS
/m])
Time (X 4 d) Samples
Salinity range is far from Threshold line
Figure 4. 6 Fourier approximation of water salinity of Baleswar-Bogi River The Goodness of fit of Fourier polynomial model 8 (Figure 4.6) is, where r2 = 0. 8482 and
adjusted r2 = 0.839, Sum Square Error-SSE = 31.44 and root mean square error-RMSE =
0.3357. Water salinity modelling for the river Baleswar-Bogi with Fourier polynomial model-
8 was obsered to be the appropriate modeln for this river. In this model the graph is shows the
dry season (February-June) with the highest salinity value of 11885.5 dS/m in 2000, 10805
dS/m in 2001, 10805 dS/m in 2002 and 10372.8 dS/m in 2003. The 4 years salinity model
show the decreasing a rate from 2000 to 2003.
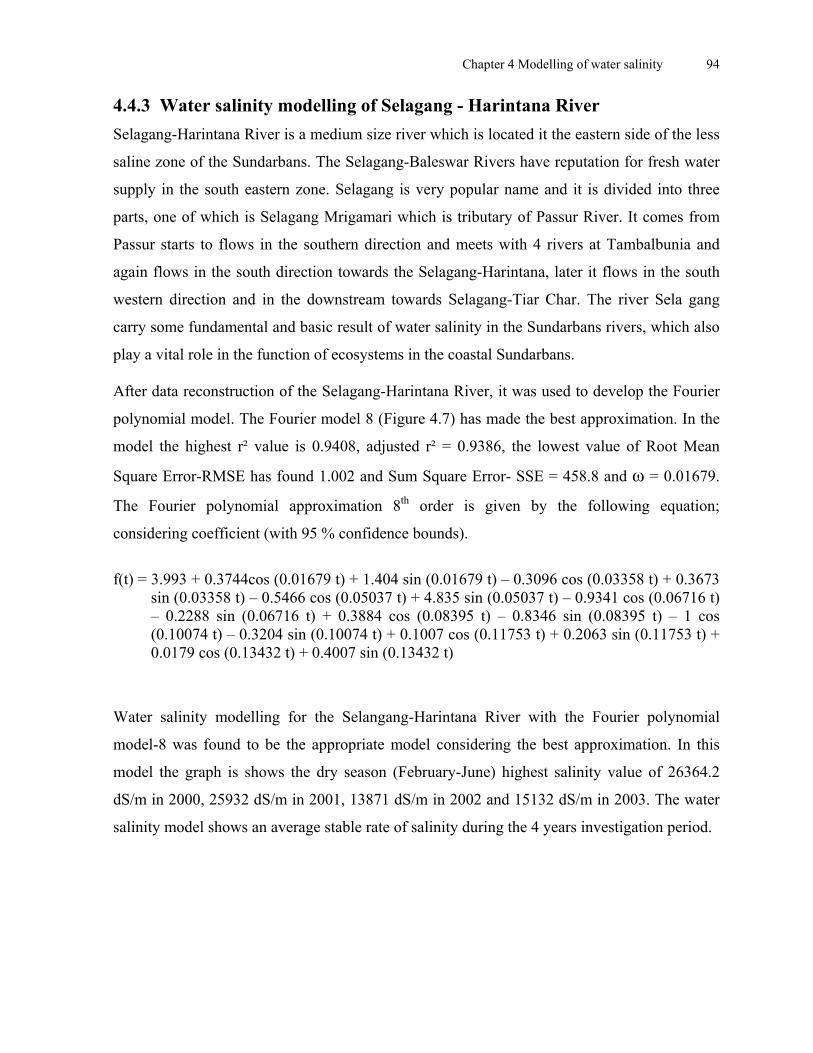
Chapter 4 Modelling of water salinity 94
4.4.3 Water salinity modelling of Selagang - Harintana River
Selagang-Harintana River is a medium size river which is located it the eastern side of the less
saline zone of the Sundarbans. The Selagang-Baleswar Rivers have reputation for fresh water
supply in the south eastern zone. Selagang is very popular name and it is divided into three
parts, one of which is Selagang Mrigamari which is tributary of Passur River. It comes from
Passur starts to flows in the southern direction and meets with 4 rivers at Tambalbunia and
again flows in the south direction towards the Selagang-Harintana, later it flows in the south
western direction and in the downstream towards Selagang-Tiar Char. The river Sela gang
carry some fundamental and basic result of water salinity in the Sundarbans rivers, which also
play a vital role in the function of ecosystems in the coastal Sundarbans.
After data reconstruction of the Selagang-Harintana River, it was used to develop the Fourier
polynomial model. The Fourier model 8 (Figure 4.7) has made the best approximation. In the
model the highest r² value is 0.9408, adjusted r² = 0.9386, the lowest value of Root Mean
Square Error-RMSE has found 1.002 and Sum Square Error- SSE = 458.8 and ω = 0.01679.
The Fourier polynomial approximation 8th order is given by the following equation;
considering coefficient (with 95 % confidence bounds).
f(t) = 3.993 + 0.3744cos (0.01679 t) + 1.404 sin (0.01679 t) – 0.3096 cos (0.03358 t) + 0.3673
sin (0.03358 t) – 0.5466 cos (0.05037 t) + 4.835 sin (0.05037 t) – 0.9341 cos (0.06716 t) – 0.2288 sin (0.06716 t) + 0.3884 cos (0.08395 t) – 0.8346 sin (0.08395 t) – 1 cos (0.10074 t) – 0.3204 sin (0.10074 t) + 0.1007 cos (0.11753 t) + 0.2063 sin (0.11753 t) + 0.0179 cos (0.13432 t) + 0.4007 sin (0.13432 t)
Water salinity modelling for the Selangang-Harintana River with the Fourier polynomial
model-8 was found to be the appropriate model considering the best approximation. In this
model the graph is shows the dry season (February-June) highest salinity value of 26364.2
dS/m in 2000, 25932 dS/m in 2001, 13871 dS/m in 2002 and 15132 dS/m in 2003. The water
salinity model shows an average stable rate of salinity during the 4 years investigation period.

Chapter 4 Modelling of water salinity 95
Samples
Salinity range is far from Threshold line
ds/m
])[
x 21
61(
y W
ater
Sal
init
Time (X 3 d) Figure 4.7 Fourier approximation of water salinity of Selagang-Harintana River
The highest salinity value is under the threashold line which is not harmful for plants growth
and ecosystems.
4.4.4 Water salinity modelling of Sibsa - Nalianala River
Sibsa River is the second largest river in the Sundarbans region and it plays a vital role in
communication and carrying fresh water from the upstream catchment. The Sibsa River is
carry large volume of fresh water from the upstream Ganges and from other local sub-
catchments and also from the important point where the fresh water and sea water mix
together thereby balancing the coastal mangrove ecosystems. This is why this river water is
moderate saline than other parts of river water salinity. The Passur is placed after the Meghna
in size in the deltaic region. The river is joined with Mongla canal at about 32 km south of
Chalna. Flowing further south, the river meets the Sibsa at about 32 km north of its mouth and
debauches into the sea keeping its original name Passur. The river is very deep and navigable
throughout the year and large marine ships can easily enter Mongla Sea Port through it. The

Chapter 4 Modelling of water salinity 96
Passur is an important river route through which Khulna-Barisal steamboats and other vessels
ply. The river is about 460m wide at Rupsa, about 790m at Bajuyan and about 2.44 km at the
confluence of the Passur-Sibsa. The total length of the river is about 142 km. The Passur and
all its distributaries are tidal channels. The Passur bifurcates into two at Mongla and the
western branch flows through the Sundarbans as Sibsa River. The Sibsa has been renamed as
the Kunga River near the estuary before joining the Bay of Bengal. Hiron Point is on the right-
bank of the Sibsa-Kunga. The total length of the river is about 100 km. The river crosses about
27 km through Paikgachha upazila and the rest of the course demarcates the common
boundary between Paikgachha and Dacope upazilas. Inside the Sundarbans, the Sibsa meets
with the Passur and receives various rivulets and khals from various directions, enriching its
flow. Among them the Barulia, Haria, Bunakhali, Garkhali, Mainas, Taki, Besekhali,
Badurgachha, Bhelti, Karua Gamrail, Hadda and Nali Jalla are notable. The river experiences
regular tides. Its water is saline throughout the year but at the high rate in the dry season and
high salinity goes down in the rainy season of the year.
The reconstructed data was used to develop the Fourier polynomial model. The Fourier Model
8 (Figure 4.8) was considered as appropriate model. The Goodness of fit of the model, where
the highest r² = 0.9137 and the lowest value of RMSE = 2.014, adjusted r² = 0.9098, Sum
Square Error-SSE = 1529 and ω = 0.02861. The Fourier polynomial approximation of 8th
order is given by the following equation; considering coefficients (with 95 % confidence
bounds).
f(t) = 7.006 – 0.6134 cos (0.02861 t) + 0.08996 sin (0.02861 t) – 2.9 cos (0.05722 t) + 7.997 sin (0.05722 t) – 0.03639 cos (0.08583 t) – 0.6724 sin (0.08583 t) – 0.7276 cos (0.11444 t) – 2.368 sin (0.08583 t) – 0.2382 cos (0.14305 t) + 0.5227 sin (0.14305 t) + 0.221 cos (0.17166 t) + 0.9901 sin (0.17166 t) + 0.08443 cos (0.20027 t) – 0.7531 sin (0.20027 t) – 0.2139 cos (0.22888 t) – 0.62 sin (0.22888 t) The Fourier polynomial model 8 was fit for the Sibsa-Nalianala River as an appropriate model
considering the best approximation. In this model the graph is shows the dry season
(February-June) highest salinity value 34576 dS/m in 2000, 36737dS/m in 2001, 43220 dS/m
in 2002 and 47542 dS/m in 2003. The Fourier polynomial model shows the yearly increasing
behaviour of water salinity in the Sibsa-Nalianala River. The first two years behaviour in
increasing slowly, during 3rd th and 4 years increasing rate is much faster than previous years.
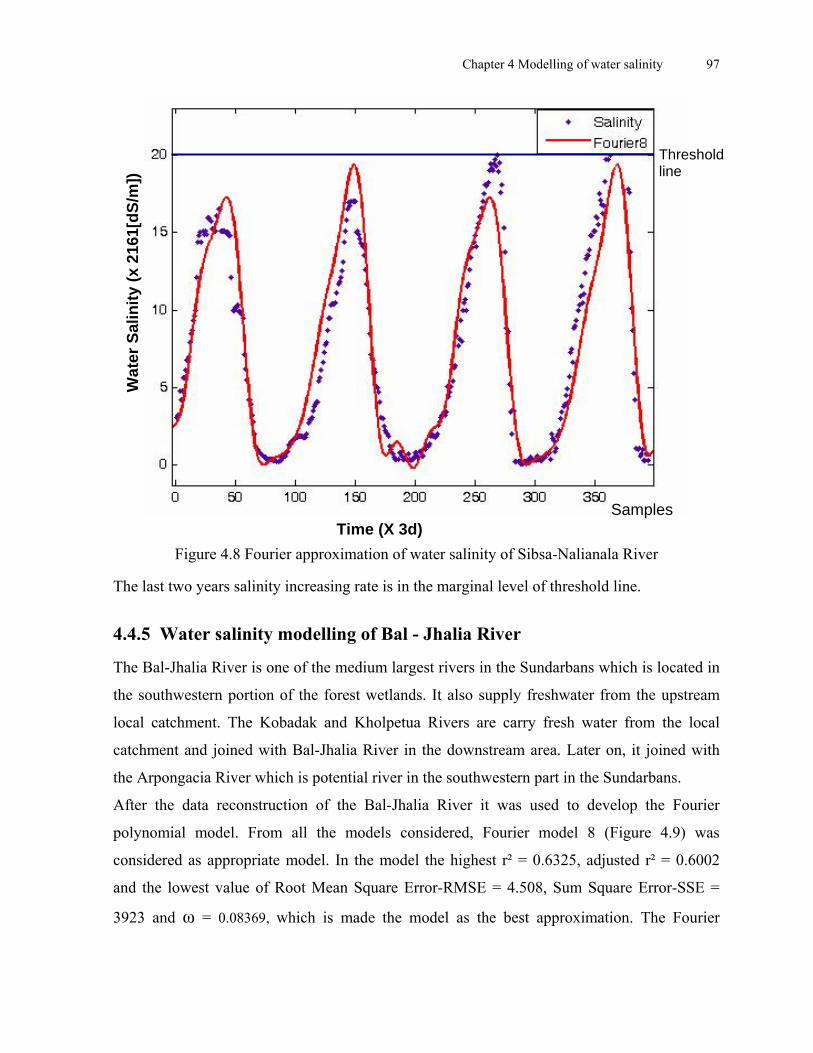
Chapter 4 Modelling of water salinity 97
Figure 4.8 Fourier approximation of water salinity of Sibsa-Nalianala River
The last two years salinity increasing rate is in the marginal level of threshold line.
4.4.5 Water salinity modelling of Bal - Jhalia River
The Bal-Jhalia River is one of the medium largest rivers in the Sundarbans which is located in
the southwestern portion of the forest wetlands. It also supply freshwater from the upstream
local catchment. The Kobadak and Kholpetua Rivers are carry fresh water from the local
catchment and joined with Bal-Jhalia River in the downstream area. Later on, it joined with
the Arpongacia River which is potential river in the southwestern part in the Sundarbans.
After the data reconstruction of the Bal-Jhalia River it was used to develop the Fourier
polynomial model. From all the models considered, Fourier model 8 (Figure 4.9) was
considered as appropriate model. In the model the highest r² = 0.6325, adjusted r² = 0.6002
and the lowest value of Root Mean Square Error-RMSE = 4.508, Sum Square Error-SSE =
3923 and ω = 0.08369, which is made the model as the best approximation. The Fourier
Wat
er S
alin
ity (x
216
1[dS
/m])
Time (X 3d)
Threshold line
Samples

Chapter 4 Modelling of water salinity 98
thpolynomial approximation of 8 order is given by the following equation. Considering
coefficients (with 95% confidence bounds):
f(t) = 16 –1.293 cos (0.08369 t) + 7.477 sin (0.08369 t) + 1.18 cos (0.16738 t) – 0.9296 sin (0.16738 t) – 0.1423 cos (0.25107 t) –1.014 sin (0.25107 t) – 0.2036 cos (0.33476 t) – 0.6092 sin (0.33476 t) + 0.3222 cos (0.41845 t) – 0.3107 sin (0.41845 t) + 0.1287 cos (0.50214 t) – 0.4723 sin (0.50214 t) + 0.09246 cos (0.58582 t) – 0.3357 sin (0.58583 t) + 0.4067 cos (0.6695 t) – 0.2137 sin (0.66952 t)
Wat
er S
alin
ity (x
216
1[dS
/m])
Time (X 4 d)
Threshold line
Samples
Figure 4.9 Fourier approximation of water salinity of Bal-Jhalia River
The Fourier polynomial model 8 (Figure 4.9) was fit for the Bal-Jhalia River as an appropriate
model considering the best approximation. In this model the graph is shows the dry season
(February-June) as the highest salinity value of 56186 dS/m in 2001, 57266.5 dS/m in 2002
and 60508 dS/m in 2003. The Fourier polynomial model shows the increasing rate of water
salinity in the Bal-Jhalia River which is higher than the salinity threshold value.
4.4.6 Water salinity modelling of Passur - Passakhali River
Sibsa River and Passur River joined the downstream of the Sundarbans reserve forest at
Passakhali location. The place where three rivers meet is called Passur-Passakhali River, and it

Chapter 4 Modelling of water salinity 99
converges with the Bay of Bengal. The tidal saltwaters mix with the upstream fresh water and
eventually they enter at different part of the Sundarbans part of the wetlands. It is also a large
estuary in the south portion of the Sundarbans.
After the data reconstruction and rearrangement of the Passur-Passakhali River, it was used to
develop the Fourier polynomial model. Fourier model 6 (Figure 4.10) was considered as
appropriate model for river Passur-Passakhali. In the model the highest r² = 0.9452, adjusted r²
= 0.9352, Sum Square Error-SSE = 1152 and the lowest value of Root Mean Square Error-
RMSE was found 1.735 and ω = 0.02719, which made the model as the best approximation.
Fourier polynomial approximation 6th order is given by the following equation; considering
coefficients (with 95% confidence bounds):
f(t) = 8.175 – 8.997 cos (0.02719 t) + 3.081 sin (0.02719 t) + 2.53 cos (0.05438 t) + sin (0.05438 t) – 0.2594 cos (0.08157 t) – 1.719 sin (0.08157 t) – 0.5761 cos (0.10876 t) + 0.5885 sin (0.10876 t) + 0.6313 cos (0.13595 t) +0.4526 sin (0.13595 t) + 0.0654 cos (0.16314 t) – 0.4682 sin (0.16314 t)
Wat
er S
alin
ity (x
216
1[dS
/m])
Time (X 4 d) Samples
Thresholdline
Figure 4.10 Fourier approximation of water salinity of Passur-Passakhali River

Chapter 4 Modelling of water salinity 100
The Fourier polynomial model 6 was fit for the Passur-Passakhali River as appropriate model
considering the best approximation. The graph shows that, the dry season (February-June) was
the highest salinity of 43220 dS/m in 2002, 60508 dS/m in 2003. The Fourier polynomial
model shows the yearly salinity increasing rate which is in the marginal level.
4.4.7 Water salinity modelling of Betmergang - Kathka River The Bethmargang-Kathka River is made of two seperate rivers in the southeastern corner of
the Sundarbans forest. The Kathka region is important area in the forest, it is also wildlife
sanctuary which is called Sundarbans east sanctuary and the total area is 192 km². It is also
popular wildlife sanctuary for the tourist attraction. All these avtivities includes the economic
and environmental importance of the sanctuary consideration. The Betmargang and Khathka
canal is play a vital role in communication and carrying fresh water from the Baleswar River
and also from other connected rivers such as Selagang, Tambalbunia and Nandabala. The
Baleswar River is carrys high volume of fresh water from the upstream Ganges and from other
local subcatchments. The Bethmargang is the important point where the fresh water and the
sea water mixing and balancing the coastal mangrove ecosystems. This is why this river water
has very less saline compare to other rivers. In general the river water salinity is lower but in
the dry season increase a little.
After the data reconstruction and rearrangement of the Betmargang-Kathka River it was used
to develop the Fourier polynomial models. The Fourier model 2 (Figure 4.11) was considered
as appropriate model for this river. The figure 4.11 shows the salinity increasing behaviour
which has been adjusted with the Fourier polynomial model 2nd order. In the model the
goodness of fit which is the highest r² = 0.8641, adjusted r² = 0.864 and the lowest value of
Root Mean Square Error-RMSE = 2.118, Sum Square Error–SSE value is 5.727, and ω =
0.001423, which made the model as the best approximation. The Fourier polynomial
approximation 2nd order is given by the following equation. Considering coefficients (with
95% confidence bounds):
f (t) = 9.364 – 7.662 cos (0.001423 t) – 0.2799 sin (0.001423 t) – 0.1035 cos (0.002846 t) + 0.479 sin (0.002846 t)

Chapter 4 Modelling of water salinity 101
The Fourier polynomial model 2 was the best appropriate model for the Betmargang-Kathka
River, where model is considering as the best approximation.
Wat
er S
alin
ity (x
216
1[dS
/m])
Threshold Line
Time (x 2 h) Samples
Figure 4.11 Fourier approximation of water salinity of Betmargang -Kathka River
In this model the graph (Figure 4.11) shows the dry season (February-June) scenarios with the
heighest salinity value which is 51864 dS/m in 2001, 43220 dS/m in 2002 and 49703 dS/m in
2003. The Fourier polynomial graph shows the yearly salinity fracturing behaviour which is
totally depending on the availability of fresh water supply in the river basin area of the
Sundarbans.
4.4.8 Water salinity modelling of Chunar - Munchiganj River
The Chunar-Munchiganj River is one of the smaller but important rivers in the southwestern
part of Bangladesh especially in the northern boundary of the Sundarbans. The Chunar-
Munchiganj River is serving as a boundary between the Sundarbans mangrove wetlands and
the northern settlements areas of the Indian boarder towards Munchiganj town. The river is
important for local communication and a fertile water shade for shrimp prawn collection. The

Chapter 4 Modelling of water salinity 102
river connected with Kanksially River and Kalindi River which is one of the transboundary
rivers in the Sundarbans forest area. After the Chunar-Munchiganj River enters the
Sundarbans, it is renamed as Malancha and it joins with Ichamati River when it enters into the
Sundarbans. The upstream fresh water from the local catchment is flows into the Chunar-
Munchiganj River. But recently the situation changed there is no enough fresh water from the
upstream, whereas the Chunar-Munchiganj Rriver’s water is used in the shrimpfield, in the
northern boundary of the Sundarbans. For various reason water and soil salinity has been
drastically increased in the Chunar- Munchiganj basin area. The salinity rate is increasing
gradually.
After the data reconstruction and rearrangement of the Chunar-Munchgnj River it was used to
develop the Fourier polynomial models. The Fourier model 8 (Figure 4.12) was considered as
appropriate model for this river. In the model the highest r² = 0.955, adjusted r² = 0.9528 and
the lowest value of Root Mean Square Error-RMSE = 1.231 and ω = 0.01985, which has
made the model as the best approximation.The Fourier polynomial approximation 8th order is
given by the following equation ; considering coefficients (with 95% confidence bounds):
f(t) = 13.59 + 2.099 cos (0.01985 t) + 0.82 sin (0.01985 t) – 0.7342 cos (0.0397 t) – 0.2323 sin (0.0397 t) – 2.657 cos ( 0.05955 t) + 6.032 sin (0.05955 t) – 1.318 Cos (0.0794 t) + 1.013 sin (0.0794 t) + 0.732 cos (0.09925 t) – 0.4589 sin (0.09925 t) – 0.4179 cos ( 0.1191 t) – 1.682 sin (0.1191 t) + 0.8124 cos (0.13895 t) – 0.2593 sin (0.13895 t) – 0.09655 cos (0.1588 t) + 0.5521 sin (0.1588 t)
The Fourier polynomial model-8 was fit in the Chunar-Munchiganj River as appropriate
model considering the best approximation. The figure 4.12 shows the Fourier polynomial
model order 8th where the water salinity cyclic behaviour has been seen. In this model the
graph shows the dry season (February-June) average highest salinity value which is 54025
dS/m in 2000, 49703 dS/m in 2001 and 54025 dS/m in 2002 and 56186 dS/m in 2003. The
time serioes consideration of the water salinity intrusion of Chunar-Munchiganj River is a
cyclic increasing behaviour. This is indicating the future increasing trend of water salinity in
this river in the Munchiganj region.
Chapter 4 Modelling of water salinity 103
Wat
er S
alin
ity (x
216
1[dS
/m])
Time Samples
Threshold line
(x 3 d)
Figure 4.12 Fourier approximation of water salinity of Chunar-Munchiganj River
The Fourier polynomial model graph shows the yearly salinity increasing behaviour, after
2000 the salinity rate was 54025 dS/m, suddenly in thefollowing year, the rate decreased at
49703 dS/m and again 54025 dS/m in 2002. The reason was that in March-April of 2001 there
was early raining and some water flows from the local catchment.
4.4.9 Water salinity modelling of Kholpetua - Kobadak River
The kobadak and Kholpetua Rivers are the biggest rivers in the Sundarbans region. The
Kholpetua-Kobadak River plays an important role in supply of fresh water from upstream area
and from the local catchment. Kobadak and Kholpetua Rivers are connected with Arpongachia
and Bal River. The Bal-Jhalia and Arpongachia joins with Malancha River further
downstream. Arpongachia and Malancha are connected to Bhairab by Kobadak River and
used to receive some amount freshwater flow from the Ganges through the Gorai River. These
two rivers have a connecting role inside the Sundarbans and in the boundary area of the
Sundarbans. The basin area now is becoming important for shrimp cultivation and other

Chapter 4 Modelling of water salinity 104
mangrove resource related commercial activities. Surrounding this river catchment is the
agricultural lands, which is being converted into shrimp farms where as the high saline water
is also important issue to farmers and attract shrimp business people. It is very important for
shrimp farming and also it carrys fresh water into the south-west part of the Sundarbans for
balance the mangrove wetlands ecosystems.
After collected, checked and rearrangement of salinity data of the Kholpetua-Kobadak Rivers
was used to develop the Fourier polynomial models. The Fourier model 8 (Figure 4.13) was
considered as appropriate model for this river. In the model the highest r² value was 0.839,
adjusted r² value was 0.8323, Sum Square Error-SSE = 2585, the lowest value of Root Mean
Square Error-RMSE was 2.511 and ω = 0.02258. These impressive results made the model as
the best approximation. The Fourier polynomial approximation 8th order is given by the
following equation; considering coefficients (with 95 % confidence bounds).
f(t) = 13.43 – 0.04756 cos (0.02258 t) – 0.3776 sin (0.02258 t) – 2.958 cos (0.04516 t) – 7.35 sin (0.04516 t) – 0.844 cos (0.06774 t) – 0.05306 sin (0.06774 t) – 1.341 cos (0.09032 t) + 0.2829 sin (0.09032 t) – 0.03563 cos (0.1129 t) + 0.5077 sin (0.1129 t) + 0.1307 cos (0.13548 t) + 0.5077 sin (0.13548 t) + 0.08059 cos (0.15806 t) – 0.1235 Sin (0.15806 t) + 0.2368 cos (0.18064 t) – 0.2988 sin (0.18064 t) The Fourier polynomial model 8 was fit for the Kholpetua-Kobadak River as appropriate
model consideration with best approximation. In this model the graph is shows the dry
season (February-June) gives the highest salinity value which is 38898 dS/m in 2001,
47542 dS/m in 2002 and 54025 dS/m in 2003. The time series data consideration of this
river the water salinity increasing behaviour is forcasting the future increasing trend of
water salinity in this reiver. The Fourier polynomial model of water salinity order 8th shows
the appropriate salinity situation of this river.
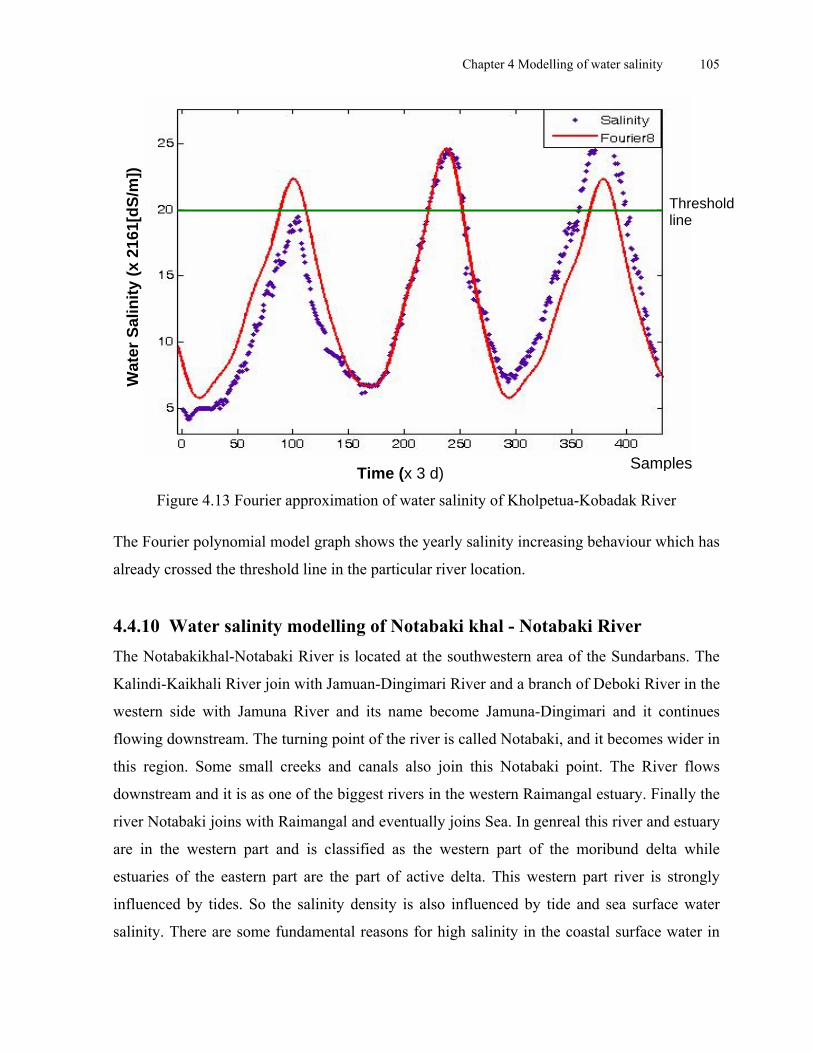
Chapter 4 Modelling of water salinity 105
Figure 4.13 Fourier approximation of water salinity of Kholpetua-Kobadak River
The Fourier polynomial model graph shows the yearly salinity increasing behaviour which has
already crossed the threshold line in the particular river location.
4.4.10 Water salinity modelling of Notabaki khal - Notabaki River The Notabakikhal-Notabaki River is located at the southwestern area of the Sundarbans. The
Kalindi-Kaikhali River join with Jamuan-Dingimari River and a branch of Deboki River in the
western side with Jamuna River and its name become Jamuna-Dingimari and it continues
flowing downstream. The turning point of the river is called Notabaki, and it becomes wider in
this region. Some small creeks and canals also join this Notabaki point. The River flows
downstream and it is as one of the biggest rivers in the western Raimangal estuary. Finally the
river Notabaki joins with Raimangal and eventually joins Sea. In genreal this river and estuary
are in the western part and is classified as the western part of the moribund delta while
estuaries of the eastern part are the part of active delta. This western part river is strongly
influenced by tides. So the salinity density is also influenced by tide and sea surface water
salinity. There are some fundamental reasons for high salinity in the coastal surface water in
Time (x 3 d)
Wat
er S
alin
ity (x
216
1[dS
/m])
Sam
Threshold line
ples

Chapter 4 Modelling of water salinity 106
the Bay of Bengal. So the water sample collection from this point is important and it will carry
some fundamental and basic result of water salinity in the Sundarbans rivers, which will play a
vital role in the function of ecosystems in the coastal Sundarbans.
After reconstruction and rearrangement of the data of the Notabakikhal-Notabaki River it was
used to develop the Fourier polynomial models. The Fourier model 2 (Figure 4.14) was
considered as appropriate model for this river. In the model the highest r² value is 0.9489,
adjusted r² value is 0.9481 and the lowest value of Root Mean Square Error-RMSE = 1.478,
Sum Square Error-SSE = 738 and ω = 0.05211 which made the model as the best
approximation. The Fourier polynomial approximation 2nd order is given by the following
equation; with consideration of coefficients (with 95% confidence bounds).
f(x) = 17.21 – 8.056 cos ( 0.5211t) + 4.008 sin(t 0.05211) +1.277 cos(t 0.10422) + 0.4013 sin (0.10422 t)
Time (x 3 d )
Thresholdline
Wat
er S
alin
ity (x
216
1[dS
/m])
Samples
Figure 4.14 Fourier approximation of water salinity of Notabakikhal-Notabaki River
The Fourier polynomial model 8 was fit (Figure 4.14) for water salinity model in the
Notabakikhal-Notabaki River as appropriate model, considering its best approximation. In this
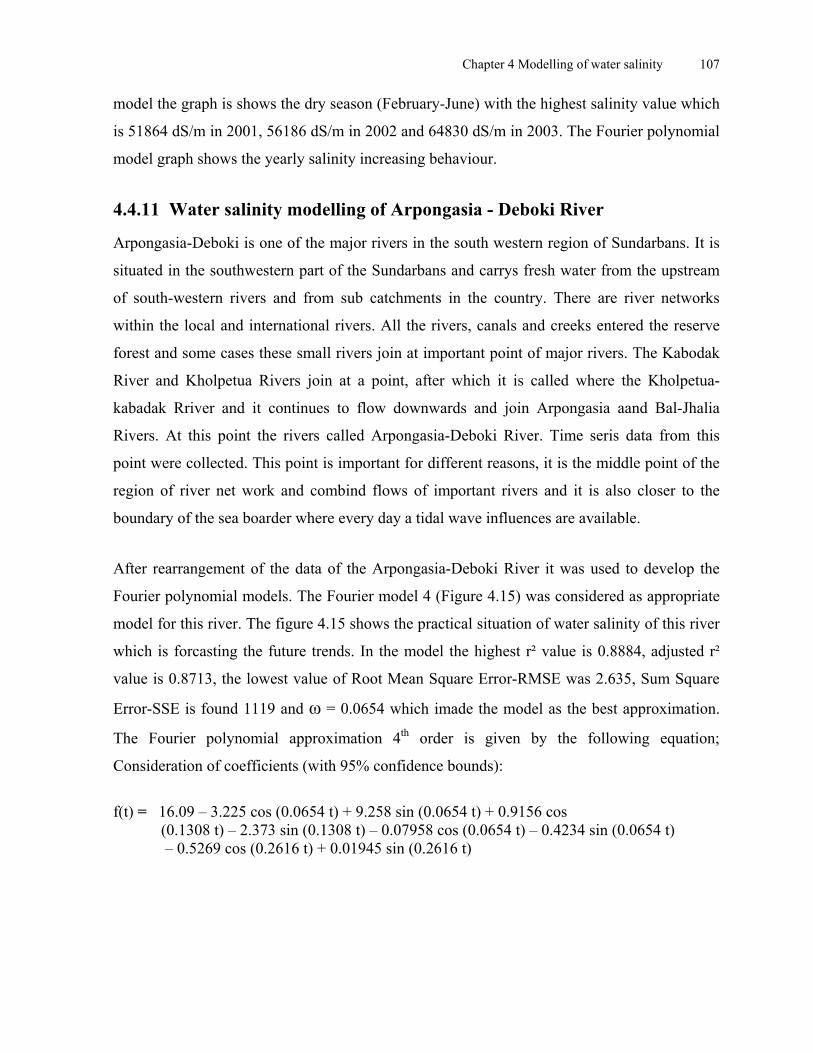
Chapter 4 Modelling of water salinity 107
model the graph is shows the dry season (February-June) with the highest salinity value which
is 51864 dS/m in 2001, 56186 dS/m in 2002 and 64830 dS/m in 2003. The Fourier polynomial
model graph shows the yearly salinity increasing behaviour. 4.4.11 Water salinity modelling of Arpongasia - Deboki River
Arpongasia-Deboki is one of the major rivers in the south western region of Sundarbans. It is
situated in the southwestern part of the Sundarbans and carrys fresh water from the upstream
of south-western rivers and from sub catchments in the country. There are river networks
within the local and international rivers. All the rivers, canals and creeks entered the reserve
forest and some cases these small rivers join at important point of major rivers. The Kabodak
River and Kholpetua Rivers join at a point, after which it is called where the Kholpetua-
kabadak Rriver and it continues to flow downwards and join Arpongasia aand Bal-Jhalia
Rivers. At this point the rivers called Arpongasia-Deboki River. Time seris data from this
point were collected. This point is important for different reasons, it is the middle point of the
region of river net work and combind flows of important rivers and it is also closer to the
boundary of the sea boarder where every day a tidal wave influences are available.
After rearrangement of the data of the Arpongasia-Deboki River it was used to develop the
Fourier polynomial models. The Fourier model 4 (Figure 4.15) was considered as appropriate
model for this river. The figure 4.15 shows the practical situation of water salinity of this river
which is forcasting the future trends. In the model the highest r² value is 0.8884, adjusted r²
value is 0.8713, the lowest value of Root Mean Square Error-RMSE was 2.635, Sum Square
Error-SSE is found 1119 and ω = 0.0654 which imade the model as the best approximation.
The Fourier polynomial approximation 4th order is given by the following equation;
Consideration of coefficients (with 95% confidence bounds):
f(t) = 16.09 – 3.225 cos (0.0654 t) + 9.258 sin (0.0654 t) + 0.9156 cos (0.1308 t) – 2.373 sin (0.1308 t) – 0.07958 cos (0.0654 t) – 0.4234 sin (0.0654 t) – 0.5269 cos (0.2616 t) + 0.01945 sin (0.2616 t)

Chapter 4 Modelling of water salinity 108
Figure 4.15 Fourier approximation of water salinity of Arpongasia-Deboki River
Fourier polynomial model 4 was developed using MATLAB version 7.1 software. The Fourier
polynomial model shows the river water salinity behaviur in the graph. The graph shows the
dry season salinity of 60508 dS/m in 2002 and 64830 dS/m in 2003. The Model shows the
salinity increasing behaviour in the Arpongasia-Deboki River. Both years dry season salinity
crossed the threshold line of water salinity in this river basin.
4.4.12 Water salinity modelling of Nilkamal - Hironpoint River
The biggest river in the Sundarbans by name Passur enters at Nilkamal-Hironpoint area and is
situated at the south of the Sundarbans where rivers and sea meet. Hironpoint is very
important spot for the Sundarbans and also for the whole region. From the upstream the two
majors’ rivers called Passur and Sibsa River the place called Passur Passakhali and the river
became a wide river here. At this area, the river name is Passur Passakhali. It is flowing upto
Hironpoint by name Passur that make it the wider river in the Sundarbans region. Actually it is
very difficult to recognise the length of the river before it joins the sea. At the mouth of Passur
River and this area, the river‘s width is 10 km to 20 km some time. The sea saline water are
enter from this point, all the ships from outside and from the deep sea are enter this point, the
Time (x 3 d)
Wat
er S
alin
ity (x
2161
[dS/
m])
Threshold line
Samples

Chapter 4 Modelling of water salinity 109
Hironpoint is the administrative point and office of the Mongla sea port. The salinity rate of
Nilkamal-Hironpoint River is normally higher than other region in Sundarbans. Salinity rate
also can be lower, depending on the fresh water carring capacity from upstream by the two
major rivers namely Passur and Sibsa.
The reconstructed data of the Nilkamal-Hironpoint River it was used to develop the Fourier
polynomial models. The Fourier model 8 (Figure 4.16) has considered as appropriate model
for this river. In the model the highest r² value is 0.9802, adjusted r² value is 0.9802, the
lowest value of Root Mean Square Error-RMSE = 1.086, Sum Square Error-SSE = 1.494 and
ω = 1.13 which made the model as the best approximation. The Fourier polynomial
approximation 8th order is given by the following equation; considering coefficients (with 95%
confidence bounds).
f(t) = – 263.2 + 519.5 cos (1.13 t) – 62.65 sin (1.13 t) – 426.9 cos (2.26 t) + 105.9 sin (2.26 t) + 304 cos (3.39 t) – 119.9 sin (3.39 t) – 181.8 cos (4.52 t) + 105.5 sin (4.52 t) + 102.8 cos (5.65 t) –77.47 sin (5.65 t) – 38.89 cos (6.78 t) + 44.74 sin (6.78 t) + 10.7 cos (7.91 t) – 20.79 sin (7.91 t) – 1.193 cos (9.04 t) + 6.423 sin (9.04 t)
Wat
er S
alin
ity (x
216
1[dS
/m])
Time (x 2h)
Threshold Line
Samples
Figure 4.16 Fourier approximation of water salinity of Nilkamal-Hironpoint River

Chapter 4 Modelling of water salinity 110
Fourier polynomial model 4 was developed using the MATLAB version 7.1 software. The
Fourier polynomial model shows the cycling water salinity behaviur. The graph shows the dry
season salinity, the average dry season water salinity is 56186 dS/m in 2001, 60508 dS/m in
2002 and 62669 dS/m in 2003. The Model shows the yearly cycling salinity increasing
behaviour in the Nilkamal-Hironpoint River basin it crossed the threshold line. The water of
Nilkamal river basin is harmful for mangrove ecosystems.
4.4.13 Water salinity modelling of Malancha - Mandarbaria River
The Malancha-Mandarbaria is the largest river interms of width in the southwestern corner in
the Sundarbans mangrove forest area. Before it enters the Sundarbans, the Malancha River
known as Chunar River it joins with Ischamoti River before it enters into the Sundarbans
forest near the Kodamtala station. From the eastern side of Kobadak River, it enters the
Sundarbans and rename as Arpongasia River in the downstream. Arpongasia River is later
connected with Bival River and rename as Bara Panga River, finally Bara Panga River is
connected to Malancha River. At this point, Mandarbaria and Malancha became large in
width, in the south and finally it is connected with Bay of Bengal. Mandarbaria is the last land
before Bey of Bengal. Hariabhanga River is located just after the west corner of Mandarbaria
and it is an inter boundary river. Malancha is one of the largest estuaries in the south west of
the Sundarbans which is playing an important role in increasing the water salinity and balance
ecosystems in the coastal region. The salinity rate of Malancha-Mandarbaria River is normally
higher than other region in the Sundarbans. Salinity rate also can be lower depending on fresh
water carrying capacity from upstream local catchment. Saline water of Bay of Bengal enters
the Sundarbans through this river basin and channels. It is very important place for saline
water samples collection to realise the salinity situation in the whole Sundarbans region and
compare with other important places in the forest.
All the data was checked very carefully and after reconstruction and rearrangement of the data
of the Malancha-Mandarbaria River it was used for time series model. In the case of
Malancha-Mandarbaria River the general Fourier model 2 (Figure 4.17) was considered as
appropriate model. In the model the goodness of fit where the highest r² value is 0.9424,
adjusted r² value is 0.9423, the lowest value of Root Mean Square Error-RMSE = 1.881, Sum
Square Error-SSE = 4.624 and ω = 0.001464 which made the model as the best

Chapter 4 Modelling of water salinity 111
approximation. The Fourier polynomial approximation 2nd order is given by the following
equation; with coefficients (with 95% confidence bounds).
f(t) = 18.13 –10.5 cos (0.001464 t) – 0.935 sin (0.001464 t) – 1.316 cos (0.002928 t) + 0.8043 sin (0.002928 t)
Wat
er S
alin
ity (x
216
1[dS
/m])
ThresholdLine
Time (x 2 h) Samples
Figure 4.17 Fourier approximation of water salinity of Malancha-Mandarbaria River
The Fourier polynomial model 2 has been accepted as water salinity model in the Malancha-
Mandarbaria river as appropriate model consideration with best approximation. In this model
the graph is showing the dry season (February-June) average highest salinity value which is
60508 dS/m in 2001, 62669 dS/m in 2002 and 69152 dS/m in 2003. The Fourier polynomial
model graph shows the yearly salinity increasing behaviour of the Malancha-Mandarbaria
River. This is the most southern river in the Sundarbans region where the water salinity rate is
always high.
4.5 Overall discussions
Modelling of water salinity in the Sundarbans Rivers is one of the vital issues for the
protection of its mangrove ecosystems and the natural resources management. Considering the
fragile environmental situation in the Sundarbans mangrove wetlands forest area it has been

Chapter 4 Modelling of water salinity 112
chosen as case studies. In the case area there are over 430 rivers and creeks flowing inside the
forest and carry the fresh water (H2O) from the upstream. Down to shortage of fresh water
from upstream catchment the downstream rivers are loosing fresh water and the capillary way.
Increasing sea salt water is the present threats to mangrove ecosystems in the case area. For
understanding the real situation in the Sundarbans region 13 important rivers which are
located around the case area have been chosen for modelling of their water salinity. The time
series model is the tool which can display the real situation. For this reason the time series
model has got the priority in my case analysis. The Fourier polynomial model is one of the
acceptable appropriate approaches for water salinity modelling. In the Sundarbans case, I have
selected 13 river basins and series salinity data has been collected. Fourier polynomial models
have been developed based on the collective data. All the 13 rivers models show the water
salinity increasing behaviour. In most of the rivers water salinity modelling showing the
cycling behaviour and through this cycling behaviour it is possible to forecast the future
situation. Most of the rivers models have been fit as Fourier polynomial model 8 and 2 which
is the best approximation of models.
The Fourier polynomial models are showing the cycling behaviour where the peak values are
recognisable from the model graphs. Analysing all the models result, it shows that Sundarbans
wetland’s salinity situation can be categorised into 2 directions such as east to west direction,
south to north direction (Figure 4.19). The water salinity investigated results show that the
salinity rate is much higher in the southern and south western rivers, the rivers of the middle
area of the Sundarbans are moderate level and the rivers of the northern portion of Sundarbans
carry low salinity rate salinity than the rivers of middle areas of the Sundarbans. Low salinity
was found in the eastern river like in the Baleswar-Bogi river which is the only river in the
Sundarbans region getting fresh water from Ganges and from others rivers, this is the reason
why this area is still less saline zone where the forest and mangrove ecosystems are not
harmful at all. Accordingly, the Selagang-Harintana River and Passur-Mongla rivers are
carrying considerable rate of salinity which is not harmful for the mangrove wetland
ecosystems within the Sundarbans site location. Considering the Fourier polynomial models
on 13 rivers the following chart (Table 4.3) is showing the peak values of water salinity in the
dry season (February-June).

Chapter 4 Modelling of water salinity 113
Table 4. 3 Highest water salinity rates (dS/m) in river basins in the Sundarbans
River Basin 2000 dS/m
2001 dS/m
2002 dS/m
2003 dS/m
Average dS/m
Remarks
Basin - 1 - - 45381 51864 48622.5 Considerable Passur-Mongla Basin - 2 11885.5 10805 10805 10372.8 10956.27 Satisfactory Baleswar-Bogi Basin-3 26364.2 25932 23771 25932 25499.8 Satisfactory Selagang-Harintana
Considerable Basin - 4 34576 36737 43220 47542 40518.75 Sibsa-Nalianala Basin - 5 - 56186 58347 60508 58347 High salinity Bal-Jhalia Basin - 6 - - 43220 60508 51864 High Salinity Passur-Passakhali
Considerable Basin - 7 - 51864 43220 49703 48255.13 Betmargang-Kathka Basin - 8 54025 49703 54025 56186 53484.75 High salinityChunar-Munchiganj
Considerable Basin - 9 - 38898 47542 54025 46807.26 Kholpetua-Kobadak
57612.26 Basin - 10 - 51864 56186 64830 High salinityNotabakikhal-Notabaki Basin - 11 - - 60508 64830 62669 High salinity Arpongasia-Deboki
59773.26 Basin - 12 - 56186 60508 62669 High salinityNilkomal-Hironpoint Basin - 13 - 60508 64830 69152 64830 High salinityMalancha-Mandarbaria
Th - 1 R Th - 6R Th - 8R Th - 11R U.Th- 4R U.Th- 2R U.Th- 2RU.Th - 3RMiss- 3R Mar - 3RMiss - 9 R
(Note: Considering the time series model results of water salinity on 13 potential rivers have
been categorized based on water salinity threshold value 43220 dS/m (20 ppt) is the threshold
value which has been recognized before. Here Th - Threshold line, U.Th - Under threshold
line, Miss - Missing data and information, Mar - Marginal value and R- River).
The result of Fourier polynomial model on 13 rivers in the Sundarbans region (Figure 4.18)
are showing the following information like in 2000 there are only one river (Chunar-
Munchiganj) has crossed the salinity threshold line (according to Clough in 1985, 43220 dS/m
[20 ppt] which has been considered as maximum optimum range for the growth of major

Chapter 4 Modelling of water salinity 114
mangrove species). Three rivers water salinity still under threshold line and 9 rivers water
salinity information is not available for the year 2000. Accordingly in 2001 the model results
show that 6 rivers water salinity has crossed the threshold line, 4 rivers water salinity is under
threshold line and 3 rivers information is missing. In 2002 the model results are showing the
information that 8 rivers water salinity has crossed the threshold value, 2 rivers water salinity
range under threshold line and 3 rivers water salinity in the marginal point. In 2003, the model
results are demonstrating that 11 rivers water salinity has crossed the threshold value and only
2 rivers water salinity is under threshold line.
0
10000
20000
30000
40000
50000
60000
70000
80000
Pas
sur 1
Bal
esw
ar 2
Sel
agan
g 3
Sib
sa 4
Bal-j
halia
5
Pas
sakh
ali 6
Bet
mar
gang
7
Chu
nnar
8
Kho
lpet
ua 9
Not
abak
i 10
Arp
onga
sia1
1
Nilk
amal
12
Mal
anch
a 13
River Basins
Wat
er S
alin
ity (d
S/m
)
2000 2001 2002 2003 Mean Value
Threshold Line 43220 dS/m
Miohaline Zone Mesohaline Zone Polyhaline Zone
Figure 4.18 Result of water salinity modelling of the rivers in the Sundarbans
After analysis the result of Fourier polynomial models on 13 rivers (Figure 4.18) during 4
years time series basis, the result showing that only one river has crossed the threshold line in
2000, 6 rivers have crossed in 2001, 8 rivers have crossed in 2002 and 11 rivers have crossed
in 2003. So the result show that the river water increasing rate is increasing gradually and
more rivers are affected. Most of affected rivers are in the southern part and gradually in the
middle part and lastly in the northern part, on the otherhand most of the rivers are located in
the western part than in the middle part and the rivers of east part is less saline affected area.

Chapter 4 Modelling of water salinity 115
The Figure 4.18 and Figure 4.19 shows the overall salinity increasing trends of the whole
Sundarbans region. As a whole considering all the models results and the peak average three
years values show the real scenarios on the Sundarbans salinity.
Figure 4.19 Salinity increasing in rivers water in different directions
The average peak values of water salinity, 4 rivers (basin 1, 2, 3 and 4) which are in good
situation. Two rivers (basin 7 and 9) are carrying the moderate situation. There are 7 rivers
(basin 5, 6, 7, 8, 10, 12 and 13) which are carrying the high salinity rate in the dry season
which are the threats for mangrove ecosystems. The highset water salinity values are found at
the Malancha-Mandarbaria River in the south and the straight north the Chunar-Munchiganj
River is carrying the highest salinity value in the north side of Sundarbans (Figure 4.20).
Simultaneously water salinity is increasing in the Kholpetua-Kobadak River which location is
also in the northern boundary of the Sundarbans area. Surrounding these two rivers there are

Chapter 4 Modelling of water salinity 116
vast area of agricultural fields, shrimp cultivation farms, settlements and urban growth centres
are located. If the salinity rate continuously increases in the future years then it will be a
fragile threat for the cultural landscapes, agricultural crops and for the whole ecosystems of
the region.
Figure 4.20 W
ater salinity Iso-haline and average highest values in 3 ecological zones
The Fourier polynomial models have ensured the yearly cycling salinity increasing behaviour.
The cycling behaviour is good for understanding the trends for future threats. The figure
(Figure 4.20) is showing the previous water salinity increasing trends which are called the
salinity iso-haline, at the same time it has been ensured the present salinity trends and average
peak values on the three ecological zones in the Sundarbans mangrove forest area. Models
results are indicating that in the less saline zone the dry season peak salinity value is found

Chapter 4 Modelling of water salinity 117
28352 dS/m (4 years average values) whereas before it was around 0 - 10805 dS/m, in the
moderate saline zone where pervious values were found 10805 - 38898 dS/m (Figure 4.21) at
present models showing the average value 49746 dS/m which is showing the marginal value to
threshold line.
Figure 4.21 comparative salinity range in three ecological zones in the Sundarbans
The high salinity zone which is located in the south west part of Sundarbans and in the
previous time the average highest salinity value was 38898-54025 dS/m whereas the present
models are showing the increasing salinity values from 54025 dS/m - 69152 dS/m and the area
of this zone has been extended in the north location. The present average peak salinity value is
57525.82 dS/m which has crossed the threshold value and there are 6 major influential rivers

Chapter 4 Modelling of water salinity 118
flowing through this ecological zone. The water salinity iso-haline map (Figure 4.20) of the
Sundarbans mangrove wetlands which is little different from the (Figure 4.21) is showing the
the recent average salinity trends in the whole region. According to three ecological zones the
present situation is more harmful than before. Considering the highest salinity rate the eastern
zone is still suitable for mangrove ecosystems; the middle area is rapidly turning to high
salinity zone and the south western region is alarming situation which would be more harmful
for some salinity sensitive mangroves plants and animals. On the other hand the high salinity
trends are increasing from south to north and east to west. The north of the Sundarbans where
settlements are presnt can be affected by high salinity. The agricultural cropping pattern is
changing due to saline water and and soil salinity increase this trends would be penetrated in
the north direction. The Fourier polynomial models are showing the cycling increasing trends
of water salinity in the Sundarbans Rivers. Considering the result of all models and the
threshold values of water salinity for Sundarbans case; it is clearly indicating and forcasting
the message that for the upstream fresh water supply into the Sundarbans site is necessary for
reducing the high salinity and protection of its mangrove wetlands ecosystems and cultural
landscapes in the Sundarbans region.
Salinity thresholds value for crops and plants in the Sundarbans region
The salinity thresholds value is one kind of measurement scale of salinity for agricultural
production and yield growth. On the other hand salinity thresholds value can measure the
tolerance of salinity of particular crops in the certain region. In accordance with different
climatic conditions, different type of crops carries different specific threshold values.
Considering the mangroves production and yield growth Chaffey mentioned in (1985) that the
maximum optimum value (Threshold value) of water salinity is 43220 dS/m (20 ppt) for
mangrove growth and development, and Siddiqi mentioned in (1989) that the maximum
seedling generation of mangroves species are in September when salinity rate is lower than
10805 dS/m. The study found more than 80 % area (4813.60 km²) where salinity rate is 32415
dS/m which is the marginal situation in the Sundarbans region. There is a wide variation of
vegetation in the Sundarbans. The freshwater zone and moderately front areas the mangrove
forest and ecosystem consists of poor growth of plants species. On the other hand for different
type of crops and plants and the yield production depends on the salinity increasing rate.
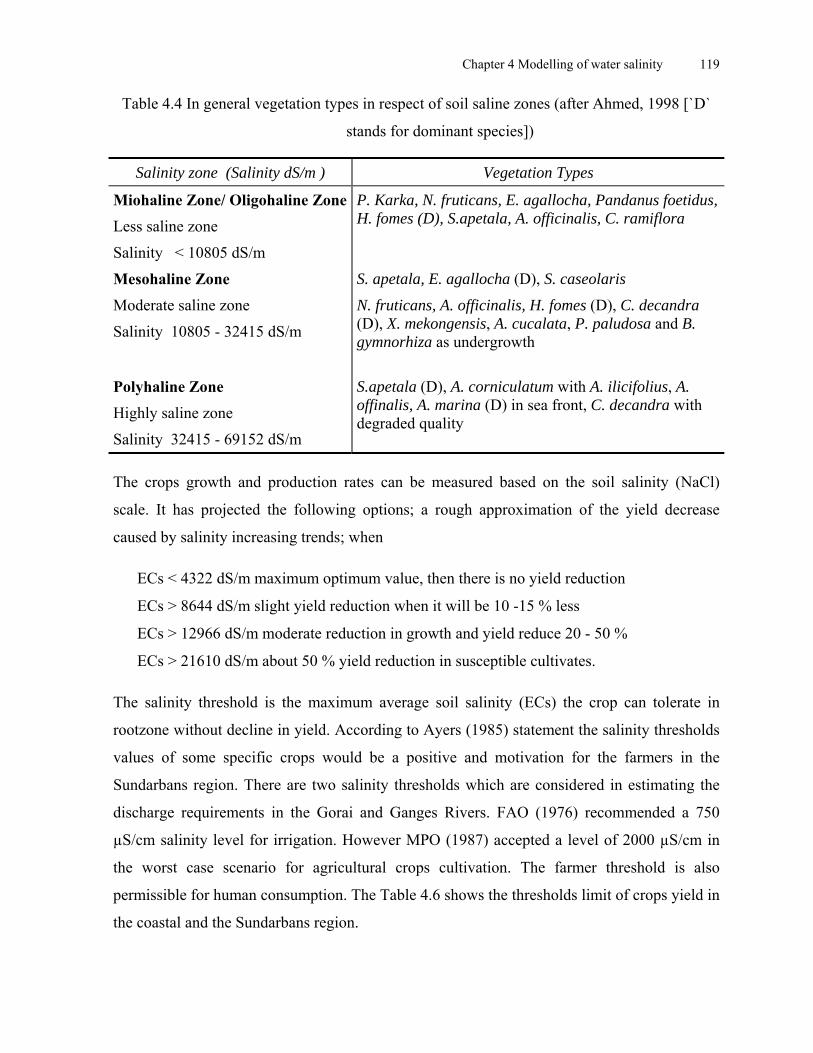
Chapter 4 Modelling of water salinity 119
Table 4.4 In general vegetation types in respect of soil saline zones (after Ahmed, 1998 [`D`
stands for dominant species])
Salinity zone (Salinity dS/m ) Vegetation Types
P. Karka, N. fruticans, E. agallocha, Pandanus foetidus, H. fomes (D), S.apetala, A. officinalis, C. ramiflora
Miohaline Zone/ Oligohaline ZoneLess saline zone
Salinity < 10805 dS/m
S. apetala, E. agallocha (D), S. caseolaris Mesohaline Zone N. fruticans, A. officinalis, H. fomes (D), C. decandra (D), X. mekongensis, A. cucalata, P. paludosa and B. gymnorhiza as undergrowth
Moderate saline zone
Salinity 10805 - 32415 dS/m
S.apetala (D), A. corniculatum with A. ilicifolius, A. offinalis, A. marina (D) in sea front, C. decandra with degraded quality
Polyhaline Zone Highly saline zone
Salinity 32415 - 69152 dS/m The crops growth and production rates can be measured based on the soil salinity (NaCl)
scale. It has projected the following options; a rough approximation of the yield decrease
caused by salinity increasing trends; when
ECs < 4322 dS/m maximum optimum value, then there is no yield reduction
ECs > 8644 dS/m slight yield reduction when it will be 10 -15 % less
ECs > 12966 dS/m moderate reduction in growth and yield reduce 20 - 50 %
ECs > 21610 dS/m about 50 % yield reduction in susceptible cultivates.
The salinity threshold is the maximum average soil salinity (ECs) the crop can tolerate in
rootzone without decline in yield. According to Ayers (1985) statement the salinity thresholds
values of some specific crops would be a positive and motivation for the farmers in the
Sundarbans region. There are two salinity thresholds which are considered in estimating the
discharge requirements in the Gorai and Ganges Rivers. FAO (1976) recommended a 750
µS/cm salinity level for irrigation. However MPO (1987) accepted a level of 2000 µS/cm in
the worst case scenario for agricultural crops cultivation. The farmer threshold is also
permissible for human consumption. The Table 4.6 shows the thresholds limit of crops yield in
the coastal and the Sundarbans region.

Chapter 4 Modelling of water salinity 120
Table 4.5 Classification of coastal salinity (Source: Bangladesh Agricultural Research Council-BARC, 1990)
Salinity class EC dS/m Plant growth condition Rice yield reduction reported %
Less saline (S ) < 2766 Salinity effects mostly None 0negligible
Slight saline (S1) 2766 - 5532 Yields of very sensitive crops may be restricted
1- 6
Moderately saline (S ) 5532 - 8298 Yields of many crops are restricted
11 - 35 2
Saline (S3) 8298 - 22129 Only salt tolerant crops yield satisfactorily
31 - 50
Highly saline (S4) > 22129 Only very salt tolerant crops yield satisfatorily
68 - 72
Table 4.6 The crops production and reduced rate based on soil salinity dS/m (after Ayers and Westcot, 1985).
100% 90% 75% 50% Vegetable and Rawcrops Salt Rating (dS/m) (dS/m) (dS/m) (dS/m)
Asparagus 3734.2 8436.5 15351.7 26830.9 T, VT
Broccoli 2627.8 3595.9 5117.2 7606.7 MS
Cabbage 1659.6 2627.8 4010.8 6361.9 M, MT
Carrot 968.1 1521.3 2627.8 4149.1 S
Cucumber 2351.1 3042.7 4010.8 5808.8 MS
Lettuce 1244.7 1936.2 2904.4 4702.3 MS
Onion 1106.4 1659.6 2489.5 4010.8 S
Pepper 1383.0 1659.6 3042.7 4702.3 MS
Potato 1521.3 2351.1 3457.6 5393.9 MS
Sweet Potato 1383.0 2212.9 3457.6 5532.1 MS
Tomato 2351.1 3180.9 4702.3 6915.2 MS
Rice (Paijum variety) 2766.0 5532.1 8298.2 27660.8 MS (Note: S - Sensitive, MS - Moderately sensitive, MT - Moderately Tolerant, T - Tolarant, VT - Very tolerant).

Chapter 4 Modelling of water salinity 121
Among many other crops all varities of rice paddy varities in Bangladesh are very sensitive to
increases in salinity. The tolerance of rice paddy varities to salt concentration starts dropping
sharply when the salinity exceeds 2000 µS/cm. Whenever the salinity concentration would be
16,000 µS/cm then plant growth drops to below 50% (MPO, 1986).
The above mentioned common crops are producing in the northern part of the Sundarbans
region. The soil and water salinity has increased during the last three decades, as a result crops
growth has decreased rapidly. The salinity threshold values for each particular crop is different
therefore it is necessary to recognise the threshold values for the particular crops in the south
western part of Bangladesh. Observing the real scenarios the farmers would be able to choose
the specific crops which are suitable for that specific saline soil in the particular areas in the
Sundarbans region. The salinity threshold values can be used as a potential indicator of crops
production and mangrove species plantation in the area affecting by NaCl in the Sundarbans
region.

Chapter 5 Proposals for the Sundarbans ecosystems development 122
Chapter 5 Proposals for the Sundarbans Ecosystems Development 5.1 Some specific proposals The Sundarbans mangrove wetlands ecosystems and its protection strategies are now a key
management concern in Bangladesh and the international communities. The mangrove
wetlands and its wildlife preservation, flora and fauna conservation, protection of indigenous
culture, cultural landscapes conservation, eco-tourism establishment, water quality control,
and upstream Ganges water supply ensure the protection of mangrove wetlands ecosystems in
the Sundarbans. These have become the most significant community issues. The Sundarbans
mangrove wetlands have assumed economic importance, as people increasingly have interest
in visiting and collecting the natural resources from these heritage sites. Protection and
conservation of the mangrove ecosystem could contribute to environmental protection,
reduction of environment degradation, and it could be a proper managed ecosystem and
heritage preservation area for future generations.
• Wetlands ecosystems have historically and culturally been considered as on integral part of
human habitation in Bangladesh. As a result, wetlands have frequently been altered or lost
because their ecological functions and resulting values to society have not yet been
understood, so it is the wise responsibility to protect these mangrove wetland ecosystems,
by maintaining the upstream water supply in the Sundarbans region.
• The present management effort of the Sundarbans does not give proper attention to the
destructive effects of development activities and tourism on such a highly sensitive
ecosystem of the mangrove wetlands. It has been stated from the previous experiences that
there were some constructional project activities such as coastal embankment, polders and
dams. They had been constructed in the Sundarbans region which has created
environmental and social negative impacts. Therefore to start any kind of developmental
project activities, Social Vulnerability Assessment (SVA) and the Environmental Impact
Assessment (EIA) or Strategic Environmental Assessment (SEA) should be under-taken as
systematic approach of addressing the environmental issues and their consequences in
Chapter 5 Proposals for the Sundarbans ecosystems development 123
order to prove potential policies, plans, and programs in adequate management activities
(Partidario et al., 2000) for sound ecosystems in the Sundarbans region.
• As it is difficult to segregate ecologically sensitive areas such as Sundarbans mangrove
wetlands from the adjoining areas, environmental management and protective measures
have to be undertaken within the framework of national planning.
• Sustainable national mangrove wetlands ecosystems management policy, which could be
participatory management approach with special highlights on Sundarbans mangroves and
its landscapes, should be at the ecosystems level.
• The Ganges water sharing between India and Bangladesh is just not a geo-techno-political
issue, it is also a humanitarian problem, so the problem should be solved in a humanitarian
way, and proper water sharing and supply to the down stream basin could be the
appropriate solution for the protection of the Sundarbans mangrove wetlands ecosystems.
• Interaction is needed between Bangladesh and India concerning a common issue for
appropriate use of Ganges water resources in the water catchment area. The coastal
ecosystems balance and economic improvement is dependent on the Ganges water supply
in the downstream. Therefore, the transboundary Ganges water sharing conflict should be
considerably reduced, and an adequate coastal mangrove wetland ecosystems management
plan should be developed and avoid the maximum ambiguities. To mitigate this water
sharing conflict, the Indo-Bangladesh Joint River Commission (JRC) was set in 1972 that
should work more actively and develop a scientific water flow monitoring system in the
Ganges basin.
• The policy statements based on the core management plan of multiple uses of the
mangrove wetlands resources, especially for forestry, fishery and shrimp farming, wildlife
conservation and protection of biodiversity should be formulated on multidisciplinary
approach. Where the local stakeholders participation and their benefits are classified.
• It should be ensured that an integrated approach to planning and management of
Sundarbans mangroves and its cultural landscapes within the large scale of integrated
coastal area management programme are implemented. There would be direct and indirect
benefits like employment opportunity, resource based small business, eco-tourism, local

Chapter 5 Proposals for the Sundarbans ecosystems development 124
socio-economic improvement, women entrepreneurship, educational facilities and local
development for the coastal community, stakeholders and international interest groups.
A clear distinction in conservation strategies also has to be made here.
i) The main aim of nature reserve should be the greatest or optimum attainable of
biological productivity, diversity, and stability by restoring all ecological processes and
their protection, regulation and carrier functions through scientific conservation
management.
ii) In natural recreation parks, the aim should be to optimize recreational amenities in
order to allow maximum recreational amenities and also allow maximum enjoyment
with minimum damage to natural and cultural resources (Naveh, 1995).
• Top-dying of Heritiera fomes is associated with soils, which has high clay content and
water salinity. For this reason, it is necessary to reduce the high rate of water and soil
salinity in order to prevent top-dying and die-back diseases in the Sundarbans (Sobhan,
1973). On account of this conservation policies must be based on a proper appreciation of
the social implications of the proposed studies.
• The marine hydro-engineering embankment construction approach for restoration of
coastal wetlands should be undertaken as a concept to protect the tidal salinity intrusion
and natural hazards mitigation in the Sundarbans areas.
• The wetland studies must be based on man environment research tradition, methodologies
of proper conservation and management of mangrove wetlands have to take into
consideration the local culture and social condition of individual cases, as well as people
appreciation, attitude and perception of the wetland environment (Islam, 1995).
5. 2 Integrated sustainable management of mangrove ecosystems The pressure on the coastal mangrove forest resources, their socio-economic, cultural value
and its significance are increasing due to strong competition among the stakeholders and the
communities utilising the mangrove resources. In such a critical situation some analytical
findings suggest that an integrated and holistic approach to mangrove resource management is
much more appropriate than other approaches (Salomons et al., 1999). The task of an
integrated management approach is to work together and produce products services and gains

Chapter 5 Proposals for the Sundarbans ecosystems development 125
or losses of socio-cultural significance from the available mangrove resources. The core
objectives of the mangrove ecosystems management is the production of a socially and
ecologically desirable resource utilisation and services that will balance mangrove wetlands
ecosystems in the coastal area.
The future of the Sundarbans integrated mangrove management process should include:
• A holistic approach oriented integration of plans and programmes for local economic
development and quality management of ecosystems. Appropriate capacity building,
education and training are necessary to disseminate to the locals and stakeholders and such
type of initiatives should start immediately.
• Global warming, sea level rise and vulnerability of coastal wetlands ecosystem is a new
additional factor determining the long term management strategy for dealing with the
mangrove wetland issue. A predicted sea level rise, accelerated by global warming will
cause a further “squeezing” of the natural tidal land (Doodly, 2001). In the Sundarbans
case, sea level rise would result in saline water moving further into the delta, which would
be a catastrophe for mangrove and coastal wetland ecosystems in Bangladesh. The fate
with different Sea Level Rise (SLR) and the impacts on the Sundarbans, this is if 1m SLR
inundate 60% of the Sundarbans (Huq et al., 1999) and with 1.5 m SLR about 17 million
(15%) of the population will have to be displaced, whereas 22,000 km² (16%) land will
permanently be inundated, cyclone intensity will rise from 10 % to 25% as a result,
reduction of mangroves areas will increase from 50-75 % (UNDP, 2000; Salar et al.,
1994). In such situation climatic awareness education and applied training should be
initiated in order to change the attitude of people and the government, and develop
technically feasible devices to live with water related extremes. Some important issues
should be considered such as a) Innovation partnership and networking for wetlands
conservation, b) Cultural values of wetlands as engine for sustainable livelihood, c)
Community-based management of coastal wetlands ecosystems, d) Restoration and
motivation of stakeholder participation. Finally to strengthen the activity of preparedness
systems, such as risk assessment and increase water storage and technology utilisation of
the expected consequences of climate change situations. Beside these migration and
adaptation are the two options that should be considered in minimizing the negative
impacts.

Chapter 5 Proposals for the Sundarbans ecosystems development 126
• Appropriate integration of all elements of management, from planning and design,
decision making, through implementation, maintenance, monitoring and evaluation within
acceptable time frame, also needs to be addressed.
• Recognise the need to involve a broader community in policy debate in other to develop
new innovative policies, management approaches and incentive mechanisms for
institutional development and local water resource-base approaches (Dovers, 2005).
• Integration management approach of mangrove wetlands ecosystems in the Sundarbans is
needed and it is essential for the protection of the whole coastal environment. For such an
important task, responsibilities should be shared among the levels of Government, non-
governmental organisations, local stakeholders, civil societies, national and international
agencies and between public and private sectors those would like to safe these invaluable
ecosystems for the future generation.
• Tourist facilities alter the natural landscapes, disturb natural areas and could become a
source of pollution (Huybers et al., 2003). To realise such harmful environmental
condition the modified 4 layers (Core Area, Eco-tourism zone, Buffer zone and
Transitional Zone) eco-tourism model has been proposed for implementation as an
appropriate tool, which is one of the alternative policies for local participation for the
protection of disturbed landscapes, soil, water, biodiversity in the Sundarbans. Reduce
substantial use of mangrove resources and establish eco-tourism by considering 350
meters buffer zone for tourists and the shrimp fry collectors in the reserve areas.
Conservation and protection measures of eco-tourism should be included as a component
of national wetlands development and management planning (Chaves, 2002; BPC, 2002;
BPC, 2001). A multicultural approach to local agenda 21, in which eco-tourism is a
component of sustainable development (Kay and Alder, 1999; Anderson, 2000).
• Taking into consideration the Bangladesh-Nepal (Ministry of Water Resources) joint
investigation report on environmental impact assessment studies in 1989, where water
supply problems was recognised and suggestion given to build water storages in the
upstream of the Ganges, in order to mitigate and solve the water problems in the Ganges
catchment area especially in Bangladesh water catchment area. The present studies finding
also strongly suggest to build 7 water storages in Nepal with the multilateral agreement.
Actually those 7 rivers of Nepal are carrying 71 % of fresh water annually at the Farakka

Chapter 5 Proposals for the Sundarbans ecosystems development 127
Barrage in the dry season. Therefore, those 7 water storages would be established in 3
different main river channel locations in the Ganges catchment at the Nepal portion, such
as Pancheshar, Saptakoshi, Karnali, Kaligandhi 1, Kaligandhi 2, Seti and Trishul Ganga
locations. It has been estimated that after construction of those proposed water storages in
Nepal, Bangladesh can achieve extra 45,000 m³/sec water from upstream in the dry season.
Figure 5.1 shows the proposed upstream water supply in the down stream through the
Ganges and international navigation route through the Jamuna -Tistha basins.
Alahabad
Figure 5.1 Proposed upstream water supply plan for Sundarbans and navigation route
To receive upstream water the Indian river basins are necessary for peaceful
implementation of such project. This could solve the fresh water crisis between Bangladesh
and India. In such case the green basin cooperation between India and Bangladesh is
necessary for implementation of international navigation route connection from Saptakosi
River basin (Nepal) to Tista River Basin (Bangladesh) and upstream water supply routes
from reservoir sites (Nepal) to Farakka point in India and up to Bardia point in Bangladesh.
• The transboundary Ganges water sharing conflict and damage to ecosystems in the
downstream of Bangladesh could be solved when ever minimum required upstream fresh
water supply could be ensured in the Sundarbans region. Considering the present

Chapter 5 Proposals for the Sundarbans ecosystems development 128
environmental degradation situation in the Sundarbans region, which has been estimated
based on the Ganges water supply scenarios in figure 3.15 and figure 3.16, based on those
two figures the present figure 5.2 shows the point (A) where water flows and salinity
increase curve has been crossed. Figure 5.2 indicates that if the Ganges water level is at
point A level, then there will be no problem for ecosystems, because the mangrove water
salinity threshold value is 43220 dS/m (Clough, 1985). Therefore maintaining water
salinity and balancing ecosystems at a minimum of 1200 m³/sec Ganges water flows are
essential at Harding bridge point. The Nepal Bangladesh water sharing approach could
carry 45,000 m³/sec flows in the dry season whereas for the protection of mangrove
wetland ecosystems, the minimum requirement is 1200 m³/sec flows at the Hardinge Bridge
point in Bangladesh.
0
500
1000
1500
2000
2500
3000
3500
4000
1962 1968 1970 1973 1975 1976 1980 1985 1989 1993 1996 1998 2000 2002 2004 2006Time (Year)
Wat
er D
isch
arge
m³/s
ec
0
10000
20000
30000
40000
50000
60000
Wat
er S
alin
ity d
S/m
m³/sec dS/m
Threshold Line
A
C
B
Figure 5.2 Considerable lines of water flows and salinity intrusion
If the Ganges River carries 1500 m³/sec to 1200 m³/sec water flows at the Hardinge Bridge
point, then the maximum salinity in water could raise to 10500 dS/m, which would not be
harmful for the mangrove wetland ecosystems in the Sundarbans. The water flow curve and
salinity increase curve has crossed on the certain point (point A) in 1975. At this point the
Ganges water flows was approximately 1200 m³/sec and salinity rate was 18000 dS/m
(figure 5.2). Line A shows the different salinity trends after and before the Farakka Barrage
construction on the Ganges River in 1975, Point B shows the salinity intrusion line that

Chapter 5 Proposals for the Sundarbans ecosystems development 129
crossed the water salinity threshold line. Therefore B is the highest considerable point of
water salinity intrusion at Passur-Mongla River. After this point the salinity increasing
trend would be harmful for ecosystems and dangerous for ecosystems services. This point
(point B) can be introduced as maximum considerable point of salinity intrusion at the
Passur-Mongla area. The Ganges water flow level C could be considered as the minimum
level of water flows for the Mongla-Passur River point. Therefore, point C indicates the
minimum quantity of water (500 m³/sec). This quantity of fresh water is necessary and
needed for the whole year to maintain the river basin, and mangrove ecosystems in the
Sundarbans region. If 1200 m³/sec fresh water is available at the Hardinge Bridge point
then the water salinity will reduce and it will come back at the situation before the Farakka
Barrage construction. Therefore, allowing 1500 m³/sec fresh water to flow in the Hardinge
Bridge at the Ganges basin could solve the ecosystems problem in the Sundarbans region.
The result of water salinity modelling on the Sundarbans rivers (Chapter 4), the alternative
approach for fresh water supply (figure 5.1) and the current administrative management
approach in the Sundarbans region could be used towards an integrated management plan for
the Sundarbans mangrove wetland ecosystems and the cultural landscapes in the region. It
could improved the standard and quality of lifestyle in local communities that depend on
mangrove resources and on the other hand balancing biodiversity and the natural productivity
of ecosystems in the Sundarbans mangrove wetlands (Gesamp, 1996; Davos, 1998).

Chapter 6 Conclusions 130
Chapter 6 Conclusions Cultural landscapes and wetlands have played a significant role in the development of human
society. The rich natural wetland is an invaluable component of the environment, which
supports a wide’s array of biodiversity and the world’s most productive ecosystems. The
destruction of cultural landscapes and wetlands which are valuable resources has serious
economic, ecological consequences for the community. The Sundarbans mangrove wetlands
forests serve as a link between terrestrial and marine ecosystems. The ecosystems approach
has been increasingly applied in water management, inland water resources, vegetation,
wetlands, riverine floodplains, deltaic lands, wildlife habitats and human settlements.
Mangrove vegetation stabilizes the coastline, enhances land building and enriches both soil
and aquatic environments. The protection of mangrove wetlands forests and their sustainable
use are not always priority issues almost all over the world. In recent years vast areas of
mangrove wetlands have been destroyed due to scarcity of upstream fresh water and human
intervention for developmental efforts. The lack of awareness, political, economic and
technical choices of development, actually did not take part for long-term perspective. That is
why it caused destruction for ecosystems with huge negative consequences for the water
resources, which is directly connected to mangrove wetlands ecosystems.
A large part, almost 45 % of coastal mangrove wetlands have disappeared within the last three
decades. After construction of the Farakka Barrage the water and soil salinity has increased
and the limit of salinity threshold line has already been crossed. Salinity increase is caused for
landscapes changes of the areas adjoining the Sundarbans; the surrounding land was popularly
used for rice and agricultural crops which is now being used for shrimp farming. Therefore
cultural landscapes are changing due to high salinity intrusion and shrimp farming. This trend
is a serious threat for agricultural cropping and mangrove ecological balance of the
Sundarbans and its cultural landscapes. Such degradation and shortage of fresh water flows
and high salinity intrusion has brought about a biodiversity loss, degrading water quality, top-
dying process, reduction of fish habitat, health risk for drinking water and threats for the
whole ecosystems. During the last 100 years the Sundarbans has lost over 12 species while 21
species are on the red list of IUCN which is noticed the alarming situation in the Sundarbans.

Chapter 6 Conclusions 131
The research on this particular issue and its findings must be considered to make an
appropriate master plan for the protection and management of Sundarbans mangrove wetlands
ecosystems in Bangladesh. The upstream fresh water supply to the Sundarbans is the central
issue for adequate management of this hostile environmental. The Ganges water sharing and
management is the most important and critical geo-political and environmental issues between
Bangladesh and India. Water sharing is a long-term disputable issue, but until now
constructive scientific water sharing, monitoring and management plan is still missing.
The actual goal of this research is a contribution makes a comprehensive management plan for
the long-term conservation and protection of cultural landscapes and mangrove wetlands
ecosystems in the Sundarbans region, where high salinity is one of the major problems for
protection of mangrove wetlands ecosystems. Considering the present fragile environmental
degradation the rivers water salinity modelling has been discussed extensively in Chapter 4,
where the time series models with the Fourier polynomial approach has been analysed. The
major 13 rivers carry fresh water from upstream by balancing the ecosystems in the coastal
mangrove region. The 13 rivers have been represented from all corners and the three
ecological zones of the Sundarbans. These rivers have been modelled and the results (Figure
4.5 to 4.17) show an increasing behaviour and most of these rivers have already crossed the
water salinity threshold line. The Fourier polynomial models of 13 rivers in the Sundarbans
are forecasting the future trends of salinity intrusion. The highest rate of water salinity is
58347 dS/m to 69152 dS/m, in such rate; all kinds of mangrove (flora fauna) species cannot
tolerate or survive. Some mangrove species can survive within 86440 dS/m but the ratio of
species is very small. Even in the Florida Bay mangroves are affected specially Avicennia
germinas by die-back diseases and it is expected that they concide with periods of
hypersalinity in Florida Bay (Carlson, 1995). In Australia there are serious die-back of
mangroves around the Mackay Coast, the Avicennia marina is affected by toxic chemical. It
appears to be taken up through the roots with salt molecules (Duke, 2004). In the Sundarbans
case top-dying and dieback disease has found has found seriously in this study. Considering
the high potentiality of mangrove biodiversity in the Sundarbans its protection is necessary
and emergence. In such situation how could it be considered that the salinity increasing rate
would not be harmful for all the mangrove species? On the other hand Sundarbans ecosystems
are not only mangrove plants; it is the functions of biotic and abiotic systems. Considering the
Chapter 6 Conclusions 132
salinity intrusion and mangrove ecosystems it is necessary to make a separate specific research
on every element of mangrove ecosystems, and the findings of such research will carry out a
positive fundamental result for making an appropriate management plan for a long-term
conservation of mangrove wetlands landscapes and its ecosystems.
This research finding will contribute to making an adequate management plan for the
mangrove wetlands ecosystems in the Sundarbans region; the policy makers would be able to
use this research finding as a guide line and as a reference. For the mangrove wetlands
ecosystems and changes of cultural landscapes where the main fundamental issue is the
Ganges water or surface water, therefore the Ganges transboundary water sharing between
Bangladesh and India would be a priority issue for discussion and should ensure fresh water
supply into the Sundarbans. Simultaneously other alternative approaches for the solution of
this environmental problem have to be searched. The coastal region of Bangladesh especially
the Sundarbans mangroves wetlands suffer from salinity problems caused of tidal flooding,
direct inundation by saline water during the wet season (June-October) and a shortage of
upstream fresh water. The intrusion of saline waters into the estuaries surface water systems,
during the period of low river flows (February- May), lateral movement of saline groundwater
main concern with the intrusion of saline water in the water systems. The following issues
should be taken into consideration as a dynamic way to mitigate the water management and to
share the conflict; and reduce the high salinity intrusion in the south western region in
Bangladesh.
1. Internal rivers connection and transforming approach / River water supply through all
connecting system plan. It can carry out a good result to make internal rivers connection
and networking systems. In the meantime there are lot of rivers that have lost their
connection, on account of this water cannot move or flow properly from north to south or
east to west. This type of river netwoking system could be developed for the future
environmental development in the Sundarbans region. In such case Jamuna River from the
north (from the Gaibandha point) can be connected with Bangali - Atrai River and joint
with Gorai through the Ganges on the certain state point where it is suitable considering
hydrological and geomorphic point of view. Through this connection internal rivers water
could flow from east-north to south west corner where Sundarbans is located.

Chapter 6 Conclusions 133
2. Dredging the river beds and internal connection in the Sundarbans are needed. The water
salinity model results show the different salinity behaviour in the Sundarbans. The higher
rates are in the south and south western corner and low salinity rates are in the eastern and
north eastern side of Sundarbans. So there could be an alternative solution if fresh water
could flow in every corner inside of the Sundarbans, perhaps the increasing rate will be
suddenly reduced whenever the upstream fresh water will enter the 13 rivers basins in the
Sundarbans mangrove wetlands.
3. Considering the Geo-hydrological condition of the region the proposed possible dam in the
upstream Ganges Barrage (Padma Barrage) should be constructed at the proper
geographical location. There is a possibility to make such Barrage at the downstream of
the Ganges as an alternative of Farakka Barrage. Where huge water can be reserved and
could be used in the dry season by the south western part of Bangladesh through the Gorai
river‘s channel. This would be a good idea and the Government of Bangladesh is already
planning for it. But I do not agree with such sensitive project whether it would be a
successful project or not. Reservoir making in Bangladesh, on a hydrological point of view
would not be a wise idea, because all the rivers carry huge particles during the flooding
times, only the Jamuna River carries 2.4 million tons particles and sediments in every year.
A major portion of these particles and sediment load is deposited in linear channel and the
river beds of the Sundarbans rivers. So the reservoir will be overloaded and filled out
within a short time and then it will create another new environmental catastrophe in the
deltaic coastal region.
4. Considering the natural influences on coastal mangrove wetlands, the Engineering
hydrological dams would be constructed at the coastal off shore areas and river estuaries
located in the south, where tidal inundation and cyclones are thrashing and damaging the
mangrove resources and human settlements. Such type of coastal hydrological dams could
trim down the destructive effects of wetlands ecosystems and human lives. It could be
measured as a life belt for the coastal communities.
5. The Ganges is the Transboundary River between India and Bangladesh. There is a water
sharing treaty between two countries. In reality the treaty is not working properly. For the
greater interest of the Sundarbans world heritage site ecosystems and the benefits of
stakeholders-water supply from Gages River should get priority. In the treaty the four key

Chapter 6 Conclusions 134
important issues should be in place at the basin level i) Scope that mean legacy of users
and uses whithin the basin, ii) Substantive norms relate to the competing uses economic,
social and environmental issue should be reconciled, iii) Implementation instruments
should specific and iv) Dispute settlement mechanisms.
6. The initiatives are needed to develop strategies for an adaptive adequate management plan
based on monitoring of fresh water supply in the Ganges basin, flora, fauna and water
quality with co-operation and appreciation of local people and international communities.
7. More in-depth applied research and training is needed especially on some potential issues
as well as on hydrology, water quality and supply, soil salinity and fertility, vegetation,
wildlife, precipitation and temperature, migration and settlement, climate change and
coastal resource management, landscapes changing pattern, fisheries and marine resources
etc. The local government authority, local research institutions, NGOs, civil societies and
international research organisations can play a potential role to arrange such environmental
awareness education, training and empirical research.
8. For effective use and research on transboundary surface water and wetlands resources;
need to build-up data base knowledge, such detailed data on surface water, wetlands in
Bangladesh are still lacking. Therefore an appropriate centre of research on wetland in the
country should be developed and strengthened its capacities (Sharafuddin, 1992).
9. Governmental wills and political commitment is necessary for such transboundary issues
within the transboundary catchments. The political inductility and good governance could
arrange potential bilateral dialogues between India and Bangladesh. The initiatives from
both Governmental sites could carry out satisfactory results for ending this pending game
between the two countries and the Ganges water sharing issues.
10. Finally an interdisciplinary integrated management plan should be developed based on the
water salinity model results which have been found in chapter 4.
The scarcity of the Ganges flows in the deltaic region is a challenge for cultural landscapes
protection, biodiversity and mangrove wetland ecosystems management in the coastal region.
The biota of the Sundarbans mangrove wetlands are highly influenced by salinity regimes of
surface and groundwater systems and more significantly of water and soil. Saline water has
large negative effects on the Sundarbans ecosystem and reduces crops growth and yields
through increased soil and water salinity. At least 1.4 million ha of the coastal and offshore

Chapter 6 Conclusions 135
areas inhabited by about 15 % of the population are directly affected by salinity. The forest
administration and inadequate management system is one of the main reason for the reserve
forest destruction. Therefore to protect the mangrove wetlands ecosystems and endangered
plants and animal species and their habitats high water salinity has to be reduced considering
salinity thresholds values by increasing the Ganges fresh water input in the Sundarbans region.
In such environmental degraded situation the discharge requirements indicate that it requires
the highest discharge (in April) of 1500 m³/sec at Hardinge bridge point on the Gages River to
keep salinity below the threshold for the Sundarbans. The future development of ecosystems,
the natural calamities and the approaches have been proposed in Figure 5.1 and 5.2 should be
considered in making a master plan for the protection of mangrove wetland ecosystems.
Therefore the community as a whole should realise this and may participate in the processes of
conservation and improvement. The research on this particular issue and its findings must be
considered to make a suitable master plan for Ganges water sharing and the management of
the Sundarbans mangrove wetland ecosystems and its cultural landscapes in the Sundarbans
region in Bangladesh.
References 136
References Abbas, A. T. B. M. 1982. The Ganges water dispute. University Press Limited, Dhaka,
Bangladesh. Ahmed, A. U. 1998. Ecological security in a warmer world: The case of the Sundarbans. BUP
monograph. Bangladesh Unnayan Parishad. Dhaka Ahmed, A. U., and Reazuddin, M. 2000. Industrial pollution of water systems in Bangladesh,
environmental system of surface water systems of Bangladesh. University Press Limited, Dhaka. Bangladesh.
Ahmed, F. 2001. Legal framework towards the conservation of the Sundarbans. Paper
presented at the 1st national conference on the Sundarbans at University of Khulna, 14-16 February, Khulna. Bangladesh.
Ahmed, R. U., and Hivst, S. M. 1995. Wetland conservation and water resources development
in Bangladesh. 14th Annual Meeting of the Society of wetland scientists, May 30- June 3, Edmonton Alberta, USA.
Ahsan, M., and Biswas, S.N. 2001. Soil and water salinity monitoring report, Khulna-Barisal
Division, SRDI, Vol. 2. Dhaka, Bangladesh. Alam, K. M. 2001. Integration of socio-economic and ecological data in conservation and
management of floral diversity in the Sundarbans. In: Siddiqi, N. A. and Baksha, M.W. (eds.). Mangrove Research and Development, Proceedings of the National Workshop on Mangrove Research and Development at Bangladesh Forest Research Institute. Chittagong.
Ali, A. M. S., and Rahman, M. A. 1996. Shrimp cultivation and environmental destruction:
case study on the Shatkhira region of Bangladesh (Bengali). In : Sultana, R. (ed.). Bhugul Patrika (Geographical Journal), Issue 14/ 1996. Department of Geography, Jahangirnagar University, Savar, Dhaka.
Alam, M., Nishat, A., and Siddiqi, S. N. 1998. Vulnerability of Bangladesh to climate change with special reference to inundation. In: Huq, S. Karim, Z. Asaduzzaman, M., and Mahtab, F. (eds.). In vulnerability and adaptation to climate change for Bangladesh. Kluwer Academic Publishers. Dordrecht, The Netherlands.
Alim, A. 1984. Soil and plant interaction in mangrove ecosystem. Paper presented in UNDP&
UNESCO training seminar on geology. Sedimentology, erosion accretion in mangrove areas. Dhaka.
Amin, M. N., and Khan, N. A. 2001. A primer on the nature and management of resources of
the Sundarbans. Grassroots voice: A journal of indigenous knowledge and development. Vol. IV. Issue 1. BARCIK, Dhaka.

References 137
Amarashinghe, M. D. 1988. Socio-economic status of human communities of selected mangrove areas on the west coast of Sri-Lanka. Mangrove ecosystems occasional papers. UNDP/UNESCO. Mangrove Project Asia and Pacific. No. 3
Anderson, D. L. 2000. The statistics of helium isotopes along the global spreading ridge
system and the central limit theorem, geophysical research letters, 27, 16, 2401/2404. Ansarul, K. 1995. Ecological implecation of changing natural flow of water on the Ganges
river ecosystems. In: Hasan, J. M. (ed.). Women for water sharing. Academic Publishers. Dhaka. Bangladesh.
Anon, 1973. Reconnaissance soil survey report of sadar south and Cox’s Bazar subdivision,
Chittagong District. Department of Soil Survey. Dacca. Anon, 1975. Soil taxonomy. A basic system of soil classification for making interpretative soil
surveys. SCS-USDA handbook no. 436 Anon, 1987. Remote sensing monitoring component of mangrove afforestation project-I.
Space Research and Remote Sensing Organisation (SPARRSO). Dhaka. Anon, 1995. Integrated resource management plan of the Sundarbans reserved forest, Vol. 1.
Draft final report of FAO/UNDP project BGD/84/056 – Integrated Resource Development of the Sundarbans Resource Forest, Khulna, Bangladesh.
Anon, 1998. Land degradation situation in Bangladesh. Soil division, BARC, Dhaka,
Bangladesh. Annette, M. P., and Donald, M. K. 2000. Managing global wetlands. In : Kent, D. M. (eds.).
Applied wetlands science and technology. Lewis Publishers, New York. pp 377- 403 Ayers, R.S., and Westcott, W. 1985. Water quality for Agricultural organisation (FAO) of the
United Nations. FAO irrigation drainage paper 29. Rome. Italy. Bala, B. K. 1998. Energy and environment: Modelling and simulation, Nova science
publishers, Inc. New York. USA. BARC (Bangladesh Agricultural Research Council), 1990. Salinity of coastal soils. BARC,
Dhaka. Bangladesh. Bandyopadhyay, A. k. 1968. The Sundarbans mangrove forest experience on reclamation. Proceeding of workshop conservation mangrove areas to paddy cultivation. UNDP/ UNESCO, RAS/79/002, New Delhi. India. Barbier, E. B. 1093. Sustainable use of wetlands valuing tropical wetland benefits: Economic
methodologies and applications. The Geographical Journal. Vol. 159. No. 1
References 138
Begum, K. 1987. Tention over the Farakka Barrage – A techno political tangle in South Asia. University Press Limited, Dhaka, Bangladesh.
Begum, S. Barai, P. K., and Datta, D. K. 2001. Availability of forest biomass energy with
reference to Bangladesh. Paper presented at the 1st national conference on the Sundarbans at University of Khulna, 14-16 February, Khulna.
Banerji, R. K. 1981. Cretaceous - eocene sedimentation, technism and biofacies in the Bengal
Basin, Palaeogo. Palaeocli palaeoco. India. Ben, C. Lindquist, A., and Wilson, D. 1995. Sharing the Ganges – The politics and technology
of river development. University Press Limited. Dhaka. Bhattacharya, D., and Chowdhury, M. 1985. Education based on prehistory in conserving
biodiversity. University of California and Rodlands University USA. A paper presented at the national conference.
Bird, E. C. F. 1967. An introduction to systematic geomorphology; Coasts. Massachusetts
Institute of Technology, MIT Press, Massachusetts. USA. Birks, H. H. Birks, H. J. B. Emil., Kaland, P. E., and Moe, D. (eds.). 1999. The cultural
landscape past, present and future. Cambridge University Press. Cambridge. UK. Biswas, A., and Hitto, J. (eds.). 2001. Sustainable development of the Ganges – Bramaputra-
Meghna basin, United Nations University Press, Tokyo, Japan. Biswas, A., and Utto, J. I. (eds.). 2000. Water for urban areas of the developing world in the
twenty first century: Water resource management and policy- Water for urban areas and challenges and perspective. UNU, Tokyo. pp1-23
Blasco, F. 1975. The mangroves of India. Institut Francis de Pondichery, Travaux de las
section scientifique et technique, tome XIV, Facicule 1, Pondichery, India. Blower, J. H. 1985. Sundarbans forest inventory project, Bangladesh: wildlife conservation in
the Sundarbans, ODA project report 151, Land resource development centre, Surbiton, Survey. UK
Bose, S. K., and Bhattacharjee, D. K. 2001. Utilisation aspects of mangrove species. In:
Siddiqi, N. A., and Baksha, M. W. (eds.). Mangrove research and development - proceedings of the national workshop on mangrove research and development at BFRI, Chittagong. 15-16 May. pp108-113
Boyce, M. S., and Haney, A. (eds.). 1997. Ecosystem management. Applications for
sustainable forest and wildlife resources. Yale University Press. New Haven and London. Bowman, H. H. M. 1917. Ecology and Physiology of the red mangrove. Proceedings. American Philosophical Science. 56: pp 589-672.

References 139
BPC-(Bangladesh Parjatan Corporation) 2001. Ecotourism implementation in the Sundarbans and recommendation for development. Report prepared by recommendation making committee and BPC. No. P- 1(56)/87 (part-1)/336. Dhaka. Bangladesh
Brammer, H. 1999. Agricultural disaster management in Bangladesh- Salinisation. University
Press Limited, Dhaka, Bangladesh. pp 331-336 Brouwer, R. Langford, I. H. Bateman, I. J., and Turner, R. K. 2001. A meta-analysis of
wetland contingent valuation studies. In: Turner, B., and Ader, (eds.). Economic of coastal and water resources: valuing environmental Functions, Kluwer Academic Publishers, and The Netherlands. pp 305-322
Brown, B. E. 1997. Integrated coastal management in South Asia. Department for
International Development. University of Newcastle. UK. Buhmann and Ervin (eds.). 2003. Trends in landscape modeling. Proceeding at Anhalt
University of Applied Sciences 2003. Wichmann Verlag, Heidelberg. Carley, M., and Christie, I. 1993. Managing sustainable development. Minneapolis. University
of Minnesota Press. USA. Chaffey, D. R. Miller, F. R., and Sandom, J. H. 1985. A forest inventory of the Sundarbans,
Bangladesh; Main report. Project report No. 140, Ovearseas Development Administration, London, UK.
Champion, H. G., and Khattak, G. M. 1965. Mannual of silviculture for Pakistan. Pakistan
Forest Institute. Peshawar, Pakistan. Chan, H. T. 1996. Mangrove reforestation in peninsular Malaysia: A Case study of matang. In:
Field, C. D. (ed.). Restoration of mangrove ecosystems. ISME. Okinawa. Japan Chan, H. T. Ong, J. E., Gong, W. K., and Sasekumar, A. 1993. The socio-economic,
ecological and environmental values of mangrove ecosystems in Malaysia and their present state of conservation. In: Clough, B. F. (ed.). The economic and environmental values of mangrove forests and their present state of conservation in the south-east Asia/Pacific region. ITTO/ISME/JIAM, Japan.
Chapman, V. J. 1975. Mangrove biogeography. In: Walsh, G., Snedaker, S. and Teas, H.
(eds.). Proceedings of the International symposium on biology and management on mangroves, 8-11 October, 1974, Honolulu. pp 3-22
Chapman, V. J. 1976. The salinity problem in general, its importance, and distribution with
special reference to natural halophytes. In: Poljakoff M. A., and Gale, J (eds.). Plants in saline environments. Springer Verlag Berlin. pp 7-23
Chaves, L. G. 2002. Tourism, recreation and eco-tourism management plan for the
Sundarbans reserve forest. An integrated management approach to ecotourism

References 140
development. Sundarbans Biodiversity Conservation Project Bangladesh. ADB: 1643 BAN (ARCADIS Euroconsult project no. 417.44631)
Christensen, B. 1984. Ecological aspects of the Sundarbans. FO: TCP/BGD/2309 (Mf). FAO,
Rome. Italy. Choudhury, A. M. Quadir, D. A., and Islam, J. 1990. Study of Chokaria Sundarbans using
remote sensing techniques. SPARRSO. Dhaka. Choudhury, K. Waliuzzaman, M., and Nishat, A. 2001. The Bangladesh Sundarbans A
Photoreal Sojourn. IUCN - the World Conservation Union, Bangladesh country office, Dhaka. pp VI, 145
Chowdhury, F. Ali, M. A., and Rahman, A. 2001. People’s report on Bangladesh environment
2001 - In search of a people’s perspective on environment in Bangladesh. Dhaka. Chowdhury, A. M. 1968. Working plan of the Sundarbans forest division for the period 1960 -
61 to 1979 - 80. East Pakistan Government Press. Dhaka. Choudhury, A. M. 1984. Integrated development of the Sundarbans, Bangladesh: Silvicultural
aspects of the Sundarbans FAO report No/ TCP /BGD/ 23 09 MO, W/ R003. Choudhury, A., and Chaudhury, A. B. 1994. Mangroves of the Sundarbans, Volume one:
India. IUCN-The World Conservation Union, Bangkok, Thailand. Chowdhury, S. H. 1995. Draft report on Entomology of the sundarbans reserve forest.
FAO/UNDP project. BGD/84/ 056. Integrated resource development of the Sundarbans Reserve Forest. Khulna.
Coleman, J. M. 1964. Bramahputra River: channel process and sedimentation. Sediment
Geology. 3 (2/3). pp 129-239 Colugh, B. F. 1985. Factors regulating mangrove ecosystem primary productivity.
Proceedings of the UNDP/ UNESCO regional project RAS/79/ 002 workshops on mangrove ecosystem dynamics, Papua New Guinea. pp 79-85
Curtis, S. J. 1933. Working plan for the forest of the Sundarbans division for the period from
April 1, 1931 to March 31, 1951. Vol.1, Bengal Government Press, Calcutta, India. Curry, J. M., and Mcguire, S. 2002. Community on land / Community, ecology, and the public
interest. Rowman & Littlefield Publishers, Maryland. USA. pp141-175 Das, S. 1980. Mangrove forest of Bangladesh (Management, exploitation and economics)
Paper presented at the 4th and 5th Annual Bangladesh Science Conference at Rajshahi University. Rajshahi. Bangladesh.

References 141
Das, S. C. 1989. Coastal marine pollution in Bangladesh. paper presented at the 5th Conference of the Bangladesh National Geographical Association, 2-5 March at Rajshahi. Bangladesh.
Das, S. C. 1992. Physical oceanography of the Bay of Bengal. In: Elahi, K. M., Sharif, A. H.
M. R., and Kalam, A. K. M. A. (eds.). Bangladesh: Geography, Environment and Development, Bangladesh National Geographical Association. Dhaka. pp 36-52
Davos, C. A. 1998. Sustaining co-operation for coastal sustainbility, Journal of environmental
management, 52. USA. pp 379-387 Dewan, A. M., and Nizamuddin, K. 1998. A Geographical analysis of salinity in the South-
western region of Bangladesh in Bhugal Patrika (Bengali), vol. 17, 1998, Dhaka. Dickinson, G., and Murphy, K. 1998. Ecosystems routledge introductions to environments
series. Routledge, London, UK. Dovers, S. 2005. Policy analysis, Environment and sustainability. In: Grafton, R. Q. Robin,
L., and Wasson, R. J. (eds.). Understanding the Environment Doody, J. P. 2000. Coastal conservation and management – an ecological perspective. Kluwer
Academic Publishers, London. UK. Drengson, A., and Taylor, D. (eds.). 1997. Ecoforestry – The art and sciences of sustainable
forest use. New society publishers. BC, Canada. Droste, B. V. Plachter, H., and Rössler, M. 1995. Cultural landscapes of universal value
Gustav Fischer-Verlag Jena, Stuttgart, Germany. Dugan, P., and Bellemy, D. 1993. Wetlands in danger - A world conservation Atlas. Oxford
University Press. New York. Duke, N. C. 1995. Genetic diversity, distributional barriers and raffing continents /more
thoughts on the evolution of mangroves - Hydrobiologia 295: 167/181. Australia Duke, N. C., Bell, A. M., Pederson, D. K., Roelfsema, C. M, Godson, L. M., Zahmel, K. N.
Mackenzie, J., and Bengston-Nash, S. 2004. Mackey mangrove dieback investigations in 2002 with recommendations for further research, monitoring and management, Centre for Marine Studies, UQ. Australia.
Dykyjova, D., and Ulehlova, B. 1998. The Production ecology of wetlands. In: Wetlake, D. F.
Kvet, J., and Szczepanski, A. (eds.). Mineral economy and cycling of minerals in wetlands. EGIS - (Environmental and Geographical Information Studies), 2000. Bangladesh Water
Development Board - Environmental baseline of Gorai river restoration project. (EGIS – I, EGIS – II, and EGIS – III). Environment and GIS support project for water sector planning, Ministry of Water Resources, Government of the Peoples Bangladesh. Dhaka.

References 142
ESCAP-(Economic and Social Co-operation for Asia and the Pacific), 1988. Coastal environmental management plan for Bangladesh. Vol. 2. Final: report. ESCAP, Bangkok, Thailand.
ESCAP-(Economic and Social Co-operation for Asia and the Pacific), 1999. Economic and
social commission for Asia and the Pacific - guidelines on integrated planning for sustainable tourism development. United Nations, New York.USA.
Elahi, K. M. Das, S. C., and Sultana, S. 1998. Geography of coastal environment: A study of
selected issues. In: Bayes, A., and Mahammad, A. (eds.). Bangladesh at 25, An analytical discourse on development. The university press limited, Dhaka, Bangladesh. pp 336-368
Erickson, P. A. 1994. A practical guide to environmental impact assessment. Academic Press,
London. UK. FAO, 1976. Water quality for agriculture, FAO irrigation project, Vol.3. Morphological
studies. Sir William Halcrow and Partners Ltd. Dhaka. FAO, 1994. Mangrove management guidelines. FAO, Rome, Italy. FAO / UNDP.1995. Project BGD/ 84/056- Integrated resource development of the Sundarbans
reserved forest. Report on mangrove silviculture, vol.1, by karim, A. Khulna. pp 16-19 FAP 4, 1993. South west area water resources management project, Vol.3. Morphological
studies. Sir William Halcrow and Partners Ltd. Fairbrother, N. 1974. The Nature of landscapes. Eelco Hoofman, Edinburg. UK Farina, A. 1998. Principles and methods in landscape ecology. London: Chapman & Hall. Farzana, N., and Nadia, M. 2001. Water disputes in South Asia.
www.issi.org.pk/strategic_studies_htm/2001 Faizuddin, M. Rahman, M. M. Shahidullah, M. Siddiq, H. U. A. Hasnin, M., and Rashid, M.
H. 1999. Plantation of golpata (Nypa fruticans) in the newly accreted sites of the Sundarbans mangrove forest of Bangladesh.
Forestal, 1960. Forestry inventory 1958-59 Sundarbans forest. Forestal International
Incorporated Canada. Folke, C. 1998. Ecosystem approaches to the management and allocation of critical resources.
In: Pace, M. L., and Groffman, P. M. (eds.). Successes, limitation, and frontiers in ecosystem science. Springer New York. pp 313 -338
Gesamp, 1996. The contributions of science to integrated coastal management. Report 61,
FAO, Rome. Italy.
References 143
Gleick, P. 1998. The world’s water. Island Press, Washington DC. USA Gibson, I. A. S. 1975. Report on a Visit to the People’s Republic of Bangladesh, 28 February
to 1st April and 13 to 17 April, (unpublished report) Overseas Development Administration, London.
Gnauck, A. 2006. Funktoren und signale- zur signalanalyse ökologischer prozesse. In:
Gnauck, A. (Hrsg.): Modellierung und simulation von ökosystemen. Workshop Kölpinsee 2004. Shaker Verlag, Aachen, Germany. pp 192-224
Gonzalo, C. 1998. Biodiversity conservation in the Sundarbans reserve forest. World Bank
technical report on 16th January, Dhaka. Gupta, H. P. 1981. Palaeonvironments during Holocene time in Bengal Basin, India as
reflected by Palynology. Palaeobotanist, 27(2), 138-159. Huq, S. Haider, R., and Rahman, A. A. (eds.). 1991. Cyclone ‘1991 - An environmental and
perceptional study. Bangladesh centre for advanced studies (BCAS), Dhaka, Bangladesh. Haque, M. I. 1996. Water Policy formulation and implementation in Bangladesh (eds.) by
Howsam, P., and Carter, R. 1996 – Water Policy: Allocation management in practice. E and FN SPON. London. UK. pp 13-20.
Hoque, M. M., and Alam, S. M. K. 1995. Post Farakka dry season surface and ground water
conditions in the Ganges and vicinity. In: Hasna, J. M. (ed.). Women for water sharing. Academic Publishers. Dhaka.
Hartung, F. Wevner, R, M. I. Alam, S. K. S. Khan, S. Paul, A. R., and Mahlback, H. P. 1998.
Association of phytopathogenic bacteria with top dying disease of Sundri tree (Heritiera fomes) in Bangladesh. Angewandte Botanik. pp 48-72
Hasan, M. Rahman, M. S., and Haider, M. Z. 2001. Some facts and observations related to
salinity and the river systems of the Sundarbans mangroves forest. Paper presented at the 1st national conference at University of Khulna, 14-16 February, Khulna. Bangladesh.
Hasna, J. M. (ed.). 1995. Women for Water Sharing. Academic Publishers. Dhaka. Hasna, J. M. Rashid, H., and Rahman, A. A. (eds.). 1998. Bangladesh coastal area resource
development and management. Executive summery and recommendations of the national workshop report I. CADMA, Dhaka.
Hassan, M. M. 2001. Water and soil quality of Sundarbans. Paper presented at 1st national
conference on the Sundarbans at University of Khulna, 14-16 February, Khulna. Hawley, A. H. 1986. Human ecology – a theoretical essay. The University of Chicago Press.
Chicago. USA

References 144
Head, L. (ed.). 2000. Cultural landscapes and environmental Change. ARNOLD. Oxford University Press Inc. New York.
Heining, R. L. 1892. Working plan of the Sundarbans Government forest, Khulna and 24 –
Pargana Districts, Bengal, and Calcutta. Bengal Secretariat Press. India. Helalsiddiqi, A. S. M. 1999. Minor forest products in the Sundarbans of Bangladesh. Journal
of non-timber forest products. 6 (1 and 2). Dhaka Holmgren, S. 1994. An environmental Assessment of the Bay of Bengal region. BOBP / REP /
67. SWEDMAR/ BOBP Hossain, T. M. Paul. Z. H. Khan, A. T. M. Alam, M. L. Islam, and Azad, A. K. M. 2001.
Salinity trends in the Sundarbans and its vegetation. In: Siddiqi, N. A., and Baksha, M. W. (eds.) Mangrove research and development. Proceeding of national workshop. 15-16 May, Chittagong. Bangladesh.
Hutchings, P., and Saenger, P. 1987. Ecology of mangroves. University of Queensland Press.
Queensland, Australia. Huq, S. Karim, Z. Asaduzzaman, M., and Mahtab, F. (eds.). 1999. Vulnerability and
adaptation to climate change for Bangladesh. Kluwer Academic Publishers, London. Hussain, Z., and Acharya, G. (eds.). 1994. Mangroves of the Sundarbans, Volume Two:
Bangladesh. IUCN – The World Conservation Union. Dyna Print, Bangkok, Thailand. Huybers, T. Bennett, J., and Elgar, E. (eds.). 2003. Environmental management and the
competitiveness of nature-Based tourism destinations. Edward Elgar Publishing. UK. Iftekhar, S. M., and Islam, R. M. 2002. Vegetation dynamics in the Sundarbans and its
implication on the integrated coastal zone management of Bangladesh. Dhaka Ingegnoli, V. 2002. Landscape ecology: a widening foundation. Springer-Verlag Berlin. Islam, M. A. 1995. Environment land use and natural hazards in Bangladesh. Dhaka
University. Dhanshish Mudrayan, New market area. Dhaka. Islam, M. S. 2001. Sea-level changes in Bangladesh: the last ten thousand years. Asiatic
Society of Bangladesh, Asiatic Civil Military Press, Dhaka. Islam, S. N. 2002. Sustainable Eco-tourism as a practicable site management policy? A case
study on the Sundarbans natural world heritage site in Bangladesh. Master’s Thesis at the International study course- World Heritage Studies, Brandenburg University of Technology at Cottbus, Germany.
Islam, S. N. 2003. Sustainable Eco-tourism as a practical site management policy. AHDPH, Dhaka, Bangladesh.

References 145
Islam, S. N. 2005a. Cultural landscapes changing and threats to ecosystems: A case study on the Sundarbans for a management plan. In: Gnauck, A. (ed.). Modelling and Simulation on Ecosystems. Shaker- Verlag, Aachen. Germany. pp 190-2004
Islam, S. N. Engelberth, S. E., and Rina, A. S. 2005b. Cultural Integrity as a Criterion of SEA.
In: Schmidt, M., Elsa, J., and Albrecht, E. (eds.) Implementing strategic environmental Assessment. Springer –Verlag, Heidelberg, Germany. pp 409 - 420.
IUCN, 1992. People, development and environment complex interlinkages in Bangladesh.
Proceedings of a national symposium held in 3-4 November. Dhaka. Bangladesh. IWM- (Institute of Water Management), 2003. Sundarbans Biodiversity Conservation Project
- Surface water modelling TA No. 3158-BAN. Final report. Volume 1. IWM, Dhaka. Bangladesh.
Jabber, M. A. 1992. A draft report on special study on pattern of erosion and accretion of land
in the coastal belt of Bangladesh using satellite imagery and Aerial photographs. APARRSO, Dhaka.
Jabbar, M. A. 1995. Farakka Barrage and its impact on the environment of Southwest region
of Bangladesh. In: Hasna, J. M. (ed.). Women for water sharing. Academic Publisher. Dhaka, Bangladesh.
Jenderedjian, K. K. 2004. Arax wetland and perspectives of transboundary conservation in
south Caucasus region – contribution to the conference on integrated water management of transboundary catchment: a contribution from transact. Venice. Italy
Jörgensen, S. E., and Muller, F. (eds.). 2000. Handbook of ecosystem theories and
management. Lewis publishers, Washington D.C. Joseph, P. S. 2006. The environmental management doe better supply of fresh in
transboundary river: The Ganges could run dry. In: Perez, J. G. (ed.). Proceedings of III international symposium on Transboundary Waters Management- Overcoming water management boundaries. Universidad de Castilla-La Mancha. 30 May-2 June, Ciudad Real, Spain.
Katebi, M. N. A. 2001. Sundarbans and Forestry. In: Haider (ed.). Cyclone ’91 – an
environmental and perceptional study. BCAS. Dhaka. pp 79-100 Karim, A. 1988. Environmental factors and distributions of Mangroves in Sundarbans with
special reference to Heritiera fomes Buch.Ham. PhD thesis at University of Calcutta. India. Karim, A. 1995. Mangrove cilviculture, vol. 1. Draft report of FAO/ UNDP project
BGD/84/056-integrated resource development of the Sundarbans reserve forest, Khulna. Kay, R., and Alder, J. 1999. Coastal planning and management. E & FN SPON – An Imprint
of Routledge, London.
References 146
Khan, M. A. R. 1986. Wildlife of Bangladesh mangrove ecosystems. Journal of Bombay natural historical sciences. Bombay. India.
Khan, M. S., and Shafi, M. 1992. Use of Korea trees with branches, tops, bark and Keora
thinning for hardboard manufacture. Brangladesh Journal of Forest Science. Chittagong Khan, A. A. 1993. Freshwater wetlands in Bangladesh: Opportunities and options. In: Nishat,
A. Hussain, Z. Roy, M. K., and Karim, A. (eds.) Freshwater wetlands in Bangladesh –Issues and approaches for Management. IUCN, Dhaka.
Khan, A. H. 1995. Ganges Water Sharing: An overview. In: Hasna, J. M. (ed.). Women for
Water Sharing. Academic Publishers. Dhaka. pp 1-33 Khan, M. S. Haq, E. Huq, S. Rahman, A. A. Rashid, S. M. A., and Ahmed, H. (eds.). 1994.
Wetlands of Bangladesh. BCAS, Dhaka. Bangladesh. Lacerda, L. D. D. (ed.). 2001. Mangrove ecosystems, function and management. Springer-
Verlag Berlin, Germany. MAB-(Man and Biosphere) UNESCO, 1975. Ecological effects of human activities on the
value and resources of lakes. Marshes, rivers, Deltas and coastal zones. UNESCO-Paris. Mafizuddin, M., and Ali, M. M. 1993. Alluvial characteristics of the changes floodplain. In:
Arephin, S. (ed.). The Journal of the Bangladesh National Geographical Association (BNGA). Vol. 19 Nos 1 and 2, 1991, Department of Geography, Jahangirnagar University, Savar, Dhaka. pp 1-12
Meining, D. 1979. Interpretations of the ordinary landscape. N.Y: Oxford University Press.
USA Mepham, R. H. 1983. Mangrove floras of the Southern continents South Africa. Journal of
Botany. pp 2: 1-8. MPO - (Master Plan Organisation), 1986. Coastal shrimp aquaculture resources, Technical
paper 18. BWDB/MPO, Dhaka MPO - (Master Plan Organisation), 1987. Surface water availability. Technical report No. 10.
MPO, Dhaka. MAP, 2000. Technical report - fisheries and flood control drainage and irrigation
development. Dhaka, Bangladesh Murtuza, G. 2001. Socio-economic condition of the people living around the Sundarbans
forest area and their opinions on forest resources conservation- a study on Koyra Upazila, Khulna Zila. Paper presented at the 1st national conference on the Sundarbans at University of Khulna, 14-16 February, Khulna.

References 147
Muniruzzaman, M. 2003. Hydro-politics of the Farakka Barrage. www.sdnpbd.org/river-basin/bangla
Mitsch, W. J., and Gosselink, J. G. 2000. Wetlands 3rd Edition. John Wiley & Sons, Inc. New
York. USA. p 1-106, 335-373 Milliman, J. D. Broadus, J. M., and Gable, F. 1989. Environmental and economic implecation
of rising sea level and subsiding deltas. The Nile and Bengal examples. Ambio. 18(6). pp- 340-365
Mirza, M. Q. M. 1998. Diversion of the Ganges water at Farakka and its effects on salinity in
Bangladesh. Environmental management Vol. 22. No.5. Springer–Verlag. New York. pp 711-722.
MoEF-(Ministry of Environment and Forest), 1994. Vulnerability of Bangladesh to climate
change and sea level rise. Summary Report- 1994. Concepts and tools for calculating risk in integrated coastal zone management. Government of the People’s Republic of Bangladesh, Dhaka.
MoFL- (Ministry of Fisheries and Livestock), 2002. Balancing resource conservation with
livelihood protection for shrimp fry collections: an integrated approach to managing coastal resources. Department of Fisheries and Livestock, Dhaka, Bangladesh. pp 1-14
MoFL-(Ministry of Fisheries and Livestock), 2002. Shrimp aquaculture in Bangladesh - A
vision for the future, Department of Fisheries Ministry of Fisheries and Livestock. October 2002. Dhaka, Bangladesh. pp 1-7
MoWR-(Ministry of Water Resources), 2000. Land use conflicts arising from shrimp and
prawn cultivation Shrimp culture costs and returns National Water Management Plan Project, Water Resource Planning Organisation, Government of the Peoples Republic of Bangladesh, Draft development strategy volume no. 8. Annex J. Economics. Helcrow Mott Macdonald Consultants.
Mondal, M. K. 1992. An Approach to increase land productivity in the coastal region.
Proceedings of the workshop on coastal zone management in Bangladesh. National commission for UNESCO. Dhaka.
Morley, R. J. 2000. Origin and evolution of tropical rain forests. John Willy & Sons Ltd. New
York, USA. pp 1- 43. Naveh, Z. 1995. Conservation, restoration and research priorities for Mediterranean uplands
threatened by global climate change (eds.). Moreno and Oechel – Global change and Mediterranean type ecosystems. Springer-Verlag Berlin.
Nishat, A. 1993. Freshwater wetlands in Bangladesh: Status and Issues. In: Nishat, A.
Hussain, Z. Roy, M. K., and Karim, A. (eds.). Freshwater wetlands in Bangladesh- issues and approaches for management. IUCN. pp 1-22.

References 148
Nishat, A. 2006. Water at Farakka Barrage in 2006. www.ajkekagoj.com/2006/April 08/ Novak, J. D. 2001. Assessing understanding in biology. Journal of biological education 35 (3). ODA - (Overseas Development Authority), 1985. A forest preventory of the Sundarbans,
Bangladesh. (Main report). Overseas Development Administration. England. Parikh, J., and Datye, H. (eds.). 2003. Sustainable management of wetlands biodiversity and
beyond. Sage publishers. New Delhi, India. Partidario, M. R., and Clark, R. (eds.). 2000. Perspectives on strategic environmental
assessment Lewis Publishers. New York. pp 2-16 Perry, J., and Vanderklein, E. 1992. Water quality – management of a natural resource.
Blackwell Science, Inc. Capital City Press. Massachusetts. USA. Pickett, S. T. A., and Mary, L. C. 2005. Vegetation dynamics. In: Eddy (ed.). Vegetation
ecology. Blackwell Publishing. USA. pp 172-195 Philip, G. 1999. A reoprt on the Chokoria Sundarbans, a forest without trees. RUPANTAR
October /99 issue, Khulna. Bangladesh. Quazi, S. Mujieri, M. K., and Sajjad, Z. 1992. Land and water use in the rural setting in
Bangladesh: Ipmact on the, People, Development and environment complex interlinkages in Bangladesh. IUCN, Dhaka. pp 45-55
Rahman, A. A. Saleemul, I. H., and Conway, G. R. (eds.). 1990. Environmental aspects of
surface water systems of Bangladesh. University press. Dhaka, Bangladesh. Rahman, M. A. 1990. A comprehensive report on Sundri (Heritiera fomes) trees with
particular reference to top dying in the Sundarbans. In: Rahman, M. A., Khandakar, K., Ahmed, F. U., and Ali, M. O. (eds.). Proceedings of the seminar on top dying of Heritiera fomes trees held on 11 August. 1988. BARC, Dhaka. pp 12-63
Rahman, M. A. 1995. Integrated resources development of the Sundarbans reserved forest –
Bangladesh- Mangrove plant pathology of the Sundarbans reserve forest in Bangladesh, UNDP, FAO, BGD/84/056 Field document 3 , UNDP and FAO, Khulna.
Rahman, A. 1995. Shrimp culture and environment in the coastal region. BIDS. Dhaka,
Bangladesh Rahman, A. (ed.). 2003. Paribesh patra (Bengali) development magazine, issue 3, 4 October-
December 2002 and January-March 2003. Unnayan Shamunnay, Dhaka, Ministry of Environment and forest and UNDP.
References 149
Rahman, A., and Chowdhury, F. (eds.). 2001. ECOFile periodical on life and nature. The Sundarbans a dismal picture. Vol. IV no .4 January-March. A Shamunnay publication, supported by UNDP under SEMP. Dhaka.
Rahman, M., and Petersen, L. (eds.). 2001. Soil resources in Bangladesh: Assessment and Utilisation. Proceedings of the annual workshop on soil resources, 14-14 February. Soil Resources Development Institute (SRDI), Prokash Mudrayan, Dhaka.
Rahman, M. A. 2001. Top dying of Sundri (Heritiera fomes) trees in the Sundarbans; Extent
of damage. Paper presented at the 1st national conference on the Sundarbans at university of Khulna, 14 -16 February, Khulna.
Rahman, A. 2001. Diseases and disorders of tree species in the Sundarbans and their
management. In: Siddiqi, and Baksha (eds.). Proceedings of the national workshop on mangrove research and development in Bangladesh. BFRI, Chittagong. pp 86-97
Ramsar Bureau, 2005. The world heritage convention, cultural landscapes and wetlands – The
Ramsar bureau convension of wetlands website: http:// www.ramsar.org /2005 Rashid, S. M. A. Khan, A., and Akanda, A, W. 1994. Fauna. In: Hussain, Z. Acharya, G.
(eds.). Mangrove of the Sundarbans. IUCN, Bangkok. pp 115-132 Razaque, A. 1981. Study on hydrolic conductivity and dispersion of clay collides in columns.
PhD thesis at Ghent University, Belgium. Rob, A. 1997. The endangered Sundarbans: Studies in mangroves environment. The weekly
Independent, 20th June 1997. Dhaka. pp 5-7 Rössler, M. 2000. Landscape stewardship: new directions in conservation of nature and
culture, world heritage cultural landscapes – The George Wright FORUM, Volume 17. No. 1, 2000. Paris, France.
Rull, V. 1998. Evalucion de los manglares neotropicales: La crisis del ecoceno. Interciencia
23: 355/362 Sharafuddin, A. M. 1992. Awareness and public participation in wetland management.
National workshop on conservation and sustainable management of freshwater wetland in Bangladesh, Dhaka: GOB, CIDA and IUCN, 9-11 December.
Saha, S. K, Datta, D. K., and Rahman, M. S. 2001. Origin of the Sundarbans: A
bioclimatological study. Paper presented at the 1st national conference at University of Khulna, 14-16 February, Khulna.
Sakamoto, M. Hagihara, Y., and Hoque, B. A. 2001. Time Series Model analysis of the
conflict over the Ganges water resources between Bangladesh and India. Graduate School of Civil Engineering Systems. Kyoto University. Japan.
References 150
Salar, A. Haq, E. Atik, R. Rashid, S., and Ahmed, H. (eds.). 1994. Wetlands of Bangladesh. Bangladesh Centre for Advance Studies and Nature Conservation Movement. Dhaka.
Salomons, W. (ed.). 1999. Perspectives on integrated coastal zone management, Springer-
Verlag Berlin, Germany. Salter, R. E. 1987. Status and utilisation of wildlife: Food and Agricultural Organisation,
Rome, Italy. Sarker, S. U. 1992. Ecology of wildlife. UNDP/FAO/BGD/ (5/011. Field document No. 50.
IFCU. Seidensticker, J., and Hai, M. A. 1983. The Sundarbans wildlife management plan,
conservation in the Bangladesh coastal zone. IUCN, Gland. Switzerland. Semeniuk, V. 1983. Mangrove distribution in north Western Australia in relationship to
regional and local freshwater seepage. Vegetation, 53: pp11-31 Sharmila, D. 1989. Environmental Character and Planning Prospect of Sundarbans. In: Jafar,
R. K. (ed.). Journal of the Bangladesh National Geographical Association. Department of Geography. JU, Savar, Dhaka. Vol. 17 Nos. 1 & 2. pp 13-25
Siddiqi, N. A. 1992. Regeneration status and influence of animals on regeneration in the
Sundarbans mangrove forests. PhD thesis, Department of Zoology, University of Dhaka. Siddiqi, N. A. 1994. The importance of mangroves to the people in the coastal areas of
Bangladesh. Proceedings VII Pacific Science International Congress, Mangrove Session organised by International Society for Mangrove Ecosystems (ISME), Okinawa, 1-2 July 1993, Japan.
Siddiqi, N. A. 2001. Mangrove forestry in Bangladesh. Institute of Forestry and
Environmental Sciences, University of Chittagong. Nibedon Press Limited, Chittagong. Siddiqi, N. A. 2001a. Mangroves of Bangladesh Sundarbans and Accretion Areas. In: Lecerda,
D. D. L. (ed.). Mangrove ecosystems function and management. Springer-Verlag Berlin. pp 142- 258- 292
Siddiqi, N. A., Islam, M. R., and Khan, M. A. S. 1989. Effect of salinity on germination
success in Keora (Sonneratia apetala Buch-Ham) Seeds. Bano Biggyan Patrika. Chittagong, Bangladesh 18. pp 9-63.
Siddiqi, N. A., and Das, S. 2000. The Mangroves and mangrove forests of Bangladesh.
Mangrove silviculture division bulletin 2. Bangladesh Forest Research Institute. Chittagong.

References 151
Siddiqi, N. A., and Baksha, M. W. (eds.). 2001. Mangrove research and development. Proceedings of the National workshop on Mangrove Research and Development at Bangladesh forest Reserach Institute, 15-16 May, Chittagong.
Sobhan, A. 1973. Report on the preliminary investigation of probable causes of top-dying of
Sundri trees in the Sundarbans, unpublished report - Soil science division, BFRI, Chittagong, Bangladesh.
SRDI-(Soil Resource Development Institute), 2000. Soil salinity in Bangladesh. Soil Resource
Development Institution, Farmgate, Dhaka, Bangladesh. SBCP- (Sundarbans Biodiversity Conservation Project), 1997. Biodiversity Conservation in
the Sundarbans Reserve Forest. ADB, PPTA No. 2724-BAN. Mid-term options report. Anzdel limited/ Eusuf and Associated. Dhaka.
SBCP-(Sundarbans Biodiversity Conservation Project), 2000. Sundarbans Biodiversity
Conservation Project. Inception report Vol. 1, Project report no. 2 ADB: BAN 1643/3158. June 2000 ADB, GEF and the Netherlands Government.
Smith, R. L., and Smith, T. M. (eds.). 2003. Elements of ecology 5th edition. Benjamin
Cummings, New York. PP-397 –594 Tilley, C. 1994. Places, Paths and monuments - A phenomenology of landscape. Oxford -
Providence, USA. Tomlinson, B. P. 1986. The botany of mangrove. Cambridge University Press. London. UK Turner, M. I. 2001. The ecology of trees in the tropical rain forest. Cambridge University
Press. UK. Turner, R. K. Batemar, I. J., and Adger, W. N. (eds.). 2001. Economics of coastal and water
resources: Valuing environmental functions. Studies in ecological economics volume 3. Kluwer Academic Publisher, The Netherlands. pp 1-43
Umitsu, M. 1997. Landforms and floods in the Ganges delta and coastal lowland of
Bangladesh, Marine Geodesy. 20 (1). pp 76 –87 UNDP, 2000. Participatory rural appraisal - practical handbook-Thana cereal technology
transfer and identification project. (GOB/ UNDP/FAO project: BGD/89/045) Government of the People’s Republic of Bangladesh. Ministry of Agriculture, Department Agricultural Extension. Dhaka.
UNESCO, 1962. Recommendation concerning the safeguarding of the beauty and character of
landscapes and sites. Paris. France UNESCO, 1992. Workshop on coastal zone management in Bangladesh. 27-31 December.
Bangladesh National Commisstion for the UNESCO. Dhaka

References 152
UNESCO, 1999. Operational guidelines for the implementation of the World Heritage Convention. World Heritage Centre. UNESCO, Paris. France
UNESCO, 2001. Properties inscribed on the world heritage list-UNESCO 1972 convention
concerning the protection of the world centre, Paris. France. Vogt, K. A. Gordon, J. C. Wargo, J. P. Vogt, D. J. Heidi, A. Peter, A. P. Clark, H. J. Hara, J.
L. O. Keaton, W. S. Weznand, T. P., and Witten, E. (eds.). 1996. Ecosystems- Balancing Science with Management. Springer, New Haven, USA.
Wahid, S. M. 1995. Hydrological study of the Sundarbans. UNDP/FAO project BGD/84/056,
Department of Forest, and Dhaka, Bangladesh. pp 16-34 White, I. 2005. Hydrology. In: Grafton, R. Q. Robin, L., and Wasson, R. (eds.). Understanding
the environment - bridging the disciplinary divides. UNSW Press and CAER, Sydney. Australia.
WTO - (World Tourism Organisation), 2002. The economic impact of tourism in the islands
of Asia and the pacific. A report on the WTO international conference on Tourism and island economics 13-15 June. WTO, Madrid, Spain.
Water and conflict in Asia/1999 http:// www.apcss.org/Report_water% 26 conflict_99.html. Wijmstra, F. A. 1969. Palynology of the Alliance well. Geol Mijnbouw 48: 125 -133 Zube, E, H. 1986. Landscape values: History, concepts and applications. In: Smardon,
Palmer., and Felleman (eds.). Foundations for Visual project analysis. John Wilay + Sons, New York. pp 4-19

153
Appendix 1 World Mangroves Distribution in km²
The total area of the world mangroves are 181,327 km2 until 1997. According to the region
Mangrove classification can be categorised into 6 regions such as Asia excluding Middle East
75,172.8 km2, Central America and Caribbean- 22,759.5 km2, Middle East and Africa 1,492.0
km2, North America 1,990.0 km2, South America 24,084.0 km2 Sub-Saharan Africa 36,512.3
km2 and developing countries 167,006.6 km2.
Name of the Country Area in km2 Name of the Country Area in km2
1. Angola - AGO 1,250 20. Congo, Dem. Rep. 226
2. Antigua and Barbuda 13.2 21. Costa Rica 370
3. Aruba- ABW 4.2 22. Cöte d‘ Ivore 644
4. Australia 11,500 23. Cuba 7,848
5. Bahamas 2,332 24. Djibouti 10
6. Bahrain 1 25. Dominica 1.6
7. Bangladesh 6017 26. Dominica Rep. 325
8. Barbados - BRB 0.1 27. Ecuador 2,469
9. Belize -BLZ 719 28. Egypt 861
10. Benin- BEN 17 29. El Salvador 268
11. Bermuda- BMU 0.1 30. Equatorial Guinea 277
12. Brazil 13,400 31. Fiji 385
13. Brunei Darussalam 171 32. French Guiana 55
14. Cambodia 851 33. Gabon 2,500
15. Cameroon 2,494 34. Gambia 497
16. China 366 35. Ghana 100
17. Colombia 3,659 36. Grenada 2.4
18. Comoros 26.2 37. Guadeloupe-GLP 39.8
19. Congo 120 38. Guatemala 161
39. Guinea 2,963 70. Philippines 1,607
40. Guinea -Bissau 2,484 71. Puerto Rico- PRI 92

154
41. Guyana 800 72. Qatar 5.0
42. Haiti 134 73. Samoa- WSM 7
43. Honduras 1,454 74. Saudi Arabia 292
44. Hong-Kong 2.8 75. Senegal 1,853
45. India 6,700 76. Seychelles -SYC 29
46. Indonesia 42,550 77. Sierra Leone 1,838
47. Iran 207 78. Singapore 6
48. Jamaica 106 79. Solomon Islands 642
49. Japan 4 80. Somalia 910
50. Kenya 530 81. South Africa 11
51. Liberia 190 82. Sri Lanka 89
52. Madagascar 3,403 83. St. Lucia - LCA 1.3
53. Malaysia 6,424 84.St.Vincent Grenadines 0.5
54. Martinique -MTQ 15.9 85. Sudan 937
55. Mauritania 1 86. Suriname 1,150
56. Mexico 5,315 87. Tanzania 1,155
57. Micronesia, Fed States 86 88. Thailand 2,641
58. Mozambique 925 89. Togo- TGO 26
59. Myanmar 3,786 90. Tonga - TON 10
60. Netherlands Antilles 11.4 91. Trinidad & Tobago 70
61. Caledonia - NCL 456 92. UAE 30
62. New Zealand 287 93. United States 1,990
63. Nicaragua 1,718 94. Vanuatu - VUT 16
64. Nigeria 10,515 95. Venezuela 2,500
65. Oman 20 96. Viet Nam 2,525
66. Pakistan 1,683 96. Virgin Islands 9.8
67. Panama 1,814 97. Yemen 81
68. Papua New Guinea 5,399 Total 181,327
69. Peru 51
Source: Man, land and sea-coastal resource use and management in Asia and the Pacific, 1992

155
Appendix 2
Mangrove Species (Trees, shrubs and herbs) in the Sundarbans in Bangladesh
Scientific Name Family Vernacular Name Type of Plant 1. Acanthus ilicifolius Acanthaceae Hargoza Scrambling, thomy herb
2. Acrostichum aureum Pteridiaceae Tiger fern/ Udoban Gregarious fern
3. Agaialitis rotundifolia Plumbaginaceae Dhalchaka Small tree
4. Aegiceras corniculatum Myrsinaceae Khalisha, khalshi Shrub
5. Amoora cucullata Meliaceae Amur Small tree
6. Avicennia alba/marina Avicenniaceae Morcha baen/sada baen Small tree
7. Avicennia officinalis Avicenniaceae Baen Tree
8. Barringtonia racemosa Barringtoniaceae Kumb, Kumba Small tree
9. Blumea species Compositae Bari a gash, bongash Aromatic herb
10. Brownlowia tersa Tiliaceae Lota Sundri Scandent shrub
11. Bruguiera gymnorrhiza Rhizophoraceae Kankra Tree
12. Caesalpinia crista Leguminosae Kutum katta Armed shrub
13. Cerbera manghas Apocynaceae Dagor Small tree
14. Ceriops decandra Rhizophoraceae Goran Shrub or small tree
15. Clerodendrum inerme Verbenaceae Sitka , sitki Scandent shrub
16. Cynometra ramiflora Leguminosae Shingra Shrub
17.Cyperus javanicus Cyperacea Kucha, Kusha Grass
18. Dalbergia candenatensis Leguminosae Chanda lota Scrambling climber
19. Dalbergia spinosa Leguminosae Chanda katta Scandent, armed shrub
20. Dendrophthoe falcata Loranthaceae Porgassa Parasite in tree crowns
21. Derris trifoliata Leguminosae Gila lota, Kali lota Climber
22. Diospyros peregrina Ebenaceae Gaeb Tree
23. Drypetes species Euphorbiaceae Achet Scandent shrub
24. Eriochloa procera Gramineae Nolgash Grass
25. Eugenia fruticosa Myrtaceae Ban jam, jam gach Small tree
26. Excoecaria agallocha Euphorbiaceae Gewa Tree
27. Excoecaria indica Euphorbiaceae Batla, batul Small tree
28. Ficus Species Moraceae Jir Tree with aerial roots
29. Flagellaria indica Flagellariaceae Abetaa Climber
30. Flueggia virosa Euphorbiaceae Sitka, sitki Scandent shrub
31. Heritiera fomes Sterculiaceae Sundri Tree
32. Hibiscus tiliaceous Malvaceae Bhola Shrub

156
33. Hoya species Asclepiadaceae Agusha Climber
34. Imperata cylindrica Gramineae Grass
35. Intsia bijuga Leguminosae Bhaela, Bharal Small tree
36. Ipomoea pes-caprae Convulvulaceae Succulent, herb
37. Ixora species Rubiaceae Bon bakul Small tree
38. Kandelia candel Rhiyophoraceae Gura, guae, gural Small tree
39. Leea aequta Leeaceae Shurb
40. Lepisanthes rubiginosa sapindaceae Bon lichu Tree
41. Lap.Nov. aff. rubiginosa sapidaceae Shrub
42. Lumnitzera racemosa Combretaceae Kirpa, Kripa Small tree
43.Macrosolen cochinchinensis Loranthaceae Poragassa Parasite in tree crowns
44. Mallotus repandus Euphorbiaceae Bon notoy Scandent shrub
45. Macuna gigantea leguminosae Doyal Climber
46. Myriostachya wightiana Gramineae Dhanshi Grass, new accretions
47. Nypa fruticans Plamae Golpata Plam , underground stem
48. Pandanus foetidus Pandanaceae Kewa Katta Prickly succulent screw
49. Petunga roxburghii Rubiaceae Narikili Small tree
50. Phoenix paludosa Palmae Hantal Thorny palm
51. Phragmites Karka Gramieae Nol kagra Grass
52. Pongamia Pinnata Leguminosae Karanj, Karanja Small tree
53. Premna corymbosa Verbenaceae Serpoli, setpoli Shrub or small tree
54. Rhizophora mucronata Rhizophoraceae Garjan, Jhanna Tree with stilt roots
55. Salacia chinensis Calastraceae Choyt barai Small tree
56. Sarcolobus globosus Asclcpiadaceae Bowali lota Climber
57. Sonneratia caseolaris Sonneratiaceae Choyla, ora, soyla Small tree
58. Sonneratia apetala Sonneratiaceae keora Tree
59. Stenochlaena palustris Blechnaceae Deki lota Climbing fern
60. Tamarix indica Tamaricaceae Jhao, nonajhao Small tree
61.Tetrastigma bracteolatum Vitidiaceae Golgoti lota Climber
62. Thunbergia species Thunbergiaceae Jermani lota Climber
63. Viscum monoicum Loranthaceae Shamu lota Woody parasite in tree
64. Xylocarpus granatum Meliaceae Dhundul Small tree
65. Xylocarpus mekongensis Meliaceae Passur Tree
Source: Chaffey and Sandom, 1985; Siddiqi 2001, pp 36-37
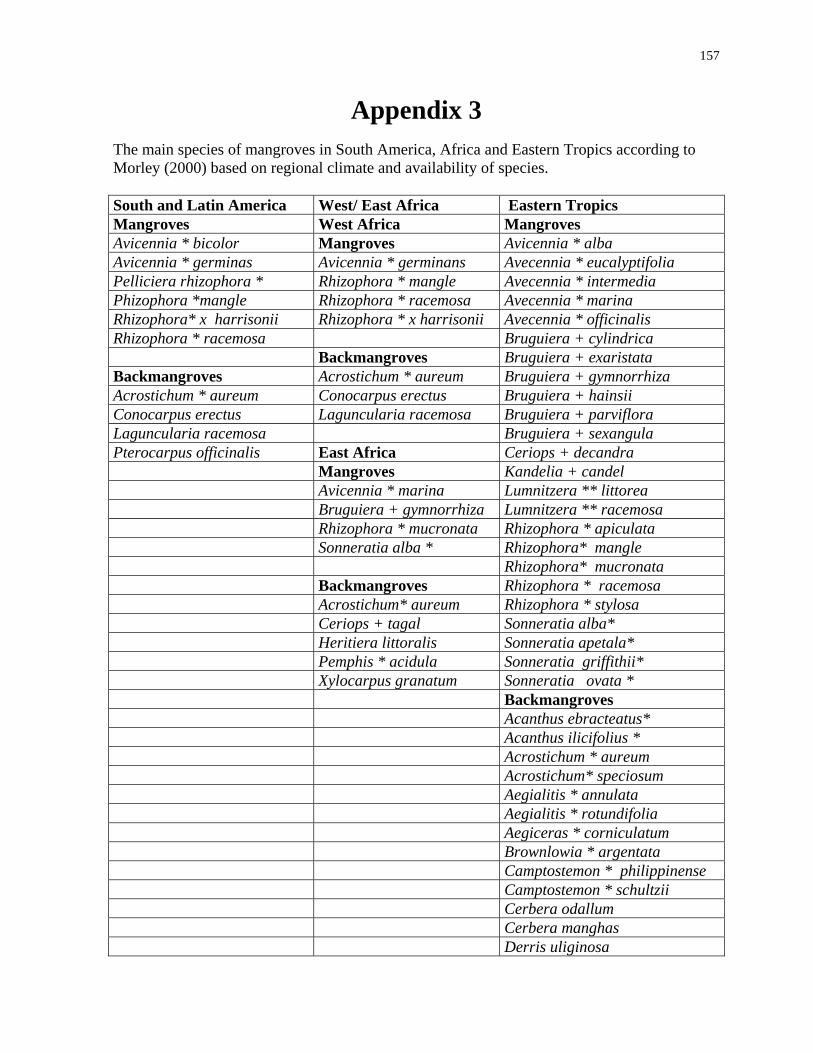
157
Appendix 3 The main species of mangroves in South America, Africa and Eastern Tropics according to Morley (2000) based on regional climate and availability of species. South and Latin America West/ East Africa Eastern Tropics Mangroves West Africa Mangroves Avicennia * bicolor Mangroves Avicennia * alba Avicennia * germinas Avicennia * germinans Avecennia * eucalyptifolia Pelliciera rhizophora * Rhizophora * mangle Avecennia * intermedia Phizophora *mangle Rhizophora * racemosa Avecennia * marina Rhizophora* x harrisonii Rhizophora * x harrisonii Avecennia * officinalis Rhizophora * racemosa Bruguiera + cylindrica Backmangroves Bruguiera + exaristata Backmangroves Acrostichum * aureum Bruguiera + gymnorrhiza Acrostichum * aureum Conocarpus erectus Bruguiera + hainsii Conocarpus erectus Laguncularia racemosa Bruguiera + parviflora Laguncularia racemosa Bruguiera + sexangula Pterocarpus officinalis East Africa Ceriops + decandra Mangroves Kandelia + candel Avicennia * marina Lumnitzera ** littorea Bruguiera + gymnorrhiza Lumnitzera ** racemosa Rhizophora * mucronata Rhizophora * apiculata Sonneratia alba * Rhizophora* mangle Rhizophora* mucronata Backmangroves Rhizophora * racemosa Acrostichum* aureum Rhizophora * stylosa Ceriops + tagal Sonneratia alba* Heritiera littoralis Sonneratia apetala* Pemphis * acidula Sonneratia griffithii* Xylocarpus granatum Sonneratia ovata * Backmangroves Acanthus ebracteatus* Acanthus ilicifolius * Acrostichum * aureum Acrostichum* speciosum Aegialitis * annulata Aegialitis * rotundifolia Aegiceras * corniculatum Brownlowia * argentata Camptostemon * philippinense Camptostemon * schultzii Cerbera odallum Cerbera manghas Derris uliginosa

158
Excoecaria *agallocha Ficus* retusa Heritiera * littoralis Hibicus* tiliaceus Intsia * bijuga Nypa fruticans* Oncosperma * filamentosa Osbornia octodonta Scyphiphora hydrophyllacea Sonneratia caseolaris* Thespesia populnea* Xylocarpus granatum Xylocarpus mekongensis Source: Morley, 2000, pp 22-23 Note: The main species of mangroves in South America, Africa and the Eastern tropics, with
an indication (*) as to the occurrence of their pollen in the fossil record. The pollen of genera
of Rhizophoraceae (marked +) is very similar to the Rhizophora; pollen of Lunmnitzera
(marked **) is similar to many other combretaceae, and also Melastromataceae. The position
of the asterisk indicates whether pollen determination is at the generic or specific level.

159
Appendix 4 The important mangrove wildlife species in the Sundarbans mangrove forest in Bangladesh
Amphibians family Common Name Scientific Name Bufonidae Common Toad Bufo melanostictus
Microphylidae Ornate Microhylid Microhyla ornata
Skipper Frog Euphlyctis cyanophlyctis
Green Frog Euphlyctis hexadactylus
Bull Frog Hoplobatrachus tigerinus
Cricket Frog Limnonectes limnocharis
Ranidae
Boulenger’s Frog Rana alticola
Rhacophoridae Common Indian Tree Frog Polypedates maculatus
Reptiles family
Agamidae Garden Lizard Calotes jerdoni
Common House Lizard Hemidactylus frenatus / flaviviridis
House Lizard Hemidactylus brookii
Gekkonidae
Wall Lizard Gekko gecko
Bengal Monitor Varanus bengalensis
Yellow Monitor Vranus flavescens
Varanidae
Ring Lizard Varanus salvator
Scincida Common Skink Mabuya carinata
Olive Ridley turtle Lepidochelys olivacea
Green Turtile Chelonia mydas
Loggerhead Turtle Caretta caretta
Cheloniidae
Hawksbill turtle Eretmochelys imbricata
Spotted Flapshell Turtle Lissemys punctata
Ganges Softshell Turtle Aspideretes gangeticus
Asiatic Softshell Turtle Chitrra indica
Peacock Softshell Turtle Aspideretes hurum
Trionychidae
Bibron’s Softshell Turtle Pelochelys bibroni
Indian Roofed Turtle Kachuga tecta
River Terrapin Batagur baska
Yellow turtle Morenia petersi
Bataguridae
Three-keeled Land tortoise Melanochelys tricarinata
King Cobra Ophiophagus hannah Elaphidae
Binocellate cobra Naja naja
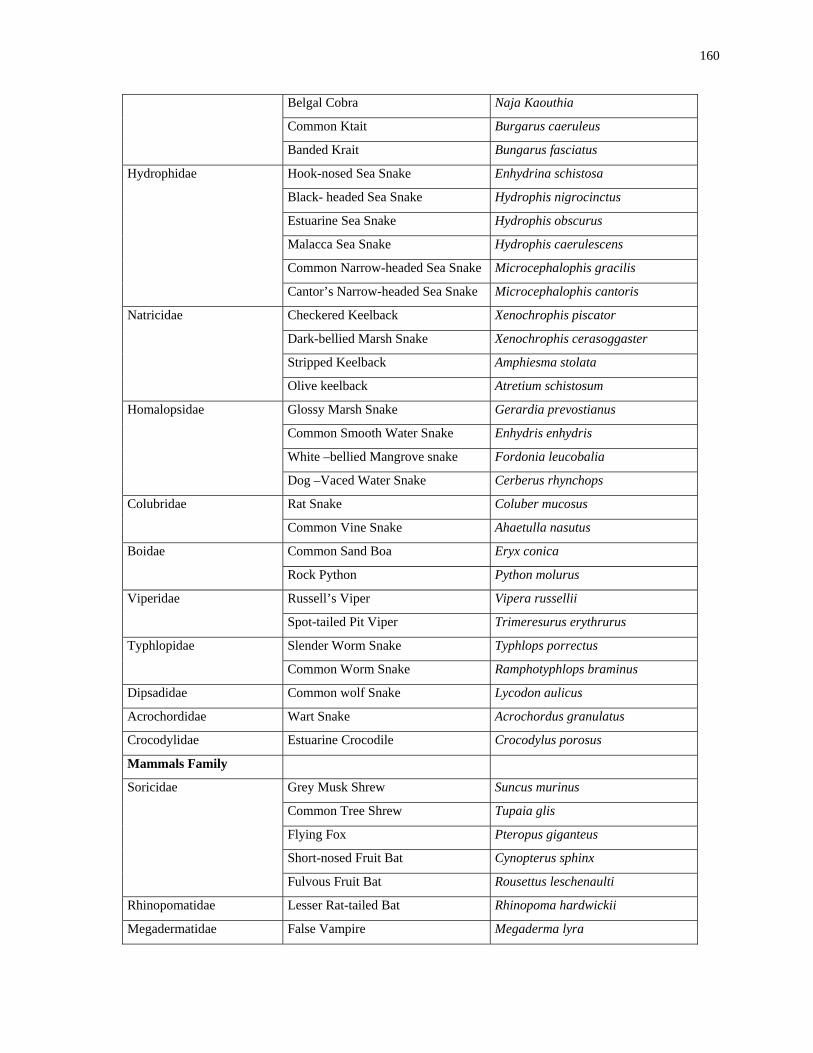
160
Belgal Cobra Naja Kaouthia
Common Ktait Burgarus caeruleus
Banded Krait Bungarus fasciatus
Hook-nosed Sea Snake Enhydrina schistosa
Black- headed Sea Snake Hydrophis nigrocinctus
Estuarine Sea Snake Hydrophis obscurus
Malacca Sea Snake Hydrophis caerulescens
Common Narrow-headed Sea Snake Microcephalophis gracilis
Hydrophidae
Cantor’s Narrow-headed Sea Snake Microcephalophis cantoris
Checkered Keelback Xenochrophis piscator
Dark-bellied Marsh Snake Xenochrophis cerasoggaster
Stripped Keelback Amphiesma stolata
Natricidae
Olive keelback Atretium schistosum
Glossy Marsh Snake Gerardia prevostianus
Common Smooth Water Snake Enhydris enhydris
White –bellied Mangrove snake Fordonia leucobalia
Homalopsidae
Dog –Vaced Water Snake Cerberus rhynchops
Rat Snake Coluber mucosus Colubridae
Common Vine Snake Ahaetulla nasutus
Common Sand Boa Eryx conica Boidae
Rock Python Python molurus
Russell’s Viper Vipera russellii Viperidae
Spot-tailed Pit Viper Trimeresurus erythrurus
Slender Worm Snake Typhlops porrectus Typhlopidae
Common Worm Snake Ramphotyphlops braminus
Dipsadidae Common wolf Snake Lycodon aulicus
Acrochordidae Wart Snake Acrochordus granulatus
Crocodylidae Estuarine Crocodile Crocodylus porosus
Mammals Family
Grey Musk Shrew Suncus murinus
Common Tree Shrew Tupaia glis
Flying Fox Pteropus giganteus
Short-nosed Fruit Bat Cynopterus sphinx
Soricidae
Fulvous Fruit Bat Rousettus leschenaulti
Rhinopomatidae Lesser Rat-tailed Bat Rhinopoma hardwickii
Megadermatidae False Vampire Megaderma lyra

161
Hipposideridae Tailless Leaf-nosed Bat Coelops frithii
Indian Pipistrelle Pipistrellus coromandra
Indian Pigmy Pipistrelle Pipistrellus mimus
Greater Yellow Bat Scotophilus heathii
Vespertilionidae
Asiatic Lesser Yellow Bat Scotophilus kuhlii
Cercopithecidae Rhesus Macaque Macaca mulatta
Bengal Tiger Panthera tigris
Jungle Cat Felis chaus
Leopard Cat Prionailurus bengalensis
Felidae
Fishing Cat Prionailurus viverrinus
Jackal Canis aureus Canidae
Bengal Fox Vulpes bengalensis
Small Indian Mongoose Herpestes auropunctatus Herpestidae
Common Mongoose Herpestes edwarsi
Smooth-coated Otter Lutra perspicillata Mustelidae
Clawless Indian Civet Aonyx cinerea
Large Indian Civet Viverra zibetha
Small Indian Civet Viverricula indica
Viverridae
Common Palm Civet Paradoxurus hermaphroditus
Suidae Wild Boar Sus scrofa
Spotted Deer Cervus axis Cervidae
Barking Deer Muntiacus muntjak
Sciuridae Fivestripped Palm Squirrel Funambulus pennanti
Bandicoot Rat Bandicota indica
Lesser Bandicoot Rat Bandicota bengalensis
House Mouse Mus musculus
Common House Rat Rattus rattus
Muridae
Long-tailed Tree Mouse Vandeleuria oleracea
Hystricidae Indian Porcupine Hystrix indica
Leporidae Rufouse-tailed Hare Lepus nigricollis
Common Dolphin Delphinus delphis
Irrawaddy Dolphin Orcaella brevirostrus
Indian Pilot Whale Globicephala marcrorhynchus
Dolphinidae
Melon-headed Dolphin Reponocephala electra
Phoceonidae Little Porpoise Neophocaena phocaenoides
Platanistidae Ganges River Dolphin Platanista gangetica
Source: Chowdhury, IUCN 2001 pp 149-150

162
Appendix 5 There are 430 rivers, creeks and canals have been made great network systems in this deltaic mangrove region. The river water body covers around 2000 km² (175686 hectares) area in the Sundarbans. The major rivers and canals/ creeks are showing in the following table.
Potential Rivers Creeks/ Canals Creeks/ Canals 1. Agargotta river 1. Chilabogi 52. Tetulbaria
2. Arpongasia river 2. Nishanbari 53. Hishamari
3. Andharmanik river 3. Jhapai 54. Horikali
4. Badamtola river 4. Karomjal 55. Charputia
5. Bhola river 5. Jongra 56. Chotlathimara
6. Baleswar river 6. Morapassur 57. Adanibaroburi
7. Bhangra river 7. Surjamukhi 58. Kalirkhal
8. Betmar river 8. Padmaboti 59. Nishankhali
9. Cunar river 9. Signboard 60. Kastura
10. Chorabetmar river 10. Nandabala 61. Mochrashing
11. Chaloki river 11. Tanbulbunia 62. Mollarkhali
12. Chukuni river 12. Bhaijhora 63. Hoddakhal
13. Deboki river 13. Kewcharkhal 64. Fultala
14. Dhumkoli river 14. Morjurbaria 65. Joymoni
15. Dutmukhi river 15. Aruaband 66. Gewakhali
16. Dingimari river 16. Patakata 67. Jhaka
17. Isamati river 17. Charbetmar 68. Chorerkhal
18. Firingi river 18. Chottosundara 69. Aloki
19. Harintana river 19. Sabrakhali 70. Chotsheali
20. Harinbhangha river 20. Chechaing 71. Shelonkhali
21. Hangsharaj river 21. Khormakhali 72. Sonakhali
22. Jamuna river 22. Andharmanik 73. Mandarbari
23. Jhalokati river 23. Bojobojha 74. Indirakani
24. Jafa river 24. Khejura 75. Sundarikouta
25. Kaira river 25. Bhedakhali 76. Chotkukumari
26. Kalagachi river 26. Dhublakhali 77. Pasuurtala
27. Kobadak river 27. Barosheali 78. Gewakhali
28. Kalindini river 28. Khashitana 79. Kalabogi
29. Kasitana river 29. Jhapa 80. Dobeki
30. Kesonkhali river 30. Kalaboga 81. korulia
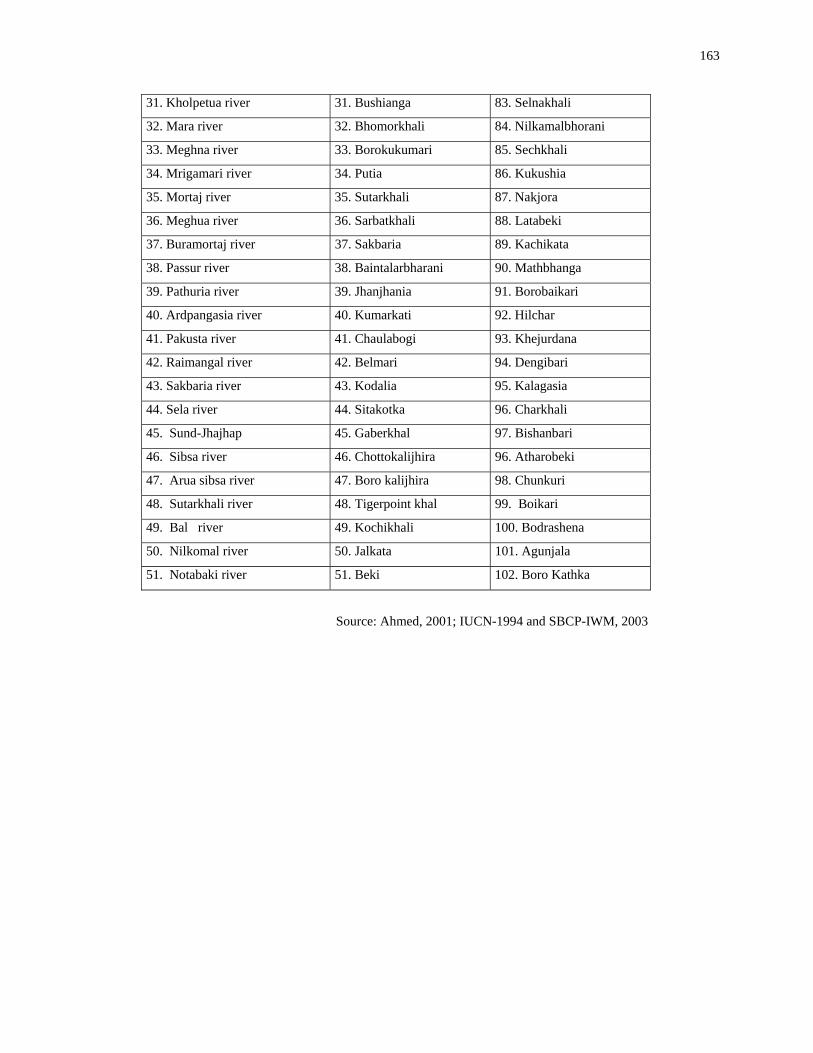
163
31. Kholpetua river 31. Bushianga 83. Selnakhali
32. Mara river 32. Bhomorkhali 84. Nilkamalbhorani
33. Meghna river 33. Borokukumari 85. Sechkhali
34. Mrigamari river 34. Putia 86. Kukushia
35. Mortaj river 35. Sutarkhali 87. Nakjora
36. Meghua river 36. Sarbatkhali 88. Latabeki
37. Buramortaj river 37. Sakbaria 89. Kachikata
38. Passur river 38. Baintalarbharani 90. Mathbhanga
39. Pathuria river 39. Jhanjhania 91. Borobaikari
40. Ardpangasia river 40. Kumarkati 92. Hilchar
41. Pakusta river 41. Chaulabogi 93. Khejurdana
42. Raimangal river 42. Belmari 94. Dengibari
43. Sakbaria river 43. Kodalia 95. Kalagasia
44. Sela river 44. Sitakotka 96. Charkhali
45. Sund-Jhajhap 45. Gaberkhal 97. Bishanbari
46. Sibsa river 46. Chottokalijhira 96. Atharobeki
47. Arua sibsa river 47. Boro kalijhira 98. Chunkuri
48. Sutarkhali river 48. Tigerpoint khal 99. Boikari
49. Bal river 49. Kochikhali 100. Bodrashena
50. Nilkomal river 50. Jalkata 101. Agunjala
51. Notabaki river 51. Beki 102. Boro Kathka
Source: Ahmed, 2001; IUCN-1994 and SBCP-IWM, 2003