title: modelling of cascade dams & reservoir operation for optimal water use: application to the...
TRANSCRIPT

Title: Modelling of Cascade Dams & Reservoir Operation for Optimal Water Use:
Application to the Omo River Basin, EthiopiaSupervisor
Prof. Dr. rer. nat Manfred Koch (Uni-Kassel)Dr. Yilma Sileshi (AAU, Ethiopia)
November 09, 2012
Kassel, Germany

Outline1. Background2. Study Area3. Objectives4. SDSM application5. SWAT Model6. HEC-ResSim Model7. References
Modeling of Cascade Dams & Reservoir Operation

1. Background• Over 45 000 times in the last century, people took
the decision to build a dam. • Dams were built to provide water for irrigated
agriculture, domestic or industrial use, to generate hydropower or help control floods (WCD, 2000).
• Hydroelectric power dams currently provide 19% of the world’s electricity supply.
• Worldwide, water demands have roughly tripled since 1950, & dams have helped satisfy that demand.
• Contribute directly to 12–16% of the global food production (WCD, 2000).
Modeling of Cascade Dams & Reservoir Operation

Background cont...• In relation to constructed dams, Africa contains
some of the world’s largest dams (e.g., Owen Falls (Uganda), Kariba (Zimbabwe) & Aswan High (Egypt). (ICOLD, 2003).
• Furthermore, Ethiopia has 13 hydropower dams and out of these ten were completed & three are under construction.
• According to 2005 plan of EEPCo, when the 3 dams complete, the capacity of the hydropower will increase to the capacity of 3,125 MW which will satisfy the electricity demand of the country.
Modeling of Cascade Dams & Reservoir Operation

Background cont...• On the contrary, dams have considerable
influence on d/s river ecosystems, in many cases extending for hundreds of kilometers below a dam.
• One of the problem encountered for the Ethiopian Gov’t has been opposition from International River (IR)-People-Water-Life in the construction of Gibe dam III in Omo river which will expect catastrophic effect on the d/s users & ecosystem.
Modeling of Cascade Dams & Reservoir Operation

Background cont...• To take account of this problem the WCD called for
a more equitable distribution of the benefits to be gained from large dams & proposed the inclusion of all identified stakeholders in the planning & management of water resources stored in a reservoir (WCD, 2000).
• To achieve this, dams & reservoirs operation must take into account the availability of the water resource in the basin, water uses u/s & d/s of the dam & must give consideration to political, organizational, social & environmental factors, as well as economic factor (McCartney & Acreman, 2001).
Modeling of Cascade Dams & Reservoir Operation

Background cont...• Hence, 1. New strategies for effective use of the water in the
basin particularly in the Omo River basin will be needed for water development & management to avert water scarcities that could depress d/s users & damage the environment.
2. A large share of water to meet new demands must come from water saved from existing uses through a comprehensive reform of water policy.
3. Integrated management must be the primary approach to addressing sustainable water resources, both for subsystem & river basin level.
Modeling of Cascade Dams & Reservoir Operation

2. Study Area• The Omo-Gibe River Basin
is almost 79,000 km2 in area
• The basin lies longitude 4°30'N - 9°30'N & latitude 35°0'E - 38°0'E, altitude of 2800masl.
• The general direction of flow of the river is southwards towards the Omo River/Lake Turkana Trough, a fault feature.
Modeling of Cascade Dams & Reservoir Operation

3. Objective of Research
Main objective
• The purpose of this study is to model cascade dams & reservoirs operation in the Omo river basin to satisfactorily simulate the operation of dams & reservoirs for optimal water use.
Modeling of Cascade Dams & Reservoir Operation

Specific objectivesThe specific objectives of the proposed study are
To simulate runoff & inflow to the reservoirs in the Omo river basin using the SWAT model.To develop & recommend optimal dam & reservoir operation rule curves for cascade dams & reservoirs, more soundly based on evaluating the feasibility of various reservoir operating alternatives. To evaluate the effects of various reservoir operating alternatives on either preventing flooding or avoiding precarious low flow at locations d/s of the reservoirs.
Modeling of Cascade Dams & Reservoir Operation

Hydrological & Hydraulic Situation in the Omo River Basin
Modeling of Cascade Dams & Reservoir Operation

GIBE-I
Modeling of Cascade Dams & Reservoir Operation
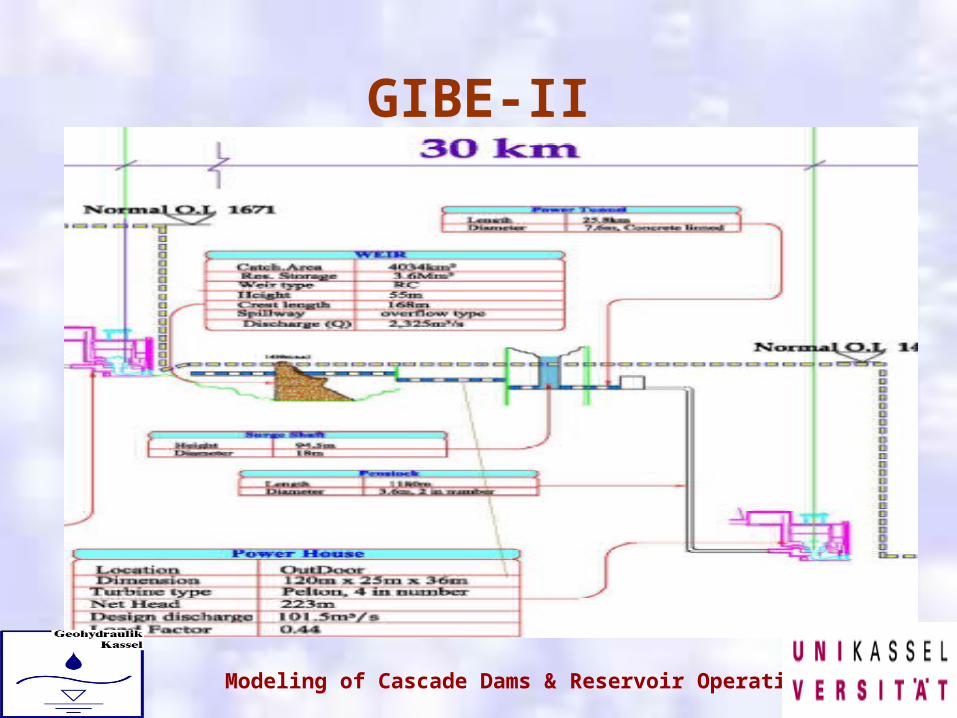
GIBE-II
Modeling of Cascade Dams & Reservoir Operation
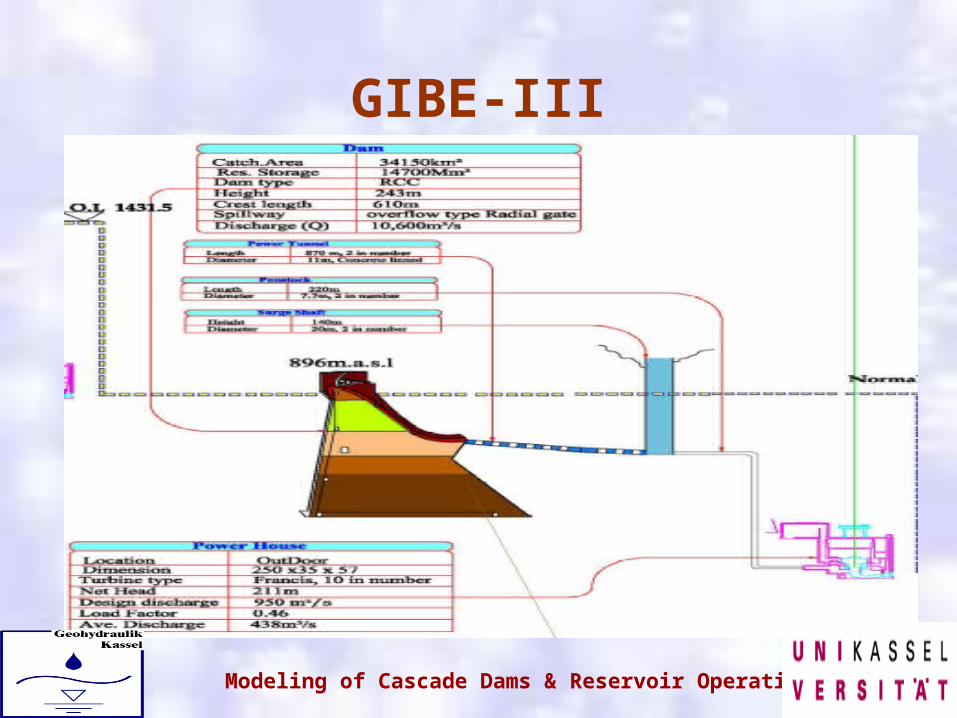
GIBE-III
Modeling of Cascade Dams & Reservoir Operation

GIBE-IV
Modeling of Cascade Dams & Reservoir Operation

GIBE-V
Modeling of Cascade Dams & Reservoir Operation

.
Modeling of Cascade Dams & Reservoir Operation
Lake Turkana

4. The Statistical DownScaling Model: application to filling and forcasting
Metrological data 4.1 Introduction• The Statistical DownScaling Model (SDSM) is a
freely available tool that produces high resolution climate change scenarios.
• Downscaling is a technique by which properties of the free atmosphere are used to predict local meteorological conditions.
• The large-scale information may originate from systematic weather observations or from climate model outputs.
Modeling of Cascade Dams & Reservoir Operation

SDSM cont....• This freely available software enables the
production of climate change time series at sites for which there are sufficient daily data for model calibration, as well as archived General Circulation Model (GCM) output to generate scenarios.
• SDSM can also be used as a stochastic weather generator or to infill gaps in meteorological data.
Modeling of Cascade Dams & Reservoir Operation

Objective
• To filling and forecasting Rainfall and Temperature data for Omo Metrological Stations
Modeling of Cascade Dams & Reservoir Operation

Methdology• The structure and operation of SDSM has seven
tasks to infill and generate data. These are: 1. Quality control and data transformation; 2. Screening of potential downscaling predictor
variables; 3. Model calibration; 4. Generation of ensembles of current weather
data using observed predictor variables; 5. Statistical analysis of observed data and climate
change scenarios; 6. Graphing model output; 7. Generation of ensembles of future weather data.
Modeling of Cascade Dams & Reservoir Operation
Modeling of Cascade Dams & Reservoir Operation
RESULT
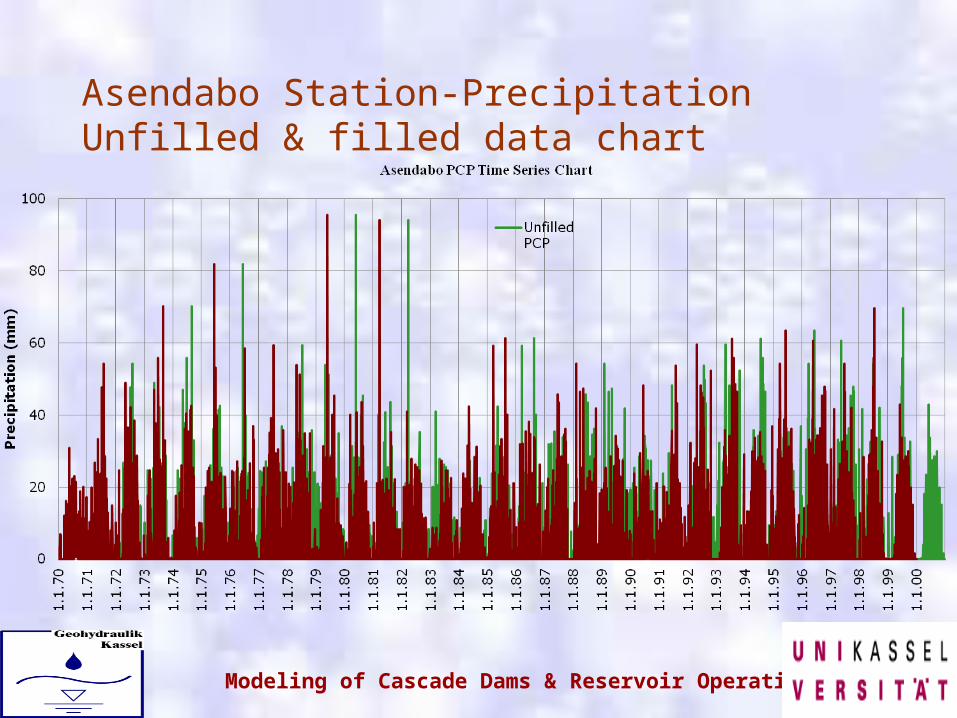
Asendabo Station-Precipitation Unfilled & filled data chart
Modeling of Cascade Dams & Reservoir Operation

Statistical Analysis using Mean, Variance,Sum & pdf plot of unfilled & Filled Precipition data
Modeling of Cascade Dams & Reservoir Operation
0
13
0
13
Jan Feb Mar Apr May Jun Jul Aug Sep Oct Nov Dec
PREC_unfilled
PREC_Filled
Asendabo Precipitation Bar Chart
0
205
0
205
Jan Feb Mar Apr May Jun Jul Aug Sep Oct Nov Dec
PREC_unfilled
PREC_Filled
Asendabo Precipitation Bar Chart
0
418
0
418
Jan Feb Mar Apr May Jun Jul Aug Sep Oct Nov Dec
PREC_Unfilled
PREC_Filled
Asendabo Precipitation Bar Chart
0
10000
0
10000
x axis label
AsendaboObsPCPunfilled.dat Mean
Asendabo PDF Chart

Generated Precipitation data from 2001-2040.
-4
5
-4
5
Year
PCPNCEP_1970-2000.dat
PCPGCM_2001_2040.dat
Standardised Precipitation Index

Statistical Analysis using Mean, Varience, Sum & pdf of Observed & Modelled data
. .
Modeling of Cascade Dams & Reservoir Operation
0
12
0
12
Jan Feb Mar Apr May Jun Jul Aug Sep Oct Nov Dec
Observed Prec
Model Prec
Observed V Model Mean Precipiritation
0
239
0
239
Jan Feb Mar Apr May Jun Jul Aug Sep Oct Nov Dec
Observed Variance
Modelled Variance
Observed Vs Simulated Prec Varience
0
347
0
347
Jan Feb Mar Apr May Jun Jul Aug Sep Oct Nov Dec
Observed Prec Sum
Modelled Prec Sum
Observed Vs Modelled Monthlly Prec Sum
0
10000
0
10000
x axis label
AssendaboObsPrec.dat
Mean
Asendabo Prec PDF Chart

Asendabo Unfilled and Filled Maximum Temperature data chart.

Modeling of Cascade Dams & Reservoir Operation
Statistical Analysis of using Mean, Variance,Sum & pdf plot of Max Unfilled & Filled Temp data
0
58
0
58
Jan Feb Mar Apr May Jun Jul Aug Sep Oct Nov Dec
Maximum Temperature_Unfilled
Mimum Temperature_Filled
Asendabo Maximum Temperature
0
46
0
46
Jan Feb Mar Apr May Jun Jul Aug Sep Oct Nov Dec
Max. Temperature_Unfilled
Max. Temperature_Filled
Asendabo Maximum Temperature
0
1810
0
1810
Jan Feb Mar Apr May Jun Jul Aug Sep Oct Nov Dec
Max. Temperature_Unfilled
Max. Temperature_Filled
Asendabo Maximum Temperature Varience
0
6906
0
6906
0 38.5
x axis label
AsendaboObsTMAXunfilled.dat
Mean
Asendabo Max. Temperature PDF Chart

Generated Maximum Temperature from 2001-2040
.
0
68
0
68
Data points
TEMPNCEP_1970-2000.dat
TEMPGCM_2001-2040.dat
Generated Temperature Maximum

Statistical Analysis using Mean, Varience, Sum & pdf of Generated data
..
Modeling of Cascade Dams & Reservoir Operation
0
57
0
57
Jan Feb Mar Apr May Jun Jul Aug Sep Oct Nov Dec
Observed Max Temp Mean
Modelled Max Temp Mean
Observed Vs Modelled Max Temp Mean
0
18
0
18
Jan Feb Mar Apr May Jun Jul Aug Sep Oct Nov Dec
Observed Max Temp Variance
Modelled Max Temp Variance
Obseved Vs Modelled Max Temp Varience
0
1000
0
1000
Jan Feb Mar Apr May Jun Jul Aug Sep Oct Nov Dec
Observed Max Temp Sum
Modelled Max Temp Sum
Observed Vs Modelled Max Temp Sum
0
4000
0
4000
x axis label
AssendaboObsTmax.dat
Mean
Asendabo Max Temp PDF Chart

Asendabo Unfilled and Filled Minimum Temperature data from 1970-2000.

Statistical Analysis using Mean, Variance,Sum & pdf plot of Min. Temp
Modeling of Cascade Dams & Reservoir Operation
0
16
0
16
Jan Feb Mar Apr May Jun Jul Aug Sep Oct Nov Dec
Min.Temp_Unfilled
Min. Temp_Filled
Asendabo Min. Temp Mean
0
16
0
16
Jan Feb Mar Apr May Jun Jul Aug Sep Oct Nov Dec
Min Temp_Unfilled Varience
Min. Temp._Filled Variance
Asendabo Min. Temperature Varience
0
500
0
500
Jan Feb Mar Apr May Jun Jul Aug Sep Oct Nov Dec
Min. Temp Sum_Unfilled
Min. Temp Sum_Filled
Asendabo Min. Temp Sum
0
5382
0
5382
-5 22
x axis label
AsendaboObsTMINunfilled.dat Mean
SDSM PDF Chart

.
-10
33
-10
33
Data points
TMINNCEP_1970-2000.dat
TMINGCM_2001-2040.dat
Mean Temperature Series
Generated Minimum Temperature from 2001-2040

. .
Modeling of Cascade Dams & Reservoir Operation
Statistical Analysis using Mean, Varience, Sum & pdf of Generated data
0
16
0
16
Jan Feb Mar Apr May Jun Jul Aug Sep Oct Nov Dec
Observed Min Temp Mean
Modelled Min Temp Mean
Observed Vs Modelled Min Temp Mean
0
16
0
16
Jan Feb Mar Apr May Jun Jul Aug Sep Oct Nov Dec
Observed Min Temp Variance
Modelled Min Temp Variance
Observed Vs Modelled Min Temp Varience
0
500
0
500
Jan Feb Mar Apr May Jun Jul Aug Sep Oct Nov Dec
Observed Min Temp Sum
Modelled Min Temp Sum
Observed Vs Modelled Min Temp Sum
0
5662
0
5662
x axis label
AssendaboObsTmin.dat Mean
Asendabo Min Temp PDF Chart

Summary
By the same procedure• 18 Precipitation station were filled and generated• 13 Maximum and Minimum temperature station data were filled and generated

5. Hydrological Model SWAT5.1. Introduction• SWAT is a hydrological model that attempt to
describe the physical processes controlling the transformation of precipitation to runoff.
• The major hydrologic processes described by this model include: Canopy interception, Evaporation, Transpiration, Snowmelt, Interflow, Overland flow, Channel flow, unsaturated subsurface flow and saturated subsurface flow.
Modeling of Cascade Dams & Reservoir Operation

Introduction cont...
• SWAT was used to assess and predict the impact of land management practices on water in Omo river basin with varying soils, land use and management conditions over long periods of time.
Modeling of Cascade Dams & Reservoir Operation
5.2. Objective
• To simulate runoff & inflow to the reservoirs in the Omo river basin.
Modeling of Cascade Dams & Reservoir Operation

• Input files needed for daily stream flow computation were :
• the digital elevation model (DEM),
• land cover, • soil layers, • daily values of
precipitation, max.& min. air temp, solar radiation, RH, & WS,
• Hydrological flow data.
Modeling of Cascade Dams & Reservoir Operation
5.3. Methodology
Methodology cont...• Missing metrological data were filled using WXGEN weather generator model of SWAT, SDSM, and Hydrological flow data were filled by Multiple
regression of R program• The Digital Elevation Model (DEM) was used to
create stream network, subbasin & delineate the watershed boundary & also calculate the sub basin parameters.
• Threshold value of 2%, 5% & 5% were taken for land use, soil & slope in order to keep the number of HRUs to a reasonable number for modeling the water assessment of the basin.
Modeling of Cascade Dams & Reservoir Operation

Methodology cont...• Runoff was predicted separately for each HRU
& routed to obtain the total runoff for the watershed, and
• Calibration, Validation & Uncertainity of the model using SWAT_CUP 4.3.7.
Modeling of Cascade Dams & Reservoir Operation

5.4. Results1. Model Calibration and Validation of
Abelti Sub watershed• Abelti sub-watershed has an area of 15,495 km²
and 30% of the total watershed delineated at Omorate.
Modeling of Cascade Dams & Reservoir Operation
SWAT Land Use Area (ha)% Watershed Area
AGRC 92603.24 1.37
AGRL 1122014.08 16.62
FRSD 115774.54 1.72
RNGW 124815.46 1.85
WATR 85006.00 1.26
Soil Area (ha)
% Watershed Area
Chromic Luvisols (LVx) 173730.74 2.57
Dystric Vertisol (VRd) 228955.24 3.39
Eutric Vertisols (VRe) 304403.79 4.51
Humic Alisol (Ntu) 385865.94 5.72
Humic Nitisols (NTu) 406320.23 6.02
Lithic Leptosols (LPq) 40937.38 0.61

Model Calibration and Validation of Abelti Sub watershed
• Using SWAT model the area was delineated into 9 sub watersheds, which were further, divided into 122 HRUs.
• Simulated flow at the outlet was compared with the observed flow.
Modeling of Cascade Dams & Reservoir Operation

Flow Calibration At Abelti
Modeling of Cascade Dams & Reservoir Operation

Sensitivity Analysis
Modeling of Cascade Dams & Reservoir Operation

2. Model Calibration and Validation of Karodus Sub watershed
Modeling of Cascade Dams & Reservoir Operation
• Karo Duse sub-watershed covers 64,518 km² and 95.6% of the total watershed delineated at the Omorate.
• Land use and land cover was reclassified into 7 broad categories
SWAT Land Use
Area (ha)
% Watershed Area
% sub basin
AGRC 92603.2 1.4 1.4
AGRL272001
0.3 40.3 42.2
FRSD661280.
5 9.8 10.3FRST 69943.8 1.0 1.1
RNGR292470.
2 4.3 4.5
RNGW242747
1 18.8 37.6
WATR186396.
5 2.8 2.9
Soil Area (ha)
% Watershed Area
% sub basin
Chromic Luvisol 351598.7 5.2 5.5Dystric leptosol 14272.9 0.2 0.2
Dystric Vertisol 228955.2 1.7 3.5
Eutric Cambisol 146060.0 1.6 2.3
Eutric Fluvisol 438059.3 6.5 6.8Eutric Leptosol 11503.9 0.2 0.2
Eutric Vertisols 827509.7 12.3 12.8
Humic Alisol1381854.
1 20.5 21.4
Humic Nitisol2130999.
1 31.6 33.0
Lithic Leptosol 919362.5 13.6 14.3

Model Calibration and Validation of Karodus Sub watershed
• Using SWAT model the area was delineated into 24 sub watersheds, which were further, divided into 311 HRUs.
• Simulated flow at the outlet was compared with the observed flow.
Modeling of Cascade Dams & Reservoir Operation

Flow Calibration At Karodus
Modeling of Cascade Dams & Reservoir Operation

Sensitivity Analysis
Modeling of Cascade Dams & Reservoir Operation

6. HEC-ResSim (Reservoir System Simulation) Model6.1. Introduction• HEC-ResSim (USACE) is a modeling software
program used to assist in planning studies for evaluating existing & proposed reservoirs, reservoir operations, & to assist in sizing the flood risk management and conservation storage requirements for each project.
• It is intended to meet the needs of real-time reservoir regulators for a decision support tool, as well as the needs of modelers doing reservoir projects studies.
Modeling of Cascade Dams & Reservoir Operation
Introduction cont...• There are three modules that make up HEC-
ResSim to simulate the dam & reservoir operations.
• These are watershed set up, reservoir network and simulation. Each module has a unique purposes & an associated set of functions accessible through menus, toolbars and schematic.
Modeling of Cascade Dams & Reservoir Operation

ResSim Module Concepts
.
Modeling of Cascade Dams & Reservoir Operation

6.2. Objective
To develop & recommend optimal dam & reservoir operation rule curves for cascade dams & reservoirs To evaluate the effects of various reservoir operating alternatives on either preventing flooding or avoiding precarious low flow at locations d/s of the reservoirs
Modeling of Cascade Dams & Reservoir Operation
• Insertion of the map layers in to the HEC-ResSim model
• Schematization & configuration of stream alignment & configurations of the projects
• Developing network schematic • Describing the physical & operational
elements of the reservoir model & analyze the alternatives
• Configuration of simulation to isolate the output analysis,
• Simulation of the dams & reservoirs network,
Modeling of Cascade Dams & Reservoir Operation
6.3. Methodology

Watershed Setup & Stream Alignment
Modeling of Cascade Dams & Reservoir Operation

• Evaluation of the effects of various reservoir operating alternatives on flooding at locations d/s of the reservoirs,
• Calibration & Verification of the model,• Development of a model that represents the
cascade dams & reservoirs, • Delivery of optimal water use operational model
for Omo River Basin and• Interpretation of the results.
Modeling of Cascade Dams & Reservoir Operation
Methodology cont…

6. References• Akter, T. & Simonovic, S. P., (2004). Modelling
uncertainties in short-term reservoir operation using fuzzy sets and a genetic algorithm. Hydrological Science Journal 49(6): 1081-1079.
• Arnold, J.G., Srinivasan, R.S., Muttiah, & J.R. Williams. (1998). Large area hydrologic modeling and assessment part I : Model development. J. American Water Resource. Assoc. 34(1): 73-89.
• Arunkumar, S., & Yeh, W. W. G. (1973). Probabilistic models in the design and operation of a multi-purpose reservoir system.
Modeling of Cascade Dams & Reservoir Operation

Modeling of Cascade Dams & Reservoir Operation