time-resolved spectroscopy of bare and reacted … · 2017-11-18 · time-resolved spectroscopy of...
TRANSCRIPT

Time-Resolved Spectroscopy of Bare and ReactedGold and Silver Clusters:
Materials for New Photochemistry?
Dissertation
zur Erlangung des akademischen GradesDoktor der Naturwissenschaften (Dr. rer. nat.)
an der Universitat KonstanzMathematisch-Naturwissenschaftliche Sektion
Fachbereich Physik
vorgelegt von
Marco Niemietz
Tag der mundlichen Prufung: 10. Dezember 2007Referent: Prof. Dr. Gerd GanteforReferent: Prof. Dr. Paul Leiderer

Cover picture: Time-resolved photoelectron difference spectra of Au2O-, indicating
fragmentation, and illustration of the corresponding process (see section 5.4.1). CADconstruction of the clusters (right hand side) by Jorn Cordes.
Contents
List of Tables vii
List of Figures ix
1 Introduction and Motivation 1
2 State of the Art 52.1 Gold and Silver Clusters . . . . . . . . . . . . . . . . . . . . . . . . . 5
2.1.1 Electronic Structure . . . . . . . . . . . . . . . . . . . . . . . 52.1.2 Geometric Structure . . . . . . . . . . . . . . . . . . . . . . . 62.1.3 Chemical Properties . . . . . . . . . . . . . . . . . . . . . . . 8
2.2 Femtosecond Spectroscopy . . . . . . . . . . . . . . . . . . . . . . . . 122.2.1 Time-Resolved Spectroscopy of Clusters . . . . . . . . . . . . 132.2.2 Femtochemistry of Clusters . . . . . . . . . . . . . . . . . . . 21
3 Basic Concepts and Methods 253.1 Metal Clusters . . . . . . . . . . . . . . . . . . . . . . . . . . . . . . . 26
3.1.1 Electronic Shell Model . . . . . . . . . . . . . . . . . . . . . . 263.1.2 Clemenger-Nilsson Model . . . . . . . . . . . . . . . . . . . . 28
3.2 Photoelectron Spectroscopy . . . . . . . . . . . . . . . . . . . . . . . 303.2.1 Basics . . . . . . . . . . . . . . . . . . . . . . . . . . . . . . . 303.2.2 Single Particle Picture . . . . . . . . . . . . . . . . . . . . . . 313.2.3 Quantum Mechanical Model . . . . . . . . . . . . . . . . . . . 343.2.4 Time-Resolved Photoelectron Spectroscopy . . . . . . . . . . . 37
3.3 Dynamics in Atoms . . . . . . . . . . . . . . . . . . . . . . . . . . . . 373.4 Dynamics in Molecules . . . . . . . . . . . . . . . . . . . . . . . . . . 383.5 Dynamics in Bulk Materials . . . . . . . . . . . . . . . . . . . . . . . 39
3.5.1 Electron-Electron-Scattering . . . . . . . . . . . . . . . . . . . 413.5.2 Electron-Phonon-Scattering . . . . . . . . . . . . . . . . . . . 433.5.3 Desorption . . . . . . . . . . . . . . . . . . . . . . . . . . . . . 45
3.6 Dynamics in Clusters . . . . . . . . . . . . . . . . . . . . . . . . . . . 513.7 Ultrashort Light Pulses . . . . . . . . . . . . . . . . . . . . . . . . . . 56
3.7.1 Properties . . . . . . . . . . . . . . . . . . . . . . . . . . . . . 563.7.2 Generation . . . . . . . . . . . . . . . . . . . . . . . . . . . . 56
iii

Table of Contents
4 Experimental Setup 594.1 Cluster Source . . . . . . . . . . . . . . . . . . . . . . . . . . . . . . . 614.2 Mass Spectrometer . . . . . . . . . . . . . . . . . . . . . . . . . . . . 63
4.2.1 Reflectron . . . . . . . . . . . . . . . . . . . . . . . . . . . . . 644.3 Photoelectron Spectrometer . . . . . . . . . . . . . . . . . . . . . . . 66
4.3.1 Magnetic Bottle . . . . . . . . . . . . . . . . . . . . . . . . . . 664.4 Laser System . . . . . . . . . . . . . . . . . . . . . . . . . . . . . . . 68
4.4.1 Millennia V . . . . . . . . . . . . . . . . . . . . . . . . . . . . 684.4.2 Tsunami . . . . . . . . . . . . . . . . . . . . . . . . . . . . . . 684.4.3 Evolution X . . . . . . . . . . . . . . . . . . . . . . . . . . . . 694.4.4 Spitfire . . . . . . . . . . . . . . . . . . . . . . . . . . . . . . . 70
4.5 Optical Setup . . . . . . . . . . . . . . . . . . . . . . . . . . . . . . . 704.5.1 Optical Path for Red-Blue . . . . . . . . . . . . . . . . . . . . 714.5.2 Optical Path for Blue-Blue . . . . . . . . . . . . . . . . . . . . 724.5.3 Optical Path for Blue-UV . . . . . . . . . . . . . . . . . . . . 73
5 Results and Discussion 775.1 Data Recording and Processing . . . . . . . . . . . . . . . . . . . . . 775.2 Bare Silver Clusters . . . . . . . . . . . . . . . . . . . . . . . . . . . . 80
5.2.1 Silver-Trimer Ag3-
. . . . . . . . . . . . . . . . . . . . . . . . 815.2.2 Silver-Heptamer Ag7
-. . . . . . . . . . . . . . . . . . . . . . . 83
5.2.3 Ag18-
. . . . . . . . . . . . . . . . . . . . . . . . . . . . . . . . 845.2.4 Ag19
-. . . . . . . . . . . . . . . . . . . . . . . . . . . . . . . . 84
5.2.5 Agn-with n = 8, 9, 11, 14, 15 and 21 . . . . . . . . . . . . . . 85
5.2.6 Discussion . . . . . . . . . . . . . . . . . . . . . . . . . . . . . 875.3 Silver Oxide Clusters . . . . . . . . . . . . . . . . . . . . . . . . . . . 92
5.3.1 Ag2O2-. . . . . . . . . . . . . . . . . . . . . . . . . . . . . . . 94
5.3.2 Ag4O2-and Ag8O2
-. . . . . . . . . . . . . . . . . . . . . . . . 101
5.3.3 Ag3O2-. . . . . . . . . . . . . . . . . . . . . . . . . . . . . . . 105
5.3.4 Ag2O3-. . . . . . . . . . . . . . . . . . . . . . . . . . . . . . . 106
5.4 Gold Oxide Clusters . . . . . . . . . . . . . . . . . . . . . . . . . . . 1085.4.1 Au2O
-. . . . . . . . . . . . . . . . . . . . . . . . . . . . . . . 108
5.4.2 AuO2-
. . . . . . . . . . . . . . . . . . . . . . . . . . . . . . . 1165.4.3 Au2O2
-. . . . . . . . . . . . . . . . . . . . . . . . . . . . . . . 118
6 Conclusion 123
7 Outlook 129
8 Zusammenfassung 131
A Abbreviations 135
iv

Table of Contents
B List of Publications 137
Bibliography 141
Danksagung 165
v


List of Tables
5.1 Relaxation times of Agn-
. . . . . . . . . . . . . . . . . . . . . . . . . 81
6.1 Overview of relaxation dynamics of small cluster anions . . . . . . . . 1266.2 Overview of photodesorption from metal cluster anions . . . . . . . . 127
A.1 Abbreviations . . . . . . . . . . . . . . . . . . . . . . . . . . . . . . . 135
vii


List of Figures
1.1 Scalability in the nano regime . . . . . . . . . . . . . . . . . . . . . . 11.2 Melting temperature of sodium clusters . . . . . . . . . . . . . . . . . 2
2.1 Mass spectrum of Agn-+ O2 . . . . . . . . . . . . . . . . . . . . . . . 10
2.2 Time-resolved photoelectron sprctra of a Cu(111)-surface . . . . . . . 132.3 Time-resolved photoelectron spectra of Hg7
-. . . . . . . . . . . . . . 14
2.4 Photodissociation of Au3-: PES & TR-PES spectra . . . . . . . . . . 15
2.5 Photodissociation of Au3-: Scheme of the potential energy surface . . 16
2.6 Relaxation times of Aln-, n = 6–15 . . . . . . . . . . . . . . . . . . . 17
2.7 Time-resolved photoelectron spectra of Al13-
. . . . . . . . . . . . . . 182.8 Time-resolved photoelectron spectra of Au6
-. . . . . . . . . . . . . . 19
2.9 Time-resolved photoelectron spectra of Au7-
. . . . . . . . . . . . . . 212.10 Thermodesorption of CO from Au2(CO)
-. . . . . . . . . . . . . . . . 22
2.11 Thermodesorption and fragmentation on Pt2(N)2-
. . . . . . . . . . . 232.12 NeNePo-data of Ag2 and Ag2O2 . . . . . . . . . . . . . . . . . . . . . 24
3.1 Examples of cluster structures . . . . . . . . . . . . . . . . . . . . . . 253.2 Simplified Scheme of the energy levels in aluminum from atom to bulk 263.3 Jellium model for sodium clusters . . . . . . . . . . . . . . . . . . . . 283.4 Clemenger-Nilsson diagram . . . . . . . . . . . . . . . . . . . . . . . 293.5 Single particle picture for photodetachment . . . . . . . . . . . . . . . 323.6 Quantum mechanical model of the photoemission process . . . . . . . 353.7 Conical Intersection . . . . . . . . . . . . . . . . . . . . . . . . . . . . 393.8 Relaxation processes in a metal induced by a fs-laser pulse . . . . . . 403.9 Relaxation of an excited free electron gas . . . . . . . . . . . . . . . . 423.10 Scheme of the two-temperature model and the time evolution of Tel
and Tph after excitation . . . . . . . . . . . . . . . . . . . . . . . . . . 443.11 Scheme of the energy flow at adsorbate covered metal surfaces after
fs-laser excitation . . . . . . . . . . . . . . . . . . . . . . . . . . . . . 463.12 Phonon mediated, adiabatic ladder climbing process for desorption . . 473.13 Electronic friction model . . . . . . . . . . . . . . . . . . . . . . . . . 483.14 Schematic illustration of the DIMET process . . . . . . . . . . . . . . 493.15 DIET/DIMET in the MGR- and Antoniewicz-model . . . . . . . . . 503.16 Relaxation processes after photoexcitation . . . . . . . . . . . . . . . 52
ix

List of Figures
4.1 Schematic overview of the experimental apparatus . . . . . . . . . . . 594.2 Arrangement of the experimental setup . . . . . . . . . . . . . . . . . 604.3 Scheme of the cluster source PACIS . . . . . . . . . . . . . . . . . . . 624.4 TOF with reflectron . . . . . . . . . . . . . . . . . . . . . . . . . . . 654.5 Mass spectra of Aun
-before and after installing the reflectron . . . . 65
4.6 Basic Principle of the “magnetic bottle” . . . . . . . . . . . . . . . . . 674.7 Optical path inside the Tsunami . . . . . . . . . . . . . . . . . . . . . 694.8 Red-Blue optical setup . . . . . . . . . . . . . . . . . . . . . . . . . . 714.9 Blue-Blue optical setup . . . . . . . . . . . . . . . . . . . . . . . . . . 724.10 Blue-UV optical setup . . . . . . . . . . . . . . . . . . . . . . . . . . 744.11 Time-resolved photoelectron spectra of Au3
-. . . . . . . . . . . . . . 75
4.12 Expanded view of the time-resolved photoelectron spectra of Au3-
. . 754.13 Integrated intensity of the pump-probe peak of Au3
-. . . . . . . . . . 75
5.1 Lifetime and relaxation time . . . . . . . . . . . . . . . . . . . . . . . 795.2 Relaxation times of Agn
-. . . . . . . . . . . . . . . . . . . . . . . . . 80
5.3 Time-resolved photoelectron spectra of Ag3-
. . . . . . . . . . . . . . 825.4 Pump-probe intensity plotted versus time delay for Ag3
-. . . . . . . 82
5.5 Time-resolved photoelectron spectra of Ag7-
. . . . . . . . . . . . . . 835.6 Time-resolved difference spectra of Ag18
-. . . . . . . . . . . . . . . . 84
5.7 Time-resolved difference spectra of Ag19-
. . . . . . . . . . . . . . . . 855.8 Time-resolved photoelectron spectra of Ag8
-and Ag9
-. . . . . . . . . 86
5.9 Time-resolved photoelectron spectra of Ag11-, Ag14
-and Ag15
-. . . . 86
5.10 Time-resolved difference spectra of Ag21-
. . . . . . . . . . . . . . . . 875.11 Simplified Clemenger-Nilsson diagram . . . . . . . . . . . . . . . . . . 885.12 Relaxation scheme of Ag19
-. . . . . . . . . . . . . . . . . . . . . . . . 91
5.13 Comparison of PES spectra of Agn-and AgnO2
-. . . . . . . . . . . . 93
5.14 Standard photoelectron spectra of Ag2-and Ag2O2
-. . . . . . . . . . 95
5.15 Photoelectron spectra of Ag2O2-using femtosecond pulses . . . . . . 96
5.16 Delay-dependent part of the TR-PES spectra of Ag2O2-. . . . . . . . 97
5.17 Analysis of the time evolution of the shape of peak c’ (assigned to Ag2-) 98
5.18 Time-resolved photoelectron spectra of Ag4O2-and Ag8O2
-. . . . . . 101
5.19 Time-resolved photoelectron spectra of Ag8O2-using the blue-UV setup103
5.20 Time-resolved difference spectra of Ag8O2-
. . . . . . . . . . . . . . . 1045.21 Time-resolved photoelectron spectra of Ag3O2
-. . . . . . . . . . . . . 105
5.22 Time-resolved photoelectron spectra of Ag2O3-
. . . . . . . . . . . . . 1065.23 Plot of the integrated intensity of the time-dependent features of
Ag2O3-versus time-delay . . . . . . . . . . . . . . . . . . . . . . . . . 107
5.24 Selected time-resolved photoelectron spectra of Ag2O3-
. . . . . . . . 1075.25 Standard photoelectron spectra of Au
-, AuO
-, Au2
-and Au2O
-recorded
with a single pulse of the fs-laser system . . . . . . . . . . . . . . . . 1095.26 Time-resolved spectra of Au2O
-. . . . . . . . . . . . . . . . . . . . . 110
x

List of Figures
5.27 Time-resolved difference spectra of Au2O-
. . . . . . . . . . . . . . . 1115.28 Selected photoelectron spectra of Au2O
-. . . . . . . . . . . . . . . . 112
5.29 Comparison of the spectrum of Au2O-at long delay with the spectra
of AuO-and Au
-. . . . . . . . . . . . . . . . . . . . . . . . . . . . . 113
5.30 Delay dependence of the photofragment intensities of Au2O-
. . . . . 1135.31 Short-time dynamics of Au2O
-. . . . . . . . . . . . . . . . . . . . . . 115
5.32 Standard photoelectron spectrum of AuO2-. . . . . . . . . . . . . . . 116
5.33 Time-resolved photoelectron spectra of AuO2-
. . . . . . . . . . . . . 1165.34 Time-resolved difference spectra of AuO2
-. . . . . . . . . . . . . . . 117
5.35 Standard photoelectron spectrum of Au2O2-
. . . . . . . . . . . . . . 1195.36 Time-resolved photoelectron spectra of Au2O2
-. . . . . . . . . . . . . 119
5.37 Time-resolved difference spectra of Au2O2-
. . . . . . . . . . . . . . . 120
xi


1 Introduction and Motivation
Population growth and limited natural resources let energy generation, storage andconversion become pressing problems in our society. The main vision motivatingthis work is the future use of novel nanomaterials for applications in catalysis andenergy conversion. This ambitious aim might be achieved by systematic studies ofclusters1 and nanoparticles, being promising building blocks of such new materials.
While atoms and bulk materials are well studied theoretically and experimentally,the access to the size regime in between is quite difficult. Clusters constitute thetransition from atom to bulk, having properties different from both. For theoret-ical modeling, interactions between the monomers have to be considered, while atthe same time statistical tools cannot be used due to the relatively low number ofmonomers involved. One of the most stimulating and inspiring issues about clustersis the fact, that their properties change with size, and the statement “each atomcounts” is absolutely true: Starting from bulk, properties are at first still scalableand effects like the ratio between surface and volume are important with decreasingsize. Getting smaller, in the size regime below a few hundred atoms, quantum sizeeffects come into play. In this regime, properties are non-scalable and exhibit dis-continuous behavior (see figures 1.1 and 1.2).
Figure 1.1:Scheme of thedependence of anarbitrary property(e.g. melting point,band gap, etc.) onthe size; n is thenumber of atoms.
pro
pe
rty
1/n1/30.0 1.00.5
bulk
quantumsize effects
scalable
non-scalable
atom
1Cluster: Agglomerate of a defined number of atoms or molecules
1

1 Introduction and Motivation
Figure 1.2:Example of a prop-erty in the non-scalable regime:Melting temper-ature of sodiumclusters. Modifiedfrom [1] (group ofH. Haberland).
cluster size [number of atoms]
metl
ing
tem
pera
ture
[K]
Thus, nanoscience has been one of the most active fields in research during thelast two decades. Accordingly, suitable candidates for applications in the fields men-tioned above might be identified by systematic research on clusters. Clusters operatein the ultimate “nano”-size limit, since they can be generated with atomic precisionand the number of atoms can be varied, tailoring their properties as desired.
Several examples exist supporting this idea: Clusters of metals “suddenly” behavesimilar to semiconductors [2–4] and they can be even more “magnetic” than thecorresponding bulk material [5], if the number of atoms is varied. Also chemicalproperties change drastically with size: Gold and silver clusters show a pronouncedeven-odd alternation in reactivity towards oxygen [6–8], with the even numberedclusters being much more reactive. Furthermore, unexpected catalytic activity forgold clusters was discovered [9–14]. This is not limited to noble metal clusters: Thereactivity of iron clusters towards hydrogen can differ by several magnitudes withchanging size [15]. All these phenomena occur in the size regime between one andone hundred atoms. Based on studies of clusters or nanoparticles, also developmentsreaching into the fields of nuclear physics (tabletop nucleosynthesis driven by clus-ters) [16] or medicine (targeting of cancer cells using nanoparticles) [17] are reported.
Another intriguing issue is the perspective of hydrogen storage using new mate-rials, because “conventional” methods exhibit severe disadvantages for mobile appli-cations: Liquid hydrogen requires cryogenics, and storage as gas demands a highpressure container. In this respect, clusters might be good candidates (e.g. Al-hydrides) since they exhibit a superior ability to bind hydrogen. These propertiesbeing different from bulk materials can be varied systematically by changing thecluster size, which might lead to future applications in catalysis, hydrogen economyand other fields.
2

An important issue about energy conversion and storage is the interaction of pho-tons (e.g. sun light) with matter. Absorption of a photon usually just leads toheating of the surface. For photochemical applications and energy production fromsun light, storage of the photon energy in an excited state and subsequent conver-sion into chemical (e.g. photodissociation of water into oxygen and hydrogen) orelectrical energy (e.g. creation of an electron-hole pair in a solar cell) is desired. Inboth cases, the existence of a long-lived electronically excited state is essential tostore the energy of the photon for further processing. One future prospect wouldbe a device converting sun light directly into hydrogen. Conversion of the energyof a visible photon into chemical energy could proceed via the following scheme:AB + hν −→ AB
* −→ A + B. AB*
is an excited state of the molecule, which sub-sequently decays by dissociation. In the case of H2O, the energy needed for splittinginto hydrogen and oxygen is higher than the energy of a photon in the visible range.Thus, more complex reactions, e.g. involving a catalyst particle, need to be consid-ered [18].
In this respect, electronic properties, especially electron dynamics after photoexci-tation, become very important, since they are essential for understanding the under-lying mechanisms in numerous fields such as catalysis, absorption of electromagneticradiation or electrical conductivity. The development of fs-lasers (1 fs = 10−15 s)provided a new tool which can be used in cluster physics for studying electron andreaction dynamics in real-time. Questions about excited states, decay times, frag-mentation paths, photodissociaton or reaction time scales after photon absorptioncan now be addressed.
Relaxation of photoexcited states in clusters can be different to the known mecha-nisms in bulk metals with a continuum of occupied and unoccupied states close to theFermi energy. In the latter case, relaxation occurs usually via Auger-like electron-electron scattering processes, quenching excitations ultrafast within less than 50 fs[19]. Referring to energy production or storage, this process is undesired, since heatis a “low quality” form of energy, especially at relatively low temperature. An alter-native bulk decay channel is phonon-assisted relaxation, depending on the electroniclevel spacing. For clusters, both relaxation channels are hindered.
One well known example for a photon-induced process is desorption of molecules,such as O2 and CO, from metal surfaces [20]. Considering e.g. catalytic CO-oxidation, where adsorption of O2 is the first reaction step, desorption of O2 from ametal surface can be regarded as one of the inverse processes in catalysis. In almostall cases this process occurs indirectly, i.e. the initial excitation is quenched ultrafastand the desorption process is a statistical process mediated by subsequently createdhot electrons or phonons [21, 22]. Thus, only very low quantum yields can be foundfor photodesorption from bulk metals. For clusters, especially those exhibiting a
3

1 Introduction and Motivation
rather rigid structure (e.g. metal oxide clusters), excited states could have longerlifetimes, increasing the probability of direct photodesorption. The aim of this partof the study is to find an example of such a cluster with slow internal conversion,exhibiting long-lived excited states and high probability for direct photodesorption.
However, small nanoclusters with fluxional geometry have another ‘degree of free-dom’ different from bulk and large nanoparticles: They can undergo fast structuralchanges as a response to excitations. Subsequently relaxation can proceed very fastby internal conversion via a conical intersection. This concept can explain the fastrelaxation dynamics observed for Al13
-[23]. A similar process is considered as a
solution of the “phonon bottleneck” problem for semiconductor quantum dots [24](refer to footnote 10 for details).
In order to check the validity of the aforementioned ideas, the relaxation dynam-ics in the following size-selected clusters are studied: Agn
-up to n = 21; AgnO2
-
with n = 2, 3, 4, 8; Ag2O3-, Au2O
-and AunO2
-for n = 1, 2. The technique used
is time-resolved photoelectron spectroscopy, which is capable of detecting ultrafastprocesses on the time scale of femtoseconds. The research done in this work repre-sents the starting point for further systematic studies which will be extended e.g. toH photodesorption of metal(H2O) clusters.
4

2 State of the Art
2.1 Gold and Silver Clusters
Noble metal clusters are usually generated by laser vaporization or sputter sources,because the high melting point makes the use of an oven difficult. The first pioneer-ing photoelectron spectroscopy (PES) (see section 3.2) experiments on these clustershave been performed as early as 1987 from the group of W. C. Lineberger [25]. Tothis day, many papers are published every year dealing mainly with the electronic,geometric and chemical properties of clusters.
2.1.1 Electronic Structure
The HOMO of the noble metals silver and gold is occupied by a single electron.The electronic configuration of silver is [Kr]4d105s1 and that of gold [Xe]4f145d106s1.Accordingly, noble metals are monovalent, i.e. there is one unpaired electron peratom. In contrast to alkali metals, directly below the s-orbital a completely filledd-orbital exists. The electronic structure of gold is more complicated than that ofcopper and silver due to two effects: On the one hand, the relativistic contraction ofthe 6s-orbital leads to stronger bonds, smaller binding distances and higher electronaffinities. On the other hand, the 5d-orbitals have a large spin-orbit splitting, whichyields energetically separated orbitals, especially for small clusters [26].
Results of PES experiments for studying the electronic structure of gold and silverclusters have been published in several articles [25–35]. R. E. Smalley and co-workersshowed [31] that most of the copper, silver and gold cluster anions for sizes of around8 to 70 atoms can be described quite well by the shell model (section 3.1.1). How-ever, the 5d-electrons of gold, the 4d-electrons of silver and the 3d-electrons of copperdo not exhibit shell closings. Furthermore, an even-odd alternation of the electronaffinities was found, so that clusters consisting of an even number of atoms have alower electron affinity than those consisting of an odd number of atoms [31]. Themagnitude of this alternation is around 0.5 eV for copper and silver and around1 eV for gold clusters. The reason for the higher difference in case of gold is thestronger interaction between the gold atoms due to relativistic effects [36]: As theatomic nuclear charge increases, electrons penetrating to the nucleus (for s-orbitals)
5

2 State of the Art
increase their velocity and consequently their mass due to special relativity. Thiseffect causes the s-orbitals to be smaller than expected classically. Therefore, theelectrons are bound stronger, shielding d-electrons more effectively [37–40]. In thesize range of 53–58 atoms, near the geometric shell closing (55 atoms), the observedelectronic density of states (DOS) is not represented by the simple electronic shellstructure, but is strongly influenced by electron-lattice interactions [41]. Only Ag55
-
and Cu55-exhibit highly degenerate states, which is a consequence of their icosahe-
dral symmetry. Neighboring sizes have perturbed electronic structures due to theirlower symmetries. Gold clusters in the same size range show completely differentspectra with almost no degeneracy, which indicates structures of much lower sym-metry. This behavior is attributed to strong relativistic bonding effects. In additionto the alkali metals, silver is the one metal with electronic properties most similarto a Fermi liquid [19]. Among the coinage metals, Ag clusters can be seen as thebest example for the electronic shell model with the least influence of d-electrons [34].
2.1.2 Geometric Structure
Direct experimental access to the geometry is difficult because of the relatively lowintensity of mass selected cluster beams. Structures of small clusters have been as-signed by experimental photodissociation spectra in combination with calculated ab-sorption spectra [42–47]. PES has also been applied to the assignment of structuresfor metal clusters by comparing simulations to experimental data [35, 41, 48, 49].Besides that, ion mobility measurements combined with calculations were used forthe determination of cluster structures. In those experiments, the collision cross sec-tion of the clusters is measured when passing through a drift cell, which is filled witha buffer gas (e.g. helium). Approximately, the smaller the collision probability, themore compact the cluster. The ion mobility method was developed by E. McDanieland others [50], combined with modern mass spectrometry in the group of M. Bowers[51–53] and applied to various cluster ions by M. F. Jarrold and co-workers [54–57].Another experimental method for gaining information on the structure of clustersis trapped ion electron diffraction (TIED) on clusters [58, 59], which was developedin the group of J. H. Parks at Harvard. Clusters are trapped in a radio-frequency-trap, then irradiated by an electron beam. Afterwards the diffracted electrons aredetected on a screen. Due to the low target density, special care has to be takento minimize and subtract the background electron signal. One of the problems instudying mass selected clusters and assigning structures to the experimental data is,that sources routinely generate a mixture of isomers. To shed light on the propertiesof different isomers, a combination of ion mobility measurements with PES couldbe applied [60]. However, since the ion intensity after isomer selection usually dropssignificantly, this combination was not yet used to study small gold or silver clusters.New techniques like A. Shvartsburg’s isomer separating 100 % permeability drift cell
6

2.1 Gold and Silver Clusters
(using ion funnels) are promising possibilizties, but not yet experimentally realizedin cluster science.
Ion mobility measurements in combination with calculations were performed inthe group of M. M. Kappes on Aun
-(n < 16) [61], Aun
+(n < 14) [62] and Agn
+
(n < 12) [63] clusters. Surprisingly, for gold cluster anions planar structures up tosizes of n = 11 were found, whereas silver clusters start forming 3-D structures atmuch smaller sizes (n ∼ 5 − 7). This preference of gold clusters for 2-D structuresis a direct consequence of the relativistic effects mentioned above.Further theoretical studies of Hakkinen et al. [64] and Fernandez et al. [65] pre-dict planar structures up to n = 13 and n = 12, respectively. Gold cations have3D-structures, starting at n = 8 [62, 65], whereas the neutral gold clusters are pro-posed to be planar up to n = 11 atoms [65]. Another theoretical study indicates the2D-3D transition occuring at a size of seven atoms for the neutrals [66]. For sizesof n = 10 – 14, flat cage structures are preferred, while larger neutrals might formspherical structures. PES studies in the group of L.-S. Wang combined with DFTcalculations of the group of Hakkinen and Landman [67] confirmed the ion mobilitymeasurements of the Kappes group, suggesting Aun
-to be planar up to n = 12 and
the 2D-3D transition is proposed to take place via cage-like structures. Besides that,evidence of multiple isomers was found for n = 4, 8, 10, 12, and 13.In a very recent (2007) quantum molecular dynamics study, it is reported that Aun
-
may exhibit a novel, planar liquid phase which coexists with a normal 3D-liquid[68]. In experiments, the entropy-favored 3D-liquid anions often supercool and so-lidify into the“wrong”dimensionality. This fact might explain that the experimentalverification of theoretical predictions is more complicated than expected.For anions having 16–18 and 21–24 atoms, experimental and theoretical evidencefor hollow cage-like structures has been found very recently in 2006 [69, 70, 12]. Atn = 25, a structural transition from hollow/tubular to core/shell compact structureis observed [71].A tetrahedral structure, corresponding to a fragment of the face-centered cubic (fcc)bulk structure, was reported for Au20
-by the group of L.-S. Wang [49] (see fig. 3.1).
The HOMO-LUMO1 gap (1.77 eV) is even larger than that of C60 ([72] and fig. 3.1)and the electron affinity is comparable to the one of C60, indicating high stabilityand chemical inertness.By a comparison of PES with calculated DOS, Au32
-was assigned an amorphous
but dense structure [73].For medium sized neutral gold clusters Aun with n = 32–35 [74, 75], 42 [76] and 50[77], cage-like structures are proposed.Low-symmetry “disordered” chiral structures were proposed for Au28 and Au55 [78].These findings were supported by a combined PES and theoretical study [41], which
1LUMO = lowest unoccupied molecular orbital
7

2 State of the Art
excluded high-symmetry structures for Au55-, but found icosahedral structures for
Ag55-and Cu55
-. For the anion Au34
-, a chiral structure is reported [79].
A very recent study from 2006 showed that some of the cage structures found in[69] can be doped (e.g. with Cu), leading to endohedral golden buckyballs such asCu@Au16
-and Cu@Au17
-[80].
For silver cluster cations ion mobility experiments and joined calculations [63]show that these clusters start forming 3D-structures at n = 5, i.e. they behave“more normal” than gold clusters. A purely theoretical work [65] proposes planarstructures up to n = 5. In the same article, also small Agn
-and Agn clusters were
investigated. The onset for 3D-structures is proposed to be n = 6 for the anions andn = 7 for the neutrals. The tendency of gold clusters for planarity, which is muchstronger than for silver (and copper [65]), is attributed to the relativistic effectsmentioned above, which lead to a hybridization of the 6s and 5d-orbitals.By means of TIED in comparison with theoretical molecular scattering functionsand calculations of geometrical structures, certain Agn
+cluster cations in the size
range (18 < n < 80) and Ag55-have been investigated in the group of M. M. Kappes
[81, 82]. Ag55+
is an ideal Mackay icosahedron, Ag55-
a weakly Jahn-Teller2 dis-torted icosahedron and the other clusters (Ag19
+, Ag38
+, Ag59
+, Ag75
+, Ag79
+) can
also be described best by structures based on the icosahedral motif. Using the sameexperimental technique, the structural evolution of Agn
+in the range n = 36 – 55
was studied [83]. In the region n < 55, local order having fivefold symmetry wasfound to dominate the cluster structures and global order having icosahedral sym-metry at the closed shell size n = 55.
2.1.3 Chemical Properties
The chemical properties of clusters can drastically change with decreasing cluster sizeand might be very different compared to the corresponding bulk material [9, 84].Gold, for instance, is inert as bulk material but reactive and catalytically activefor certain sizes. Haruta’s discovery of gold nanoparticles acting as extremely ac-tive catalysts even at low temperature [85] fueled research in this field [86]. Thesenanoparticles, as large as 2− 3 nm, were shown to be active for various reactions,such as CO-oxidation [87, 88]. Ag nanoparticles with an average size of 2− 3 nmturned out to be as catalytically active as their Au counterparts [89]. Concerningthe CO-oxidation reaction, formation of different oxide species as a function of par-ticle size was suggested to be responsible for the size selectivity in chemical reactionscatalyzed by Ag nanoparticles [90]. The efficiency of catalysts is influenced mainlyby the particle size and the substrate [37].
2See section 3.1.2 for details
8

2.1 Gold and Silver Clusters
Most of the catalysts used in surface science have a certain particle size distri-bution, which does not allow investigations of cluster size selectivity on an atom-by-atom basis. Mass selected clusters can overcome this problem and provide abetter understanding of the underlying mechanisms [37]. Furthermore, results canbe compared with theoretical studies, which is difficult for nanoparticles on sub-strates, having distinct size distributions.Investigations of mass selected Au clusters deposited onto MgO(100) surfaces byU. Heiz and co-workers showed, that clusters in the size range of 8–20 atoms arereactive towards CO-oxidation [9, 11]. In combination with theoretical calculations,it was proposed that charge transfer from defect sites plays an important role forthe enhanced catalytic activity. A collaboration of the groups of Y. D. Kim andG. Gantefor found Aun clusters supported on silica with n = 5 and 7 to be resistanttowards oxidation, whereas other clusters could be oxidized and reduced by O andCO [13]. In contrast, for mass selceted Au clusters on sputtered HOPG, only Au8
was found to be active towards oxidation/reduction [14]. However, Au5 and Au7
turned out to be inert towards the oxidation and STM-images suggest that theseclusters exist as individual particles rather than forming larger particles on the sur-face [37].
Based on the results from surface science, further investigations on chemical prop-erties of gas phase clusters were triggered. One of the advantages of gas phase clus-ters is the easier mass separation compared to deposited clusters. For depositedclusters, diffusion might take place which can lead to aggregations of clusters [37].Furthermore, the interaction with the substrate can modify the cluster properties.Thus, by comparing chemical properties of gas phase clusters to the correspondingdeposited clusters, a better understanding of the metal-support interactions can beobtained. Recently, it has been shown that mass selected gold cluster anions inthe gas phase exhibit comparable catalytic activities to those of deposited clusters,confirming the importance of the negative charge in this respect [6, 7, 10, 91].
The increased catalytic activities seem not to be limited to Au, but are also rele-vant for other materials: For both Au and Ag clusters anions in the size regime upto n = 20 atoms, a pronounced even-odd alternation has been found with the evennumbered cluster anions being much more reactive, chemisorbing O2 [6–8].Figure 2.1 displays a mass spectrum of Agn
-clusters reacted with O2 molecules,
where the even-odd alternation in reactivity can be observed: The even numberedclusters Ag2
-, Ag4
-, Ag8
-, Ag10
-and Ag12
-almost completely react with O2, while
Ag3-, Ag7
-and Ag9
-are inert (Ag5
-and Ag6
-have too low intensities and are not
discussed). According to spectroscopic results, the O2 binds molecularly to Agn-
[8] and Aun-[7, 91, 93] clusters, since for some clusters a fine structure in the PES
spectra was observed, which has been assigned to the O-O stretching vibration. Theeven-odd alternation can be understood in terms of a simple charge transfer picture:
9

2 State of the Art
2 0 0 4 0 0 6 0 0 8 0 0 1 0 0 0 1 2 0 0 1 4 0 0
7
2 + O 2
4 + O 2
3 + O 2
1 2 + O 2
1 0 + O 28 + O 2
1 1
9Int
ensit
y (arb
. unit
s)
M a s s ( a m u )
3 A g n- + O 2
Figure 2.1: Mass spectrum of Agn-
clusters reacted with molecular O2. Clusterswith even number n of Ag atoms easily adsorb a single O2 molecule (red). Theodd-numbered clusters (blue) react weakly with O2 (e.g. Ag3
-+ O2) [8, 92].
The bond between the metal cluster anion and the O2 molecule is formed by chargetransfer from the cluster to the O2. The easier the transfer, the faster the reac-tion can occur. Aun
-and Agn
-clusters exhibit a pronounced even-odd alternation
of electron affinities with the clusters having an odd number of electrons (= evennumber of metal atoms) showing low electron affinities (see section 2.1.1).Adsorption of a single oxygen atom can be observed for Au
-, even when provid-
ing O2 molecules in the cluster source, and for larger clusters, if atomic oxygen isprovided [93]. If atomic oxygen introduced in the cluster source, also species withdissociatively chemisorbed oxygen can be generated [92]. For Ag2O2
-, dissociative
chemisorption was detected for a small fraction of clusters, depending on the con-ditions in the cluster source. In case of Au4O2
-, a new isomer was produced which
exhibits also dissociatively bound O2 [92]. Larger gold and silver cluster anions(n > 20) behave chemically completely different: Aun
-are inert towards O2 [7],
whereas Agn-are still reactive [8].
In contrast to the anions, small gold cluster cations are unreactive towards adsorp-tion of O2, with Au10
+being the only exception [94]. A theoretical study predicts
that for gold neutrals up to six atoms only Au3 and Au5 can adsorb O2 [95]. Smallsilver anions, cations and neutrals in the size regime up to seven atoms have been
10

2.1 Gold and Silver Clusters
studied theoretically by Zhou et al. [96], confirming the experimental findings onthe O2 adsorption of the anions. For the cations, the adsorption energies are pro-posed to be generally smaller than those of the anions and neutrals, reaching a localmaximum at Ag4O2
+.
The interaction of Ag2+
with O2 was investigated in a multi-collision experi-ment at various temperatures in an ion trap by the group of T. M. Bernhardt andL. Woste [97]. As product, Ag2O
+was detected and Ag2O2
+as intermediate step
identified. The absolute rate coefficients and activation energies for molecular ad-sorption were given. In a comparison of experiment and theory, AgnOm
+cations
with m = 0, 1 and 2 were investigated [98]. For the bare clusters, 2D-structureswere found up to seven atoms and 3D-structures for larger clusters. In contrast, 3D-structures were observed for all oxidized clusters. It was found that the electronicshell structure of the metallic part still persists after oxidation, considering thateach oxygen atom reduces the number of valence electrons by two. This leads to un-usual evaporation channels such as the preference of Ag3O
+to eject a single oxygen
atom. The dioxides undergo a structural transition from Ag5O2+
(the silver atomsare separated by the oxygen atoms) to Ag7O2
+(here the atoms form a pentagonal
bi-pyramid, where the two oxygen atoms stay on opposite sides on the outer surfaceof the cluster). In another article, the adsorption of oxygen and nitrogen to smallsilver cluster cations (up to 25 atoms) was studied experimentally, using a temper-ature controlled reaction chamber [99]. It was concluded that oxygen molecularlychemisorbs to the clusters at a temperature of 77 K, transferring one electron to thesilver. Above 105 K, chemisorption transforms into oxidation, involving dissociationof the O2 molecule and releasing a single oxygen atom. In case of nitrogen, an equi-librium between sticking and evaporation takes place, depending on temperatureand cluster size, which was attributed to a weak induced dipole-dipole interaction.
Joint experimental and theoretical studies of the groups of A. W. Castleman, Jr.and V. Bonacic-Koutecky on the interaction between AunOm
-with CO show that
multiple oxygen atoms can adsorb to the Aun-clusters, if oxygen is inserted into the
laser vaporization source, being present both as molecules and atoms [100, 101]. Nospecial size dependence in the oxygen uptake pattern was found. However, a strongsize-selectivity was observed for the reaction with CO, revealing AunOm
-with odd
number of gold atoms adsorbing multiple CO molecules, whereas cluster anions hav-ing an even number of gold atoms mostly did not show signs of multiple attached COmolecules. More detailed information on the chemical properties of coinage metalcluster anions can be found in an review article by Y. D. Kim [37]. In the reviewby T. M. Bernhardt [86], a description of reactions and catalysis of small gold andsilver clusters is given.
Before cluster dynamics is discussed, the electronic, geometric and chemical prop-
11

2 State of the Art
erties of gold and silver clusters which are most important for the present work willbe summarized:
• Small gold and silver clusters can be described quite well by the shell model.Besides that, they exhibit a pronounced even-odd alternation of the electronaffinity (clusters consisting of an even number of atoms have a lower EA thanthose consisting of an odd number of atoms)
• The properties of gold clusters are more influenced by relativistic effects thanthose of silver cluster, which lead e.g. to rigid and planar structures for rel-atively big cluster anions in case of gold (n ∼ 11), whereas the transition to3-D structures for silver cluster anions occurs at smaller size (n ∼ 6)
• Gold and silver clusters and nanoparticles are catalytically very active
• An even-odd alternation in reactivity up to n = 20 atoms can be observedfor both Aun
-and Agn
-, with the even numbered clusters being more reactive
towards absorption of O2 than the odd numbered
• O2 binds molecularly to Aun-and Agn
-in the size regime up to n = 20
• If atomic oxygen is provided in the cluster source, also species with dissocia-tively bound oxygen can be generated
2.2 Femtosecond Spectroscopy
Systematic Studies on the dynamics of excited states in molecules and bulk materialswere facilitated not until the development of fs-lasers, allowing pulse durations ofless than 100 fs (section 3.7) [102–110]. The basic principle of these experiments isto induce a process (e.g. electron-hole excitation) by absorption of a pump-photonand subsequent probing of the time evolution of the studied system. This can bedone e.g. by irradiating the target with a probe-photon at variable time-delay fol-lowing the pump pulse (see 4.5). Various probe signals, such as photoluminescence,photoions or photoelectrons, are monitored to reveal the evolution in time of thechosen system.
The relaxation of photoexcited electrons is shown for a Cu(111)-surface in figure2.2 [111]. A non-equilibrium electron distribution generated by the pump pulse re-laxes by ultrafast electron-electron scattering (see section 3.5.1). The smaller theexcitation above the Fermi-level, the slower the relaxation rate. Several papers onrelaxation dynamics at metal surfaces have been published, mainly based on time-resolved photoelectron spectroscopy (TR-PES, see section 3.2.4). For silver, goodagreement with Fermi liquid theory has been found, whereas for gold and copper
12

2.2 Femtosecond Spectroscopy
the relaxation rates are considerably lower than predicted [107, 19]. Complete ther-malization of the electron gas was observed after 1 ps for gold [109, 112].
0,0 0,5 1,0 1,5 2,0
Energy above E [eV]Vac
0
200
400
600
800 Pump-P
robe
Delay
[fs]
n = 0
n = 1
secondary-electrons
primary-electrons
Cu (111)single crystal
Figure 2.2: TR-PES of a Cu(111)-surface. Shown is the intensity versus pump-probe delay. Positive times correspond to excitation with 2.35 eV and probing with4.7 eV. For negative delays, the pulse order is reversed. The liefetime of the primaryelectrons is less than 20 fs [111].
Semiconductors should generally exhibit longer relaxation times compared to met-als, since the DOS close to the Fermi-level is lower (caused by the band gap) andtherefore electron-electron scattering is negligible. However, the relaxation dynam-ics strongly depend on the quality of the surface and on defects. For an excited stateof the Si(111)(2×1)-surface, lifetimes of several hundred picoseconds were observed[113].
2.2.1 Time-Resolved Spectroscopy of Clusters
TR-PES was used for the first time on mass selected clusters in the group ofD. M. Neumark in Berkeley to study the dissociation of I2
-[114]. Several publi-
cations in the field of physical chemistry followed, dealing mainly with dissociation,caging dynamics and CTTS (“charge transfer to solvent”) dynamics of moleculesand clusters [115–125]. Recently, the dynamics of methanol clusters [126, 127] andtogether with O. Cheshnovsky the dynamics of bare water clusters [128, 129] were
13

2 State of the Art
studied. In another collaboration with O. Cheshnovsky, mercury clusters were in-vestigated. For Hgn
-(11 ≤ n ≤ 16, 18), the dynamics following intraband excitation
into the p-band by 1.53 eV were monitored [130]. Decay of the initially excitedstates occurred within 10 ps and subsequent relaxation proceeded on a timescaleof 50− 100 ps. The dynamics were assigned to radiationless transitions within themanifold of p states, similar to a semiconductor3. Only Hg11
-showed a behavior dif-
ferent from the other clusters, having a much longer lifetime of the initially preparedstate (33.9 ps). In a following study, the intraband excitation dynamics of smallerHgn
-clusters with (n = 7−13, 15, 18) were examined, using a pump energy of 1.0 eV
[131]. The relaxation dynamics were similar to those observed for larger mercuryclusters, although exhibiting on average relaxation rates two to three times faster.For Hg7
-(figure 2.3) and Hg8
-an oscillatory structure in the signal was found, which
was assigned to the activation of nuclear wave packet motion following excitation.
@1118# intensities have been normalized according to theirrespective values atn57 for purposes of comparison. Sizedependence of the@111# intensities could only be tracked toHg12
2 , after which resonant interband photodetachment ob-scures resonant intraband photodetachment signal~see Fig.3!. The contribution to the@1118# signal from resonant in-terband photodetachment was estimated and subtracted. Er-ror bars for both relative feature intensities were determinedbased on the reproducibility of intraband resonant relative todirect 395 nm photodetachment signal.
Figure 10 illustrates that@111# and@1118# signal inten-sities measured within the temporal pulse overlap exhibit thesame intensity reduction with cluster size. As these featuresare separated by;2.15 eV, a range over which the photode-tachment cross-section decreases dramatically, these virtuallyidentical trends indicate a reduction in the intraband absorp-tion cross-section at 1.0 eV with cluster size.
D. Photoelectron angular distributions
The 1250 nm@111# PADs collected were fit to the stan-dard expression,36
FIG. 5. TRPES ‘‘waterfall’’ progression of intraband relaxation dynamics:~a! Hg7
2 ; ~b! Hg122 . Resonantinterbandphotodetachment~Fig. 1, process
D! observed forn.11 is labeled.
FIG. 6. Early-delay Hg72 relaxation dynamics. Dashed arrows indicate the
gate-integrated and mutually out-of-phase spectral windows used tofrequency-analyze signal oscillations~see Fig. 9!.
FIG. 7. Time-dependent integrated spectral intensities gated over the initial(Dt50 ps) two-color photodetachment features.~a! Hg7
2 ; ~b! Hg122 . Fitted
single exponential decay curves~black! are overlaid and correspond to thetime scales given in Table I. The inset of~a! shows early-delay single oscil-lations, which reflect nuclear wave packet motion.
054314-6 Bragg et al. J. Chem. Phys. 122, 054314 (2005)
Downloaded 27 Jan 2005 to 134.34.142.102. Redistribution subject to AIP license or copyright, see http://jcp.aip.org/jcp/copyright.jsp
Figure 2.3:Time-resolved photoelectronspectra of the intraband re-laxation of Hg7
-, showing
oscillatory wave packet motionof the excited state [131].
TR-PES on metal clusters was first used by G. Gantefor and W. Eberhardt [132].In this work, the photodissociation of Au3
-was investigated, using a one-color pump-
probe experiment with a photon energy of 3.0 eV. The metastable excited state(Au3
-)*
was prepared by absorption of the pump photon, which fragments into Au2
and Au, exhibiting two different decay channels:
Au3-+ hν −→ (Au3
-)* −→ Au1
-+ Au2 (i)
−→ Au2-+ Au1 (ii)
3Small mercury clusters can indeed be regarded as semiconductors, exhibiting a band gap whichdecreases with increasing cluster size [4]
14

2.2 Femtosecond Spectroscopy
In case (i), the negative charge remains on the gold atom and in case (ii) on the dimer.
Figure 2.4(a) shows the photoelectron spectra of Au1-
(a), Au2-
(b) and Au3-
(c).The time-resolved spectrum (d) of Au3
-consists of a superposition of the features
visible in the spectra (a), (b) and (c), showing the fragmentation of Au3-. Analyzing
the time-resolved spectra in figure 2.4(b), a broad maximum (dashed), appearing
after only 0.6 ps, can be observed, which is assigned to the excited state (Au3-)*.
(a) (b)
Figure 2.4: 2.4(a) shows photoelectron spectra of (a) Au1-, (b) Au2
-, (c) Au3
-and
a pump-probe spectrum (d) of Au3-
at a delay of 3.6 ns. In fig. 2.4(b), a seriesof pump-probe spectra of Au3
-in the energy range of the Au1
-fragment peak is
depicted. The numbers correspond to the time-delay between pump and probe pulsein picoseconds [132].
15

2 State of the Art
Figure 2.5:Scheme of the potential energy sur-face involved in the photodissocia-tion of Au3
-[132].
This maximum develops with increasing delay into the narrow peak (black) of Au1-,
which grows in intensity for longer delays whereas the broad maximum concomi-tantly weakens.
In figure 2.5 a scheme of the potential energy surfaces is illustrated, which can beused to explain the processes and the three transient stages involved:At stage I (delay 0 ps) the pump pulse excites the cluster from its ground state Xinto the excited state A, which is still in the same geometry as the ground state,yielding spectrum (c) in figure 2.4(a).For delays < 0.2 ps the cluster is in stage II and relaxes into the new equilibriumgeometry of the excited state A, having a geometry different from the ground state.This process occurs on a timescale comparable to the experimental time resolution(230 fs) and leads to the appearance of the broad maximum (dashed) in figure 2.4(b).At stage III, i.e. for delays < 0.1 ns, the energy of the absorbed photon is partlytransferred to the vibrational degrees of freedom of the cluster. It is sufficient tobreak the bond, thus dissociation is possible at any time> 0.2 ns. Owing to its statis-tical nature, this process follows an exponential decay, yielding the spectrum in figure2.4(a) (d). The lifetime of the excited state was measured to be (1500± 200) ps.In summary, the dynamics of Au3
-does not show the characteristics of a metal, but
rather the behavior of a molecule.
In a collaboration of the groups of G. Gantefor and P. Leiderer, an excited stateof C3
-was studied using TR-PES [133, 134]. From the time-resolved spectra, the
lifetime of the excited state (2.6± 0.7 ps) and the relaxation mechanisms, i.e. theconfigurations of the participating electronic states, could be determined. The dy-namics after photoexcitation is again different from metals or semiconductors: Theexcited state is attributed to a Feshbach resonance and relaxation occurs via elec-tronic autodetachment, which is well known in molecular physics [135].
16
2.2 Femtosecond Spectroscopy
The group of W. Eberhardt and M. Neeb studies the relaxation dynamics ofmass-selected clusters, especially small clusters of open d-shell metals [136–141]. Incontrast to Hgn
-, Au3
-and C3
-, the lifetime of an excited state of Pt3
-was found
to be less than 70 fs, implying that electron relaxation in clusters consisting of onlythree atoms can already be as fast as for bulk metals [138]. The ultrafast relaxationwas attributed to inelastic electron-electron scattering processes due to the alreadyhigh DOS close to the HOMO, which originates from the open d-shell of platinum.Ultrafast electron relaxation was also observed for other open d-shell transition met-als. Pd3
-, Pd4
-and Pd7
-exhibit excited states having lifetimes of 42 fs, 91 fs and
25 fs, respectively [139, 140]. Energy transfer to the vibrational modes occurs within10 ps. In case of Ni3
-, an excited state having a lifetime of 215 fs and an electron-
phonon coupling time of about 450 fs was observed [141].
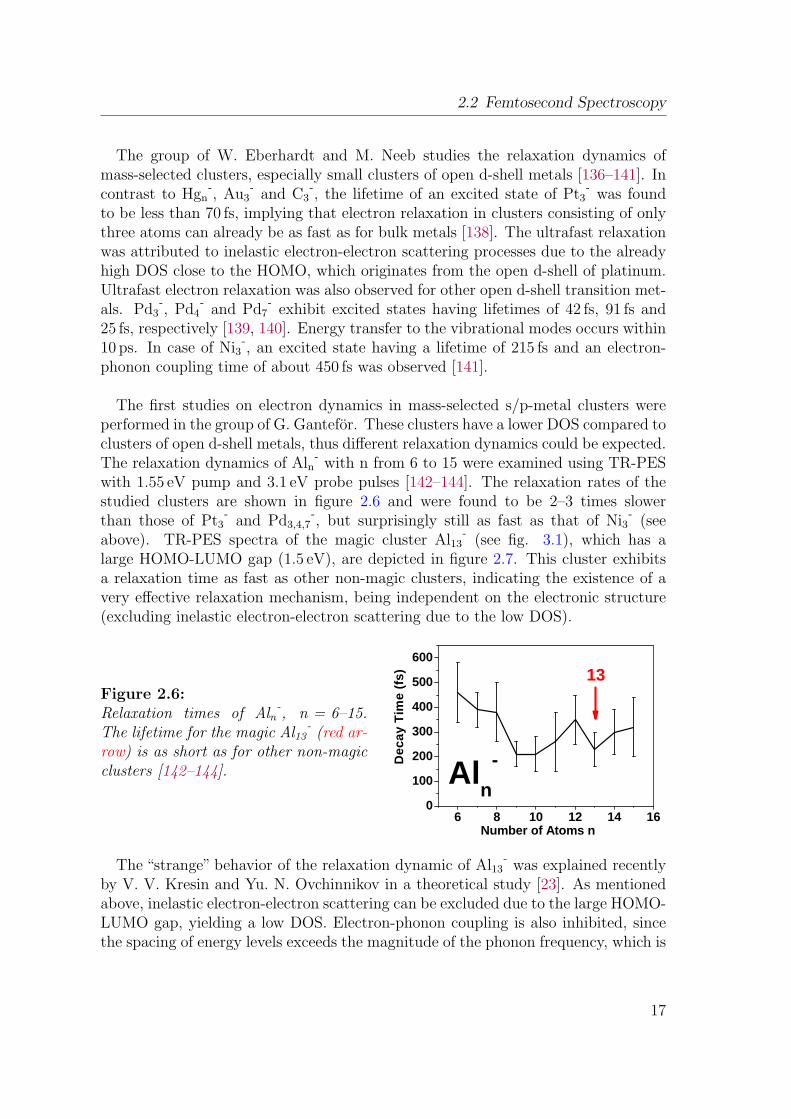
The first studies on electron dynamics in mass-selected s/p-metal clusters wereperformed in the group of G. Gantefor. These clusters have a lower DOS compared toclusters of open d-shell metals, thus different relaxation dynamics could be expected.The relaxation dynamics of Aln
-with n from 6 to 15 were examined using TR-PES
with 1.55 eV pump and 3.1 eV probe pulses [142–144]. The relaxation rates of thestudied clusters are shown in figure 2.6 and were found to be 2–3 times slowerthan those of Pt3
-and Pd3,4,7
-, but surprisingly still as fast as that of Ni3
-(see
above). TR-PES spectra of the magic cluster Al13-
(see fig. 3.1), which has alarge HOMO-LUMO gap (1.5 eV), are depicted in figure 2.7. This cluster exhibitsa relaxation time as fast as other non-magic clusters, indicating the existence of avery effective relaxation mechanism, being independent on the electronic structure(excluding inelastic electron-electron scattering due to the low DOS).
Figure 2.6:Relaxation times of Aln
-, n = 6–15.
The lifetime for the magic Al13-(red ar-
row) is as short as for other non-magicclusters [142–144].
6 8 1 0 1 2 1 4 1 601 0 02 0 03 0 04 0 05 0 06 0 0
1 3
A l n-
N u m b e r o f A t o m s n
Deca
y Tim
e (fs)
The “strange” behavior of the relaxation dynamic of Al13-was explained recently
by V. V. Kresin and Yu. N. Ovchinnikov in a theoretical study [23]. As mentionedabove, inelastic electron-electron scattering can be excluded due to the large HOMO-LUMO gap, yielding a low DOS. Electron-phonon coupling is also inhibited, sincethe spacing of energy levels exceeds the magnitude of the phonon frequency, which is
17

2 State of the Art
Figure 2.7:TR-PES difference spectra of Al13
-. The first spec-
trum from the top (trace A) is a standard UPSspectrum obtained with an excimer laser (hν =6.4 eV). The series of spectra displays the time-dependence of the pump-probe signal. The spec-trum recorded at zero delay is also displayed in thetop window for comparison. The observation of anarrow peak (marked B) in the TR-PES spectra isunique for the Aln
-clusters with n = 6 − 15. The
broad ‘background’-like signal between 1.5− 3 eVwas attributed to multi-photon processes [142, 143].Please note that Al13
-is a double magic cluster with
a HOMO-LUMO gap of 1.5 eV. Hence, at least apicosecond lifetime of the HOMO-LUMO excitationwas expected!
2 . 5 2 . 0 1 . 5 1 . 0
6 0 0 f s
B i n d i n g E n e r g y ( e V )
Inten
sity (
arb .u
nits)
2 7 0 f s
2 0 0 f s
7 0 f s
A l 1 3-
B
BAR e f .
0 f sp u m p +p r o b e
B i n d i n g E n e r g y ( e V )6 5 4 3 2 1 0
0 f s
∼ 40 meV for aluminum. This would require a relaxation process involving multiplephonons, which is very unlikely (leading to a longer lifetime for a cluster ensemble).According to Kresin and Ovchinnikov, the cluster undergoes a Jahn-Teller shapedeformation following excitation, representing a collective and coherent vibrationalexcitation. This can be illustrated using a Clemenger-Nilsson diagram (see figures3.4 and 5.11 for details): The new energetic minimum of the excited cluster has ageometry different from the ground state, leading to deformation and consequentlylevel crossing of the involved states. Thus, relaxation proceeds by internal conversionthrough a conical intersection (see figure 3.7).
Experimental studies on gold clusters revealed relaxation times above 1 ns for Au3-
and Au6-
[143, 145, 146]. TR-PES spectra of Au6-, illustrating the dynamics, are
shown in figure 2.8. This behavior can be understood in terms of an increased levelspacing between different energy levels compared to open d-shell metals or Aln
-,
which was attributed to the larger splitting of the molecular orbitals due to rela-tivistic effects (see section 2.1.1). The higher time resolution in this work comparedto the photodissociation study mentioned above [132] allowed for the observation ofwave-packet motion in Au3
-in real time. The magic cluster Si4
-was also studied by
18

2.2 Femtosecond Spectroscopy
0 . 5 1 . 0 1 . 5 2 . 0 2 . 5 3 . 0
A u 6-
Norm
alize
d inte
nsity
(arb
. unit
s)
K i n e t i c E n e r g y ( e V )
1 6 0 0 p s1 3 0 0 p s1 0 0 0 p s
7 0 0 p s5 0 0 p s3 0 0 p s
0 p s
Figure 2.8:TR-PES of Au6
-. Displayed is the time-
dependent pump-probe signal, decaying on atimescale above 1 ns [146, 143].
this group by TR-PES (pump 1.5 eV, probe 3.05 eV), showing excited states withdecay times about 1.2 ps, respectively [143]. This intermediate behavior comparedto Aln
-and Aun
-is attributed to electron-phonon assisted relaxation, since the DOS
(HOMO-LUMO gap 1 eV) is again very low.
Very recently, the group of B. v. Issendorff started doing time-resolved pump-probe photoelectron spectroscopy on clusters. They combined this technique withphotofragment spectroscopy to investigate free sodium cluster cations Nan
+with
n = 16–250 [147, 148]. Thermionic emission was used to determine the electron-phonon coupling constants. No deviation from the two-temperature model (seesection 3.5.2) was found and the coupling constants seem to exhibit a smooth con-vergence towards the bulk value. Surprisingly, no strong quantum size effect wasobserved even for the smallest cluster size. A possible reason is the relatively highphoton energy deposited in the cluster (3.1 eV is used for the pump pulse and multi-photon absorption takes place), leading to a high DOS available for energy transferfrom the electronic system to the lattice. This is suggested to proceed via relax-ation of multiparticle states, i.e. electron-phonon coupling has to be regarded as thetransition from one correlated all electron state to a lower lying, vibrationally moreexcited one, instead of a single phonon creation connected with the simple transitionof one electron from one single particle level to another one.
Results on the dynamics of Ag3 and Ag4 were obtained performing NeNePo stud-ies (see page 24) in the group of L. Woste, where a rapid change of geometry after
19

2 State of the Art
photodetachment has been measured, indicating a rather fluxional geometry4 of thetrimer [149–151]. Furthermore, wave-packet motion of the tetramer could be ob-served [152]. For neutral Ag3, an excited state having a lifetime of 5.7 ns was foundin a two-color pump-probe experiment in the group of Meiwes-Broer [153].
For neutral Ag8 in helium droplets, a very narrow absorption resonance has beenfound [154], implying a long-lived excited state. This observation was confirmed byMeiwes-Broer and co-workers, using a similar experiment [155] and later perform-ing two-photon photoionization measurements [156]. Even fluorescence in an Argonmatrix was observed for Ag8 after excitation [157].
In a very recent work in the group of W. Eberhardt and M. Neeb, Aun-(n = 5–8,
14, 20) and Wn-
(n = 3–14) were investigated by means of TR-PES [158]. Usinga pump energy of 1.56 eV and a probe energy of 3.12 eV, an extremely long-livedexcited state was observed for Au6
-, exhibiting a lifetime > 90 ns. For time-delays
> 750 ps, a ns-pulse of the third harmonic of a Nd:YAG (3.5 eV) was used as probepulse, which was triggered electronically. In collaboration with theory (M. Walter,University of Jyvaskyla), it was proposed that internal conversion is hampered dueto symmetry reasons, yielding a planar structure even after excitation. A possiblerelaxation mechanism might be photon emission, exhibiting a time constant > 700 nsaccording to theory. In case of Au5
-, an excited state exhibiting an oscillatory wave-
packet dynamic with a period of 315 fs was observed, while the excitation decays ona picosecond timescale. Au7
-and Au8
-have initially excited states, which decay by
internal conversion on a timescale of 1.8 ps and 650 fs, respectively. The TR-PESspectra of Au7
-are shown in figure 2.9. Together with theory (group of Bonacic-
Koutecky) it was concluded, that both clusters melt, i.e. strong fluctuations ingeometry are present but no well-defined isomers. Inverting the order of pump andprobe pulse, for Au7
-two distinct excited states can be populated, relaxing within
600 fs and 1.6 ps, respectively. Using an excitation energy of 3.12 eV, Au14-and Au20
-
exhibit similar time constants for relaxation (1.4 ps and 1.2 ps, respectively). Theserelatively short time constants (considering the HOMO-LUMO gaps of the neutralswith 1 eV and 1.77 eV), are suggested to proceed via electron-phonon interactionwithin states above the HOMO of the anion, having rather small level spacing.The studied tungsten clusters exhibit lifetimes of the initially excited states (pumpenergy 1.56 eV) below 100 fs and on a timescale of a picosecond the energy is thermal-ized among the vibrational degrees of freedom, comparable to bulk values. Similarto previous studies on open d-shell metal clusters, these fast dynamics are assignedto electron-electron scattering, which is possible due to the high density of states.
4This finding supports the approach of Kresin and Ovchinnikov mentioned above for explainingthe fast relaxation of Al13
-
20

2.2 Femtosecond Spectroscopy5.1 Goldcluster 37
Abbildung 5.2: Zeitaufgeloste Photoelektronenspektren von Au−7 . Die Anre-
gung erfolgt mit hνpump = 1, 56 eV , die Abfrage mit hνprobe = 3, 12 eV . Die
Verzogerungszeiten zwischen Anregungs- und Abfragepuls sind neben dem je-
weiligen Spektrum angegeben.
Figure 2.9:TR-PES of Au7
-. A peak shift of the initially excited
electron distribution (around 2 eV binding energy) to-wards higher binding energies can be observed [158].
In summary, for small clusters consisting of open d-shell metals, very fast relax-ation dynamics have been observed, whereas for gold clusters excited states revealingvery long lifetime have been found. In both cases, the behavior was assigned to theDOS near the HOMO, leading to fast relaxation for a high DOS and slow dynamicsfor low DOS. Another relaxation mechanism was proposed for Al13
-, namely internal
conversion induced by a shape deformation following excitation. In the present work,the studies are extended to Agn
-clusters to check the validity of the aforementioned
ideas.
With respect to the surprising reactivity and catalytic properties of clusters, time-resolved spectroscopy of photochemical reactions on these species is also a field ofgreat interest.
2.2.2 Femtochemistry of Clusters
The development of fs-lasers was recognized to open new possibilities for researchin various fields. One of the most interesting topics is the investigation of chemicalreactions in real-time. Ahmed Zewail, one of the pioneers in femtochemsitry, in 1999was awarded the Nobel prize in chemistry for the development of basic techniquesin this field [159, 160]. The studies in his group also extend to clusters physics (e.g.(O2)n
-with n = 3–5 was examined [161]) and recently to biology [162].
So far, direct photodesorption of molecules from metal clusters has not been ob-
21

2 State of the Art
served. The few experimental observations [163, 164] all proved to be dealing withthermal desorption rather than a direct process: The energy of the photon is ther-malized within less than 100 fs and in a subsequent step, the molecule desorbs fromthe hot cluster via unimolecular dissociation.
In the group of W. Eberhardt and M. Neeb, photoinduced desorption of CO fromAu2(CO)
-and Pt2(CO)5
-has been studied by TR-PES [163]. Figure 2.10 shows a
series of photoelectron spectra, taken at different delays. The initial excitation isquenched very fast by inelastic electron-electron scattering and a sharp peak evolves,which was assigned to Au2
-. No change in shape or position of this feature was
observed. The observed dynamics were proposed to be thermal desorption, accordingto the following mechanism:
Au2(CO)-+ hν1.5 eV −→ (Au2(CO)
-)* −→ (Au2(CO)
-)hot −→ Au2
-+ CO
The excited state decays rapidly by electron-electron scattering, transferring theexcitation energy into the vibrational modes, i.e. the cluster becomes hot. Afterthermalization, desorption occurs in a statistical process with a time constant of474 fs. Performing calculations using the RRK-formalism (see section 3.6), a disso-ciation energy of 0.91 eV was found.
VOLUME 88, NUMBER 7 P H Y S I C A L R E V I E W L E T T E R S 18 FEBRUARY 2002
-0.500.511.522.53
Au2(CO)
1−
h = 1.5 eV
h = 3.1 eVpumpν
probe-only
100 fs
x25
250 fs
420 fs
1.1 ps
4.9 ps
Au2−
(probe-only)
binding energy / eV
phot
oele
ctro
n in
tens
ity
νprobe
FIG. 1. Time-resolved pump-probe photoelectron spectra ofAu2�CO�2. The probe-only (single-photon) photodetachmentspectrum of Au2�CO�2 is shown at the top while the probe-onlyspectrum of Au2
2 is shown at the bottom.
electron transients at low binding energies (,1 eV) is ob-served, a sharp peak evolves at 2 eV with increasing de-lay. This peak surmounts the underlying single-photonphotoelectron spectrum (probe only) at delays larger than200 fs. The emerging peak matches perfectly the photo-detachment peak of unreacted Au2
2 (bottom of Fig. 1).Obviously, the photoexcited Au2�CO�2 cluster dissociatesinto ground state Au2
2 and CO. The position, width, andline shape of the Au2
2 peak does not change althoughthe intensity continuously increases. Therefore we as-sume a statistical desorption of CO where the dissipatedenergy redistributes into a dissociative channel. An ex-ponential fit to the transient intensity of the Au2
2 peakreveals a dissociation time constant tdiss � �474 6 52� fs(Fig. 2a). Using the rate constant, k�E�� � 1�tdiss, andapplying a quantum Rice-Ramsperger-Kassel (RRK) for-malism [10], k�E�� � nvib
j! � j2m1s21�!� j2m�! � j1s21�! , a dissociation
energy E0 � 0.91 eV is calculated where a vibrational fre-quency nvib � 1.16 3 1013 Hz (48 meV) along the Au-C
x 4
0 0.5 1 1.5 2 2.5 0 0.2 0.4 0.8-0.2 10.6
time delay / ps
0 31 42 5 6 7
a)
b)
Au2(CO)−
Au2(CO)−
0 10 20 30 40 50 60 70 80
c)
time delay / ps
Pt2(CO)5−
d)
Pt2(CO)5−
elec
tron
inte
nsity
/ a.
u.
FIG. 2. Transient photoelectron intensities of Au2�CO�2 [(a)and (b)] and Pt2�CO�5
2 [(c) and (d)]. (a) Partial two-photon pho-toelectron intensity at 2 eV as a function of the delay. The tran-sient peak intensity is directly related to the increase of the Au2
2
fragment. The full line shows an exponential fit from which thedesorption time constant has been deduced. (b) Two-photonphotoelectron intensity above HOMO (0– 0.8 eV) as a functionof the time delay. The fit (solid line) shows a convolution of theprobe pulse and an exponentially decaying transient population(see text) from which the electron-vibration relaxation constanthas been deduced. The lasting intensity drop above 400 fs in-dicates dissociation which has been fit by a single exponential(dashed line). (c) The intensity ratio of the vibrational com-ponents at 1.8 (y � 0) and 2.1 eV (y � 1) (see Fig. 3) as afunction of the time delay. The transient shows the increase ofthe fragment Pt2�CO�4
2. From an exponential fit (solid line) thedesorption time constant has been derived. (d) Two-photon pho-toelectron intensity above the HOMO (0–1.5 eV) of Pt2�CO�5
2
as a function of the time delay. The fit (solid line) shows aconvolution of the probe pulse and an exponentially decayingtransient population (see text) from which the electron-vibrationrelaxation constant has been deduced.
internuclear axis [11] and a maximum initial cluster tem-perature of Ei � 300 K were used [12]. In the RRKapproach, it is assumed that the activated cluster with natoms has j � E��h�nvib� quanta of vibrational excita-tions, where E� � Ehn 1 Ei is the total energy of thecluster. s is equal to the number of vibrational degreesof freedom where �nvib� � 53 meV is the mean frequencyof all vibrations of the cluster [11]. Dissociation along theAu-C coordinate requires m � E0�hnvib quanta.
The quantum-RRK result is in good agreement with den-sity functional calculations on bent Au2�CO�2 where a dis-sociation energy of 0.77 eV has been calculated [11] forthe ground state potential. The bent geometry of the an-ion (�Au-C-O � 132.3±) is attributed to a Renner-Tellerdistortion of the degenerate lowest unoccupied molecularorbital (p) of neutral linear Au2�CO� [13]. The agreementbetween the RRK result and the quantum calculation sup-ports our interpretation of a statistical loss of CO.
Besides the observed desorption dynamics, a preced-ing electronic relaxation of the “hot” electrons is evi-dent from Fig. 1. This is obvious by the time-dependentphotoemission intensity at binding energies below theelectron affinity, i.e., at binding energies below 1 eV.In this energy region, the photoelectrons originate fromphotoexcited states. With increasing delay a shift from
076102-2 076102-2
Figure 2.10:TR-PES of the thermodesorption of COfrom Au2(CO)
-. For binding energies less
than 1 eV, rapid thermalization can be ob-served, whereas a narrow peak at around 2 eVevolves, which was assigned to Au2
-[163].
22

2.2 Femtosecond Spectroscopy
Similar thermodesorption of CO was found from Pt2(CO)5-[163]. However, the time
constant was 3 ps, which was explained by the higher number of degrees of freedomfor the platinum-pentacarbonyl cluster.
In the same group, photoinduced dynamics of Pt2(N)2-
were studied [164]. Thecorresponding photoelectron spectra are depicted in figure 2.11(a). Again, ther-mal desorption of the adsorbed molecule was found, but being in competition withbreaking of the metal-metal bond:
Pt2N2-+ hν1.5 eV −→ Pt1
-+ PtN2 (i)
−→ Pt2-+ N2 (ii)
The signal in the binding energy regime around 1.5 eV vanishes with increasingdelay, which is assigned to energy transfer from the electronic to the vibrationalsystem. Again, new features appear with increasing delay, which are assigned to theproposed fragments. From an analysis of the relative intensity of the fragment peaks(figure 2.11(b)) the authors propose that process (i) is slightly favored over (ii). Thetime constant for process (i) is 78 ps, so that a calculation using the RRK-theoryyields a dissociation energy of 0.4 eV. In comparison to the dissociation energy of
92 M. Neeb et al. / Journal of Electron Spectroscopy and Related Phenomena 144–147 (2005) 91–96
2. Experiment
The experiment has been described elsewhere[6]. Inshort, pure metal clusters are produced in a laser vaporiza-tion plasma source (50 Hz) using a pulsed He-carrier gas(10 bar backing pressure). Gaseous N2 is injected via a secondsolenoid valve downstream of the cluster condensation zone.After adiabatic expansion anions are accelerated by a pulsedWiley–McLaren ion optics to 500 eV. Anionic Ptn(N2)m−clusters are mass-selected from the cluster beam using atime-of-flight mass spectrometer. The flight distance fromthe cluster source to the detachment region is∼2 m. Whenthe desired cluster of a particular mass enters the time-of-flight magnetic-bottle electron spectrometer, an electron isdetached from the cluster via two subsequent laser pulses. Thefundamental (1.5 eV) and second harmonic of a Ti:sapphirelaser were used as pump (∼1 mJ,∼80 fs, 4 mJ/cm2) and probe(∼0.3 mJ) pulses, respectively. The delay was controlled bya motor-driven microcontroller where the optical path of thepump-pulse is altered relative to the probe-pulse. The point ofzero delay has been determined by polarization gating usingthe rear quartz window of the spectrometer chamber.
A time-of-flight mass spectrum is shown inFig. 1. Un-der our experimental conditions (huge surplus of N2) onlyN2-saturated Ptn-cluster anions are observed forn≥ 4. Notethat the number of N2 ligands is equal to the number of metalatoms in the cluster, i.e.n=mforn≥ 3. This favours a geome-try where each Pt atom terminally binds a single N2 molecule.Bridged sites, which occur with a 1:1 atom-to-bridge ra-tio in planar ring structures, are less likely as these ring
Fig. 1. Time-of-flight mass spectra of pure Ptn− (bottom) and N2-saturated
Ptn(N2)m− clusters (top). The clusters have been produced by a laser vapor-ization cluster source with a repetition rate of 50 Hz. A surplus of molecularN2 was injected by a separate valve a few centimeters downstream of theplasma plume.
structures are not energetically favoured for small Pt clusters[7].
3. Results
Time-resolved photodetachment spectra of Pt2(N2)− aredisplayed inFig. 2. The pump-probe delay varies from 100 fsto 1 ns from bottom to top. The electron binding energy hasbeen revealed by subtracting the kinetic energy from theprobe-pulse photon energy (3 eV), i.e. the binding energyrefers to excited electrons above the HOMO[8]. The moststriking observation inFig. 2 is a double peak at 2.15 eV,which evolves after∼10 ps. Additionally, a small but distinctfeature develops at 1.9 eV. For delay settings larger than 50 psthe two rising features clearly surmount the underlying pump-probe intensity of Pt2(N2)−. The double feature at 2.15 eVfits both the adiabatic peak doublet of Pt1
− as well as thesplit photoelectron feature of Pt2
−. Additionally, the smallfeature at 1.9 eV is equal to the energy of the adiabatic peakof Pt2−. For comparison, ordinary photodetachment spec-tra of Pt1− and Pt2− are shown together with a time-resolvedphotodetachment spectrum of Pt2(N2)− in Fig. 3. The normalphotoelectron spectra (single-photon) have been taken witha Nd:YAG laser (3.49 eV) while the time-resolved spectrum
Fig. 2. Pump-probe photoelectron spectra of Pt2(N2)−. The pump-photonenergy is 1.5 eV while 3 eV-photons were used for probing the excited clus-ters. Note the evolving peaks at 2.15 and 1.9 eV, which arise from photodis-sociation (see text for explanation). The pump-probe spectra are normalizedto the background at energies below 1.3 eV where no pump-probe signal ispresent. This unwanted background intensity, which contains no time infor-mation (detachment by two photons of the probe-pulse), has been subtractedfrom all spectra. The pump-only signal, which originates from three simul-taneously absorbed pump-photons, has also been subtracted from the pump-probe spectra. The pump-only and probe-only spectra have been recordedseparately for each pump-probe spectrum.
(a)
M. Neeb et al. / Journal of Electron Spectroscopy and Related Phenomena 144–147 (2005) 91–96 93
Fig. 3. Pump-probe photoelectron spectrum of Pt2(N2)−. For this spec-trum a Ti:Sa laser was electronically synchronized with a frequency-doubledNd:YAG laser. The pump photon is 1.5 eV (Ti:Sa) while the probe-photon is3.49 eV (Nd:YAG). Due to the temporary pulse width of the Nd:YAG lasera delay of a few ns is intrinsically given. The photodetachment spectra ofPt1− and Pt2− have been taken with the Nd:YAG laser (3.49 eV). Note thesimilarity between the time-resolved spectrum of Pt2(N2)− and the spectraof the two metal fragments.
of Pt2(N2)− has been taken with an electronically synchro-nized Ti:Sa (pump-pulse) and Nd:YAG laser (probe,∼10 nspulse width). Due to the higher probe-photon energy of theYAG laser (3.49 eV) an additional peak of the Pt atom isseen at 2.9 eV. The peaks of the Pt monomer and dimer fitperfectly with the evolving peaks in the Pt2(N2)− spectrum.From this we conclude that Pt2(N2)− photodissociates in ei-ther Pt2− and N2 or Pt1− + PtN2. The metal dimer resultsfrom a metal-ligand bond disrupture while the Pt atom re-sults from an intermetallic bond breakage:
Pt2(N2)− + 1.5 eV → Pt1− + Pt(N2) (I)
Pt2(N2)− + 1.5 eV → Pt2− + N2 (II)
The negative charge locates in both cases at the metal frag-ment as the electron affinity of the Pt-atom and the dimer isquite high, namely 2.1 and 1.9 eV (see the adiabatic peak ofPt1− and Pt2− in Fig. 3).
Fragmentation pathway (I) seems to be favoured over theN2-desorption channel (II) due to the relative peak intensityof Pt2− and Pt1− (Fig. 3). In case of a statistical fragmen-tation process this can be explained by a lower dissociationthreshold of I versus II assuming a similar photoionizationcross section of the monomer and dimer.
The dissociation is initiated by a single pump-photon asshown by the dependence of the fragment-peak intensity onthe pump power. This is displayed in the double-logarithmic
Fig. 4. Double-logarithmic plot of the pump-pulse intensity vs. the fragment-peak intensity at 2.15 eV electron binding energy. Due to the slope of∼1the dissociation must be initialized by a single pump-photon (1.5 eV).
plot of Fig. 4. The slope of the fitted line is nearly 1, whichcorresponds to a linear dependence of the fragment inten-sity on the pump-pulse power. Consequently, the dissocia-tion energy must be less than 1.5 eV for both fragmentationpathways. Thus, upon adsorbing a N2-ligand the dissociationenergy along the Pt–Pt intermetallic bond is strongly reducedwith respect to free Pt2, which has a dissociation energy of∼3 eV [9].
The transient of the fragment peak intensity at 2.15 eVis shown in Fig. 5. The peak rise is well reproducedby an exponential curve. A dissociation-time constantτdiss= (78± 25) ps is revealed from the fit. Altogether theexponential increase, the competing fragmentation channelsas well as the small dissociation rate make a statistical frag-
Fig. 5. Fragment-peak intensity at 2.15 eV vs. the pump-probe delay. A dis-sociation time constantτdiss= (78± 25) ps is deduced from the exponentialfit (y=a+b(1− exp(−tdelay/τdiss))).
(b)
Figure 2.11: TR-PES of Pt2(N)2-is shown in 2.11(a). The marked features are
assigned to the fragments. For details, refer to the text. 2.11(b) depicts a comparisonof pump-probe spectra of Pt2(N)2
-with spectra of Pt1
-and Pt2
-, obtained using only
the probe pulse [164].
23

2 State of the Art
free Pt2 (∼ 3 eV), a strong influence from the N2 adsorption on the intermetallicbond was concluded.
In the group of T. M. Bernhardt and L. Woste Ag2O2-was investigated, using the
so-called NeNePo technique with pump and probe pulses of 3.05 eV [165]. NeNePorefers to negative to neutral to positive, indicating the experimental scheme: Mass-selected cluster anions are irradiated by a pump pulse, detaching electrons and thuspreparing neutral clusters. After variable time-delay, the probe pulse detaches elec-trons from the neutral species yielding cations, which are eventually detected in amass spectrometer. The NeNePo-data of Ag2O2
-and Ag2
-is shown in figure 2.12.
For Ag2O2-
it was concluded that a one-photon excitation yields neutral Ag2O2,
with a typical power of 1 W at a repetition rate of 1 kHz. Theamplified near-infrared pulses (central frequency 812 nm) arefrequency doubled in a 0.3 mm thin BBO-crystal and split intopump and probe beams (2–5 mW each). A defined time delaybetween pump and probe can be introduced by guiding onebeam on a computer-controlled delay stage. The recombinedfs-laser beams are finally guided coaxially into the trap and areslightly focused by a 1 m focal length lens. The zero time delaycan be precisely determined inside the vacuum chamber bymeasuring the cross-correlation between pump and probebeam through the photoemission current from a gold plate.
To better understand the influence of the oxygen ligand onthe nuclear dynamics of the silver dimer, we first investigatedthe NeNePo signal of the bare silver dimer without adsorbedoxygen resulting from photodetachment of Ag2
� with 3.05 eVphoton energy, time-delayed ionization of Ag2, and detectionof Ag2
1. Our previous NeNePo investigation of Ag2 werecarried out at room temperature and yielded a ground statevibration of 196 fs.16,24 An important aspect of the measure-ments presented here is that at the chosen rf-ion trap tempera-ture of 100 K, the anionic Ag2
� ensemble is in the vibrationalground state (v ¼ 0) with 96% probability. In Fig. 1(a) theexperimental fs-NeNePo pump–probe spectrum of Ag2 ob-tained in a one-color experiment using the second harmonic ofthe fs-laser (l(pump) ¼ l(probe) ¼ 406 nm) at 100 K aniontemperature is presented. The NeNePo transient signal exhibitstwo remarkable features: (i) A pronounced maximum in therecorded Ag2
1 yield at 190 fs pump–probe delay time and (ii) adistinct oscillatory dynamics at longer delay times (4400 fs).The amplitude of the oscillating structure at delay times 4400fs is about a factor of ten smaller than the maximum signal.The period of the observed signal oscillation was determinedboth by linear regression of the observed signal maxima and byFFT analysis (cf. inset in Fig. 1(a)) to be 180 � 1 fs corre-sponding to a vibrational constant of n ¼ 185 � 1 cm�1.25 Italso has to be noted that the apparent signal structure at timezero in Fig. 1 originates from interference of pump and probe
laser pulses with the same wavelength in the one-color experi-ment leading to efficient vertical multi-photon ionization.The presented fs-NeNePo dynamics in the Ag2
1 signal inFig. 1(a) can be understood on the basis of the spectroscopicproperties of Ag2
�26 and Ag2.27,28 Fig. 2 presents a schematic
representation of the potential energy curves of the knownelectronic states of Ag2 in the three charge states which havebeen constructed from the literature data based on Morsepotentials. Through a single-photon electron detachment with406 nm (3.05 eV) photons, a vibrational wave packet is createdon the electronic ground state of Ag2 (X 11Sg), but also on thelowest excited triplet state 1 3Su. The transition to this lattertriplet state is not spin-forbidden since the released electron cancarry spin ��h/2. The system is thus populated at the innerturning point of the potential energy curve of this state (1 3Su)as can be seen from Fig. 2(a). The question, whether the wavepacket which propagates to longer core distances is bound bythe triplet potential, cannot be clarified unambiguously due tothe uncertainties of the spectroscopic literature data. However,the photoelectron spectra of Ag2
� indicate that the system ispumped into the dissociation continuum of this state.26 Duringthe propagation along the triplet potential curve, the wavepacket might be transferred via resonant two-photon transi-tions at two close lying locations to the cationic state fordetection (see Fig. 2(a)). With increasing core distance, first aresonance with the C 23Pu state is reached and then with theB 11Pu state of Ag2. The existence of these resonances explainsthe strong enhancement of the Ag2
1 signal at 190 fs delay time.The lack of a periodic revival with comparable amplitudeconfirms the assumption that the wave packet is not boundby the triplet state and further propagates freely to dissociationon the triplet state potential.The wave packet simultaneously prepared on the X 11Sg
singlet ground state of Ag2 oscillates between the inner andouter turning point of the potential leading to the observedperiodic signal at delay times 4400 fs with 180 fs oscillationperiod. According to the Franck–Condon principle and theknown photoelectron spectrum of Ag2
�,26 the low vibrationalstates (v ¼ 0–7) are populated and a wave packet is initiallycreated at the outer turning point of the X 11Sg ground statepotential (cf. Fig. 2(b)). The measured vibrational constant of185 � 1 cm�1 (180 � 1 fs oscillation period, see Fig. 1(a)) isslightly red shifted by only 7 cm�1 compared to the known
Fig. 1 (a) NeNePo spectrum of Ag2 recorded in a one-color experi-ment (406 nm) at 100 K ion temperature. The dashed line correspondsto a sine function fit to the NeNePo Ag2
1 signal for delay times 4600fs. Inset: Power spectrum of the Ag2
1-signal at delay times4600 fs. (b)Pump–probe spectra of the NeNePo fragment signals Ag2
1 (solid line)and AgO1 (dashed line, magnified by a factor of ten) resulting fromneutral Ag2O2 dissociation after photodetachment of Ag2O2
� (406 nm,100 K). Inset: Power spectrum of the Ag2
1 NeNePo fragment signal attime delays 4600 fs.
Fig. 2 Potential energy schemes for the observed NeNePo processesof the Ag2
1/Ag2/Ag2� system. (a) Dynamics in the 13Su-state of Ag2.
(b) Dynamics in the X 13Sg-state of Ag2. The relevant potential curvesinvolved in the respective NeNePo processes are highlighted by boldsolid lines. The vertical arrows starting from the Ag2
� ground state(X Ag2
�) indicate the pump (photodetachment) photon energy. Theother vertical arrows characterize the energies of the multi-photonprobe process.
P h y s . C h e m . C h e m . P h y s . , 2 0 0 5 , 7 , 2 7 0 6 – 2 7 0 9 2707T h i s j o u r n a l i s & T h e O w n e r S o c i e t i e s 2 0 0 5
Figure 2.12:(a) NeNePo-data of Ag2 recorded in aone-color experiment using 406 nm at100 K ion temperature. The dashed linecorresponds to a sine function fit to theAg2
+signal for delay times > 600 fs.
Inset: Power spectrum of the Ag2+
sig-nal at delay times > 600 fs. (b) Pump-probe spectra of the NeNePo fragmentsignals Ag2
+(solid line) and AgO
+
(dashed line, magnified by a factorof ten) resulting from Ag2O2 (406 nm,100 K). Inset: Power spectrum of theAg2
+NeNePo fragment signal at time-
delays > 600 fs [165].
which is unbound and leads to desorption of O2. The vibrational frequency ex-tracted from the Ag2O2
--data is red shifted compared to those of bare Ag2
-, which
is suggested to be vibrationally excited after O2-desorption. More details are givenin section 5.3.1. In the presented work, the same system is investigated and thedata obtained by TR-PES disagree with the interpretation of the NeNePo article.However, the NeNePo-data is in accordance with this work under the condition thatthe first excitation step is reassigned to a two-photon process (see section 5.3.1).
24

3 Basic Concepts and Methods
Information on the geometric structure of clusters is difficult to obtain “directly”in an experiment, e.g. by electron diffraction or ion mobility measurements (seesection 2.1.2). Furthermore, ensembles of clusters of a certain mass can consist of amixture of different isomers. Thus, comparison of experimental data and theoreticalcalculations is essential for obtaining cluster structures.In solid state physics, the symmetric structures of bulk materials can be described byseven crystal systems, and these structures can be composed of one of the fourteenBravais lattices [166], neglecting surface effects. In case of clusters, this approachis no longer suitable, since surface effects play an important role: Even a clusterconsisting of 1000 atoms has about 400 atoms on its surface [167]. Thus, clustersapproach the crystal structures of the corresponding bulk material usually not upto some thousand atoms [168].For small clusters, the most stable structure is an icosahedron, if the geometry isnot disturbed by preference of certain bond angles or electronic effects [169]. Anexample for a stable “magic” structure is the cluster Al13 (figure 3.1). The figurealso depicts three other structures of clusters and the structure of fullerite, a clustermaterial, consisting of C60 clusters [170].
W S15 42
Al13
Au20
C60 Fullerite
Figure 3.1: Some examples of cluster structures: The platelet W15S42 [171], icosa-hedral Al13 [172], pyramidal Au20 [49] (corresponding to the bulk fcc structure), themost famous cluster C60 [72, 173] and the cluster material fullerite, consisting ofC60 clusters [170, 173].
25

3 Basic Concepts and Methods
3.1 Metal Clusters
Clusters can be classified in various ways, e.g. by their binding mechanism (van derWaals interaction, metallic bonding, etc.). Another way of classification, which isappropriate in this case, is classification by the material the clusters are generatedof, such as noble gases, metals, semiconductors, alkali halogens, water or organicmolecules. This work focuses on metal clusters, especially on clusters of s/p metals.A basic difference between atoms, clusters and bulk materials is their electronicstructure. For atoms, the energy levels are discrete, whereas for bulk metals manyenergy levels are energetically very close, so that the density of states is very highand the energy levels can be viewed as continuous and thus form a band structure.Clusters constitute the transition from atom to bulk and properties of both regimesmight occur. Figure 3.2 displays schematically how the energy levels evolve fromatom to bulk for aluminum.
EB EF
N=
3p
3s
1 Bulk2 4 40
Figure 3.2: Simplified scheme of the energy levels in Aluminum from atom to bulk[174]. N is the number of atoms. For a single atom, energy levels are discrete. Withincreasing N they split and for large N (bulk metal) energy bands are formed.
3.1.1 Electronic Shell Model
The jellium model gives a simple description of the delocalized nature of the elec-trons in bulk metals. This model yields good predictions also for clusters madeof simple metals, i.e. sodium, copper, silver, gold and aluminum clusters. In thismodel, the positive charge (actually localized at the nuclei) is smeared out over thewhole bulk or cluster (like a jelly), whereas the valence electrons are treated like afree electron gas, so that they can move freely in the potential of the positive charge.This model is very similar to the shell models from atom or nuclear physics. Theion cores are considered to provide a uniform positively charged background andthe valence electrons feel this effective potential. In this respect, metal clusters can
26

3.1 Metal Clusters
be viewed as superatoms, where clusters react as if they were atoms (e.g. Al13 =halogen, Ag8 = rare gas or Ag9 = alkali superatom) [175, 176].As an approximation, the Woods-Saxon-Potential can be used as effective poten-tial [177]. Even better results can be obtained by using self-consistent approachessimilar to the Hartree-Fock method in atomic physics [36, 178]: In the first step, areasonable effective potential is assumed to calculate the electron wave functions,which are then used to obtain again the effective potential by averaging. If bothpotentials agree, the problem is solved; if not, the initial potential gets modified toachieve self-consistency.
The success of the jellium model assuming non-interacting electrons is based ontwo physical reasons:The first reason is a screening effect. The coulomb potential between electrons andnuclei is screened by the valence electrons to an effective potential. The screeninglength depends on the electron density and has a value of around 0.67 A for sodium,which is small compared to the distance to the next neighboring atom (3.71 A) [167].In this case, the effective potential outside the screening region is too weak to bindan electron to a nucleus, therefore it can move freely within the cluster.The second point is due to the Pauli exclusion principle. The density of valence elec-trons in a metal is quite high (1022− 1023 per cm3), so that the interaction betweenthe electrons should be quite strong. However, due to the Pauli exclusion principle,inelastic scattering is only possible near the Fermi edge, since for energy differencesof more than ∼ kBT relative to the Fermi level, all energetically accessible statesare occupied and scattering is inhibited. Only a small fraction of the electrons canchange their states, i.e. that the electron-electron interaction does not considerablyaffect the free electron gas.
The potentials and orbitals calculated for a cluster in the framework of the spher-ical jellium model look typically like the one in figure 3.3(a). The energy levels aredetermined by the radial quantum number and the angular momentum quantumnumber, following the nuclear (i.e. not the atomic) convention. Shell closings occurfor 2, 8, 18, 20, 34, 40, 58 ... electrons. Clusters having closed shell structure arecalled “magic”, since they are very stable. This is due to the especially high bind-ing energy per atom of these closed shell clusters. In contrast, for a cluster havingone more atom (i.e. one or more additional electrons), the total binding energyincreases only slightly, but the binding energy per atom is lower than for the closedshell species. This behavior can for example be seen in the mass spectra of sodiumclusters, showing high intensities for clusters with completely filled electronic shells(figure 3.3(b)) [179]. However, the correct interpretation of mass spectra is diffi-cult, since a high intensity in the spectrum does not always correspond to a stablecluster. Mass spectra depend in a complex manner on the experimental conditions,e.g. ionization or electron attachment (necessary for mass spectrometry) can lead
27

3 Basic Concepts and Methods
(a) (b)
Figure 3.3: 3.3(a) Potential energy of the electrons as a function of the cluster ra-dius for a spherical Na20. Electron energy levels with radial and angular-momentumquantum numbers and degeneracies of the levels (in parentheses) are also shown.The total number of electrons in a given shell is indicated on the right hand side.Only the electrons occupying the highest occupied molecular orbitals are displayedby arrows [181]. 3.3(b) Mass spectrum of Nan. Prominent features correspond toneutral magic clusters [181].
to fragmentation [180].
3.1.2 Clemenger-Nilsson Model
The approximation by a spherical jellium model cannot explain the fine structures(for 12, 14, 26, 30, 36, 38, 50, 54 ... electrons) between the shell closings in the massspectra, since this simplification only holds for clusters having zero total angularmomentum (i.e. closed electronic shell structure). The Jahn-Teller theorem statesthat degenerate energy levels split by lowering the symmetry of the system (e.g. bydeformation) [182]. For partly filled orbitals this leads to an increase in bindingenergy within one shell, since the splitting yields a lower-lying (binding) and higher-lying (anti-binding) state, at which the lower state is occupied to a higher degree.Thus, it can be concluded that spherical clusters having only partly filled shells,are instable towards deformation and the energetically favorable structure is non-spheric. Largest deformations are expected for partly filled shells having high angularmomentum. In 1985, Clemenger was the first using a deformed potential which couldexplain the fine structure [183]. He adapted the Nilsson model [184] from nuclearphysics to cluster physics in the so called Clemenger-Nilsson model, which treats theclusters as an ellipsoid. The potential includes an anharmonic component, whichdepends on the square of the shell angular momentum [167]. Figure 3.4 displays aso-called Clemenger-Nilsson diagram. It represents the single particle energies as a
28

3.1 Metal Clusters
function of cluster shape. The total electronic energy is equal to the sum of the singleparticle energies in that model. The minimum of the resulting total energy curvefor a given number of electrons is indicated by a dot at the highest occupied level.Closed shell clusters are spherical, whereas maximum deformation occurs in betweenthe main shell closings of 4, 14, 26, 50, ... electrons. To obtain the energies of theshells for a certain cluster, one has to draw a vertical line through the correspondingdot. The interceptions with the curves correspond to shell energies.
Figure 3.4: Clemenger-Nilsson diagram. The electron numbers are positioned atthe highest occupied levels and at the equilibrium configuration. The energy levels arecharacterized by the main quantum number n, the quantum number in z-direction nz
and the projection of the orbital angular momentum on the z-axis Λ. The distortionparameter η describes the shape deformation: η = 2Rz−Rx
Rz+Rxwhere the Ri are the
semiaxes of the ellipsoid [33].
29

3 Basic Concepts and Methods
3.2 Photoelectron Spectroscopy
3.2.1 Basics
Mass spectra can only give a rather indirect access to the structure of clusters.Therefore, direct methods for finding the geometric or electronic structure are nec-essary to develop and test more accurate models for clusters [180].
A well known method from solid state physics for studying the electronic structureis photoelectron spectroscopy (PES). It is based on the photoelectric effect, whichis a quantum electronic phenomenon in which so called photoelectrons are emittedfrom matter after the absorption of energy from electromagnetic radiation. Thiseffect was explained by Albert Einstein [185] who was awarded the Nobel Prize inphysics in 1921 “for his services to Theoretical Physics, and especially for his dis-covery of the law of the photoelectric effect” [186].
A standard PES experiment uses a light source with known photon energy fordetaching photoelectrons. Their kinetic energy is measured, which can be convertedinto binding energy. In solid state physics, this is usually done by a XPS (X-Rayphotoelectron spectroscopy) [187] or an UPS (ultraviolet photoelectron spectroscopy)[188] experiment. The electron spectrometers used are mainly dispersive, i.e. onlyelectrons of a certain, small energy range can be detected at a time. However, to ob-tain a complete photoelectron spectrum, the whole energy range has to be scanned.An advantage of this method is the high energy resolution (∼ 5 meV [189]), underthe condition that the electron counting rate is high enough or the measurementtime sufficiently long to get a feasible spectrum. For bulk surfaces, these conditionsusually apply.
In case of mass selected clusters, however, the target density is around 104 to 106
particles per cm3, which is about six magnitudes lower than for a molecular beamof neutrals (1010 to 1012 particles per cm3). The particle density in an ion beam iscomparable to ultra high vacuum at 10−10 mbar [190].
To compensate for the low target density, a high photon intensity is necessary,which can be accomplished by using a laser. A disadvantage of commercial lasersis the relatively low photon energy, so that in most cases only the highest occupiedstates can be probed. This is also the reason for studying anions rather than cations:The energy necessary for detaching an electron from a cation is usually much higherthan the photon energy of commercial lasers. The electron affinity (EA)1 of anions
1The electron affinity of an atom or molecule is the energy released when an electron is attachedto the neutral atom or molecule.
30

3.2 Photoelectron Spectroscopy
is lower than the ionization potential2 of neutrals or cations. EAs of metal clusteranions range from 1 eV to 3 eV, whereas the ionization potentials of neutral clustersare 5 eV to 8 eV. For very large clusters (n � 100) the electron affinity of the anionand the ionization potential of the neutral converge towards the work function ofthe corresponding bulk [190].
For the study of ultra-fast processes, a fs-laser system was used in the presentwork, i.e. the whole experiment was carried out in pulsed mode (40 Hz). One advan-tage of this mode is the potential use of a time-of-flight electron spectrometer (seesection 4.3), which is capable of detecting all kinetic energies of the photoelectronsdetached with the laser pulse at once and hence reducing the time for recording aspectrum by two orders of magnitude.
PES spectra yield information about the electronic structure, i.e. about the or-bitals. In the following sections, two models will be discussed which can be used forthe interpretation of the spectra.
3.2.2 Single Particle Picture
The most simple model, being a crude approximation, is the single particle picture.The main assumption is that the incoming photon only interacts with one singleelectron in the cluster and completely transfers its energy to it. The electron getsdetached if the photon energy hν is higher than its binding energy EBind. Besidesthat it is assumed that the electron does not interact with its neighbors, neitherin the bound state nor while leaving the cluster. The kinetic energy Ekin of thephotoelectron is given by
Ekin = hν − EBind. (3.1)
A photoelectron spectrum displays the kinetic energy distribution of the electronsand corresponds to a an averaging over many ionization processes. For electronsoriginating from different orbitals, various peaks with different kinetic energies canbe seen. Figure 3.5 shows this correlation schematically. The relative peak intensi-ties indicate the probabilities of the different detachment processes and depend onthe number of electrons occupying the orbital, the symmetry of the orbital and thephoton energy [191]. In this respect, PES directly maps the electronic structure upto a maximum binding energy, which corresponds to the difference between pho-ton energy and electron affinity. The single particle model fails to explain the linebroadening sketched in figure 3.5. However, this can be made up within the manyparticle model (see page 35).
2The ionization potential of an atom or molecule is the minimum energy required to remove oneof its electrons
31

3 Basic Concepts and Methods
HOMO-LUMOgap
Ekin
Ebind
Evac
Intensity
Ehn
HOMO
LUMO
Figure 3.5: Scheme for photodetachment in the single particle picture. The orbitalsof the particle below the vacuum level Evac are displayed. The additional electronof the anion occupies the LUMO of the neutral. A photon having the energy hνdetaches an electron from its bound state above Evac [192].
The single particle picture can be used both for neutrals and for anions. However,figure 3.5 shows a special property of PES on anions: If for a neutral the highestoccupied molecular orbital (HOMO) is completely filled, which corresponds to ashell closing (see section 3.1.1), the additional electron of the anion has to occupythe lowest unoccupied molecular orbital (LUMO)3. Analogous to atom, molecularand nuclear physics, a shell closing usually corresponds to a stable particle. In caseof a closed shell species (for the neutral), in the PES spectrum of the anion a peakhaving high kinetic energy appears, since the relative weakly bound electron fromthe LUMO of the neutral is detached. The energy difference between this peakand the next, lower energetic feature corresponds to the energy difference betweenHOMO and LUMO of the neutral, which is referred to as HOMO-LUMO gap. Thisgap corresponds to the lowest possible excitation energy of the neutral and can beassociated with the band gap of a bulk semiconductor. The size of this gap is an
3here the notation refers to the neutral
32

3.2 Photoelectron Spectroscopy
important parameter correlated with the stability and chemical reactivity of a clus-ter [190].
The above considerations hold under the assumption of identical geometries foranion and neutral. If the geometries differ, the above conclusions do not hold exactlyanymore, since changes in the electronic structure are much faster than changes ingeometry (see Born-Oppenheimer approximation in section 3.2.3). It is importantto note that the PES spectrum yields information about the electronic states of theneutral, but in the geometry of the anion.
In an accurate description, the photoemission process is a transition from theinitial state EN
i having N electrons to the final state EN−1f with N − 1 electrons
[187], which yields a kinetic energy for the photoelectrons of
Ekin = hν − (EN−1f − EN
i ). (3.2)
The single particle model and the simplified equation 3.1 are based on Koopmanstheorem [193], which neglects the effects of the emitted electron on the final state andthe influence on the remaining electrons. Hence, there are features in the spectra,which cannot be explained within the single particle picture, since they originatefrom processes which take place during the detachment process. To obtain betterresults, the following final state effects can be taken into account to amend thissimple model [194, 35]:
• RelaxationThe charge state of the particle increases due to the detachment of an electron,which yields an increase of the binding energy of all orbitals. This relaxationenergy is transferred to the outgoing electron and increases its kinetic energy.
• Multiplet SplittingIn the final state, the remaining electrons can couple their spins and angularmomenta to different total spins and angular momenta. Depending on theenergy of the final state, the kinetic energy of the photoelectron can differ bythe energy differences of the possible final states, so that multiple peaks mightappear in the spectrum.
• “Shake Up” ProcessIn this case, the photon interacts with more than one electron: During thedetachment process, another bound electron might be excited into a previouslyunoccupied state, which leads to a detached electron having a kinetic energylowered by the excitation energy.
• Configuration InteractionEspecially the emission of electrons from deeper lying orbitals can disturb the
33

3 Basic Concepts and Methods
remaining electrons so strongly, that the single particle orbitals of the finalstate do not have much similarity with the ones from the initial state. Inthat case, the features in the PES spectrum cannot be related anymore tothe emission from occupied orbitals of the particle in the initial state and thefinal state has to be described by a linear combination of many initial stateconfigurations.
Multiplet splitting and shake up processes have been observed e.g. for PES onAgn
-clusters [35]. In all four processes, not only the photon and the emitted electron
but also the remaining electrons play an important role, which cannot be accountedfor in the single particle picture. Therefore, a model including all valence electronswith spins and angular momenta has to be used for obtaining a more detailed inter-pretation of the spectra.
3.2.3 Quantum Mechanical Model
For a complete quantum mechanical description of the photoemission process, notonly the electrons but also the motion of the nuclei has to be taken into account. Bymeans of the Born-Oppenheimer approximation [195, 196], the many-body problemis simplified: Due to the much higher mass of a nucleus compared to an electronthe electronic processes take place much faster than the motion of the nuclei, sothat the electrons can immediately follow those motions. Therefore, an electronictransition occurs without considerable change of the distances between the nuclei,i.e. the motion of the electrons and the motion of the nuclei to some degree can betreated independently of each other.
In the quantum mechanical many body picture the photodetachment process isconsidered as a transition from an initial all-electron state X
-with defined energy,
spin and angular momentum into various all-electron states X, A, . . . (right part infigure 3.6). In contrast to the single particle picture, where only the binding energyof the valence orbitals is considered, the total energy of the state including all elec-trons is taken into account, which is therefore used in figure 3.6 as ordinate. Theabscissa shows a generalized reaction coordinate which for a dimer corresponds tothe distance of the nuclei. In the spectrum the peak with the lowest binding energyis assigned to the transition from the electronic ground state X
-of the anion (assum-
ing vibrationally “cold” clusters) into the electronic ground state X of the neutralparticle. The next peak can be assigned to the transition into the first excited stateA of the neutral, so that the statement of “a PES spectrum being a direct mappingof the electronic states” still holds.
For the full interpretation of the proceeding processes, the dipole selection ruleshave to be applied also. The outgoing electron may carry any angular momentum
34

3.2 Photoelectron Spectroscopy
Reaction coordinate
Energy Ehn
n=0
n=1
n=0
n=1
n=2
n=3
n=4
n=0
n=1
n=2
n=3n=4n=5
rgg,Argg,X-rgg,X
VDE
PESspectrum
Ekin
Ebind
ADE
VDE
M4
-
X-
X
A
(M )4 hot
0
M4
0
n=3
n=2
VEAVEA
(M )4 hot
-
rgg,X Reaction coordinate
Energy
neutralcluster
anioniccluster
excitedneutralcluster
ADE
rgg,X-
Figure 3.6: Right part: Scheme of the photoemission process in the quantum me-chanical model. Plotted are the electronic potential energy curves including vibra-tional states (n = 0, 1, . . .) and corresponding wave functions of the ground stateX
-of the anion, the ground state X and the first excited state A of the neutral. In
the left part, the photodetachment process is sketched for an unspecified cluster M4-.
Modified from Tim Fischer [197].
and may have arbitrary parity, so that usually transitions into almost all of theelectronic states of the neutral are allowed [191]. Only the selection rule for the spinis important: The outgoing electron carries a spin of 1/2, hence the total spin ofinitial and final state can only differ by that value in case of angular momentumcoupling (Russel-Saunders coupling). E.g., if the ground state of the anion is a sin-glet (multiplicity 1, see footnote 4), only transitions into doublets (multiplicity 2) ofthe neutral are allowed [194].
Within the quantum mechanical model, the line broadening and the vibrationalfine structure can be explained [25, 30, 189]. The initial state could be the elec-tronic ground state X
-of the anion, having vibrational degrees of freedom. If the
35
3 Basic Concepts and Methods
anion is “cold”, it is in the vibrational ground state with n = 0. The final statesX, A,. . . also have different vibrational states, enabling transitions not only into thevibrational ground state but also into excited vibrational states with n = 1, 2, . . .(figure 3.6). For certain electronic transitions many vibrational transitions might beallowed, leading to a broadening of the “electronic” peaks. With sufficient energyresolution of the electron spectrometer different vibrational transitions [30, 189] canbe distinguished. The intensities of the vibrational transitions are governed by theFranck-Condon principle [198, 199] and depend on the equilibrium geometries of ini-tial and final state. Classically, the Franck–Condon principle uses the approximationthat an electronic transition is most likely to occur without changes in the positionsof the nuclei in the molecular entity and its environment. The resulting state iscalled a Franck–Condon state, and the transition involved is a “vertical” transition.The quantum mechanical description of this principle states that the intensity ofa vibronic transition is proportional to the square of the overlap integral betweenthe vibrational wavefunctions of the two states that are involved in the transition[200]. Figure 3.6 shows the probability density |ψ2| for the vibrational states (greencurves). Most probably the nuclei are found at the maxima of |ψ2|. Similar to clas-sical physics, they are located close to the turning points, but for the vibrationalground state n = 0, the maximum is exactly in the middle between the turningpoints. The transition shown in figure 3.6 starts from the maximum of |ψ2|. Usingthe Born-Oppenheimer approximation, the position and momenta of the nuclei donot change, so that the transition can be described by a vertical arrow upwards,parallel to the ordinate. Under these conditions, the most likely transition in figure3.6 occurs into the electronic ground state X, being vibrational excited with n = 2.Due to the finite width of the probability distribution transitions into other neigh-boring vibrational states also take place, but having lower probability, yielding lowerpeak intensities. Broad peaks indicate big differences in the equilibrium geometry ofanion and neutral. For similar geometries only transitions between similar quantumnumbers can be observed (e.g. 0 −→ 0 transitions) and the peaks are sharp.
Besides that, figure 3.6 explains the difference between adiabatic detachmentenergy (ADE) and the vertical detachment energy (VDE) of a particle: ADE isdefined as transition from the electronic and vibrational ground state of the anioninto the electronic and vibrational ground state of the neutral. However, duringthe emission process, the geometry of the particle is “frozen” (considering the Born-Oppenheimer approximation), so that the VDE is observed in the spectra ratherthan the ADE. The VDE is the energy, which is necessary to detach an electronfrom the electronic and vibrational ground state of the anion, if the geometry re-mains unchanged during the transition. Only if the minima of the two potentialcurves lay exactly on top of each other, ADE and VDE are identical. If a neutralcluster binds an electron, the vertical electron affinity (VEA) is released, usuallyresulting in a vibrational excited anion.
36

3.3 Dynamics in Atoms
In the left part of figure 3.6, the processes and energies described above are illus-trated for an hypothetical cluster M4
-. A vertical transition yields a vibrationally
excited neutral cluster (M40)hot in the geometry of the anion, while the equilibrium
geometry of the neutral ground state is different.
3.2.4 Time-Resolved Photoelectron Spectroscopy
One major issue about the unique properties of clusters is the electronic relaxationafter photoexcitation. Experimentally, this can be explored using time-resolvedphotoelectron spectroscopy (TR-PES). The study of ultrafast phenomena such aselectron dynamics or direct photodesorption requires ultrashort laser pulses (see sec-tion 3.7) with pulse durations below 100 fs. In TR-PES, a short laser pulse (pump)disturbs the system (e.g. excites an electron to another state) and a second, delayedpulse (probe) maps the electron distribution by means of photoemission, which cor-responds to a snapshot of the electronic system at the selected delay. To follow thetime evolution of the system after excitation, the delay between pump and probeis varied and every measurement at a certain delay mirrors the dynamics (e.g. re-laxation) of the system at that specific delay. If pump and probe pulse have thesame wavelength, one can speak of a one-color experiment, whereas in case of twodifferent wavelengths it is called a two-color experiment.
The big advantage of a pump-probe experiment compared to other time-resolvedtechniques is the fact that the time resolution is not limited by the detector. Elec-tronic devices are usually too slow, e.g. the fastest photodiodes have a temporalresponse in the order of picoseconds. For pump-probe experiments, time resolutionis limited only by the duration of the pulses and the possible spatial delay steps.The duration and the length of a laser pulse are correlated by the speed of light.Thus, the phrase “pulse length” is often used as a synonym for pulse duration. Apulse having a duration of 100 fs has a spatial length of around 30 µm.
3.3 Dynamics in Atoms
The energy levels in atoms are discrete and their distance is usually in the eVregime. For an isolated atom, an excited electron relaxes by emission of a photon(luminescence). This probability λ depends on the electronic structure of the atomand the probabilities λi for possible transitions to lower states [201]. The decayfollows an exponential law in a way that the population density N of a state is givenby
N(t) = Nt=0 e−tλ = Nt=0 e
− tτ (3.3)
37
3 Basic Concepts and Methods
with λ =∑
i λi. Hence, the lifetime of an excited state τ = 1λ
is usually in the orderof nanoseconds [202]. A metastable state for which the transition to the groundstate is normally not allowed by the dipole selection rules of quantum mechanics,can have much longer lifetimes. In that case, relaxation takes place by multipoletransitions of higher order or multi-photon transitions, having lifetimes in the rangeof milliseconds to seconds or even much longer relaxation times [202].
3.4 Dynamics in Molecules
In case of molecules, several relaxation processes are possible after photoexcitation.In contrast to single atoms, also vibrational modes can contribute and interactionsbetween electrons and nuclei become important. Some of the most important relax-ation mechanisms are listed below:
• At sufficiently low vibrational energies, vibrations of a molecule can be de-scribed by a superposition of normal modes, which are independent. Forhigher energies, the anharmonic part in the potential becomes important andcan lead to couplings between the normal vibrations. In this case, the vi-brational energy is distributed among all accessible modes and this process iscalled internal vibrational redistribution (IVR). IVR occurs usually ona picosecond timescale [203].
• On a timescale of nanoseconds or even longer, photon emission can occur. Ifthe states involved into the transitions have the same multiplicity4, the processis spin-allowed and photon emission is called fluorescence. If the multiplicityis changed, the emission process is called phosphorescence and the transitionprobability is usually much lower. Typical values for relaxation times are10−9 − 10−6 s for fluorescence and 10−2 − 102 s for phosphorescence [204].
• Also several radiationless processes can lead to the decay of an excited state.The coupling between initial and final state can be mediated by several effectssuch as vibronic coupling (IVR), spin-orbit coupling, the Jahn-Teller effect (orRenner-Teller5 effect for linear molecules), or electrostatic interaction [203].Such nonradiative relaxations are called internal conversion if the transitionoccurs between two electronic states of the same multiplicity and intersystemcrossing if the states have different multiplicities [204–206]. In these cases,the potential energy of an excited state is converted partly into vibrational
4Multiplicity M : Number of possible orientations of the spin angular momentum for a given totalspin quantum number S, calculated as M = 2S + 1
5A degenerate state in the linear configuration can split into two potential curves during a bendingvibration; analog to the Jahn-Teller effect [203]
38

3.5 Dynamics in Bulk Materials
energy of another electronic state.This can proceed e.g. via a conical intersection of the two potential energysurfaces involved (see figure 3.7). It is noteworthy to mention that an intersec-tion is not required. Radiationless jumps between potential surfaces can alsooccur at avoided crossings.
Figure 3.7:Scheme of a conical intersec-tion between two potential en-ergy surfaces [207].
• Dissociation or predissociation6 of a molecule.
• Autoionization, i.e. spontaneous emission of an electron without further inter-action with an energy source [200]. In this case, the bound molecular state ofthe neutral molecule lies above the states of the molecular ion and can coupleto those, producing an ionic state and emit an electron [203].
3.5 Dynamics in Bulk Materials
In bulk materials, many energy levels are close together, i.e. the density of states isso high that the energy levels can be viewed as continuous, forming energy bands.At a temperature of 0 K these bands are filled with electrons up to the Fermi-levelEF, conforming to the Pauli principle. The relation between the number of electronshaving a particular energy and the temperature in thermal equilibrium is describedby the Fermi-Dirac distribution f(E, T ). For temperatures higher than 0 K electronswith an energy above EF and unoccupied states (holes) below EF already exist.
6Predissociation: Excitation into a level below the dissociation limit can lead to dissociation, ifthis level is above the dissociation limit of another electronic state and couples to continuousenergy levels of that state [203]
39

3 Basic Concepts and Methods1. Theoretical Background
Figure 1.1.: Processes induced by a fs-laser pulse arriving at a metal surface. The metal is in thermalequilibrium before excitation. (a,b,c) After generation of a coherent polarization by the laser pulse andits decay, the excited electrons exchange energy with other electrons by electron-electron scattering. Thisthermalization finally leads to a Fermi-Dirac distribution of temperature Te. (d) Directly after excitation,the electrons start to transfer energy to the cold lattice via electron-phonon coupling. The 2-temperaturemodel becomes valid as soon as the electrons and phonons can be described by temperatures Te and Tph,respectively. (e) Finally, electrons and phonons arrive at the same temperature. Transport processes leadto energy dissipation in the considered volume, too.
The interaction between the lattice and the excited electrons leads to the emission of pho-nons and the cooling of the electrons on a time scale of 0.1 to 10 ps as seen in Fig. 1.1(d).In many cases, the resulting phonon population can be described by a Bose-Einstein distri-bution with phonon temperature Tph, as for example in the 2-temperature model [Ani74].However, this is not true in general, as shown for semiconductors [Els89] or the semimetalgraphite in this work, where a non-equilibrium population of “hot phonons” is generated.The heat transfer from the electrons to the lattice fades as soon as electrons and phononshave arrived at the same temperature, Te = Tph, see Fig. 1.1(e).
It should be emphasized that all processes mentioned can temporally overlap. For example,the generation of phonons takes place already before the electrons have thermalized. Mo-reover, spatial transport processes set in from the very beginning. However, they can beneglected on these short time scales, if the pump pulse creates a homogeneously excitedsample. On much longer time scales, heat diffusion leads to a cooling of the sample to theambient temperature.
These mechanisms have important consequences in areas such as surface femtochemis-try [Bon99]. For example, the hot electrons of laser-excited Ru were shown to trigger chemi-cal reactions of adsorbed molecules that do not occur under equilibrium conditions [Bon99].
The dynamics of optically excited charge carriers in semiconductors and gases proceedssimilarly to that in metals [Sha99]. Major differences concern the time scales involved andthe recombination of electrons and holes which proceeds by phonon emission in metals.This is not possible in semiconductors where the phonon energies are much smaller thanthe band gap of ∼ 1 eV. Instead, photon emission, Auger and other processes lead toelectron-hole recombination on a time scale of typically 1 ns. Long before, electrons and
6
Figure 3.8: Relaxation processes in a metal induced by a fs-laser pulse. From [208].For details refer to the text.
In figure 3.8, the typical processes induced by a fs-laser pulse and timescales whichoccur in a metal are depicted [208, 209]:
(a) The pump pulse mainly interacts with the electronic system and usually leadsto the creation of a coherent collective polarization of the electron population(plasmon), which preserves the optical phase memory of the exciting laserpulse. Polarization effects can influence lifetimes of excited states in metalsurfaces [19]. However, it is noteworthy to mention that in case of a cluster alaser pulse usually just leads to excitation of a single electron.
(b) Then the dephasing starts and the coherence is lost on a timescale of 1− 100 fsdue to the interaction with other electronic states, phonons and defects. Thesescattering processes have also an elastic character which does not thermalizethe electronic system but already leads to a loss of coherence, i.e. the mo-mentum is randomized. In that stage, the initial energy of the pump pulseis distributed among the excited incoherent electron-hole pairs. The “new”charge carrier distribution (second trace in figure 3.9) is different from theFermi-Dirac distribution in equilibrium (top trace in figure 3.9).
(c) On a time scale of 10− 1000 fs, thermalization of the electronic system via“Auger-like” inelastic electron-electron scattering takes place (see section 3.5.1below). Figure 3.9 schematically shows the time evolution of the thermaliza-tion of a free electron gas after optical excitation.
(d) Interactions between the“hot”electrons and the lattice occur on longer timescalesof 0.1− 10 ps (depending on the amount of energy which has to be dissipatedand on the phonon frequency) by inelastic electron-phonon scattering (see sec-tion 3.5.2 below).
40

3.5 Dynamics in Bulk Materials
(e) The net energy transfer from the electronic system to the lattice ends whenelectron bath and lattice reach the same temperature (i.e. the energy flows inboth directions are equal).
Also other processes such as electron-defect scattering, electron-magnon scattering(for ferromagnetic materials [209]) or fluorescence can contribute to the relaxation.Since electron-defect scattering is mainly elastic, the clusters studied here are notferromagnetic and photon emission takes typically nanoseconds, it will be focused onthe processes mentioned before. It is important to note that the different relaxationmechanisms overlap in time, e.g. electron-phonon interaction already starts beforethe electronic system is thermalized. In the next two sections, processes (c) (electron-electron scattering) and (d) (electron-phonon scattering) will be discussed in moredetail, since they can also play an important role in the relaxation dynamics ofclusters.
3.5.1 Electron-Electron-Scattering
For Auger-like electron-electron scattering the primary electrons (created by pho-toexcitation) relax on a timescale of ten to several hundred femtoseconds by ultrafastscattering processes with the “cold” electrons of the Fermi-sea at or below EF andhence lead to creation of “hot” secondary electrons, which are excited into unoccu-pied states above EF [107, 111].
At high excitation densities, rapid thermalization via multiple collisions amongthe photoexcited non-equilibrium electrons (or holes) may establish a Fermi-Dirac-distribution, characterized by an electron temperature, before equilibration with thelattice temperature is reached. For low excitation densities (< 1019 electrons/ cm3
in metals), scattering between the primary electrons can be neglected [111] andscattering rates can be described within the framework of Landau’s Fermi liquidtheory [211]:
The relaxation time depends mainly on the number of electrons available forinelastic scattering and the number of unoccupied states. Energy and momentumhave to be conserved, lowering the number of allowed scattering processes. Thehigher the excitation energy of the electron, the more unoccupied states betweenthe excited state and EF are accessible and the faster the decay can take place (seefigure 2.2). Landau’s Fermi liquid theory for e-e interactions in metals yields for thelifetime of an excited state in a free electron gas [211, 212]:
τe−e = a ·n56
[1
E − EF
]2
(3.4)
with a = 16π16 3
56 ~4
√4πε0
e2m3,
41

3 Basic Concepts and Methods
t = 00
f(E)
EEF
1
1
1
0
0
0
0
1
T = Tel 0
T2 >> T0
T >2 T3 > T0
t > t1 0
h�
h�
t > t2 1
t > t3 2
thermalizatione-e scattering
coolinge-ph scattering
opticalexcitation
Figure 3.9: Scheme of the relaxation of an optically excited free electron gas. Attime t0 the electron gas can be described by a Fermi-Dirac distribution with temper-ature T0. Photoexcitation creates a highly non-thermal distribution at t1. Inelasticelectron-electron scattering leads to energy redistribution, yielding a Fermi-Dirac dis-tribution at t2 with T2 >> T0. Via electron-phonon scattering energy is transferredfrom the electronic system to the vibrational degrees of freedom and at t3 the elec-tron gas can be characterized by a Fermi-Dirac distribution with T3 (T2 > T3 > T0).Modified from [210].
where m and e are mass and charge of a free electron and n is the density of theelectron gas. The relation τe−e ∼ (E − EF )−2 can be rationalized by the numberof accessible states for electron-electron scattering in a three dimensional systemand has been confirmed for silver and tantalum [19, 107]. With increasing electrondensity the DOS increases ∼ n1/3, i.e. the accessible phase space increases and thelifetime should decrease. In contrast to that screening of the electrons increases withincreasing n, reducing the scattering probability and hence increasing lifetime. Fora free electron gas the screening effect dominates according to 3.4 and the lifetimeincreases with increasing electron density. Depending on the electronic structure,the first or second effect dominates, but considering different elements certain trendsexist:
42

3.5 Dynamics in Bulk Materials
Noble metals have closed d-bands but open s/p-bands, whereas transition metalshave open d-bands. Since d-bands are usually narrower in energy but consist of morestates, they have a higher DOS near EF compared to s/p-metals. Due to the higherDOS, transition metals show usually faster electron relaxation than noble metals,the screening plays a minor role here.
Data on silver, tantalum and rhodium is in good agreement with Fermi liquidtheory [19, 107], whereas for gold and copper the lifetimes are considerably higherthan predicted. Possible reasons might be the higher lying d-band for Cu and Auwhich contributes more to the screening [103]. For the description of the electrondynamics of more complex band structures (e.g. graphite), the model of a free elec-tron gas is not suitable.
Complete thermalization of the hot electrons in metals to a Fermi-Dirac-distributionis usually reached after about 1 ps [109, 112].
3.5.2 Electron-Phonon-Scattering
The hot electron gas interacts with the cooler ion cores (lattice) until thermal equi-librium is reached, i.e. the electronic system cools down and the lattice gets hotter.The interaction can be rationalized within the following picture: On the one hand,motion of the positive nuclei from the equilibrium position changes the local elec-tronic charge distribution. On the other hand, modifications of the electronic chargedensity influence the nuclei via electrostatic interactions. In this manner interactionbetween electrons and phonons can be visualized [213].
The thermalization of electron gas and lattice can be described by the so called“two-temperature model” [214, 215]: Electron gas and lattice are treated as two in-dependent heat baths which exchange energy. It is assumed that the electron gas isin thermal equilibrium (i.e. it follows a Fermi-Dirac distribution with a temperatureTel) and then transfers energy into the lattice (which is also in thermal equilibriumand the phonons follow a Bose-Einstein distribution having temperature Tph). Therelaxation time for electron-phonon scattering depends on the amount of energywhich has to be dissipated and on the phonons which can be created. For a ma-terial with a low phonon frequency, i.e. low energy phonons, relaxation is slowersince multi-phonon scattering processes are necessary for energy dissipation, whichare less likely than a process involving only one quantum [109]. Thermalization ofelectron gas and lattice usually takes place on a timescale of several picoseconds [103].
Mathematically, this model is described by two coupled differential equations,which describe the change of the electronic temperature Tel and the change of the
43

3 Basic Concepts and Methods
lattice temperature Tph, respectively [112, 213, 216]:
Cel(Tel)∂Tel
∂t= ∇r(κ∇rTel)−G(Tel − Tph) + S(r, t) , (3.5)
Cph(Tph)∂Tph
∂t= G(Tel − Tph) . (3.6)
Cel and Cph are the heat capacities of electron gas and lattice. Equation 3.5 reflectsthe electron diffusion where κ is the electron diffusion constant, G the electron-phonon coupling constant and S(r, t) accounts for the optical excitation. In equa-tion 3.6, the term corresponding to diffusion is missing, since heat conduction bythe electron gas is much faster than by phonons. A scheme of the two-temperaturemodel and the time evolution of the electron and phonon heat bath is depicted infigure 3.10.
1. Basic concepts
1.2. fs-laser excitation of metal surfaces: the two temperaturemodel
The excitation of the metal surface due to fs-laser irradiation is discussed. Therefore, themacroscopic quantities reflection and absorption have to be correlated to a microscopic des-cription in terms of the interaction between the light field (respectively the photons) andthe metal electrons. The absorption is due to the creation of electron-hole (e-h) pairs whichthermalize via electron-electron scattering and cool down to thermal equilibrium with thephonon temperature because of electron-phonon scattering and diffusion. The temporal evo-lution of the transient electron and phonon temperatures Tel and Tph can be described viathe two-temperature model, which is based on the following assumptions:
3210time [ps]
el
ph
T
Tsu
rface t
em
pera
ture
[K
]2500
2000
1500
1000
500
3000
4 5thermal diffusion
meta
l
electron-phononcoupling
z
fs-laser pulse
Figure 1.7.: Two-temperature model scheme (left) [Ani74] and an example for the transient electron andphonon surface temperatures Tel and Tph after fs-laser excitation of ruthenium with a 100 fs, 800 nm laserpulse and a fluence of 〈F 〉 = 60 J/m2. Electronic peak temperatures of several thousand Kelvin are achievable.
The absorption of light induces an instantaneously thermalized hot-electron distribution,represented by an electron heat bath, whose energy content is expressed by a Fermi-Diracdistribution with Tel. This electron heat bath transfers energy either to the substrate bythermal diffusion or to a phonon heat bath via electron-phonon coupling. The phonon heatbath is characterized by Tph of a Bose-Einstein distribution which represents the energycontent in this subsystem. The scheme of the two coupled heat baths is depicted in Fig. 1.7.The temporal evolution of the energy contents in the electronic and phononic sub-systemsare represented by a set of coupled differential equations [Ani74]:
thermal diffusion e-ph coupling excitation
Cel(Tel)∂
∂tTel =
∂
∂z
(
κel∂
∂zTel
)
−H(Tel, Tph)+ S(z, t) (1.13a)
Cph(Tph)∂
∂tTph = +H(Tel, Tph) (1.13b)
The first equation describes the temporal change in the energy content of the electron gaswhich is due to absorption of the laser pulse S(z, t), energy transfer to the lattice H(Tel, Tph)via electron-phonon coupling and due to transport into the bulk via diffusion. z denotes thedistance from the surface into the bulk. It is sufficient to apply the calculations only to this
18
Figure 3.10: Scheme of the two-temperature model [215] and the time evolution ofTel and Tph after fs-laser excitation of ruthenium with a 100 fs, 800 nm laser pulsewith a fluence of 60 J/m2. From [210].
If no heat transport by electron diffusion and no further energy supply takes place,Tel can only change by the electron-phonon coupling and equation 3.5 simplifies to
Cel(Tel)∂Tel
∂t= −G(Tel − Tph) . (3.7)
If the electronic system is not yet thermalized, e.g. if electron-electron and electron-phonon scattering take place on the same timescale, characterization only by atemperature is not suitable. In that case the electron distribution can be describedby the Boltzmann transport equation under the relaxation-time approximation. TheBoltzmann equation is divided into thermal and non-thermal parts [109]:
f = fnonthermal(E, t) + fthermal[Tel(t)]
44

3.5 Dynamics in Bulk Materials
The thermal part fthermal corresponds to the Fermi-Dirac distribution and only de-pends on the temperature, whereas the non-thermal part fnonthermal depends on theelectron density. The relaxation of fnonthermal is governed by the differential equation
∂fnonthermal
∂t= − 1
τth
(δE
EF
)fnonthermal (3.8)
having the following solution:
fnonthermal(δE, t) = f0 exp
(−[δE
EF
]2t
τth
), (3.9)
where f0 is the primary electron distribution, δE = E − EF and τth a constant.Energy is transferred from the non-thermalized distribution to the thermalized one,while energy is dissipated from fthermal to the lattice at the same time. The changein energy of the electron gas is given by
Cel(Tel)∂Tel
∂t= −G(Tel − Tph) +
∂
∂t
∫fnonthermalE
3/2dE . (3.10)
3.5.3 Desorption
For surfaces covered with an adsorbate, the energy from excitation can also triggerreactions such as desorption, which is one of the most simple surface reactions. Insurface science, a photon induced excitation is called “direct”, if the photons areabsorbed by adsorbate molecules directly and “indirect” or “substrate-mediated”, ifabsorbed by the substrate.Figure 3.11 illustrates the energy flow between the different subsystems of an adsor-bate covered metal surface.In case of direct photodesorption, photons couple directly to the dipole moment ofthe substrate-adsorbate bond or transition dipole moment of the substrate-adsorbatecomplex.Coupling to the dipole moment leads to ladder-climbing (figure 3.12), which can beobserved using IR-photons even at metal substrates (acting as IR-mirror). How-ever, this process is strongly hindered by the anharmonicity of the potential, whichcauses the vibrational level spacing to decrease with increasing vibrational quantumnumber, pushing some of the required transitions off-resonance as a consequence.Nevertheless, IR-lasers can be tuned in resonance with an intramolecular adsorbatevibration and energy will be transfered by anharmonic coupling from the initiallyexcited mode to the substrate-adsorbate vibration and to substrate phonons. Thismight also lead to desorption, if enough energy is accumulated in the substrate-adsorbate vibration [218].
45

3 Basic Concepts and Methods
Figure 3.11: Scheme of the energy flow at adsorbate covered metal surfaces afterfs-laser excitation. Direct adsorption in the adsorbate can be neglected for thinatomic or molecular layers [21]. The laser pulse excites the electronic system, whichcan thermalize with the lattice. Surface reactions can be driven either by the electronor phonon system, the latter mechanism is slower. Modified from [217].
Direct excitation of the transition dipole moment and induction of an electronictransition (anlagous to the DIET7-mechanism, see page 50 below) dominates in theUV/vis range at semiconductor surfaces.In contrast to semiconductors, metal surfaces have a high absorptivity for UV/vislight, thus preferring indirect mechanisms (absorption in thin atomic or molecularadsorbate layers can be neglected). Indirect processes involve two steps: Initialabsorption of the photons by the substrate and subsequent energy transfer to theadsorbate. Direct and indirect processes can be discriminated experimentally by thedependence of the desorption yield on the polarization of the light. The cross sectionfor direct excitation is highest for light polarized along the dipole/transition dipolemoment of the bond to be broken, whereas for indirect routes (substrate mediated)the polarization plays only a minor role [219].Since the indirect, substrate mediated routes are dominant for optical excitationsat metal surfaces and metal clusters are studied within the presented work, a briefoverview over these mechanisms will be given. In a simplified picture, a metal sub-strate can be viewed as consisting of two heat baths, the lattice and the electron gas(section 3.5.2). Each of these subsystems can couple independently to the adsorbateand transfer energy, which was originally gained by photoexcitation and distributedamong the different subsystems as depicted in figures 3.8 and 3.11. Desorption canthen be driven by different processes:
7DIET: desorption induced by electronic transitions
46

3.5 Dynamics in Bulk Materials
• The conventional picture for the desorption process is given by an electronicallyadiabatic8 energy transfer in the electronic ground state of the system and iscalled ladder climbing process (figure 3.12): Substrate and adsorbate atomsare coupled by their vibrations, until enough kinetic energy is accumulated inthe adsorbate to overcome the barrier towards desorption. Both systems arein thermal equilibrium. The reaction rate k for thermally activated processesdepends nonlinear on the temperature and is usually given by an Arrhenius-
like equation of the form k = ν0 · eEdeskBT , where Edes is the activation energy
necessary for desorption and ν0 the so-called “attempt” frequency. The CO-desorption from a Ru-surface was explained by this mechanism [220, 221].
ground state
reaction coordinate
phonons Edes
k TB ph
substrate
adsorbateE
Figure 3.12:Sketch of phonon mediated,adiabatic desorption (modifiedfrom [210]). Substrate and ad-sorbate couple by their vibra-tions and the energy requiredfor desorption is transferredinto the adsorbate (vibrationalladder climbing).
Besides excitation by phonons, reactions can also be electron mediated. Thephoto-induced catalytic activity of some surfaces, e.g. the oxidation of CO onRu(0001), has been attributed to an excitation of the adsorbed O2 by the hot elec-tron bath [220, 221]. In surface femtochemistry, two conceptually different modelshave been developed to describe the energy transfer mediated by electrons, wherethermalized as well as non-thermalized electrons from the metal-substrate can in-teract with the adsorbate [222]:
• In the frictional approach, the energy transfer is treated in terms of friction[223–225]. Figure 3.13 depicts a physical picture of the process. Vibrationof the adsorbate, i.e. motion of the adsorbate along the reaction coordinate,leads to a shift and broadening/narrowing of the adsorbate resonance. For
8A reaction in which there is no change of electronic state or multiplicity can be called (electron-ically) adiabatic.
47

3 Basic Concepts and Methods
decreasing distance to the substrate, the level shifts downward due to the in-creasing image potential and also broadens, since its lifetime decreases dueto the increasing overlap with the Fermi-level [222]. On the one hand, thisresonance can be transiently populated by (hot) substrate electrons createde.g. by photoexcitation. The charge flow induces motion to the adsorbate,which results in the mentioned level shift and broadening/narrowing. In otherwords, the charge transfer triggers adsorbate motion and energy from the hotelectrons is transferred into kinetic energy of the adsorbate, which can lead todesorption. On the other hand, if not enough energy for desorption is accumu-lated, the vibrational motion along the reaction coordinate leads to an electronflow back and forth between substrate and adsorbate, i.e. the resonance is pop-ulated for close distances between substrate and adsorbate and depopulatedfor larger distances due to the energy shift of the level. This current is sub-ject to damping (corresponding to friction), which leads to relaxation of thesubstrate-adsorbate vibration.
reaction coordinate
adsorbate
current
a
b
c
hot e-
EF
E
substrate
Figure 3.13: Illustration of the electronic friction model (adapted from [210]). Anadsorbate resonance (i.e. an adsorbate orbital) may be populated (a, b) by substrate(thermalized or non-thermalized) electrons, initiating adsorbate motion by the changeof the charge distribution. If enough kinetic energy is accumulated, desorption mightoccur. If not enough energy is accumulated, the adsorbate motion leads to an electronflow back and forth between metal and adsorbate, which is subject to damping (fric-tion). In case of high-lying adsorbate resonances (c), this charge-transfer channelmay not be open [21].
48

3.5 Dynamics in Bulk Materials
• In case of the second concept describing energy transfer mediated by electrons,two processes can be distinguished, depending on the excitation density. Figure3.14 illustrates the principle of both mechanisms. In this approach, “hot”electrons from the substrate can transiently populate an unoccupied excitedstate of the substrate-adsorbate bond and relax after a certain time into theground state. In this case, two potential energy surfaces are involved so thatthis mechanism is not adiabatic but rather diabatic.
LUMO
HOMO
e transfer-
adsorbatereaction coordinate
ground state
excitedstate
� ~ 1-10 fshot e-
EF
Edes
E
substrate
Figure 3.14: Schematic illustration of the DIMET process (modified from [210]).The energy exchange involves (repeated) transfer of electrons from the high-energytail (red) of the electronic distribution into an unoccupied molecular orbital (LUMO)of the adsorbate-substrate complex. In contrast, from a cold electron distribution(dashed area), electrons cannot reach the respective unoccupied levels [21]. The sys-tem evolves on the excited state which leads to nuclear motion of the adsorbate(substrate-adsorbate vibration). If enough kinetic energy is accumulated before re-laxation into the ground state, desorption occurs (DIET process, green). If severalelectronic transitions occur before desorption (green & yellow), the process is calledDIMET.
For low excitation densities of the photon source (typically cw9 or ns-lasers),the system evolves on the potential energy surface (excited state) for a time τand electronic energy is converted into nuclear motion of the adsorbate, until
9cw stands for continuous wave, which means continuous output
49

3 Basic Concepts and Methods
it relaxes back into the ground state. If the amount of acquired vibrational en-ergy (corresponding to kinetic energy of the adsorbate molecule) is sufficient,i.e. if τ is bigger than a critical time, desorption occurs. This process is calledDIET (desorption induced by electronic transitions). This model using a re-pulsive excited state was proposed by Menzel and Gomer [226] and Redhead[227] and is called MGR-model. Antoniewicz showed that the same formal-ism leading to desorption can be used for an excited binding state, having anequilibrium position closer to the substrate, as depicted in figure 3.15 [228].For DIET, the fluence F dependence of the reaction yield Y is linear, Y ∼ F ,for up to 1.5 mJ/cm3 [219], since the average time between two excitations islong compared to the relaxation times of the excited state and the substrate-adsorbate vibration.
MGR
R R
(a) (b) Antoniewicz
Figure 3.15: DIET/DIMET in the MGR-model (a) with a repulsive excited stateand in the model of Antoniewicz (b) with a bonding excited state having an equi-librium position closer to the substrate than the ground state. R is the reactioncoordinate. Modified from [222].
Using intense photon sources such as fs-lasers, the density of excited electronscan be high enough so that the process outlined for DIET can take place severaltimes before the substrate-adsorbate vibration is damped. If enough energyis acquired by these transitions, desorption can occur. This model is namedDIMET (desorption induced by multiple electronic transitions) [229]. Thereaction yield at the same wavelength usually is higher than for DIET and hasa superlinear dependence on the absorbed laser fluence, Y ∼ F n with n > 1(typically 2 − 10 [219]), which is a consequence of the multiple repetition of
50

3.6 Dynamics in Clusters
the excitation/de-excitation cycles. Furthermore, the reaction yield also showsan isotope effect, i.e. an adsorbate mass dependence, since a lighter adsorbatemolecule gains more speed until relaxation into the ground state than a heavierone [21]. Besides that, strong internal vibrations of the desorbed molecule aretypical and the branching ratios for concurring reactions can be different toDIET conditions [217, 219].
Both concepts concerning electron mediated substrate-adsorbate coupling (elec-tronic friction and DIET/DIMET) use similar processes in a different mechanisticdescription, describing different limits. For low excitation densities, low energy lev-els are crucial in the friction-model whereas high lying states are not reachable. Inthe DIMET-model these high lying states are populated. At high excitation densi-ties both approaches are physically equivalent [21]. However, both concepts can becombined in a unifying formalism [230].
3.6 Dynamics in Clusters
Clusters are closely related to molecules, thus also the relaxation mechanisms de-scribed in section 3.4 can occur. Compared to the respective bulk material clustershave different properties, since finite size or even quantum size effects might play animportant role. However, the relaxation mechanisms explained for bulk materialsalso occur, but in the nanometer regime clusters of metals might show semiconduct-ing behavior or vice versa. How the cluster relaxes and on which timescales can bestudied by TR-PES. A scheme of the most likely processes for energy dissipationafter excitation is shown in figure 3.16.These processes can again be divided into direct and indirect processes. For indirectprocesses (indicated by the yellow clusters in figure 3.16), the photon energy is firstthermalized among the electrons and/or vibrational modes of the cluster.
Direct Processes
Some of the direct processes (marked by the blue clusters in figure 3.16) are listedbelow:
• Photon emission: Either fluorescence or, less likely, phosphorescence can oc-cur. Both was observed e.g. for C60. In case of phosphorescence, excited statelifetimes of more than 40 ms were found [231–233].
• Direct photoemission: The energy of the photon is directly transferred to anelectron which is detached (photoelectric effect).
• Direct fragmentation/desorption via dissociative state: Similar to DIET forbulk metal-substrates, an electron is excited from the ground state into an
51

3 Basic Concepts and Methods
Figure 3.16:Scheme of possible processes forenergy dissipation after pho-toexcitation. Processes indi-cated by the blue clusters aredirect, the yellow clusters illus-trate indirect processes.
e-
e-
Directphotoemission
Photon emission
Fragmentationvia dissociative
state
Delayedevaporation
of atoms
Electronrelaxation &
thermalisation
Thermionicemission
excited state in the first step. This excited state can be either repulsive(MGR-model) or binding (Antoniewicz) with an equilibrium position closerto the substrate than to the ground state (figure 3.15, considering only oneexcitation/relaxation cycle). In the second step, the system evolves on theexcited potential energy surface and the adsorbed molecule moves away fromthe cluster. In the third step the electron relaxes back into the ground after acertain time. If the adsorbate has gained enough kinetic energy till relaxation,it can escape [20]. Important is the lifetime of the excited state which mustbe longer than a critical value for dissociation. In case of a repulsive excitedstate (MGR-model), dissociation can also occur while the electron is still inthe excited state, provided that the lifetime is long enough so that the mo-tion on the potential curve leads directly into dissociation without electronicrelaxation. For bulk metals, direct photodesorption is not very likely to occur,since this process competes with the very fast relaxation mechanism of inelasticelectron-electron scattering (section 3.5.1), which quenches the excitation [22].
52

3.6 Dynamics in Clusters
Relaxation and Thermalization; Internal Conversion
Besides that, indirect processes, which follow energy relaxation and thermalization,are also possible. In this case, the photon energy is first thermalized by inelasticelectron-electron scattering (section 3.5.1) and electron-phonon scattering (section3.5.2), similar to the case of bulk materials. Thus, the excitation energy is dis-tributed among the vibrational degrees of freedom of the cluster.Another radiationless deexcitation mechanism, which was described above, is inter-nal conversion (or intersystem crosing). The transition between electronic statesmight proceed through a conical intersection or an aovided crossing.It is important to note that nanoclusters have another degree of freedom differentfrom bulk and large nanoparticles: They can undergo fast structural changes as aresponse to excitations. During such a geometric transformation the single particleorbitals continuously change their binding energies and might even cross in the en-ergy diagram. This concept corresponds to the above described internal conversion,induced by a shape deformation. The potential surface of the ground and excitedstates might touch in a particular geometry during the deformation process, result-ing in a fast and efficient relaxation of the excited state. The crossing point inthe energy diagram is described as a conical intersection. The concept of internalconversion induced by a shape deformation provides an explanation for the fast re-laxation observed in the case of Al13
-, as pointed out by Kresin et al. [23] (see page
17). It is interesting to note that recently an excitation induced lattice relaxationis also considered as a solution of the “phonon bottleneck” problem10 of larger semi-conductor nanoparticles [24].
In contrast to particles on a bulk surface, for gas phase clusters the excitationenergy is confined in the cluster and cannot dissipate into the substrate. As de-scribed, also the relaxation dynamics for clusters are different from that of atoms orbulk materials, since the electronic structure differs. The density of states near thehighest occupied state (the Fermi-level for bulk metals) is usually higher than foratoms but lower than for bulk metals, so that relaxation in clusters is rather fasterthan for atoms but slower than for bulk metals (see figure 3.2). In this respect, newphotochemical properties might occur, because the electronic properties can changewith each additional atom.
10Semiconductor nanoparticles or quantum dots (quasi 0D materials) were expected to show slowrelaxation after excitation due to confinement, which gives rise to a reduced electronic DOSfor phonon-assisted processes [234, 235]. However, lifetimes in the subpicosecond to picosecondregime were observed [236–240].
53

3 Basic Concepts and Methods
Indirect Processes
After relaxation of the initially excited cluster, the following indirect processes mightoccur:
• Delayed dissociation/desorption of a monomer/adsorbate: This process canbe mediated either by hot electrons (DIET/DIMET or frictional approach) orby excitation of the vibrational system (ladder climbing process), as alreadydiscussed for bulk materials.
Thermal dissociation of clusters can be described by statistical models. Asalready mentioned, the dissociation/desorption in thermal equilibrium is dueto statistical energy fluctuations. There is a certain statistical probability for asufficient amount of energy to be accumulated in one of the vibrational degreesof freedom to break the bond. The decay time depends on the ratio betweenexcitation and binding energy and on the number of degrees of freedom. Thiscorrelation was first described by Rice and Ramsperger [241], and Kassel [242].Their theory, called RRK-theory, treats molecules or clusters as a collectionof s independent harmonic oscillators (representing the vibrational degrees offreedom), which are strongly coupled in a way so that energy can be transferredamong them. It is assumed that dissociation occurs if, by chance, sufficientenergy Ediss is accumulated in one of the oscillators, which corresponds tothe breaking of a bond. The probability for that process is then given bythe number of possible arrangements, provided that an energy higher thanEdiss in the particular oscillator is accumulated, divided by the total numberof possible arrangements of the energy within the cluster. Using statisticalphysics, the number of possible ways for distributing the energy E among sdegrees of freedom is Es−1
(s−1)!, and the reaction probability is [243]
(E − Ediss)s−1/(s− 1)!
Es−1/(s− 1)!=
(E − Ediss
E
)s−1
, (3.11)
which gives a reaction rate k being inversely proportional to the decay time τ
k(E) =1
τ= νvib · g ·
(E − Ediss
E
)s−1
, (3.12)
where g is the degeneracy of the reaction path and νvib the frequency of theparticular oscillator (meaning that the oscillator is running νvib times per sec-ond against the dissociation barrier).In the limit of infinite n (number of atoms in the cluster), s is divergent butequation 3.12 can be simplified using the relation E = skBT , which “defines” a
54

3.6 Dynamics in Clusters
cluster temperature T , being the energy within a cluster divided by its numberof vibrational degrees of freedom (kB is Boltzmann’s constant) [168]:
k(T ) =1
τ= νvib · g · e
−EdisskBT . (3.13)
This expression can be suitable already for n > 30 [168]. However, comparedwith experiments, the classical RRK-theory can underestimate the dissocia-tion rates quite often by many orders of magnitude [243]. One problem of thistheory is the classical treatment of the vibrational degrees of freedom.
A quantum version of the theory was developed by Kassel [244]: For s oscil-lators having the same frequency, the number of possible ways to distributej quanta among these oscillators is (j+s−1)!
j!(s−1)!. Assuming that the cluster has
j = Eh〈νvib〉
quanta of vibrational excitations, 〈νvib〉 is the mean frequency of all
vibrations of the cluster and m = Ediss
hνvibquanta are required for dissociation of
the chosen bond [163], the reaction probability is given by
(j −m+ s− 1)!/(j −m)!(s− 1)!
(j + s− 1)!/j!(s− 1)!=
j!(j −m+ s− 1)!
(j + s− 1)!(j −m)!, (3.14)
so that the dissociation rate becomes [245]
k(E) =1
τ= g · νvib
j!(j −m+ s− 1)!
(j + s− 1)!(j −m)!. (3.15)
The quantum mechanical formulation of the RRK-theory is still not accurateenough for many cases [243], hence Marcus developed the RRKM-theory [246,247], based on the RRK-theory. It makes use of the concepts of a transitionstate located on the maximum of the hyper potential surface on the reactionpath from the cluster to the fragments. Now all the vibrational and rotationaldegrees of freedom are considered and also the zero-point energies are included.Using statistical mechanics the reaction rate is given by [245]
k(E) = l 6= · 1
h
N(E 6=)
ρ(Ev)(3.16)
where N(E 6=) is the sum of states of the active vibrations of the cluster in thetransition state, ρ(Ev) corresponds to the density of states of the active degreesof freedom of the excited system and l 6= is the number of different transitionstates which can be formed if the atoms are distinguishable. N and ρ canbe calculated by efficient algorithms, but it is quite a challenge to find theappropriate transition state. For more details see [243, 245] and the referencestherein.
55
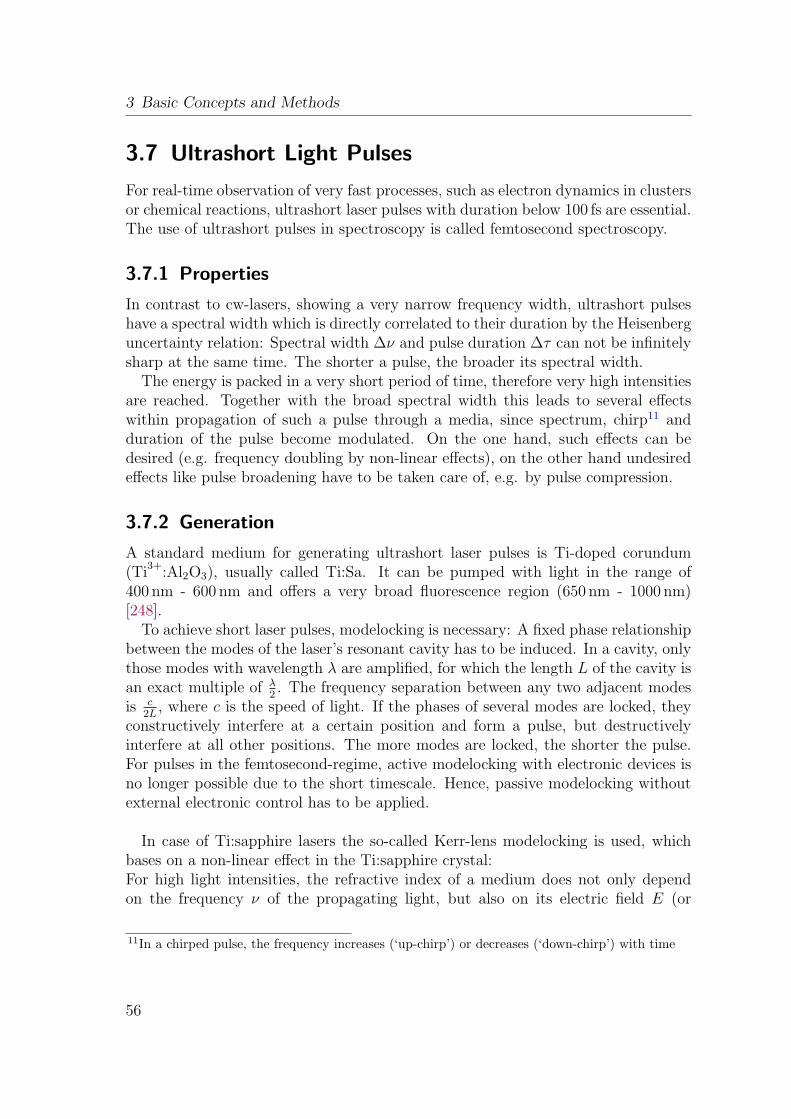
3 Basic Concepts and Methods
3.7 Ultrashort Light Pulses
For real-time observation of very fast processes, such as electron dynamics in clustersor chemical reactions, ultrashort laser pulses with duration below 100 fs are essential.The use of ultrashort pulses in spectroscopy is called femtosecond spectroscopy.
3.7.1 Properties
In contrast to cw-lasers, showing a very narrow frequency width, ultrashort pulseshave a spectral width which is directly correlated to their duration by the Heisenberguncertainty relation: Spectral width ∆ν and pulse duration ∆τ can not be infinitelysharp at the same time. The shorter a pulse, the broader its spectral width.
The energy is packed in a very short period of time, therefore very high intensitiesare reached. Together with the broad spectral width this leads to several effectswithin propagation of such a pulse through a media, since spectrum, chirp11 andduration of the pulse become modulated. On the one hand, such effects can bedesired (e.g. frequency doubling by non-linear effects), on the other hand undesiredeffects like pulse broadening have to be taken care of, e.g. by pulse compression.
3.7.2 Generation
A standard medium for generating ultrashort laser pulses is Ti-doped corundum(Ti
3+:Al2O3), usually called Ti:Sa. It can be pumped with light in the range of
400 nm - 600 nm and offers a very broad fluorescence region (650 nm - 1000 nm)[248].
To achieve short laser pulses, modelocking is necessary: A fixed phase relationshipbetween the modes of the laser’s resonant cavity has to be induced. In a cavity, onlythose modes with wavelength λ are amplified, for which the length L of the cavity isan exact multiple of λ
2. The frequency separation between any two adjacent modes
is c2L
, where c is the speed of light. If the phases of several modes are locked, theyconstructively interfere at a certain position and form a pulse, but destructivelyinterfere at all other positions. The more modes are locked, the shorter the pulse.For pulses in the femtosecond-regime, active modelocking with electronic devices isno longer possible due to the short timescale. Hence, passive modelocking withoutexternal electronic control has to be applied.
In case of Ti:sapphire lasers the so-called Kerr-lens modelocking is used, whichbases on a non-linear effect in the Ti:sapphire crystal:For high light intensities, the refractive index of a medium does not only dependon the frequency ν of the propagating light, but also on its electric field E (or
11In a chirped pulse, the frequency increases (‘up-chirp’) or decreases (‘down-chirp’) with time
56

3.7 Ultrashort Light Pulses
intensity I). The refractive index n is then time-dependent and can be written as
n(t) = n0 + n∗2|E(t)|2 = n0 + n2I(t). (3.17)
If a Gaussian beam profile is assumed and if it is considered that light is deflectedtowards the optically thicker medium, a laser beam gets focused within a non-linearmedium (having positive n2) to the center of the beam. This effect is called self-focusing and originates from the non-uniform power density distribution in a Gaus-sian beam, leading to a change of the refractive index across the beam, which ishigher in the center than at the edges. Therefore, a rod of an active Kerr mediumacts as a lens for high intensity light. For Ti:sapphire lasers the crystal acts as aKerr-lens. To achieve modelocking rather than cw-mode, it can be necessary to “as-sist”the constructive interference at a certain position. This leads to higher intensityat this point and thus stronger focusing in this zone. In the simplest case an apertureblocks the less focused part of the beam. After some round-trips the modelockingis amplified and an ultrashort light pulse is created. In case of the laser systemused in this work, an AOM (acousto-optical-modulator) is used for introducing adisturbance which establishes modelocking (see section 4.4.2). In case of optimalalignment of the beam path including the pump-beam, even the aperture can beabandoned. A little disturbance occurring while the laser is running in cw-mode canamplify and lead to modelocking [249].
Unfortunately the propagation through the laser cavity also leads to dispersion12
of the pulse, limiting the minimal reachable pulse duration [250]. This is causedby optical components such as mirrors and the exit window, but mainly by thecrystal itself. Therefore, it is necessary to counteract the dispersion already withinthe cavity. This can be done by using a prism compressor, consisting of at leasttwo prisms: In the first prism, the dispersion of the prism material causes differentwavelength components to travel along different paths. A second prism superposesthe different components again. Depending on the setup, the components previouslyseparated in time can be made overlapping after the compressor.In the used setup, four prisms are installed, which is illustrated in figure 4.7. Thesecond prism parallelizes the spatially broadened beam, so that by means of a slitthe central wavelength of the pulse can be changed, leading to a slightly tunablelaser. The third and fourth prisms combine the different wavelength componentsand optimize the overlap in time.
12Here: Different wavelengths within the pulse have different group velocities which causes aprolongation of the pulse duration
57


4 Experimental Setup
In this chapter the basic experimental setup for studying clusters via time-resolvedphotoelectron spectroscopy is described. A schematic overview of the experimentalapparatus is shown in figure 4.1. It consists of five components, which are describedin the corresponding sections:
• Cluster source (section 4.1)
• Mass spectrometer (section 4.2)
• Photoelectron spectrometer (section 4.3)
• Laser system (section 4.4)
• Optical setup (section 4.5)
fs-Laser system=800nm, 1kHz, 0.7mJ, 70fs�
PACIS
Adsorbate
valve Skimmers
He
Time-of-flight mass spectrometer
e detector-
Coil
fs-Pulses
Magnetic
bottle
Permanent
magnet
Deceleration unit
Reflectron
Cluster
detector
Clusters
Optical setup
e-
Figure 4.1: Scheme of the experimental apparatus. Clusters are generated with aPACIS and mass separated by a time of flight mass spectrometer with reflectron. Amass spectrum can be obtained from the cluster detector. In the interaction zone, aselected cluster bunch is irradiated by two laser pulses (pump & probe), detachingphotoelectrons. In the strong divergent field of a permanent magnet, the e− followthe gradient towards the homogeneous field of a coil, which guides them to the e−
detector and a photoelectron spectrum is recorded. Modified from [251].
59

4 Experimental Setup
The apparatus was originally built by P. W. Gerhardt [144]. Within the presentedwork, a reflectron was installed, providing higher mass resolution and thus enablingstudies on reacted clusters. Furthermore, the optical setup was modified to higherphoton energies, allowing time-resolved measurements on species with higher elec-tron affinity: An optical setup for one-color pump probe experiments using 3.1 eVand an arrangement for two-color pump probe studies with 3.1 eV and 4.65 eV wereinstalled.
Basically, two kinds of concepts can be distinguished: Continuous experimentsand pulsed ones. The first PES experiments on mass-selected cluster anions wereperformed in the groups of W. C. Lineberger and K. H. Bowen with a continuoussetup [25, 30, 252, 253]. Advantages of this concept are a high energy resolutiondue to the dispersive electron spectrometer (∼ 5 meV [189]) and the chance of angu-lar resolved PES. In combination with a cluster source providing a high continuouscluster intensity (e.g. a magnetron sputter source [254, 255]), this setup is especiallysuitable for cluster deposition [256]. However, a dispersive spectrometer can detectonly electrons of a certain energy at a time, so that only low photoelectron intensi-ties can be achieved.
Reflectron
1m
Millennia VMillennia V
Spitfire 50 fsSpitfire 50 fs
Tsunami
sub35
Tsunami
sub35
Evo
lutio
nX
Evo
lutio
nX
II IIIChamber IChamber I Chamber IVChamber IV
Chamber VChamber V
Figure 4.2: Arrangement of the experimental setup. Chamber I contains thePACIS. Chambers II and III are used to pump down the carrier gas used for clustergeneration. Chamber IV contains the ion optics and the acceleration unit. The elec-tron spectrometer and the interaction zone between laser and cluster beam is locatedin chamber V, where also the reflectron is mounted. The arrangement of the lasersystem is shown in the lower right corner.
60

4.1 Cluster Source
The experiment described here is a pulsed experiment, which was developed al-most simultaneously in the groups of O. Cheshnovsky and R. E. Smalley [257] andG. Gantefor, K.-H. Meiwes-Broer and H. O. Lutz [27]. Here, the experiment is runin pulsed mode, which allows the use of other types of source and spectrometer.In particular, a TOF photoelectron spectrometer can be used, which provides aresolution of 1% and a collection efficiency of 50% [189]. Moreover, it is possibleto study dynamical processes by means of a femtosecond laser system. The basicexperimental setup was already described in several essays [144, 145, 251, 258] andwill be briefly discussed in this chapter.
Cluster source, mass spectrometer and electron spectrometer are located within avacuum system, which consists of several chambers. The vacuum system is designedin such a way that it can be decomposed and shipped to suitable light sources. Thearrangement is sketched in figure 4.2.
4.1 Cluster Source
Clusters are mostly generated by condensation of atoms or molecules in the gasphase via adiabatic expansion into vacuum. For non-gaseous substances it is nec-essary to vaporize them first. Depending on the material, this can be achieved bydifferent methods such as an oven [259], a laser vaporization source [260–262] or asputter source [254, 255].
In this experiment, a PACIS (Pulsed Arc Cluster Ion Source)[263–266] is usedand will be described in this section. It is similar to a laser vaporization source, butuses an electric arc rather than a laser to vaporize the cluster material in a heliumatmosphere (see figure 4.3). One crucial advantage of the PACIS is the high amountof created ions, so that ionization after the initial discharge is not necessary.
The PACIS is located in chamber I (see fig. 4.2). The pulsed arc burns in a quartzor boron-nitride cube, where two channels cross each other perpendicularly with avariable repetition rate (40 Hz for the measurements described here). Two electrodesare located on opposite sides of the cube and have a distance of 0.5− 3 mm, whichcan be varied by changing the position of the anode. Helium is inserted as carriergas by a pulsed solenoid valve at a pressure up to 20 bar. Simultaneously an ignitionvoltage of around 600 V is applied between the electrodes and an arc is ignited, whichburns for a variable time (∼ 10− 100 µs) at a selected voltage (∼ 100− 150 V) anda current of several thousand amps is flowing. In the arc ionized He
+ions are accel-
erated towards the cathode and ablate the target material by sputtering. The metalvapor and the helium mixes within the discharge and the resulting plasma is flushed
61

4 Experimental Setup
Metal cathode
Quartz cube
Extender
Copper anode
He
O2
Figure 4.3: Scheme of the cluster source PACIS. The cathode gets vaporized by thearc and the resulting plasma is carried along with the helium. The collisions withthe extender cool down the mixture and clusters form [192].
into the extender. The gas mixture is cooled down by collisions with the walls ofthe water cooled extender1, which enables condensation and formation of clusters.At the stage of the interaction with the laser system, the cluster temperature isestimated to be roughly room temperature [29]. About 10 % of the emitted mate-rial is charged (both positively and negatively) [264, 266]. A second solenoid valveis mounted on the extender and allows for the creation of metal-adsorbate clusters.These clusters can be generated in two different ways [268]: A pulse of adsorbate gas(here: O2) is injected downstream by the second valve into the extender and the O2
molecules react with the clusters, generating preferentially moleculary chemisorbedspecies. Alternatively, a pulse of adsorbate gas is inserted into the source before theHe valve opens to allow the O2 being present in the electric arc, leading to dissoci-ation of a large fraction of the molecules into atomic oxygen, which can react withthe clusters. In this manner, also dissociatively chemisorbed species can efficientlybe created [92].
The size distribution of the generated cluster strongly depends on the conditionswithin the source. A long, narrow extender leads to bigger clusters since morecollisions of the vaporized target material take place. To further optimize the cluster
1the supersonic expansion into vacuum is too weak for cooling in the arrangement used here [267]
62

4.2 Mass Spectrometer
yield, it is possible to change the duration and the time delays between the gas pulses,the discharge and the start of the acceleration voltage. Typical delay times are inthe region of ten up to several hundred microseconds.
4.2 Mass Spectrometer
After leaving the extender, the clusters pass through three skimmers (located inchambers II and III), cutting out the center region of the beam which prevents itfrom being dispersed by the Mach front and makes it easier for the carrier gas tobe drawn off by the pumps. Furthermore, they separate the differential pumpingstages, so that the clusters travel through a pressure gradient towards lower pressureinto the mass spectrometer.
In chamber IV, the clusters enter the time-of-flight mass spectrometer (TOF).Therein, the clusters get accelerated by a pulsed (40 Hz) negative electric potential(∼ 1000 V). The electrodes used for acceleration have the shape of a cone, toachieve a spatial focus of the beam and accordingly increase cluster intensity. Inthis manner, the negatively charged particles get accelerated, while the neutrals driftwithout influence of the field and the positively charged get filtered out. Due to theelectric field, all anions gain the same kinetic energy and subsequently travel througha field free zone. Since light particles travel faster than heavy particles having thesame kinetic energy, the “cluster cloud” separates into several bunches, each bunchcontaining clusters of the same mass. The clusters reach a speed v, which is inverselyproportional to the square root of their mass m:
v =
√2qαU0
m(4.1)
U0 corresponds to the applied voltage for acceleration, q is the charge of the clusterand α a correction, which takes into account that in reality not all clusters gainthe kinetic energy e ·U0. Using 4.1, the relation t ∝
√m is obtained, which enables
the calibration of the spectrometer by using particles of known masses. In order toguide the ion beam through the apparatus, ion optics (consisting of several electriclenses and steerers2) is used.
The mass resolution m∆m
is limited by several effects [251]: The cluster cloud en-tering the acceleration unit has a certain size, so that clusters at different startingpositions feel different potential differences and gain different kinetic energy. Besides
2A steerer consists of a pair of metal plates, where a variable potential can be applied, eachplate having opposite polarity with respect to the counterpart but equal absolute value of thepotential (similar to a “classical” capacitor). Varying the voltage, the ions can be deflected asdesired.
63

4 Experimental Setup
that, the thermal velocity distribution of the clusters coming from the source alsoyields a decrease of mass resolution. However, this effect plays only a minor role,since the adiabatic expansion within the supersonic beam leads to a relatively sharpvelocity distribution. A third aspect are coulomb effects between the clusters [269].Especially for high ion intensities (which is crucial for pump-probe experiments),these effects lead to repulsion of the clusters and to broadening of the velocity dis-tribution of a cluster bunch. Another important limiting factor are inhomogeneitiesof the acceleration fields. If they are to high, they can act as an electrical lens andaberration might occur. To minimize those effects, grids can be used to homogenizethe fields (also within the reflectron). However, grids cause a severe drop of ionintensity. Since high intensity is a very important factor, grids are abandoned in ourexperiment. Further limiting factors of a high mass resolution are the cone shapeof the channeltron for cluster detection and the stability of the high voltage powersupplies for acceleration pulse and reflectron [267].
To avoid these effects or at least to compensate for them, different measures canbe taken [251]:On the one hand ionization can take place within the acceleration unit with a focusedlaser. On the other hand, the advantages of the PACIS, which are a high clusterintensity and already ionized clusters, would be foiled.Wiley and McLaren [270] suggested in 1955 the use of a two-stage acceleration unitinstead of an one-stage unit. For an one-stage unit, the focus point, where a fasterparticle overtakes a slower, is at a fixed position, which is in a distance of 2L fromthe ending of the acceleration zone, if L is the length of that unit. For a two stageunit, the focus point depends on the ratio of the applied voltages and can be varied,leading to an optimum resolution at a desired position (e.g. at the interaction zoneor the mass detector).
4.2.1 Reflectron
To take advantage of a two-stage setup and increase mass resolution, a reflectronwas attached to chamber V of the experimental apparatus (see figure 4.2). Thereflectron has two stages: A deceleration field (having a steep increase of the electricfield) and a reflection field (with slow increase). This is implemented by using several(40) equally spaced metal rings, which are connected by resistors. In this way, alinear increasing voltage can be applied. The deceleration field is generated by 5rings, with a potential difference of ∼ 550 V, whereas to the reflection field a similarpotential difference is applied on, but divided among 35 rings.
Two effects of the reflectron increase mass resolution: Firstly the flight distanceof the clusters gets prolonged which improves mass separation; Secondly, fasterclusters penetrate deeper into the reflection field and experience a time delay due
64
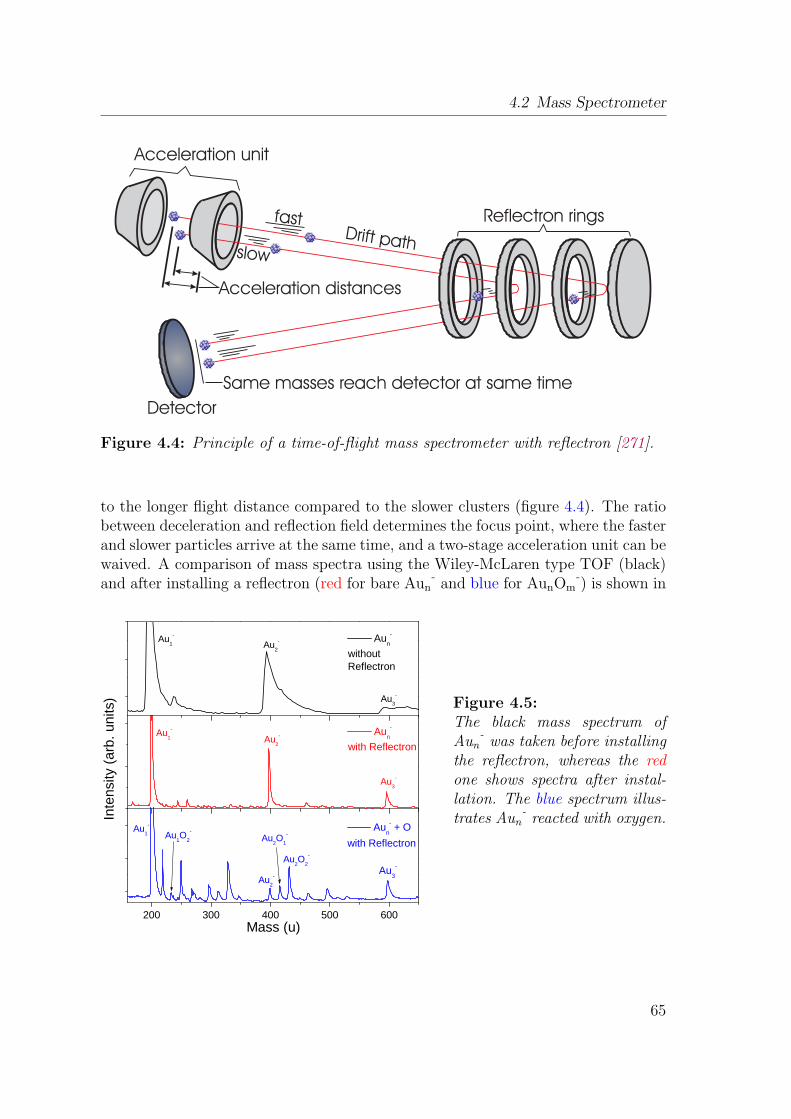
4.2 Mass Spectrometer
Acceleration unit
Drift path
fast
slow
Acceleration distances
Same masses reach detector at same time
Detector
Reflectron rings
Figure 4.4: Principle of a time-of-flight mass spectrometer with reflectron [271].
to the longer flight distance compared to the slower clusters (figure 4.4). The ratiobetween deceleration and reflection field determines the focus point, where the fasterand slower particles arrive at the same time, and a two-stage acceleration unit can bewaived. A comparison of mass spectra using the Wiley-McLaren type TOF (black)and after installing a reflectron (red for bare Aun
-and blue for AunOm
-) is shown in
2 0 0 3 0 0 4 0 0 5 0 0 6 0 0
A u 2 O 1-
A u 2 O 2-
A u 1 O 2-
w i t h R e f l e c t r o n
M a s s ( u )
A u n- + O
w i t h R e f l e c t r o n
Inten
sity (a
rb. un
its)
A u n-
A u 3-
A u 2-A u 1
-
A u 3-
A u 2-
A u 1-
A u 3-
A u 2-
A u n-
w i t h o u tR e f l e c t r o n
A u 1-
Figure 4.5:The black mass spectrum ofAun
-was taken before installing
the reflectron, whereas the redone shows spectra after instal-lation. The blue spectrum illus-trates Aun
-reacted with oxygen.
65

4 Experimental Setup
figure 4.5. The new setup was developed in this work, which is capable of a massresolution of roughly m
∆m≈ 400.
4.3 Photoelectron Spectrometer
The cluster beam is focused on the interaction zone with the laser by means ofelectric lenses. By variation of the time delay between acceleration pulse and laser,it is possible to select a bunch containing clusters of the same mass, which arethen irradiated by a laser. The kinetic energy of the photoelectrons is measuredby a time-of-flight setup: They travel through a drift tube, and the time until theyreach the detector is measured. The time-of-flight spectra can be converted intoenergy spectra by using the relation t ∝ 1/
√Ekin between time and kinetic energy.
Comparison with known spectra allows for the calibration of the spectrometer.
4.3.1 Magnetic Bottle
The spectrometer used in this work is a so-called “magnetic bottle”. It is named af-ter the bottle-like shape of the magnetic fields within the spectrometer. It was firstpublished in 1983 by Kruit and Read [272] and used shortly after in cluster scienceby Chesnovsky et al. [257] and Gantefor et al. [273]. The basic principle is shown infigure 4.6. In the interaction zone of ion beam and laser, a highly divergent magneticfield (∼ 0.1 T/mm [194]), caused by a bar magnet, is present. In the inhomogeneousfield, the detached photoelectrons follow the field gradient towards a weaker, ho-mogeneous magnetic field (∼ 0.001 T [194]), which guides the electrons through adrift tube onto a channeltron. Since the Lorentz-force is always perpendicular to thevelocity of the electrons, the kinetic energy remains constant. In this manner, al-most all photoelectrons, independent of the direction of their emission, get collected[265] and it is possible to scan the whole relevant energy regime in one measurement.
The longer the drift tube, the better the energy resolution [189]. Here, the drifttube has a length of around 1.5 m and is coated with a thin graphite layer to obtaina homogeneous and conducting surface, having the same work function everywhere,which minimizes losses due to space charge effects. The use of magnetic fields in-creases the photoelectron intensity by two orders of magnitude, which enables spec-troscopy using very low laser intensity [194]. This fact is especially important forexperiments using a femtosecond laser, since the pulse intensity should be kept aslow as possible, to minimize undesired non-linear effects (e.g. multi-photon ionisa-tion, etc.). For further optimization, two Helmholtz-coils are used to compensatefor the earth’s magnetic field.
The energy resolution is mainly limited by the Doppler broadening due to the
66

4.3 Photoelectron Spectrometer
B
h�
Mn
-
Mn
e-
Electron detector
Figure 4.6:Basic Principle of the “magnetic bot-tle”. The detached photoelectrons aredeflected by the inhomogeneous mag-netic field at the interaction zone intothe drift tube, where a homogeneousmagnetic field guides them to the detec-tor. The kinetic energy of the electronscan be derived from their flight time.Modified from [33, 192].
velocity of the clusters. The velocity of the electrons ~ve observed by the spectrometeris the sum of the velocity of the electrons caused by the photo effect ~vphoto and thevelocity of the ions ~vion. Taking this into account, the kinetic energy of an electron(having mass me) is
Ekin =1
2me(~vphoto + ~vion)2. (4.2)
Neglecting the part containing (~vion)2, the maximum broadening depends on theproduct of both velocities:
∆Ekin ∝ me · vphoto · vion (4.3)
According to this formula, the resolution decreases with increasing kinetic energy ofthe photoelectrons.
To minimize the Doppler broadening, the cluster ions are decelerated in the photo-detachment region by a pulsed electric field, depending on the acceleration field(here: ∼ 950 V). Another effect, which limits the resolution, is coulomb repulsiondue to high ion intensity (which is especially important for pump-probe experimentsas in this work). As already mentioned, the energy resolution depends on the kineticenergy of the photoelectrons and the variance for the presented measurements wasaround ± 0.1 eV. However, it has been demonstrated that an energy resolution of6 meV can be reached with this type of spectrometer [189].
67

4 Experimental Setup
4.4 Laser System
The laser system used in this work is manufactured by Spectra Physics and consistsof four components (see figure 4.2). The two main parts are:
• The oscillator Tsunami (see section 4.4.2), generating the ultra-short pulses,which is pumped by the Millennia V (sect. 4.4.1).
• The regenerative3 amplifier Spitfire (sect. 4.4.4), which amplifies these pulses.It is pumped by the Evolution X (sect. 4.4.3).
4.4.1 Millennia V
The first component is the Millennia V, a Nd:YVO4 solid state cw-laser, pumpedby two arrays of laser diodes having a maximum power of 20 W each. The firstharmonic (1064 nm) is frequency doubled by a LBO4-crystal, which generates up to5 W at a wavelength of 532 nm (green) [274]. It is used for pumping the Tsunamiwith a power of 4.3 W.
4.4.2 Tsunami
The Tsunami is a mode-locked Ti:sapphire-laser, which generates laser pulses < 35 fslength at a repetition rate near 80 MHz [275]. The wavelength of the pulses is cen-tered at about 800 nm (infrared) and their width is about 40 nm. The average outputpower reaches up to 300 mW.
The optical path inside the Tsunami is shown in figure 4.7. The green pump beamfrom the Millennia is injected into the cavity via mirrors P1 and P2 and pumps theTi:sapphire crystal, leading to laser emission (red beam) between the ending mirrorsM1 and M10. The sequence of prisms Pr1 to Pr4 is used for pulse compression. Thedifferent components of the spectrum are spatially separated, so that the centralwavelength can be selected by a slit, which is variable in vertical direction and con-nected to a micrometer caliper. The amount of glass from the prisms which is in thebeam, can be changed by a second micrometer caliper. In this way, the pulse com-pression can be optimized and correspondingly the pulse length minimized. TherebyPr2 and Pr3 move vertically up or down. When the output wavelength is modified,the cavity has to be adjusted, to achieve the shortest pulses. In first order, slit andprisms have to be moved at the same rate, i.e. the micrometer calipers have to beturned by the same amount. To optimize output power, mirrors M1 and M10 can be
3Regenerative amplifier: An optical amplifier with a cavity in which pulses do a certain numberof round trips
4Lithium triborate (LiB3O5)
68

4.4 Laser System
Model 3955
AOM electronics
M1
Pump
beam
Pump
beam
Brewster
window
P2
M2
Beam
dump
P1
M3
Ti:sapphire-crystal
M4
M5
Pr1
M6
M7
Pr2 Pr3
M9
Slit
M8
Pr4
AOM
M10Beam
splitter
Brewster
window
Photo diode
Figure 4.7: Sketch of the optical path inside the Tsunami and the regulator circuitfor modulating the AOM.
adjusted from outside the laser. The AOM (acousto-optical-modulator) is used toachieve modelocking rather than cw-mode by assisting the constructive interferencegenerating ultra short pulses (section 3.7) at a certain position. The AOM basi-cally switches the quality factor of the cavity (“Q-switching”) between high losses(meaning no laser activity) and almost no losses (laser activity) per roundtrip. It iscontrolled by an electronic device, obtaining the optimum frequency from a photodiode, which detects the pulses going around in the cavity. In this manner, changesof e.g. the cavity length can be detected and the AOM frequency adjusted. Afterestablishing modelocking, the AOM can be turned off.
4.4.3 Evolution X
The Evolution X serves as pump laser for the Spitfire. The laser medium is Nd:LiYF4,which is pumped by four arrays of AlGaAs laser diodes. By means of Q-switchingusing an AOM, pulses of 50 ns to 150 ns and a maximum pulse energy of 10 mJ at arepetition rate of 1 kHz are generated [276]. The fundamental at 1053 nm is intra-cavity frequency doubled by a LBO to 527 nm (green), with a maximum power of10 W. For the experiments carried out an output power between 6.4 W and 6.8 Wwas used.
69
4 Experimental Setup
4.4.4 Spitfire
The ultra-short pulses, coming from the Tsunami, are amplified within the Spitfireby chirped pulse amplification [277]: A femtosecond pulse is stretched in time bytaking advantage of its high spectral width, which yields a chirped pulse. In the nextstep, the energy per pulse is increased by linear amplification. At last, the pulseis compressed again. The stretching in time (here done by means of a grating) isnecessary, since the high field strength of a femtosecond pulse can damage the gainmedium, which is in this case a Ti:sapphire crystal. The compressor mainly consistsof a second grating, which basically reverses the stretching caused by the first one.The optimum distance between compressor grating and a mirror assembly, sittingon a slide, can be adjusted from outside by a stepping motor.
Special care has to be taken of the fact that the Tsunami can accidentally switchfrom fs-operation to cw-mode. In this case, the spectral width is very narrow andthe grating is not able to stretch the beam in time, so that the intensity inside theTi:sapphire-crystal can exceed its damage threshold. To virtually prevent damage,two photo diodes, separated by a few centimeters, observe the first order of diffrac-tion coming from the stretcher grating. In case the spectrum is not wide enough,one of them or both do not record light and prevent the beam from further propa-gating into the amplification cavity by changing the polarization of the beam, usinga Pockels5 cell. Obviously, their signals and subsequent triggered processes cannotexceed the speed of light, so even in case the diodes recognize the problem, thereis still a limited exposure time of the crystal to the beam (which might cause somedamage), but it is kept as short as possible.
After leaving the Spitfire, the beam has a diameter of 7 mm, a central wavelengthof 800 nm (infrared), corresponding to a photon energy of 1.55 eV. It is horizontallylinear polarized and the pulse duration is around 70 fs. The average power is in theregime of 600− 700 mW at a repetition rate of 1 kHz. Compared to the averagepower of the Tsunami, this does not seem very impressive. However, taking into ac-count the repetition rate giving the energy per pulse, the Spitfire yields 0.6− 0.7 mJper pulse compared to only a few nJ for the Tsunami. For more details (e.g. opticalpath inside the Spitfire) see [145, 278].
4.5 Optical Setup
In the presented work, three different pump-probe setups were used. They basicallydiffer in the wavelength of the beams for pump and probe. In all setups, the infrared
5The Pockels effect produces birefringence in an optical medium induced by a constant or varyingelectric field
70

4.5 Optical Setup
beam passes, after leaving the Spitfire, a type I6 BBO7 (not focused), where secondharmonic generation (SHG) takes place. The resulting vertically polarized light hasa wavelength of 400 nm (blue), corresponding to 3.1 eV photon energy. Changingthe orientation of the BBO with respect to the polarization of the incoming beam,the infrared power, which is converted to blue light, can be varied. The maximumblue output power is around 150 mW. In the following, the infrared beam will bereferred to as “red” and the blue beam as “blue”.
4.5.1 Optical Path for Red-Blue
The optical arrangement for the red-blue experiments is shown in figure 4.8. AfterSHG, red and blue are separated by a wavelength selective mirror. To obtain avariable delay between pump and probe pulse, the red beam is directed towards aretro reflector, which is mounted on a delay stage. The delay stage can be adjustedusing a micrometer caliper with an accuracy of 10 µm.
Beam splitter
BeamcombinerRed & blue Red
pulse
Bluepulse
Retro reflector
Retro reflector
to interaction zone
� �Delay stage
BBO for SHG
Figure 4.8: Sketch of the optical path for the red-blue experiments.
The delay time, introduced by the stage, is ∆τ = 2dc, if d is the elongated path.
The delay stage is arranged in a way that red as well as blue can be used as pumppulse. Both beams are recombined using a second, wavelength selective mirror. Alens (f = 500 mm) focuses both beams to the interaction zone with the clusters. Bychanging its position, the laser intensity irradiating the clusters can be varied.
6Type I: Two photons having ordinary polarization with respect to the crystal combine to formone photon, having double the frequency and extraordinary polarization
7BBO stands for β-BaB2O4 (beta barium borate), which is a crystal used in non-linear optics
71

4 Experimental Setup
The position of zero delay between both pulses is determined“in situ”by using thepump-probe feature of a cluster with a lifetime much shorter than the time resolutionof our experimental setup. In this case the dependence of the pump-probe signal onthe delay between pump and probe pulse corresponds to the time resolution (115 fs).The maximum is taken as time zero. In this case Ag3
-was taken as reference (see
section 5.2.1).
4.5.2 Optical Path for Blue-Blue
For the extension of our pump-probe experiments to gold clusters, the optical setupwas modified for higher photon energy, because gold clusters have higher detachmentenergies than the silver clusters studied before. For this part of the study, a one-color pump-probe experiment was performed using two blue pulses acting as pumpand probe.
Beam splitter
Probe pulse
Pump probe&Pumppulse
Retro reflector
to interaction zone
� �Delay stage
�/2BBO for SHG
Figure 4.9: Sketch of the optical path for the one-color blue-blue experiments.
In this case, only a few items are changed compared to the red-blue setup (seefigure 4.9): A Glan-Laser calcite polarizing beam splitter cube is used for splittingthe second harmonic into two beams (the ratio of the outgoing beams dependingon the polarization of the incoming beam). The outgoing beams are perpendicu-larly polarized with respect to each other and their intensity ratio can be varied bychanging the orientation of the λ/2-wave plate, which turns the polarization of theincoming beam before the beam splitter. The retro reflector mounted on the delaystage has a high reflectivity for 400 nm and high transmission for 800 nm. The timedelay between the two pulses can still be changed as described before. Both beams
72

4.5 Optical Setup
are recombined using a second polarizing beam splitter cube. The same lens usedin the previous setup focuses both pulses on the clusters.
For a one-color pump-probe setup, the zero point can be determined outside thechamber, since the dispersion due to the lens and the window is the same for bothpulses. In this case, the interference pattern of both pulses is observed on a screen(e.g. a sheet of paper). The zero point is assigned to maximum interference. Inorder to let both pulses interfere, the polarization of the beams has to be parallel(due to the beam splitter, they are polarized perpendicular to each other). This canbe done by means of a third polarizing beam splitter cube, which is oriented 45◦
with respect to the other cubes. This procedure can also provide an upper limit forthe time resolution of the optical setup (270 fs), taking the delay difference betweenbeginning and ending of the interference pattern while scanning over the zero point.The lower resolution compared to the red-blue setup can be explained by the factthat the pulses propagate through more material before interacting with the clusterbeam (especially the used calcite beam splitters with 13.7 mm length), introducingpulse broadening.
4.5.3 Optical Path for Blue-UV
The third optical setup used in this work (shown in figure 4.10) is a further develop-ment of the blue-blue setup to even higher photon energy. After SHG red and blueare separated by a wavelength selective mirror. The red beam passes a λ/2-waveplate and enters a second delay stage, where it is recombined with the part of theblue which is reflected from the beam splitter (see below). The λ/2-wave plate isused to rotate the polarization of the red beam in such a way, that it is parallelto the part of the blue beam it is combined with. Similar to the blue-blue setup,the blue beam passes a λ/2-wave plate after its generation, which is used to rotateits polarization and determines the ratio between the reflected, vertically polarizedpart and the transmitted, horizontally polarized part (called “pump” in figure 4.10).The pump part passes the retro reflector located on the delay stage which is usedto introduce the time delay between pump and probe. As already mentioned, thevertically polarized part of the blue beam is combined with the red beam on thesecond delay stage, which is used to create spatial as well as temporal overlap withinthe UV-BBO. It is also a type I BBO (cut in a different angle than the BBO usedfor SHG), optimized for generating the third harmonic with a wavelength of 266 nm(now referred to as UV), corresponding to 4.66 eV. Blue pump and UV probe arecombined, using the second polarizer, and focused on the interaction zone with thecluster beam using the 500 mm-lens.
The determination of the zero point is more difficult for the blue-UV experi-
73

4 Experimental Setup
beam splitter
Probe
Pump & probe
Pumppulse
Retro reflector
to interaction zone
� �Delay stage
�
�Stage
�/2
�/2
BBO for SHG
UV-BBO
Figure 4.10: Sketch of the optical path for the two-color blue-UV experiments.
ments. To roughly determine zero delay, the dye BiBuQ8 [279] can be used. BiBuQfluoresces if it is irradiated by a UV pulse isotropically and the lifetime of the cor-responding state is very long (0.9 ns [280]). If the blue pulse arrives after UV, theexcited state is depopulated by stimulated emission, pointing in propagation direc-tion of the causative blue pulse. This can be observed as a dip in the fluorescenceperpendicular to the laser beam. This was accomplished by inserting a test-tubecontaining BiBuQ solved in dioxane9 into the beam path, focusing both pulses usinga 75 mm-lens and monitoring the fluorescence by a spectrometer, depending on theposition of the retro reflector for the pump pulse. This procedure allows only for arough estimate of real zero, since the dispersion of tube and solution are different tothe one of the window.After this procedure time zero can be determined more exactly by monitoring thepump-probe features of Au3
-versus delay time (see fig. 4.11 and 4.12), which has
two long-lived excited states accessible with an excitation energy of 3.1 eV (see fig-ure 4.12). Pump-probe peaks can be observed at around 2.9 eV and 3.9 eV kineticenergy (see fig. 4.12). The peak at 0.8 eV decreases with increasing delay, since anelectron is excited from this state yielding the peak at 3.9 eV. The peaks centeredat 1.4 eV and 2.2 eV correspond to two-photon processes from the pump pulse. Theintensity of the pump-probe features plotted versus delay time shows a S-like edge(fig. 4.13). Only if the UV pulse hits the clusters after the blue beam has alreadyexcited them, the maximum of the curve is reached. The center of the slope is as-signed to the zero point. The derivative of the fit curve has a Gaussian-like shape
8 C48H66O2: 4,4´´´-bis[(2-butyloctyl)oxy]-1,1´:4´,1´´:4´´,1´´´- quaterphenyl9 C4H8O2
74

4.5 Optical Setup
and its FWHM can be taken as approximation for the time resolution of the setup,yielding 300 fs. Again the lower time resolution compared to the red-blue setup canbe explained by pulse broadening, caused by more material (especially the beamsplitter cubes) the pulses have to propagate through.
Figure 4.11:TR-PES “waterfall” plot of Au3
-using
pump and probe pulses with 3.1 eV and4.65 eV, respectively. For details referto the text.
0.5 1.0 1.5 2.0 2.5 3.0 3.5 4.0
-3.5-0.13
-0.070
0.071.2
3.26.5
26.539.9
106.6173.3
Delay (
ps)
46,50 46,00 45,99 45,98(ze 45,97 45,80 45,50 45,00 42,00 40,00 30,00 20,00
Kinetic Energy (eV)
Y A
xisAu3
-
Pump 3.1 eVProbe 3.1 eV
Figure 4.12:Expanded view of the TR-PES spectraof Au3
-, showing the pump-probe peaks
at around 2.9 eV and 3.9 eV.
2.5 3.0 3.5 4.0
-3.5-0.13
-0.070
0.071.2
3.26.5
26.539.9
106.6173.3
Au3-
Delay (ps)
46,5 46,0 45,9 45,9 45,9 45,8 45,5 45,0 42,0 40,0 30,0 20,0
Kinetic Energy (eV)Y
Axi
s
Pump 3.1 eVProbe 3.1 eV
Figure 4.13:Integrated intensity of the pump-probepeak at around 2.9 eV of Au3
-, showing
an S-like edge.
- 4 - 3 - 2 - 1 0 1 2 3 4 5 6 7
�!.!���!.! �).#)-&.2�*"#'���*'.3(!))�,/!.&*)��2�����������������#1+��1�1���"1���#&$%.&)$��2 �*�0#&$%.&)$���%&���*� ������ ��� ������������ ����� 4��������� �� ���� 4������1� ������ 4������"1 ���� � 4����
� ��).#)-&.2
Integ
rated
Inten
sity (a
rb. un
its)
�#'!2��+-�
A u 3-
75


5 Results and Discussion
5.1 Data Recording and Processing
For the experiments carried out in this work, all cluster anions are synthesized us-ing a PACIS (see section 4.1), where helium with a backing pressure of 20 bar isused as carrier gas. The trigger signals opening the valve have a duration of around0.1 ms. The length of the water-cooled (∼ 280 K) extender is varied between 0.16 mand 0.20 m, and its inner diameter is 4 mm. At the stage of TR-PES, the clustertemperature is estimated to be roughly room temperature, since the anions spend asufficient amount of time inside the water-cooled extender.
The PES-signal is detected with a channeltron and is related to the time of flightof the photoelectrons after detachment. The signal is accumulated using a time-to-digital converter with a time resolution of up to 1 ns. The spectrometer is calibratedusing data of clusters with known spectra. Accordingly, from the time of flight infor-mation the kinetic energy of the photoelectrons can be obtained, using a computeralgorithm. Measurement of a single photoelectron spectrum at a given delay usuallytakes only a few minutes, depending on the cluster intensity. This short time is quiteremarkable, since a mass selected gas phase ion beam is examined.
To obtain the binding energy spectrum, the kinetic energy has to be subtractedfrom the energy of the detaching photon(s), corresponding to equation 3.1. For fem-tosecond and especially two-color pump-probe experiments, the features observedin the spectra might originate from different photon energies and multi-photon pro-cesses. A peak appearing at a certain binding energy might belong to another state,having different binding energy. Thus, it is sometimes more appropriate to displaythe kinetic energy of the photoelectrons rather than the binding energy. In thiswork, both representations are used, depending on the context.
Comparison of the spectra taken at different delays between pump and probe pulserequires normalization, because mainly cluster intensity but also laser intensity ormeasurement time can vary from one measurement to the next. Several normaliza-tion procedures can be applied:
• The spectra can be normalized to the total intensity of all photoelectrons. This
77

5 Results and Discussion
is suitable, if the total detachment cross section is assumed to be constant ata given probe photon energy. However, no electrons should be “lost” duringa pump-probe series, which can happen by fragmentation, if the fragmentsignal is out of reach for the used probe energy or simply if the cross sectionfor photodetachment changes. Therefore, this procedure was only used forAuO2
-, since in this case all observable features show time-dependent behavior
and therefore normalization to a single peak is misleading.
• Another method is a single peak as normalization reference. In this case,the peak must be time-independent and often originates from a one-photonprocess, since these processes usually show a high cross section. Also two- ormulti-photon processes can be used, but it is required that they originate froma single pulse only (pump or probe). This method is used for all other clusters.
In this work, the dynamics of bare silver, silver oxide and gold oxide clustersare studied. Several series of pump-probe photoelectron spectra are recorded. Thepump pulse can excite a fraction of the anions in the mass-selected bunch, whereasthe probe pulse detaches electrons from the same bunch. The photon energy of thepump-pulse cannot be scanned in the experimental system. Therefore, pump-probesignals can only be observed for clusters having an available excited state for theelectron excitation using the fixed energies of the respective optical setup.
The photon flux of both pulses is optimized in order to minimize the number ofcluster anions hit by two or more photons from the same pulse, and to maximize thenumber of species hit by one single photon from each pulse. The photon flux canbe optimized with the following procedure: Only using the pump pulse the photonflux is decreased below a certain value, showing onset of electron detachment bytwo-photon processes. The same procedure can be applied for the probe pulse. Thephoton flux of both, pump and probe pulse, have to be readjusted for different clus-ters, because the cross sections of the corresponding processes may vary significantlyas a function of cluster size.
The lifetime of an excited state and the relaxation time of a cluster can be dif-ferent, which is illustrated schematically in figure 5.1. The lifetime is given by anexponential factor describing the depopulation of the state independent of the decaychannel. The relaxation time is the time the system needs to relax back into theground state, corresponding to the vanishing of any time-dependent signal in thephotoelectron spectrum. Relaxation of an excited state usually proceeds via varioussteps in a cascade and the lifetime is the first step of such a cascade. Since it is usu-ally hardly possible to distinguish between different decay steps within a cascade onthe basis of photoelectron data alone, only the relaxation time can be determined,which contains rather limited information about the total dynamics of the system.
78

5.1 Data Recording and Processing
~Lifetime
of state C
Excited state C
B
A
Ground
state GRe
laxa
tion
Figure 5.1:Illustration of the difference betweenlifetime and relaxation time. TheLifetime of state C is the time forits depopulation, whereas the relax-ation time corresponds to the timeneeded for the system to relax backinto the ground state G.
To extract the lifetime/relaxation time associated with a time-dependent peak inthe PES-spectrum, the intensity of the regarded energy range can be plotted versustime-delay between pump and probe pulse. Assuming an exponential decay, thetime constant can be calculated (see e.g. top trace in fig. 5.23).
First, results on bare silver clusters will be presented, continuing the studies onrelaxation of s/p metal clusters performed on gold in the the group of G. Gantefor,where long-lived excited states have been discovered (see page 18 and ref. [143, 146]),in contrast to the fast relaxation of open d-shell metal clusters (see page 17 and ref.[138–141, 158]). These experiments are carried out using the red-blue optical setup(section 4.8).In the next part, photodesorption is studied, starting with experimental data onAgnO2
-, which are obtained using the red-blue setup as well. To extend the studies to
clusters having higher electron affinity (e.g. AunOm-), the optical setup has first been
modified for one-color pump-probe experiments with blue light (section 4.9). Underthese conditions, Au2O
-has been examined. In order to obtain even better insight
into the electronic states and allow for experiments on species with even higherelectron affinity, the optical setup has very recently been modified further to carryout experiments using blue as pump pulse and the third harmonic (UV) as probepulse (see section 4.9). Using this newly developed setup, Ag8O2
-is studied to clarify
the findings on the silver oxide clusters using lower photon energy. Furthermore,Ag2O3
-turns out to exhibit dynamics which can be observed very clearly with the
new setup. In the last step the investigations are extended to gold oxide clusters.However, for better comprehensibility this chapter’s context is presented in order ofthe type of clusters and physical processes (relaxation, desorption) which are studiedand not classified by the optical setup.
79

5 Results and Discussion
5.2 Bare Silver Clusters
As discussed in section 2.2.1, different relaxation dynamics have been observed forsmall metal clusters, depending on the DOS. Furthermore, a relaxation mechanismdifferent to bulk materials or large nanoparticles was proposed for nanoclusters,namely internal conversion induced by a shape deformation following excitation [23].In the present work, the studies are extended to Agn
-clusters to check the validity
of the aforementioned ideas.
The pump pulse used for the studies on bare silver clusters has a photon energyof 1.55 eV and the probe pulse a photon energy of 3.1 eV. The optical setup used forthe measurements on bare silver clusters is the one described in section 4.8. Pump-probe signals were detected for Agn
-with n = 3, 7–9, 11, 14, 15, 18, 19 and 21.
For the species Ag3-, Ag7
-, Ag18
-and Ag19
-the pump-probe signals were sufficiently
intense to allow for a more detailed analysis of the dynamics.
For all clusters showing pump-probe signals, the time-dependent signal intensityhas been integrated and plotted versus pump-probe delay, resulting in an estimationof the relaxation times of the excited states (see figure 5.2 and table 5.1). In mostcases the time-dependent signal decreases, following an exponential law describedby a single time constant. In other cases (n = 7, 18, 19) it is possible to distinguishbetween a fast and a slow component. Both values are listed in Table I. However, thetrue relaxation behavior might be more complex and the time constants extractedfrom the photoelectron spectra can only be taken as crude estimations, describingthe behavior of the excited cluster. Ag3
-, Ag7
-, Ag18
-and Ag19
-show a rather unusual
behavior and will be discussed in more detail.
2 4 6 8 10 12 14 16 18 20 Bulk0
200400600800
1000
3000
4000
5000
Probe 3.1 eV
Agn-
Rel
axat
ion
Tim
e (fs
)
Number of Atoms n
Pump 1.55 eV
Figure 5.2:Relaxation times (fast comp. only)versus cluster size. The bulk value(from ref. [19]) is averaged forenergies between 0.5 eV and 1.5 eVabove EF . If no data is shown, nopump-probe signal was observed atthe used photon energy. Clusters ator shortly following the shell clos-ings (with 8, 18 & 20 electrons =7, 17 & 19 atoms) exhibit longer re-laxation times.
80

5.2 Bare Silver Clusters
Number of Relaxation time Error Relaxation time Error
atoms n fast comp. [ fs] [± fs] slow comp. [ fs] [± fs]
3 <115
7 3800 1000 9500 2500
8 220 80
9 170 60
11 250 80
14 <115
15 160 50
18 400 100 2900 2700
19 630 200 2700 800
21 420 80
Bulk 20 5
Table 5.1: Decay times of the pump-probe signals of Agn-
after excitation by a1.55 eV photon. The relaxation times have been obtained by integrating the truepump-probe signal. The intensities decrease with increasing delay and the relaxationtimes are determined by a standard exponential fit procedure. If the relaxation timeis equal to the experimental resolution, we cannot determine the relaxation time and115 fs is given as an upper limit. In some cases a slow and a fast component have beenidentified and both values are given. The value for bulk Ag averaged for excitationenergies between 0.5 eV and 1.5 eV above Fermi energy is taken from reference [19].Unusual long relaxation times are observed at n = 7, 18, 19, 21) (corresponding toclusters at or shortly following electronic shell closings).
5.2.1 Silver-Trimer Ag3-
The experimental time-resolution is determined by recording pump-probe spectra ofa short-lived excited state. Figure 5.3 displays a series of pump-probe photoelectronspectra of Ag3
-. The pump-probe signal at a kinetic energy of 2 eV indicates the
existence of an excited state with a lifetime much shorter than the time resolution.The intensity of this peak plotted versus pump-probe delay (figure 5.4) correspondsto the crosscorrelation curve and gives the real time-resolution of the apparatus.The spectra are normalized to the photoelectron peak at a kinetic energy of 0.7 eVcorresponding to photodetachment from Ag3
-by one photon of the probe pulse.
The 11 traces represent a scan range of 100 µm of the retroreflector corresponding
81

5 Results and Discussion
0.9 1.8 2.7
- 100 fs
300 fs
Nor
mal
ized
Inte
nsity
(arb
. uni
ts)
Kinetic Energy (eV)
Ag3-
Pump 1.55 eVProbe 3.1 eV
Scan Range100 µm, 660 fs
resolution < 115 fs
pump-probesignal
- 367 fs
0 fs
Figure 5.3:Pump-probe photoelectron spectra of Ag3
-
proving the time-resolution of the experi-mental setup. The pump-probe signal ex-hibits the signature of an excited state witha lifetime much shorter than the time res-olution of the experimental setup. In thiscase the dependence of the pump-probe sig-nal on the delay between pump and probepulse corresponds to the time resolution.
-0.4 -0.2 0.0 0.2
Data: InModel: EquatioWeighty Chi^2/DR^2 y0xcwA
Inte Ga
Pum
p-P
robe
Inte
nsity
(arb
. uni
ts)
Delay (ps)
Ag3-
FWHM:115±15 fs
Figure 5.4:Pump-probe intensity of the feature at2 eV of Ag3
-plotted versus time delay.
The FWHM of the curve corresponds tothe experimental time-resolution of theexperimental setup.
to 660 fs. As time resolution the FWHM1 (115 fs) of the pump-probe signal intensityas a function of the delay fitted by a Gaussian function is taken. The deconvolutionof this curve (multiplication by 1√
2for Gaussian pulses) yields the pulse duration
(81 fs), assuming equal duration and shape for pump and probe pulse. In addition,the maximum of this signal was taken as time zero. If the unknown lifetime of theexcited state is not negligible, the time resolution measured in this way gives anupper limit of the real time resolution.
1FWHM = Full Width at Half Maximum
82

5.2 Bare Silver Clusters
5.2.2 Silver-Heptamer Ag7-
Figure 5.5 displays a series of pump-probe photoelectron spectra of the magic clusterAg7
-. The spectra are normalized to the one-photon emission peak (not shown)
caused by the probe photons at Ekin = 0.54 eV corresponding to the known verticaldetachment energy of this cluster, which is 2.56 eV [35]. At zero delay, a maximumat the expected position of 2.09 eV=3.1 eV+1.55 eV-2.56 eV appears. At long delays(trace recorded at 25.7 ps) the pump-probe signal vanishes. In between, it exhibitsa rather complex behavior with a change in shape, position, and intensity. Thesignal to noise ratio does not allow a profound discussion of shape variations andthe gradual shift of its position. The time-dependent signal was integrated between1.2 eV and 2.5 eV kinetic energy for each spectrum. Since the observed decreasein intensity was found to be fast within the first 3 ps and much slower thereafter,the curve was fitted by two subsequent exponential decay functions. The timeconstants for the decays are 3.8 ps and 9.5 ps, respectively. Obviously, the realrelaxation process is rather complex and the description by two decay times is anapproximation.
Figure 5.5:A series of the pump-probe photoelec-tron spectra of Ag7
-is displayed. The
vertical detachment energy of Ag7-
is2.56 eV and the spectra are normal-ized to the signal at Ekin = 0.54 eV(not shown). At zero delay a featureat Ekin = 2.1 eV appears. With in-creasing delay this feature exhibits arather complex behavior and finally dis-appears. The decrease in intensity isbest fitted with two subsequent exponen-tial decay functions with a time constantof 3.8 ps ± 1 ps for delays < 3 ps and9.5 ps± 2.5 ps for longer delays.
1 2 3
Probe 3.1 eVPump 1.55 eV
25.7 ps
0 fs
12.5 ps6 ps
2.6 ps
1.3 ps
0.6 ps
300 fs
Nor
mal
ized
Inte
nsity
(arb
. uni
ts)
Kinetic Energy (eV)
Ag7-
83

5 Results and Discussion
5.2.3 Ag18-
Figure 5.6 displays difference spectra of Ag18-, which have been obtained by sub-
tracting the non-time-dependent photoemission signal, recorded at very long delay,from the TR-RES spectra at each delay. At a kinetic energy of around 2.2 eV,a time-dependent peak appears at zero delay, which shifts towards lower kineticenergy. In the range from 0.9 eV to 1.8 eV, an intense pump-probe signal can beobserved, which makes it difficult to monitor a possible shift of the “main” peak.The signal at 2.2 eV decreases in intensity and at the same time, the lower kineticenergy feature increases. For delays longer than 600 fs the overall intensity of thepump-probe signal decreases. As in the case of Ag7
-, the dynamics can be described
approximately by two subsequent exponential decay functions. The main peak in theregion between 1.8 eV and 2.2 eV decays within 400 fs± 100 fs, whereas the featureat lower kinetic energy has a longer time constant of 2900 fs± 1000 fs.
2.52.01.5
Kinetic Energy (eV)1.0
N
orm
aliz
ed In
tens
ity (a
rb.u
nits
)
Probe 3.1 eVPump 1.55 eV
5.2 ps
2.0 ps
600 fs
270 fs
70 fs
Ag18-
Figure 5.6:A series of TR-PES difference spectra ofAg18
-is displayed. The spectra have been
obtained at different pump-probe delays anddisplayed after the non-time-dependent pho-toemission signal had been subtracted. Thepeak at around 2.2 eV decreases in intensityand shifts towards lower kinetic energy. Thebroad feature between 0.9 eV and 1.8 eV alsodecreases in intensity, but with a lower timeconstant.
5.2.4 Ag19-
Time-resolved photoelectron difference spectra of Ag19-are displayed in figure 5.7.
At zero delay a peak appears at 1.8 eV, corresponding to the excitation of an electronof the uppermost occupied orbital of the anion (2s) by a photon of the pump pulse.With increasing delay the pump-probe feature exhibits a gradual shift towards higherbinding energy developing into a maximum between 1.1 eV and 1.5 eV kinetic energy
84

5.2 Bare Silver Clusters
at 1.3 ps. This feature disappears with further increasing delay. Again, the relaxationcan be described by two time constants: The signal in the interval between 1.5 eVand 2.0 eV decreases with a time constant of 630 fs, while the broad peak between1.1 eV and 1.5 eV vanishes more slowly with a time constant of 2.7 ps. The bluearrow at 1.1 eV in figure 5.7 corresponds to the estimated position of the upper edgeof the 1f/2s gap and the red arrow at 1.82 eV indicates the position of the pump-probe peak, corresponding to an electron excited from the 2s into 1f-orbital. Fordetails see section 5.2.6.
Figure 5.7:Series of pump-probe photoelectron spec-tra of Ag19
-. Only the time-dependent
part of the photoelectron signal is shown.The delay-independent signal, which hasbeen determined by recording a spectrumat a large delay when no further detectablechanges occur, has been subtracted. At zerodelay a peak appears at the expected posi-tion of the pump-probe signal as calculatedfrom the sum of the photon energies minusthe vertical detachment energy (indicated bythe red arrow: 1.82 eV = 1.55 eV +3.1 eV−2.83 eV). The estimated position of the up-per edge of the 1f/2s gap is indicated by theblue arrow at 1.1 eV.
Probe 3.1 eVPump 1.55 eV
0.7 1.1 1.5
1f - 2s gap
Nor
mal
ized
Inte
nsity
(arb
. uni
ts)
2s 1f
Kinetic Energy (eV)1.9
0 fs
5 ps
1.3 ps
0.6 ps
0.3 ps
130 fs
Ag19-
5.2.5 Agn-with n = 8, 9, 11, 14, 15 and 21
For the species Agn-with n = 8, 9, 11, 14, 15 and 21 the amount of clusters created
by the source was rather limited, thus the intensity of the pump-probe photoelectronsignal was low. Consequently, only the relaxation times have been evaluated sincethe signal to noise ratio did not allow for a more detailed analysis. Figures 5.8, 5.9and 5.10 show the series of TR-PES spectra of these clusters.Agn
-(n = 8, 9, 11, 15) exhibit time constants of around 200 fs, whereas for Ag14
-
the relaxation time was below the time resolution, similar to Ag3-. In contrast, Ag21
-
has a relaxation time of 420± 80 fs, comparable to those of Ag18-and Ag19
-.
85

5 Results and Discussion
Pump 1.55 eVAg8- Ag9
-
3.02.52.01.51.0
Kinetic Energy (eV)
0.5
Nor
mal
ized
Inte
nsity
(arb
. uni
ts)
15 ps
1931 fs
599 fs
266 fs
100 fs
0 fs
3.02.52.01.51.0
Nor
mal
ized
Inte
nsity
(arb
. uni
ts)
0 fs
35 ps
1931 fs
599 fs
266 fs
67 fs
33 fs
Kinetic Energy (eV)
Probe 3.1 eV
Figure 5.8: Series of pump-probe photoelectron spectra of Ag8-and Ag9
-. In both
cases, at kinetic energies of around 2.7 eV and 2.0 eV, respectively, a time-dependentpeak can be observed.
Pump 1.55 eV
Ag15-Ag11
- Ag14-
Kinetic Energy (eV)Kinetic Energy (eV)
Nor
mal
ized
Inte
nsity
(arb
. uni
ts)
Nor
mal
ized
Inte
nsity
(arb
. uni
ts)
Nor
mal
ized
Inte
nsity
(arb
. uni
ts)
3.02.52.01.51.0
5328 fs
0.5
1998 fs
667 fs
333 fs
67 fs
0 fs
-333 fs
2.52.01.5
1.0
1900 fs
270 fs
400 fs
170 fs
70 fs
0 fs
3.02.52.01.51.0
15251 fs
0.5
932 fs
266 fs
466 fs
133 fs
67 fs
33 fs
0 fs
Kinetic Energy (eV)Probe 3.1 eV
Figure 5.9: Series of pump-probe photoelectron spectra of Ag11-, Ag14
-and Ag15
-.
Again, time-dependent features can be observed. The relaxation times are listed intable 5.1.
86

5.2 Bare Silver Clusters
Figure 5.10:Series of time-resolved difference spectra ofAg21
-, showing only the time-dependent part.
A broad feature around 1.1 eV kinetic energyis visible, decaying with a time constant of420± 80 fs and slightly shifting towards lowerkinetic energy.
Probe 3.1 eVPump 1.55 eV
1.70.9N
orm
aliz
ed In
tens
ity (a
rb.u
nits
)
1.51.31.1
1800 fs
730 fs
400 fs
200 fs
70 fs
Kinetic Energy (eV)0.7
0 fsAg21-
5.2.6 Discussion
None of the Agn-studied here exhibit a relaxation time comparable to those of Au3
-
or Au6-[146]. Auger-like processes and phonon assisted relaxation cannot rationalize
the observed fast relaxation times in the present work because of the large energygaps between electronic levels of these small clusters. Thus, as a possible decaymechanism, one should consider the high ability of clusters to deform as a responseto a single electron excitation which might result in a very fast radiationless decayby internal conversion.
A qualitative understanding of the data on Ag cluster anions can be obtainedwithin the following concept: Silver clusters are mostly bound by their s-electronswhile the contribution of d-electrons to the chemical bonds is small [34]. s/p-orbitalsform bonds with less preference for certain bond angles or geometries comparedto d-orbitals. Therefore, electronic excitations might easily induce a considerablechange in the cluster geometry as indicated by the simplified Clemenger-Nilsson di-agram in figure 5.11: A 20-electron metal cluster (e.g., Ag19
-) has the closed shell
configuration 1s21p61d102s2 and a spherical symmetry. After single electron exci-tation corresponding to the transition of a 2s-electron into the 1f shell, the systemgains binding energy by prolate deformation. Already for medium deformation the1f- and 2s-sublevels cross and radiationless relaxation is possible.
Originally, this approach has first been used by Kresin et al. [23] to explain thefast relaxation of the HOMO-LUMO excitation in Al13
-, which was observed in our
group [142]. They showed theoretically that nanoclusters can support a fast non-
87

5 Results and Discussion
Distortion Parameter (arb. units)
Orb
italB
ind
ing
En
erg
y(a
rb.u
nit
s)
1p
1d
2s
1g
1s1s
20 e-
8 e-
7 e-
2 e-
2p
40 e-
prolateoblate
1fAg19
-
Al13
-
58 e-
Figure 5.11: Simplified Clemenger-Nilsson diagram (modified from [33]) of theelectronic shells in clusters of simple metals. Each curve corresponds to a non-degenerate single particle orbital in a deformed spherical potential. The binding en-ergy depends on the degree of structural deformation. For simplification, only prolateand oblate deformations are considered and some sublevels have been omitted. Atspherical symmetry the deformation parameter is zero and the sublevels are degen-erate. The stars indicate the positions of the 2, 7, 8, 20, 40 and 58 electron clusters(labeled on the right hand side). The configuration of a 20 electron cluster (e.g.,Ag19
-) is 1s21p61d102s2 and the lowest possible excitation corresponds to a 2s → 1f
transition. Analogous, a 40 electron cluster (e.g., Al13-) undergoes a 2p → 1g ex-
citation. For both cases possible radiationless relaxation pathways are indicated byarrows.
radiative relaxation channel which derives from their distinctive ability to undergoJahn-Teller shape deformations. The calculations were done for a three-dimensionalpotential well undergoing a spheroidal distortion and the time evolution of the dis-tortion parameter is calculated. The basic concept of these calculations, internal
88

5.2 Bare Silver Clusters
conversion via a conical intersection, is illustrated in figure 5.11 and possible relax-ation pathways are indicated by arrows.
In the case of gold clusters, the geometric structure is strongly influenced by thed-electrons and the large spin-orbit interactions [64]. For these reasons Aun
-up to
n ∼ 11 are planar [61]. Here, an electronic excitation might yield a weaker geometricchange and the mechanism of internal conversion is not valid because of too rigidgeometric structures. This explains the extremely long lifetimes of excited statesfound in some Aun
-.
The picture of purely s/p-bonded flexible clusters, which undergo considerablegeometrical changes after electronic excitations, explains the short relaxation timesfor Agn
-(figure 5.2 and table 5.1). Among the species studied here, Ag3
-shows a
very fast relaxation of the excited state. This can also be understood in terms ofa fast shape deformation. The ground state Ag3
-is linear, while the neutral and
positively charged trimers are triangular. An excited state of Ag3-
might also betriangular, so that photoexcitation of the linear trimer anion might trigger a fastgeometry change, during which the system passes through a crossing point with theground state potential surface, resulting in radiationless relaxation. In the alreadymentioned NeNePo study of the trimer a slower dynamical response time (700 fs)was observed [149]. The time scale depends on the local gradient of the potentialenergy surface of the final state and might be different for different processes anddifferent excitation energies in the same system.
Ag7-is the only exception of the general behavior with a lifetime of about an order
of magnitude longer than those of all other Agn-. It has the largest HOMO-LUMO
gap among the clusters studied here [30, 31, 33, 35], which might explain the longerrelaxation time. However, it is important to note that Al13
-has a gap of similar size
but exhibits an extremely short relaxation time [142]. Hence, a large gap alone doesnot explain the data on Ag7
-. Based on the simplified Clemenger-Nilsson diagram in
figure 5.11, the longer lifetime of the excited state in Ag7-compared to Al13
-can be
justified as follows: In the case of the 8-electron cluster, a much larger geometricaldeformation is necessary than for a cluster with 40 electrons (Al13
-) to approach a
crossing point. The series of photoelectron spectra (figure 5.5) show that the excited
Ag7-*
immediately starts to change its geometry resulting in a fast initial shift ofthe excited state towards lower kinetic energy. It then needs a relatively long timefor further deformation before the cluster finally approaches a crossing point andthe peak in figure 5.5 disappears. Thus, the longer time scale of relaxation observedfor Ag7
-(figure 5.5) can be related to the large deformation necessary for a crossing
of the 1d- and 1p-sublevels in figure 5.11 as well as the large HOMO-LUMO gap.The finding of a significantly enhanced relaxation time of the 8 electron Ag7
-agrees
89

5 Results and Discussion
well with the results on neutral Ag8 mentioned above, indicating the existence of along-lived excited state for this magic cluster [154, 156, 157].
For most of the Agn-, relaxation after photoexcitation might proceed via a com-
bination of various mechanisms involving Auger-like processes, relaxation via vibra-tional modes, and internal conversion. The relaxation times become longer by abouta factor of two for clusters with more than 18 valence electrons (figure 5.2 and table5.1). The larger clusters – especially around the shell closings at 18 and 20 electrons– might have a stronger preference for a spherical geometry and an excitation involv-ing the 2s-orbital might induce only a small change of the cluster geometry. Thiscould explain the slower relaxations of theses clusters, i.e., although relaxations viaother mechanisms might be enhanced due to the higher density of states, ultrafast re-laxation might be slower for the larger clusters in the size regime between n = 18–21.
For Ag19-, the signal to noise ratio is sufficiently high to analyze the structures
observed in the time resolved photoelectron data (figure 5.7). The maximum of thepump probe signal shifts gradually from 1.8 eV in kinetic energy to about 1.2 eV andthen disappears. Again, this behavior can be explained by a structural deformationof the cluster after photoexcitation with a final radiationless internal conversion backto the ground state.However, if we assume a rigid geometric structure of this cluster, an alternative inter-pretation of the spectra is possible, which is illustrated in figure 5.12: The excitedelectron first moves within the manifold of levels of the electronic shell above the2s-level (= the 1f-orbital containing seven suborbitals) similar to the relaxation ofan excited electron in the conduction band of a semiconductor, and then approachesthe lowest edge of the 1f manifold of states above the 2s-1f gap. The broad maximumvisible in the spectrum taken at 1.3 ps delay is located right above this gap betweenthe 2s-shell and the 1f manifold of states. The size of this gap can be estimated by acareful analysis of photoelectron spectra of Agn
-taken at higher photon energy [35].
Such relaxation via electron-phonon-like interactions is possible, if the level spacingis comparable to the typical energy of the vibrational modes.
In case of Ag18-, the peak at 2.2 eV can be assigned to an excitation from the
2s-orbital into the unoccupied 1f-orbital (as for Ag19-). Again, a peak shift can be
observed, but the 1f-2s gap is not clearly visible in the TR-PES spectra due to theintense pump-probe signal already existing at zero delay. This can be explainedby excitation of an electron from the deeper lying 1d-orbitals into the 1f-orbital,corresponding to the broad feature from 0.9 eV to 1.8 eV (compare figure 3.3(a)).Another possibility might be “switching” to another isomer2 (having a different elec-
2Isomer refers here to a different, metastable structure rather than a temporarily from the originalshape deformed cluster
90

5.2 Bare Silver Clusters
0.7 1.1 1.5
1f - 2s gapN
orm
alize
dIn
tensity
(arb
.units)
2s 1f
Kinetic Energy (eV)1.9
Pump 1.55 eVProbe 3.1 eV 5 ps
1.3 ps
0.6 ps
0.3 ps
130 fs
0 fs
Ag19-
1s
1d
1p
2s
1f
oc
cu
pie
d�
Ag19
-
Figure 5.12: Relaxation scheme of Ag19-. After excitation (red arrow), the ex-
cited electron relaxes down to the lowest edge of the 1f manifold of states (yellowarrow, τ ∼ 630 fs). Eventually, it relaxes back into the ground state (green arrow,τ ∼ 2.7 ps).
tronic structure) with the pump-pulse, though this is not very likely, consideringthe fact that already at zero delay both features are visible. The observed dynamicscould be rationalized similarly to the clusters aforementioned within the picture ofinternal conversion, induced by laser excitation which might cause a shape deforma-tion of the cluster.Similar to Ag19
-, the relaxation dynamics might also proceed via a radiationless
decay known from semiconductors, as already illustrated for Ag19-
in figure 5.12.However, for Ag18
-the possible 2s-1f gap is not clearly visible as explained before,
which favors the model of internal conversion by shape deformation.
According to the considerations mentioned above, internal conversion can be pro-posed as the dominant relaxation channel of excited states in metal clusters withlow density of electronic states and a fluxional geometry. The deformation of acluster induced by photoexcitation of a single electron can be visualized using theNilsson diagram. The simplified Nilsson diagram displayed in figure 5.11 shows thatalready a small change in geometry of a 40-electron cluster results in closure of the
91
5 Results and Discussion
1g-2p gap [23]. Thus, most likely the deformation leads to internal conversion via aconical intersection, during which the excess energy is converted to “heat”. In figure5.11 one possible relaxation path of an excited state of Al13
-is indicated by arrows.
However, one should note that the Nilsson diagram is a crude approximation. In amore accurate description, both the ground state and the excited state of a clusterhave to be described by potential energy surfaces in a multidimensional space.
5.3 Silver Oxide Clusters
In contrast to the studies on bare silver clusters, a second valve introduces O2 intothe extender, resulting in the effective generation of AgnO2
-. In earlier studies, oxy-
gen was found to be mostly molecularly chemisorbed to even-numbered silver clusteranions [8, 92]. Not only even-numbered but also odd-numbered clusters can reactwith atomic oxygen, but for the odd numbered species, dissociative chemisorptionmight be more likely.In these experiments, again the optical setup described in section 4.8 was used.However, the order of pump and probe was reversed compared to the measurementson bare silver clusters. Consequently, pump and probe have a photon energy of3.1 eV and 1.55 eV, respectively. This change was done for the following reasons:In case of AgnO2
-, photons of 3.1 eV are appropriate for photoexcitation, whereas
1.55 eV photons do not lead to an excited state. Although the probe energy of1.55 eV is rather low, it has one crucial advantage: There are practically no two-photon processes even at high photon flux. The AgnO2
-clusters have an excited
state using 3.1 eV pump pulses and two-photon processes are rather likely at thisphoton energy. At slightly increased photon flux, electrons from such two-photonprocesses conceal the weak pump-probe signal. Thus, in a 3.1 eV/3.1 eV pump-probe experiment both pulses need to have a minimum photon flux resulting in anextremely weak pump-probe signal. With the intense 1.55 eV probe pulse, excitedstates and systems with low electron affinities are easily detected. Therefore, thisarrangement using intense but low photon energy probe pulses is especially suit-able to study the time evolution of the excited states. The time resolution of thesetup is the same as for the measurements on bare silver clusters (better than 115 fs).
As already described in section 2.1.3, Agn-clusters readily react with O2 molecules,
showing an even-odd alternation in reactivity, with almost all of the even numberedclusters reacting with O2, whereas the odd numbered clusters are inert. If atomicoxygen is provided in the cluster source, all Agn
-react, resulting in formation of
clusters with various numbers of Ag and O atoms in a cluster. Depending on theconditions in the cluster source, for a small fraction of the Ag2O2
-, dissociative
chemisorption was detected in a recent study [92]. In the current work, the dynam-
92

5.3 Silver Oxide Clusters
ics of the species with molecularly adsorbed oxygen were examined.
Before discussing the time-resolved photoelectron spectra, it might be helpful tohave a closer look at the ground state electronic structures of Agn
-and AgnO2
-clus-
ters. Figure 5.13 compares standard photoelectron spectra of Agn-and AgnO2
-with
n = 2, 3, 4 and 8 [8, 267]. Adsorption of O2 results in an increase of the electronaffinity by about 0.5 eV−1.3 eV. Note that detachment with 1.55 eV photons is pos-sible only for Ag2
-. The electronic structure is different for each cluster, especially
in case of the reacted clusters. It seems unlikely that these clusters have excitedstates with similar properties (energy, lifetime, Franck-Condon profile).
A g 2 O 2-
A g 2-
Inten
sity (
arb. u
nits) A g 3 O 2
-
A g 3-
B i n d i n g E n e r g y ( e V )
A g 8 O 2-
A g 4 O 2-
A g 4-
1 . 0 1 . 5 2 . 0 2 . 5 3 . 0 3 . 5
1 . 0 1 . 5 2 . 0 2 . 5 3 . 0 3 . 5
A g 8-
Figure 5.13: Standard photoelectron spectra of bare Agn-and reacted AgnO2
-, mea-
sured with a Nd:YAG-Laser (4.66 eV photon energy) [8, 267]. The spectrum ofAg3O2
-was taken with the UV-pulse (4.65 eV) of the fs-Laser (see section 4.10) and
this species has been generated by reaction with atomic oxygen. O2 chemisorptionresults in an increase of the electron emission threshold by about 1 eV. The spectraagree well with earlier results [30, 35]. For all species except Ag2
-, the emission
threshold is beyond the probe photon energy of 1.55 eV.
Using TR-PES, the evolution of the clusters after absorption of 3.1 eV photons
93

5 Results and Discussion
was studied. The time evolution of the system is monitored by recording photoelec-tron spectra with the 1.55 eV probe pulse and only the species with sufficiently lowelectron affinities can be observed using low photon energy. These are the transientexcited states of the AgnO2
-clusters and the potential negatively charged photofrag-
ments O-
(EA3 = 1.461 eV [281]), Ag-
(EA = 1.304 eV [282]), O2-
(EA = 0.45 eV[283]) and Ag2
-(VDE = 1.06 eV [30]). For species with an electron affinity lower
than 3.1 eV the pump pulse contributes to the electron signal by photodetachment,which is independent of the pump-probe delay. Therefore, the time-independentpart is subtracted from each spectrum, as well as some time-independent featuresfrom undesired multi-photon processes.
In this section, first Ag2O2-will be discussed in detail. Next, Ag4O2
-and Ag8O2
-
will be addressed since similar features are observed as in case of Ag2O2-. Addition-
ally, results from blue-UV measurements on Ag8O2-
are depicted. Then, data onAg3O2
-is shown, exhibiting different behavior. The last part of this section deals
with Ag2O3-, exhibiting an intense excited state signal using the blue-UV setup.
5.3.1 Ag2O2-
Figure 5.14 displays the ground state photoelectron spectra of Ag2O2-
and Ag2-
recorded using a standard Nd:YAG laser with a photon energy of 4.66 eV [267]. ForAg2O2
-, the threshold for electron emission is at a binding energy of about 2.2 eV,
and the VDE is about 2.7 eV, corresponding to the maximum of the electronic tran-sition at the lowest binding energy. The spectrum exhibits a pronounced vibrationalfine structure (red arrows) assigned to the O-O stretching vibration (170 meV). TheVDE of Ag2
-is much lower than that of Ag2O2
-(yellow arrow) [30].
Figure 5.15 demonstrates time-resolved photoelectron spectra of Ag2O2-recorded
using the femtosecond laser system. The upper trace shows a spectrum recordedexclusively using a 3.1 eV laser pulse. In this spectrum, two different features can beobserved: A weak peak at a kinetic energy of 2.8 eV (marked A in figure 5.15) andan intense maximum centered around a kinetic energy of about 0.35 eV(marked C).Feature C can be assigned to direct photoemission from Ag2O2
-and corresponds to
the maximum visible in figure 5.14 (lower trace) between 2.4 eV and 3.1 eV bindingenergy. The peak at a kinetic energy of 2.8 eV (marked A) should be caused by a two-photon process. A simple two-photon process corresponding to direct photoemissionwould result in a peak at a kinetic energy of 0.35 eV+3.1 eV = 3.45 eV, which differssignificantly from peak A’s position. Thus, feature A must be due to two-photonexcitation of electrons with higher binding energies than those giving rise to theappearance of C. The standard spectrum of Ag2O2
-(figure 5.14) shows a second,
3the electron affinities (EA) given in the text are the ones of the corresponding neutrals
94

5.3 Silver Oxide Clusters
4 3 2 1 0
0.3 eV
Ag2O
2
-
Inte
nsity
(arb
.units)
Binding Energy (eV)
Ag2
-
3.1 eV
1.1 eV1.1 eV Figure 5.14:Photoelectron spectra of Ag2
-and
Ag2O2-
recorded using a standardNd:YAG laser with a photon energy of4.66 eV [267]. The energy resolutionis roughly 50 meV and varies with thebinding energy. The temperature ofthe anions prior to detachment is aboutroom temperature. The pronounced vi-brational structure (red arrows) in thespectrum of Ag2O2
-indicates molecular
chemisorption of oxygen.
more intense peak at higher binding energy range (3.4 eV - 4 eV). According toKoopman’s theorem, excitation with a photon of 3.1 eV from this state would resultin a bound state with low binding energy (0.3 eV, see horizontal green bar in lowertrace of figure 5.14). A second photon from the 3.1 eV pulse detaches this electronwith a kinetic energy (Ekin) of 3.1 eV − 0.3 eV = 2.8 eV. Some excess energy Evib
remains in the neutral Ag2O2, which can be estimated to
Evib = 2hν − EA(Ag2O2−)− Ekin. (5.1)
The EA of Ag2O2-is unknown, but the threshold energy in the photoelectron spec-
trum of Ag2O2-(figure 5.14, lower trace) gives an upper limit of the EA:
EA(Ag2O2−) < 2.2 eV. (5.2)
Thus, the excess energy Evib in the remaining neutral Ag2O2 is at least
Evib > 2 · 3.1 eV − 2.2 eV − 2.8 eV = 1.2 eV. (5.3)
The appearance of feature A indicates the existence of an excited state of Ag2O2-
with an electron binding energy of roughly 0.3 eV, which is optically accessible byphotons of 3.1 eV. Note that the spectrum (upper trace of figure 5.15) is generated
95

5 Results and Discussion
Figure 5.15:Photoelectron spectra of Ag2O2
-using
a single femtosecond pulse with a pho-ton energy of 3.1 eV (upper trace), twofemtosecond pulses with 3.1 eV and1.55 eV photon energies, respectively,at zero delay (middle trace) and at7300 fs delay (lower trace). Markedfeatures are discussed in the text. Noelectron signal is observed with the1.55 eV laser pulse only.
1 2 3
Long Delay
Kinetic Energy (eV)
Norm
alize
dIn
tensity
(arb
.units)
Zero Delay
Vibr.
3.1 eVonly
C
x 20
A
B
c’
using the pump pulse only and is superimposed to all spectra obtained using bothfemtosecond laser pulses.
If Ag2O2-
is irradiated using both femtosecond pulses with photon energies of3.1 eV and 1.55 eV, respectively, a new feature at a kinetic energy of about 1.25 eVappears (figure 5.15: Middle trace, marked B). This feature can be explained byassuming the existence of an excited state of Ag2O2
-with an electron affinity of
about 0.3 eV (1.25 eV = 1.55 eV − 0.3 eV). The state is populated by the pumppulse (3.1 eV), and the large intensity of this two-photon feature is indicative ofa large cross section for this excitation. The red arrows mark features of the finestructures assigned to excitation of the O2 stretching vibrations, having a vibrationalfrequency of 170± 40 meV.
With increasing pump-probe delay, feature B disappears and a photoelectron spec-trum resembling the one obtained using only the pump pulse is observed (figure 5.15,lower trace) with a weak shoulder appearing on the high kinetic energy side of fea-ture C (marked c’).
The changes in the pump-probe spectra as a function of delay time become more
96

5.3 Silver Oxide Clusters
c’
0.5 1.0 1.5 2.0 2.5
7300 fs
700 fs
165 fs
100 fs
33 fs
0 fs
Norm
alize
dIn
tensity
(arb
.units)
Kinetic Energy (eV)
Ag2O
2
- B
Figure 5.16:Delay-dependent part of the time-resolved photoelectron spectra ofAg2O2
-. Pump and probe photon
energies are 3.1 eV and 1.55 eV, re-spectively, with the 3.1 eV pulse beingfirst. The pump-probe delay is given infemtoseconds. The delay-independentphotoelectron signal (upper trace infigure 5.15) has been subtracted foreach spectrum. The marked featurescorrespond to the ones in figure 5.15.Feature B (red) is assigned to anexcited state of Ag2O2
-and peak c’
(yellow) is tentatively assigned to thepeak at 1.1 eV binding energy in thespectrum of Ag2
-(figure 5.14, upper
trace). The arrows are assigned to theO2 stretching vibration.
pronounced in the difference spectra, in which the delay-independent electron sig-nal (figure 5.15, upper trace) is subtracted (figure 5.16). Assuming an exponentialdecay of the optically excited state, it can be observed that feature B, assigned tothe detachment from the excited state of Ag2O2
-, disappears with a time constant
of < 100 fs, which is less than the time resolution of the experimental setup. Inthe difference spectra, shoulder c’, observed in figure 5.15 (lower trace), appearsas a peak at 0.5 eV kinetic energy. Peak B decreases in intensity with increasingtime interval between the pulses, whereas peak c’ grows concomitantly. Since theprobe photon energy is 1.55 eV, the binding energy of these electrons correspondsto 1.55 eV − 0.5 eV = 1.05 eV. Within the experimental error of ±0.1 eV, this coin-cides with the VDE of Ag2
-. Hence, peak c’ in figure 5.16 is tentatively assigned to
photofragmentation, yielding pure Ag2-:
Ag2O2-+ hν3.1 eV −→ (Ag2O2
-)* −→ Ag2
-+ O2
For the assignment of peak c’ to this photofragmentation process, the followinguncertainties should be taken into account:
(i) Identification of Ag2-as photofragment is based on the peak position of feature
c’, which became clearly visible only after some treatment of the raw data in
97

5 Results and Discussion
the difference spectra. Shape and exact position of the peak change within acertain range, depending on the subtraction parameters.
(ii) Multi-photon processes contributing to the signal cannot be excluded. Otherreaction pathways involving different neutral or charged photofragments andtwo or even three photons might yield a similar peak in the photoelectronspectrum. Although the power of each laser pulse was kept as low as possible,such processes cannot be completely ruled out.
Although these issues should be considered, the process of photodesorption of neutralO2 seems to be reasonable and similar to the known photodesorption process of COfrom Au2
-[163]. The latter is a thermally activated process, in which the energy of
the pump photon is first thermalized and then CO desorbs from the hot anion:
Au2(CO)-+ hν1.5 eV −→ (Au2(CO)
-)* −→ (Au2(CO)
-)hot −→ Au2
-+ CO
In contrast to Au2(CO)-, the data on Ag2O2
-are more suggestive of a direct pho-
todesorption process due to the following reason:In case of thermally activated processes each photoelectron spectrum of the TR-PES
series corresponds to the superposition of parent and fragment spectra. With in-creasing delay, the parent spectrum decreases in intensity and the fragment spectrumincreases. In case of a direct process, the time-dependent change of the electronicstructure is reflected in gradually changing shapes and positions of the photoemis-sion features. Figure 5.17 displays the time development of feature c’ exclusively (the
0.5 1.0 1.5 2.0 2.5
Pump 3.1 eV
Probe 1.55 eV
700 fs
165 fs
100 fs
Inte
nsity
(arb
.units)
Kinetic Energy (eV)
c’
Figure 5.17:Time evolution of the shape of feature c’ as ex-tracted from the data displayed in figure 5.16.Feature B observed in the lowest trace of fig-ure 5.16 is subtracted from each spectrum dis-played in figure 5.16. The residual signal isdominated by feature c’. The procedure revealsa delay-dependent change in the shape of thispeak.
98

5.3 Silver Oxide Clusters
contribution of excited state B to the spectrum has been subtracted). A change inthe shape of feature c’ is visible with increasing delay time, whereas only the increaseof the peak intensity without a change of peak shape is expected for a thermallyactivated process in an ensemble of clusters.
The direct process occurs within a time scale comparable to the instrumentaltime resolution and it was hardly possible to observe details in the changing ofthe electronic structure taking place with the O2 desorption. The primary goal ofmonitoring the breaking of the chemical bond and the subsequent reorganizationof the electronic structure is not yet fully reached. Summarizing the main resultsdemonstrated so far
(i) Unambiguously an optically accessible excited state of Ag2O2-
is identified.The optically allowed transition has a large cross section which is evidentthrough the unusual high intensity of pump-probe feature B (figure 5.15).
(ii) The excited state decays most likely by direct photofragmentation via the
process Ag2O2-+ hν3.1 eV −→ (Ag2O2
-)* −→ Ag2
-+ O2.
This is in contrast to bulk surfaces where direct photofragmentation competes withefficient thermalization. Accordingly, the use of clusters instead of bulk surfacesmight enhance the efficiency of photochemistry drastically.
In the next paragraph, the results will be compared to the NeNePo studies ofSocaciu-Siebert et al. on the same cluster anion [165]. The NeNePo data weresuggested to be based on a one-photon pump process:
Ag2O2-+ hν3.05 eV −→ Ag2O2 + e−.
The neutral Ag2O2 is unbound and the O2 molecule leaves the Ag2 in a unimoleculardecay process:
Ag2O2 −→ Ag2*
+ O2.
The neutral Ag2 might be vibrationally excited (indicated by the asterisk). The
probe laser pulse then ionizes the neutral Ag2*
in a multi-photon process. The in-tensity of Ag2
+is recorded with respect to the pump-probe delay. The ion signal
varies periodically as a function of time delay between pump and probe pulse and thefrequency is assigned to the Ag2
*stretching vibration. This vibrational frequency
is red shifted compared to the one of the NeNePo signal of bare Ag2-. The authors
interpret this behaviour as a vibrational excitation with an excess energy of 0.7 eVin the neutral Ag2 after desorption of an O2 molecule.
99

5 Results and Discussion
The NeNePo data agree with the TR-PES spectra, assuming that the pump pulsedetaches the electron from Ag2O2
-in a two-photon process via the excited state of
the anion. In TR-PES this two-photon process gives rise to feature A in figure 5.15.The kinetic energy of the detached electron is 2.8 eV, and the electron affinity ofAg2O2
-is below 2.2 eV (threshold of the lower trace in figure 5.14). The energy
balance leaves an excess energy of 1.2 eV in the neutral Ag2O2 as calculated above(1.2 eV = 2 · 3.10 eV− 2.8 eV− 2.2 eV). The O2 desorption requires some energy sothat an excess energy of 0.5 eV − 0.8 eV may remain in the neutral Ag2, explainingthe red shift in the NeNePo data.
Thus, based on the TR-PES data, the first step of the NeNePo data might bereassigned to two-photon detachment of the pump pulse via the excited state ofthe Ag2O2
-anion. This specific two-photon process leaves an excess energy in the
neutral Ag2O2 and this energy probably causes the O2 desorption.
In the TR-PES experiment, the excited state is populated by a one-photon pro-cess and its decay is recorded using the probe pulse. The (undesired) two-photonpump process leads to the appearance of an additional weak feature (A) in the pho-toelectron spectra. The direct photodetachment of Ag2O2
-can be viewed as a third
competing process, leaving almost no excess energy in the neutral Ag2O2 (figure5.15, feature C). It is not possible to observe the further fate of this relatively “cold”neutral Ag2O2. Summarizing, there are three processes corresponding to the threefeatures A, B and C in figure 5.15:
• Process I, feature C: One-photon detachment
Ag2O2-+ 1 ·hνpump −→ (Ag2O2)cold + e
-0.35 eV
• Process II, feature B: One-photon excitation of the anion and subsequent de-sorption
Ag2O2-+ 1 ·hνpump −→ (Ag2O2
-)* −→ Ag2
-+ O2
• Process III, Feature A: Two-photon detachment
Ag2O2-+ 2 ·hνpump −→ (Ag2O2)hot + e
-2.8 eV
(Ag2O2)hot −→ (Ag2)hot + O2
With TR-PES, process II was studied, while in the previous NeNePo experimentmost likely process III was detected. The observation of hot neutral Ag2 is a conse-quence of the existence of the excited state of Ag2O2
-. A one-photon pump-process in
case of the NeNePo experiment can be excluded, because there is not enough energyleft in the neutral to explain the red shift of the vibrational frequency. The electronfrom single photon detachment has a kinetic energy of about 0.35 eV (feature C infigure 5.15) and the residual energy for Ag2O2 is negligibly small.
100

5.3 Silver Oxide Clusters
5.3.2 Ag4O2-and Ag8O2
-
Figure 5.18 displays time-resolved photoelectron spectra of Ag4O2-and Ag8O2
-(in
case of Ag6O2-, the cluster intensity was low and no pump-probe signal was de-
tected). Similar to Ag2O2-, in both cases broad peaks with vibrational fine struc-
tures (marked by arrows) are observed, with their intensity decreasing exponentiallywith time. These peaks are assigned to excited states of the anions Ag2O2
-(see also
above), Ag4O2-
and Ag8O2-
with lifetimes of < 100 fs, 400 fs ± 50 fs and < 100 fs,respectively. For Ag8O2
-, only upper limits of the lifetimes can be given due to the
limited time resolution of the experiment. The vibrational frequencies are deter-mined to be 320 meV ± 40 meV and 240 meV ± 50 meV, respectively. Interestingly,the spectra of Ag4O2
-and Ag8O2
-are similar to those of Ag2O2
-. Although the
products of the assumed desorption process (Ag4-
and Ag8-) cannot be observed
Probe1.55 eV
Pump3.1 eV
Ag8O2-
2.50.5 1.51.0 2.0
240 fs
170 fs
100 fs
33 fs
0 fs0.5 1.0 1.5 2.0 2.5
Nor
mal
ized
Inte
nsity
(arb
. uni
ts)
Ag4O2-
1400 fs700 fs360 fs
170 fs
100 fs
33 fs
0 fs
Kinetic Energy (eV)
Figure 5.18: Time-resolved photoelectron spectra of the even-numbered AgnO2-clus-
ters with n = 4 and 8. The anions are excited with a 3.1 eV photon and the spectraare recorded using 1.55 eV photon energy. The broad feature at zero delay is assignedto photodetachment from an excited state of the anions, which exponentially decayswith a short lifetime (400 fs ± 50 fs for n = 4 and < 100 fs for n = 8). The arrowsmark finestructures assigned to excitation of the O2 stretching vibration.
101

5 Results and Discussion
due to their high electron affinities with a probe energy of 1.55 eV, the similarityof the peak shapes, peak positions and time evolution suggest that the underlyingmechanisms of these three clusters should be analogous (using higher probe energy,it is possible to identify Ag8
-as fragment after photoexcitation of Ag8O2
-, see be-
low). The observed broad maxima are tentatively assigned to excited states, whichare localized close to the chemisorbed O2 molecule and have antibonding character,resulting in fast and direct desorption. The states are suggested to be localizedbecause the electronic structure of the entire cluster varies strongly with increasingnumber of Ag atoms, yet the excited state changes only slightly.
In photoelectron spectroscopy, vibrational fine structure most likely corresponds tothe structure of the final state of the photoionization, which is the neutral species inthis case. For neutral Ag2O2, the binding energy of the O2 molecule is predicted to below, and a vibrational frequency close to the value of free O2 is expected (195 meV),in line with the observation (170 meV±40 meV). For Ag4O2 and Ag8O2, vibrationalfrequencies (300 meV and 240 meV, respectively) are larger, and thus comparableor even higher than the one of the positive ion O2
+[284]. This result can partially
be explained by charge transfer to the metal cluster. However, one should notethat after this two-step photodetachment process involving two photons, the neu-tral AgnO2 cluster may not necessarily be in the electronic ground state, and excitedstates of neutral O2 with vibrational frequencies as high as 370 meV were alreadyobserved [284]. A detailed assignment is difficult at the present state of knowledge.However, in all three cases the vibrational fine structure can only be assigned to theO2 stretching vibration. The broad Franck-Condon profile indicates that the stateis indeed localized close to the oxygen molecule.
Very recently, the optical setup was modified as described in section 4.10 to higherphoton energies, using 3.1 eV as pump and 4.65 eV as probe energy. In contrast toAg4O2
-(and Ag3O2
-), for Ag8O2
-, TR-PES spectra (shown in figure 5.19) could be
obtained, which might be due to a higher cross section of this cluster for the UVprobe pulse. In order to obtain better insight into the dynamics, difference spectraare plotted in figure 5.20. For easier comparison to spectra obtained by conventionalPES, they are plotted versus binding energy. At zero delay, a peak at a binding en-ergy of 0.8 eV can be observed, which develops into a broad maximum and shiftstowards higher binding energy. These features are assigned to an excited state. Atthe same time, a peak centered at around 1.7 eV (marked A in figure 5.20) develops.It cannot exactly be observed at which delay this peak starts to appear, since thesignal of the excited state is superimposed and the signal to noise ratio for thesemeasurements is lower than in case of the red-blue setup, complicating the analysis.This is caused by the lower intensity of the UV probe pulse, which is due to two non-linear processes involved (the first is generation of blue light by frequency doubling,and the second frequency mixing of red and blue) in its generation. Plotting the
102

5.3 Silver Oxide Clusters
0.5 1.0 1.5 2.0 2.5 3.0 3.5 4.0
-3.3-0.267
-0.2-0.133
-0.0670
0.0670.133
0.20.267
0.3340.4
0.4670.6
26.7
40107
Probe 4.65 eV
Delay (
ps)
46,50 46,05 46,04 46,03 46,02 46,01 46,00 45,99 45,98 45,97 45,96 45,95 45,94 45,92 45,70 45,00 40,00 30,00
Kinetic Energy (eV)
Ag8O2-
Pump 3.1 eV
Figure 5.19:TR-PES 3D-plot of Ag8O2
-,
showing the full energyrange. The spectra are nor-malized to the feature be-tween 2.1 eV and 2.7 eV.In the region from 3.4 eVto 4.2 eV kinetic energy,a time-dependent featurecan be observed. Whenthe pulses start to overlap(∼ −200 fs), the intensityof the peak at around 0.8 eVdrops, since an electron isexcited from that state.
integrated intensity of the broad feature (in the range between 0.4 eV and 1.4 eV)of each trace versus time-delay, exponential relaxation behavior can be observedwith a time constant of 275± 50 fs. The relaxation rate obtained from the blue-UVdata is lower than the one from the blue-red experiment. This can be explainedby the lower signal to noise ratio, making it more difficult to analyze the data, andthe lower time resolution for this optical setup. In case of the blue-UV setup, thepulses travel through more material, giving rise to pulse broadening. Furthermore,the kinetic energy of the observed features is higher compared to the blue-red setup,giving rise to a lower energy resolution (see equation 4.3). Another feature evolvesat a binding energy of roughly 3.0 eV(marked B in figure 5.20). Again, the signal tonoise ratio and the fact that the signal is superimposed by a one-photon signal fromAg8O2
-make the analysis more difficult.
The energetic position of both evolving peaks (A and B in figure 5.20) match the twofeatures with lowest binding energy of bare Ag8
-(figure 5.13) within the experimen-
tal resolution, indicating fragmentation. Another fact supporting this interpretationis the development of the initially excited state into a broad maximum, which in-dicates a change in the geometric structure. From the appearance of feature B at3.0 eV it can be concluded that the signal around 1.7 eV results from bare Ag8
-for
delays longer than 600 fs. Both fragment peaks are detectable almost immediatelyafter decay of the excited state, suggesting a fast and direct process. For thermaldesorption, a longer timescale would be expected, since Ag8O2
-has more degrees of
freedom than e.g. Pt2N2-, which shows thermal desorption on a timescale of tens of
picoseconds [164]. However, the time constant depends on the ratio between excita-tion and dissociation energy. In case of Pt2(N)2
-, an excitation energy of 1.5 eV was
103

5 Results and Discussion
AB
Probe4.65 eV
Ag8O2-
1 2
Binding Energy (eV)
1 2 3 Binding Energy (eV)
-200 fs
-133 fs
-67 fs
0 fs
67 fs
133 fs
200 fs
267 fs
334 fs
400 fs
467 fs
600 fs
2.0 ps
6.7 ps
40 ps
107 ps
Nor
mal
ized
Inte
nsity
(arb
. uni
ts)
Pump3.1 eV
A
Figure 5.20: Time-resolved difference spectra of Ag8O2-. A spectrum taken at
negative delay has been subtracted. The left series shows the binding energy rangebetween 0.35 eV and 3.3 eV, while the right series shows an expanded view of theregion near the excited state. At a binding energy centered at 0.8 eV and rangingfrom 0.5 eV to 1.1 eV, an excited state can be observed at zero delay. With increasingdelay, this peak evolves into a broad maximum and shifts towards higher bindingenergy. Concomitantly, a peak at a binding energy of around 1.7 eV evolves, markedA. Another feature develops at a binding energy of roughly 3.0 eV, marked B.
104

5.3 Silver Oxide Clusters
used whereas a pump energy of 3.1 eV is applied here, reducing the expected time.Unfortunately, an estimate cannot be performed since no data on the dissociationenergy is available in literature to the best knowledge of the author. Nevertheless, achange in shape can be seen for the fragment peaks, which support an interpretationin favor of direct rather than thermal desorption.
For Ag2O2-the excited state decays by direct photodesorption indicating an an-
tibonding character with respect to the O2-Ag bond, and the blue-UV data onAg8O2
-also suggests direct photofragmentation. Since all even-numbered clusters
studied here exhibit excited states with similar energetic positions and vibrationalfine structures, it seems likely that direct O2 desorption also takes place in Ag4O2
-.
5.3.3 Ag3O2-
In the case of Ag3O2-theoretical studies predict for the geometrical structure a linear
Ag3 subunit with molecularly bound O2 [96, 285]. It is important to note that inthese calculations the adsorption of molecular oxygen was investigated, but in thisexperiment atomic oxygen was provided for generating Ag3O2
-. This might lead to
the creation of an isomer with dissociatively bound O2. Figure 5.21 displays a series
Figure 5.21:Time-resolved photoelectron spectra ofAg3O2
-. The clusters were generated using
atomic oxygen. The narrow feature is as-signed to photodetachment from an excitedstate of the Ag3O2
-anion. The lifetime for
the excited state is 5.4 ps± 1.5 ps.
105

5 Results and Discussion
of TR-PES spectra of Ag3O2-, showing a single narrow peak (corresponding to an
excited state) with a long lifetime of 5.4 ps ± 1.5 ps. Furthermore, no vibrationalfine structure could be detected, which is also in contrast to the even-numberedclusters. These observations indicate different dynamics after photoexcitation. Ifdissociatively chemisorbed oxygen is assumed, direct desorption of O2 is not possible,hampering the relaxation and leading to the observed long-lived excited state. Thedecay path of this state cannot be revealed while using the present experimentalsetup.
5.3.4 Ag2O3-
A pronounced excited state can be seen in case of Ag2O3-, recorded using the blue-
UV setup. A series of time-resolved spectra is depicted in figure 5.22. The excitedstate at a kinetic energy of 4.4 eV relaxes with a lifetime of 420 fs ± 80 fs, deducedfrom a plot of the integrated intensity of the peak versus time-delay (figure 5.23).The electron which is excited should originate from a state reachable with the probeenergy. Indeed, the feature around 1.3 eV shows a decrease in intensity starting ata delay of −200 fs. At that time-delay, both pulses start to overlap. The intensitydecreases until a delay of 730 fs but increases again for longer delays, indicatingrelaxation back into the ground state (figure 5.24. Besides that, an increase ofintensity in the region from 1.5 eV to 2.4 eV can be observed, starting simultaneouslywith the decay around zero delay (figure 5.24 and 5.23, lower trace). The timeconstant for that increase is 900± 300 fs. With increasing delay, the intensity shiftstowards lower kinetic energy.
1.5 2.0 2.5 3.0 3.5 4.0 4.5
-3.3-0.27
-0.2-0.13
-0.070
0.070.13
0.20.4
0.730.87
11.1
1.31.4
6.740.1
73.5
Ag2O3-
Dela
y (p
s)
Kinetic Energy (eV)
Pump 3.1 eVProbe 4.65 eV
Figure 5.22:Time-resolved photoelectron spec-tra of Ag2O3
-in a “waterfall”
plot, normalized to the peak at2.8 eV. An excited state is ob-served centered at a kinetic en-ergy of 4.4 eV. A decrease in in-tensity of the peak at 1.3 eV canbe seen from −200 fs onwards,when both pulses start to overlap,since the excited electron origi-nates from that state. Concomi-tantly, the intensity in the energyrange from 1.5 eV to 2.4 eV in-creases.
106

5.3 Silver Oxide Clusters
-1 0 1 2 3 4 5 6 7
Ag2O3-
τ ~900 fs
Pump-Probe Delay (ps)
Data: Data1_DModel: MnMolecular1Equation: y = A1 - A2*exp(-Weighting: y No weighting Chi^2/DoF = 6404.961R^2 = 0.85946 A1 1245.30516 ±71A2 436.0492 ±81k 1.11784 ±0.
Intermediate Region(1.5 eV to 2.4 eV)In
tegr
ated
Inte
nsity
(arb
. uni
ts)
Data: Data1_CModel: ExpDec1Equation: y = A1*exp(-x/t1) + y0Weighting: y No weighting Chi^2/DoF = 0.00231R^2 = 0.99207 y0 0.06759 ±0.0314A1 1.56712 ±0.0543t1 0.38172 ±0.0381
Pump-Probe Peakat 4.4 eVτ ~ 420 fs
Figure 5.23:Plot of the integrated intensity of thetime-dependent features of Ag2O3
-
versus time-delay. The upper trace(blue) shows the integrated inten-sity of the pump-probe peak centeredat 4.4 eV, resulting in a lifetime of420± 80 fs. The lower trace (red)depicts the increasing intensity inthe intermediate energy range from1.5 eV to 2.4 eV, yielding a time con-stant of 900± 300 fs.
2 3 4
Pump 3.1 eVProbe 4.65 eV
Nor
mal
ized
Inte
nsity
(arb
. uni
ts)
Kinetic Energy (eV)
-0.27 ps 0 ps 0.73 ps 6.7 ps 40.1 ps
Ag2O3-
Figure 5.24: Selected TR-PES spectra of Ag2O3-. An excited state at 4.4 eV can
be seen, which is populated by an electron from the peak at 1.3 eV, decreasing fromzero delay to 730 fs but increasing again for longer delay times. Concomitantly, theincrease of intensity in the energy range from 1.5 eV to 2.4 eV is clearly visible.
107
5 Results and Discussion
The relatively fast relaxation might be due to electron-electron interactions, sincethe excited state decays and at the same time “hot” electrons in the region from1.5 eV to 2.4 eV occur, shifting towards lower kinetic energy. For long delays, ashoulder persists, indicating a vibrationally hot cluster. This behavior is similar tothe relaxation observed for open d-shell transition metal clusters [136–141]. How-ever, these clusters exhibit lifetimes lower by at least a factor of two, which mightbe attributed to the higher DOS compared to the silver oxides. An alternativerelaxation channel could be fragmentation, yielding e.g. Ag2O2
-. To check for frag-
ments, difference spectra were examined, using different time-delays for subtraction.However, no indications for such processes were found. Nevertheless, fragmentationcannot completely be excluded, since only a relatively small fraction of the clusterensemble might be interacting with pump and probe and the potential fragmentsignal might be superimposed by the signal of Ag2O3
-.
5.4 Gold Oxide Clusters
In this section, results on gold oxide clusters are presented, which exhibit higherelectron affinities compared to silver oxide clusters (a similar effect as for the respec-tive bare clusters). Therefore, higher photon energy for the probe pulse is required.Accordingly, the optical setup is first modified according to a one-color pump-probescheme (using blue light; section 4.9) which turns out to be especially suitable forAu2O
-. In case of Au1O2
-and Au2O2
-, undesired multi-photon processes induced by
3.1 eV are rather likely. Hence, the recently developed blue-UV setup (section 4.10)has been applied on these species.
The gold oxide clusters are generated with a source setup very similar to the caseof silver oxides in the section above, introducing O2 into the extender before or afterignition of the electric arc for effective creation of the desired oxides.
5.4.1 Au2O-
The energies (3.1 eV) of pump and probe pulse are optimized at long delays, re-spectively, maximizing the photofragment signal of AuO
-and Au
-and minimizing
the two-photon signal from each individual pulse. As a result, the pulse energy ofthe pump pulse is higher than the one of the probe pulse and there is a consid-erable two-photon signal generated by the pump alone, which does not depend onthe pump-probe delay. The pulse energy of the probe pulse is set to a lower value,allowing effective one-photon detachment from the excited Au2O
-*species and the
charged photofragments Au-and AuO
-. From the neutral fragments no signal can
be detected due to their high ionization potentials.
108

5.4 Gold Oxide Clusters
Figure 5.25:Photoelectron spectra of Au
-, AuO
-,
Au2-
and Au2O-
recorded with a sin-gle pulse of the femtosecond laser sys-tem. The pulse energy is reduced belowthe onset of two-photon processes. Theupper two spectra are recorded using aphoton energy of 3.1 eV, whereas for thelower two 4.65 eV was used.
1 2 3 4
E
D
CB AuO-
Au2O-
Au2-
Inte
nsity
(arb
. uni
ts)
Binding Energy (eV)
Au- A
Figure 5.25 displays ground state photoelectron spectra of those anions (Au-, AuO
-
and Au2-), which might play a role in the photofragmentation of Au2O
-. All spectra
in figure 5.25 are recorded with a single pulse of the femtosecond laser (3.1 eV or4.65 eV). The spectra of Au
-and AuO
-are measured using the second harmonic
(3.1 eV) of the Ti:sapphire laser, while the spectra of Au2-and Ag2O
-were obtained
with the third harmonic (4.65 eV). In the observable energy range the spectrum ofAu
-exhibits a single peak at 2.3 eV binding energy (marked A), corresponding to
the electron affinity of Au [30]. For AuO-, two peaks at 2.4 eV and 2.6 eV (marked
B and C) are observed with the feature at 2.6 eV having about twice the intensityof the 2.4 eV peak. Both spectra agree with earlier measurements [30, 286]. In theenergy regime accessible by the 3.1 eV pump photons, Au2
-exhibits a single feature
centered at 2.0 eV (marked D), while for Au2O-the electron affinity is higher than
3.1 eV (marked E), thus no one-photon signal appears in the TR-PES measure-ments. Again, the spectra agree with earlier data recorded with standard pulsedlasers [30, 93].
The high electron affinity of Au2O-makes it an ideal candidate for photoexcitation
experiments, since the competing channel of photodetachment is closed for photon
109

5 Results and Discussion
energies up to 3.5 eV. Species with such a high EA allow for the observation of thetime evolution of high-lying excited states in a TR-PES experiment. In addition, forAu2O
-, all possible charged photofragments can be observed using 3.1 eV photons
due to their low electron affinities.
A series of time-resolved spectra of Au2O-is depicted in figure 5.26. The spectra
are normalized to the peak centered at around 1.3 eV binding energy. The signal be-low 1.3 eV is caused by two-photon processes from the pump pulse. With increasingdelay, two peaks labeled A/B and C increase in intensity. For deeper insight intothe delay-dependent contribution, difference spectra are displayed in figure 5.27. Atzero delay, the difference signal vanishes. In the spectrum recorded at 1.0 ps, a broadmaximum between 2.0 eV and 2.5 eV appears. With further increasing delay, bothpeaks already visible in figure 5.26 grow on top of this feature at binding energiesof 2.35 eV (marked A/B) and 2.6 eV (marked C), while the intensity of the broadmaximum decreases simultaneously.
535128
8148
28143.7
1.70.7
00.0 0.5 1.0 1.5 2.0 2.5
0
0.7
1.0
1.7
2.3
3.7
7.7
14
21
28
34
48
61
81
94
128
328Delay (ps)
C
Binding energy (eV)
Au2O-
Pump 3.1 eVProbe 3.1 eV
A/B535
Figure 5.26:TR-PES spectra of Au2O
-
recorded with pump and probepulses of 3.1 eV. The spectraare normalized to the peakcentered at around 1.3 eV. Thepulse energy of the pump isabove the threshold of two-photon processes, giving rise tothe signal below 1.7 eV. Withincreasing delay, two peaksmarked A/B and C grow.
Using 3.1 eV laser pulses, three basically different spectra can be observed forAu2O
-. At zero delay, the signal is dominated by the two-photon contribution of
the (more intense) pump pulse. It can be tentatively assigned to the spectrum ofthe excited state of Au2O
-in the geometry of the anion ground state (figure 5.28,
lower trace, left part). The spectrum is delay-independent and does not appear infigure 5.27. The excited state develops with increasing time into a new geometry,yielding a broad maximum, which dominates the pump probe difference spectra ata delay of 3.7 ps (figure 5.28, middle trace). At further increasing time delay, thebroad maximum disappears and features assigned to photofragments are observedin the pump-probe difference spectrum (figure 5.28, upper trace).
110

5.4 Gold Oxide Clusters
0.5 1.0 1.5 2.0 2.5
C
0.0 ps0.07 ps0.33 ps0.7 ps
1.0 ps 2.3 ps
3.0 ps 3.7 ps4.3 ps 7.7 ps
11 ps 14 ps21 ps28 ps34 ps48 ps
61 ps
81 ps
94 ps
128 ps
328 ps
Binding Energy (eV)
535 ps
Au2O-
Pump 3.1 eV / Probe 3.1 eV
A/B
Figure 5.27:Series of pump-probe photoelec-tron spectra of Au2O
-recorded
with pump and probe pulseshaving a photon energy of3.1 eV. The delay betweenboth pulses is given in picosec-onds for each trace. Only thedelay dependent signal is dis-played, the delay-independentsignal has been subtracted. Thetwo peaks marked A/B and Care assigned to the photofrag-ments Au
-and AuO
-, respec-
tively (for further details referto the text).
Both peaks visible at long delays (figure 5.27, lowest trace, marked A/B and C)are assigned to the charged photofragments Au
-and AuO
-, which can be rational-
ized by figure 5.29. The EAs of Au and AuO are the same within 0.065 eV [30, 286].Accordingly, the feature at lower binding energy (marked A/B) consists of two com-ponents: A contribution from the low binding energy feature of AuO
-(figure 5.25,
peak B) and the signal from the Au-anion (figure 5.25, peak A).
The time constants of both decay channels, yielding Au-or AuO
-, are determined
by plotting their photofragment intensities versus delay time. The intensity of AuO-
111

5 Results and Discussion
0 1 2 3 4 5
Delay328 ps
Delay3.7 ps
Delayzero
Inte
nsity
(arb
. uni
ts)
Binding Energy (eV)
Au2O-
reg. PES4.65eV
3.1eVpump
Figure 5.28: Selected photoelectron spectra of Au2O-. The lowest trace displays
a comparison between the spectrum of the ground state recorded with one pulse of4.65 eV photon energy (violet) and the spectrum obtained with the 3.1 eV pump pulseonly (black). The pulse energy of the 3.1 eV pump pulse is set above the onset oftwo-photon processes. This two-photon signal is delay-independent and subtractedfrom each spectrum in figure 5.26 to obtain the spectra displayed in figure 5.27. Themiddle trace (red) shows a difference spectrum recorded at a delay of 3.7 ps beforeonset of fragmentation. This spectrum is assigned to the excited state of Au2O
-in a
new geometry. The upper trace (green) displays a difference spectrum at long delay(328 ps). The intensity of the broad maximum observed at 3.7 ps is reduced, and thespectrum is dominated by features assigned to photofragments.
is directly proportional to that of peak C in figure 5.27. In case of Au-, the intensity
corresponds to that of peak A/B, corrected by the contribution from AuO-. Thishas been done by subtracting 44 % of the intensity of feature C, since this reflectsthe contribution of peak B in feature A/B, as can be seen in the second trace offigure 5.25. The resulting intensities are shown in figure 5.30. Assuming a single
112

5.4 Gold Oxide Clusters
Figure 5.29:The energetic positions of the features visi-ble in the TR-PES spectrum of Au2O
-at a
delay of 328 ps (upper trace) are comparedwith photoelectron spectra of AuO
-(mid-
dle trace) and Au-
(lower trace) from fig-ure 5.25. The peak at 2.6 eV correspondsto the high binding energy feature of AuO
-,
whereas the peak at 2.35 eV consists of boththe Au
-peak and the low binding energy fea-
ture of AuO-.
0.5 1.5 2.5
Binding Energy (eV)
Au-
AuO-
Inte
nsity
(arb
. uni
ts) Au2O
-@ 328 ps
0 100 200 300
0.1
I max
- In
tens
ity (a
rb. u
nits
)
Pump - Probe Delay (ps)
AuO-
Au-
Fit: Time Constant 110 ± 30 ps Delayed Onset @ 7 ± 2 ps1
Figure 5.30: Delay dependence of the intensities of the photofragments, extractedfrom the series of pump-probe spectra displayed in figure 5.27. Shown is the difference(normalized to 1) between the maximum intensities Imax of the fragment signals atinfinite delay and the measured intensities I on a logarithmic scale. Both fragmentsignals appear after a delay of 7± 2 ps. Within the experimental accuracy bothfragment signals increase with the same time constant of 110± 30 ps.
113

5 Results and Discussion
exponential growth, the intensity I for each fragmentation channel is given by
I = Imax(1− e−t/τ ), (5.4)
where τ is the time constant for fragmentation and Imax corresponds to the maxi-mum fragment ion intensity, depending on the energies of pump and probe and onthe cross sections for on the one hand photoexcitation of the parent anion and onthe other hand photodetachment of both fragment anions. Both parameters (Imax,τ) can be different for both channels yielding AuO
-and AuO
-. Furthermore, the
delay of the onset for fragmentation might also be different. For extracting the timeconstant τ and the onset delay, it is convenient to plot (Imax− I)/Imax versus delaytime t on a logarithmic scale. In this case, fragmentation according to equation 5.4is given by a linear increase starting at 1 and having a slope corresponding to τ .Within the error bars of the experimental data, both fragmentation channels canbe described by the same time constant (110± 30 ps) and onset delay (7± 2 ps).Hence, the decay mechanism is very similar in both cases.
In order to shed light on the possible fragmentation channels, it is useful to eval-uate the energetics involved in the possible decay paths:
Au2O-*
+ hν3.1 eV −→ AuO-+ Au (I)
−→ Au-+ AuO (II)
−→ Au2-+ O (III)
−→ O-+ Au2 (IV)
The excitation energy necessary for process III is predicted from theory [101] tobe 3.14 eV, which is slightly higher than the excitation energy of our system. Thisfinding agrees with the fact that a signal from Au2
-is not observed. Process IV
requires even higher energy due to the low electron affinity of O and can also beexcluded. Processes I and II might be very close in energy, because the electronaffinities of Au and AuO are very close [30, 286]. This fact may explain that bothprocesses are observed with comparable probability.
Delayed onsets of the photofragment signal have been observed in similar exper-iments earlier [287, 288]. Their origin is still unclear, but two mechanisms seem tobe possible explanations:
1. The system needs time to evolve on the excited state potential energy surfaceuntil it approaches a minimum, from which a decay is possible (e.g., via aconical intersection).
2. The photofragments need time to separate after relaxation into the groundstate.
114

5.4 Gold Oxide Clusters
Using TR-PES, it is possible to study the excited anion during the first few pi-coseconds after excitation in detail as shown in figure 5.31. The data are the sameused in figure 5.27, but smoothed and plotted with expanded intensity scale. Within1 ps after excitation a broad maximum appears, growing in intensity and and shift-ing towards higher binding energy with increasing time delay. After about 7 ps nofurther change in shape and position can be observed. These observations suggestthe following interpretation: The maximum corresponds to the anion, being in alocal minimum of the excited state potential surface. The equilibrium geometry ofthe anion in the excited state is different from the one of the ground state, and thechange of shape and position of the broad feature reflects the geometric rearrange-ment the system undergoes after excitation. As long as the geometry of the excitedanion is similar to the initial geometry, the difference spectra displayed in figures5.27 and 5.31 show a vanishing signal. With increasing geometric rearrangementa gradually increasing peak appears, shifting in position and shape until the anionapproaches the new equilibrium geometry. Hence, the data strongly support thefirst mechanism mentioned above being mainly responsible for the delayed onset.
0.0 0.5 1.0 1.5 2.0 2.5
Au2O-
Pump 3.1 eV / Probe 3.1 eV
Binding Energy (eV)
Inte
nsity
(arb
. uni
ts)
14.3 ps11 ps7.7 ps4.3 ps3.7 ps3.0 ps2.3 ps1.7 ps1.0 ps0.7 ps0.33 ps0.07 ps0.03 ps0 ps
Figure 5.31:Details of the dynamics of Au2O
-for
short delay times, corresponding toan expanded view of the data in fig-ure 5.27. After ∼ 1 ps a maximumappears in the high binding energyregime accompanied by a dip at lowbinding energy, caused by the subtrac-tion procedure. With increasing de-lay, the maximum increases in inten-sity and shifts towards higher bindingenergy (arrow).
115

5 Results and Discussion
5.4.2 AuO2-
According to PES measurements in combination with theory, oxygen is bound disso-ciatively to AuO2
-, in contrast to neutral AuO2 or anionic Au2O2
-[93]. A standard
photoelectron spectrum together with the calculated structure is depicted in figure5.32.
Figure 5.32:Standard PES of AuO2
-obtained with
an ArF laser (6.4 eV photon energy).Various features can be observed (la-beled A to D). The inset illustrates thepredicted structure. Modified from [93].
Binding Energy (eV)
A
B
C
D
The time-resolved measurements on this species are performed using the blue-UVoptical setup, providing pump and probe pulses with 3.1 eV and 4.65 eV, respec-tively. Figure 5.33 shows the resulting TR-PES spectra in a “waterfall” plot. In thebinding energy region between 0.2 eV and 2.7 eV, time-dependent dynamics can beobserved, which are assigned to excited states. Furthermore, from the full scale spec-tra it can be seen that also the high energy peaks at 3.5 eV and 4.3 eV contribute to
-26.6-8
-0.534-0.2
-0.133-0.067
00.133
6.820.1
26.833.5
40.10.0 0.5 1.0 1.5 2.0 2.5 3.0 3.5 4.0
Binding Energy (eV)
AuO2-
Delay (ps)
50,00 46,10 46,05 46,04 46,03 46,02 46,00 45,00 43,00 42,00 41,00 40,00 35,00
Pump 3.1 eVProbe 4.65 eV
Figure 5.33:TR-PES of AuO2
-obtained
with the blue-UV setup.The spectra are normal-ized to the electron inten-sity over the full energyrange available, since allobserved peaks seem to betime-dependent.
116

5.4 Gold Oxide Clusters
the dynamics, since their intensity decrease at the zero point. To check for possiblefragmentation, difference spectra are plotted in figure 5.34. Four pronounced peaks(labeled A, B, C and D) can be observed. Taking into account the broad Franck-Condon profile, they match with the energetic positions of the features visible in thestandard spectrum in figure 5.32 labeled in the same way, but shifted by the pumpenergy of 3.1 eV. A small shift of the peak position can be observed for the delaysat 0 fs and 133 fs, indicating a slight change in geometry. For longer delay times,the peak positions do not show any shift but only a decrease in intensity with thesame rate. Evaluation of the integrated intensity between zero and 2.65 eV versustime-delay yields an exponential decay with a time constant of 31± 7 ps. The spec-tra shown are normalized to the overall intensity in the full energy range observablewith the probe pulse, since all peaks are involved into the dynamics. Nevertheless,normalization to one of the high energy peaks results in the same difference spectra
0 1 2B i n d i n g E n e r g y
2 5 , 0 0
4 0 , 0 0
4 1 , 0 0
4 2 , 0 0
4 3 , 0 0
DCB 4 5 , 0 0
A
4 6 , 0 0
4 6 , 0 2
A u O 2-
4 6 , 0 3
- 1 3 3 f s
- 2 0 0 f s
- 5 3 4 f s
- 6 7 f s
1 3 3 f s
0 f s
6 . 8 p s
Norm
alized
Inten
sity (a
rb. un
its)
2 0 . 1 p s
2 6 . 8 p s
4 0 . 1 p s
3 3 . 5 p s
n o r m a l i z e d t o f u l l r e g i o n
4 6 , 0 4
4 6 , 0 5
1 4 0 . 2 p s
4 6 , 1 0
Figure 5.34:Difference spectra for AuO2
-, taken with
a pump photon energy of 3.1 eV anda probe energy of 4.65 eV. A spec-trum at negative delay has been sub-tracted. Four time-dependent features ap-pear, when pump and probe overlap suf-ficiently. Considering the broad Franck-Condon profile, all features can be as-signed to excitation by 3.1 eV from thepeaks labeled in the same way as in fig-ure 5.32. All of the excited states decayon the same timescale of 31± 7 ps.
117

5 Results and Discussion
(not shown) and gives basically the same decay time e.g. for the peak at 3.5 eV).
Possible fragmentation products are AuO-, Au
-, O
-, O2
-and their neutral coun-
terparts. The most probable processes would be fragmentation into AuO-and O or
Au-and O2, since Au and AuO have the highest (and a very similar) EA among the
possible fragments. However, O2 is bound dissociatively, favoring the first process,since O2-desorption is hampered similar to the case of Ag3O2
-, and thus leading to
a relatively long relaxation time. Nevertheless, none of the mentioned fragmentscan be identified in the spectra. Furthermore, no peak shift or “hot” secondaryelectrons can be observed, indicating a relaxation mechanism different from Auger-like electron-electron scattering, electron-phonon coupling or relaxation enabled byshape deformation of the cluster.
The measured electron affinity of 3.30 eV corresponds roughly to the vertical de-tachment energy, which is considerably higher than theoretically predicted (2.95 eV)[93]. This might be a sign for an adiabatic detachment energy lower than 3 eV, whichis below the pump energy of 3.1 eV. Thus, another relaxation channel, called vi-brational autodetachment, might be open [32, 289]. In this case, absorption of thepump photon yields an electronically excited state, being also vibrationally excited.As the excitation energy is higher than the adiabatic detachment energy, dissipationof energy by emission of a low kinetic energy electron is possible. Such electrons cannot be detected with the electron spectrometer used here (the minimum kinetic en-ergy is around 0.1 eV [267]), but have been found e.g. for Au6
-[32, 289] or I
-(H2O)4
and I-(D2O)4 [118, 121]. This mechanism might explain the relaxation dynamics
observed here.
5.4.3 Au2O2-
For comparison, a standard spectrum of Au2O2-, modified from reference [93], is
depicted in figure 5.35. In contrast to AuO2-, oxygen is bound molecularly. Accord-
ingly, relaxation of the cluster after photoexcitation by desorption of an O2 moleculemight be allowed, similar to AgnO2
-with n being even.
To check for this assumption, time-resolved measurements are carried out usingthe blue-UV optical setup (section 4.10), with 3.1 eV photons for pumping and a4.65 eV pulse as probe. A series of time-resolved photoelectron spectra is shown infigure 5.36. Plotted is the normalized intensity versus binding energy. The spectraare normalized to the one-photon signal of feature A in figure 5.35. To examinethe dynamics in more detail, difference spectra are depicted in figure 5.37. At abinding energy of around 1.85 eV, a peak appears at a delay of −133 fs, when pumpand probe start to overlap. This peak is time-dependent and assigned to an excitedstate. After at a delay of 200 fs it vanishes and a broad feature in the binding energy
118

5.4 Gold Oxide Clusters
Binding Energy (eV)
A B
C D
E
Figure 5.35:Standard PES of Au2O2
-obtained with
an ArF laser (6.4 eV photon energy).The inset illustrates the predicted struc-ture. Modified from [93].
-6.9-0.867-0.133-0.033
00.033
0.10.2
0.3340.467
1.11.83.119.833.2
1730.0 0.5 1.0 1.5 2.0 2.5 3.0 3.5 4.0
Probe 4.65 eV
Delay (ps)
47,00 46,10 45,99 45,975 45,97 45,965 45,955 45,94 45,92 45,80 45,70 45,50 43,00 41,00 30,00 20,00
Binding Energy (eV)
Au2O2-
Pump 3.1 eV
Figure 5.36:“Waterfall” plot of the TR-PESseries of Au2O2
-. In the bind-
ing energy range between 1.5 eVand 2.5 eV, time-dependent dy-namics can be seen. For a moredetailed view of that region, seefigure 5.37.
region between 1.6 eV and 2.2 eV can be observed. For longer delays between pumpand probe, the excited state develops into a more narrow feature, centered at 2.0 eV.
From an analysis of the standard spectrum in figure 5.35, the origin of the ob-served excited states can be obtained, assuming only one-photon pump processeswith 3.1 eV. Accordingly, the peak at 1.85 eV is caused by excitation from peak C.The broad feature indicates an equilibrium geometry of the excited Au2O2
-different
from the ground state geometry.The peak at 2.0 eV, growing for delays longer than 1 ps, matches the position of thelow binding energy peak of bare Au2
-(feature D in figure 5.25). Thus, photoexcita-
tion using 3.1 eV yields desorption of O2 via an intermediate excited state, similarto the silver oxides mentioned in section 5.3. This is in agreement with experimen-
119

5 Results and Discussion
1.5 2.0 2.5
173 ps
Binding Energy (eV)
33.2 ps
19.8 ps
3.1 ps
1.8 ps
1.1 ps
467 fs
334 fs
Nor
mal
ized
Inte
nsity
(arb
. uni
ts)
200 fs
100 fs
33 fs
0 fs
-33 fs
-133 fs
Au2O2-
-867 fs
Figure 5.37:Series of difference spectra of Au2O2
-, taken
with a pump photon energy of 3.1 eV anda probe energy of 4.65 eV. Several time-dependent features are observed. For detailsrefer to the text.
tal [290] (1.01 eV) and theoretical [95, 291, 292] (0.95 eV– 1.40 eV) values for thebinding energy of O2 to Au2
-, all being more than a factor of two to three below
the pump photon energy. Therefore the dynamics can be described according to thefollowing scheme:
Au2O2-+ hν3.1 eV −→ Au2
-+ O2.
However, the lifetime of the excited states is longer and the fragment signal is ob-served at rather long delays, which is similar to the case of Au2O
-. In case of
the blue-UV measurement, the signal to noise ratio is not high enough for a moredetailed analysis of the data, e.g. a peak shape analysis of the fragment peak. Con-
120

5.4 Gold Oxide Clusters
sequently, it cannot completely be excluded that thermodesorption occurs as it wasfound e.g. for Au2(CO)
-(section 2.2.2), but desorption from the excited state surface
seems more probable, since a broad intermediate excited state and a concomitantlyincreasing fragment peak can be observed.
121


6 Conclusion
Led by the vision of searching for suitable candidates for future applications incatalysis and energy conversion, systematic studies on the dynamical properties ofseveral size-selected clusters have been performed. The following questions wereaddressed:
• What are the basic relaxation mechanisms of clusters consisting of s/p-metals?Do bare silver clusters show similar properties to the previously studied goldor aluminum clusters?
• Do metal clusters exhibit different dynamical behavior from bulk metals withrespect to photon induced desorption?
• Can species with long-lived excited states be identified?
In order to address these issues, Agn-
(n up to 21), AgnO2-
with n = 2, 3, 4, 8,Ag2O3
-, Au2O
-and AunO2
-for n = 1, 2 were synthesized using a PACIS and investi-
gated systematically by time-resolved photoelectron spectroscopy. Different opticalsetups were installed within this work, because pump and probe energies had to bemodified in order to access and probe excited states for various clusters.
1. Bare Silver ClustersAgn
-with n = 3, 7–9, 11, 14, 15, 18, 19, 21 were photoexcited by absorption of
a single photon with an energy of 1.55 eV and the time-dependent developmentof the excited system was observed by recording photoelectron spectra usinga second laser pulse with a photon energy of 3.1 eV. For most of the speciesthe excited state signal disappears on a time scale considerably shorter than1 ps. Since the spacing between neighboring electronic levels is of the sameorder as the excitation energy and much larger than the typical energy ofvibrational modes, relaxations via combinations of Auger-like processes andcoupling of electronic and vibrational excitations are unlikely. The abilityof these small clusters to deform after optical excitation is proposed to beresponsible for the short relaxation times analogous to the previously studiedcase of Al13
-. Qualitatively, the relationship of electronic shells and their gaps
and the deformation of the clusters is described by the Nilsson diagram. Withhelp of this diagram, a first qualitative understanding of the experimental datacan be gained.
123

6 Conclusion
2. Silver Oxide ClustersExcited states of AgnO2
-clusters with even n = 2, 4 and 8 were discovered,
having high photoabsorption cross sections for a pump energy of 3.1 eV. Theexcited states of these species are similar, although the electronic structurevaries strongly with increasing number of Ag atoms in the cluster. The stateis localized close to the oxygen molecule and decays for Ag2O2
-into Ag2
-and
O2 via direct photoinduced desorption. The data indicate the existence of twoother processes: The regular one-photon detachment leading to the electronicground state of the neutral Ag2O2 and a resonant two-photon detachment pro-cess via the excited state leading to “hot”neutral Ag2O2. In the latter case theexcess energy is a consequence of the anion’s excited state configuration, whichdoes not allow a transition into the electronic ground state of neutral Ag2O2.Most likely, the latter process is the one observed in the NeNePo experimentof Socaciu-Siebert et al. [165]. This resonant two-photon detachment mightdominate at slightly higher pump pulse energies. Analogous, measurementsusing the new blue-UV optical setup (pump 3.1 eV, probe 4.65 eV) reveal pho-todesorption for Ag8O2
-, suggesting again a direct process. The excited state
with similar energy, lifetime and vibrational fine structure found for Ag4O2-
suggests similar direct photodesorption processes occurring for this cluster.On metal surfaces, direct desorption is unlikely, because any excited state isquenched effectively by the DOS near the Fermi energy. In clusters the DOSis low, allowing longer lifetimes and competing processes become more likely.
This interpretation is supported by the finding of an excited state with a longliftetime for Ag3O2
-. Here, O2 is suggested to be dissociatively chemisorbed
and the only remaining “fast” relaxation channel (desorption) is blocked. Thelifetime increases by more than one order of magnitude to 5.4 ps.
In case of Ag2O3-, an intense pump-probe signal is detected (pump 3.1 eV,
probe 4.65 eV). The relaxation time is about 420 fs and hot electron dynamicscan be observed, suggesting Auger-like electron-electron interaction to be re-sponsible for relaxation. This finding is different from the other studied silveroxides, which either relax via desorption or exhibit rather long-lived excitedstates.
3. Gold Oxide ClustersPhotofragmentation of Au2O
-induced by excitation with a 3.1 eV photon was
observed using one-color TR-PES. The data indicate the existence of an ex-cited state of the anion with a very long lifetime of more than 100 ps. Fromthis excited state, the parent anion decayed into Au
-+ AuO or AuO
-+ Au.
Fragmentation did not start immediately after excitation but with a delay of
124

7 ps. A detailed analysis of the spectra at short delay times indicates that thedelayed onset for fragmentation corresponds to the time for geometric rear-rangement.
Au1O2-was studied using the blue-UV setup. For this cluster, oxygen is bound
dissociatively, inhibiting relaxation by desorption of O2. Several excited statescould be identified, all having relaxation times of about 31 ps. No chargedfragments could be observed, although their EA is within the used probe en-ergy. Furthermore, peak shifts of the excited states were not observed duringrelaxation. Since the pump energy was just above the threshold for photo-detachment and the ADE might be slightly below, relaxation via vibrationalautodetachment is proposed for energy dissipation of this cluster.
For Au2O2-, a rather short-lived excited state (< 1 ps) could be observed using
the blue-UV pump-probe scheme. The excited state developed into a broadmaximum with increasing time, indicating an equilibrium geometry of Au2O2
-*
different from the ground state geometry. For this cluster, oxygen is bound asa molecule, allowing again energy dissipation by O2-desorption. Indeed, Au2
-
could be identified in the spectra, suggesting photodesorption similar to theeven numbered silver oxide clusters and Au2O
-.
In summary, the results obtained in this work demonstrate that for small metalclusters fast thermalization is not always the dominant relaxation channel. Fur-thermore, direct photodesorption and long-lived excited states have been identified,which have not been observed from metal surfaces. Thus, photoactivation or pho-todesorption may prevail as dominant processes for such small clusters, suggestingunique photochemical properties and making them very interesting for photochem-istry and promising candidates for future applications in energy storage, energy con-version and catalysis. In the following two tables, a short overview of the relaxationdynamics (table 6.1) for metal/semiconductor cluster anions and of the desorptiondynamics (table 6.2) from metal clusters found so far is given as final conclusion.
125

6 Conclusion
Cluster hνPump Relaxation Relaxation Ref.
[ eV] time mechanism
open d-shell metals
Pd3,4,7-
1.5 42 fs, 91 fs, 25 fs e-e [139, 140]
Pt3-
1.5 < 70 fs e-e [138]
Ni3-
1.5 215 fs e-e [141]
W3-14-
1.56 < 100 fs e-e [158]
s/p metals
Au3-
3.1 1.2 ns fragm [132, 145, 146]
Au5,7,8-
1.5 ∼ 1 ps ic (IVR) [158]
Au6-
1.5/1.56 > 1 ns/> 90 ns not known [145, 146]/[158]
Au7,14,20-
3.12 ∼ 1 ps e-e/IVR [158]
Ag3,8,9,11,14,15-
1.55 < 250 fs ic (deform) this work
Ag7-
1.55 3.8 ps ic (deform) this work
Ag18,19,21-
1.55 400− 630 fs ic (deform) this work
Al6-12,14,15-
1.55 220− 450 fs e-ph [142, 144]
Al13-
1.55 250 fs ic (deform) [23, 142, 144]
other clusters
Si4-
1.5 1.2 ps e-ph [143]
Hg11-/Hg12-16,18
-1.53 34 ps/∼ 10 ps e-ph [130]
Hg7-13,15,18-
1.0 2− 9 ps e-ph [131]
Ag2O3-
3.1 420 fs e-e this work
Table 6.1: Overview of the relaxation dynamics for bare metal/semiconductor clus-ter anions after photoexcitation. Given are the pump photon energy, the lifetime ofthe initial excited state if known or the relaxation time, and the dominant relaxationmechanism. The following abbreviations are used: e-e = Auger-like electron-electronscattering, e-ph = electron-phonon interactions, ic = internal conversion, deform =shape deformation, fragm = fragmentation, IVR = internal vibrational redistribu-tion.
126
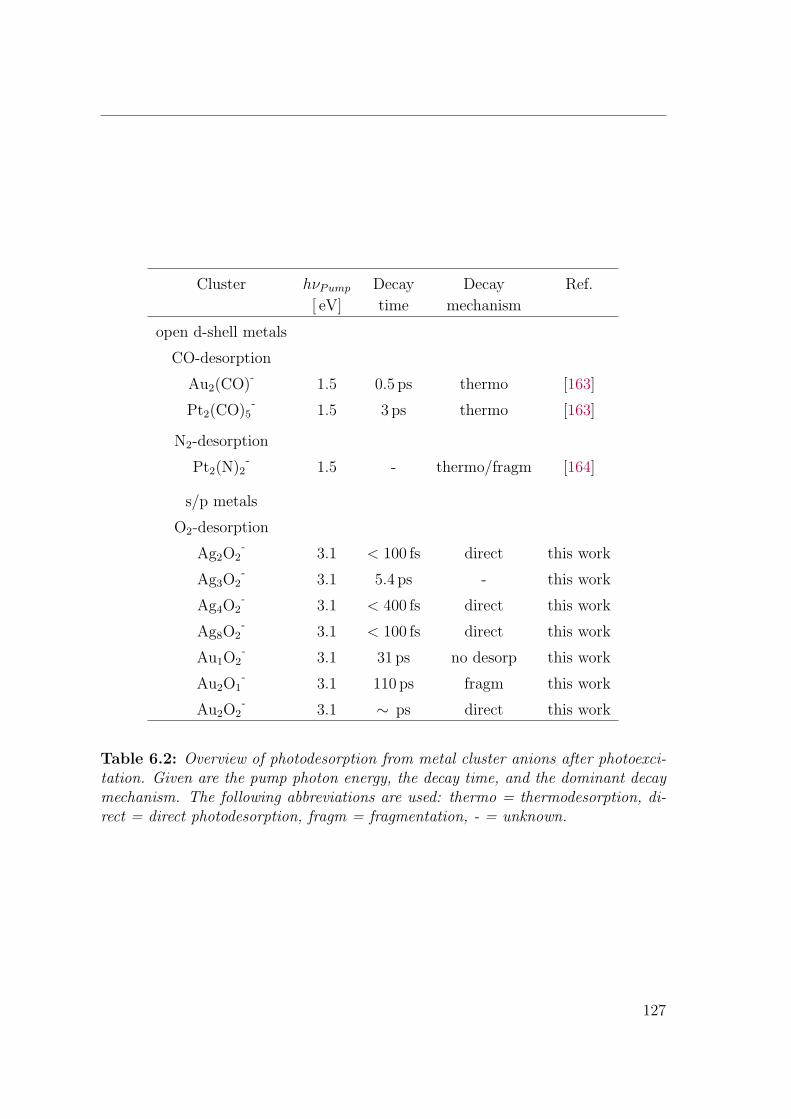
Cluster hνPump Decay Decay Ref.
[ eV] time mechanism
open d-shell metals
CO-desorption
Au2(CO)-
1.5 0.5 ps thermo [163]
Pt2(CO)5-
1.5 3 ps thermo [163]
N2-desorption
Pt2(N)2-
1.5 - thermo/fragm [164]
s/p metals
O2-desorption
Ag2O2-
3.1 < 100 fs direct this work
Ag3O2-
3.1 5.4 ps - this work
Ag4O2-
3.1 < 400 fs direct this work
Ag8O2-
3.1 < 100 fs direct this work
Au1O2-
3.1 31 ps no desorp this work
Au2O1-
3.1 110 ps fragm this work
Au2O2-
3.1 ∼ ps direct this work
Table 6.2: Overview of photodesorption from metal cluster anions after photoexci-tation. Given are the pump photon energy, the decay time, and the dominant decaymechanism. The following abbreviations are used: thermo = thermodesorption, di-rect = direct photodesorption, fragm = fragmentation, - = unknown.
127


7 Outlook
The data presented are part of a systematic study of the photochemical propertiesof small metal clusters. To continue this project, further investigations of AunOm
-,
AunHm-
and Aun(H2O)m-
clusters are planned. Concerning applications in photo-catalysis and energy conversion, especially gold clusters might be very intriguing,since for Au2O
-and in previous studies for Au3
-and Au6
-[146], very long-lived ex-
cited states have been found. The recently developed optical setup provides photonenergies which are sufficient for studying even these species with high EA.
Furthermore, silver oxide clusters are also promising candidates for photochem-istry, showing direct photodesorption. The blue-UV setup will be applied on largerspecies, enabling the detection of possible fragments. As soon as a higher time-resolution becomes available, direct photodesorption can be monitored in real-time.This could be achieved by spectral broadening in a gas-filled hollow fiber, where mostof the intensity propagates in the gas, and self-phase modulation occurs. Subsequentdispersive compression can be done e.g. with double-chirped mirrors or prisms. Thismethod allows to compress e.g. 15 fs pulses down to a few femtoseconds [293, 294].
Also applications of clusters in hydrogen storage are very auspicious. In this re-spect, especially Al-hydrides could be promising candidates. The PACIS, used inthis work, is capable of generating clusters with various numbers of Al and H atomsin a cluster [295, 296]. First examinations of AlnHm
-are currently under way, show-
ing excited state dynamics.
In order to make the planned studies on gold hydride clusters possible, a highermass resolution is necessary. To achieve this, the reflectron will be extended to themaximum length, limited just by the size of the laboratory.
Moreover, another aspect not considered yet will be addressed in the future: Theinteraction of clusters with external fields and forces. This is a very intriguing issue,because “nano”matter might respond in a different way to external forces than bulkmatter. As described within this work, lifetimes and relaxation channels of clustersvary drastically with the number of atoms, depending on the details of the electronicand geometric structure. A perturbation induced by an external field might changerelaxation for a given size, since e.g. the mixing of electronic states can be altered.In this respect, a magnetic field should induce a Zeeman splitting of the electronic
129

7 Outlook
levels, because electrons occupying high quantum number shells can carry large an-gular momentum [297]. Such a giant Zeeman effect, which was already observedfor nanoparticles [298] but not yet considered for clusters, could alter the relaxationdynamics. It is planned to modify the magnetic bottle in order to apply varyingmagnetic fields using an electro magnet.
Besides that, relaxation rates might be also temperature dependent, since vibra-tional excitations play an important role in relaxation by internal conversion, whichis induced by a shape deformation [23]. This should lead to a reduced relaxationrate at lower temperatures for the double magic cluster Al13
-. To modify the cluster
temperature, a longer extender can be attached to the PACIS and cooled to liquidnitrogen temperature.
In addition, a controlled change of geometry of a cluster having different isomersmight be induced by a pump pulse. This “isomer switching” can be examined time-resolved by the probe pulse. A suitable candidate might be Ag2O2
-, since O2 can be
bound either molecularly or dissociatively [92].
Finally, real-time observation of a catalytic reaction such as CO-oxidation on a“cluster surface”might yield new insight into the catalytic processes of nanocatalysis.Such reactions (e.g. CO and O2 on Aun
-clusters [10]) could be triggered by a pump
pulse and observed by the probe.
130

8 Zusammenfassung
Im Hinblick auf geeignete Materialien fur mogliche Anwendungen in der Katal-yse und zur Energiekonversion wurden systematische Studien der Dynamik ver-schiedener massen-selektierter Cluster durchgefuhrt. Insbesondere wurden dabeifolgende Punkte beleuchtet:
• Was sind die grundlegenden Relaxationsmechanismen von Clustern aus s/p-Metallen? Zeigen reine Silbercluster ahnliche Eigenschaften wie die zuvor un-tersuchten Gold- oder Aluminiumcluster?
• Zeigen Metallcluster ein anderes dynamisches Verhalten bei photoneninduzierterDesorption als Festkorperoberflachen?
• Haben manche der untersuchten Cluster langlebige angeregte Zustande?
Um diese Fragestellungen zu untersuchen wurden Agn-
(n bis 21), AgnO2-
mitn = 2, 3, 4, 8, Ag2O3
-, Au2O
-und AunO2
-fur n = 1, 2 mit Hilfe einer PACIS
hergestellt und systematisch durch zeitaufgeloste Photoelektronenspektroskopie un-tersucht. Im Rahmen dieser Arbeit wurden verschiedene optische Versuchsanord-nungen aufgebaut, da die Energien von Pump und Probe Puls angepasst werdenmussten, um angeregte Zustande von verschiedenen Clustern erreichen und unter-suchen zu konnen.
1. Reine SilberclusterAgn
-mit n = 3, 7–9, 11, 14, 15, 18, 19, 21 wurden durch Absorption einzelner
Photonen von 1.55 eV angeregt und die zeitliche Entwicklung des angeregtenSystems durch Aufnahme von Photoelektronenspektren mit einem zweitenLaserpuls (3.1 eV Photonenenergie) studiert. Bei den meisten untersuchtenClustern verschwindet das Pump-Probe Signal deutlich schneller als 1 ps. Dader Abstand benachbarter elektronischer Niveaus in der gleichen Großenord-nung wie die Anregungsenergie liegt und viel großer als die Energie der Vibra-tionsmoden ist, ist Relaxation mittels einer Kombination von Auger-ahnlichenProzessen und Elektron-Phonon Streuung unwahrscheinlich. Zur Erklarungdes Relaxationsmechanismus wird deshalb ein anderer Effekt herangezogen,namlich die Fahigkeit dieser kleinen Cluster, sich nach optischer Anregungzu deformieren, ahnlich dem zuvor untersuchten Al13
-. Qualitativ kann die
Beziehung zwischen den elektronischen Schalen und ihrer Abstande und der
131

8 Zusammenfassung
Deformation des Clusters durch das Nilsson-Diagramm beschrieben werden,um ein erstes Verstandnis der experimentellen Daten zu gewinnen.
2. SilberoxidclusterFur AgnO2
-mit geradzahligem n = 2, 4 und 8 wurden angeregte Zustande
entdeckt, die einen hohen Wirkungsquerschnitt fur die Absorption von Pho-tonen mit 3.1 eV haben. Die angeregten Zustande dieser Cluster verhaltensich ahnlich, obwohl sich die elektronische Struktur mit zunehmender Anzahlder Silberatome im Cluster stark andert. Der angeregte Zustand ist nahe amSauerstoffmolekul lokalisiert und fuhrt beim Ag2O2
-zum Zerfall in Ag2
-und
O2 durch direkte photoinduzierte Desorption. Außerdem deuten die Daten aufzwei weitere Prozesse hin: Das normale ein-Photonen Detachment, was zumelektronischen Grundzustand des neutralen Ag2O2 fuhrt und einen resonan-ten zwei-Photonen Detachmentprozess uber den angeregten Zustand, der zu“heißem”neutralem Ag2O2 fuhrt. Im zweiten Fall ergibt sich die Uberschussen-ergie als Konsequenz aus der Konfiguration des Anions im angeregten Zus-tand, die keinen Ubergang in den elektronischen Grundzustand des neutralenAg2O2 erlaubt. Dieser zweite Prozess wurde vermutlich in einem NeNePo-Experiment von Socaciu-Siebert et al. [165] beobachtet. Dieses resonantezwei-Photonen Detachment konnte bei hoheren Energien des Pump-Pulses do-minieren. Analoge Messungen mit dem neuen blau-UV Aufbau (Pump-Photon3.1 eV, Probe-Photon 4.65 eV) zeigen auch fur Ag8O2
-Photodesorption und
weisen auf einen direkten Prozess hin. Der angeregte Zustand am Ag4O2-
mit ahnlicher Energie, Lebensdauer und vibratorischer Feinstruktur deutetebenfalls auf direkte Photodesorption hin. An Metalloberflachen hingegen istdirekte Photodesorption unwahrscheinlich, da angeregte Zustande wegen derhohen Zustandsdichte in der Nahe der Fermikante durch Auger-artige Prozesssehr schnell relaxieren konnen. Fur Cluster ist die Zustandsdichte niedrig,deshalb sind langere Lebensdauern und Konkurrenzprozesse wie direkte Pho-todesorption wahrscheinlicher.
Diese Interpretation wird durch die lange Lebensdauer eines angeregten Zu-stands beim Ag3O2
-gestutzt. In diesem Fall ist O2 vermutlich dissoziativ
chemisorbiert und der einzige“schnelle”Relaxationskanal (Desorption) ist block-iert. Die Lebensdauer ist dementsprechend um mehr als eine Großenordnunglanger (5.4 ps).
Ag2O3-zeigt ein intensives Pump-Probe Signal (Pump-Photon 3.1 eV, Probe-
Photon 4.65 eV). Die Relaxationszeit betragt 420 fs und “heiße Elektronen”werden beobachtet, die auf Auger-artige inelastische Elektron-Elektron Streu-ung hindeuten. Diese Beobachtung unterscheidet sich von den anderen un-
132

tersuchten Silberoxidclustern, die entweder durch Desorption relaxieren odereinen langlebigen angeregten Zustand zeigen.
3. GoldoxidclusterDie Photofragmentation von Au2O
-induziert durch ein 3.1 eV Photon wurde
mittels TR-PES untersucht (Probe ebenfalls 3.1 eV). Dabei zeigte sich einangeregter Zustand mit einer langen Lebensdauer von 110 ps. Aus diesem an-geregten Zustand heraus zerfiel der Cluster in Au
-+ AuO oder AuO
-+ Au.
Die Fragmentation setzte nicht sofort nach der Anregung ein, sondern miteiner Verzogerungszeit von 7 ps. Eine genaue Analyse der Spektren fur kurzeVerzogerungszeiten zwischen Pump- und Probe-Puls deutet daraufhin hin,dass der verzogerte Eintritt der Fragmentation der Zeit fur eine geometrischeUmordnung des Au2O
-entspricht.
Au1O2-wurde mit Hilfe des blau-UV Aufbaus untersucht. An diesem Cluster
ist Sauerstoff dissoziativ gebunden, so dass Relaxation durch Desorption vonO2 nicht stattfinden kann. Mehrere angeregte Zustande konnten beobachtetwerden, die alle Lebensdauern von ungefahr 31 ps haben. Mogliche geladeneFragmente konnten nicht identifiziert werden, obwohl deren Elektronenaffinitateninnerhalb der Probe-Energie liegen. Des Weiteren waren keine Verschiebun-gen in der Position der Peaks wahrend der Relaxation zu erkennen. Da diePump-Energie nur sehr geringfugig uber der Schwelle fur Photodetachmentliegt und die adiabatische Detachmentenergie darunter liegen konnte, ist Re-laxation durch vibratorisches Autodetachment wahrscheinlich.
Am Au2O2-wurde mittels des blau-UV Aufbaus ein eher kurzlebiger angeregter
Zustand (< 1 ps) beobachtet. Der angeregte Zustand wurde mit zunehmenderVerzogerung zu einem breiten Maximum, was auf eine Gleichgewichtsgeome-trie des Au2O2
-*hindeutet, die unterschiedlich zu der des Grundzustands ist.
Fur diesen Cluster ist Sauerstoff molekular gebunden und O2-Desorption “er-laubt”. Tatsachlich konnte Au2
-in den Spektren identifiziert werden, was auf
Photodesorption ahnlich den geradzahligen Silberoxiden und Au2O-hinweist.
Die Ergebnisse dieser Arbeit zeigen, dass fur kleine Metallcluster schnelle Ther-malisierung nicht immer der dominante Relaxationskanal darstellt. Außerdem wur-den direkte Photodesorption sowie langlebige angeregte Zustande gefunden, was anMetalloberflachen bisher nicht beobachtet wurde. Dementsprechend konnen Pho-toaktivierung oder Photodesorption die dominanten Prozesse fur solche kleinen Clus-ter bilden, was auf einzigartige photochemische Eigenschaften hindeutet und dieseCluster sehr interessant fur Photochemie und als vielversprechende Kandidaten furAnwendungen in Energiespeicherung, Energiekonversion und Katalyse macht.
133


A Abbreviations
Table A.1: Description of frequently used abbreviations.
Abbreviation Description
ADE adiabatic detachment energy
AOM acousto-optic modulator
BBO beta barium borate (β-BaB2O4)
DFT density functional theory
DIET desorption induced by electronic transitions
DIMET desorption induced by multiple electronic tran-sitions
DOS density of states
EA electron affinity
EF Fermi energy
FLT Fermi liquid theory
HOMO highest occupied molecular orbital
HOPG highly-oriented pyrolytic graphite
IVR internal vibrational redistribution
LBO lithium triborate (LiB3O5)
LUMO lowest unoccupied molecular orital
MO molecular orbital
Nd:YAG neodymium-doped yttrium aluminium garnet(Nd:Y3Al5O12)
Nd:YLF neodymium-doped yttrium lithium fluoride(Nd:LiYF4)
Nd:YVO4 neodymium-doped yttrium orthovanadate
NeNePo negative to neutral to positive
135

A Abbreviations
PACIS pulsed arc cluster ion source
PES photoelectron spectroscopy
STM scanning tunneling microscope
Ti:Sa titanium-doped corundum (Ti3+
:Al2O3)
TIED trapped ion electron diffraction
TOF time-of-flight mass spectrometer
UPS ultraviolet photoelectron spectroscopy
UV ultraviolet
TR-PES time-resolved photoelectron spectroscopy
VDE vertical detachment energy
VEA vertical electron affinity
XPS X-ray photoelectron spectroscopy
136
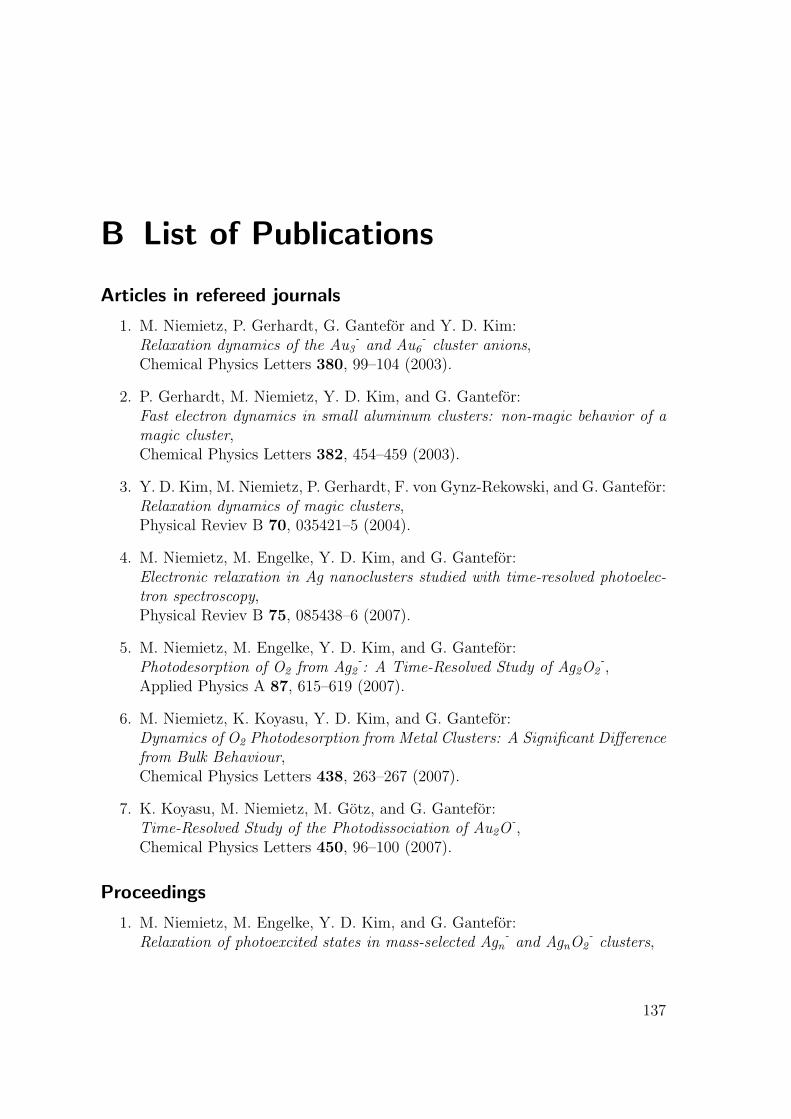
B List of Publications
Articles in refereed journals
1. M. Niemietz, P. Gerhardt, G. Gantefor and Y. D. Kim:Relaxation dynamics of the Au3
-and Au6
-cluster anions,
Chemical Physics Letters 380, 99–104 (2003).
2. P. Gerhardt, M. Niemietz, Y. D. Kim, and G. Gantefor:Fast electron dynamics in small aluminum clusters: non-magic behavior of amagic cluster,Chemical Physics Letters 382, 454–459 (2003).
3. Y. D. Kim, M. Niemietz, P. Gerhardt, F. von Gynz-Rekowski, and G. Gantefor:Relaxation dynamics of magic clusters,Physical Reviev B 70, 035421–5 (2004).
4. M. Niemietz, M. Engelke, Y. D. Kim, and G. Gantefor:Electronic relaxation in Ag nanoclusters studied with time-resolved photoelec-tron spectroscopy,Physical Reviev B 75, 085438–6 (2007).
5. M. Niemietz, M. Engelke, Y. D. Kim, and G. Gantefor:Photodesorption of O2 from Ag2
-: A Time-Resolved Study of Ag2O2
-,
Applied Physics A 87, 615–619 (2007).
6. M. Niemietz, K. Koyasu, Y. D. Kim, and G. Gantefor:Dynamics of O2 Photodesorption from Metal Clusters: A Significant Differencefrom Bulk Behaviour,Chemical Physics Letters 438, 263–267 (2007).
7. K. Koyasu, M. Niemietz, M. Gotz, and G. Gantefor:Time-Resolved Study of the Photodissociation of Au2O
-,
Chemical Physics Letters 450, 96–100 (2007).
Proceedings
1. M. Niemietz, M. Engelke, Y. D. Kim, and G. Gantefor:Relaxation of photoexcited states in mass-selected Agn
-and AgnO2
-clusters,
137

B List of Publications
in Femtochemistry VII: Fundamental Ultrafast Processes in Chemistry, Physicsand Biology;M. Kimble, A. W. Castleman Jr., ed.; Elsevier, Amsterdam; p. 274–283 (2006);ISBN 0444528210.
Talks
1. Reaktionen von Siliziumclustern mit Wasserstoff: Eine Moglichkeit zur Pas-sivierung der “dangling bonds”?M. Niemietz, R. Fromherz, L. Kronik, E. Ko, J. Chelikowsky, and G. GanteforDPG-Fruhjahrstagung, Hannover (Germany), March 24–28, 2003.
2. Ultraschnelle Dynamik in massenselektierten reinen und reagierten Metallclus-tern; selected hot topic talkM. Niemietz, M. Engelke, Y. D. Kim, and G. GanteforClustertreffen, Bad Herrenalb (Germany), September 11–16, 2005.
3. Zeitaufgeloste Photoelektronenspektroskopie photochemischer Reaktionen an großense-lektierten ClusternM. Niemietz, M. Gotz, M. Engelke, Y. D. Kim, and G. GanteforCAP-Workshop, Bad Ragaz (Switzerland), March 13–15, 2006.
4. Real-time spectroscopy of photo-chemical reactions on mass-selected clustersM. Niemietz, K. Koyasu, M. Gotz, M. Engelke, and G. GanteforDPG-Fruhjahrstagungp, Dusseldorf (Germany), March 5–9, 2007.
Posters
1. Pump-Probe Photoelektronenspektroskopie an MetallclusternM. Niemietz, P. Gerhardt and G. GanteforDPG-Fruhjahrstagung, Hannover (Germany), March 24–28, 2003.
2. Relaxationsdynamik magischer ClusterM. Niemietz, P. Gerhardt, F. von Gynz-Rekowski, Y. D. Kim, and G. GanteforClustertreffen, Brand (Austria), October 5–10, 2003.
3. Relaxation Dynamics of Optically Excited States of Ag ClustersM. Engelke, M. Niemietz, Y. D. Kim, and G. GanteforS3C 2005 - Symposium on Size Selected Clusters, Brand (Austria), February28 – March 3, 2005.
4. Time-resolved spectroscopy of O2 photodesorption from mass-selected metalclustersM. Niemietz, M. Engelke, Y. D. Kim, and G. Gantefor
138

Gordon Research Conference on Photoions, Photoionization and Photodetach-ment, Buellton, USA, January 29 – February 3, 2006.
5. Real-time spectroscopy of the dynamics of size-selected metal clusters: electronrelaxationM. Niemietz, M. Engelke, Y. D. Kim, and G. GanteforXIII. International Symposium on Small Particles and Inorganic Clusters (IS-SPIC), Gothenburg, Sweden , July 23–28, 2006.
6. Real-time spectroscopy of the dynamics of size-selected metal clusters: photo-chemical reactionsM. Niemietz, M. Engelke, M. Gotz, Y. D. Kim, and G. GanteforXIII. International Symposium on Small Particles and Inorganic Clusters (IS-SPIC), Gothenburg, Sweden , July 23–28, 2006.
7. Dynamics of O2 Photodesorption from Metal Clusters: A Significant Differencefrom Bulk BehaviourM. Gotz, M. Niemietz, K. Koyasu, Y. D. Kim, and G. GanteforS3C 2007 - Symposium on Size Selected Clusters, Brand (Austria), March12–16, 2007.
8. Time-resolved photoelectron spectroscopy of gold-oxide clustersK. Koyasu, M. Niemietz, M. Gotz, and G. GanteforS3C 2007 - Symposium on Size Selected Clusters, Brand (Austria), March12–16, 2007.
9. Electronic Relaxation in Ag NanoclustersM. Niemietz, M. Engelke, Y. D. Kim, and G. GanteforS3C 2007 - Symposium on Size Selected Clusters, Brand (Austria), March12–16, 2007.
139


Bibliography
[1] M. Schmidt, J. Donges, Th. Hippler and H. Haberland. Influence of Energy andEntropy on the Melting of Sodium Clusters. Phys. Rev. Lett., 90(10), p. 103401,(2003). 2
[2] C.-Y. Cha, G. Gantefor and W. Eberhardt. Photoelectron spectroscopy of Cun-
clusters: Comparison with jellium model predictions. J. Chem. Phys., 99(9), p.6308–6312, (1993). 2
[3] H. Wu, S. R. Desai and L.-S. Wang. Electronic Structure of Small Titanium Clusters:Emergence and Evolution of the 3d Band. Phys. Rev. Lett., 76(2), p. 212–215,(1996). 2
[4] R. Busani, M. Folkers and O. Chesnovsky. Direct Observation of Band-Gap Closurein Mercury Clusters. Phys. Rev. Lett., 81(18), p. 3836–3839, (1998). 2, 14
[5] I. M. L. Billas, A. Chatelain and W. A. de Heer. Magnetism from the Atom to theBulk in Iron, Cobalt, and Nickel Clusters. Science, 265(5179), p. 1682–1684, (1994).2
[6] B. E. Salisbury, W. T. Wallace and R. L. Whetten. Low-temperature activation ofmolecular oxygen by gold clusters: a stoichiometric process correlated to electronaffinity. Chem. Phys., 262(1), p. 131–141, (2000). 2, 9
[7] D. Stolcic, M. Fischer, G. Gantefor, Y.D. Kim, Q. Sun and P. Jena. Direct Observa-tion of Key Reaction Intermediates on Gold Clusters. J. Am. Chem. Soc., 125(10),p. 2848–2849, (2003). 2, 9, 10
[8] Y. D. Kim and G. Gantefor. Formation of di-oxygen species on Ag anion clusters.Chem. Phys. Lett., 383(1-2), p. 80–83, (2004). 2, 9, 10, 92, 93
[9] A. Sanchez, S. Abbet, U. Heiz, W.-D. Schneider, H. Hakkinen, R. N. Barnett andUzi Landman. When Gold Is Not Noble: Nanoscale Gold Catalysts. J. Phys. Chem.A, 103, p. 9573–9578, (1999). 2, 8, 9
[10] W. T. Wallace and R. L. Whetten. Coadsorption of CO and O2 on Selected GoldClusters: Evidence for Efficient Room-Temperature CO2 Generation. J. Am. Chem.Soc., 124(25), p. 7499–7505, (2002). 2, 9, 130
[11] B. Yoon, H. Hakkinen, U. Landman, A. S. Worz, J.-M. Antonietti, S. Abbet, K. Ju-dai and U. Heiz. Charging Effects on Bonding and Catalyzed Oxidation of CO onAu8 Clusters on MgO. Science, 307(5708), p. 403–407, (2005). 2, 9
141

Bibliography
[12] B. Yoon, P. Koskinen, B. Huber, O. Kostko, B. von Issendorff, H. Hakkinen,M. Moseler and U. Landman. Size-Dependent Structural Evolution and Chemi-cal Reactivity of Gold Clusters. ChemPhysChem, 8(1), p. 157 – 161, (2007). 2,7
[13] D. C. Lim, R. Dietsche, M. Bubek, G. Gantefor and Y. D. Kim. Oxidation andReduction of Mass-Selected Au Clusters on SiO2/Si. ChemPhysChem, 7(9), p. 1909–1911, (2006). 2, 9
[14] D. C. Lim, R. Dietsche, M. Bubek, T. Ketterer, G. Gantefor and Y. D. Kim. Chem-istry of mass-selected Au clusters deposited on sputter-damaged HOPG surfaces:The unique properties of Au8 clusters. Chem. Phys. Lett., 439(4-6), p. 364–368,(2007). 2, 9
[15] R. L. Whetten, D. M. Cox, D. J. Trevor and A. Kaldor. Correspondence betweenElectron Binding Energy and Chemisorption Reactivity of Iron Clusters. Phys. Rev.Lett., 54(14), p. 1494–1497, (1985). 2
[16] I. Last and J. Jortner. Tabletop Nucleosynthesis Driven by Cluster Coulomb Explo-sion. Phys. Rev. Lett., 97(17), p. 173401, (2006). 2
[17] M. Uchida, M. L. Flenniken, M. Allen, D. A. Willits, B. E. Crowley, S. Brumfield,A. F. Willis, L. Jackiw, M. Jutila, M. J. Young and T. Douglas. Targeting of CancerCells with Ferrimagnetic Ferritin Cage Nanoparticles. J. Am. Chem. Soc., 128(51),p. 16626–16633, (2006). 2
[18] K. Maeda, K. Teramura, D. Lu, T. Takata, N. Saito, Y. Inoue and K. Domen.Photocatalyst releasing hydrogen from water. Nature, 440, p. 295, (2006). 3
[19] M. Aeschlimann, M. Bauer and S. Pawlik. Competing nonradiative channels forhot electron induced surface photochemistry. Chem. Phys., 205(1-2), p. 127–141,(1996). 3, 6, 13, 40, 42, 43, 80, 81
[20] R. Franchy. Surface and bulk photochemistry of solids. Rep. Prog. Phys., 61(6), p.691–753, (1998). 3, 52
[21] C. Frischkorn and M. Wolf. Femtochemistry at Metal Surfaces: Nonadiabatic Reac-tion Dynamics. Chem. Rev., 106(10), p. 4207–4233, (2006). 3, 46, 48, 49, 51
[22] P. Avouris and R. E. Walkup. Fundamental Mechanisms of Desorption and Frag-mentation Induced by Electronic Transitions at Surfaces. Annu. Rev. Phys. Chem.,40(1), p. 173–206, (1989). 3, 52
[23] V. V. Kresin and Yu. N. Ovchinnikov. Fast electronic relaxation in metal nanoclus-ters via excitation of coherent shape deformations. Phys. Rev. B, 73(11), p. 115412,(2006). 4, 17, 53, 80, 87, 92, 126, 130
142
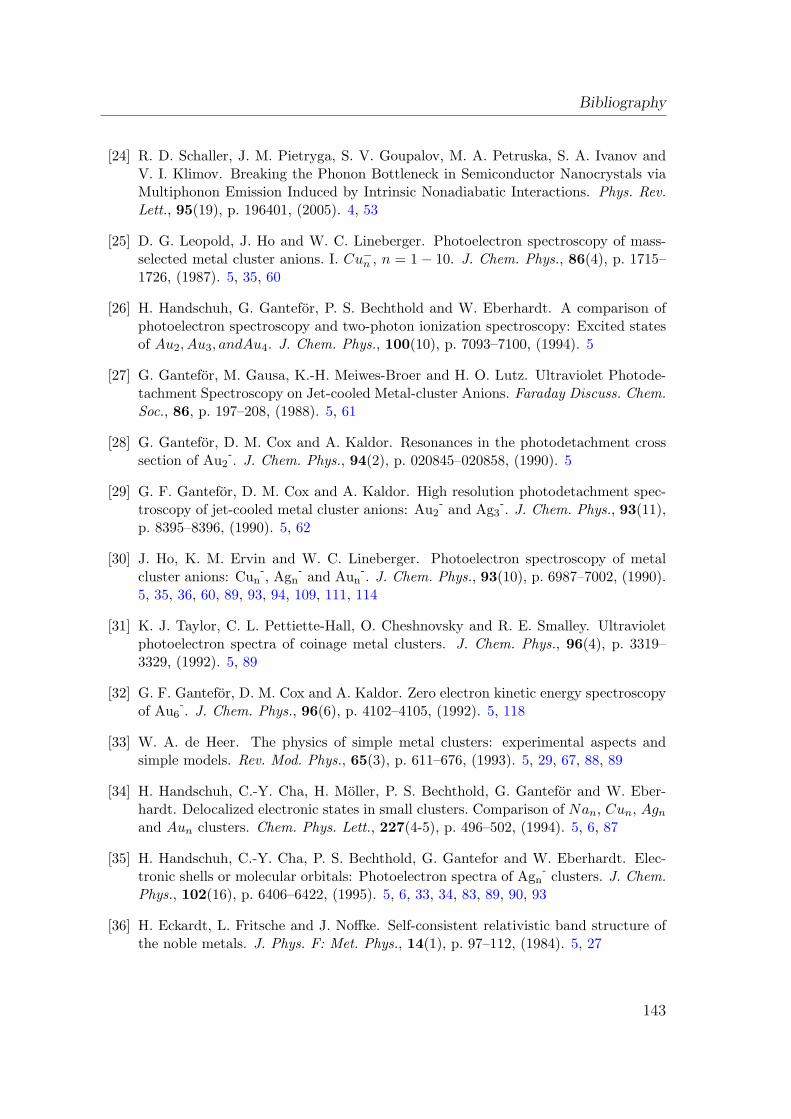
Bibliography
[24] R. D. Schaller, J. M. Pietryga, S. V. Goupalov, M. A. Petruska, S. A. Ivanov andV. I. Klimov. Breaking the Phonon Bottleneck in Semiconductor Nanocrystals viaMultiphonon Emission Induced by Intrinsic Nonadiabatic Interactions. Phys. Rev.Lett., 95(19), p. 196401, (2005). 4, 53
[25] D. G. Leopold, J. Ho and W. C. Lineberger. Photoelectron spectroscopy of mass-selected metal cluster anions. I. Cu−n , n = 1− 10. J. Chem. Phys., 86(4), p. 1715–1726, (1987). 5, 35, 60
[26] H. Handschuh, G. Gantefor, P. S. Bechthold and W. Eberhardt. A comparison ofphotoelectron spectroscopy and two-photon ionization spectroscopy: Excited statesof Au2, Au3, andAu4. J. Chem. Phys., 100(10), p. 7093–7100, (1994). 5
[27] G. Gantefor, M. Gausa, K.-H. Meiwes-Broer and H. O. Lutz. Ultraviolet Photode-tachment Spectroscopy on Jet-cooled Metal-cluster Anions. Faraday Discuss. Chem.Soc., 86, p. 197–208, (1988). 5, 61
[28] G. Gantefor, D. M. Cox and A. Kaldor. Resonances in the photodetachment crosssection of Au2
-. J. Chem. Phys., 94(2), p. 020845–020858, (1990). 5
[29] G. F. Gantefor, D. M. Cox and A. Kaldor. High resolution photodetachment spec-troscopy of jet-cooled metal cluster anions: Au2
- and Ag3-. J. Chem. Phys., 93(11),
p. 8395–8396, (1990). 5, 62
[30] J. Ho, K. M. Ervin and W. C. Lineberger. Photoelectron spectroscopy of metalcluster anions: Cun
-, Agn- and Aun
-. J. Chem. Phys., 93(10), p. 6987–7002, (1990).5, 35, 36, 60, 89, 93, 94, 109, 111, 114
[31] K. J. Taylor, C. L. Pettiette-Hall, O. Cheshnovsky and R. E. Smalley. Ultravioletphotoelectron spectra of coinage metal clusters. J. Chem. Phys., 96(4), p. 3319–3329, (1992). 5, 89
[32] G. F. Gantefor, D. M. Cox and A. Kaldor. Zero electron kinetic energy spectroscopyof Au6
-. J. Chem. Phys., 96(6), p. 4102–4105, (1992). 5, 118
[33] W. A. de Heer. The physics of simple metal clusters: experimental aspects andsimple models. Rev. Mod. Phys., 65(3), p. 611–676, (1993). 5, 29, 67, 88, 89
[34] H. Handschuh, C.-Y. Cha, H. Moller, P. S. Bechthold, G. Gantefor and W. Eber-hardt. Delocalized electronic states in small clusters. Comparison of Nan, Cun, Agn
and Aun clusters. Chem. Phys. Lett., 227(4-5), p. 496–502, (1994). 5, 6, 87
[35] H. Handschuh, C.-Y. Cha, P. S. Bechthold, G. Gantefor and W. Eberhardt. Elec-tronic shells or molecular orbitals: Photoelectron spectra of Agn
- clusters. J. Chem.Phys., 102(16), p. 6406–6422, (1995). 5, 6, 33, 34, 83, 89, 90, 93
[36] H. Eckardt, L. Fritsche and J. Noffke. Self-consistent relativistic band structure ofthe noble metals. J. Phys. F: Met. Phys., 14(1), p. 97–112, (1984). 5, 27
143

Bibliography
[37] Y. D. Kim. Chemical properties of mass-selected coinage metal cluster anions: to-wards obtaining molecular-level understanding of nanocatalysis. Int. J. Mass spec-trom., 238(1), p. 17–31, (2004). 6, 8, 9, 11
[38] N. Bartlett. Relativistic Effects and the Chemistry of Gold. Gold Bulletin, 31(1),p. 22–25, (1998). 6
[39] H. Schwarz. Relativistic Effects in Gas-Phase Ion Chemistry: An Experimentalist’sView. Angew. Chem. Int. Ed., 42, p. 4442–4454, (2003). 6
[40] K. Koszinowski, D. Schroder and H. Schwarz. Coupling of Methane and Ammoniaby Dinuclear Bimetallic Platinum-Coinage-Metal Cations PtM. Angew. Chem. Int.Ed., 43, p. 121–124, (2004). 6
[41] H. Hakkinen, M. Moseler, O. Kostko, N. Morgner, M. Astruc Hoffmann and B. v. Is-sendorff. Symmetry and Electronic Structure of Noble-Metal Nanoparticles and theRole of Relativity. Phys. Rev. Lett., 93(9), p. 093401, (2004). 6, 7
[42] M. F. Jarrold and K. M. Creegan. Optical spectroscopy of metal clusters: Cu4+.
Chem. Phys. Lett., 166(2), p. 116–122, (1990). 6
[43] C. R. C. Wang, S. Pollack, T. A. Dahlseid, G. M. Koretsky and M. M. Kappes.Photodepletion probes of Na5,Na6, and Na7. Molecular dimensionality transition(2D → 3D)? J. Chem. Phys., 96(11), p. 7931–7937, (1992). 6
[44] T. Ikegami, T. Kondow and S. Iwata. The geometric and electronic structures ofArn
+ (n=3–27). J. Chem. Phys., 98(4), p. 3038–3048, (1993). 6
[45] M. Pellarin, E. Cottancin, J. Lerme, J. L. Vialle, M. Broyer, F. Tournus, B. Masenelliand P. Melinon. Coating and polymerization of C60 with carbon: A gas phasephotodissociation study. J. Chem. Phys., 117(7), p. 3088–3097, (2002). 6
[46] D. Schooss, S. Gilb, J. Kaller, M. M. Kappes, F. Furche, A. Kohn, K. May andR. Ahlrichs. Photodissociation spectroscopy of Ag4
+(N2)m, m = 0–4. J. Chem.Phys., 113(13), p. 5361–5371, (2000). 6
[47] A. Fielicke, R. Mitric, G. Meijer, V. Bonacic-Koutecky and G. von Helden. TheStructures of Vanadium Oxide Cluster-Ethene Complexes. A Combined IR MultiplePhoton Dissociation Spectroscopy and DFT Calculation Study. J. Am. Chem. Soc.,125(51), p. 15716–15717, (2003). 6
[48] H. Kietzmann, J. Morenzin, P. S. Bechthold, G. Gantefor, W. Eberhardt, D.-S.Yang, P. A. Hackett, R. Fournier, T Pang and C. Chen. Photoelectron Spectra andGeometric Structures of Small Niobium Cluster Anions. Phys. Rev. Lett., 77(22),p. 4528–4531, (1996). 6
[49] Jun Li, Xi Li, Hua-Jin Zha and Lai-Sheng Wang. Au20: A Tetrahedral Cluster.Science, 299(5608), p. 864, (2003). 6, 7, 25
144

Bibliography
[50] E. A. Mason and E. W. McDaniel. Transport Properties of Ions in Gases. Wiley,(1988). 6
[51] P. R. Kemper, M. T. Hsu and M. T. Bowers. Transition-metal ion-rare gas clus-ters: bond strengths and molecular parameters for Co+(He/Ne)n, Ni+(He/Ne)n,and Cr+(He/Ne/Ar). J. Phys. Chem., 95(26), p. 10600–10609, (1991). 6
[52] N. v. Helden, G. Gotts and M. T. Bowers. Experimental evidence for the formationof fullerenes by collisional heating of carbon rings in the gas phase. Nature, 363, p.60 – 63, (1993). 6
[53] R. R. Hudgins, M. Imai, M. F. Jarrold and P. Dugourd. High-resolution ion mobilitymeasurements for silicon cluster anions and cations. J. Chem. Phys., 111(17), p.7865–7870, (1999). 6
[54] M. F. Jarrold and J. E. Bower. Mobilities of silicon cluster ions: The reactivity ofsilicon sausages and spheres. J. Chem. Phys., 96, p. 9180–9190, (1992). 6
[55] M. F. Jarrold and J. E. Bower. Mobilities of metal cluster ions aluminum (Aln+ and
Aln2+): effect of charge on cluster geometry. J. Phys. Chem., 97(9), p. 1746–1748,
(1993). 6
[56] A. A. Shvartsburg and M. F. Jarrold. Solid Clusters above the Bulk Melting Point.Phys. Rev. Lett., 85(12), p. 2530–2532, (2000). 6
[57] A. A. Shvartsburg and M. F. Jarrold. Transition from covalent to metallic behaviorin group-14 clusters. Chem. Phys. Lett., 317(6), p. 615–618, (2000). 6
[58] M. Maier-Borst, D. B. Cameron, M. Rokni and J. H. Parks. Electron diffraction oftrapped cluster ions. Phys. Rev. A, 59(5), p. R3162–R3165, (1999). 6
[59] S. Kruckeberg, D. Schooss, M. Maier-Borst and J. H. Parks. Diffraction of Trapped(CsI)nCs+: The Appearance of Bulk Structure. Phys. Rev. Lett., 85(21), p. 4494–4497, (2000). 6
[60] R. Fromherz, G. Gantefor and A. A. Shvartsburg. Isomer-Resolved Ion Spectroscopy.Phys. Rev. Lett., 89(8), p. 083001, (2002). 6
[61] F. Furche, R. Ahlrichs, P. Weis, C. Jacob, S. Gilb, T. Bierweiler and M. M. Kappes.The structures of small gold cluster anions as determined by a combination of ion mo-bility measurements and density functional calculations. J. Chem. Phys., 117(15),p. 6982–6990, (2002). 7, 89
[62] Stefan Gilb, Patrick Weis, Filip Furche, Reinhart Ahlrichs and Manfred M. Kappes.Structures of small gold cluster cations (Aun
+, n < 14): Ion mobility measure-ments versus density functional calculations. J. Chem. Phys., 116(10), p. 4094–4101,(2002). 7
145

Bibliography
[63] P. Weis, T. Bierweiler, S. Gilb and M. M. Kappes. Structures of small silver clustercations (Agn
+, n<12): ion mobility measurements versus density functional andMP2 calculations. Chem. Phys. Lett., 355(3-4), p. 355–364, (2002). 7, 8
[64] H. Hakkinen, M. Moseler and U. Landman. Bonding in Cu, Ag, and Au Clusters:Relativistic Effects, Trends, and Surprises. Phys. Rev. Lett., 89(3), p. 033401, (2002).7, 89
[65] E. M. Fernandez, J. M. Soler, I. L. Garzon and L. C. Balbas. Trends in the structureand bonding of noble metal clusters. Phys. Rev. B, 70(16), p. 165403, (2004). 7, 8
[66] J. Wang, G. Wang and J. Zhao. Density-functional study of Aun (n = 2-20) clusters:Lowest-energy structures and electronic properties. Phys. Rev. B, 66(3), p. 035418,(2002). 7
[67] H. Hakkinen, B. Yoon, U. Landman, X. Li, H.-J. Zhai and L.-S. Wang. On theElectronic and Atomic Structures of Small AuN
- (N = 4 − 14) Clusters: A Photo-electron Spectroscopy and Density-Functional Study. J. Phys. Chem. A, 107(32),p. 6168–6175, (2003). 7
[68] P. Koskinen, H. Hakkinen, B. Huber, B. von Issendorff and M. Moseler. Liquid-Liquid Phase Coexistence in Gold Clusters: 2D or Not 2D? Phys. Rev. Lett., 98(1),p. 015701, (2007). 7
[69] S. Bulusu, X. Li, L.-S. Wang and X. C. Zeng. Evidence of hollow golden cages.Proc. Natl. Acad. Sci. USA, 103(22), p. 8326–8330, (2006). 7, 8
[70] X. Xing, B. Yoon, U. Landman and J. H. Parks. Structural evolution of Au nan-oclusters: From planar to cage to tubular motifs. Phys. Rev. B, 74(16), p. 165423,(2006). 7
[71] S. Bulusu, X. Li, L.-S. Wang and X.C. Zeng. Structural Transitions from Pyramidalto Fused Planar to Tubular to Core/Shell Compact in Gold Clusters: Aun
- (n =21-25). J. Phys. Chem. C, 111(11), p. 4190–4198, (2007). 7
[72] H. W. Kroto, J. R. Heath, S. C. O’Brien, R. F. Curl and R. E. Smalley. C60:Buckminsterfullerene. Nature, 318(6042), p. 162–163, (1985). 7, 25
[73] M. Ji, X. Gu, X. Li, X. Gong, J. Li and L.-S. Wang. Experimental and Theoreti-cal Investigation of the Electronic and Geometrical Structures of the Au32 Cluster.Angew. Chem. Int. Ed., 44(43), p. 7119–7123, (2005). 7
[74] M. P. Johansson, D. Sundholm and J. Vaara. Au32: A 24-Carat Golden Fullerene.Angew. Chem. Int. Ed., 43(20), p. 2678–2681, (2004). 7
[75] X. Gu, M. Ji, S. H. Wei and X. G. Gong. AuN clusters (N = 32, 33, 34, 35): Cagelikestructures of pure metal atoms. Phys. Rev. B, 70(20), p. 205401, (2004). 7
146

Bibliography
[76] Y. Gao and X. C. Zeng. Au42: An Alternative Icosahedral Golden Fullerene Cage.J. Am. Chem. Soc., 127(11), p. 3698–3699, (2005). 7
[77] J. Wang, J. Jellinek, J. Zhao, Z. Chen, R.B. King and P. vonRagueSchleyer. HollowCages versus Space-Filling Structures for Medium-Sized Gold Clusters: The Spheri-cal Aromaticity of the Au50Cage. J. Phys. Chem. A, 109(41), p. 9265–9269, (2005).7
[78] I. L. Garzon, J. A. Reyes-Nava, J. I. Rodrıguez-Hernandez, I. Sigal, M. R. Beltranand K. Michaelian. Chirality in bare and passivated gold nanoclusters. Phys. Rev.B, 66(7), p. 073403, (2002). 7
[79] A. Lechtken, D. Schooss, J. R. Stairs, M. N. Blom, F. Furche, N. Morgner, O. Kostko,B. von Issendorff and M. M. Kappes. Au42
-: A Chiral Gold Cluster? Angew. Chem.Int. Ed., 46(16), p. 2944–2948, (2007). 8
[80] L.-M. Wang, S. Bulusu, H.-J. Zhai, X.-C. Zeng and L.-S. Wang. Doping GoldenBuckyballs: Cu@Au−16 and Cu@Au−17 Cluster Anions. Angew. Chem. Int. Ed., 46,p. 2915–2918, (2007). 8
[81] D. Schooss, M.N. Blom, J.H. Parks, B.v. Issendorff, H. Haberland and M.M. Kappes.The Structures of Ag55
+ and Ag55-: Trapped Ion Electron Diffraction and Density
Functional Theory. Nano Lett., 5(10), p. 1972–1977, (2005). 8
[82] M. N. Blom, D. Schooss, J. Stairs and M. M. Kappes. Experimental structuredetermination of silver cluster ions (Agn
+, 19 ≤ n ≤ 79). J. Chem. Phys., 124(24),p. 244308, (2006). 8
[83] X. Xing, R. M. Danell, I. L. Garzon, K. Michaelian, M. N. Blom, M. M. Burns andJ. H. Parks. Size-dependent fivefold and icosahedral symmetry in silver clusters.Phys. Rev. B, 72(8), p. 081405, (2005). 8
[84] S. Lee, C. Fan, T. Wu and S. L. Anderson. CO Oxidation on Aun/TiO2 CatalystsProduced by Size-Selected Cluster Deposition. J. Am. Chem. Soc., 126(18), p.5682–5683, (2004). 8
[85] M. Haruta. Size- and support-dependency in the catalysis of gold. Catal. Today,36(1), p. 153–166, (1997). 8
[86] T. M. Bernhardt. Gas-phase kinetics and catalytic reactions of small silver and goldclusters. Int. J. Mass spectrom., 243(1), p. 1–29, (2005). 8, 11
[87] M. Valden, X. Lai and D. W. Goodman. Onset of Catalytic Activity of Gold Clusterson Titania with the Appearance of Nonmetallic Properties. Science, 281(5383), p.1647–1650, (1998). 8
[88] A. Cho. Connecting the Dots to Custom Catalysts. Science, 299(5613), p. 1684–1685, (2003). 8
147

Bibliography
[89] A. Lange de Oliveira, A. Wolf and F.i Schuth. Highly selective propene epoxidationwith hydrogen/oxygen mixtures over titania-supported silver catalysts. Catal. Lett.,73(2–4), p. 157–160, (2001). 8
[90] Dong Chan Lim, Ignacio Lopez-Salido and Young Dok Kim. Size selectivity for CO-oxidation of Ag nanoparticles on highly ordered pyrolytic graphite (HOPG). Surf.Sci., 598(1-3), p. 96–103, (2005). 8
[91] Y. D. Kim, M. Fischer and G. Gantefor. Origin of unusual catalytic activities ofAu-based catalysts. Chem. Phys. Lett., 377(1-2), p. 170–176, (2003). 9
[92] Y. D. Kim, G. Gantefor, Q. Sun and P. Jena. Chemisorption of atomic and molecularoxygen on Au and Ag cluster anions: discrimination of different isomers. Chem.Phys. Lett., 396(1-3), p. 69–74, (2004). 10, 62, 92, 130
[93] Q. Sun, P. Jena, Y. D. Kim, M. Fischer and G. Gantefor. Interactions of Au clusteranions with oxygen. J. Chem. Phys., 120(14), p. 6510–6515, (2004). 9, 10, 109, 116,118, 119
[94] D. M. Cox, R. Brickman, K. Creegan and A. Kaldor. Gold clusters: reactions anddeuterium uptake. Zeitschrift fur Physik D Atoms, Molecules and Clusters, 19, p.353–355, (1991). 10
[95] X.i Ding, Z. Li, J. Yang, J. G. Hou and Q. Zhu. Adsorption energies of molecularoxygen on Au clusters. J. Chem. Phys., 120(20), p. 9594–9600, (2004). 10, 120
[96] J. Zhou, Z.-H. Li, W.-N. Wang and K.-N. Fan. Density functional study of theinteraction of molecular oxygen with small neutral and charged silver clusters. Chem.Phys. Lett., 421(4-6), p. 448–452, (2006). 11, 105
[97] L. D. Socaciu, J. Hagen, U. Heiz, T. M. Berhardt, T. Leisner and L. Woste. Ractionmechanism for the oxidation of free silver dimers. Chem. Phys. Lett., 340, p. 282–288, (2001). 11
[98] M. Schmidt, Ph. Cahuzac, C. Brechignac and Hai-Ping Cheng. The stability of freeand oxidized silver clusters. J. Chem. Phys., 118(24), p. 10956–10962, (2003). 11
[99] M. Schmidt, A. Masson and C. Brechignac. Oxygen and Silver Clusters: Transitionfrom Chemisorption to Oxidation. Phys. Rev. Lett., 91(24), p. 243401, (2003). 11
[100] M. L. Kimble, A.W. Castleman, Jr., C. Burgel and V. Bonacic-Koutecky. Inter-actions of CO with AunOm
- (n = 4). Int. J. Mass spectrom., 254(3), p. 163–167,(2006). 11
[101] M. L. Kimble, N. A. Moore, G. E. Johnson, Jr. A. W. Castleman, C. Burgel,R. Mitric and V. Bonacic-Koutecky. Joint experimental and theoretical investi-gations of the reactivity of Au2On
- and Au3On- (n = 1–5) with carbon monoxide.
J. Chem. Phys., 125(20), p. 204311, (2006). 11, 114
148

Bibliography
[102] A. H. Zewail. Femtochemistry, volume I und II. World Scientific Press, Singapur,(1994). 12
[103] H. Petek and S. Ogawa. Femtosecond time-resolved two-photon photoemission stud-ies of electron dynamics in metals. Progress in Surf. Sci., 56(4), p. 239–310, (1997).12, 43
[104] C. Voisin, D. Christofilos, N. Del Fatti, F. Vallee, B. Prevel, E. Cottancin, J. Lerme,M. Pellarin and M. Broyer. Size-Dependent Electron-Electron Interactions in MetalNanoparticles. Phys. Rev. Lett., 85(10), p. 2200–2203, (2000). 12
[105] S. Vajda, C. Lupulescu, A. Merli, F. Budzyn and L. Woste. Observation and The-oretical Description of Periodic Geometric Rearrangement in Electronically ExcitedNonstoichiometric Sodium-Fluoride Clusters. Phys. Rev. Lett., 89(21), p. 213404,(2002). 12
[106] D. M. Neumark. Transition State Spectroscopy. Science, 272, p. 1446–1447, (1996).12
[107] E. Knoesel, A. Hotzel, T. Hertel, M. Wolf and G. Ertl. Dynamics of photoexcitedelectrons in metals studied with time-resolved two-photon photoemission. Surf. Sci.,368(1-3), p. 76–81, (1996). 12, 13, 41, 42, 43
[108] T. Hertel, E. Knoesel, A. Hotzel, M. Wolf and G. Ertl. Ultrafast Electron Dynamicsat Cu(111): Response of an Electron Gas to Optical Excitation. Phys. Rev. Lett.,76(3), p. 535–538, (1996). 12
[109] W. S. Fann, R. Storz, H. W. K. Tom and J. Bokor. Electron thermalization in Gold.Phys. Rev. B, 46(20), p. 13592–13595, (1992). 12, 13, 43, 44
[110] S. Pawlik, M. Bauer and M. Aeschlimann. Lifetime Difference of PhotoexcitedElectrons Between Intraband and Interband Transitions. Surf. Sci., 377–379, p.206–209, (1997). 12
[111] M. Wolf. Femtosecond dynamics of electronic excitations at metal surfaces. Surf.Sci, 377–379, p. 343–349, (1997). 12, 13, 41
[112] W. S. Fann, R. Storz, H. W. K. Tom and J. Bokor. Direct measurement of nonequi-librium electron-energy distributions in subpicosecond laser-heated gold films. Phys.Rev. Lett., 68(18), p. 2834–2837, (1992). 13, 43, 44
[113] J. Bokor, R. Storz, R. R. Freeman and P. H. Bucksbaum. Picosecond Surface Elec-tron Dynamics on Photoexcited Si(111)(2×1) Surfaces. Phys. Rev. Lett., 57(7), p.881–884, (1986). 13
[114] B. J. Greenblatt, M. T. Zanni and D. M. Neumark. Photodissociation Dynamics ofthe I2
- Anion Using Femtosecond Photoelectron Spectroscopy. Chem. Phys. Lett.,258, p. 523–529, (1996). 13
149

Bibliography
[115] B. J. Greenblatt, M. T. Zanni and D. M. Neumark. Photodissociation of I2-(Ar)n
Clusters Studied with Anion Femtosecond Photoelectron Spectroscopy. Science,276, p. 1675–1678, (1997). 13
[116] B. J. Greenblatt, M. T. Zanni and D. M. Neumark. Time-resolved studies of dy-namics in molecular and cluster anions. Faraday Discuss., 108, p. 101–113, (1997).13
[117] B. J. Greenblatt, M. T. Zanni and D. M. Neumark. Femtosecond photoelectronspectroscopy of I2
-(Ar)n clusters (n=6,9,12,16,20). J. Chem. Phys., 111(10), p.566–577, (1999). 13
[118] L. Lehr, M. T. Zanni, C. Frischkorn, R. Weinkauf and D. M. Neumark. Electronsolvation dynamics in finite systems: a femtosecond study of iodine (water)n anionclusters. Science, 284, p. 635–638, (1999). 13, 118
[119] M. T. Zanni, B. J. Greenblatt, A. V. Davies and D. M. Neumark. Photodissociationof gas phase I3
- using femtosecond photoelectron spectroscopy. J. Chem. Phys., 111,p. 2991–3003, (1999). 13
[120] M. T. Zanni, C. Frischkorn, A. V. Davies and D. M. Neumark. Dynamics of thecharge-transfer-to-solvent states in I -(Xe)n clusters. J. Phys. Chem., 104, p. 2527,(2000). 13
[121] A. V. Davis, M. T. Zanni, C. Frischkorn and D. M. Neumark. Time-resolved dy-namics of charge transfer to solvent states in solvated iodide clusers. J. Elec. Spec.Relat. Phenom., 108(1–3), p. 203–211, (2000). 13, 118
[122] B. J. Greenblatt, M. T. Zanni and D. M. Neumark. Femtosecond photoelectronspectroscopy of I2
-(CO2)n clusters (n = 4, 6, 9, 12, 14, 16). J. Chem. Phys., 112, p.601–612, (2000). 13
[123] C. Frischkorn, M. T. Zanni, A. V. Davis and D. M. Neumark. Electron solvationdynamics in I -(NH3)n clusters. Faraday Discuss., 115, p. 439, (2000). 13
[124] A. Kammrath, J. R. R. Verlet, A. E. Bragg, G. B. Griffin and D. M. Neumark.Dynamics of Charge-Transfer-to-Solvent Precursor States in I−(water)(n) (n = 3–10) Clusters Studied with Photoelectron Imaging. J. Phys. Chem. A, 109(50), p.11475–11483, (2005). 13
[125] Jan R. R. Verlet, Aster Kammrath, Graham B. Griffin and Daniel M. Neumark.Electron solvation in water clusters following charge transfer from iodide. J. Chem.Phys., 123(23), p. 231102, (2005). 13
[126] A. Kammrath, J. R. R. Verlet, G. B. Griffin and D. M. Neumark. Photoelectronimaging of large anionic methanol clusters: (MeOH)n
- (n ∼ 70 − 460). J. Chem.Phys., 125(17), p. 171102, (2006). 13
150

Bibliography
[127] A. Kammrath, G. B. Griffin, J. R. R. Verlet, R. M. Young and D. M. Neumark. Time-resolved photoelectron imaging of large anionic methanol clusters: (Methanol)n
- (n∼ 145− 535). J. Chem. Phys., 126(24), p. 244306, (2007). 13
[128] A. E. Bragg, J. R. R. Verlet, A. Kammrath, O. Cheshnovsky and D. M. Neumark.Hydrated Electron Dynamics: From Clusters to Bulk. Science, 306(5696), p. 669–671, (2004). 13
[129] A. E. Bragg, J. R. R. Verlet, A. Kammrath, O. Cheshnovsky and D. M. Neu-mark. Electronic Relaxation Dynamics of Water Cluster Anions. J. Am. Chem.Soc., 127(43), p. 15283–15295, (2005). 13
[130] J. R. R. Verlet, A. E. Bragg, A. Kammrath, O. Cheshnovsky and D. M. Neumark.Time-resolved relaxation dynamics of Hgn
- clusters (11 ≤ n ≤ 16, 18) clusters fol-lowing intraband excitation at 1.5 eV. J. Chem. Phys., 121(20), p. 10015–10025,(2004). 14, 126
[131] A. E. Bragg, J. R. R. Verlet, A. Kammrath, O. Cheshnovsky and D. M. Neumark.Time-resolved intraband electronic relaxation dynamics of Hgn
- clusters (n = 7 −13, 15, 18) excited at 1.0 eV. J. Chem. Phys., 122(5), p. 054314, (2005). 14, 126
[132] G. Gantefor, S. Kraus and W. Eberhardt. Femtosecond photoelectron spectroscopyof the photodissociation of Au3
-. J. Electron. Spectrosc. Relat. Phenom., 88–91, p.35–40, (1998). 14, 15, 16, 18, 126
[133] S. Minemoto, J. Muller, G. Gantefor, H. J. Munzer, J. Boneberg and P. Leiderer.Direct Observation of Electronic Excitations in Molecules and Small Clusters. Phys.Rev. Lett., 84(16), p. 3554–3557, (2000). 16
[134] J. Muller. Silizium- und Kohlenstoffcluster: Struktur und Dynamik. Dissertation,Universitat Konstanz, (2001). 16
[135] M. Allan. Study of triplet states and short-lived negative ions by means of electronimpact spectroscopy. J. Electr. Spec. Relat. Phenom., 48, p. 219–351, (1989). 16
[136] N. Pontius, P.S. Bechthold, M. Neeb and W. Eberhardt. Time-resolved photo-electron spectroscopy on mass-selected metal clusters using a regenerative femtosec-ond amplifier up to 100 Hz. Appl. Phys. B, 71(3), p. 351–356, (2000). 17, 108
[137] N. Pontius, P.S. Bechthold, M. Neeb and W. Eberhardt. Femtosecond multi-photonphotoemission of small transition metal cluster anions. J. Electron. Spectrosc. Relat.Phenom., 106(2–3), p. 107–116, (2000). 17, 108
[138] N. Pontius, P. S. Bechthold, M. Neeb and W. Eberhardt. Ultrafast Hot-ElectronDynamics Observed in Pt3
- Using Time-Resolved Photoelectron Spectroscopy. Phys.Rev. Lett., 84(6), p. 1132–1135, (2000). 17, 79, 108, 126
151

Bibliography
[139] N. Pontius, P. S. Bechthold, M. Neeb and W. Eberhardt. Time-resolved photo-electron spectra of optically excited states in Pd3
-. J. Electron. Spectrosc. Relat.Phenom., 114–116, p. 163–167, (2001). 17, 79, 108, 126
[140] N. Pontius, G. Luttgens, P. S. Bechthold, M. Neeb and W. Eberhardt. Size-dependent hot-electron dynamics in small Pdn
--clusters. J. Chem. Phys., 115(22),p. 10479–10483, (2001). 17, 79, 108, 126
[141] N. Pontius, M. Neeb, W. Eberhardt, G. Luttgens and P. S. Bechthold. Ultrafastrelaxation dynamics of optically excited electrons in N3
-. Phys. Rev. B, 67(3), p.035425, (2003). 17, 79, 108, 126
[142] P. Gerhardt, M. Niemietz, Y. D. Kim and G. Gantefor. Fast electron dynamics insmall aluminum clusters: non-magic behavior of a magic cluster. Chem. Phys. Lett.,382(3-4), p. 454–459, (2003). 17, 18, 87, 89, 126
[143] Y. D. Kim, M. Niemietz, P. Gerhardt, F. v. Gynz-Rekowski and G. Gantefor. Re-laxation dynamics of magic clusters. Phys. Rev. B, 70(3), p. 035421–5, (2004). 17,18, 19, 79, 126
[144] P. W. Gerhardt. Schnelle Relaxation von Clustern. Dissertation, Universitat Kon-stanz, (2004). 17, 60, 61, 126
[145] M. Niemietz. Ultrakurzzeit-Spektroskopie an Nanopartikeln. Diplomarbeit, Univer-sitat Konstanz, (2003). 18, 61, 70, 126
[146] M. Niemietz, P. Gerhardt, G. Gantefor and Y. D. Kim. Relaxation dynamics of theAu3
- and Au6- cluster anions. Chem. Phys. Lett., 380(1-2), p. 99–104, (2003). 18,
19, 79, 87, 126, 129
[147] M. Maier, G. Wrigge, M. Astruc Hoffmann, P. Didier and B. v. Issendorff. Obser-vation of Electron Gas Cooling in Free Sodium Clusters. Phys. Rev. Lett., 96(11),p. 117405, (2006). 19
[148] M. Maier, M. Schatzel, G. Wrigge, M. Astruc Hoffmann, P. Didier and B. V. Is-sendorff. Bulk-like electron-phonon coupling in small free sodium clusters. Int. J.Mass spectrom., 252(2), p. 157–165, (2006). 19
[149] S. Wolf, G. Sommerer, S. Rutz, E. Schreiber, T. Leisner and L. Woste. Spectroscopyof Size-Selected Neutral Clusters: Femtosecond Evolution of Neutral Silver Trimers.Phys. Rev. Lett., 74, p. 4177–4180, (1995). 20, 89
[150] T. Leisner, S. Vajda, S. Wolf, L. Woste and R. S. Berry. The relaxation from linearto triangular Ag3 probed by femtosecond resonant two-photon ionization. J. Chem.Phys., 111, p. 1017–1021, (1999). 20
[151] H. Hess, S. Kwiet, L. Socaciu, S. Wolf, T. Leisner and L. Woste. The influence of theanion vibrational temperature on the fs dynamics in a NeNePo experiment. Appl.Phys. B, 71, p. 337–341, (2000). 20
152

Bibliography
[152] H. Hess, K. R. Asmis, T. Leisner and L.Woste. Vibrational wave packet dynamics inthe silver tetramer probed by NeNePo femtosecond pump-probe spectroscopy. Eur.Phys. J. D, 16, p. 145–149, (2001). 20
[153] A. Przystawik, P. Radcliffe, T. Diederich, T. Doppner, J. Tiggesbaumker and K.-H.Meiwes-Broer. Photoelectron studies of neutral Ag3 in helium droplets. J. Chem.Phys., 126(18), p. 184306, (2007). 20
[154] F. Federmann, K. Hoffmann, N. Quaas and J. P. Toennies. Spectroscopy of extremelycold silver clusters in helium droplets. Eur. Phys. J. D, 9(1-4), p. 11–14, (1999). 20,90
[155] Thomas Diederich, Josef Tiggesbaumker and Karl-Heinz Meiwes-Broer. Spec-troscopy on rare gas–doped silver clusters in helium droplets. J. Chem. Phys.,116(8), p. 3263–3269, (2002). 20
[156] P. Radcliffe, A. Przystawik, T. Diederich, T. Doppner, J. Tiggesbaumker and K.-H. Meiwes-Broer. Excited-State Relaxation of Ag8 Clusters Embedded in HeliumDroplets. Phys. Rev. Lett., 92(17), p. 173403, (2004). 20, 90
[157] C. Felix, C. Sieber, W. Harbich, J. Buttet, I. Rabin, W. Schulze and G. Ertl. Ag8
Fluorescence in Argon. Phys. Rev. Lett., 86(14), p. 2992–2995, (2001). 20, 90
[158] J. Stanzel. Relaxationsprozesse in optisch angeregten Metallclustern. Dissertation,Technische Universitat Berlin, (2007). 20, 21, 79, 126
[159] Ahmed H. Zewail. Laser Femtochemistry. Science, 242(4886), p. 1645–1653, (1988).21
[160] M. J. Rosker, M. Dantus and A. H. Zewail. Femtosecond real-time probing ofreactions. I. The technique. J. Chem. Phys., 89(10), p. 6113–6127, (1988). 21
[161] D. H. Paik, T. M. Bernhardt, N. J. Kim and A. H. Zewail. Femtochemistry of mass-selected negative-ion clusters of dioxygen: Charge-transfer and solvation dynamics.J. Chem. Phys., 115(2), p. 612–616, (2001). 21
[162] P.-Y. Cheng, J. S. Baskin and A. H. Zewail. Cluster Chemistry And DynamicsSpecial Feature: Dynamics of clusters: From elementary to biological structures.Proc. Natl. Acad. Sci. USA, 103(28), p. 10570–10576, (2006). 21
[163] G. Luttgens, N. Pontius, P. S. Bechthold, M. Neeb and W. Eberhardt. Photon-Induced Thermal Desorption of CO from Small Metal-Carbonyl Clusters. Phys.Rev. Lett., 88(7), p. 076102, (2002). 22, 23, 55, 98, 127
[164] M. Neeb, J. Stanzel, N. Pontius, W. Eberhardt, G. Luttgens, P.S. Bechthold andC. Friedrich. Time-resolved photoelectron spectra of Pt2(N2)
-. J. Electron. Spectrosc.Relat. Phenom., 144–147, p. 91–96, (2005). 22, 23, 103, 127
153

Bibliography
[165] L. D. Socaciu-Siebert, J. Hagen, J. Le Roux, D. Popolan, M. Vaida, S. Vajda, T. M.Bernhardt and L. Woste. Ultrafast nuclear dynamics induced by photodetachmentof Ag2
- Ag2O2-: oxygen desorption from a molecular silver surface. Phys. Chem.
Chem. Phys., 7, p. 2706–2709, (2005). 24, 99, 124, 132
[166] N. W. Ashcroft and N. D. Mermin. Festkorperphysik. Oldenbourg, 2. edition, (2005).25
[167] E. Recknagel. Clusterphysik. Fachbereich Physik, Universitat Konstanz, 4th edition,(2005). 25, 27, 28
[168] H. Haberland. Vielteilchen-Systeme. Bergmann-Schafer - Lehrbuch der Experimen-talphysik, chapter 8. Walter de Gruyter, (1992). 25, 55
[169] G. Gantefor and Y. D. Kim. Clusterphysik, Wahlpflichtvorlesung. Lecture Skript,(2005). 25
[170] W. Kratschmer, Lowell D. Lamb, K. Fostiropoulos and Donald R. Huffman. SolidC60: a new form of carbon. Nature, 347, p. 354–358, (1990). 25
[171] N. Bertram, J. Cordes, Y.D. Kim, G. Gantefor, S. Gemming and G. Seifert.Nanoplatelets made from MoS2 and WS2. Chem. Phys. Lett., 418(1-3), p. 36–39,(2006). 25
[172] S. Burkart. Wasserstoff-Chemisorption an Metallclustern. Dissertation, UniversitatKonstanz, (2000). 25
[173] B. Godunov. Buckyball: a C60 molecule. http://www.godunov.com/Bucky/,(2007/07/23). 25
[174] G. Gantefor and W. Eberhardt. Shell structure and s–p hybridization in smallaluminum clusters. Chem. Phys. Lett., 217(5-6), p. 600–604, (1994). 26
[175] D. E. Bergeron, Jr. Castleman, A. W., T. Morisato and S. N. Khanna. Formationof Al13I−: Evidence for the Superhalogen Character of Al13. Science, 304(5667), p.84–87, (2004). 27
[176] D. E. Bergeron, P. J. Roach, Jr. Castleman, A. W., N. O. Jones and S. N. Khanna.Al Cluster Superatoms as Halogens in Polyhalides and as Alkaline Earths in IodideSalts. Science, 307(5707), p. 231–235, (2005). 27
[177] T. Mayer-Kuckuk. Kernphysik. Teubner, 7th edition, (2002). 27
[178] M. Brack. The physics of simple metal clusters: self consistent jellium model andsemiclassical approaches. Rev. Mod. Phys., 65, p. 611–732, (1993). 27
[179] W. D. Knight, K. Clemenger, W. A. de Heer, W. A. Saunders, M. Y. Chou andM. L. Cohen. Electronic Shell Structure and Abundances of Sodium Clusters. Phys.Rev. Lett., 52(24), p. 2141–2143, (1984). 27
154

Bibliography
[180] G. Gantefor. Die Struktur von Nanopartikeln: Experiment und Theorie. In 25. IFF-Ferienkurs “Komplexe Systeme Zwischen Atom und Festkorper”, chapter 5. (1994).28, 30
[181] E. Campbell. Atom cluster. The McGraw-Hill Encyclopedia of Science & Technology.M. D. Lickerl, 9th edition, (2002). 28
[182] H. A. Jahn and E. Teller. Stability of polyatomic molecules in degenerate electronicstates. I. Orbital degeneracy. Proc. R. Soc. London, Ser. A, 161, p. 220–235, (1937).28
[183] K. Clemenger. Ellipsoidal shell structure in free-electron metal clusters. Phys. Rev.B, 32(2), p. 1359–1362, (1985). 28
[184] B. R. Mottelson and S. G. Nilsson. Classification of the Nucleonic States in DeformedNuclei. Phys. Rev., 99(5), p. 1615–1617, (1955). 28
[185] A. Einstein. Uber einen die Erzeugung und Verwandlung des Lichtes betreffendenheuristischen Gesichtspunkt. Annalen der Physik, 17, p. 132, (1905). 30
[186] Nobelprize.org. The Nobel Prize in Physics 1921 .http://nobelprize.org/nobel prizes/physics/laureates/1921/index.html,(2007/04/02). 30
[187] S. Hufner. Photoelectron spectroscopy. Springer, 3. edition, (2003). 30, 33
[188] D. Briggs. Practical Surface Analysis: Auger and X–Ray Photoelectron Spectroscopy.Heyden, London, (1996). 30
[189] H. Handschuh, G. Gantefor and W. Eberhardt. Vibrational spectroscopy of clustersusing a “magnetic bottle” electron spectrometer. Rev. Sci. Instrum., 66(7), p. 3838–3843, (1995). 30, 35, 36, 60, 61, 66, 67
[190] G. Gantefor. Physik der Nanostrukturen - Photoelektronenspektroskopie anmassenseparierten Clustern, volume 29 of Vorlesungsmanuskripte des IFF-Ferienkurses. Holzle, Rainer, Institut fur Festkorperforschung, ForschungszentrumJulich, (1998). 30, 31, 33
[191] J. Berkowitz. Photoabsorption, photoionization and photoelectron spectroscopy.Acad. Pr., (1979). 31, 35
[192] D. Stolcic. Sauerstoff- und Stickstoff-Chemisorption an Metallclustern. Dissertation,Universitat Konstanz, (2003). 32, 62, 67
[193] T. Koopmans. Uber die Zuordnung von Wellenfunktionen und Eigenwerten zu deneinzelnen Elektronen eines Atoms. Physica, 1(1-6), p. 104–113, (1934). 33
155

Bibliography
[194] G. Gantefor. Photoelectron Spectroscopy. In S. N. Khanna and A. W. Castle-man, editors, Quantum Phenomena in Clusters and Nanostructures, Cluster Physics,chapter 3. Springer, Berlin, Heidelberg, New York, (2003). 33, 35, 66
[195] M. Born and R. Oppenheimer. Zur Quantentheorie der Molekeln. Annalen derPhysik, 84(20), p. 457–484, (1927). 34
[196] M. Schubert and G. Weber. Quantentheorie. Spektrum Akademischer Verlag, Hei-delberg, (1993). 34
[197] T. Fischer. Personal communication (2007). 35
[198] J. Franck and E. G. Dymond. Elementary processes of photochemical reactions.Trans. Faraday Soc., 21, p. 536–542, (1926). 36
[199] E. Condon. A Theory of Intensity Distribution in Band Systems. Phys. Rev., 28(6),p. 1182–1201, (1926). 36
[200] A. D. McNaught and A. Wilkinson, editors. IUPAC Compendium of Chemical Ter-minology. IUPAC, 2nd edition, (1997). 36, 39
[201] W. Demtroder. Laserspektroskopie. Springer, 4. edition, (2000). 37
[202] W. Demtroder. Atoms, Molecules and Photons. Springer, (2006). 38
[203] W. Demtroder. Molecular Physics. WILEY-VCH, Weinheim, (2005). 38, 39
[204] J. Michl and V. Bonacic-Koutecky. Electronic Aspects of Organic Photochemistry.John Wiley & Sons, New York, (1990). 38
[205] M. Klessinger and J. Michl. Excited States and Photochemistry of Organic Molecules.VCH, New York, (1995). 38
[206] A. Kuhl and W. Domcke. Multilevel Redfield description of the dissipative dynamicsat conical intersections. J. Chem. Phys., 116(1), p. 263–274, (2002). 38
[207] Wikipedia. Conical Intersections. http://en.wikipedia.org/wiki/Image:PeakedCI.jpg,(2007/08/15). 39
[208] T. Kampfrath. Charge-Carrier Dynamics in Solids and Gases Observed by Time-Resolved Terahertz Spectroscopy. Dissertation, Freie Universitat Berlin, (2005). 40
[209] I. E. Radu. Ultrafast Electron, Lattice and Spin Dynamics on Rare-Earth MetalSurfaces. Dissertation, Freie Universitat Berlin, (2006). 40, 41
[210] S. Wagner. State- and Time-Resolved Investigations of Energy Transfer Mechanismsin Femtosecond-Laser Induced Associative Desorption. Dissertation, Freie Univer-sitat Berlin, (2006). 42, 44, 47, 48, 49
156

Bibliography
[211] D. Pines and P. Nozieres. The theory of quantum liquids. Benjamin, (1966). 41
[212] M. Wolf and M. Aeschlimann. Femtosekunden-Dynamik in Metallen - das kurzeLeben heißer Elektronen. Phys. Bl., 54, p. 145–148, (1998). 41
[213] G. Moos. Zur Dynamik niederenergetischer Elektronen in metallischen Festkorpern.Dissertation, Fachbereich Physik, Freie Universitat Berlin, (2002). 43, 44
[214] M. I. Kaganov, I. M. Lifschitz and L. V. Tanatarov. Relaxation between Electronsand the Crystalline Lattice. Sovjet Physics JETP, 4(2), p. 173–178, (1957). 43
[215] S. I. Anisimov, B. L. Kapeliovich and T. L. Perelman. Electron emission from metalsurfaces exposed to ultrashort laser pulses. Sovjet Physics JETP, 39, p. 375–377,(1974). 43, 44
[216] M. Bonn, D. N. Denzler, S. Funk, M. Wolf, S.-S. Wellershoff and J. Hohlfeld. Ul-trafast electron dynamics at metal surfaces: Competition between electron-phononcoupling and hot-electron transport. Phys. Rev. B, 61(2), p. 1101–1105, (2000). 44
[217] D. N. Denzler. The ultrafast reaction dynamics of hydrogen and interfacial structureof water on the Ru(001)-surface. Dissertation, Freie Universitat Berlin, (2003). 46,51
[218] F. M. Zimmermann and W. Ho. State resolved studies of photochemical dynamicsat surfaces. Surf. Sci. Rep., 22(4-6), p. 127–247, (1995). 45
[219] P. Saalfrank. Quantum Dynamical Approach to Ultrafast Molecular Desorption fromSurfaces. Chem. Rev., 106(10), p. 4116–4159, (2006). 46, 50, 51
[220] M. Bonn, S. Funk, Ch. Hess, D. N. Denzler, C. Stampfl, M. Scheffler, M. Wolf andG. Ertl. Phonon- Versus Electron-Mediated Desorption and Oxidation of CO onRu(0001). Science, 285(5430), p. 1042–1045, (1999). 47
[221] C. Hess, S. Funk, M. Bonn, D. N. Denzler, M. Wolf and G. Ertl. Femtoseconddynamics of chemical reactions at surfaces. Appl. Phys. A, 71(5), p. 477–483, (2000).47
[222] S. Funk. Ultraschnelle Reaktionsdynamik an Oberflachen: Desorption und Oxidationvon CO auf Ru(001) induziert durch Femtosekunden-Laserpulse. Dissertation, FreieUniversitat Berlin, (1999). 47, 48, 50
[223] D. M. Newns, T. F. Heinz and J. A. Misewich. Desorption by Femtosecond LaserPulses: An Electron-Hole Effect? Prog. Theor. Phys. Suppl. 106, 411 (1991), 106,p. 411–418, (1991). 47
[224] F. Budde, T. F. Heinz, A. Kalamarides, M. M. T. Loy and J. A. Misewich. Vibra-tional distributions in desorption induced by femtosecond laser pulses: coupling ofadsorbate vibration to substrate electronic excitation. Surf. Sci., 283, p. 143–157,(1993). 47
157

Bibliography
[225] M. Head-Gordon and J. C. Tully. Molecular dynamics with electronic frictions. J.Chem. Phys., 103(23), p. 10137–10145, (1995). 47
[226] D. Menzel and R. Gomer. Desorption from Metal Surfaces by Low-Energy Electrons.J. Chem. Phys., 41(11), p. 3311–3328, (1964). 50
[227] P. A. Redhead. Interaction of slow electrons with chemisorbed oxygen. Can. J.Phys., 42(5), p. 886–905, (1964). 50
[228] P. R. Antoniewicz. Model for electron- and photon-stimulated desorption. Phys.Rev. B, 21(9), p. 3811–3815, (1980). 50
[229] J. A. Misewich, T. F. Heinz and D. M. Newns. Desorption induced by multipleelectronic transitions. Phys. Rev. Lett., 68(25), p. 3737–3740, (1992). 50
[230] M. Brandbyge, P. Hedegard, T. F. Heinz, J. A. Misewich and D. M. Newns. Electron-ically driven adsorbate excitation mechanism in femtosecond-pulse laser desorption.Phys. Rev. B, 52(8), p. 6042–6056, (1995). 51
[231] J. Arbogast, A. Darmanyan, C. Foote, Y. Rubin, F. Diederich, M. Alvarez, S. Anzand R. L. Whetten. Photophysical properties of C60. J. Phys. Chem., 95(1), p.11–12, (1991). 51
[232] R. W. Haufler, L.-S. Wang, L. P. F. Chinabte, C. Jin, J.Conceicao, Y. Chai andR. E. Smalley. Fullerene triplet state production and decay: R2PI probes of C60 andC70 in a supersonic beam. Chem. Phys. Lett., 179(5-6), p. 449–454, (1991). 51
[233] E. Cavar, M.-C. Blum, M. Pivetta, F. Patthey, M. Chergui and W.-D. Schneider.Fluorescence and Phosphorescence from Individual C60 Molecules Excited by LocalElectron Tunneling. Phys. Rev. Lett., 95(19), p. 196102, (2005). 51
[234] U. Bockelmann and G. Bastard. Phonon scattering and energy relaxation in two-, one-, and zero-dimensional electron gases. Phys. Rev. B, 42(14), p. 8947–8951,(1990). 53
[235] H. Benisty, C. M. Sotomayor-Torres and C. Weisbuch. Intrinsic mechanism for thepoor luminescence properties of quantum-box systems. Phys. Rev. B, 44(19), p.10945–10948, (1991). 53
[236] V. I. Klimov and D. W. McBranch. Femtosecond 1P -to- 1S Electron Relaxation inStrongly Confined Semiconductor Nanocrystals. Phys. Rev. Lett., 80(18), p. 4028–4031, (1998). 53
[237] V. I. Klimov, D. W. McBranch, C. A. Leatherdale and M. G. Bawendi. Electron andhole relaxation pathways in semiconductor quantum dots. Phys. Rev. B, 60(19), p.13740–13749, (1999). 53
158

Bibliography
[238] P. Guyot-Sionnest, M. Shim, C. Matranga and M. Hines. Intraband relaxation inCdSe quantum dots. Phys. Rev. B, 60(4), p. R2181–R2184, (1999). 53
[239] C. Burda, S. Link, M. Mohamed and M. El-Sayed. The Relaxation Pathways ofCdSe Nanoparticles Monitored with Femtosecond Time-Resolution from the Visibleto the IR: Assignment of the Transient Features by Carrier Quenching. J. Phys.Chem. B, 105(49), p. 12286–12292, (2001). 53
[240] U. Woggon, H. Giessen, F. Gindele, O. Wind, B. Fluegel and N. Peyghambarian.Ultrafast energy relaxation in quantum dots. Phys. Rev. B, 54(24), p. 17681–17690,(1996). 53
[241] O. K. Rice and H. C. Ramsperger. Theories of unimolecular gas reactions at lowpressures. J. Amer. Chem. Soc., 49(7), p. 1617–1629, (1927). 54
[242] L. S. Kassel. Studies in Homogeneous Gas Reactions. I. J. Phys. Chem., 32(2), p.225–242, (1928). 54
[243] M. F. Jarrold. Introduction to Statistical Reactio Rate Theories. volume 52 ofChemical Physics, chapter 2.7, p. p. 163–186. Springer, (1994). 54, 55
[244] L. S. Kassel. Studies in Homogeneous Gas Reactions. II. Introduction of QuantumTheory. J. Phys. Chem., 32(7), p. 1065–1079, (1928). 55
[245] G. Luttgens. Photoelektronenspektroskopie an reagierten Metallclustern - Dynamikder Ligandendesorption, elektronische Struktur und Geometrie. Dissertation, Uni-versitat Koln, (2001). 55
[246] R. A. Marcus and O. K. Rice. Session on free radicals. The kinetics of the recombi-nation of methyl radicals and iodine atoms. J. Phys. Chem., 55, p. 894–908, (1951).55
[247] R. A. Marcus. Unimolecular Dissociations and Free Radical Recombination Reac-tions. J. Chem. Phys., 20(3), p. 359–364, (1952). 55
[248] P. F. Moulton. Spectroscopic and laser characteristics of Ti3+ : Al2O3. J. Opt. Soc.Am. B, 3(1), p. 125–133, (1986). 56
[249] D. E. Spence, P. N. Kean and W. Sibbett. 60-fsec pulse generation from a self-mode-locked Ti:sapphire laser. Opt. Lett., 16(1), p. 42–44, (1991). 57
[250] E. P. Ippen and C. V. Shank. Dynamic spectroscopy and subpicosecond pulse com-pression. Applied Physics Letters, 27(9), p. 488–490, (1975). 57
[251] M. Gotz. Zeitaufgeloste Spektroskopie an massenselektierten Clustern. Diplomar-beit, Universitat Konstanz, (2007). 59, 61, 63, 64
[252] K. M. Ervin and W. C. Lineberger. Photoelectron Spectroscopy of Molecular Anions.In Advances in Gas Phase Ion Chemistry, volume 1, p. 121–166. (1992). 60
159

Bibliography
[253] K. M. McHugh, J. G. Eaton, G. H. Lee, H. W. Sarkas, L. H. Kidder, J. T. Snodgrass,M. R. Manaa and K. H. Bowen. Photoelectron spectra of the alkali metal clusteranions: Na-
n=2-5, K-n=2-7, Rb-
n=2-3, Cs-n=2-3. J. Chem. Phys., 91(6), p. 3792–3793,(1989). 60
[254] H. Haberland, M. Karrais, M. Mall and Y. Thurner. Thin films from energeticcluster impact: A feasibility study. J. Vac. Sci. Technol., A, 10(10), p. 3266–3271,(1992). 60, 61
[255] H. Haberland, M. Mall, M. Moseler, Y. Qiang, T. Reiners and Y. Thurner. Fillingof micron-sized contact holes with copper by energetic cluster impact. J. Vac. Sci.Technol., A, 12(5), p. 2925–2930, (1994). 60, 61
[256] R. Dietsche. Elektronenspektroskopie an Nanostrukturen auf Oberflachen. Diplo-marbeit, Universitat Konstanz, (2004). 60
[257] O. Cheshnovsky, S. H. Yang, C. L. Pettiette, M. J. Craycraft and R. E. Smalley.Magnetic time-of-flight photoelectron spectrometer for mass-selected negative clus-ter ions. Rev. Sci. Instrum., 58(11), p. 2131–2137, (1987). 61, 66
[258] M. Engelke. Femtosekundenspektroskopie an massenselektierten Clustern. Diplo-marbeit, Universitat Konstanz, (2005). 61
[259] K. Sattler, J. Muhlbach, A. Reyes-Flotte and E. Recknagel. Adv. Mass. Spectr., 8,p. 1826, (1980). 61
[260] T. G. Dietz, M. A. Duncan, D. E. Powers and R. E. Smalley. Laser production ofsupersonic metal cluster beams. J. Chem. Phys., 74(11), p. 6511–6512, (1981). 61
[261] V. E. Bondybey and J. H. English. Laser excitation spectra and lifetimes of Pb2
and Sn2 produced by YAG laser vaporization. J. Chem. Phys., 76(5), p. 2165–2170,(1982). 61
[262] J. B. Hopkins, P. R. R. Langridge-Smith, M. D. Morse and R. E. Smalley. Supersonicmetal cluster beams of refractory metals: Spectral investigations of ultracold Mo2.J. Chem. Phys., 78(4), p. 1627–1637, (1983). 61
[263] G. Gantefor, H. R. Siekmann, H. O. Lutz and K. H. Meiwes-Broer. Pure metaland metal-doped rare-gas clusters grown in a pulsed ARC cluster ion source. Chem.Phys. Lett., 165(4), p. 293–296, (1990). 61
[264] H. R. Siekmann, Ch. Luder, J. Faehrmann, H. O. Lutz and K. H. Meiwes-Broer.The pulsed arc cluster ion source (PACIS). Z. Phys. D: At., Mol. Clusters, 20, p.417–420, (1991). 61, 62
[265] C.-Y. Cha, G. Gantefor and W. Eberhardt. New experimental setup for photo-electron spectroscopy on cluster anions. Rev. Sci. Instrum., 63(12), p. 5661–5666,(1992). 61, 66
160

Bibliography
[266] Bu. Wrenger and K.-H. Meiwes-Broer. The application of a Wien filter to massanalysis of heavy clusters from a pulsed supersonic nozzle source. Rev. Sci. Instrum.,68(5), p. 2027–2030, (1997). 61, 62
[267] G. Gantefor. Personal communication (2007). 62, 64, 93, 94, 95, 118
[268] Y. D. Kim, D. Stolcic, M. Fischer and G. Gantefor. N2 chemisorption to Wn- nan-
oclusters: molecular versus dissociative chemisorption. Chem. Phys. Lett., 380(3-4),p. 359–365, (2003). 62
[269] T. Leisner. Entwicklung eines Reflektron zur Untersuchung von Microclustern imFlugzeitmassenspektrometer. Laborbericht, Universitat Konstanz, (1986). 64
[270] W. C. Wiley and I. H. McLaren. Time-of-Flight Mass Spectrometer with ImprovedResolution. Rev. Sci. Instrum., 26(12), p. 1150–1157, (1955). 64
[271] T. Lange, T. Bergmann, H. Gohlich, H. Schaber and T. P. Martin. Atom-Cluster.Physik in unserer Zeit, 20(6), p. 172–177, (1989). 65
[272] P. Kruit and F. H. Read. Magnetic field paralleliser for 2 π electronspectrometerand electron-image magnifier. J. Phys. E: Sci. Instrum., 16, p. 313–324, (1983). 66
[273] G. Gantefor, K. H. Meiwes-Broer and H. O. Lutz. Photodetachment spectroscopyof cold aluminum cluster anions. Phys. Rev. A, 37(7), p. 2716–2718, (1988). 66
[274] Spectra Physics. Millennia V: Manual, (1998). 68
[275] Spectra Physics. Tsunami: User’s Manual, (2002). 68
[276] Spectra Physics. Evolution: User Manual; Version 2.2d, (2002). 69
[277] P. Maine, D. Strickland, P. Bado, M. Pessot and G. Mourou. Generation of ultra-high peak power pulses by chirped pulse amplification. IEEE Journal of QuantumElectronics, 24(2), p. 398–403, (1988). 70
[278] Spectra Physics. Spitfire, 50 fs, 1 kHz; Version 2.1, (2002). 70
[279] Exciton. BBQ. http://www.exciton.com/pdfs/bbq.pdf, (2007/02/19). 74
[280] F. Masetti, F. Elisei and U. Mazzucato. Optical study of a large-scale liquid-scintillator detector. J. Lumin., 68(1), p. 15–25, (1996). 74
[281] C. Valli, C. Blondel and C. Delsart. Measuring electron affinities with the photode-tachment microscope. Phys. Rev. A, 59(5), p. 3809–3815, (1999). 94
[282] R. C. Bilodeau, M. Scheer and H. K. Haugen. Infrared laser photodetachment oftransition metal negative ions: studies on IMG, IMG, IMG and IMG. J. Phys. B,31(17), p. 3885–3891, (1998). 94
161
Bibliography
[283] K. M. Ervin, I. Anusiewicz, P. Skurski, J. Simons and W. C. Lineberger. The OnlyStable State of O2
- Is the XΠ2g Ground State and It (Still!) Has an Adiabatic
Electron Detachment Energy of 0.45 eV. J. Phys. Chem. A, 107(41), p. 8521–8529,(2003). 94
[284] K. P. Huber and G. Herzberg. Molecular Spectra and Molecular Structure IV: Con-stants of Diatomic Molecules. Van Nostrand Reinhold, New York, (1979). 102
[285] V. Bonacic-Koutecky, R. Mitric, U. Werner, L. Woste and R. S. Berry. ClusterChemistry And Dynamics Special Feature: Ultrafast dynamics in atomic clusters:Analysis and control. Proc. Natl. Acad. Sci. USA, 103(28), p. 10594–10599, (2006).105
[286] T. Ichino, A.J. Gianola, D.H. Andrews and W.C. Lineberger. Photoelectron Spec-troscopy of AuO- and AuS-. J. Phys. Chem. A, 108(51), p. 11307–11313, (2004).109, 111, 114
[287] V. Dribinski, J. Barbera, J. P. Martin, A. Svendsen, M. A. Thompson, R. Parsonand W. C. Lineberger. Time-resolved study of solvent-induced recombination inphotodissociated IBr-(CO2)n clusters. J. Chem. Phys., 125(13), p. 133405, (2006).114
[288] F. Muntean, M. S. Taylor, A. B. McCoy and W. C. Lineberger. Femtosecond studyof Cu(H2O) dynamics. J. Chem. Phys., 121(12), p. 5676–5687, (2004). 114
[289] K. J. Taylor, C. Jin, J. Conceicao, L.-S. Wang, O. Cheshnovsky, B. R. Johnson, P. J.Nordlander and R. E. Smalley. Vibrational autodetachment spectroscopy of Au6
- :Image-charge-bound states of a gold ring. J. Chem. Phys., 93(10), p. 7515–7518,(1990). 118
[290] W. T. Wallace, A. J. Leavitt and R. L. Whetten. Comment on: The adsorptionof molecular oxygen on neutral and negative AuN clusters (N = 2–5) [Chem. Phys.Lett. 359 (2002) 493]. Chem. Phys. Lett., 368(5–6), p. 774–777, (2003). 120
[291] G. Mills, M. S. Gordon and H. Metiu. The adsorption of molecular oxygen onneutral and negative Aun clusters (n = 2–5). Chemical Physics Letters, 359(5–6),p. 493–499, (2002). 120
[292] B. Yoon, H. Hakkinen and U. Landman. Interaction of O2 with Gold Clusters:Molecular and Dissociative Adsorption. J. Phys. Chem. A, 107(20), p. 4066–4071,(2003). 120
[293] B. Schenkel, R. Paschotta and U. Keller. Pulse compression with supercontinuumgeneration in microstructure fibers. J. Opt. Soc. Am. B, 22, p. 687–693, (2005). 129
[294] G. Steinmeyer and G. Stibenz. Generation of sub-4 fs pulses via compression of awhite-light continuum using only chirped mirrors. Appl. Phys. B, 82, p. 175–181,(2006). 129
162

Bibliography
[295] X. Li, A. Grubisic, S. T. Stokes, J. Cordes, G. F. Gantefor, K. H. Bowen, B. Kiran,M. Willis, P. Jena, R. Burgert and H. Schnockel. Unexpected Stability of Al4H6: ABorane Analog? Science, 315(5810), p. 356–358, (2007). 129
[296] B. Kiran, P. Jena, X. Li, A. Grubisic, S. T. Stokes, G. F. Gantefor, K. H. Bowen,R. Burgert and H. Schnockel. Magic Rule for AlnHm Magic Clusters. Phys. Rev.Lett., 98(25), p. 256802, (2007). 129
[297] O. Kostko, B. Huber, M. Moseler and B. von Issendorff. Structure Determination ofMedium-Sized Sodium Clusters. Phys. Rev. Lett., 98(4), p. 043401–4, (2007). 130
[298] M. C. Debnath, J. X. Shen, E. Shirado, I. Souma, T. Sato, R. Pittini andY. Oka. Temperature and magnetic field effects of transient exciton luminescence inCd1−xMnxTe/Cd1−yMgyTe quantum wells. J. Lumin., 87–89, p. 475–477, (2000).130
163


Danksagung
Die Durchfuhrung meiner Doktorarbeit sowie die Erstellung dieser Dissertation warenohne die Unterstutzung und Mitarbeit von Freunden und Kollegen nicht moglichgewesen. Aus diesem Grund mochte ich mich an dieser Stelle bei allen, die durchihre Unterstutzung zum Gelingen dieser Arbeit beigetragen haben, ganz, ganz her-zlich bedanken, insbesondere bei
meinem Doktorvater, Prof. Dr. Gerd Gantefor fur die Moglichkeit, in seiner Gruppeein sehr interessantes Forschungsprojekt durchfuhren zu durfen. Besonders dankbarbin ich fur seinen Einsatz bezuglich meiner Betreuung, Ausbildung und Forderungwahrend der Doktorarbeit, bei der er mir stets mit Rat und Tat zur Seite stand.
Prof. Dr. Paul Leiderer fur die Erstellung des Zweitgutachtens fur diese Arbeit.
Prof. Dr. Young Dok Kim fur die Unterstutzung bei der Interpretation der experi-mentellen Daten, die fruchtbaren wissenschaftlichen Diskussionen und sein Engage-ment fur die gemeinsamen Veroffentlichungen.
Dr. Kiichirou Koyasu fur die freundschaftliche Zusammenarbeit und seinen uner-mudlichen Einsatz im Labor, bei der Datenauswertung, den“Origin-Unwagbarkeiten”und fur das Erstellen des neuen Datenkonversionsprogramms. Auf diesem Wegewunsche ich noch alles Gute fur die weitere Zukunft in der Wissenschaft.
meinem Vorganger, Dr. Peter Gerhardt fur die Einweisung in die Versuchsapparaturund die freundschaftliche Zusammenarbeit.
Matthias Gotz fur die Unterstutzung beim Umbau des optischen Aufbaus und denMessungen an den Goldoxidclustern, das Korrekturlesen dieser Arbeit und das Kon-struieren der Cluster mit CAD sowie die freundschaftliche Zusammenarbeit.
Markus Engelke fur die Zusammenarbeit bei den Messungen an den Silberclusternund fur die freundschaftliche Atmosphare.
Tim Fischer fur die freundschaftliche Zusammenarbeit bei der Organisation der S3C2005 in Brand, die interessanten Diskussionen querbeet uber alle Lebensbereichesowie das Korrekturlesen dieser Arbeit. Nicht zu vergessen die guten Nussecken von
165
Danksagung
seiner Mum . . .
Jorn Cordes fur das Korrekturlesen dieser Arbeit, insbesondere in sprachlicher Hin-sicht, die Hilfe beim Konstruieren mit CAD, die freundschaftliche Atmosphare unddie Idee mit den Pokerabenden.
den wissenschaftlichen Werkstatten sowie Louis Kukk fur die schnelle Unterstutzungbei Reparaturen und Umbauten.
den Kollegen und “Mitbewohnern” von P9, speziell bei Felix von Gynz-Rekowski,Nils Bertram, Ignacio Lopez-Salido, Dong Chan Lim, Rainer Dietsche, Wilko West-hauser, Tobias Mangler, Karsten Vetter, Moritz Bubek, Thorsten Ketterer, JanHeinen und Christof Walz fur die sehr angenehme und freundschaftliche Atmo-sphare, anregende Diskussionen, gemeinsame Kaffeepausen und die gemeinsamen“Events” wie Joggen, Squash, Pokern, Kart fahren, Fußball-WM schauen . . .
meiner Familie fur die tolle Unterstutzung wahrend meiner gesamten Ausbildung.Dadurch ist diese Promotion erst moglich geworden.
Mirjam fur ihre große Geduld, nervliche Unterstutzung, Trost und Aufmunterung,Ansporn, furs Zuhoren, Korrekturlesen und nicht zuletzt fur die Erkenntnis, dass esdoch Wichtigeres gibt im Leben als Arbeit.
166