three dimensional strain distribution and … · shuswap metamorphic complex. this thesis uses...
TRANSCRIPT

THREE DIMENSIONAL STRAIN DISTRIBUTION AND DEFORMATION TEMPERATURE INTERPRETED FROM
QUARTZ MICROSTRUCTURES AND PETROFABRICS IN THE OKANAGAN VALLEY SHEAR ZONE, SOUTHERN
CANADIAN CORDILLERA
by
Vincent Twomey
B.Sc., University College Cork, 2011
Thesis Submitted in Partial Fulfilment of the
Requirements for the Degree of
Master of Science
in the
Department of Earth Sciences
Faculty of Science
Vincent Twomey 2014
SIMON FRASER UNIVERSITY
Summer 2014

ii
Approval
Name: Vincent Twomey
Degree: Master of Science
Title:
Three dimensional strain distribution and deformation temperature interpreted from quartz microstructures and petrofabrics in the Okanagan Valley shear zone, southern Canadian Cordillera
Examining Committee: Chair: Dr. Andrew Calvert Professor
Dr. Dan Gibson Senior Supervisor Associate Professor
Dr. Dan Marshall Supervisor Professor
Dr. Derek Thorkelson Supervisor Professor
Dr. Laurent Godin Supervisor Adjunct
Dr. Lori Kennedy External Examiner UBC
Date Defended/Approved:
July 18, 2014

iii
Partial Copyright Licence
iv
Abstract
The Eocene Okanagan Valley shear zone (OVsz) is a ~1-1.5 km thick, <30°
west-dipping, extensional, crustal-scale detachment that facilitated exhumation of
the southwestern Shuswap metamorphic complex in the southern Canadian
Cordillera. Kinematic indicators suggest a predominantly top-to-the-WNW sense
of shear with quartz a-axis patterns suggesting general plane strain conditions
with possible constriction in the upper 150m of the shear zone. Deformation
temperatures derived from recrystallization mechanisms and crystallographic
orientations of quartz progressively, yet anomalously rapidly, increase from ~280
to >650 °C down the 1-1.5 km structural section. Higher temperature fabrics
formed at structurally lower levels within the shear zone are interpreted to have
been ‘locked-in’ after migrating out of the progressively narrowing active zone of
deformation during exhumation of the footwall to upper crustal levels. These
fabrics were passively exhumed along a trajectory resulting in their progressive
juxtaposition against lower temperature fabrics being generated in the still active
part of the OVsz higher in the crust.
Keywords: Quartz crystallographic preferred orientations (CPOs); quartz recrystallization mechanisms; deformation temperatures; strain; exhumation; Okanagan Valley shear zone (OVsz); Shuswap metamorphic complex
v
Acknowledgements
I want to thank Dan Gibson for giving me the chance to study in Canada and to
experience life in a new continent. I would also like to thank him for his support for
support, mentorship and academic insight. The exact same can be said for Laurent
Godin. I am also thankful to Derek Thorkelson, Dan Marshall, and Lori Kennedy for
taking the time to make suggestions and provide discussions which helped improve this
thesis.
I am very thankful to Kevin Cameron for the bit of banter and giving me great labs to TA.
Also a very special mention to all the lads at SFU particularly Luke, Ivanka, Flavien,
Jaap, Sarah, Anja, Francesca and many others who have made my time at SFU
enjoyable and great craic altogether. This thesis was initially the product of a few pints to
many back in Ireland with Brendan Murphy and my good friend John Reavy who helped
convince me to give Canada a shot.
I would like to thank Dr. Martin Wong from Colgate University for allowing me to use his
EBSD detector. His knowledge of the software made my life demonstrably easier during
my data collection. Also, cheers to Kyle Larson (UBC-O) for the FA scans. I am also very
appreciative of the staff at the Earth Sciences department of SFU; particularly the
assistance of Glenda, Tarja, Matt and Rodney.
I’d like to give a particularly big shout out to my field assistant Zac for doing a great job,
as well as putting up with me for the guts of an entire Summer, as well as providing m
with some good company when out camping. Special thanks to Andy Okulitch for
sharing his expertise in my study area. Also thanks to Rick Lawton for hitting me up with
some accommodation in the Okanagan. Thanks to all who helped in Kingston too.
My biggest thanks goes out to my Mammy and Daddy as well as my brothers and sister
for their support and motivation while I pursue my studies. This would be by no means
possible without them. I cannot write an acknowledgements section without a special
referral to Hazel for her endless support, motivation and friendship.
vi
Table of Contents
Approval .......................................................................................................................... ii Partial Copyright Licence ............................................................................................... iii Abstract .......................................................................................................................... iv Acknowledgements ......................................................................................................... v Table of Contents ........................................................................................................... vi List of Tables ................................................................................................................. viii List of Figures................................................................................................................. ix
Chapter 1. Introduction to the regional geology of the southeastern Canadian Cordillera, the Okanagan Valley shear zone, and a statement of problems and research objectives ................................... 1
1.1. Introduction ............................................................................................................. 1 1.2. Geology of the southern Canadian Cordillera ......................................................... 2 1.3. The significance of the Okanagan Valley shear zone as an extensional
detachment ............................................................................................................. 5 1.4. Research Objectives ............................................................................................ 14
Chapter 2. Quartz microstructures and petrofabrics of the Okanagan Valley shear zone: Insights into its progressive exhumation from the middle crust ............................................................................ 16
2.1. Abstract ................................................................................................................ 16 2.2. Introduction ........................................................................................................... 17 2.3. Geological setting ................................................................................................. 19 2.4. Geology of the Okanagan Valley shear zone in the vicinity of the Okanagan
Mountain Provincial Park ...................................................................................... 27 2.4.1. Structural and kinematic framework of the Okanagan Valley shear
zone in the vicinity of the Okanagan Mountain Provincial Park ................ 32 2.5. Methodology of microstructural analysis ............................................................... 37
2.5.1. Quartz recrystallization mechanisms ....................................................... 38 2.5.2. Quartz crystallographic preferred orientations ......................................... 39
2.6. Results ................................................................................................................. 43 2.6.1. Microstructures and quartz dynamic recrystallization mechanisms .......... 43
2.6.1.1. Cataclasites and ultramylonites in upper Okanagan Valley shear zone - Domain 1 .............................................................................................. 43
2.6.1.2. Quartz recrystallization mechanisms and microstructures in middle section of the Okanagan Valley shear zone - Domain 2 ................................. 47
2.6.1.3. Quartz recrystallization mechanisms and microstructures near the base of the Okanagan Valley shear zone - Domain 3 ..................................... 49
2.6.2. Quartz crystallographic preferred orientation analysis.............................. 50 2.6.2.1. Quartz crystallographic preferred orientations in the upper section
of the Okanagan Valley shear zone -Domain 1 ............................................... 50 2.6.2.2. Quartz CPO fabrics in the middle section of the Okanagan Valley
shear zone -Domain 2 ..................................................................................... 50 2.6.2.3. Quartz crystallographic preferred orientations in the lower section
of the OVsz - Domain 3 ................................................................................... 53
vii
2.6.2.4. Heterogeneity of crystallographic preferred orientations heterogeneities in microstructural domains ..................................................... 55
2.6.2.5. Comparison between Electron backscatter diffraction and Fabric Analysis ........................................................................................................... 57
2.7. Discussion ............................................................................................................ 58 2.7.1. Three-dimensional distribution of deformation temperatures and
strain in the Okanagan Valley shear zone................................................ 58 2.7.1.1. Variations in deformation temperatures with structural depth .................. 58 2.7.1.2. Interpretation of strain geometry variation with structural depth ............... 61 2.7.1.3. Interpretation of shear sense from c-axis fabrics ...................................... 61
2.7.2. Inferred minimum ages of the quartz deformation structures during exhumation .............................................................................................. 64
2.7.3. Geometrical criteria and flow associated with telescoping of isotherms and exhumation in the immediate footwall of the Okanagan Valley shear zone ................................................................... 66
2.7.4. Implications for exhumation of the Shuswap metamorphic complex and the Channel Flow model ................................................................... 70
2.7.5. Implications regarding discrepancies along strike of the OVsz ................. 71 2.7.6. Formation of late, high angle faults within footwall domain ...................... 75
2.8. Conclusions .......................................................................................................... 76
Chapter 3. Conclusions ........................................................................................... 78
References............... .................................................................................................... 80 Appendix A: Background information on Methodology .......................................... 93 Appendix B: Unprocessed Electron Backscatter Diffraction data ........................ 101 Appendix C: Fabric Analyser data ....................................................................... 116 Appendix D: Supplementary geometric data ....................................................... 121 Appendix E: Late to Post-kinematic volcanism within the Okanagan
Mountain Provincial Park ............................................................... 126
viii
List of Tables
Table 2.1. Scanning electron microscope settings for electron backscatter diffraction analysis at Colgate University, New York ............................... 41
Table 2.2. Summary of the 20 samples selected for quartz microstructural and petrofabric analysis ......................................................................... 44
ix
List of Figures
Figure 1.1. Generalized geological map of the southern Canadian Cordillera ................. 4
Figure 1.2. Simplified present-day west-east crustal cross-section of the southern Canadian Cordillera ................................................................................. 5
Figure 1.3. Geologic map of the study area in the vicinity of the Okanagan mountain provincial Park .......................................................................... 8
Figure 1.4. Conceptualized model showing gravitational collapse as a mode of exhumation of the Shuswap metamorphic complex. ............................... 10
Figure 1.5. Generalized cross-sections of the southern Canadian Cordillera demonstrating potential mid-crustal flow ................................................ 12
Figure 2.1. Generalized geological map of the southern Canadian Cordillera ............... 22
Figure 2.2. Cross-sections of the southern Canadian Cordillera showing potential exhumation modes of the Shuswap metamorphic complex. ................... 26
Figure 2.3. Geologic map of the Okanagan Valley shear zone in the vicinity of the Okanagan Mountain Provincial Park. ..................................................... 29
Figure 2.4. Outcrop photos down structural succession in the northern limb ................. 33
Figure 2.5. Outcrop appearance down structural succession in the southern limb ......... 36
Figure 2.6. Summary of the interpretation and presentation of quartz crystallographic orientations ................................................................... 40
Figure 2.7. Photomicrographs of microstructures of increasing structural depth in the northern limb of the antiform. ............................................................ 46
Figure 2.8. Photomicrographs of microstructures in order of increasing structural depth in the southern limb of the antiform............................................... 48
Figure 2.9. Electron backscatter diffraction and Fabric Analyser quartz c- and a-axis orientations in the northern limb ...................................................... 52
Figure 2.10. Electron backscatter diffraction and Fabric Analyser quartz c- and a-axis orientations in order of increasing structural depth in the southern limb. ........................................................................................ 54
Figure 2.11. Individual microscale domains of quartz c-axis fabrics identified within VT-12-72 acquired using a Fabric Analyser. ................................. 56
Figure 2.12. Schematic diagram showing the apparent relationship between deformation temperatures with respect to structural depth ..................... 59
Figure 2.13. Model showing inferred paleo-isotherms within the study area .................. 63
Figure 2.14. Particle displacement model showing the possible progressive kinematic evolution of the Okanagan Valley shear zone during exhumation ............................................................................................ 69

x
Figure 2.15. Simplified geology map highlighting the inferred corrugations in the footwall ................................................................................................... 73
1
Chapter 1. Introduction to the regional geology of the southeastern Canadian Cordillera, the Okanagan Valley shear zone, and a statement of problems and research objectives
1.1. Introduction
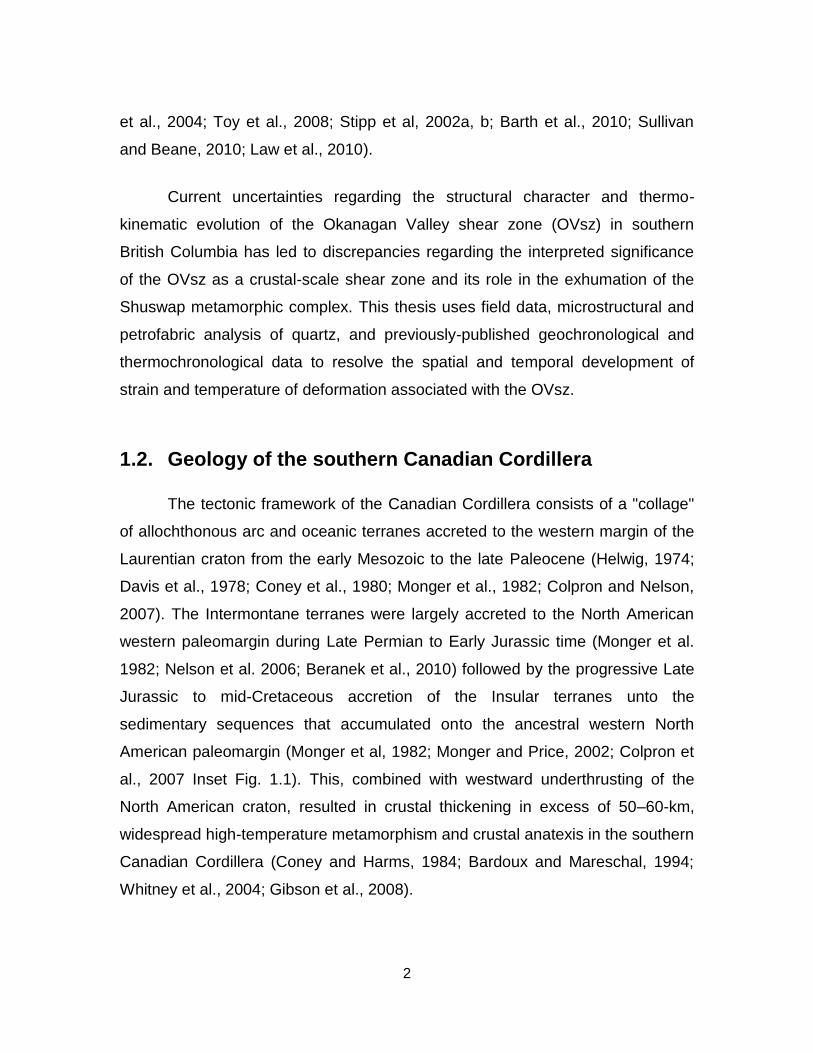
Low-angle extensional brittle-ductile shear zones, which can
accommodate kilometre-scale horizontal crustal stretching, are interpreted to
play a significant role in the exhumation of metamorphic core complexes in the
North American Cordillera (Coney, 1980; Wernicke, 1981; Coney and Harms,
1984; Axen, 2004). A comprehensive examination of the thermo-kinematic
evolution of these shear zones is required to understand processes that
contribute to the exhumation of mid-crustal rocks. Constituent minerals within
mylonitic rocks in ductile shear zones are commonly characterized by
recrystallization textures and steady-state microfabrics, with a consistent grain
size distribution, shape-preferred orientation, and crystallographic preferred
orientation (Passchier and Trouw, 2005). The balance between individual strain-
accommodating processes, petrofabric development and different
recrystallization mechanisms is related to the succession of physical conditions
that accompanied deformation, including temperature, strain rate, strain
geometry, shear sense, grain size and fluid activity (Lister, 1978; Law, 1990; Law
2
et al., 2004; Toy et al., 2008; Stipp et al, 2002a, b; Barth et al., 2010; Sullivan
and Beane, 2010; Law et al., 2010).
Current uncertainties regarding the structural character and thermo-
kinematic evolution of the Okanagan Valley shear zone (OVsz) in southern
British Columbia has led to discrepancies regarding the interpreted significance
of the OVsz as a crustal-scale shear zone and its role in the exhumation of the
Shuswap metamorphic complex. This thesis uses field data, microstructural and
petrofabric analysis of quartz, and previously-published geochronological and
thermochronological data to resolve the spatial and temporal development of
strain and temperature of deformation associated with the OVsz.
1.2. Geology of the southern Canadian Cordillera
The tectonic framework of the Canadian Cordillera consists of a "collage"
of allochthonous arc and oceanic terranes accreted to the western margin of the
Laurentian craton from the early Mesozoic to the late Paleocene (Helwig, 1974;
Davis et al., 1978; Coney et al., 1980; Monger et al., 1982; Colpron and Nelson,
2007). The Intermontane terranes were largely accreted to the North American
western paleomargin during Late Permian to Early Jurassic time (Monger et al.
1982; Nelson et al. 2006; Beranek et al., 2010) followed by the progressive Late
Jurassic to mid-Cretaceous accretion of the Insular terranes unto the
sedimentary sequences that accumulated onto the ancestral western North
American paleomargin (Monger et al, 1982; Monger and Price, 2002; Colpron et
al., 2007 Inset Fig. 1.1). This, combined with westward underthrusting of the
North American craton, resulted in crustal thickening in excess of 50–60-km,
widespread high-temperature metamorphism and crustal anatexis in the southern
Canadian Cordillera (Coney and Harms, 1984; Bardoux and Mareschal, 1994;
Whitney et al., 2004; Gibson et al., 2008).

3
During the Paleocene, the obliquity of convergence between the North
American plate and subducting Kula plate increased due to a change in plate
kinematics. The increased obliquity produced a dextral transtensional regime that
resulted in cessation of crustal contraction and orogenic thickening, and the
initiation of Eocene extensional collapse in the southeastern Canadian Cordillera
(Ewing, 1980; Engebretson et al., 1984; Price and Carmichael, 1986; Parrish et
al., 1988; Harms and Price, 1992; Struik, 1993; Monger and Price, 2002). The
extensional collapse was accompanied by decompression melting and rapid
exhumation of mid-crustal rocks within the overthickened orogenic wedge in
south-central British Columbia and adjacent Washington (Figs 1.1; 1.2; Ewing,
1980; Okulitch, 1984; Tempelman-Kluit and Parkinson, 1986; Johnson and
Brown, 1996; Johnson, 2006). Eocene exhumation was primarily facilitated by a
system of crustal-scale, north-south striking normal sense detachment faults and
shear zones (Ewing, 1980; Okulitch, 1984; Johnson and Brown, 1996; Parrish et
al., 1988). Two of the crustal detachments include the west-side-down Okanagan
Valley shear zone (OVsz) and the east-side-down Columbia River fault defining
the western and eastern boundaries of the southern Shuswap metamorphic
complex, respectively (Figs 1.1; 1.2; Templeman-Kluit and Parkinson, 1986;
Parrish et al., 1988; Johnson and Brown, 1996; Brown et al, 2012).
4
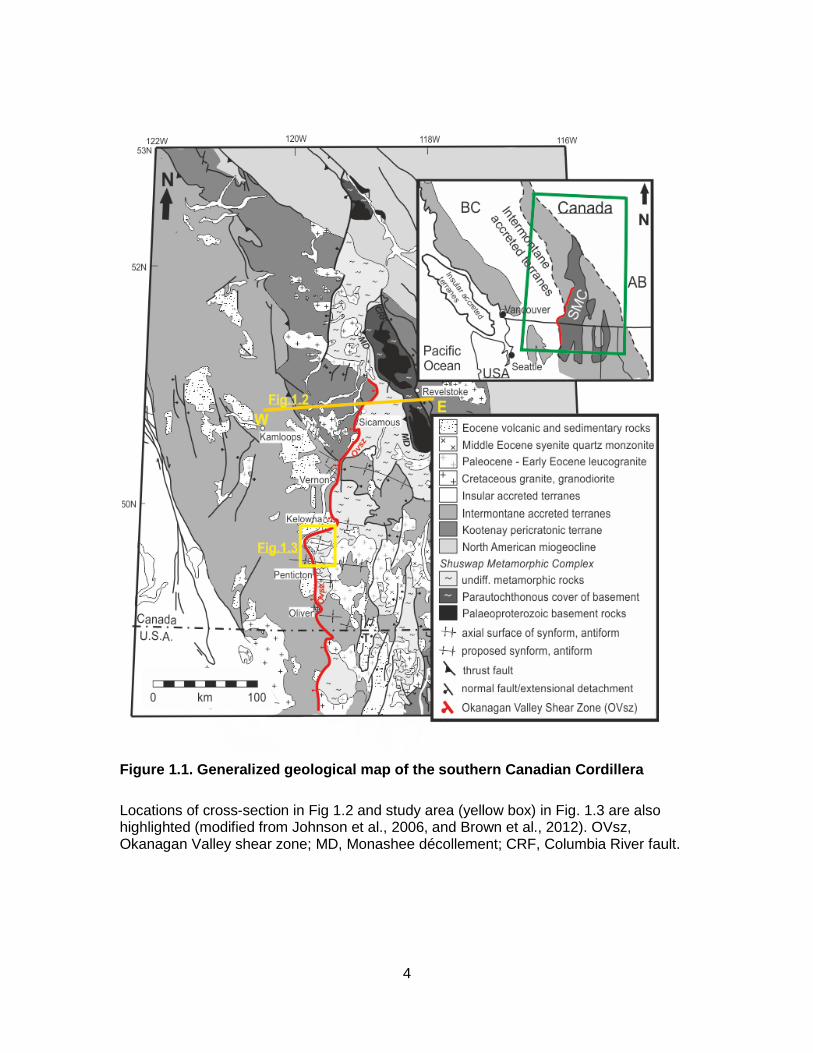
Figure 1.1. Generalized geological map of the southern Canadian Cordillera
Locations of cross-section in Fig 1.2 and study area (yellow box) in Fig. 1.3 are also highlighted (modified from Johnson et al., 2006, and Brown et al., 2012). OVsz, Okanagan Valley shear zone; MD, Monashee décollement; CRF, Columbia River fault.
5
1.3. The significance of the Okanagan Valley shear zone as an extensional detachment
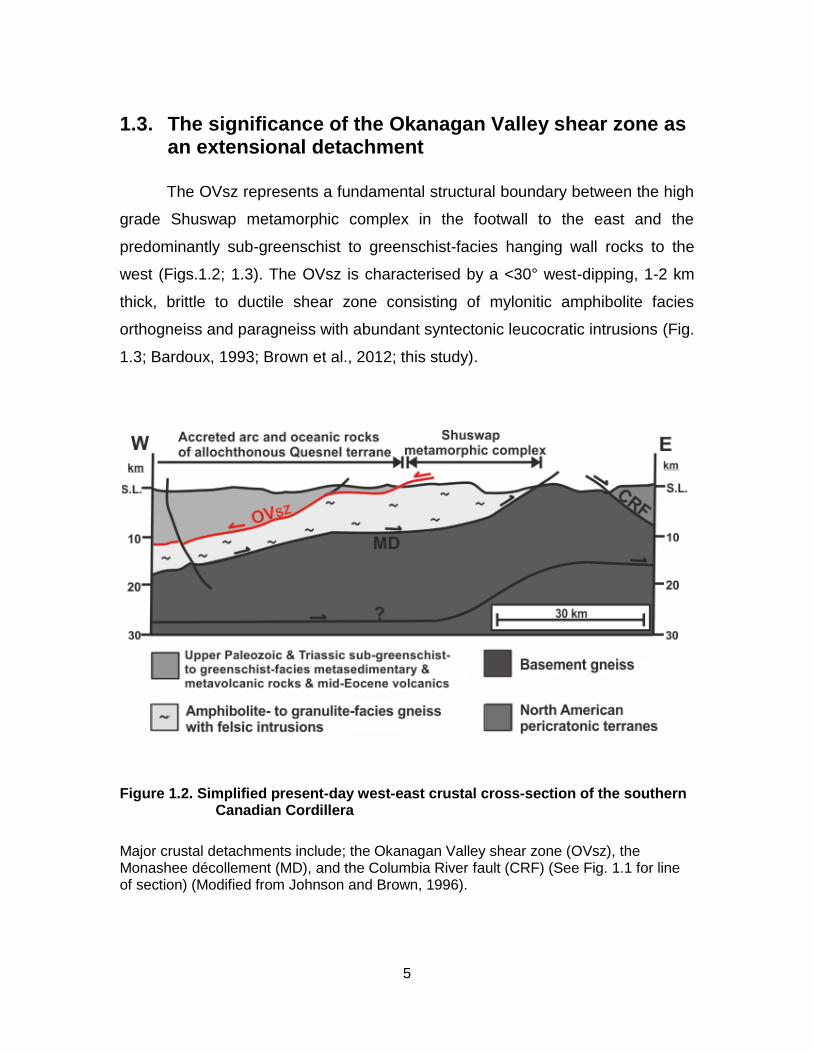
The OVsz represents a fundamental structural boundary between the high
grade Shuswap metamorphic complex in the footwall to the east and the
predominantly sub-greenschist to greenschist-facies hanging wall rocks to the
west (Figs.1.2; 1.3). The OVsz is characterised by a <30° west-dipping, 1-2 km
thick, brittle to ductile shear zone consisting of mylonitic amphibolite facies
orthogneiss and paragneiss with abundant syntectonic leucocratic intrusions (Fig.
1.3; Bardoux, 1993; Brown et al., 2012; this study).
Figure 1.2. Simplified present-day west-east crustal cross-section of the southern Canadian Cordillera
Major crustal detachments include; the Okanagan Valley shear zone (OVsz), the Monashee décollement (MD), and the Columbia River fault (CRF) (See Fig. 1.1 for line of section) (Modified from Johnson and Brown, 1996).
6
Footwall rock types consist of amphibolite- to granulite-facies gneisses
and abundant leucocratic intrusions (Figs.1.1; 1.2). These rocks contain a
penetrative ductile fabric characterized by a shallowly dipping foliation,
interpreted to be the result of the Early Jurassic to early Paleogene contraction
and orogenic thickening (Figs.1.1; 1.2; Price and Mountjoy, 1970; Brown and
Journeay, 1987; Parrish et al., 1988; Johnson and Brown, 1996; Gibson et al.,
2005; 2008). Paleozoic to Early Triassic sub-greenschist to greenschist facies
metasedimentary and metavolcanic rocks, along with local Eocene volcanic and
sedimentary sequences and unconformably overlying stratified syn-extensional
half graben basins are found in the hanging wall west of the OVsz (Fig.1.2; 1.3;
Tempelman-Kluit and Parkinson, 1986: McClaughry and Gaylord, 2005; Brown et
al., 2012). The steep metamorphic gradient and disparity in argon cooling ages
exhibited across the trace of the OVsz, and the degree of anatectic Eocene
melting, ductile deformation and mylonitization within the footwall gneiss readily
demonstrate that the exhumation of mid-crustal footwall rocks was achieved
through lithospheric extension (Bardoux and Mareschal, 1994; Johnson and
Brown, 1996; Brown et al., 2012).
The base of the OVsz is marked by undeformed granitoid plutons and
gneissic units (Bardoux, 1993; Brown et al., 2012; this study). Top-to-the-WNW
solid-state deformation fabrics increase in intensity up the structural section
grading from penetratively deformed amphibolite facies orthogneiss and
paragneiss to greenschist-facies mylonite and cataclasite within the uppermost
part of the shear zone (Fig. 1.3). Previous studies have characterized the
detachment system as a brittle-ductile shear zone >1 km thick in many places
overprinted by a brittle detachment at the top, thus referring to the system as the
Okanagan crustal shear (Tempelman-Kluit and Parkinson, 1986) or Okanagan
Valley fault (Parrish et al., 1988 and references therein). In this study, we
continue with the terminology proposed by Brown (2010) and Brown et al. (2012)
choosing to refer to the detachment system as the Okanagan Valley shear zone

7
(OVsz), since it is a km’s thick distributed shear zone that includes both the brittle
and ductile fabric components.
8
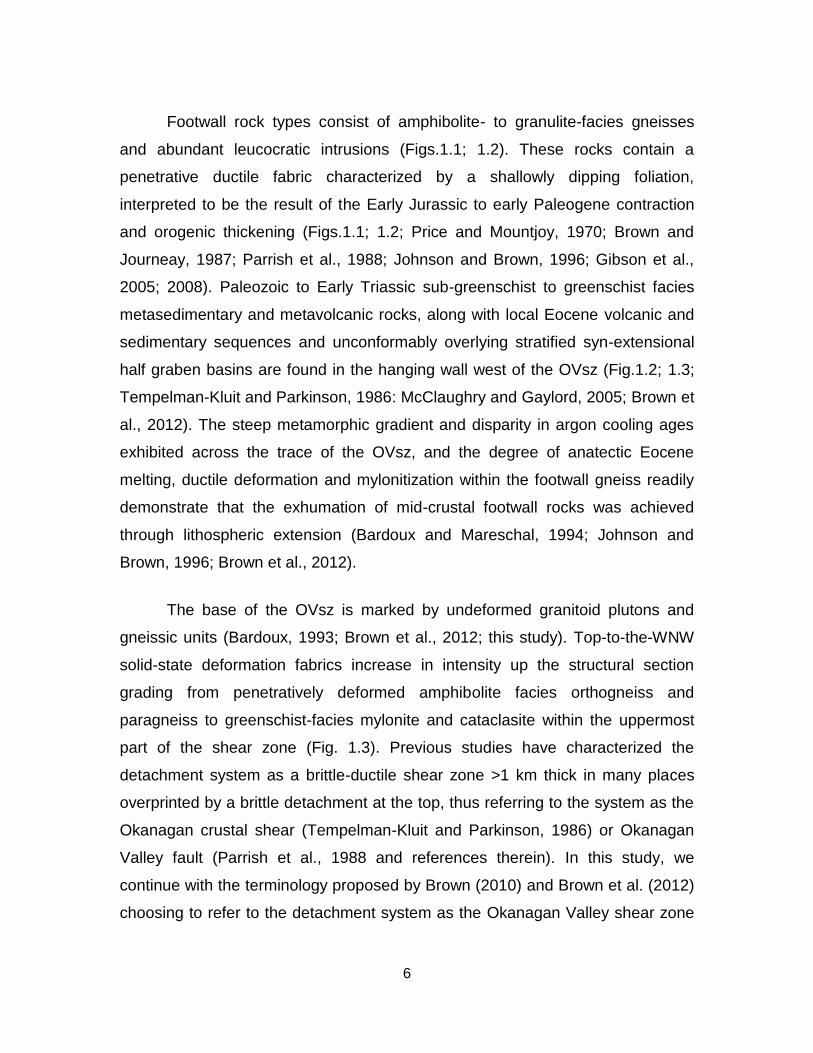
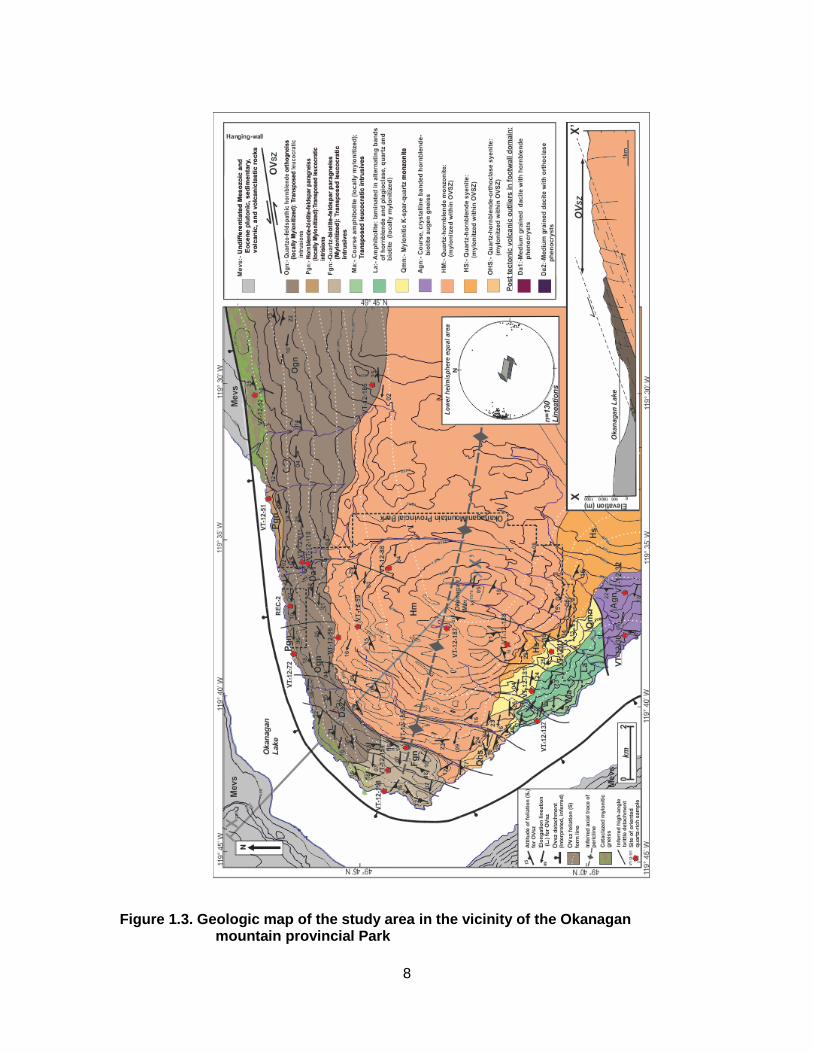
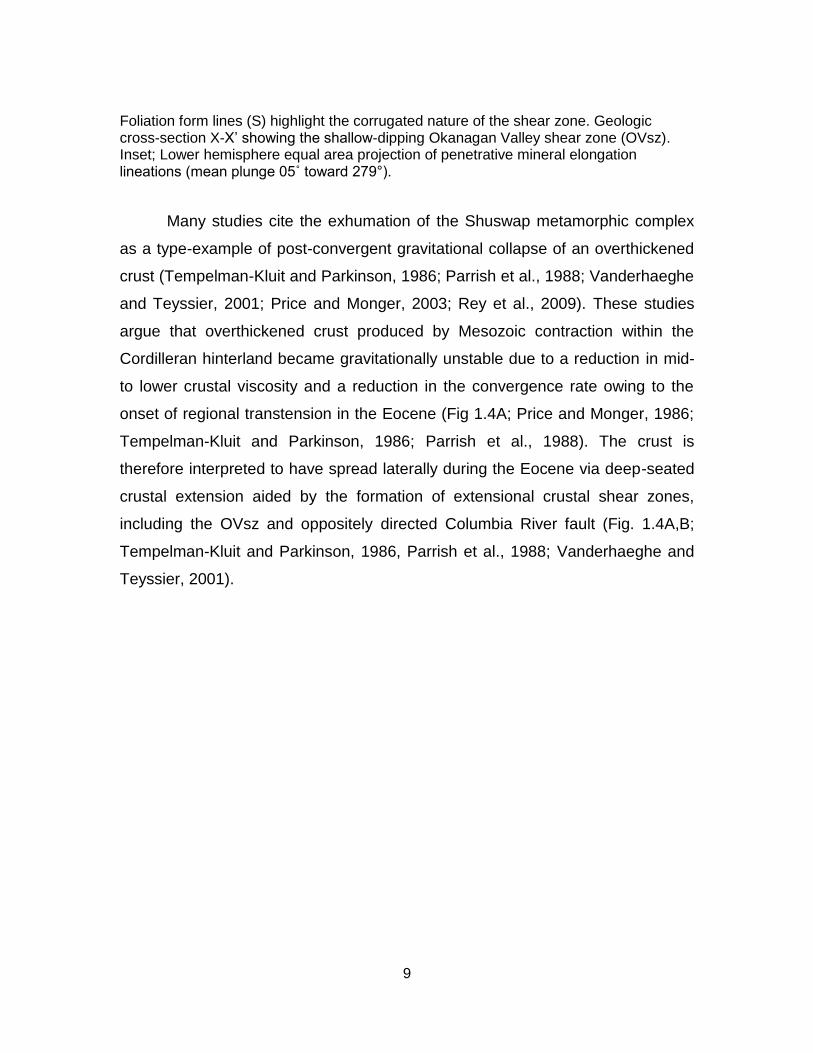
Figure 1.3. Geologic map of the study area in the vicinity of the Okanagan mountain provincial Park
9
Foliation form lines (S) highlight the corrugated nature of the shear zone. Geologic cross-section X-X’ showing the shallow-dipping Okanagan Valley shear zone (OVsz). Inset; Lower hemisphere equal area projection of penetrative mineral elongation lineations (mean plunge 05˚ toward 279°).
Many studies cite the exhumation of the Shuswap metamorphic complex
as a type-example of post-convergent gravitational collapse of an overthickened
crust (Tempelman-Kluit and Parkinson, 1986; Parrish et al., 1988; Vanderhaeghe
and Teyssier, 2001; Price and Monger, 2003; Rey et al., 2009). These studies
argue that overthickened crust produced by Mesozoic contraction within the
Cordilleran hinterland became gravitationally unstable due to a reduction in mid-
to lower crustal viscosity and a reduction in the convergence rate owing to the
onset of regional transtension in the Eocene (Fig 1.4A; Price and Monger, 1986;
Tempelman-Kluit and Parkinson, 1986; Parrish et al., 1988). The crust is
therefore interpreted to have spread laterally during the Eocene via deep-seated
crustal extension aided by the formation of extensional crustal shear zones,
including the OVsz and oppositely directed Columbia River fault (Fig. 1.4A,B;
Tempelman-Kluit and Parkinson, 1986, Parrish et al., 1988; Vanderhaeghe and
Teyssier, 2001).

10
Figure 1.4. Conceptualized model showing gravitational collapse as a mode of exhumation of the Shuswap metamorphic complex.
(A) Crustal thickening during W-E compression in the Mesozoic resulted in significant crustal thickening in the Cordilleran hinterland. (B) With time, partial melting ensues in the mid-crust and W-E compression eases during Late Cretaceous to Paleocene time. (C) Post-compressional gravitational collapse (peach arrow) of the overthickened crust is initiated during the Paleocene to Eocene with oppositely verging, extensional, low-angle detachments, including the Okanagan Valley shear zone, facilitating exhumation of the mid-lower crust.
11
In contrast, several studies have interpreted the OVsz to represent the
high strain upper boundary of a channelized mid-crustal ductile flow zone
(Fig.1.4; Johnston et al., 2000; Brown and Gibson, 2006; Glombick et al., 2006;
Gervais and Brown, 2011). The channel flow model involves lateral flow of a
relatively low viscosity, weak crustal layer between stronger bounding layers
(Godin et al., 2006; Grujic, 2006). East of the OVsz, within the Shuswap
metamorphic complex, orogen-normal Poiseuille flow (i.e. where flow in a layer is
fastest in the middle and decreases towards the margins; see Godin et al., 2006)
is interpreted to have operated in a ~10 km-thick channel that was decoupled
contemporaneously from its lid, the hanging wall of the OVsz, and base, the
footwall of the thrust-sense Monashee décollement (Fig. 1.4; Brown and Gibson,
2006). The OVsz has therefore been interpreted to represent the normal-sense
top of a Cretaceous to early Paleogene mid-crustal channel, reactivated during
Eocene extension (Fig. 1.4; Brown and Gibson, 2006; Gervais and Brown, 2011).
The coeval development of sub-parallel opposite-sense structures at the top and
bottom of the channel is required by the channel flow model (Grujic, 2006).
Previous studies have documented 55–49 Ma east-propagating contractional
structures in the lower levels of the Shuswap metamorphic and Monashee
complexes (i.e., base of channel) and similarly-aged top-to-the-west extensional
structures within the OVsz, the inferred upper boundary of the channel (Johnson
and Brown, 1996; Brown and Gibson, 2006).

12
Figure 1.5. Generalized cross-sections of the southern Canadian Cordillera demonstrating potential mid-crustal flow
(A) A potential Late Cretaceous–Paleocene configuration of mid-crustal channel prior to extensional faulting and (B), the present-day geometry. The middle-crustal layer is interpreted to have been a zone of channel flow in the Late Cretaceous to early Paleogene with the OVsz (highlighted in red) and the Monashee décollement (MD) acting as the upper and lower boundaries, respectively. CRF, Columbia River fault; MC, Monashee complex; SDF, Selkirk detachment fault (Modified from Brown and Gibson 2006).
Regardless of whether or not channel flow was involved, most workers
agree that the OVsz is a crustal-scale detachment facilitating tens of kilometres
of displacement. Tempelman-Kluit and Parkinson (1986) estimated 60-90 km of
horizontal extension based on correlation of Eocene volcanic outliers in the
hanging wall with their inferred Eocene “plutonic root”, the Coryell syenite, in the
footwall. Bardoux (1993) used palinspastically-restored cross sections to
determine 45-70 km of displacement in the Kelowna area. Farther north, Johnson

13
and Brown (1996) estimated ~32 km of displacement also using palinspastic
restoration. Brown et al. (2012) estimated 64-89 km of displacement based on
geometric and thermobarometric arguments.
Conversely, the hypothesis that the OVsz is a major crustal-scale
detachment has been challenged by studies in the Vernon area (Fig. 1.1;
Thompson and Unterschutz 2004; Glombick et al., 2006a). Middle Eocene
volcanic and sedimentary hanging wall rocks have been mapped across the
trace of the OVsz and are interpreted to sit unconformably on the high-grade
metamorphic footwall rocks of the Shuswap metamorphic complex in a series of
semi-continuous Eocene outliers (Glombick et al., 2006a). The continuity of
hanging wall stratigraphy across the trace of the shear zone is interpreted to
suggest that the Shuswap metamorphic complex was not exhumed by crustal-
scale detachments (Glombick et al., 2006a). An alternative channel flow model is
proposed by Glombick et al. whereby partial melting of the middle crust in the
Late Cretaceous to early Paleogene resulted in the development of a channel of
ductile flow that was underthrust by a crustal-scale ramp and exhumed from
depths of 20–30 km by vertical thinning. Consequently, a substantial attenuation
of metamorphic isograds across low-angle detachments such as the OVsz
resulted. However, this model does not factor in the open, upright, km-scale
corrugations found along the trace of the OVsz (Fig. 1.1; Brown, 2010). These
structures plunge at about 15° to the west-northwest parallel to the previously
inferred stretching direction and are interpreted to have formed syn-extension
rather than during a later folding event (Christie, 1973; Ross, 1981; Bardoux,
1993; Brown, 2010). These corrugations are common in extensional shear zones
(Whitney et al., 2013) and are strongly correlated with occurrences of
metamorphic core complexes, suggesting a genetic link between the two
(Singleton, 2012). The corrugations model can explain the semi-continuous
nature of hanging wall units across the shear zone, in that they are preserved as
'islands' on top of the footwall domain within synformal keels of the corrugations.

14
Many questions remain regarding the deformational processes associated
with the development of the OVsz and its overall role in the exhumation of the
Shuswap metamorphic complex. In particular, no work has been done that
documents the deformation mechanisms and the style of flow that characterize
different structural levels of the OVsz and its three-dimensional strain geometry,
which is the focus of this study.
1.4. Research Objectives
This study aims to elucidate the thermo-kinematic evolution of the OVsz in
the vicinity of Okanagan Mountain Provincial Park in southeastern British
Columbia where the complete thickness of the shear zone is exposed. This
research focuses on the following questions:
1. What is the strain state and temperature of deformation of the OVsz in the
study area?
2. Are there variations in deformation temperature, shear strain deformation
mechanisms down structural succession of the shear zone?
3. Can the data contribute to our understanding of the deformation
processes involved with the exhumation of rocks from mid- to lower crustal
depths along low angle extensional shear zones such as the OVsz?
These questions are addressed through detailed 1:10 000 scale mapping
of lithology and structures across the OVsz in the vicinity of the Okanagan
Mountain Provincial Park (Fig.1.3). Field mapping was carried out over a period
of two months during the summer of 2012. A representative suite of quartz-rich
oriented samples was collected throughout the field area across the entire
structural section of the OVsz. The geological map and structural measurements
serve as the framework to establish the 3-dimensional macro- to microstructural
15
characterization of the shear zone. Deformation temperatures, strain geometry,
and the style of strain across the OVsz within study area are constrained using
quartz microstructures and petrofabrics acquired across the entire thickness of
the shear zone. Thin sections orientated perpendicular to the foliation and
parallel to the lineation were examined to investigate mineral assemblages,
deformational fabrics, shear sense indicators and quartz and applicable feldspar
recrystallization mechanisms. Quartz crystallographic preferred orientations
(CPO) in several thin sections were analysed using a combination of the Fabric
Analyser (FA) technique (e.g. Wilson et al., 2003; 2007) and Electron backscatter
diffraction analyses (EBSD) (e.g. Prior et al., 1999; 2009) using a scanning
electron microscope at Colgate University, New York.
Results, interpretations, conclusions and outstanding issues related to this
study are presented in Chapter 2 and Appendices A through E. Chapter 2
describes the geology and kinematics of the OVsz in the study area and is
written with the intent to be submitted as a stand-alone manuscript to the Journal
of Structural Geology. This chapter also integrates the results and conclusions
from this thesis with previous studies to formulate a regional tectonic model for
the OVsz. Chapter 3 presents a brief summary of the conclusions derived from
this study.
16
Chapter 2. Quartz microstructures and petrofabrics of the Okanagan Valley shear zone: Insights into its progressive exhumation from the middle crust
2.1. Abstract
Quartz recrystallization mechanisms and quartz crystallographic preferred
orientations (CPOs) are used to examine the thermo-kinematic evolution of a
mylonite zone associated with the extensional Okanagan Valley shear zone
(OVsz) in the southern Canadian Cordillera. The north-south striking, <30° west-
dipping OVsz forms the southwestern margin of the Shuswap metamorphic
complex, which consists of variably mylonitized orthogneiss and paragneiss, and
transposed leucocratic intrusions over an approximate 1-1.5 km thick structural
section. The ductile fabric is partially overprinted by brittle fractures towards the
structural top of the shear zone as the footwall was progressively exhumed
during Eocene extension. A top-to-the-WNW sense of shear is interpreted from
both meso- and micro-shear-sense indicators. Quartz a-axis patterns suggest
plane strain deformation with slight constriction in the upper 150 m of the
structural section. Quartz microstructures and quartz c-axis fabric data suggest
deformation temperatures progressively and rapidly increase downward from
~280°C to >650 °C over the 1-1.5 km of structural section. A simplified geometric
particle path model demonstrates how penetrative non-coaxial flow along
detachment-parallel flow planes in predominantly plane strain deformation could

17
result in this significant telescoping of originally horizontal isotherms during
progressive exhumation. This model involves a scenario where deformation
fabrics in structurally lower rocks with originally higher deformation temperatures
were ‘locked-in’ as they migrated out of the active zone of deformation during
exhumation of the footwall to upper crustal levels. These locked-in higher
temperature fabrics were passively exhumed along an ESE trajectory that
resulted in their progressive juxtaposition beneath lower temperature fabrics that
were being generated in the narrowing active part of the WNW-directed shear
zone in higher crustal levels.
2.2. Introduction
Microstructures and petrofabric textures in plastically deformed quartz can
be utilized to interpret deformation temperatures, strain rate, non-coaxiality of
flow and distortional strain geometry in exhumed shear zones (Lister, 1978; Law,
1990; Stipp et al, 2002a,b; Law et al., 2004; Toy et al., 2008; Barth et al., 2010;
Sullivan and Beane, 2010; Law et al., 2010). The quartzo-feldspathic mylonites in
the immediate footwall of the Okanagan Valley shear zone (OVsz; Brown et al.
2012) provide an opportunity to constrain deformation parameters by combining
analysis of dynamic recrystallization mechanisms and crystallographic preferred
orientations (CPOs) of quartz. The OVsz is a north-south striking, 1-2 km-thick,
shallow west-dipping, ductile to brittle shear zone interpreted to have played a
significant role in the Eocene exhumation of the southern Shuswap metamorphic
complex in the southeastern Canadian Cordillera (Parkinson, 1985; Tempelman-
Kluit and Parkinson, 1986; Parrish et al., 1988; Bardoux, 1993; Johnson and
Brown, 1996; Brown et al., 2012).
Previous studies of the OVsz have focused on mapping of rock units and
structures, and constraining the pressure temperature-time (P-T-t) path of the
shear zone utilizing U-Pb age analysis and conventional 40Ar/ 39Ar
18
geothermobarometry (Tempelman-Kluit and Parkinson, 1986; Parrish et al.,
1988; Bardoux, 1993; Johnson and Brown, 1996; Glombick et al. 2006a; Brown
et al., 2012). However, a rigorous quantitative three-dimensional strain analysis
has yet to be carried out on the OVsz. Such a study can provide constraints on
the rheological evolution and finite strain development of the shear zone.
Acquisition of such data may also help determine possible deformation
processes that operated during the evolution and exhumation of the OVsz from
mid-crust. In turn, these insights can be applied to other similar crustal-scale
shear zones.
In this study, quartz recrystallization mechanisms and CPO patterns are
analysed in terms of dislocations at the atomic-scale, with the latter based on the
activation of different intracrystalline slip systems (Passchier and Trouw, 2005).
These features are sensitive to variations in temperature, imposed strain path or
kinematic framework, and magnitude and symmetry of finite strain (Schmid and
Casey 1986; Law, 1990; Passchier and Trouw, 2005). Consequently, these
methods are commonly utilized in characterizing the thermo-kinematic evolution
of exhumed shear zones (e.g. Xypolias and Koukouvelas, 2001; Law et al., 2004;
2010; 2011; 2013; Sullivan and Law, 2007; Toy et al., 2008; Barth et al., 2010).
For example, an observed quartz recrystallization and CPO temperature increase
down the structural succession of the OVsz may be indicative of a simple,
evolving extensional shear zone model proposed in several metamorphic core
complexes in the North American Cordillera (Reynolds 1982, Lister & Davis
1983, Lister et al., 1984a.b, Wernicke 1985). In such a model, mylonites that
formed at relatively deeper crustal levels move structurally upward during
tectonic denudation and are overprinted by lower temperature fabrics and
recrystallization mechanisms. Alternatively, Toy et al. (2008) argue that
preservation of relatively-high temperature CPO fabrics towards the structural top
of a shear zone may imply intense localization of shear strain at deeper crustal
depths. If this were the case, intense strain localization could result in

19
preservation of higher temperature fabrics despite being exhumed through cooler
parts of the crust as few grains would be suitably orientated for lower
temperature fabrics to develop. Farther from this localized zone, where shear
strain was less intense, fabrics would be more likely to be modified at shallower
crustal levels during exhumation.
In this paper, new data are presented that constrain the deformation
temperatures and strain within the OVsz. The data were collected in and around
the vicinity of the Okanagan Mountain Provincial Park in southern British
Columbia, where a complete three-dimensional exposure of the OVsz facilitates
detailed structural and lithological mapping of the shear zone. Deformation
temperatures are inferred from quartz microstructures and quartz c-axis fabrics
derived from electron backscatter diffraction (EBSD) and fabric analysis (FA).
Strain geometry is interpreted from quartz a-axis fabrics provided by EBSD
analysis. The data were used to investigate the deformation conditions and type
of flow during exhumation of the OVsz using a simplified geometric particle path
model. These new data provide an opportunity to investigate the flow process
that occurred during the development and exhumation of the OVsz.
2.3. Geological setting
The Shuswap metamorphic complex is the largest core complex in the
North American Cordillera, representing a large part of the exhumed
metamorphic core of the southern Canadian Cordillera (Coney, 1980; Coney and
Harms, 1984; Okulitch, 1984, Parrish et al., 1988, Vanderhaeghe et al., 2003;
Gibson et al., 2008). The Shuswap metamorphic complex consists of a series of
domal culminations that expose penetratively-deformed amphibolites- to
granulite-facies gneisses and granitic intrusions within southern British Columbia
and northeastern Washington (Fig. 2.1, Ewing, 1980; Armstrong, 1982; Okulitch,
1984; Brown and Carr, 1990; Brown et al., 2012). The metamorphic peak of the
20
Shuswap metamorphic complex corresponds to a period of crustal thickening in
excess of 55 km in the southern Canadian Cordillera during the Mesozoic and
earliest Paleogene (Price and Mountjoy, 1970; Brown et al., 1986; Parrish et al.,
1988; Brown and Gibson, 2006; Gibson et al., 2008). This crustal thickening was
in part due to the accretion and obduction of arc and oceanic terranes along the
ancestral western margin of North America coincident with the westward
migration of the continent (Monger et al., 1982; Monger and Price, 2002). Deeply
buried parts of the Shuswap metamorphic complex were exhumed to upper
crustal levels during the Eocene (Tempelman-Kluit and Parkinson, 1986; Parrish
et al., 1988; Parrish 1995) in response to a change from transpression to
transtension between the North American and Pacific plates during the
Paleogene (Ewing, 1980; Price and Carmichael, 1986; Monger and Price, 2002).
Eocene crustal extension accommodated by structures such as the OVsz
juxtaposed the high grade rocks of the Shuswap metamorphic complex to the
east with lower metamorphic grade arc-related terranes to the west (Ewing,
1980; Tempelman-Kluit and Parkinson, 1986; Parrish et al., 1988; Bardoux,
1993; Johnson and Brown, 1996; Johnson 2006; Brown et al., 2012). The OVsz
is part of a ~300 km north-south striking, brittle-ductile crustal detachment (Fig.
2.1), and is characterized by moderately to intensely mylonitized orthogneiss and
paragneiss intruded by felsic sheets that are moderately to intensely mylonitized
within the footwall domain of the OVsz. The shear zone displays prominent west-
northwest trending elongation lineations with shear-sense indicators consistently
indicative of relative westward displacement of the hanging wall (Bardoux, 1985,
1993; Parkinson, 1985; Journeay and Brown, 1986; Tempelman-Kluit and
Parkinson, 1986; Brown et al., 2012; this study). U-Pb zircon crystallization ages
confirm that the mylonitic gneiss within the OVsz developed during Eocene
metamorphism and deformation that accompanied motion along the shear zone
(Parrish et al., 1988; Johnson and Brown, 1996; Brown et al., 2012). The
orthogneiss is interpreted to have been derived from multiple intrusions, including

21
Late Jurassic to Eocene granodiorite plutons (Tempelman-Kluit and Parkinson,
1986), whereas the paragneiss units are interpreted to represent Paleozoic to
Early Jurassic sedimentary protoliths (Brown et al., 2012). The sinuous surface
trace of the shear zone reflects its shallow and corrugated geometry along strike.
The OVsz is further characterized by open, west-northwest trending, upright,
multi-scale folds. The trend of the hinge of these folds parallels the interpreted
finite Eocene extension direction (Fig. 2.1; Ross, 1981; Brown, 2010). At intervals
of 50-100 km, hanging wall rocks appear as semi-continuous outliers intersecting
the N-S trace of the OVsz where they occur in the structural lows of synformal
keels, whereas gneissic rocks of the footwall domain are exposed in the adjacent
antiformal highs (Fig. 2.1).
22
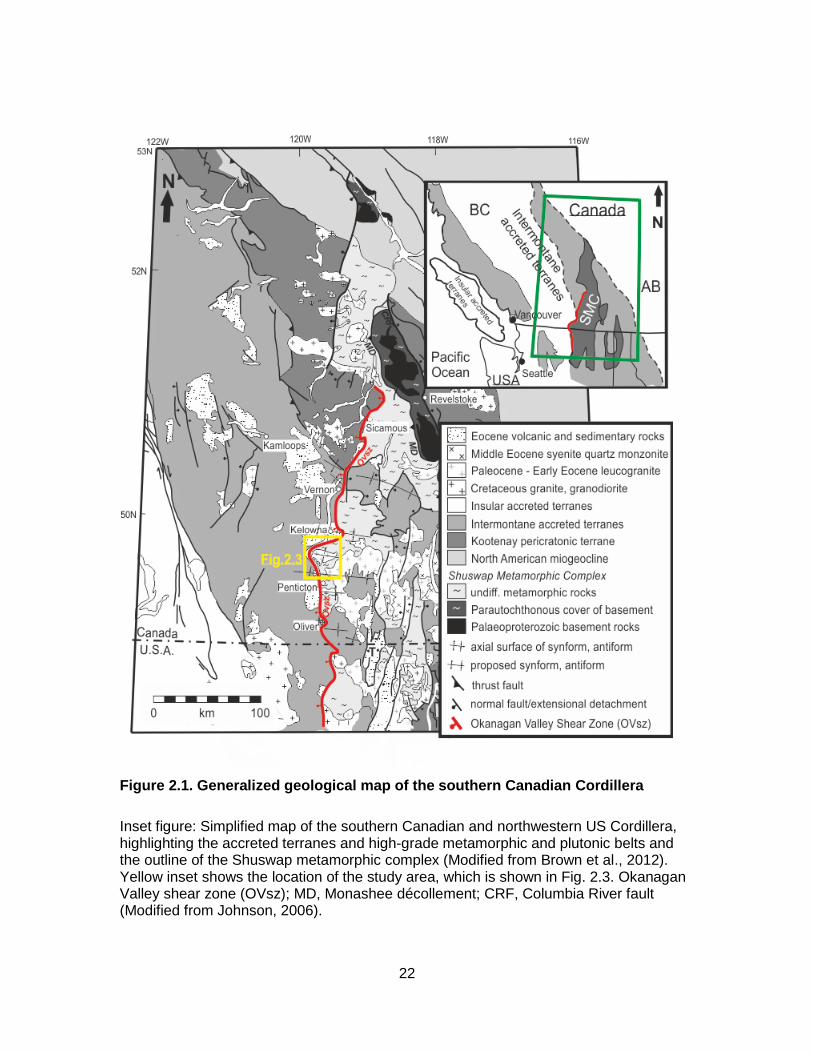
Figure 2.1. Generalized geological map of the southern Canadian Cordillera
Inset figure: Simplified map of the southern Canadian and northwestern US Cordillera, highlighting the accreted terranes and high-grade metamorphic and plutonic belts and the outline of the Shuswap metamorphic complex (Modified from Brown et al., 2012). Yellow inset shows the location of the study area, which is shown in Fig. 2.3. Okanagan Valley shear zone (OVsz); MD, Monashee décollement; CRF, Columbia River fault (Modified from Johnson, 2006).
23
Additional evidence supporting the interpretation that the OVsz is a
crustal-scale detachment that help facilitate the exhumation of the Shuswap
metamorphic complex from mid-crustal depths includes the break in
metamorphic grade across the shear zone (Brown et al., 2012). Zeolite- to
greenschist-facies rocks of the hanging wall are juxtaposed against mylonitic
amphibolite- to granulite-facies footwall rocks of the Shuswap metamorphic
complex (Fig. 2.1; Brown and Journey, 1987; Parrish et al., 1988; Brown et al.,
2012). The immediate hanging wall is affected by localised brecciation,
chloritization and silicification (Bardoux, 1993), and is dissected by high-angle
normal faults. Eocene syn-extensional half graben basins formed in response to
movement on these faults and were subsequently filled with local detritus
including Eocene volcanogenic sedimentary rocks, as well as gneissic clasts
from the exhuming footwall (McClaughry and Gaylord, 2005). The extension and
filling of the hanging wall basins was approximately coeval with anatectic melting
and amphibolite-facies metamorphism recorded in the footwall domain, which
implies rapid exhumation of mid-crustal rocks to the near-surface. This
exhumation was achieved through lithospheric stretching focused along
extensional detachments such as the OVsz (Tempelman-Kluit and Parkinson,
1986; Parrish et al., 1988; Bardoux, 1993; McClaughry and Gaylord, 2005). This
evidence is in line with other studies that show the footwall of the OVsz was
rapidly exhumed from at least 20 km depth to shallow levels in the crust (<3 km)
during the Eocene (ca.56–48 Ma). This understanding is based on overlapping
K-Ar and 40Ar/39Ar cooling ages for hornblende, biotite and muscovite and modal
fission-track ages of apatite and sphene with U-Pb zircon and monazite ages
from the high grade gneisses and anatectically-derived granitoid rocks
(Baadsgaard et al., 1961; Ross, 1974; Medford, 1975; Wanless et al., 1978;
Mathews, 1981; Stevens et al., 1982; Archibald et al., 1984; Parrish et al., 1988;
Armstrong et al., 1991; Bardoux, 1993; Johnson and Brown, 1996; Kruckenberg

24
et al., 2008; Toraman et al., 2011; Brown et al., 2012). Exhumation and cooling
are interpreted to be contemporaneous with axatexis and emplacement of
syntectonic intrusions since cooling from zircon and monazite crystallization to
argon closure temperatures occurred within a few million years (Hansen and
Goodge, 1988; Kruckenberg et al., 2008; Kruckenberg and Whitney, 2011;
Brown et al., 2012).
In contrast, K-Ar and 40Ar/39Ar analyses indicate that large portions of the
hanging wall remained below 280 °C (< 9km) since the late Mesozoic, as many
plutonic rocks yield Jurassic to Early Cretaceous cooling ages (White et al.,
1968; Roddick et al., 1972; Medford, 1975; Fox et al., 1976; Parrish et al., 1988).
The sharp contrast in the isotopic cooling ages across the OVsz further suggests
that the OVsz accommodated regional crustal-scale extension during the Eocene
(Bardoux, 1993).
Rapid exhumation of the OVsz is also indicated by the pressure-
temperature data from upper amphibolites-facies garnetiferous schist that were
at, or above, the wet granite solidus within the OVsz (Bardoux, 1993; Laberge
and Pattison, 2007; Brown et al., 2012). Garnet porphyroblasts show little
evidence of retrograde re-equilibration related to exhumation (Bardoux, 1993;
Brown et al., 2012). Similar geochronological, thermochronological and
themobarometric data have been documented in footwall rocks farther to the
east, which also argue for rapid Eocene exhumation of the Shuswap
metamorphic complex (e.g. Vanderhaeghe et al., 1999; Teyssier et al., 2005;
Rey et al., 2009).
Estimates of displacement along the OVsz vary considerably along strike,
from <2 km to >90 km, (Parkinson, 1985; Tempelman-Kluit and Parkinson, 1986;
Parrish et al., 1988; Bardoux, 1993; Bardoux, and Mareschal, 1994; Glombick et
al., 2006; Johnson and Brown, 1996; Brown et al., 2012). The variations in the
estimated amount of displacement have led to differences in the interpreted role

25
played by the OVsz in the exhumation of the Shuswap metamorphic complex.
Several models of have been proposed that involve post-convergence,
extensional gravitational collapse of an overthickened crust (e.g. Fig. 2.2A;
Tempelman-Kluit and Parkinson, 1986; Brown and Journeay, 1987; Parrish et al.,
1988; Vanderhaeghe and Teyssier, 2001; Price and Monger, 2003; Rey et al.,
2009). In these models, the OVsz facilitated Eocene lateral spreading of the
gravitationally unstable, overthickened orogen with lowered viscosity in the mid-
to lower crust due to partial melting. This collapse coincided with a change in
plate kinematics and a reduction in convergence rate along the western plate
margin (Ewing, 1980; Price and Carmichael, 1986; Monger and Price, 2002).
Alternatively, the OVsz has been interpreted to represent the shallow west-
dipping, normal-sense top of a syn-convergent, ductile mid-crustal channel
during Cretaceous to Paleocene, subsequently reactivated during Eocene
extension (Fig. 2.2B; Brown and Gibson, 2006; Glombick et al., 2006; Gervais
and Brown, 2011). In this model, the OVsz may have played a significant role in
localizing orogen-normal Poiseuille flow in the channel (i.e. where flow in a layer
is fastest in the middle and decreases towards the margins; see Godin et al.,
2006) within the Shuswap metamorphic complex (Fig. 2.2B; Brown and Gibson,
2006; Gervais and Brown, 2011). Although Brown and Gibson (2006) and
Gervais and Brown (2011) do not dispute that the OVsz played a major role in
the Eocene collapse of the orogen by the OVsz, Glombick et al. (2006) argued
otherwise. They contended that the channel was underthrust by a crustal-scale
ramp and exhumed from depths of 20–30 km by vertical ductile thinning,
requiring <2km of actual displacement along the OVsz.
26
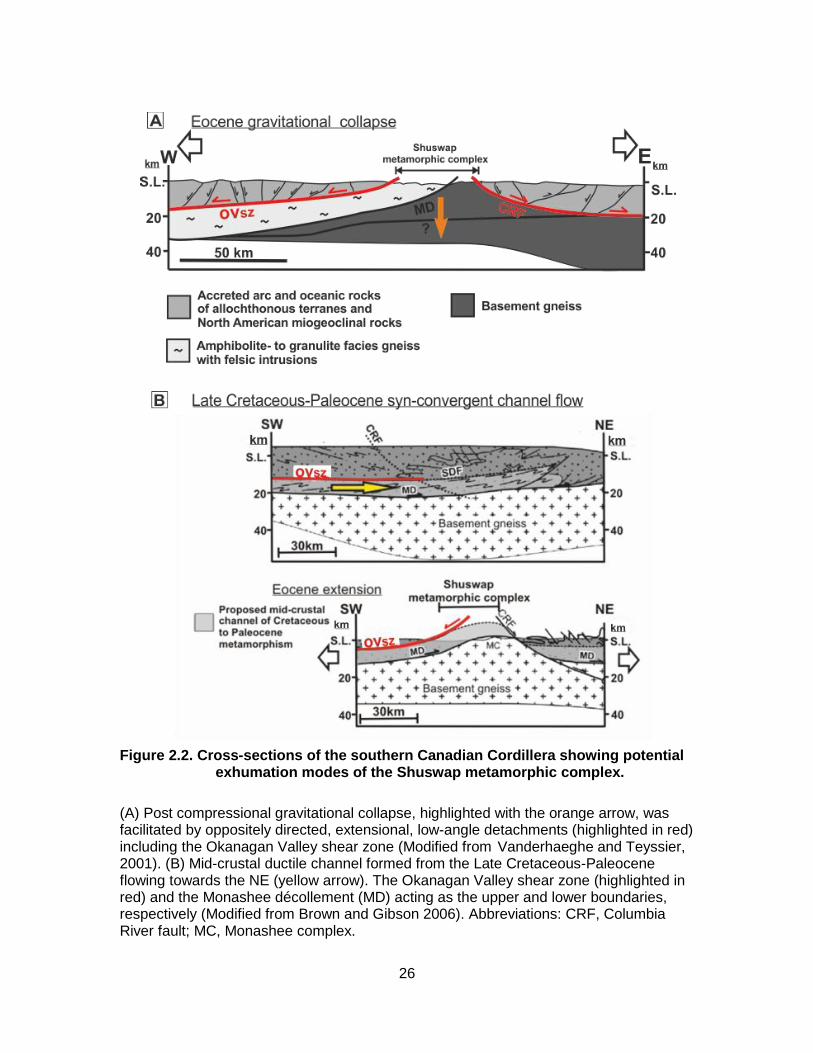
Figure 2.2. Cross-sections of the southern Canadian Cordillera showing potential exhumation modes of the Shuswap metamorphic complex.
(A) Post compressional gravitational collapse, highlighted with the orange arrow, was facilitated by oppositely directed, extensional, low-angle detachments (highlighted in red) including the Okanagan Valley shear zone (Modified from Vanderhaeghe and Teyssier, 2001). (B) Mid-crustal ductile channel formed from the Late Cretaceous-Paleocene flowing towards the NE (yellow arrow). The Okanagan Valley shear zone (highlighted in red) and the Monashee décollement (MD) acting as the upper and lower boundaries, respectively (Modified from Brown and Gibson 2006). Abbreviations: CRF, Columbia River fault; MC, Monashee complex.
27
2.4. Geology of the Okanagan Valley shear zone in the vicinity of the Okanagan Mountain Provincial Park
The OVsz exposed in the Okanagan Mountain Provincial Park is a gently
to moderately west-dipping brittle-ductile shear zone that transitions downward
from cataclastic ultramylonitic to mylonitic gneiss and felsic intrusive rocks to
mylonitic amphibolite-facies gneiss and felsic intrusive rocks, to a weakly- to non-
deformed syntectonic granitoid pluton at the base (Figs. 2.2; 2.3; 2.4). Within the
study area, the OVsz is warped by a west-northwest trending, kilometre-scale,
open, antiform that is defined by the variation in attitude of the foliation that dips
gently (~03° to 25°) across the field area (Fig. 2.3). The antiform is interpreted to
be one of the corrugations that characterize the overall OVsz geometry (Brown,
2010). Shear-sense indicators such as S-C fabrics, asymmetric porphyroclast
and pressure shadows consistently indicate top-down-to-the-WNW sense of
shear. Aligned quartz, feldspar and elongated hornblende define a penetrative
elongation lineation trending 279° (Fig. 2.3). The mean trend of the penetrative
elongation lineation, which is primarily defined by the alignment of quartz,
feldspar and elongated hornblende, is 279 ° (Fig. 2.3). The hinge line of the
antiformal corrugation is broadly parallel to the mean mineral elongation direction
(Fig. 2.3). A series of steeply dipping, north striking, top-down-to-the-WNW brittle
faults cut the OVsz (Figs. 2.3; 2.4A). Although these structures appear to locally
offset the mylonitic foliation on a <5 metre scale, they do not significantly affect
the overall inferred structural succession of the OVsz.
The top of the OVsz is bounded by a brittle detachment surface marking
the break between the penetratively deformed high grade metamorphic rocks
within the shear zone and the low grade metamorphic to unmetamorphosed
volcanic and sedimentary rocks of the hanging wall to the west (Fig. 2.3).
Previous studies described the detachment system as a ductile shear zone
overprinted by a brittle detachment (i.e. Okanagan Valley crustal shear of
Tempelman-Kluit and Parkinson, 1986; Okanagan Valley fault of Parrish et al.,

28
1988, and Johnson and Brown, 1996). This study uses the terminology of Brown
et al. (2012), who referred to the detachment system as the Okanagan Valley
shear zone, in order to account for the distributed nature of the shear zone that
includes both the brittle and ductile components.
29
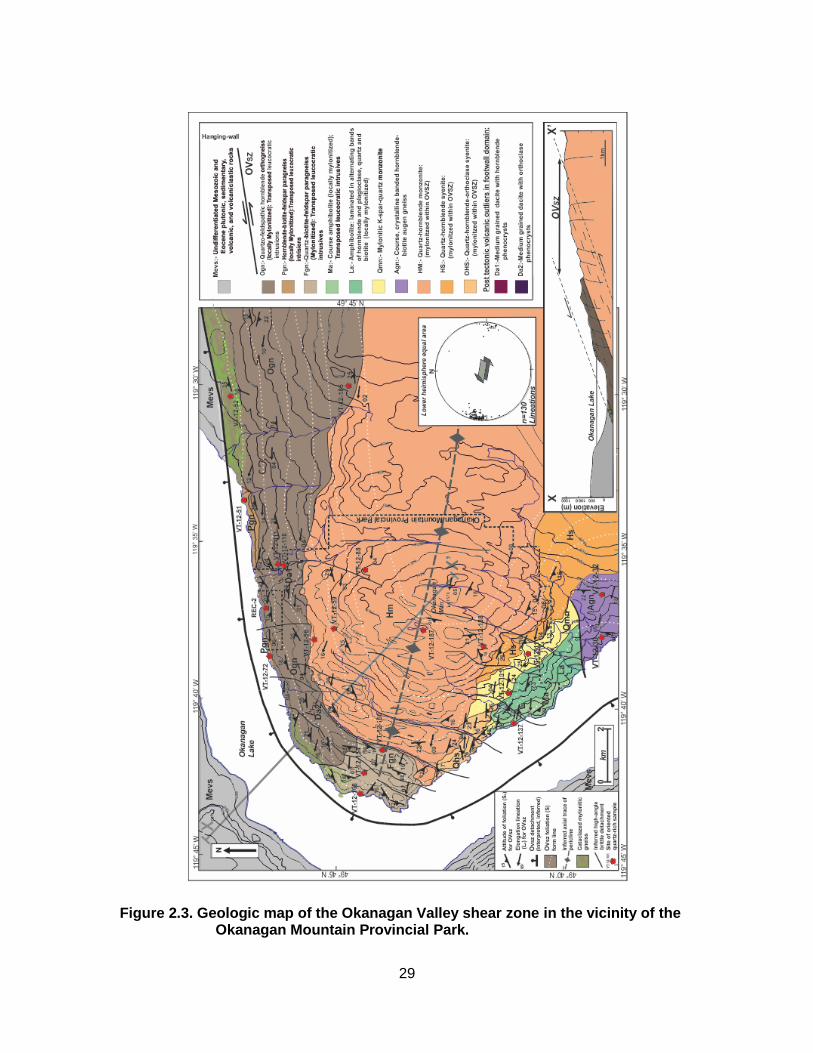
Figure 2.3. Geologic map of the Okanagan Valley shear zone in the vicinity of the Okanagan Mountain Provincial Park.
30
Foliation form lines (S) highlight the antiformal corrugation that defines the shear zone in the study area. Simplified geologic cross-section X-X’ showing the shallow-dipping OVsz. Inset of lower hemisphere equal area show projection of elongation lineations with a mean trend of 279 . Sample locations in this study are also highlighted.
The northern limb of the antiform is defined by a sequence of mixed mafic
and felsic orthogneiss with thin bands of paragneissic units (Figs. 2.3; 2.4).
Centimetre-scale hornblende-rich and hornblende-poor- layers characterize the
mafic orthogneiss. Orthoclase-quartz-hornblende±biotite with orthoclase
porphyroclasts delineate the more felsic orthogneiss (Fig. 2.4C.E). The
paragneissic units comprise transposed layers of finely banded quartz-K-
feldspar-biotite±hornblende (Fig.2.4C). Numerous boudinaged centimetre-scale
ultramafic and amphibolite veins intrude the paragneiss.
The southern limb of the antiformal pericline consists of a penetratively to
weakly mylonitized amphibolitic gneiss containing an abundance of small,
rootless isoclinal folds (Fig.2.5A), structurally underlain by laminated amphibolite
gneiss (Fig. 2.5B) and mylonitic felsic orthogneiss (Fig. 2.5C). The southern limb
of the pericline terminates at a north-south striking, banded quartz-feldspar-
orthoclase-hornblende±biotite-chlorite gneiss containing distinctive augen
orthoclase clasts (Fig. 2.3; 2.5F). All units across the study area contain
transposed syntectonic leucosome and pegmatitic sheets (e.g. Fig 2.4).
The core of the antiformal pericline is dominated by a quartz-hornblende
monzonite to quartz-hornblende syenite based on the modal percentages of the
constituent mineral (Figs. 2.3; 2.4I; 2.5D), contrary to the granodiorite
interpretation of Medford (1975) and Tempelman-Kluit (1989). The quartz-
hornblende monzonite unit dominates the northern exposures of the pluton with
the syenite unit restricted to the south. 40Ar/39Ar cooling ages from hornblende
and micas suggest these units were at a temperature above 500 °C at ~51 Ma,
cooling rapidly to <280 °C at ~48 Ma (Medford 1975; Mathews 1981; Parkinson
1985). The monzonite and syenite units are dominated by feldspar megacrysts

31
that parallel a penetrative mineral lineation (e.g. Fig. 2.4D). The base of the
shear zone is broadly defined by non-foliated monzonite and syenite units
transitioning structurally upward from the base into progressively more foliated
units, and eventually into mylonitized felsic orthogneiss interlayered with mafic
orthogneiss and paragneiss (Figs 2.4; 2.5). Within this mixed region, boudins of
the plutonic units are intercalated, transposed, and interfolded with enclaves of
mafic orthogneiss, becoming progressively concordant with the mylonitized
gneissic layering towards the structural top of the OVsz (Figs 2.4; 2.5). This
mixed region is interpreted as an irregular intrusive contact possibly affected by
syntectonic deformation.
Two post-kinematic dacitic outliers are mapped in northern limb of the
pericline where dikes that feed into the outliers cut through the mylonitic gneiss
(Fig. 2.3) (see Appendix E). These outliers are tentatively correlated with the
Marama Formation based on previous mapping of similar felsic volcanics within
and west of the OVsz where cooling ages from volcanic rocks of these
formations range from 48.4 Ma (whole rock) to 53.1 Ma (K/Ar-biotite) (Church
1973; 1985; Bardoux, 1993). The cooling ages of these regional volcanic outliers
are coeval with the ages of tectonized leucosome, dikes and plutons interpreted
to have been generated and deformed at mid-crustal depths (Bardoux, 1993;
Brown et al., 2011). These relationships suggest that ductile deformation lower in
the structural succession may have still been on-going while the mid-lower
section of the OVsz was at or near the surface.

32
2.4.1. Structural and kinematic framework of the Okanagan Valley shear zone in the vicinity of the Okanagan Mountain Provincial Park
The approximate 1-1.5 km structural thickness of the OVsz observed in
the Okanagan Mountain Provincial Park is broadly divided into three
lithostructural domains (Figs. 2.3, 2.4) that transition structurally downward from:
(i) Domain 1: cataclasite grading downwards into ultramylonite that is
locally overprinted by brittle features;
(ii) Domain 2: moderately mylonitized greenschist to amphibolites-facies
ortho- and paragneiss and transposed syntectonic felsic intrusions;
(iii) Domain 3: moderately to weakly foliated ortho- and paragneiss rocks
interlayered with a weakly- to non-deformed plutonic rock at the base of the
shear zone.
The gradation of brittle to ductile structural features down the structural
column is in agreement with previous studies along strike of the OVsz (e.g.
Parkinson, 1985; Tempelman-Kluit and Parkinson, 1986; Bardoux, 1993; Brown
et al., 2012).

33
Figure 2.4. Outcrop photos down structural succession in the northern limb

34
(A) View of the Okanagan Mountain Provincial Park from the south showing the inferred trace of the upper boundary of the Okanagan Valley shear zone in the westernmost part of the study area. The dashed red lines represent inferred late, high-angle, brittle faults. (B) Example of cataclasite with mylonitized gneissic fragments at the top of the structural section. (C) Ultramylonitic paragneiss overprinted by conjugate brittle faults. (D) Open folds interpreted to be corrugations with centimetre- to metre-scale wavelengths that have hinge lines parallel to the penetrative elongation lineation. (E) Transposed leucocratic intrusive sills and melt wisps within hornblende-rich mylonitic orthogneiss at the base of Domain 1. (F) Domain 2 mylonite containing a delta feldspar porphyroclast recording top-to-the-WNW sense of shear (G) and (H) Recumbent sheath folds with axial surfaces parallel to the layering and foliation in Domain 2. (I) Quartz hornblende monzonite near the base of the shear zone with euhedral feldspar clasts free of internal deformation. (J) Schematic vertical section of the northern limb of the antiform showing approximate structural depths of Figs 2.3B-I (grey arrows indicate inferred shear sense).
The upper 50–100 m portion of Domain 1 is characterized by the
superposition of fractures around brecciated and chloritized lenses of ductile
fabrics near the top of the mylonitic front (Figs. 2.2; 2.4B). Cataclasite gradually
transitions structurally downward into the less fractured, locally brecciated,
chloritized and silicified ultramylonite (Fig. 2.3C). Domain 1 appears absent in the
southern limb, apparently cropping out only in the northern antiformal limb.
The ultramylonite gradually loses the prevalent brittle overprint structurally
downward, where it preferentially preserves solid-state deformation features
characteristic of the lithostructural Domain 2 mylonite. In Domain 2, the mylonitic
fabric in the gneissic and intrusive units is characterized by a centimetre to
metre-scale, discontinuous, laterally transposed, compositionally layered foliation
(e.g. Figs. 2.4E, F; 2.5B), and ubiquitous elongation lineation trending 279° (Fig.
2.2). The elongation lineation is defined by the alignment of hornblende, biotite
and ribboned quartz. Pervasive Type I S-C fabrics (Lister and Snoke, 1984) are
defined by the S-surfaces of the aligned long axes of hornblende. Quartz ribbons
also indicate top-to-the-WNW sense of shear and commomly anastomose
around rotated feldspar aggregates in the intrusive units. Sigma- and delta-type
asymmetric pressure shadows of porphyroclasts also indicate top-to-the-WNW
sense of shear (Fig. 2.4F). The leucocratic intrusions become progressively
transposed parallel to the gneissic layering higher in the structural section (e.g.
35
2.4E & F). Lower in the structural section, near the middle of Domain 2
(~>500m), planar fabric elements, intrusions and foliations are ubiquitously re-
folded, forming isoclinal, rootless and recumbent sheath folds with axial planes
parallel to the penetrative foliation (e.g. Fig 2.4H & J).
Folds with centimetre- to metre-scale wavelengths and hinges that parallel
the pervasive elongation lineation locally appear in the upper 500m of the OVsz
where the mylonitic foliation is folded (Fig. 2.4C). These folds are likely to be
minor folds related to the kilometre-scale corrugations along the strike of the
shear zone and not related to the recumbent, isoclinal and transposed folds
present in the gneiss. These open, upright folds appear to have not experienced
the same degree of flattening as the isoclinals folds within the gneiss and are
nearly concentric with straight hinge lines parallel to the extensional direction.
Domain 3, located ~650 m below the top of the shear zone, consists of
moderately to weakly foliated ortho- and paragneiss interlayered with a variably
foliated syntectonic leucocratic syenite to monzonite pluton (Fig.2.4G). The
pluton becomes progressively less foliated to non-deformed down structural
section towards the base of the shear zone. Elongate mafic enclaves within the
leucocratic units are preferentially aligned in the direction of the mean elongation
lineation direction (Fig. 2.4E). A banded orthoclase gneiss unit containing
distinctive augen orthoclase clasts occurs immediately south of the southern limb
of the pericline (Fig. 2.2; 2.4F). The foliation orientation indicates either that this
gneiss is faulted in place with respect to the structural section of the antiform, or
is beyond the inflection point of the southern limb of the antiform(Fig. 2.2). The
asymmetry of the augen clasts within the gneiss often displays top-to-the-WNW
shear sense. However, the unit is not mylonitized like the gneissic units within
Domains 1 and 2, thus it is classified as Domain 3.

36
Figure 2.5. Outcrop appearance down structural succession in the southern limb
(A) Rootless folds of an amphibolite lens in the southern periclinal limb. (B) Banded hornblende- and plagioclase-rich amphibolite with top-to-the-WNW shear sense defined by asymmetric tails of feldspar porphyroclasts. (C) Mylonitic felsic orthogneiss. (D) Preferred alignment of long axis of euhedral orthoclase phenocrysts (yellow ellipses) near the base of the shear zone. (E) Preferred alignment of elongate mafic enclaves in the direction of the trend of the mean elongation lineation direction. (F) Banded orthoclase augen gneiss immediately south of the southern limb of the pericline. (G) Schematic vertical section of the southern periclinal limb showing approximate placement of A-E (grey arrows indicate inferred shear sense).

37
2.5. Methodology of microstructural analysis
Oriented samples of quartz-rich mylonitic gneiss and leucogranite were
collected down the entire exposed structural column of the OVsz. The relative
positions of the samples were projected into the structural succession of the
OVsz by calculating their approximate structural depth below the inferred upper
contact of the shear zone assuming the dip of the OVsz is constant throughout
the section. Because the dip of the detachment ranges from 3˚ to 25°, the
estimated structural depth in this study is interpreted within 50-100m error. The
approximate locations of the structural sections are based on their relative
position with respect to the hinge and limbs of the antiform that controls the map-
scale geometry the OVsz in the study area.
Twenty representative samples with appropriate modal quartz mineral
assemblages from either transposed leucocratic intrusions or gneissic country
rock were chosen for microstructural analysis using a petrographic microscope to
ascertain the dominant dynamic recrystallization mechanisms at each position
within the OVsz. Ten samples were chosen from this group for CPO analysis,
with eight of these selected down a vertical structural transect within the northern
hinge of the antiformal pericline. This vertical transect was chosen to investigate
CPO fabrics because it contained a homogenous rock type and the notable
variation in mesoscopic-scale deformation structures down the structural section.
The remaining two CPO samples were selected from both the middle of the
southern limb and the gneissic unit south of the antiform. Representative
samples were cut parallel to the X-Z plane of the finite strain ellipsoid, parallel to
the elongation lineation and perpendicular to foliation. Consequently, all
photomicrographs utilized for quartz microstructural and CPO analysis in this
study are viewed approximately towards the north-northeast at right angles to the
inferred transport direction.
38
2.5.1. Quartz recrystallization mechanisms
Dynamic recrystallization mechanisms of quartz and where applicable,
feldspar (Pryer, 1993), were used as an estimate of temperature conditions
during deformation (Hirth and Tullis, 1992; Stipp et al., 2002a, b). Stipp et al.
(2002a, b) combined inferred deformation temperatures of naturally deformed
rocks with experimental data of Hirth and Tullis (1992) to constrain the
deformation conditions according to the recrystallization mechanisms of
deformed quartz grains. These dynamic recrystallization mechanisms are
typically the result of the formation and progressive rotation of subgrains and the
migration of grain boundaries in response to a change in dislocation density
(strain energy) within individual quartz grains (e.g., Guillop and Poirier 1979; Urai
et al., 1986). The interaction of these two processes results in three different
dynamic recrystallization mechanisms (Regimes) of quartz microstructures based
on deformation temperature (Stipp et al., 2002a). Regime 1 is a localised, low
temperature grain boundary migration known as bulging recrystallization (BLG),
which dominates from approximately 280 to 400 °C. Regime 2 is characterized
by concentration of dislocations along grain walls due to a reduction of elastic
distortional strain energy resulting in subgrain rotation recrystallization (SGR),
which occurs from approximately 400 °C to 500 °C. Regime 3 is a strain-induced
grain boundary migration recrystallization (GBM) driven by differences in stored
strain energy between adjacent grains occurring at temperatures >500 °C (Fig.
2.6C; Stipp et al., 2002a and references therein). Above 650°C, quartz displays
chessboard extinction whereby two orthogonal sets of tilt walls define subgrain
boundaries indicating relatively higher temperatures (Blumenfeld et al., 1986;
Mainprice et al., 1986; Hirth and Tullis, 1992; Stipp et al., 2002a,b). Appendix A
provides further information on the theory of quartz recrystallization mechanisms
analysis.

39
2.5.2. Quartz crystallographic preferred orientations
Quartz CPO fabrics were used in conjunction with the identification of
dynamic recrystallization mechanisms to assess shear sense, deformation
temperatures, and strain symmetry (Fig. 2.6; Lister et al., 1978; Lister and
Hobbs, 1980; Law, 1990; Sullivan and Beane, 2010). CPO fabrics are interpreted
through a combination of c- and a-axis plots, where different regions of an equal
area stereographic plot represent basal <a>, rhomb <a>, prism <a> or prism <c>
slip of individually measured quartz crystals (Fig. 2.6; Lister et al. 1977; Schmid
and Casey, 1986; Law, 1990). Quartz CPO patterns are assessed according to
the definitions of Lister (1977), in which the plane normal to the lineation (Y-Z
plane) is defined as the symmetry plane. Fabrics that do not mirror themselves
across this plane are described as asymmetric. A summary of the orientation of
principal strain axes, active slip systems, fabric geometries in different strain
fields, and evolution of CPO patterns during non-coaxial strain at various
temperatures is portrayed in Figure 2.6 (see Appendix A for a more extensive
review on CPO fabric analysis).
40
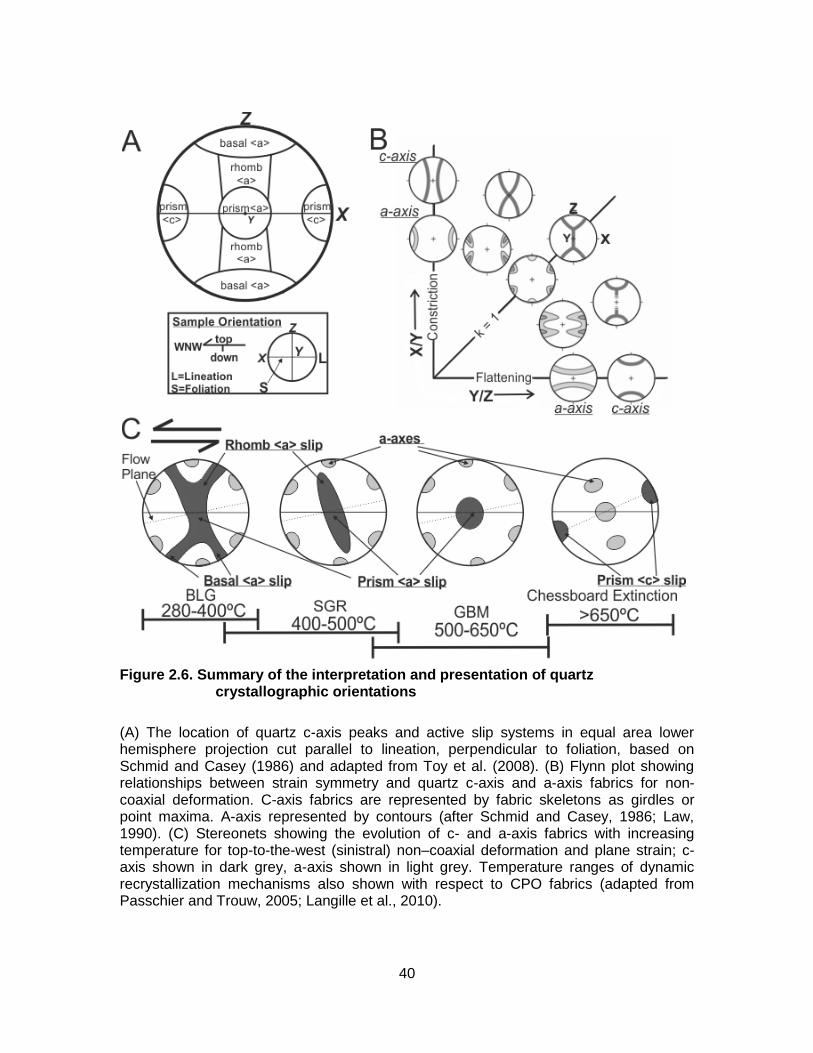
Figure 2.6. Summary of the interpretation and presentation of quartz crystallographic orientations
(A) The location of quartz c-axis peaks and active slip systems in equal area lower hemisphere projection cut parallel to lineation, perpendicular to foliation, based on Schmid and Casey (1986) and adapted from Toy et al. (2008). (B) Flynn plot showing relationships between strain symmetry and quartz c-axis and a-axis fabrics for non-coaxial deformation. C-axis fabrics are represented by fabric skeletons as girdles or point maxima. A-axis represented by contours (after Schmid and Casey, 1986; Law, 1990). (C) Stereonets showing the evolution of c- and a-axis fabrics with increasing temperature for top-to-the-west (sinistral) non–coaxial deformation and plane strain; c- axis shown in dark grey, a-axis shown in light grey. Temperature ranges of dynamic recrystallization mechanisms also shown with respect to CPO fabrics (adapted from Passchier and Trouw, 2005; Langille et al., 2010).

41
Quartz c- and a- axis CPO fabrics were collected using an electron
backscatter diffraction (EBSD) detector mounted on scanning electron
microscope at Colgate University, New York. A description of the scanning
electron microscope settings and the measurement conditions and setup
parameters of the EBSD technique in this study are summarized in Table 2.1.
For further description of EBSD techniques and its application to geologic
problems, see Prior et al. (1999; 2009).
Table 2.1. Scanning electron microscope settings for electron backscatter diffraction analysis at Colgate University, New York
Scanning electron microscope JEOL JSM636OLV
Software for scanning electron microscope Oxford Instruments HKL Channel 5.0
Electron backscatter diffraction detector Nordlys EBSD detector
Accelerating Voltage
Working Distance
Binning
Vacuum
Bands
Step Size
20 kV
10-20 mm
4X4
High
6
Greater than the average grain size in individual domains of the thin section
Individual data points for quartz collected during automated mapping are
established according to the ‘step sizes’ that are deemed appropriate for a given
sample. These step sizes are set at increments smaller than the average quartz
grain size in an entire thin section, or within a domain of a thin section, to ensure
representative sampling of all grains when determining the crystallographic
orientation of individual quartz grains by indexing. Post-acquisition data reduction
includes the removal of wild data spikes. Clusters of proximal point data with
crystallographic misorientations (<10°) are grouped to eliminate any erratic or
misindexed orientations. Following this, crystallographic misorientations (>10°)
are defined by point grain boundaries. Clusters of similar crystallographic
42
orientations are then grouped as individual grains and a new data set is created
where each grain is represented as a single point.
Quartz c-axis orientations were also collected using the using the fabric
analyser (FA) method as a complimentary technique to EBSD analysis using
multiple high-resolution digital images acquired simultaneously from several
orientations generated with spatial resolution of 2.8 μm per pixel (Petternell et
al., 2010). These images use rotating polarizing filters to create false colour
composites of crystal c-axis orientations. Within these images, individual quartz
grains are manually selected based on recrystallization properties and prior
identification of suitable quartz localities. The c-axis orientations of individual
pixels inside the images are evaluated using the ‘INVESTIGATOR©’ software
where gradational shades of colour in these images represent orientations of the
c-axes. Data acquisition and reduction related to FA analysis are described in
detail by Wilson et al. (2003, 2007) and Peternell et al. (2009). The availability of
high-resolution digital images allow for a relatively rapid evaluation of textural
heterogeneities in quartz c-axes within an individual thin section (Petternell et al.,
2010). Bulk CPO fabrics can be also utilized, as opposed to relying on fabrics
within individual quartz-rich domains. This flexibility serves as an effective
method to determine deformation partitioning within a thin section and account
for heterogeneities of c-axis patterns within the bulk thin section.

43
2.6. Results
This section describes microstructures of the representative samples from
the top of the OVsz to progressively lower structural levels and considered within
the context of the three lithostructural domains previously described (see
Fig.2.2). The approximate structural depth, rock types, quartz recrystallization
mechanisms, CPO fabrics and estimated temperatures of deformation for each
sample are summarized in Table 2.
2.6.1. Microstructures and quartz dynamic recrystallization mechanisms
2.6.1.1. Cataclasites and ultramylonites in upper Okanagan Valley shear zone - Domain 1
Brittle deformation features indicative of cataclastic flow and retrogressive
processes dominate the upper 50 m of Domain 1, gradually transitioning to
ultramylonite in the lower part of the Domain (Fig. 2.7B, C). In thin section,
angular broken fragments of mylonitic gneiss and felsic intrusive rocks are
embedded in a matrix of quartz, feldspar and chlorite (Fig. 2.7A). Small often
conjugate fractures are offset from a few millimetres to centimetres and are
infilled with quartz, chlorite and possibly calcite (Fig.2.7A). Limited evidence of
ductile deformation is provided by patchy undulose extinction of quartz in the
groundmass and by the lobate contacts inferred to be due to low temperature
grain boundary migration (BLG) indicative of relict ductile quartz deformation
(Fig. 2.7A).
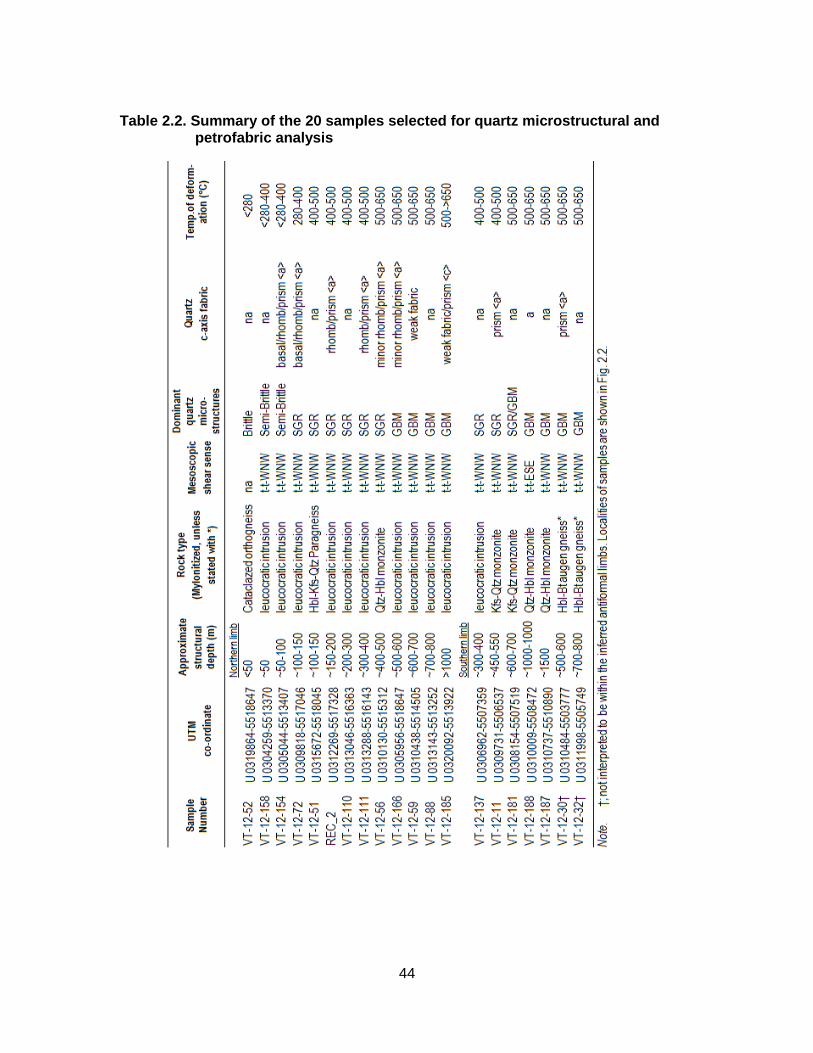
44
Table 2.2. Summary of the 20 samples selected for quartz microstructural and petrofabric analysis

45
Extensional shear bands within feldspar porphyroclasts record top-to-the-
WNW shear sense (Fig.2.7B, C). Tension gashes and microfractures within
these porphyroclasts are filled with recrystallized quartz and are generally
oriented perpendicular to the long dimension of the porphyroclasts. Lower in the
ultramylonitic part of Domain 1, feldspar porphyroclasts are often asymmetric,
reduced in size and exhibit elongated ovoid shapes with their long dimension
seemingly tilted parallel to the YZ plane with evidence suggesting onset of core-
mantle structures (Fig. 2.7D). The onset of ductile deformation of quartz is
evident within the upper ultramylonitic zone (~50-100m) with possible evidence of
BLG recrystallization. Due to the highly fractured nature of the rocks towards the
structural top of Domain 1 however, these ductile fabrics could also be relict
ductile deformation. Overall the features are indicative of deformation
temperatures ranging from <280°C to 400 °C.
The onset of SGR recrystallization at ~100 m down the structural
succession is generally indicated by elongated quartz ribbons oriented in the
direction of instantaneous stretch consistent with top-to-the-WNW sense of shear
(Fig. 2.7D). These elongated ribbons become more distinct with increasing
structural depth, and coupled with the first appearance of core-mantle structures
of feldspars indicate deformation temperatures >400°C (e.g. Passchier and
Trouw, 2005) (Fig. 2.7E). These microstructures appear exclusively in the
northern limb of the antiform with no apparent evidence for sub-400 °C plastic
deformation of quartz in the southern limb (Figs. 2.7; 2.8).
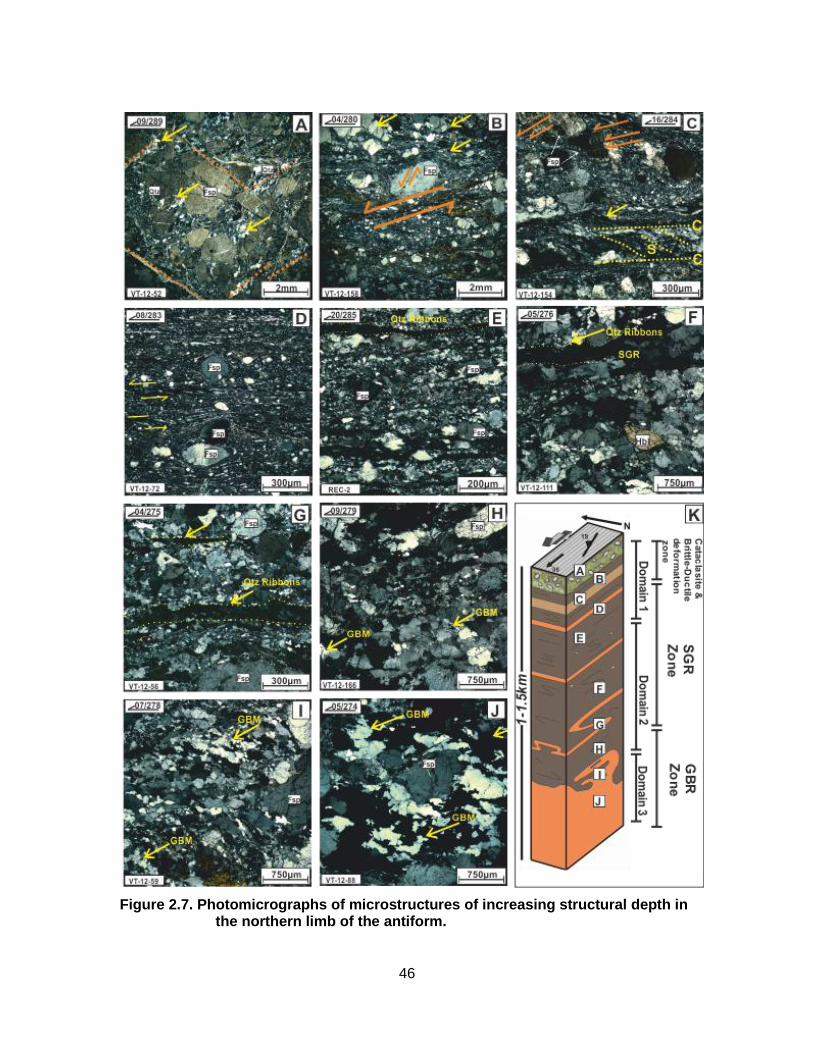
46
Figure 2.7. Photomicrographs of microstructures of increasing structural depth in the northern limb of the antiform.
47
(A) Fractured angular fragments within cataclasites with evidence of grain size reduction. Fragments are offset by conjugate shear fractures (orange dashes). Relict ductily-deformed quartz with patchy undulose extinction and serrated grain boundaries are evident (yellow arrows). (B) Shear band offsets in brittlely-deformed feldspar porphyroclasts and quartzo-feldspathic matrix indicating top-to-the-WNW shear sense (orange arrows). (C) Onset of SGR recrystallization shown by elongated quartz ribbons and systematic shear band offsets in feldspar porphyroclasts highlighted by orange arrows. (D,E) SGR recrystallization indicating deformation temperatures of 400-500 °C and core-mantle structures in feldspar porphyroclasts in the lower section of Domain 1. (F,G) Elongated quartz ribbons indicative of SGR at the top of Domain 2. (H) Amoeboid quartz grains with serrated boundaries indicate GBM recrystallization (>500 °C) at the base of Domain 2. (I, J) Quartz exhibiting GBR in syntectonic pluton towards the base of the shear zone which shows increasing grain size down the structural column. (K) Schematic vertical section of the northern antiformal limb showing approximate locations with respect to their approximate structural depth in the Okanagan Valley shear zone. Mineral abbreviations (after Whitney and Evans, 2010): Qtz, quartz; Fsp, feldspar; Hbl, hornblende; Bt, biotite. Estimated structural depths of samples are listed in Table 2.2. All photos are viewed towards the NNE under crossed polarized light.
2.6.1.2. Quartz recrystallization mechanisms and microstructures in middle section of the Okanagan Valley shear zone - Domain 2
Elongated quartz ribbons and S-C fabrics indicate a top-to-the-WNW
sense of shear and a discontinuous increase in size in recrystallized quartz
grains in the upper section of Domain 2 (~300-500m) (Figs 2.7F,G; 2.8A,D).
These features are common in the northern limb and appear at the lowest
structural section in the southern limb of the pericline. Feldspar porphyroclasts in
Domain 2 generally show core-mantle structures with slight onset of asymmetric
pressures shadows in the form of sigma- and delta-type clasts indicating top-to-
the-WNW shear sense with a deformation temperature range of ~400-500 °C in
this part of the shear zone.
A discreet SGR to GBM transition occurs ~500-600m down structural
section indicating deformation temperatures of ~500 °C. Amoeboid grains with
relatively large recrystallized grain sizes and distinct lobate and inter fingered
serrated grain boundaries are observed, coupled with undulose extinction and

48
SGR along grain boundaries (Figs 2.7H; 2.8C). Further down section, amoeboid
quartz grains with generally larger recrystallized grain sizes and GBM suggest
deformation temperatures ranging from ~500°C to 650°C.
Figure 2.8. Photomicrographs of microstructures in order of increasing structural depth in the southern limb of the antiform.
49
(A) SGR within elongated quartz ribbons and core-mantle structures of feldspar porphyroclasts. (B) SGR within elongated quartz ribbons accompanied by increased recrystallized grain size with increasing structural depth. (C) SGR to GBM transition indicating ~500°C temperature of deformation; also includes sigma-type feldspar porphyroclast within elongated quartz ribbons. (D,E) GBR recrystallization within the syntectonic intrusive plutons indicating deformation temperatures of 500-650°C. Deformed symmetric feldspars make it difficult to determine a shear sense. There is a broad distribution of recrystallized grain size and core-mantle structures in feldspar porphyroclsasts. (F) GBM deformation of quartz in banded gneiss immediately south of the southern limb of the pericline. (G) Schematic vertical section of the southern antiformal limb showing approximate locations with respect to their approximate structural depth in the Okanagan Valley shear zone. All photos are viewed towards the NNE under crossed polarized light.
2.6.1.3. Quartz recrystallization mechanisms and microstructures near the base of the Okanagan Valley shear zone - Domain 3
Both the host gneiss and intrusive plutonic units towards the base of the
OVsz are characterized almost exclusively by GBM recrystallization and core-
mantle structures of feldspar porphyroclasts (e.g. Figs 2.8I, J; 2.9D,E; 2.12).
Quartz displays distinctive lobate, ameoboid texture indicative of deformation
temperatures ranging from 500-650°C.
Despite the overall increase in grain size, there appears to be a broader
distribution of recrystallized quartz grain size (e.g., Figs 2.7I; 2.8E). The relatively
smaller grains may be “island grains” (e.g., Stipp et al., 2002a) formed by an
increase in the size of lobate structures and interfingering, thus becoming
isolated from the remainder of the irregular crystal boundary. The absence of
chessboard extinction within quartz suggests the temperature of deformation did
not exceed 650°C. The gneissic units south of the southern antiformal limb show
primarily GBM recrystallization (Fig. 2.8F). This coupled with the core-mantle
structures and slight asymmetric delta-type porphyroclasts of the ‘augen’ feldspar
clasts indicate top-to-the-WNW shear sense with deformation temperatures of
500-650°C (Fig. 2.8F).
50
2.6.2. Quartz crystallographic preferred orientation analysis
2.6.2.1. Quartz crystallographic preferred orientations in the upper section of the Okanagan Valley shear zone -Domain 1
Towards the structural top of the OVsz (~50-150m), quartz c-axis fabrics
show asymmetric single girdles of basal <a>, rhomb <a> and prism <a> slip,
sinistrally inclined <15° with respect to the Y-Z plane (e.g. VT-12-154 and VT-12-
72; Fig. 2.9a, b), indicating top-to-west-northwest sense of shear and
deformation temperatures of 280-400 °C (Fig. 2.6) . The a-axis fabrics suggest a
deviation from plane strain towards constrictional strain near the structural top of
the OVsz (Fig. 2.9A, B). Further down the structural section of Domain 1, a
weakly developed top-to-the-WNW rhomb <a> and prism <a> fabric is observed
(e.g. Rec_2), suggestive of deformation temperatures of 400-500 °C (Fig. 2.9C).
This transition also corresponds to the possible onset of a weak six point maxima
of <a> axis fabrics bounding the stereoplot suggesting an onset of plane strain
conditions.
2.6.2.2. Quartz CPO fabrics in the middle section of the Okanagan Valley shear zone -Domain 2
Domain 2 is characterized by rhomb <a> and prism <a> slips suggesting
temperatures in the range of 400-500 °C (e.g.VT-12-111; Fig. 2.9D). It is difficult
to determine a sense of symmetry from most of the CPO fabrics in Domain 2 with
the exception of the top-to-the-ESE sense of shear observed for the FA fabric in
VT-12-166 (~500-600m down structural section). From ~400-600 m down
structural section, CPO patterns appear to indicate prism <a> slip, Y-axis
maxima with a temperature range of 500-650 °C (Figs. 2.9E, F; 2.10A).
Generally, the <a> axes across Domain 2 in both the northern and southern
51
limbs show point maxima suggesting plane strain deformation conditions (Figs.
2.9; 2.10).
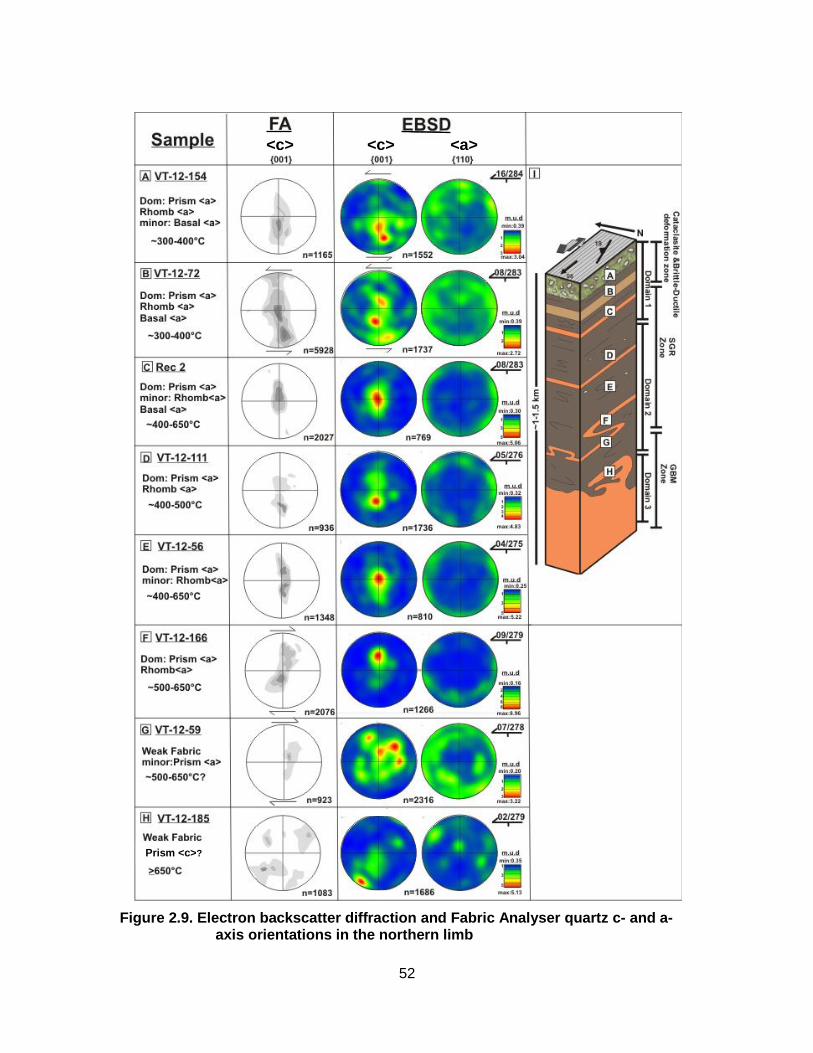
52
Figure 2.9. Electron backscatter diffraction and Fabric Analyser quartz c- and a-axis orientations in the northern limb
<c>
<c>
<a>
Prism <c>?

53
Fabrics shown in equal area lower hemisphere projections presented in order of increasing structural depth in the northern limb of the antiformal pericline. The c- and a-axis orientations are shown with respect {001} and {110} plane of the Miller index, respectively. Contouring of stereoplots is based on the mean uniform density (m.u.d.) with designated maximum and minimum values. (A-H) Quartz c-axis fabrics show a systematic progression of increasing temperature with increasing depth based on the active slip systems. The a-axes show a dominance of plane strain in the middle structural succession of the OVsz with a possible deviation towards constriction in the upper 200m of the structural succession. (I) Schematic vertical section of the northern antiformal limb showing approximate locations of Figs. 2.9A-H with respect to structural depth in the Okanagan Valley shear zone.
2.6.2.3. Quartz crystallographic preferred orientations in the lower section of the OVsz - Domain 3
The CPO fabric from the upper part of Domain 3 (~600-700m below the
top of the section) shows a distribution around the Y-pole of the stereoplot (Fig.
2.9G). This fabric occurs near the structural top of the quartz monzonite pluton
around the gradational contact with the host gneiss (e.g. VT-12-59) (Fig. 2.9I).
The weak EBSD fabric is difficult to interpret, but the FA fabric defines an
asymmetric top-the-the-ESE single girdle. The weak prism <a> with slight onset
of rhomb <a> slip may indicate deformation temperatures in the range of 400-500
°C, which appears to contradict the GBM recrystallization mechanism in the
sample. The weak a-axes orientations makes it difficult to determine a definitive
strain geometry.
The CPO fabric from a transposed leucocratic dike (VT-12-185) within the
gneiss near the base of the shear zone (>1000m) has a clear top-to-the-ESE
sense of shear (Fig. 2.9H). This could be interpreted as an asymmetric single
girdle of basal <a>, rhomb <a> and prism <a> slip indicating deformation
temperatures of 280-400 °C. Alternatively, the distribution of the c-axis plot could
also be interpreted to represent prism <c> slip with deformation temperatures
>650 °C. This is supported by the distribution of the a-axis plot, which suggests
plane strain conditions during prism <c> slip (see Fig. 2.6C).

54
Immediately south of the southern antiformal limb, the measured CPO
fabric (VT-12-30) indicates a strong prism <a> slip with a minor component of
rhomb <a> slip (Fig. 2.10B). The resultant asymmetric single girdle shows a top-
to-the-ESE fabric (Fig. 2.10B). This contradicts the mesoscopic kinematic
indicators, which indicate a top-to-the-WNW sense of shear (See Fig. 2.4F). The
a-axis plot suggests plane strain conditions (Fig. 2.10B). The c-axis orientation is
interpreted to indicate a temperature range of 400 to >500 °C.
Figure 2.10. Electron backscatter diffraction and Fabric Analyser quartz c- and a-axis orientations in order of increasing structural depth in the southern limb.
The c- and a-axis orientations are shown with respect {001} and {110} plane of the Miller index, respectively. Contouring of stereoplots based on the mean uniform density (m.u.d.) with designated maximum and minimum values. (A) CPO in the middle structural succession displays prism <a> slip, Y-axis maxima (500-650 °C). (B) Prism <a>, Y-maxima slip with a minor rhomb <a> component (400 to >500 °C). (C) Schematic vertical section of the southern antiformal limb showing approximate locations of Figs 2.10A-B with respect to their approximate structural depth in the OVsz.
<c>
<c>
<a>

55
2.6.2.4. Heterogeneity of crystallographic preferred orientations heterogeneities in microstructural domains
High-resolution images acquired from the FA analysis facilitate testing of
fabric homogeneity between microscale domains within a single thin section (Fig.
2.11). Measurements collected on a raster area across VT-12-72 primarily
display an asymmetric single girdle, yet also suggest the presence of prism <c>
slip (Fig. 2.11C). This heterogeneity can also be found within an individual
microscale domain (Fig.2.11E). This is the only analysed sample where this
microscale heterogeneity occurs. It is uncertain whether other microscale
heterogeneities occur throughout the shear zone.
The CPO data presented in Figures 2.9 and 2.10 were collected in several
quartz rich domains within individual thin sections, and therefore can be thought
of as representing a bulk CPO fabric for each thin section. Although these bulk
CPO fabrics are easier to interpret, they may not accurately reflect the CPOs
within individual quartz domains or the overall fabric heterogeneities at the thin
section scale. For instance, the bulk CPO fabric for VT-12-72 is interpreted as an
asymmetric sinistral single girdle with inferred deformation temperatures ranging
from 280 °C to 400 °C (Fig. 2.9B; 2.11). In contrast, an individual microscale
CPO domain appears to contain dominantly prism <c> slip with inferred
deformation temperatures >650 °C. This domain occurs within an inferred
transposed leucocratic intrusion (Fig. 2.11). The process responsible for the
formation of this microstructural domain is uncertain requiring further
investigation; particularly pertaining to the nature of the transposed intrusive
rocks with respect to the overall CPO fabric of the sample.

56
Figure 2.11. Individual microscale domains of quartz c-axis fabrics identified within VT-12-72 acquired using a Fabric Analyser.

57
(A) Plane polarized image of transposed felsic intrusive in which quartz CPO fabrics were measured. (B) High resolution false-colour digital image showing the variation in orientation of the main fabrics of all grains in the unit (assignment of false colours are based on a coloured stereogram shown in the bottom left corner). (C) Bulk raster of a selected section of this section showing a lower hemisphere projection of c-axis fabric with basal <a>, rhomb <a> and prism <a> in an asymmetric single girdle and a prism <c> girdle. (D) Basal <a>, rhomb <a> and prism <a> asymmetric single girdle restricted to lower domain based on random point accumulation. (E) Prism <c> girdle from quartz CPOs localized in upper domain based on random point accumulation.
2.6.2.5. Comparison between Electron backscatter diffraction and Fabric Analysis
In most samples both EBSD and FA yield similar results with minor
differences in the pole figures for several samples in the middle of the shear zone
within Domain 2 (e.g. VT-12-11 and VT-12-56). EBSD fabrics record Y-axis
maxima with minor rhomb <a> slip as opposed to more pronounced asymmetric
single girdles of prism <a> and rhomb <a> obtained by the FA in these samples.
This may be attributed to the EBSD data reduction and FA quality indices.
Additionally, the FA may negatively bias against prism <a> fabrics, since
INVESTIGATOR© may assign a low geometric and retardation quality for vertical
quartz crystals (Peternell et al., 2010). Because the grains in FA are manually
selected, this bias has been limited, as shown by numerous FA plots with a good
density of Y-maxima grains. This problem appears more pronounced when using
a general raster box in the automated mode.
58
2.7. Discussion
2.7.1. Three-dimensional distribution of deformation temperatures and strain in the Okanagan Valley shear zone
2.7.1.1. Variations in deformation temperatures with structural depth
Deformation temperatures indicated by quartz microstructures and c-axis
fabrics range from ~280°C to >650°C, increasing non-linearly with structural
depth beneath the inferred upper detachment surface of the OVsz (Figs 2.7; 2.8;
2.9; 2.10; 2.12). The progression of deformation temperatures obtained from
dynamic recrystallization mechanisms on the microstructural scale is broadly
compatible with deformation temperatures estimated from the c-axis fabrics down
the structural succession (Fig. 2.12). Isothermal surfaces have subsequently
been created based on the distribution of deformation temperature data across
the field area, which give an apparent geothermal gradient between 300-400 °C
km-1 across the OVsz.
The interpreted deformation temperature increases from <280°C to 400°C
in the upper 200 m of the shear zone, to up to ~400-500 °C 500 m down the
structural section (Fig. 2.12). Below a structural depth of 500 m, deformation
temperatures of 500-650 °C are recorded (Fig. 2.12). At a depth of ~1-1.5 km,
deformation temperatures appear to remain constant at <650 °C (Fig. 2.12). This
may be ascribed to a gradual reduction of the strain of the shear zone towards its
base, with a transition to a more conventional geothermal gradient (e.g. 25°C km-
1) below it. However, the prism <c> fabric of sample VT-12-185 (Fig. 2.9H) does
suggest the temperature of deformation in the OVsz at that location may have
exceeded 650°C. Another exception to the general pattern described above is
found within the southern limb of the antiform. Here, the lack of microstructural
evidence for deformation temperatures below 400 °C is in agreement with

59
mesostructural observations that demonstrate an absence of ultramylonites and
cataclasized mylonitic units that characterize Domain 1 where the relatively low
temperature fabrics are found. The lack of sufficient data makes it difficult to
provide an adequate explanation for the absence of Domain 1 in this limb.
Notably, throughout the study area there is no evidence of thermally-induced
static annealing across the OVsz. The lack of any recorded polygonal quartz
crystals with straight boundaries and 120° triple junctions due to grain boundary
area reduction (e.g. Passchier and Trouw, 2005) suggest that there was no
significant thermal relaxation of the shear zone during or after deformation.
Figure 2.12. Schematic diagram showing the apparent relationship between deformation temperatures with respect to structural depth
The data suggest an apparent geothermal gradient within the shear zone of approximately 300-400 °C km-1 over a vertical distance of ~1 km. † - samples not interpreted to be within antiformal limbs upon which structural depths are based.

60
Deformation temperatures indicated by c-axis fabrics and quartz
recrystallization mechanisms in samples from transposed leucocratic intrusive
dikes throughout the structural section appear to yield similar results (e.g
samples Rec-2; VT-12-111; VT-12-154; VT-12-166). These samples also appear
to yield similar deformation temperatures acquired from quartz-rich country rock
samples at similar structural levels (e.g. Rec-2 and VT-12-51), suggesting that
these transposed intrusions cooled to ambient background temperatures prior to
the cessation of penetrative deformation in the OVsz.
The observed individual microscale domain of prism <c> slip within a
leucocratic intrusion in VT-12-72 indicates deformation temperatures of >650 °C,
in contrast with the general inferred deformation temperature of ~280-400 °C for
the sample (Figs. 2.11; 2.12). The possible relict higher temperature from this
domain may be related to the transition from magmatic temperatures to solid-
state deformation temperatures in syntectonic intrusions. Lister and Williams
(1983) noted how CPO fabrics in quartz-rich samples not only follow trending
maxima where the angle of the girdle changes while tracking the finite strain
axes, but that the fabric can stay fixed in its relationship to the flow plane. Thus,
the magmatic crystallographic fabrics that developed at sub-granitic solidus
conditions prior to transposition of the intrusion may be preserved or locked
(hardened) into place. In this scenario, the magmatic fabric may pass seamlessly
into a >650 °C (prism <c>) solid-state fabric where the pre-existing fabric
influences the progressive CPO development during onset of plastic deformation
below the granite solidus.
Alternatively, domains with higher deformation temperatures in syntectonic
leucocratic intrusions could suggest the intrusions remained at higher
temperatures than the wall rocks when plastic deformation of quartz ceased and
fabrics were ’locked-in’. If so, these intrusions could have been emplaced during
a relatively late stage of penetrative deformation associated with the OVsz.
61
2.7.1.2. Interpretation of strain geometry variation with structural depth
A-axis fabrics generally suggest plane strain deformation across the OVsz
with a deviation towards constriction in the upper ~150m of the structural
succession (i.e. within Domain 1 in the northern antiformal limb) (e.g. Fig. 2.9).
Plane strain in general shear occurs where stretching in one direction is
compensated by flattening at right angles to the stretching direction, with Y = 1
and X > Y > Z with respect to the strain ellipsoid (Fossen, 2010). Sullivan (2013)
postulated that near plane strain progressive simple shear can create L-S
tectonites where the foliation occupies the direction of flattening perpendiular to X
on the X-Y plane. This arrangement is compensated by constriction
accommodated by the elongation lineations forming parallel to the X direction.
Within the study area, L-S tectonites predominate across the OVsz with L
tectonites becoming more pronounced towards the top of the section and
weakening towards the base (See section 2.4). For plane strain deformation
conditions, the active slip system typically controls the location of the fabric
maxima on the stereoplot, which in turn is diagnostic of deformation temperature
(Lister 1981, Sullivan and Beane, 2010). Therefore, the data in this study indicate
that deformation at mid-crustal amphibolite-facies occurred primarily under plane-
strain deformation conditions. There is an indication of possible slight
constrictional deformation that developed during progressive exhumation to
upper-crustal, greenschist- to sub greenschist-facies deformation (i.e. Domain 1)
as described in the northern limb.
2.7.1.3. Interpretation of shear sense from c-axis fabrics
The consistent top-to-the-WNW asymmetry of the c-axis fabric girdles in
the upper 400 m of the structural section (e.g. VT-12-72; VT-12-154) is
compatible with the mesoscopic shear-sense indicators. However, several of the
c-axis fabrics deeper in the structural section suggest top-to-the-ESE sense of
62
shear (e.g. VT-12-11; VT-12-30; VT-12-166). It is unclear what their significance
is with respect to the penetrative deformation in the OVsz. These fabrics could
represent preserved penetrative deformation linked with the northeast-directed
compressional phase of the Shuswap metamorphic complex either preceding or
synchronous with top-to-the-WNW deformation higher up in the shear zone. A
similar switch in asymmetry was documented by Johnson and Brown (1996)
farther north along a transect between Sicamous and Revelstoke, British
Columbia. Johnson and Brown (1996) noted a kinematic reversal from W-direct
to NE-directed shear sense occurred within deeper levels of OVsz footwall
domain at ~ 2 km depth. Alternatively, the opposing shear sense documented in
this study could be attributed to non-coaxial deformation with a significant pure
shear component in plane strain that resulted in coeval, oppositely directed
fabrics that formed as conjugates oblique to the principal strain axes. However,
there is no evidence in the data of this study that supports this explanation, aside
from the reversal in shear sense.
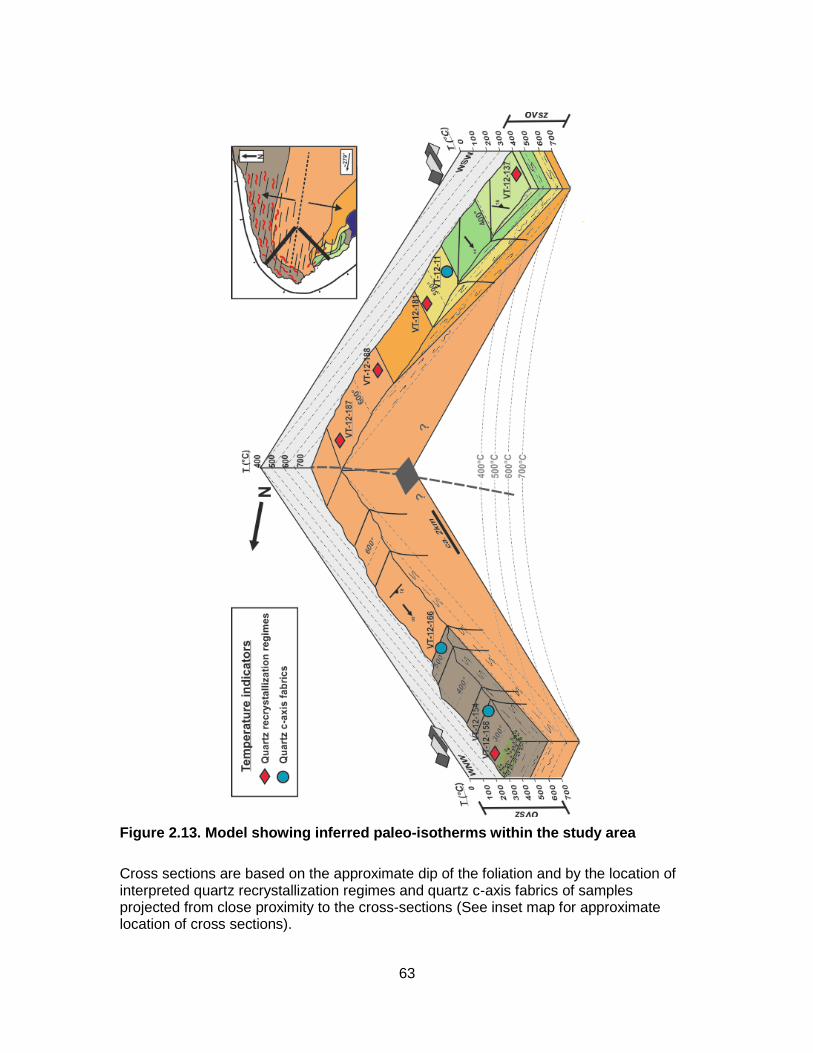
63
Figure 2.13. Model showing inferred paleo-isotherms within the study area
Cross sections are based on the approximate dip of the foliation and by the location of interpreted quartz recrystallization regimes and quartz c-axis fabrics of samples projected from close proximity to the cross-sections (See inset map for approximate location of cross sections).
64
2.7.2. Inferred minimum ages of the quartz deformation structures during exhumation
The quartz microstructures and CPO fabrics are interpreted to be mostly
Eocene in age, constrained with U-Pb zircon crystallization and 40Ar/39Ar cooling
ages from the gneissic and intrusive rocks within the OVsz from previous studies
(Medford, 1975; Bardoux, 1993; Parrish et al., 1988; Johnson and Brown, 1996;
Brown et al., 2012). Deformation temperature estimates from this study are in
agreement with the closure temperature range for K/Ar and 40Ar/39Ar cooling
ages obtained on rocks within the OVsz that track its Eocene exhumation within
and around the study area (Medford, 1975; Bardoux, 1993). Hornblende samples
typically cooled below 550°C (McDougall and Harrison, 1999) between ~53 and
48.5 Ma (Medford, 1975; Bardoux, 1993). Muscovite ages indicate the OVsz
cooled below 350 °C at ~50 Ma and biotite below 280 °C (McDougall and
Harrison, 1999) at 48.7 Ma. Apatite and titanite fission-track ages within the
cataclasite rocks suggest the carapace was near surface by at least ~47±1 Ma
(Medford, 1975; Bardoux, 1993). The overlap between the hornblende and mica
cooling ages suggests rapid exhumation of the footwall by ductile shearing along
the OVsz at an average rate of 4 km/Myr between 54 Ma and 48 Ma while
cooling from ~650°C to <280°C (Bardoux, 1993).
Bardoux (1993) dated intrusive felsic bodies within the OVsz immediately
north of the study area, which indicate shearing may have started as early as 56
Ma. Immediately south of the study area, Brown et al. (2012) obtained zircon
crystallization ages of ~53-50 Ma for syntectonic felsic intrusives and anatectic
leucosome interpreted to have formed at >20 km depth. The overlap in time of
the 40Ar/39Ar cooling ages of Bardoux (1993) and of the zircon crystallisation of
Brown et al. (2012) is consistent with the rapid exhumation facilitated by the
OVsz.
65
The apparent overlap of zircon crystallization and 40Ar/39Ar cooling ages
summarized above may also imply that higher temperature, mid-crustal ductile
deformation and upper-crustal lower temperature brittle-ductile deformation
occurred simultaneously. However, this hypothesis does not fully explain the
apparent elevated geothermal gradient in the OVsz of ~300-400 °C km-1 in a
vertical distance of ~1-1.5 km (Figs. 2.12; 2.13). Deformation with a significant
component of pure shear or vertical shortening may account for the apparent
telescoping of isotherms in the immediate footwall of the OVsz during
exhumation. This scenario, along with other possible mechanisms, is discussed
below.
The bulk of quartz microstructures and CPO fabrics presented in this
study are interpreted to have formed during exhumation of the OVsz from the
mid-crust to progressively shallower crustal levels during WNW-ESE-directed
extension. This progression is supported by the apparent decrease in
metamorphic grade towards the structural top of the shear zone. Deformation
temperatures deeper in the structural section (i.e. Domain 3) demonstrate
amphibolite-facies deformation and metamorphism, compatible with exhumation
from the mid-crust. To the south, within the OVSZ, geothermobarometric data
suggest exhumation from at least ~17-23 km depth during Eocene deformation
(c.f. Fig. 4; Brown et al., 2012). Deformation temperatures progressively
decrease up structural section with greenschist-facies deformation (i.e. upper
Domain 2 and Domain 1) overprinting amphibolite-facies structures, followed by
brittle deformation overprinting ductile fabrics towards the structural top of
Domain 1. The microstructural and metamorphic gradation suggests mid-crustal
ductile fabrics may have been capped by lower temperature structures that
formed progressively nearer to the surface as the detachment evolved and its
deeper levels were progressively exhumed to shallower levels.

66
2.7.3. Geometrical criteria and flow associated with telescoping of isotherms and exhumation in the immediate footwall of the Okanagan Valley shear zone
The inferred telescoping of isotherms that define an apparent geothermal
gradient of ~300-400 °C km-1 in the OVsz during the Eocene (Fig. 2.13) is
possibly the result of several geometric and tectonic factors either working
singularly or in unison. Pressure-temperature estimates from Bardoux (1993) and
Brown et al. (2012) indicate paragneissic domains within the OVsz equilibrated in
the early Eocene at 670 °C ± 50 °C and 6 ± 1 kbar, equivalent to ~17-23 km
depth. Based on these estimates, the initial Eocene geothermal gradient is
estimated to lie between 30-39 °C km-1 (See Appendix D for calculations). Below,
we discuss how several parameters such as the coaxiality, magnitude and
velocity of flow in principally plane strain deformation could explain the intense
telescoping of isotherms. These parameters are incorporated into a conceptual
model which proposes how isotherms ranging within ~280 °C to >650 °C were
telescoped from their original vertical separation of ~9-15 km to a final separation
of 1-1.5 km during exhumation (See Appendix D for calculations).
Shear-sense indicators from both field and microstructural analysis
indicate that penetrative deformation within the OVsz involves non-coaxial
deformation. Therefore, a simplified two-dimensional particle displacement model
for exhumation with a non-coaxial component is adopted (e.g. Law et al., 2011)
to account for the telescoping of the ~280 °C to >650 °C isotherms to a final
separation of 1-1.5 km (Figs. 2.12; Fig. 2.13; See Appendix D). This model is
based on the premise that particles move along different parallel paths in the
shear zone with the orientation of the flow planes parallel to the foliation planes,
with differential transport-parallel motion between the particles (Fig.2.14; Law et
al., 2011). For the sake of simplicity, the isotherms are assumed to be originally
horizontal, inclined to the detachment surface at an angle equal to the
detachment dip (Fig. 2.14). Several other geometric variables include the dip

67
angle of the detachment and the original vertical spacing between isotherms for
which we assume a prevailing linear geothermal gradient (Fig. 2.14; Law et al.,
2011). A component of shortening from the observed non-coaxial shear is likely
to have reduced both the original angle between the detachment and isotherms
and the vertical spacing between the original isotherms, although it is unlikely to
have been a sufficient amount to explain the observed telescoping of the
isotherms vertical shortening of ~85-92% (see Appendix D). Simultaneously,
however, the transport parallel stretching produced by this shortening contributes
to the shear plane-parallel displacements, thereby lengthening the particle path
in primarily plane strain conditions. It should be stressed that this model is solely
geometric with no account of thermal processes such as chilling of the hotter
footwall against the cooler hanging wall, thermal relaxation, or the influence of
syntectonic plutonic activity. Furthermore, the potential role of circulating fluids on
the geothermal gradient during deformation is not factored in this model. For
instance, any influence on an elevated transient geotherm during deformation
from a potential influx of cool surface fluids into the shear zone is not considered
(e.g. Gottardi et al., 2011).
Quartz microstructures and CPO fabrics used to infer deformation
temperatures are interpreted to be the product of exhumation-related shearing
and cooling, with the recorded fabrics for individual particles being ’locked-in’ at
progressively higher levels and cooler temperatures as the shear zone
manoeuvres during exhumation. Therefore, assuming that the original
metamorphic mineral assemblages, microstructures, and CPO fabrics were not
reset at lower temperatures after movement along their respective exhumation
paths, the telescoping of the isotherms indicated by these thermometers would
result in steeper apparent thermal gradients (Fig. 2.14).
Although the OVsz is interpreted to have rapidly exhumed to the upper
crust during the Eocene, there is little definitive data on the absolute timing for
when the individual observed microstructures and CPO fabrics either
68
commenced, or were ’locked-in’ during exhumation. It is difficult to decipher
whether penetrative deformation down the exposed structural section could have
been simultaneously active or occurred diachronously throughout the shear
zone. Based on the observations in this study, It is most likely diachronous, but
over a very short range of geologic time.
We therefore propose a model whereby the active zone of penetrative
deformation became narrower up structural section near the Earth’s surface (Fig.
2.14). This progression would result in microstructures and CPO fabrics in
structurally lower rocks with originally higher deformation temperatures to be
‘locked-in’ as they migrated out of the active zone of deformation during
exhumation of the footwall to upper crustal levels (Fig. 2.14). Once locked in,
these higher temperature fabrics were passively exhumed along a trajectory that
resulted in their progressive juxtaposition against lower temperature fabrics that
were being generated in the active part of the shear zone (Fig. 2.14). There is a
component of overprinting of the lower temperature fabrics on the higher
temperature fabrics but this was confined to structurally higher levels where the
shear zone narrowed approaching the surface. Thus, the deepest level fabrics
remained relatively unscathed during exhumation. The progressive increase in
the inferred deformation temperatures down structural section in this study
supports this model.
Furthermore, similar to the low-angle South Tibetan Detachment System
in the Himalayas, progressive accretion of relatively cooler rocks during
exhumation would result in progressive telescoping and translation of rocks
deformed at different crustal depths and temperatures (Cottle et al., 2011). This
juxtaposition of rocks from progressively deeper structural levels would result in
the formation of a condensed section with an apparent smooth gradient in
deformation temperatures.
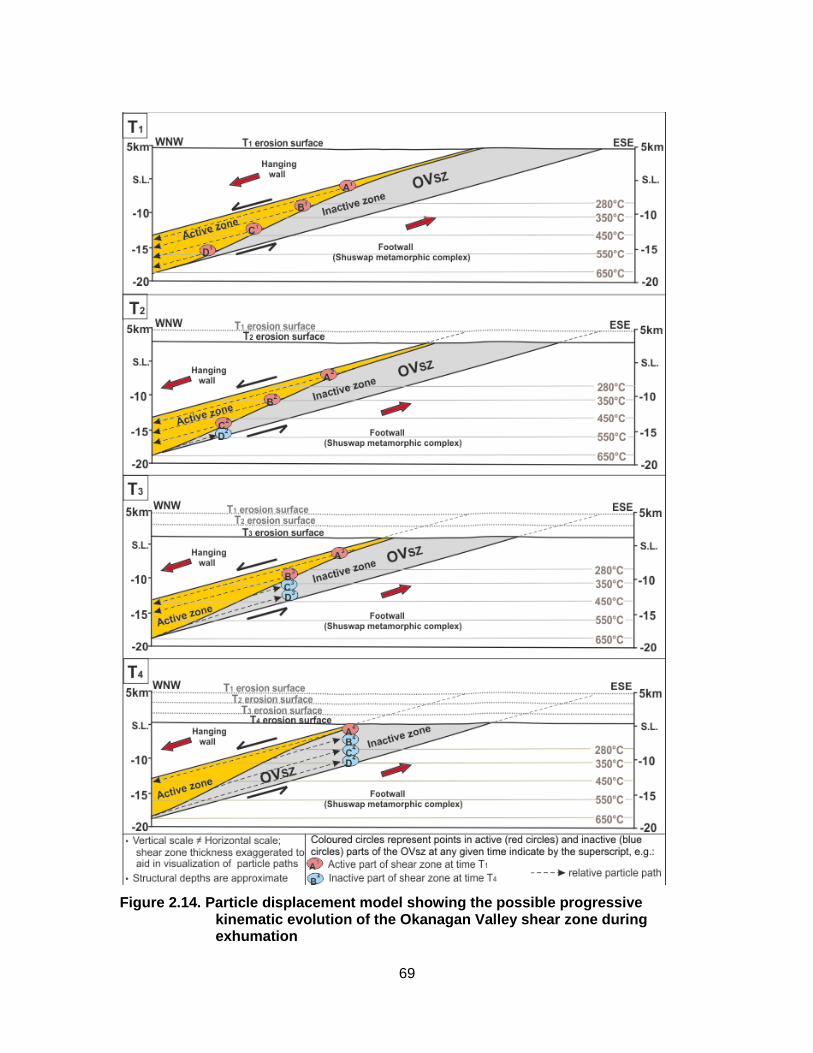
69
Figure 2.14. Particle displacement model showing the possible progressive kinematic evolution of the Okanagan Valley shear zone during exhumation
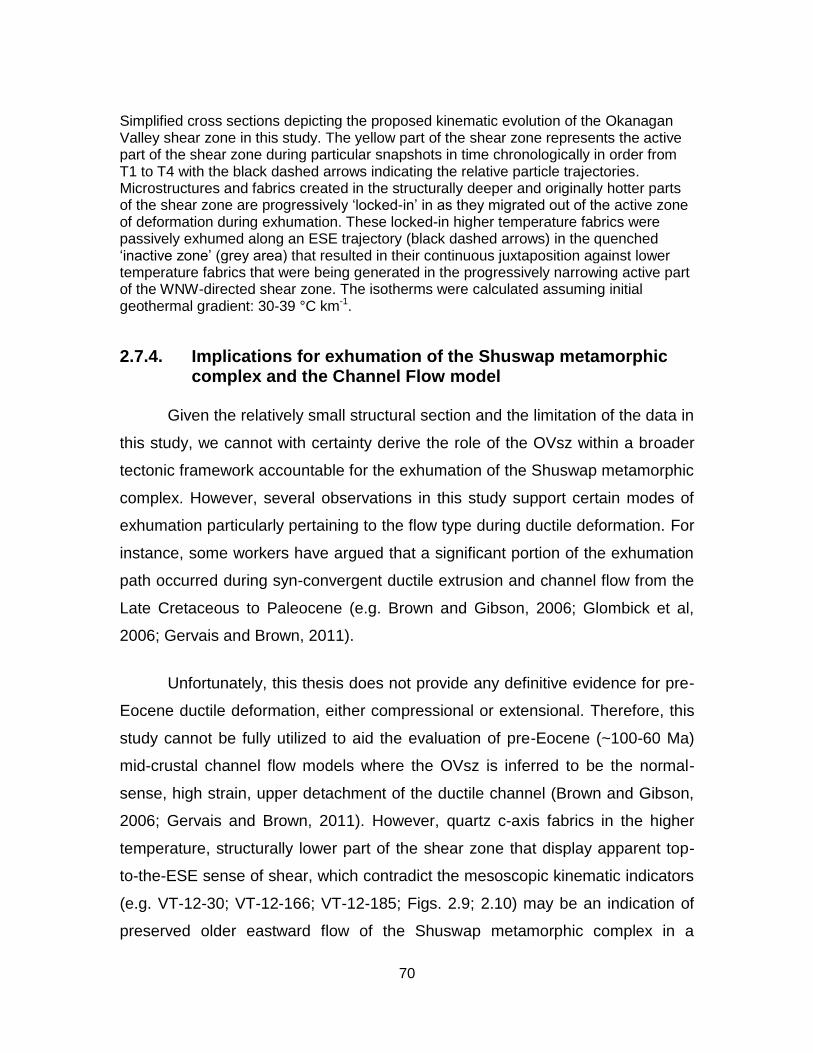
70
Simplified cross sections depicting the proposed kinematic evolution of the Okanagan Valley shear zone in this study. The yellow part of the shear zone represents the active part of the shear zone during particular snapshots in time chronologically in order from T1 to T4 with the black dashed arrows indicating the relative particle trajectories. Microstructures and fabrics created in the structurally deeper and originally hotter parts of the shear zone are progressively ‘locked-in’ in as they migrated out of the active zone of deformation during exhumation. These locked-in higher temperature fabrics were passively exhumed along an ESE trajectory (black dashed arrows) in the quenched ‘inactive zone’ (grey area) that resulted in their continuous juxtaposition against lower temperature fabrics that were being generated in the progressively narrowing active part of the WNW-directed shear zone. The isotherms were calculated assuming initial geothermal gradient: 30-39 °C km-1.
2.7.4. Implications for exhumation of the Shuswap metamorphic complex and the Channel Flow model
Given the relatively small structural section and the limitation of the data in
this study, we cannot with certainty derive the role of the OVsz within a broader
tectonic framework accountable for the exhumation of the Shuswap metamorphic
complex. However, several observations in this study support certain modes of
exhumation particularly pertaining to the flow type during ductile deformation. For
instance, some workers have argued that a significant portion of the exhumation
path occurred during syn-convergent ductile extrusion and channel flow from the
Late Cretaceous to Paleocene (e.g. Brown and Gibson, 2006; Glombick et al,
2006; Gervais and Brown, 2011).
Unfortunately, this thesis does not provide any definitive evidence for pre-
Eocene ductile deformation, either compressional or extensional. Therefore, this
study cannot be fully utilized to aid the evaluation of pre-Eocene (~100-60 Ma)
mid-crustal channel flow models where the OVsz is inferred to be the normal-
sense, high strain, upper detachment of the ductile channel (Brown and Gibson,
2006; Gervais and Brown, 2011). However, quartz c-axis fabrics in the higher
temperature, structurally lower part of the shear zone that display apparent top-
to-the-ESE sense of shear, which contradict the mesoscopic kinematic indicators
(e.g. VT-12-30; VT-12-166; VT-12-185; Figs. 2.9; 2.10) may be an indication of
preserved older eastward flow of the Shuswap metamorphic complex in a
71
proposed Late Cretaceous to Paleocene viscous channel. This would, in turn,
predict that the quartz microstructures towards the base of the shear zone in the
country rock may be preserving pre-Eocene fabrics. If so, these fabrics may have
formed during relatively higher flow velocities under a significant component of
pure shear, telescoping the isotherms prior to Eocene exhumation (Fig. 2.16).
Nonetheless, the top-to-the-ESE fabric could still be further telescoped during
Eocene exhumation. The greater component of pure shear under plane strain
deformation conditions towards the base of the OVsz may have resulted in
oppositely flowing, top-to-the-ESE shear as a result of simultaneous transport-
parallel stretching. Local and thermal anomalies are also not factored in this last
hypothesis. Clearly, further thermo-kinematic and geochronological analyses are
required along the entire structural section of the Shuswap metamorphic complex
from the OVsz to the immediate hanging wall of the Monashee décollement to
decipher the flow profile associated with deformation and exhumation.
2.7.5. Implications regarding discrepancies along strike of the OVsz
The affirmation of the OVsz as a crustal-scale extensional detachment in
this thesis appears incompatible with studies around the vicinity of Vernon and
Osoyoos (Fig. 2.17; Okulitch, 1979, 1987; Thompson and Unterschutz, 2004;
Glombick et al., 2004; Glombick et al., 2006a,b; Massey and Duffy, 2007).
Several of these studies have questioned the significance of the OVsz as a major
crustal-scale detachment (e.g. Thompson and Unterschutz 2004; Glombick et al.,
2006a,b). Hanging wall rocks mapped in a series of semi-continuous
unconformable outliers across the trace of the OVsz within its footwall domain
are used as evidence to suggest the footwall was not exhumed by a km-scale
crustal detachment (e.g. Glombick et al., 2006a). A zone of northeast-directed
channelized ductile flow between the overlying superstructure, including hanging

72
wall rocks of the OVsz, and the underthrusting of a crystalline basement crustal-
scale ramp is interpreted to have developed in the Late Cretaceous to early
Paleogene (Glombick et al., 2006a). Furthermore, the observation that non-
coaxial mylonites are not continuously exposed along the entire strike of the
OVsz, but appear in "pockets", further complicates interpretation of the OVsz as
a crustal-scale detachment (Glombick et al., 2006a).
Alternatively, the discrepancies mentioned above may due to the
formation of displacement parallel, syn-extensional open, upright, multi-scale
folds, referred to as corrugations, which affect the map-scale geometry of the
OVsz (Fig. 2.17; Brown, 2010). Syn-extensional corrugations such as these are
inherent features commonly observed within extensional shear zones flanking
core complexes, with hinges that parallel the direction of extensional
displacement (Spencer, 1999; Singleton & Mosher, 2012). The corrugations that
affect the OVsz are defined by the change in direction of the dip of the average
contoured foliation and may explain the changes in lithology and shear zone
angle along strike (Christie, 1973; Ryan 1973; Ross, 1981; Brown, 2010; this
study). Hanging wall units that encroach into the footwall domain of the OVsz
occur in synformal lows where the fault dip is shallow (Christie 1973; Ryan 1973;
Ross 1981; Bardoux, 1993; Brown, 2010). In contrast, granitoid units and the
high-grade gneiss of the footwall occur in antiformal highs where the shear zone
arches over them at a higher angle (Christie, 1973; Ryan 1973; Ross, 1981;
Brown, 2010; this study).
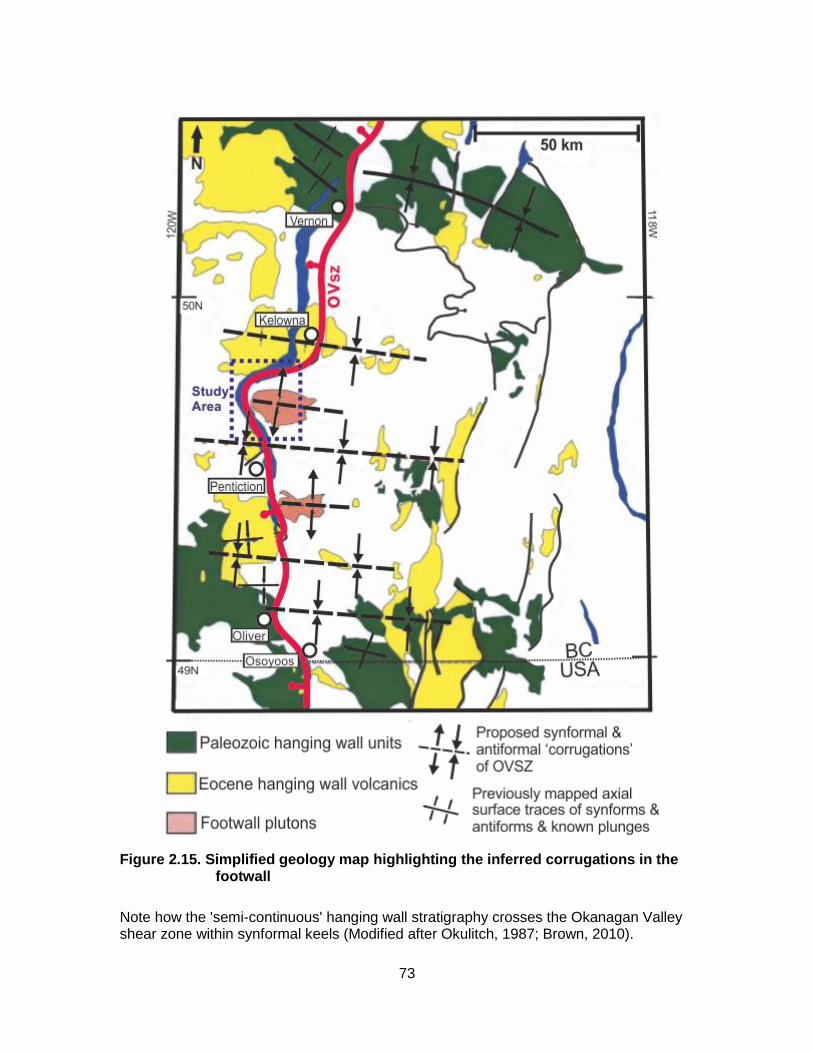
73
Figure 2.15. Simplified geology map highlighting the inferred corrugations in the footwall
Note how the 'semi-continuous' hanging wall stratigraphy crosses the Okanagan Valley shear zone within synformal keels (Modified after Okulitch, 1987; Brown, 2010).
74
Lithological mapping in this study appears compatible with this
hypothesis. The attitude of the foliation of the mylonitic gneiss in the study area
defines a west-northwest trending, kilometre-scale, open, upright, antiform cored
by a monzonitic to syenitic pluton (see Chapter 2). This antiform is interpreted to
belong to one of a series of kilometre-scale antiformal corrugations (Brown,
2010; Fig. 3.2). The augen gneissic unit in the south end of the study area (see
section 2.4.1) may be beyond the inflection point of the antiform, representing the
outer northern limb of a synformal keel.
The OVsz is interpreted to have developed in a transtensional regime (e.g.
Price and Carmichael, 1986; Harms and Price, 1992). As alluded to above, in
similar tectonic settings, the occurrences of warped or corrugated detachments
are commonly observed (Bartley et al., 1990; Chauvet and Seranne, 1994; Kurz
and Neubauer, 1996; Spencer, 1999; Singleton, 2013). The observation that the
fold axes are parallel to the inferred extensional direction, coupled with the
minimal deflection of the metamorphic isograd surfaces, suggests these
undulations are syn-extensional rather than forming during a later folding event
(Christie 1973; Ryan 1973; Ross 1981; Bardoux, 1993; Brown, 2010; this study).
To further test the corrugations hypothesis, future projects could collect
microstructural and petrofabric data along strike of the OVsz to check for
variations that could be attributable to antiformal or synformal corrugations. For
instance, quartz recrystallization mechanisms and petrofabrics in this study were
collected on the limbs of an antiformal pericline with samples selected based on
their approximate structural depth. These limbs were prioritized due to the
apparent ease of approximating their location within the structural section and to
maintain lithological consistency between the samples. Future mapping projects
may utilize similarly styled structural transects and sampling strategies in
individual antiformal and synformal corrugations. Transects could compare
kinematic data from limb to hinge to limb to decipher how non-coaxiality of flow,
strain geometry, sense of shear and deformation temperatures vary across a
folded surface of the OVsz. Additionally, this system could be utilized to compare

75
the thermo-kinematic data of the exposed antiformal periclines with adjacent
synformal keels along strike of the OVsz.
2.7.6. Formation of late, high angle faults within footwall domain
Along-strike warping of the detachment is possibly a late stage feature
owing to rapid exhumation (vertical transport) and doming of the lower plate (i.e.,
a nascent metamorphic core complex), and is often synchronous with, or
postdates, the formation of extension-parallel folds (Spencer, 1982; Buck, 1988;
Wernicke and Axen, 1988; Bartley et al., 1990; Spencer and Reynolds, 1991).
The axis of doming of the detachment is inferred to be transient (i.e. rolling hinge;
Buck, 1988), so that all of the detachment and hanging wall are warped to some
degree before the upper plate is eventually breached to form an exposed
metamorphic core complex. The final stage of this warping is possibly seen in the
study area by the high-angle, brittle fractures striking perpendicular to the
direction of extension attributed to isostatic bending stresses related to footwall
rollover as the gneisses and plutonic rocks (footwall of the OVsz) were exhumed
to the surface (Tucholke et al., 1998).
76
2.8. Conclusions
1. Detailed structural and bedrock mapping coupled with quartz
recrystallization mechanisms and crystallographic preferred orientation
(CPO) analysis corroborates the OVsz as a major, crustal-scale
extensional detachment that exhumed rocks from the middle crust that
were metamorphosed at amphibolite-facies conditions.
2. Three lithostructural domains are defined within the OVsz that grade
structurally downward from: the upper 200 m of the vertical structural
section consisting of cataclasite and ultramylonite (Domain 1); to
greenschist and amphibolites-facies mylonites from ~200-600 m (Domain
2); and at 600-1500 m, weakly to moderately developed mylonites
interfingered with a weakly- to undeformed pluton (Domain 3). The
relatively lower deformation temperatures and brittle overprint of Domain 1
are localized in the northwestern part of the study area where the attitude
of the foliation defines the northern limb of an antiform that warps the
shear zone.
3. Meso- to microstructural kinematic indicators down the structural section
are characterized by a consistent top-to-the WNW sense of shear with a
few quartz c-axis fabrics deeper in the shear zone indicating a top-to-the
ENE shear sense.
4. The bulk of quartz a-axis patterns suggest general plane strain conditions
across the shear zone with slight onset of constrictional strain towards the
structural top of Domain 1.
77
5. Deformation temperatures indicated by quartz recrystallization
mechanisms and quartz c-axis fabrics range from ~280 to >650 °C and
progressively increase with respect to structural depth beneath the
inferred upper surface of the detachment. Estimated isothermal surfaces
are projected within the study area and are broadly parallel to the dip of
the penetrative foliation planes. The observed telescoping of ~280-650 °C
isotherms within a ~1-1.5 km vertical structural section suggests an
elevated geotherm in the range of 300-400 °C/km in the immediate
footwall of the OVsz.
6. We propose a model whereby microstructures and CPO fabrics in
structurally lower rocks with originally higher deformation temperatures to
be ‘locked-in’ as they migrated out of the active zone of deformation during
exhumation of the footwall to upper crustal levels. These locked-in higher
temperature fabrics were passively exhumed along an ESE trajectory that
resulted in their continuous juxtaposition against lower temperature fabrics
that were being generated in the progressively narrowing active part of the
WNW-directed shear zone. The component of overprinting of the lower
temperature fabrics on the higher temperature fabrics was confined to
structurally higher levels where the shear zone narrowed approaching the
surface with the deepest level fabrics remained relatively unscathed during
exhumation.
78
Chapter 3. Conclusions
The Shuswap metamorphic complex in the southern Canadian Cordillera
formed in response to a period of crustal thickening in excess of 55 km following
a compressional phase during the Mesozoic and Paleogene (Brown et al., 1986;
Parrish et al., 1988; Price and Monger, 2002; Brown and Gibson, 2006; Gibson
et al., 2008). Deeply buried parts of the complex were exhumed to upper crustal
levels during the Eocene (Tempelman-Kluit and Parkinson, 1986; Parrish et al.,
1988; Parrish 1995) in response to a change from transpression to transtension
between the North American and Pacific plates during the Paleogene (Ewing,
1980; Price and Carmichael, 1986). Eocene exhumation of the southern
Shuswap metamorphic complex was, in part, facilitated by crustal-scale
extension along the Okanagan Valley shear zone (OVsz) (Tempelman-Kluit and
Parkinson, 1986; Parrish et al., 1988; Bardoux, 1993; Johnson and Brown, 1996;
Johnson 2006; Brown et al., 2012). The shear zone marks the western-most, and
structurally-highest margin of the Shuswap metamorphic complex exhibiting a
major metamorphic and thermochronological offset, juxtaposing the penetratively
deformed amphibolite to granulite-facies rocks of the Shuswap metamorphic
complex in the footwall to the east with greenschist-facies to unmetamorphosed
hanging wall rocks to the west (Tempelman-Kluit and Parkinson, 1986; Parrish et
al., 1988; Bardoux, 1993; Johnson and Brown, 1996; Johnson 2006; Brown et
al., 2012). The OVsz is characterized by a < 30° west-dipping, 1-2 km-thick,
ductile shear zone capped by a brittle detachment surface. The OVsz includes
prominent west-northwest trending elongation lineations with fabrics consistently
indicative of relative WNW displacement of the hanging wall (Parkinson, 1985;
79
Journeay and Brown, 1986; Tempelman-Kluit and Parkinson, 1986; Bardoux,
1993; Brown et al., 2012; this study).
The OVsz in the vicinity of the Okanagan Mountain Provincial Park in
southern BC is warped by a west-northwest trending, kilometre-scale, open,
antiform that is interpreted to be one of the antiformal corrugations that
characterize the OVsz (Brown, 2010). Here, the OVsz grades upwards from a
non- to weakly mylonitized syntectonic pluton, to mylonitic to ultramylonitic ortho-
and paragneiss and tectonized felsic intrusions, with a thin band of cataclasite at
the top of the section. Deformation temperatures indicated by quartz
recrystallization mechanisms and quartz c-axis fabrics from these rocks range
from ~280 to >650 °C, and progressively increase with respect to structural depth
beneath the inferred upper detachment. Quartz a-axis patterns suggest
deformation occurred primarily under general plane strain conditions with slight
onset of constrictional strain towards the structural top of the shear zone. Inferred
isothermal surfaces are broadly parallel to the dip of the penetrative foliation
planes. The observed telescoping of the ~280 to 650 °C isotherms within a ~1-
1.5 km vertical structural section suggests an elevated geotherm in the range of
300-400 °C per km in the immediate footwall of the OVsz.
This intense telescoping of isotherms could have been due to
microstructures and CPO fabrics in structurally lower rocks with originally higher
deformation temperatures being ‘locked-in’ as they migrated out of the active
zone of deformation during exhumation of the footwall to upper crustal levels,
These higher temperature fabrics were passively exhumed along a trajectory that
resulted in their continuous juxtaposition against lower temperature fabrics that
were being generated in the progressively narrowing active part of the shear
zone in higher crustal levels. This resulted in an apparent compression of
deformation isotherms within the 1-1.5 structural section of the OVsz.
80
References
Archibald, D.A, Krough, T.E., Armstrong, RL., and Farrar, E. 1984. Geochronology and tectonic implications of magmatism and metamorphism, southern Kootenay arc and neighboring regions, southeastern British Columbia. Part II: mid-Cretaceous to Eocene. Canadian Journal of Earth Sciences 21, 567-583.
Armstrong, R 1982. Cordilleran metamorphic core complexes - from Arizona to southern Canada. Annual Reviews of Earth Planetary Science 10, 129-154.
Armstrong, RL., Parrish, RR, van der Heyden, P., Scott, K., Runkle, D., and Brown, RL. 1991. Early Proterozoic basement exposures in the southern Canadian Cordillera: core gneiss of Frenchman Cap, Unit I of the Grand Forks Gneiss, and the Vaseaux Formation. Canadian Journal of Earth Sciences 28, 1161-1201.
Axen, G.J. 2004.Mechanics of low-angle normal faults: in Karner, G. , Taylor, B., Driscoll, N., and Kohlstedt, D.L. (eds.) Rheology and Deformation in the Lithosphere at Continental Margins, Columbia University Press, 46-91.
Bardoux, M. 1993. The Okanagan Valley normal fault from Penticton to Enderby-Southcentral British Columbia. Ph.D. Dissertation, Carleton University, Ottawa, Ontario, 292 p.
Bardoux, M., Mareschal, J.-C., 1994. Extension in south-central British Columbia; mechanical and thermal controls. Tectonophysics, 238(1-4): 451-470.
Barth, N.C., Hacker, B.R., Seward, G.G.E., Walsh, E.O., Young, D., Johnston, S., 2010. Strain within the ultrahigh-pressure western Gneiss region of Norway recorded by quartz CPOs. In: Law, R., Butler, R., Holdsworth, R., Krabbendam, M., Strachan, R. (Eds.), Continental Tectonics and Mountain Building: The Legacy of Peach and Horne. Geological Society, London, Special Publication.
Bartley, J. M., Fletcher, J. M., and Glazner, A. F. 1990. Tertiary extension and contraction of lower-plate rocks in the central Mojave metamorphic core complex, southern California. Tectonics 9, 521- 534.
81
Beaumont, C., Jamieson, R.A., Nguyen, M.H., and Lee, B. 2001. Himalayan tectonics explained by extrusion of a low-viscosity crustal channel coupled to focused surface denudation. Nature 414, 738-742.
Beaumont, C., Jamieson, R.A., Nguyen, M.H., and Medvedev, S. 2004. Crustal channel flows: 1. Numerical models with applications to the tectonics of the Himalayan-Tibetan orogen. Journal of Geophysical Research 109.
Beranek, L. P., Mortensen J. K., Orchard, M.J., and Ullrich, T. 2010. Provenance of North American Triassic strata from west-central and southeastern Yukon; correlations with coeval strata in the Western Canada Sedimentary Basin and Canadian Arctic Islands. Canadian Journal of Earth Sciences 47(1): 53-73.
Blumenfeld, P., Mainprice, D. and Bouchez, J.L., 1986. C-slip in quartz from subsolidus deformed granite. Tectonophysics 127, pp. 97-115.
Brown, R. L. and J. M. Journeay 1987. Tectonic denudation of the Shuswap metamorphic terrane of southeastern British Columbia, Geology 15(2), 142-146.
Brown, RL. and Carr, S.D. 1990. Lithospheric thickening and orogenic collapse within the Canadian Cordillera. In Proceedings, Pacific Rim Congress 90, University of Queensland,Brisbane, Australia 2, 1-10.
Brown, R.L., Gibson, H.D., 2006. An argument for channel flow in the southern Canadian Cordillera and comparison with Himalayan tectonics. In: Law, R.R., Searle, M.P., Godin, L. (Eds.), Channel flow, ductile extrusion and exhumation in continental collision zones. Geological Society special publication. Geological Society, London, pp. 543-559.
Brown, S.R., 2010. Geology and Geochronology of the Southern Okanagan Valley Shear Zone, Southern Canadian Cordillera, British Columbia, Simon Fraser University, Burnaby, 320 pp.
Brown, S. R., Gibson, H. D., Andrews, G.D.M., Thorkelson, D.J., Marshall, D.D., Vervoort, J.D., Rayner N., 2012. New constraints on Eocene extension within the Canadian Cordillera and identification of Phanerozoic protoliths for footwall gneisses of the Okanagan Valley shear zone. Lithosphere 4, 354-377.
Brown, R. L. Journeay, J. M. Lane, L. S. Murphy,D. C. Rees, C. J. 1986. Obduction, backfolding and piggyback thrusting in the metamorphic hinterland of the southeastern Canadian Cordillera, Journal of Structural Geology 8, 255-268, doi:10.1016/0191-8141(86)90047-7.
Buck, W.R 1988. Flexural rotation of normal faults. Tectonics 7, 959-973.

82
Chauvet, A, and Seranne, M. 1994. Extension-parallel folding in the Scandinavian Caledonides: implications for late-orogenic processes. Tectonophysics 238, 31-54.
Christie, J.S., 1973. Geology of the Vaseaux Lake Area, University of British Columbia, 139 pp.
Church, B.N. 1973. Geology of the White Lake Basin, British Columbia. Department of Mines and Petroleum Resources, Bulletin 61, 3-141.
Church, B.N. 1985. Volcanology and structure of Tertiary outliers in south-central BritishColumbia. Field Trip Guidebook, B.C. Ministry of Energy. Mines, and Petroleum Resources, 46p.
Colpron, M. Warren, M. J. Price, R. A. 1998. Selkirk fan structure, southeastern Canadian Cordillera: Tectonic wedging against an inherited basement ramp, Geol. Soc. Am. Bull. 110, 1060– 1074, doi:10.1130/0016-7606(1998)110<1060.
Colpron, M., Nelson, J.L., and Murphy, D.C. 2007. Northern Cordilleran terranes and their interactions through time. Geological Society of America Today 17, 4-10.
Coney, P.J. 1980. Cordilleran metamorphic core complexes: An overview. In Cordilleran metamorphic core complexes. Edited by M. Crittenden, P. Coney, P. and G. Davis, G. Geological Society of America Memoir, 153: 7-31.
Coney, P.J., Jones, D.L. and Monger, J.W.H. 1980. Cordilleran suspect terranes. Nature 288, 329-333.
Coney, P.I., Harms, T.A 1984. Cordilleran metamorphic core complexes: Cenozoic extensional relics of Mesozoic compression. Geology, 12: 550-554.
Cook, F.A, Green, AG., Simony, P.S., Price, RA, Parrish, RR, Mike eit, B., Gordy, P.L., Brown, RL., Coflin, KC., and Patenaude, C. 1988. Lithoprobe seismic refection structure of the southeastern Canadian Cordillera: initial results. Tectonics 7, 157-180.
Cook, F.A., Varsek, J.L., Clowes, R.M., Kanasewich, E.R., Spencer, C.S., Parrish, R.R., Brown, R.L., Carr, S.D., Johnson, B.J., Price, R.A., 1992. Lithoprobe crustal reflection cross section of the southern Canadian Cordillera, 1. Foreland thrust and fold belt to Fraser River fault. Tectonics 11, 12–35.
Davis, G. A., Monger, J.W.H., Burchfiel, B. C., 1978, Mesozoic construction of the Cordilleran 'collage,' central British Columbia to central California, in Howell, D. G., and McDougall, K. A., eds., Mesozoicpaleogeography of the western United States: Society of Economic Paleontologists and Mineralogists, Pacific Section,Pacific Coast Paleogeography Symposium 2, 1-32.

83
Engebretson, D.C., Cox, A, Gordon, R.G. 1984. Relative motions between oceanic plates of the Pacific Basin. Journal of Geophysical 89, 10291-10310.
Ewing, T.E. 1980. Paleogene tectonic evolution of the Pacific Northwest. Journal of Geology 88, 619-638.
Fossen, H., 2010. Structural Geology. Cambridge University Press, Cambridge.
Fox, K.F., Jr., Rinehart, C.D., Engels, J.c., and Stern, T.W. 1976. Age of emplacement of the Okanogan gneiss dome, north-central Washington. Geological Society ofAmerica Bulletin 87, 1217-1224.
Gervais, F., Brown, R. L., 2011. Testing modes of exhumation in collisional orogens: Synconvergent channel flow in the southeastern Canadian Cordillera,
Gibson, RD., Brown, R.L., Carr, S.D., 2008. Tectonic evolution of the Selkirk fan, southeastern Canadian Cordillera: A composite Middle Jurassic-Cretaceous orogenic structure. Tectonics, 27(6).
Gibson, H. D., Brown, R. L., Carr, S.D., 2005. U/Th- Pb geochronologic constraints on the structuralnevolution of the Selkirk fan, northern Selkirk Mountains, southern Canadian Cordillera, Journal of Structural Geology 27, 1899–192.
Glombick, P., Thompson, R.I., Erdmer, P., Daughtry, K.L., 2006a. A reappraisal of the tectonic significance of early Tertiary low-angle shear zones exposed in the Vernon map area (82 L), Shuswap metamorphic complex, southeastern Canadian Cordillera. Canadian Journal of Earth Sciences 43(2), 245-268.
Glombick, P., Thompson, R., Erdmer, P., Heaman. L., Friedman, M.. Villeneuve, M., Daughtry, K. 2006b. U-Pb constraints on the thermotectonic evolution of the Vernon antiform and the age of the Aberdeen gneiss complex, southeastern Canadian Cordillera. Canadian Journal of Earth Sciences 43(2), 213-244.
Godin, L., Grujic, D., Law, R.D., and Searle, M.P. 2006. Channel flow, ductile extrusion and exhumation in continental collision zones: an introduction. In: Law, R.D., Searle, M.P., and Godin, L. (eds). Channel Flow, Ductile Extrusion and Exhumation in Continental Collision Zones. Geological Society of London Special Publications, 268: 1-23.
Gottardi, R., Teyssier, C., Mulch, A., Vennemann, T.W., Wells M.L, 2011. Preservation of an extreme transient geotherm in the Raft River detachment shear zone, Geology, 39( 8), 759-762.
Grujic, D., and Manckletow, N.S. 1995. Folds with axes parallel to the extension direction: an experimental study. Journal of Structural Geology 17, 279-291.
84
Guillope M, Poirier J-P 1979 Dynamic recrystallization during creep of single-crystalline halite: an experimental study. Journal of Geophysical Research 84, 5557–5567.
Hansen, V.L., Goodge, J.W., 1988, Metamorphism, structural petrology, and regional evolution of the Okanogan complex, northeastern Washington, in Metamorphism and Crustal Evolution of the Western United States, Rubey Colloquium 7, 233–270.
Harms, T.A., Price, R.A., 1992. The Newport fault: Eocene listric normal faulting, mylonitization. and crustal extension in northeast Washington and northwest Idaho. Geological Society of America Bulletin 104, 745-761.
Hanmer, S., Passchier, C., 1991. Shear-Sense Indicators: A Review: Geological Survey of Canada Current Research 90-17, 72 p.
Helwig, J., Ed. (1974). Eugeosynclinal basement and a collage concept of orogenic belts. eds. Dott, R.H., Jr.
Hirth, G., Tullis, J., 1992. Dislocation creep regimes in quartz aggregates. Journal of Structural Geology 14, 145-159.
Hobbs, B. E. 1985. The geological significance of microfabric. In: Preferred Orientation in Deformed Metals and Rocks (edited by Wenk, H.-R.). Academic Press, Orlando.
Johnson, B.J., 1994. Structure and tectonic setting of the Okanagan Valley fault system in the Shuswap Lake area, southern British Columbia. Ph.D. Thesis, Carleton University, 281 pp.
Johnson, B.J., 2006. Extensional shear zones, granitic melts, and linkage of overstepping normal faults bounding the Shuswap metamorphic core complex, British Columbia. GSA Bulletin, 118(3/4): 366-382.
Johnson, B.J., Brown, R.L., 1996. Crustal structure and early Tertiary extensional tectonics of the Omineca belt at 51degrees N latitude, southern Canadian Cordillera. Canadian Journal of Earth Sciences, 33(12): 1596-1611.
Kruckenberg, S.C., and Whitney, D.L., 2011, Metamorphic evolution of sapphirine- and orthoamphibole- cordierite–bearing gneiss, Okanogan Dome, Washington, USA: Journal of Metamorphic Geology 29, 425–449, doi:10.1111/j.1525-1314.2010.00926.x.
Kruckenberg, S.C., Whitney, D.L., Teyssier, c., Fanning, C.M., Dunlap, W.J. 2008.Paleocene-Eocene migmatite crystallization, extension, and exhumation in the interland of the northern Cordillera: Okanogan dome, Washington, USA. Geological SocietyAmerica Bulletin 120, 912-929.

85
Kruhl, J.H., 1996. Prism- and basal-plane parallel subgrain boundaries in quartz: a microstructural geothermobarometer. Journal of Metamorphic Geology 14, 581-589.
Kruhl, J.H., 1998. Prism- and basal-plane parallel subgrain boundaries in quartz: a microstructural geothermobarometer: Reply. Journal of Metamorphic Geology 16, 142-146.
Kurz, W., and Neubauer, F. 1996. Deformation partitioning during updoming of the Sonnblick area in the Tauern Window (Eastern Alps, Austria). Journal of Structural Geology 18, 1327-1343.
Laberge, J.D., and Pattison, D.R.M., 2007, Geology of the western margin of the Grand Forks complex, southern British Columbia: High-grade Cretaceous metamorphism followed by Early Tertiary extension on the Granby fault: Canadian Journal of Earth Sciences, 44, 199–228.
Langille, J.M., Jessup, M.J., Cottle, J.M., Newell, D., Seward, G., 2010. Kinematic evolution of the Ama Drime Detachment: insights into orogen-parallel extension and exhumation of the Ama Drime Massif, Tibet-Nepal. Journal of Structural Geology 32, 900-919.
Larson, K.P. and Godin, L. 2009. Kinematics of the Greater Himalayan sequence, Dhaulagiri Himalayas: implications for the structural framework of central Nepal. Journal of the Geological Society, London 166, 25-43.
Law, R.D., 1990. Crystallographic fabrics: a selective review of their applications to research in structural geology. In: Knipe, R.J., Rutter, E.H. (Eds.), Deformation Mechanisms, Rheology and Tectonics. Geological Society, London, Special Publication 54, 335-352.
Law, R.D., Searle, M.P., Simpson, R.L., 2004. Strain, deformation temperatures, and flow at the top of the Greater Himalayan Slab, Everest Massif, Tibet. Journal of the Geological Society, London 161, 305-320.
Law, R.D., Mainprice, D., Casey, M., Lloyd, G.E., Knipe, R.J., Cook, B., Thigpen, J.R., 2010. Moine thrust zone mylonites at the stack of Glencoul: I microstructures, strain and influence of recrystallization on quartz crystal fabric development. In: Law, R.D., Butler, R.W.H., Holdsworth, R., Krabbendam, M., Strachan, R.A. (Eds.), 2010. Continental Tectonics and Mountain Building. The Legacy of Peach and Horne, 335. Geological Society, London, Special Publication, 543-577.
Law, R.D., Jessup, M.J., Searle, M.P., Francsis, M.K., Waters, D.J., Cotte, J.M., 2011. Telescoping of isotherms beneath the South Tibetan Detachment System, Mount Everest Massif. Journal of Structural Geology, 33, 1569-1594.
86
Law, R. D.; Stahr, D. W.; Francsis, M. K.; Ashley, K. T.; Grasemann, B.; Ahmad, T., 2013. Deformation temperatures and flow vorticities near the base of the Greater Himalayan Series, Sutlej Valley and Shimla Klippe, NW India. Journal of Structural Geology, 54, 21-53.
Lister, G.S., 1977. Discussion: Crossed girdle c-axis fabrics in quartzites plastically deformed by plane strain and progressive simple shear. Tectonophysics 39, 51-54.
Lister, G.S., Price, G.P., 1978. Fabric development in a quartz-feldspar mylonite. Tectonophysics 49 (1-2), 37-78.
Lister, G.S., Paterson, M.S., Hobbs, B.E., 1978. The simulation of fabric development in plastic deformation and its application to quartzite: the model. Tectonophysics 45, 107-158.
Lister, G.S., Paterson, M.S., 1979. The simulation of fabric development during plastic deformation and its application to quartzite: fabric transions. Journal of Structural Geology 1 (2), 99-115.
Lister, G.S. Hobbs, B.E., 1980. The simulation of fabric development during plastic deformation and its application to quartzite: the influence of deformation history. Journal of Structural Geology 2, 335-352.
Lister, G.S., Williams, P.F., 1983. The partitioning of deformation in flowing rock masses. Tectonophysics 92,, 1-33.
Lister, G.S., Snoke, A.W., 1984. S-C Mylonites. Journal of Structural Geology 6 (6), 617-638.
Lister, G.S. Davis, G. A. 1989. The origin of metamorphic core complexes and detachment faults during Tertiary continental extension in the northern Colorado River region, USA. Journal of Structural Geology, 11, 65-94.
Massey, N.W.D., Duffy, A., 2007. Boundary Project: N,[cKinney Creek (NTS 82E/03) and Beaverdell (NTS 82FJ06E, 07W, lOW, llW) Areas, South-Central British Columbia. B.e. Ministry of Energy, Mines and Petroleum Resources, Geological Field workPaper 2008-1, p. 99-107.
Mainprice, D., Bouchez, J.L., Blumenfeld, P., Tubia, J.M., 1986. Dominant c-slip in naturally deformed quartz: implications for dramatic plastic softening at high temperature. Journal of Geology 14, 819-822.
Mathews, W. 1981. Early Cenozoic resetting of potassium-argon dates and geothermalhistory of north Okanagan area, British Columbia. Canadian Journal of Earth Sciences 18, 1310-1319, 198.

87
McClaughry, J.D., Gaylord, D.R., 2005. Middle Eocene sedimentary and volcanic infilling of an evolving supradetachment basin: White Lake Basin, south-central British Columbia. Canadian Journal of Earth Sciences 42, 49-66.
McDougall, I. Harrison, T.M., 1999. Geochronology and thermochronology by the 40Ar/39Ar method: 2nd edition, New York, Oxford University Press, 269 p.
Medford, G.A 1975. K-Ar and fission track geochronometry of an Eocene thermal event in the Kettle River (west half) map area, southern British Columbia. Canadian Journal of Earth Sciences 12, 836-843.
Monger, J., Price, R , 2002. The Canadian Cordillera: Geology and Tectonic Evolution. Canadian Society of Exploration Geophysicists Recorder, 17: 17-36.
Monger, J.W.H., Price, R.A., Tempelman-Kluit, D.J., 1982. Tectonic accretion and the origin of the two major metamorphic and plutonic welts in the Canadian Cordillera. Journal of Geology, 10, 70-75.
Nelson, J.L., Colpron, M., Piercey, S.J., Dusel-Bacon, C., Murphy, D.C., and Roots, C.F. 2006. Paleozoic tectonic and metallogenic evolution of the pericratonic terranes in Yukon, northern British Columbia and eastern Alaska. In Paleozoic evolution and metallogeny of pericratonic terranes at the ancient Pacific margin of North America, Canadian and Alaskan Cordillera. eds.M. Colpron and J.L. Nelson. Geological Association of Canada, Special Paper 45, pp. 323–360.
Okulitch. A.V., 1984. The role of the Shuswap metamorphic complex in Cordilleran tectonism: A review. Canadian Journal of Earth Sciences 21, 1171-1193.
Okulitch, A.V., 1987. Comment on "Extension across the Eocene Okanagan crustal shearin southern British Columbia." Geology 15, 187-188.
Parkinson, D.L., 1985. U-PB geochronometry and regional geology of the southern Okanagan Valley, British Columbia; the western boundary of a metamorphic core complex. MSc Thesis, University of British Columbia.
Parrish, R.R., 1995. Thermal evolution of the southeastern Canadian Cordillera. Canadian Journal of Earth Sciences 32, 1618-1642.
Parrish, R.R., Carr, S.D., Parkinson, D.L., 1988. Eocene extensional tectonics and geochronology of the southern Omineca Belt, British Columbia and Washington. Tectonics, 7(2): 181-212.
Passchier, C.W., Trouw, R.A.J., 2005. Microtectonics, second ed. Springer, Berlin, 366 pp.
88
Peternell, M., Kohlmann, F., Wilson, C.J.L., Seiler, C., Gleadow, A.J.W., 2009. A new approach to crystallographic orientation measurement for apatite fission track analysis: Effects of crystal morphology and implications for automation. Chemical Geology 265, 527-539.
Peternell, M., Hasalová, P., Wilson, C.J.L., Piazolo, S. and Schulmann, K. 2010. Evaluating quartz crystallographic preferred orientations and the role of deformation partitioning using EBSD and fabric analyser techniques. Journal of Structural Geology 32, 803–817.
Pfiffner, O.A., Ramsay, J.G., 1982. Constraints on geological strain rates, arguments from finite strain states of naturally deformed rocks. Journal of Geophysical Research 87, 311-321.
Price, R.A., 1986. The southeastern Canadian Cordillera: Thrust faulting, tectonic wedging, and delamination of the lithosphere. Journal of Structural Geology 8, 239-254.
Price, R.A., Monger, J.W.H., Roddick, J.A., 1985. Cordilleran cross-section: Calgary to Vancouver. In: Field Guides to Geology and Mineral Deposits in the Southern Canadian Cordillera: GSA Cordilleran Section Meeting, Vancouver, B. C., May '85. D.J. Tempelman-Kluit (ed.). Vancouver, Geological Society of America Cordilleran Section, 371-385.
Price, RA., Carmichael, D.M., 1986. Geometric test for Late Cretaceous-Paleogene intracontinental transform faulting in the Canadian Cordillera. Geology 14, 468-471.
Price, R.A. Mountjoy, E.W., 1970. Geologic structure of the Canadian Rocky Mountains between Bow and Athabasca Rivers: A progress report. In: Structure of the Southern Canadian Cordillera. J.O. Wheeler (ed.). Geological Association of Canada, Special Publication no. 6, 7-25.
Prior, D.J., Boyle, A.P., Brenker, F., Cheadle, M., Day, A., Lopez, G., Peruzzo, L., Potts, G.J., Reddy, S., Spiess, R., Timms, N.E., Trimby, P., Wheeler, J., and Zetterström, L.1999. The application of electron backscatter diffraction and orientation contrast imaging in the SEM to textural problems in rocks. American Mineralogist 84, 1741-1759.
Prior, D.J. 2009. EBSD in the earth sciences: application, common practice and challenges. In: Schwartz, A.J., Kumar, M., Adams, B.L., Field, D.P. (eds.). Electron Backscatter Diffraction in Materials Science. Springer Science and Business Media, New York. 345-360.
Pryer, L.L., 1993. Microstructures in feldspars from a major crustal thrust zone: the Grenville Front, Ontario, Canada. Journal of Structural Geology 15, 21-36.

89
Read, P.B., Brown, RL., 1981. Columbia River fault zone: Southeastern margin of the Shuswap and Monashee complexes, southern British Columbia. Canadian Journal of Earth Sciences 18, 1127-1145.
Rey, P., Teyssier, C., and Whitney, D.L., 2009, Extension rates, crustal melting, and core complex dynamics,Geology 37, 391–394.
Reynolds, S.J., 1982, Geology and geochronology of the South Mountains, central Arizona (Ph.D. thesis): Tucson, University of Arizona, 220 p.
Roddick, C., Farrar, E., and Procyshyn, E.L. 1972. Potassium-Argon ages of igneous rocks from the area near Hedley, southern British Columbia. Canadian Journal of Earth Sciences 9, 1632-1639.
Ross, J.V. 1974. A Tertiary Thermal Event in South-Central British Columbia. Canadian Journal of Earth Sciences 11, 1116-1122.
Ross, I.V. 1981. A geodynamic model for some structures within and adjacent to the Okanagan Valley, southern British Columbia. Canadian Journal of Earth Sciences 18, 1581-1598.
Ryan, D. 1973. Structural geology and Rb/Sr geochronology of the Anarc ist Mountain area, south-central British Columbia. Ph.D. Dissertation, University of British Columbia, Vancouver, B.C., 256 pp.
Schmid, S.M., Casey, M., 1986. Complete fabric analysis of some commonly observed quartz c-axis patterns. In: Hobbs, B.E., Heard, H.C. (Eds.), Mineral and Rock Deformation: Laboratory StudiesdThe Paterson Volume. American Geophysical Union Monograph, 36. American Geophysical Union, pp. 246-261.
Shaver, R.H. Modern and ancient geosynclinal sedimentation, Society of Economic Paleontologists and Mineralogists Special Publication. v 19, p. 359-380.
Singleton, J.S. 2013. Development of extension-parallel corrugations in the Buckskin-Rawhide metamorphic core complex, west-central Arizona. GSAB, 125, 453-472.
Singleton, J.S., Mosher, S. 2012. Mylonitization in the lower plate of the Buckskin-Rawhide detachment fault, west-central Arizona: Implications for the geometric evolution of metamorphic core complexes. Journal of Structural Geology 39, 180-198.
Spencer, J.E. 1982. Origin of folds in Tertiary low-angle fault surfaces, so theastern California and western Arizona. In Mesozoic- Cenozoic Tectonic Evolution of th Colorad River Region, California, Nevada and Arizona. Edited by E.G. Frost, D.L. Martin, Cordilleran Publishers, San Diego, CA, p. 123-134.

90
Spencer, J.E. 1999. Geologic continuous casting below continental and deep-sea detachment faults and at the striated extrusion of Sacsayhuamán, Peru. Geology, v. 27, p. 327-330.
Spencer, J.E., and Reynolds, SJ. 1991. Tectonics of mid-Tertiary extens on along a transect through west-central Arizona. Tectonics 10, 1204-1221.
Stevens, R.D., DeLabio, RN., and Lachance, G.R 1982. Age determination and geologic studies: K-Ar isotopic ages. Report 16, Geological Survey of Canada, Paper 82-2, 56p.
Stipp, M., Stünitz, H., Heilbronner, R., Schmid, S.M., 2002a. The eastern Tonale fault zone: a ‘natural laboratory’ for crystal plastic deformation of quartz over a temperature range from 250 to 700 C. Journal of Structural Geology 24, 1861-1884.
Stipp, M., Stünitz, H., Heilbronner, R., Schmid, S.M., 2002b. Dynamic recrystallization of quartz: correlation between natural and experimental conditions. In: De Meer, S., Brury, M.R., De Brasser, J.H.P., Pennock, G.M. (Eds.), Deformation Mechanisms, Rheology and Tectonics: Current Status and Future Perspectives. Geological Society, London, Special Publication 200, 171-190.
Struik, L.C., 1993. Intersecting intracontinental Tertiary transform fault systems in the North American Cordillera. Canadian Journal of Earth Sciences 30, 1262-1274.
Sullivan, W.A., 2013. L tectonites. Journal of Structural Geology 50, 161-175.
Sullivan, W.A., Beane, R.J. 2010. Asymmetrical quartz crystallographic fabrics produced during constrictional deformation. Journal of Structural Geology 32, 1,430–1,443.
Tempelman-Kluit, D.J., Parkinson, D., 1986. Extension across the Eocene Okanagan crustal shear in southern British Columbia. Journal of Geology 14, 318-321.
Tempelman-Kluit, D.J., 1989. Geology, Penticton, British Columbia. Scale 1:250 000. Geological Survey of Canada,Ottawa.
Thompson, R.I., Unterschutz, J.L.B., 2004. Geology of the Vernon map area, British Columbia (NTS 82 L/06). Geological Survey of Canada, Open File 4375, scale 1:50000.
Toraman, E., Fayon, A., Whitney, D.L., Teyssier, C., Reiners, P.W., Thomson, S.N., and Krucken berg, S.C., 2011, Apatite-zircon U-Th/He and fi ssion-track dating of the Okanogan Dome exhumation (Washington, USA): Geological Society of America Abstract with Programs 43, 5, 654.
91
Toy, V.G., Prior, D.J., Norris, R.J., 2008. Quartz textures in the Alpine fault mylonites: influence of pre-existing preferred orientations on fabric develop- ment during progressive uplift. Journal of Structural Geology 30, 602–621.
Tucholke, RE., Lin, J., and Kleimock, M. 1998. Megamullions and mullion structure defining oceanic metamorphic core complexes on the Mid-Atlantic Ridge, Journal of Geophysical Research 103, 9857-9866.
Urai, J. L., Means, W. D., Lister, G. S. 1986. Dynamic recrystallization in minerals, in Mineral and Rock Deformation: Laboratory Studies, Geophysical. Monogr. Ser 36, eds. Hobbs B. E.. Heard H.C. 166-199, AGU, Washington, D.C.
Vanderhaeghe, 0., Teyssier., Wysoczanski, R., 1999. Structural and geochronological constraints on the role of partial melting during the formation 0 the Shuswap metamorphic core complex at the latitude of the Thor- Odin dome, British Columbia. Canadian Journal of Earth Sciences 36, 917-943.
Vanderhaeghe O., and Teyssier C., 2001. Crustal-scale rheological transitions during late-orogenic collapse. Tectonophysics 335, 211-228.
Vanderhaeghe, 0., Teyssier, C., McDougall, I., Dunlap, W., 2003. Cooling and exhumation of the Shuswap metamorphic core complex constrained by 40Ar-39Ar thermochronology. Geological Society of America Bulletin 115, 200-216.
Wernicke, B. 1981. Low-angle normal faults in the Basin and Range Province: Nappe tectonics in an extending orogen. Nature 291, 645–648.
Wernicke, B.P., 1985. Uniform-sense normal simple shear of the continental lithosphere, Canadian Journal of Earth Sciences 22, 108-125.
Wernicke, B., Axen, G.J. 1988. On the role of isostasy in the evolution of normal fault systems. Geology 16, 848-851.
Wheeler. J. 0., McFeely, P., (compilers) 1991. Tectonic assemblage map of the Canadian Cordillera and adjacent parts of the United States of America. Geological Survey of Canada, Map) 712A, scale 1: 2 000 000.
White, W.H.. Harakal, lE., and Carter, N.C. 1968. Potassium-Argon ages of some ore deposits inBritish Columbia. Canadian Institute of Mining and Metallurgy Bulletin, 61: 1326-1334.
Whitney, D. L., Paterson, S. R, Schmidt, K. L. Glazner, A. F., Kopf, C. F. 2004. Growth and demise of continental arcs and orogenic plateaux in the North American Cordillera; from Baja to British Columbia. Geological Society Special Publications 227: 167-175.

92
Wilson, C.J.L., Russell-Head, D.S., and Sim, H.M., 2003. The application of an automated FA system to the textural evolution of folded ice layers in shear zones. Annals of Glaciology 37, 7-17.
Wilson, C.J.L., Russell-Head, D.S., Kunze, K., and Viola, G. 2007. The analysis of quartz c-axis fabrics using a modified optical microscope. Journal of Microscopy 227: 30-41.
Xypolias, P., Koukouvelas, I.K., 2001. Kinematic vorticity and strain rater patterns associated with ductile extrusion in the Chelmos Shear Zone (External Hellenides, Greece). Tectonophysics 338, 59-77.
93
Appendix A: Background information on Methodology
Quartz recrystallization mechanisms
Dislocations are atomic-scale mobile defects within crystal lattices. Migration of dislocations on intracrystalline slip planes (e.g. dislocation creep) contributes to intracrystalline deformation (Fossen, 2010). The characterization of dislocation creep systems is based on mechanical data and on recrystallization mechanisms identified by transmission electron microscopy and optical microscope observations (Hirth and Tullis, 1992; Passicher and Trouw, 2005; Fossen, 2010). Hirth & Tullis (1992) have demonstrated that the dominant recrystallization mechanism is a function of the finite deformation conditions including temperature, stress, and strain rate. Thus, dislocation creep microstructures in quartz have proven useful in determining the kinematics of plastically deformed rocks (e.g. Tullis et al. 1973, White 1976).
This study documents the dynamic recrystallization mechanisms of quartz-rich samples spanning vertical sections within the study are complemented by feldspar deformation textures where applicable (Pryer, 1993). Microtextural analysis according to Stipp et al. (2002a,b) was conducted to ascertain the deformation conditions with respect to structural depth. Stipp et al. (2002a,b) combine inferred deformation temperatures of naturally deformed rocks with experimental data of Hirth & Tullis (1992) to constrain the deformation conditions according to the recrystallization mechanisms identified in quartz-rich mylonites from natural shear zones. These dynamic recrystallization mechanisms are usually the result of the formation and progressive rotation of subgrains and the migration of grain boundaries in response to a change in dislocation density (strain energy) within individual quartz grains (e.g. Guillop and Poirier 1979; Urai et al., 1986). The interaction of these two processes is responsible for the occurrence of three different dynamic recrystallization mechanisms of quartz microstructures based on deformation temperature (Stipp et al., 2002a). Regime 1 is a localised, low temperature grain boundary migration known as bulging recrystallization (BLG), which dominates from approximately 280-400 °C. Regime 2 is characterized by concentration of dislocations along grain walls due to a reduction of elastic distortional strain energy resulting in subgrain rotation recrystallization (SGR), which occurs from approximately 400-500 °C. Regime 3 is a strain-induced grain boundary migration recrystallization (GBM) driven by differences in stored strain energy between adjacent grains occurring at temperatures >500°C (Fig. 2.6C; Stipp et al., 2002a and references therein). Above 650°C, quartz displays chessboard extinction (Fig. A.1C; Blumenfeld et al., 1986; Mainprice et al., 1986; Hirth and Tullis, 1992; Stipp et al., 2002a,b).

94
Microstructural Analysis using crystallographic preferred orientations
Assuming steady-state deformation with respect to finite strain, CPO fabrics can be used in conjunction with the identification of dynamic recrystallization mechanisms to assess shear sense, deformation temperatures, and strain symmetry (Fig. A.1; Lister et al., 1978; Lister and Hobbs, 1980; Law, 1990; Sullivan and Beane, 2010). This is based on the precepts of the Taylor-Bishop-Hill hypothesis, whereby dislocation creep can be accommodated by the movement of dislocations through rigid body rotation of the crystallographic axes until a particular slip system is oriented to allow slip (Lister et al., 1978; Lister and Paterson, 1979). Therefore, if the deformation within a specified crystalline volume is statistically homogeneous, crystallographic lattices can act as an internal reference frame during deformation (Lister and Hobbs, 1980). The lattice rotations are interpreted to develop in a preferential orientation during deformation because the crystallographic structure deforming through the conservative migration of dislocations remains relatively undistorted, whereas the grain itself undergoes significant changes in shape. The movement of dislocations in quartz is along a certain number of lattice planes in a given direction (Burgers vector) with quartz often deforming by slip on up to four slip planes within the uniaxial system, each of which can accommodate a certain amount of incremental strain (Fig. A.1C; Lister et al. 1977; Law, 1990). Together, the orientation of the slip plane and the magnitude and direction of the Burgers vector define a slip system (Lister et al. 1978). To activate these slip systems, the minimum stress required for slip to occur, referred as the Critical Resolved Shear Stress (CRSS), must be exceeded (Lister et al., 1978). The magnitude of the CRSS for a particular orientation is strongly dependent on temperature, as well as strain rate, pressure, and chemical-fluid activity (Hobbs, 1985).
Both quartz c- and a-axis fabric geometries can be related to distortional strain geometry (Sullivan and Beane, 2010). This is achieved using numerical simulations of plastic deformation based on the Taylor-Bishop-Hill model of slip system activation in quartz c-axes (Lister and Hobbs, 1980) and the inferred geometry of a-axis fabrics in naturally deformed quartzite (Schmid and Casey, 1986). These observations are subsequently incorporated into the Flinn plot showing the relationship between the strain symmetry and quartz c- and a-axis fabrics showing deviations from plane strain towards constriction or flattening (Fig. A.1B; Schmid and Casey, 1986).
Assuming natural strain rates and plane strain, temperatures of deformation can be constrained through the following two methods using quartz c-axis fabrics: (1) the evaluation of quartz c-axis opening angles in cross girdled fabric skeletons (e.g. the fabric skeleton of c-axis girdles in Fig. A.1C and Fig. A.1D; Kruhl, 1998; Law et al., 2004), and (2) the interpretation of dominant slip systems active during deformation (e.g. Fig. A.1D; Law, 1990; Toy et al, 2008).
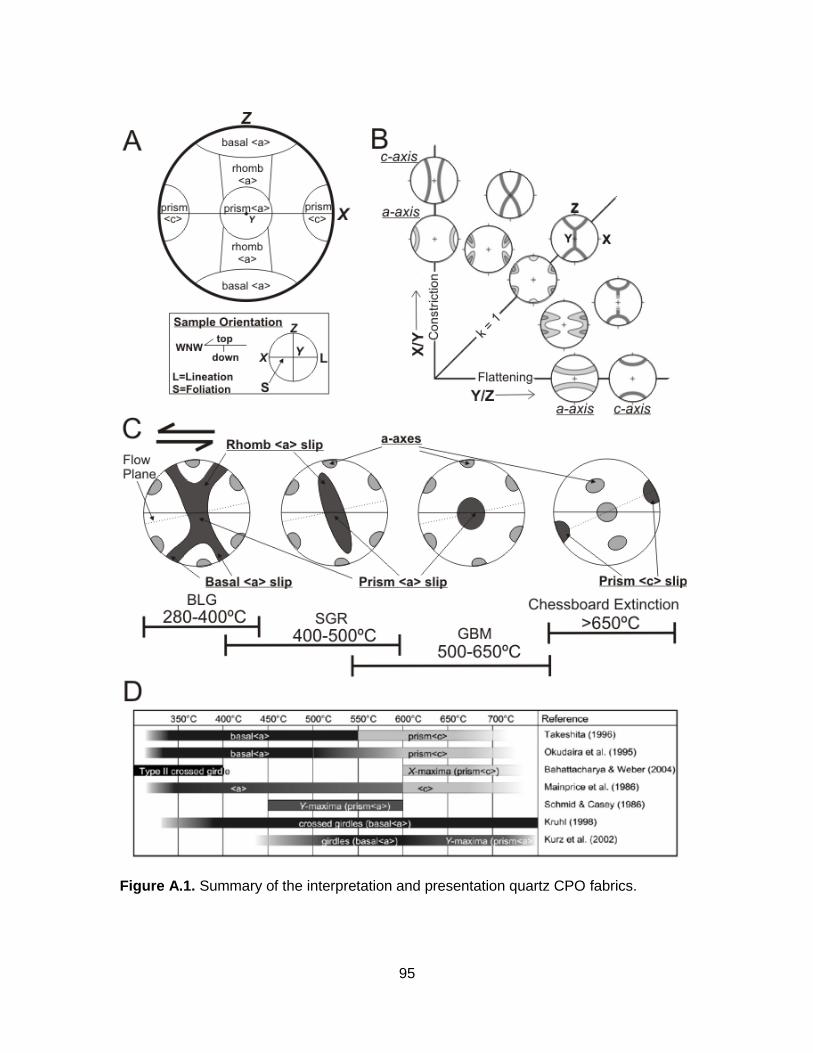
95
Figure A.1. Summary of the interpretation and presentation quartz CPO fabrics.
96
(A) the location of quartz c-axis peaks and active slip systems in equal area lower hemisphere projection cut parallel to lineation, perpendicular to foliation, based on Schmid and Casey (1986) and adapted from Toy et al. (2008). (B) Flynn plot showing relationships between strain symmetry and quartz c-axis and a-axis fabrics for coaxial deformation. C-axis fabrics represented by fabric skeletons represented as either girdles or point maximas. A- axis represented by contours (after Schmid and Casey, 1986; Law, 1990). (C) Stereonets showing the evolution of c- and a-axis fabrics with increasing temperature for top-to-the-west (sinistral) non–coaxial deformation and plane strain; c-axisc-axis shown in dark grey, a-axis shown in light grey. Temperature ranges of dynamic recrystallization mechanisms also shown with respect to CPO fabrics (adapted from Passchier and Trouw, 2005; Langille et al., 2010). (D) Summary of previously estimated temperature ranges in which certain quartz slip systems and subsequent quartz c-axes fabrics operate (after Toy et al., 2008 and references therein).
Kruhl (1998) discusses the use of quartz CPO fabrics as a practical geothemometer. He suggests that the transition in dominant dislocation glide with respect to increasing temperature goes from basal <a> to prism <c> slip, caused by the phase transformation from low (α) to high (β) quartz. This depends strongly on temperature and pressure of deformation and equilibration. Blacic (1975) and Linker & Kirby (1981) document that glide is elementary in the <c> direction of synthetic quartz, proposing that the different glide rates in the <a> and <c> directions are related to an anisotropy of diffusion along these directions. Subsequent work of Dennis (1984) and Giletti & Yund (1984) confirmed that oxygen diffusion is much faster in the <c> direction than the <a> direction. Mainprice and Nichols (1989) equate increasing temperature of deformation with an increasing importance of diffusion in the <c> direction, and subsequently, the velocity of dislocation glide in that direction and on planes containing it. This therefore implies that the transition from prism <a> slip to <c> slip is facilitated with increasing temperature. Water may act as a catalyst during deformation and support the formation and migration of lattice defects without being consumed (Kruhl, 1996; 1998). Therefore, Kruhl (1998) suggests that during significant periods of deformation even tiny amounts of water are sufficient to increase the plasticity of quartz and support the development of SGB, which need only low densities of lattice defects to operate.
Therefore, within the limitations of Taylor-Bishop-Hill analysis theory (Lister & Paterson 1979; Lister and Hobbs, 1980) the active slip systems act as a semi-quantitative estimate of deformation temperature. Activation of lattice slip at relatively low temperatures (280-400 °C) is interpreted to be dominantly on the basal plane with single girdle fabrics result from combined Prism <a> and Rhomb <a> slip, progressing to a Y-axis maxima fabric perpendicular? to the lineation suggesting dominant prism <a> slip with increasing temperature (500-650 °C) (Fig A.1C; Mainprice et al., 1986; Law, 1990; Tullis and Yund, 1992; Kruhl, 1998; Langille et al., 2010). At temperatures >650 °C, slip of prismatic planes in the

97
Prism <c> direction are activated (Fig A.1C; Mainprice et al., 1986; Law, 1990; Tullis and Yund, 1992; Kruhl, 1998). Additionally, the asymmetry of the CPO skeleton in a c-axis plot with respect to the kinematic reference frame (foliation and lineation) can be used to determine the sense of shear (Fig. 2.6C; Law, 1990).
The crystallographic orientation of sub-grain boundaries (SGB) in quartz is a useful indicator of the operative slip direction during high temperature plastic deformation (Mainprice, 1986). Preliminary optical fabric data can be acquired by inserting the quarter wavelength retardation plate in the optical microscope to give a quick qualitative 2D analysis of the subgrain boundaries and potential lattice orientation, thus aiding the sample selection for EBSD analysis.
Quartz CPO fabrics are obtained through measuring the crystallographic orientations of an appropriate number of individual recrystallized grains (>300). These fabrics were initially obtained through the use of a universal stage (U-Stage) mounted on an optical microscope (Berek, 1924; Reinhard, 1931). U-stage mounted samples have previously proved an effective and reliable means to gather meaningful quartz c-axes (e.g. Law 1986), but this method has specific limitations. For instance, U-stage analysis is restricted to moderate to coarse-grained samples (low spatial resolution) with data biased to recrystallization regimes associated with larger grain sizes. It is also not possible to measure a-axis fabrics in quartz grains, Furthermore, there is a strong potential to misidentify quartz within quartzo-feldspathic samples during grain identification. As a result, the measurement of CPOs has since evolved to include the use Electron Back Scatter Diffraction (EBSD) detectors mounted to a Scanning Electron Microscope with additional acquisition of c-axes from the Fabric Analyser (FA) technique (Wilson et al., 2003; 2007).
Both Electron backscatter diffraction (EBSD) and Fabric Analyser (FA) techniques allow for the automatic recognition of quartz CPO fabrics where single grain or bulk measurements on a thin section are based on the determination of the orientation of the selected lattice directions (Ullemeyer et al., 2000; Peternell et al., 2010). High-resolution acquisition of CPO data can be acquired from rock-forming mineral grains as small as <1 μm (EBSD) and ~2.8 μm (FA) with automated data acquisition and analysis (Peternell et al., 2010). Both EBSD and FA are ideal for investigating textural heterogeneities within individual thin sections. This enables rapid comparison of statistically significant data from independent methods and allows for analysis of different quartz-rich domains within a sample, which can highlight variations in quartz CPO fabrics within one thin section (e.g. Peternell et al., 2010; Nagy 2012). For a full description of EBSD and FA techniques, and their application to geologic problems, see Prior et al. (1999; 2009) and Wilson et al. (2003; 2007), respectively.

98
References:
Blacic, J. D. 1975. Plastic deformation mechanisms in quartz: the effect of water. Tectonophysics 27, 271-294.
Blumenfeld, P., Mainprice, D. and Bouchez, J.L., 1986. C-slip in quartz from subsolidus deformed granite. Tectonophysics 127, pp. 97-115.
Fossen, H., 2010. Structural Geology. Cambridge University Press, Cambridge.
Giletti, B. J. & Yund, R. A. 1984. Oxygen diffusion in quartz. Journal of Geophysical Research. 89, 4039-4046.
Guillope M, Poirier J-P 1979 Dynamic recrystallization during creep of single-crystalline halite: an experimental study. Journal of Geophysical Research 84, 5557–5567.
Hirth, G., Tullis, J., 1992. Dislocation creep regimes in quartz aggregates. Journal of Structural Geology 14, 145-159.
Hobbs, B. E. 1985. The geological significance of microfabric. In: Preferred Orientation in Deformed Metals and Rocks (edited by Wenk, H.-R.). Academic Press, Orlando.
Kruhl, J.H., 1996. Prism- and basal-plane parallel subgrain boundaries in quartz: a microstructural geothermobarometer. Journal of Metamorphic Geology 14, 581-589.
Kruhl, J.H., 1998. Prism- and basal-plane parallel subgrain boundaries in quartz: a microstructural geothermobarometer: Reply. Journal of Metamorphic Geology 16, 142-146.
Law, R.D., 1990. Crystallographic fabrics: a selective review of their applications to research in structural geology. In: Knipe, R.J., Rutter, E.H. (Eds.), Deformation Mechanisms, Rheology and Tectonics. Geological Society, London, Special Publication 54, 335-352.
Law, R.D., Searle, M.P., Simpson, R.L., 2004. Strain, deformation temperatures, and flow at the top of the Greater Himalayan Slab, Everest Massif, Tibet. Journal of the Geological Society, London 161, 305-320.
Lister, G.S., 1977. Discussion: Crossed girdle c-axis fabrics in quartzites plastically deformed by plane strain and progressive simple shear. Tectonophysics 39, 51-54.

99
Lister, G.S. Hobbs, B.E., 1980. The simulation of fabric development during plastic deformation and its application to quartzite: the influence of deformation history. Journal of Structural Geology 2, 335-352.
Lister, G.S., Paterson, M.S., Hobbs, B.E., 1978. The simulation of fabric development in plastic deformation and its application to quartzite: the model. Tectonophysics 45, 107-158.
Lister, G.S., Paterson, M.S., 1979. The simulation of fabric development during plastic deformation and its application to quartzite: fabric transitions. Journal of Structural Geology 1 (2), 99-115.
Lister, G.S., Price, G.P., 1978. Fabric development in a quartz-feldspar mylonite. Tectonophysics 49 (1-2), 37-78.
Mainprice, D. Nicolas, A. 1989. Development of shape and lattice preferred orientations: application to the seismic anisotropy of the lower crust. Journal of Structural Geology 11, 175-189.
Nagy. C. 2012. From cessation of south-directed mid-crust extrusion to onset of orogen-parallel extension, NW Nepal Himalaya. M.Sc.thesis Queen’s University Kingston, Ontario, 293 pp.
Passchier, C.W., Trouw, R.A.J., 2005. Microtectonics, second ed. Springer, Berlin, 366 pp.
Peternell, M., Hasalová, P., Wilson, C.J.L., Piazolo, S. and Schulmann, K. 2010. Evaluating quartz crystallographic preferred orientations and the role of deformation partitioning using EBSD and fabric analyser techniques. Journal of Structural Geology 32, 803–817.
Prior, D.J., Boyle, A.P., Brenker, F., Cheadle, M., Day, A., Lopez, G., Peruzzo, L., Potts, G.J., Reddy, S., Spiess, R., Timms, N.E., Trimby, P., Wheeler, J., and Zetterström, L.1999. The application of electron backscatter diffraction and orientation contrast imaging in the SEM to textural problems in rocks. American Mineralogist 84, 1741-1759.
Prior, D.J. 2009. EBSD in the earth sciences: application, common practice and challenges. In: Schwartz, A.J., Kumar, M., Adams, B.L., Field, D.P. (eds.). Electron Backscatter Diffraction in Materials Science. Springer Science and Business Media, New York. 345-360.
Pryer, L.L., 1993. Microstructures in feldspars from a major crustal thrust zone: the Grenville Front, Ontario, Canada. Journal of Structural Geology 15, 21-36.
Schmid, S.M., Casey, M., 1986. Complete fabric analysis of some commonly observed quartz c-axis patterns. In: Hobbs, B.E., Heard, H.C. (Eds.), Mineral and Rock

100
Deformation: Laboratory StudiesdThe Paterson Volume. American Geophysical Union Monograph, 36. American Geophysical Union, pp. 246-261.
Stipp, M., Stünitz, H., Heilbronner, R., Schmid, S.M., 2002b. Dynamic recrystallization of quartz: correlation between natural and experimental conditions. In: De Meer, S., Brury, M.R., De Brasser, J.H.P., Pennock, G.M. (Eds.), Deformation Mechanisms, Rheology and Tectonics: Current Status and Future Perspectives. Geological Society, London, Special Publication 200, 171-190.
Stipp, M., Tullis, J., 2003. The recrystallized grain size piezometer for quartz. Geophysical Research Letters 2088.
Sullivan, W.A., Beane, R.J. 2010. Asymmetrical quartz crystallographic fabrics produced during constrictional deformation. Journal of Structural Geology 32, 1,430–1,443.
Toy, V.G., Prior, D.J., Norris, R.J., 2008. Quartz textures in the Alpine fault mylonites: influence of pre-existing preferred orientations on fabric development during progressive uplift. Journal of Structural Geology 30, 602–621.
Ullemeyer, K., Braun, G., Dahms, M., Kruhl, J.H., Olesen, N.Ø., Siegesmund, S., 2000.Texture analysis of a muscovite-bearing quartzite: a comparison of some currently used techniques. Journal of Structural Geology 22, 1541-1557.
Urai, J. L., Means, W. D., Lister, G. S. 1986. Dynamic recrystallization in minerals, in Mineral and Rock Deformation: Laboratory Studies, Geophysical. Monogr. Ser 36, eds. Hobbs B. E.. Heard H.C. 166-199, AGU, Washington, D.C.
Wilson, C.J.L., Russell-Head, D.S., and Sim, H.M., 2003. The application of an automated FA system to the textural evolution of folded ice layers in shear zones. Annals of Glaciology 37, 7-17.
Wilson, C.J.L., Russell-Head, D.S., Kunze, K., and Viola, G. 2007. The analysis of quartz c-axis fabrics using a modified optical microscope. Journal of Microscopy 227: 30-41.

101
Appendix B: Unprocessed Electron Backscatter Diffraction data
*Thin Section images denote general areas (yellow boxes) on the sample where
Electron Backscatter Diffraction data were collected
REC_2

102
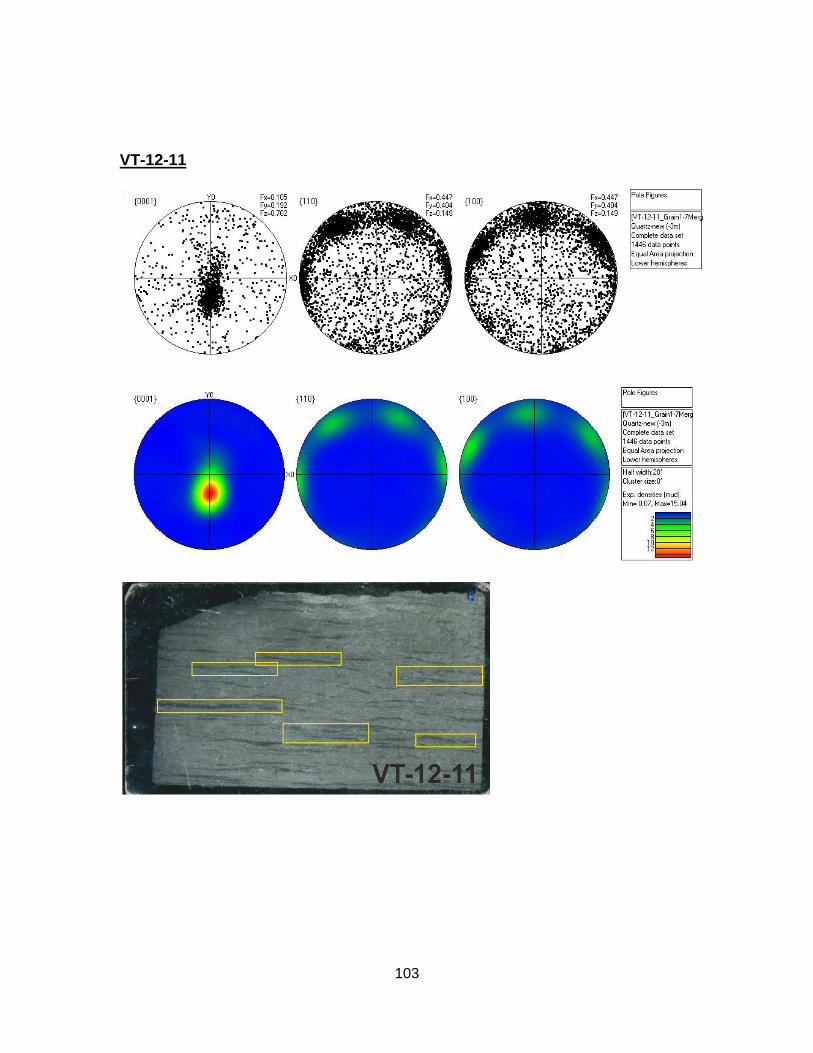
103
VT-12-11
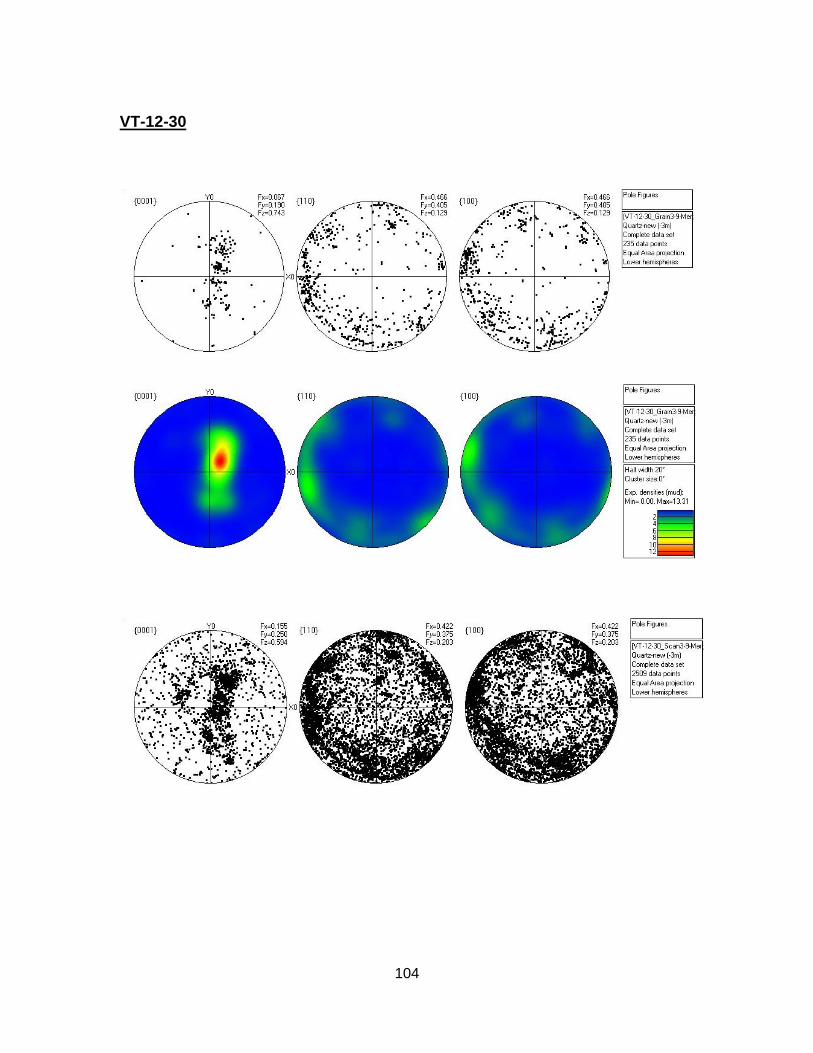
104
VT-12-30
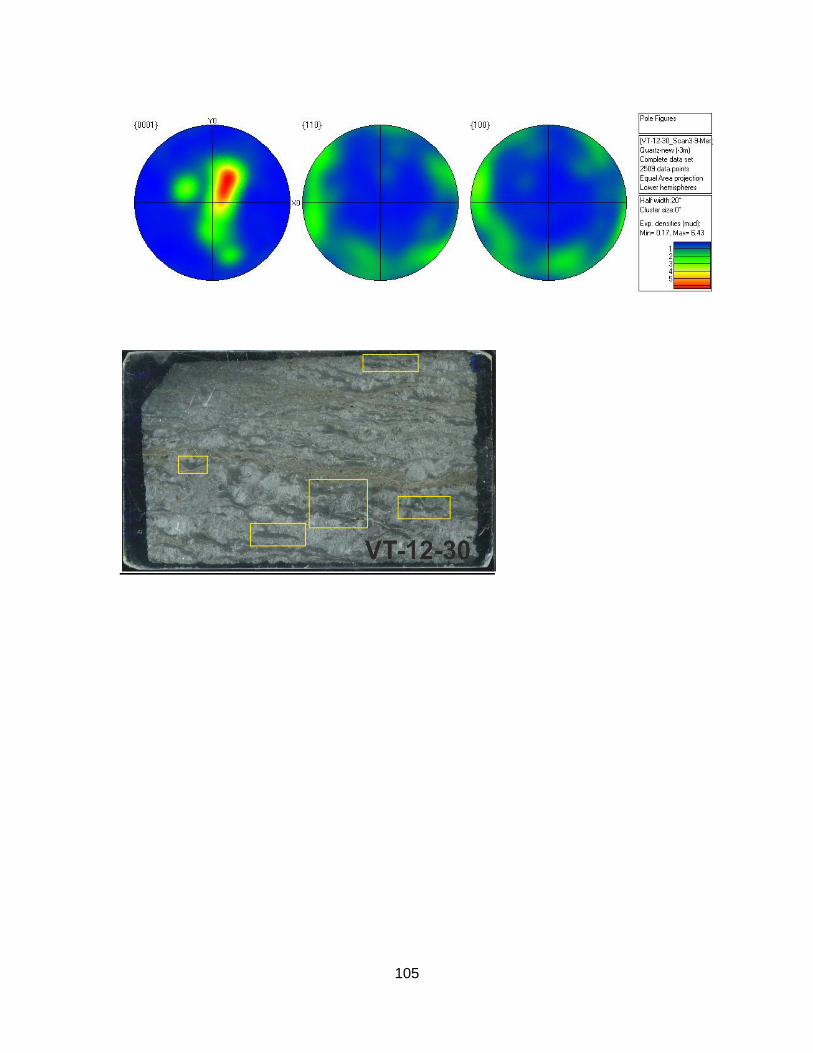
105
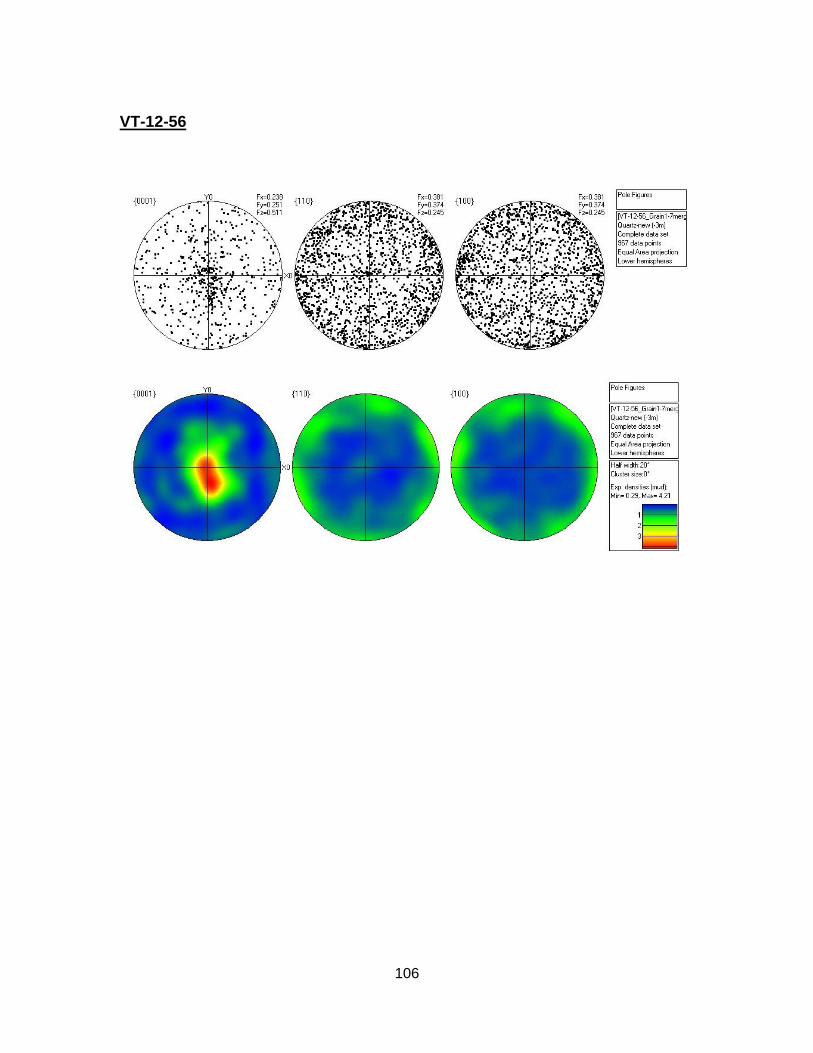
106
VT-12-56
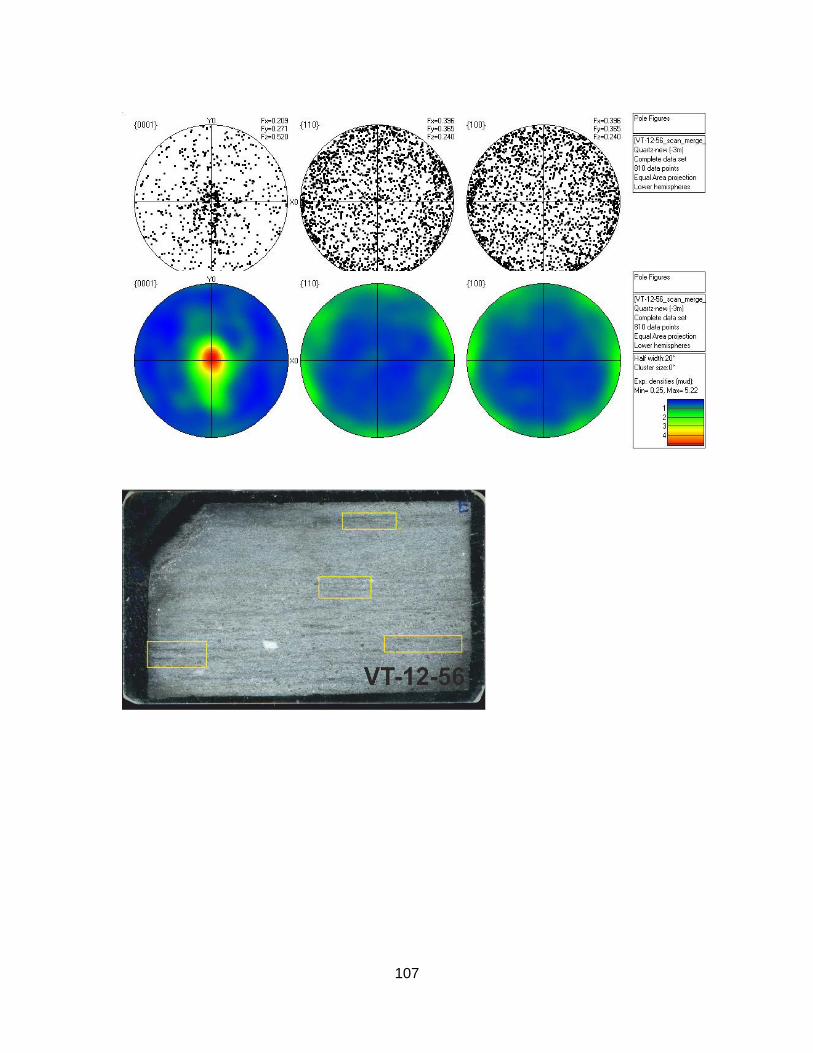
107

108
VT-12-59
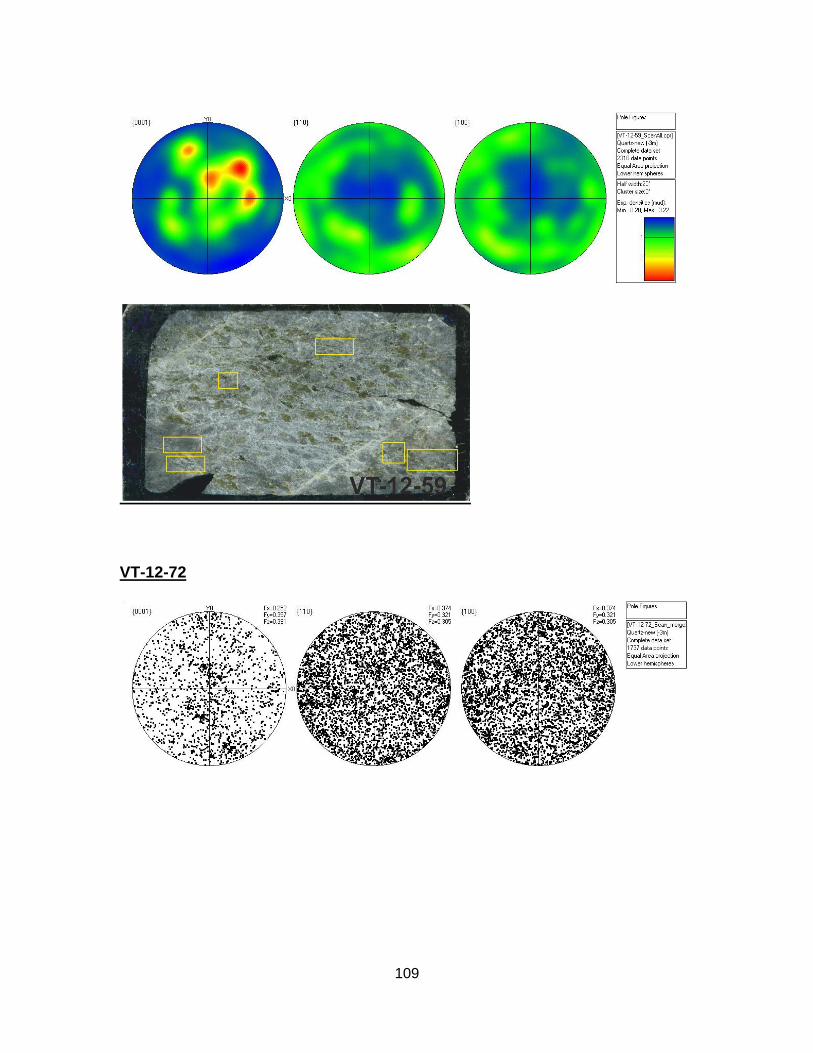
109
VT-12-72
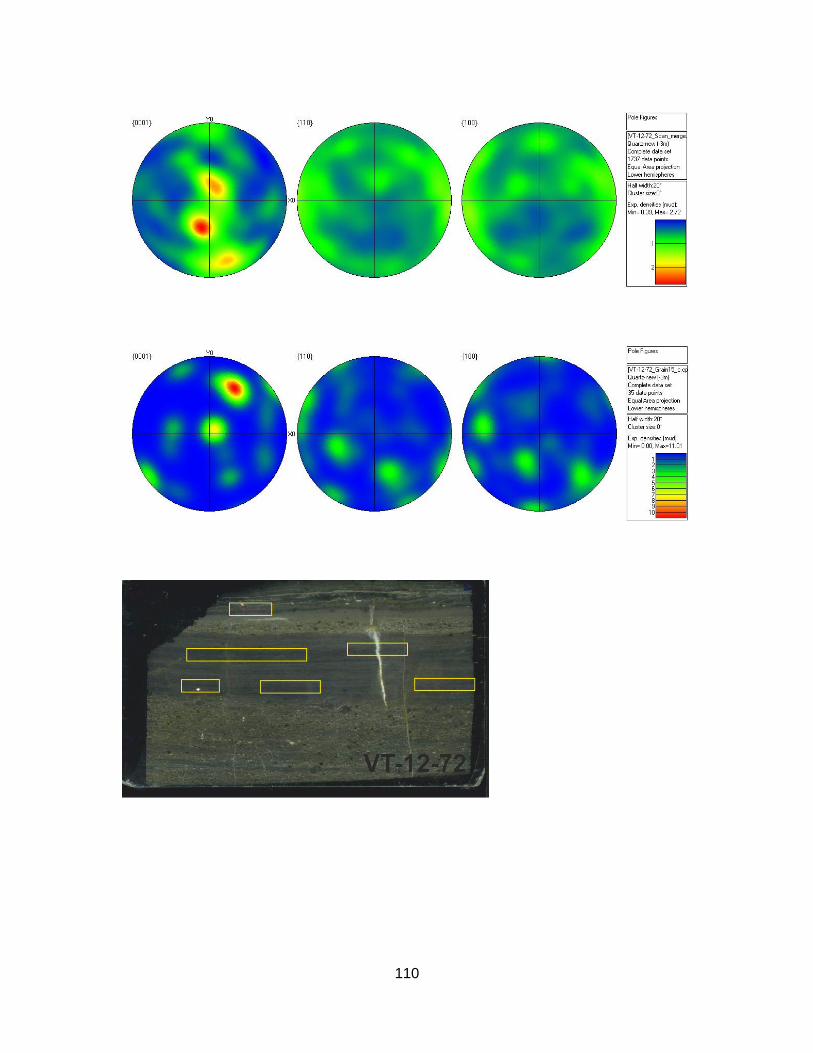
110
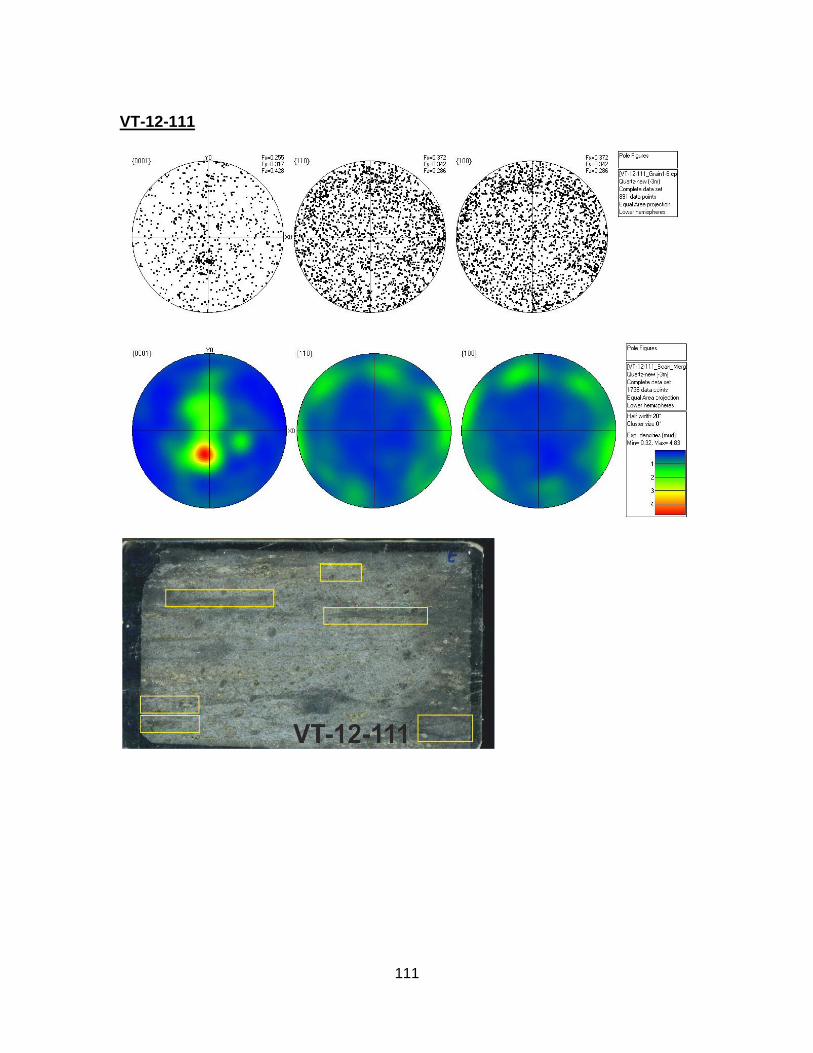
111
VT-12-111
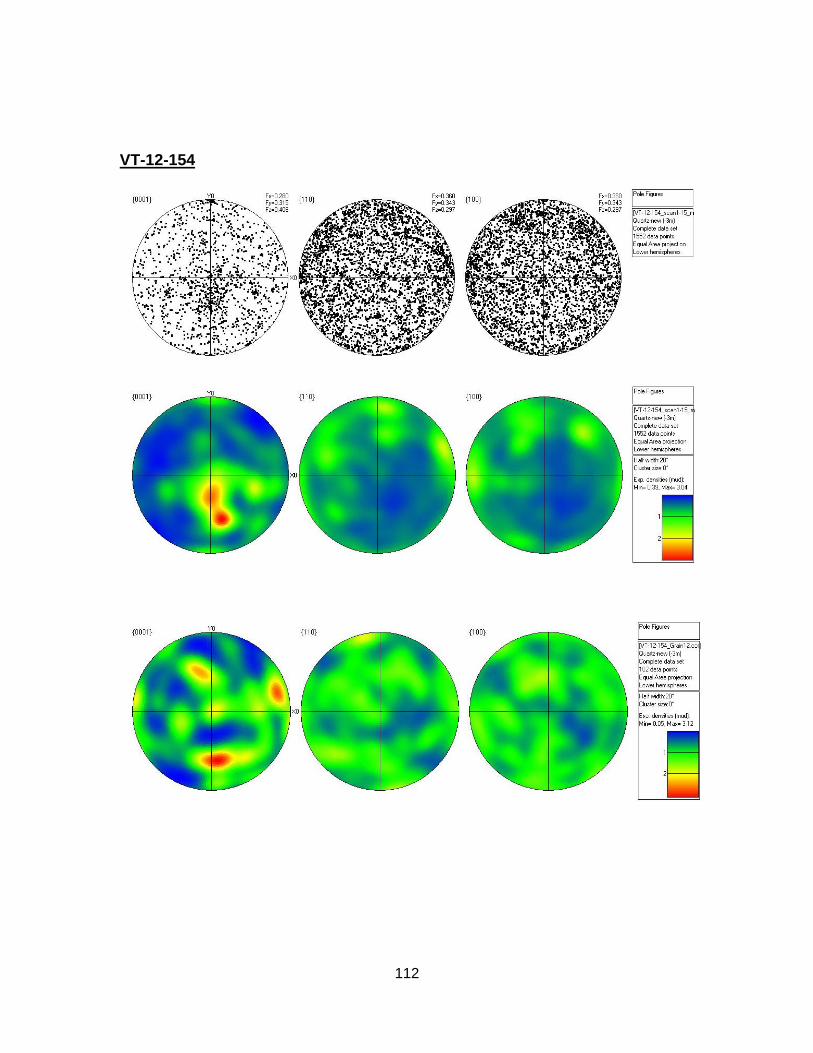
112
VT-12-154
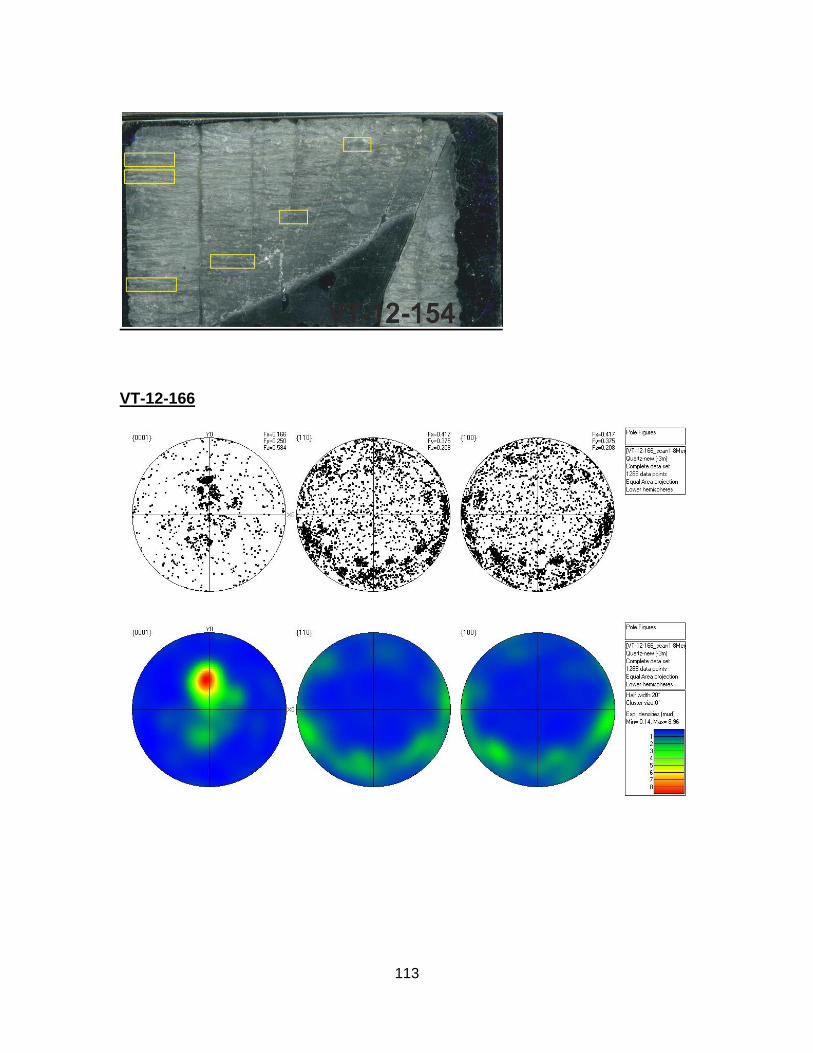
113
VT-12-166
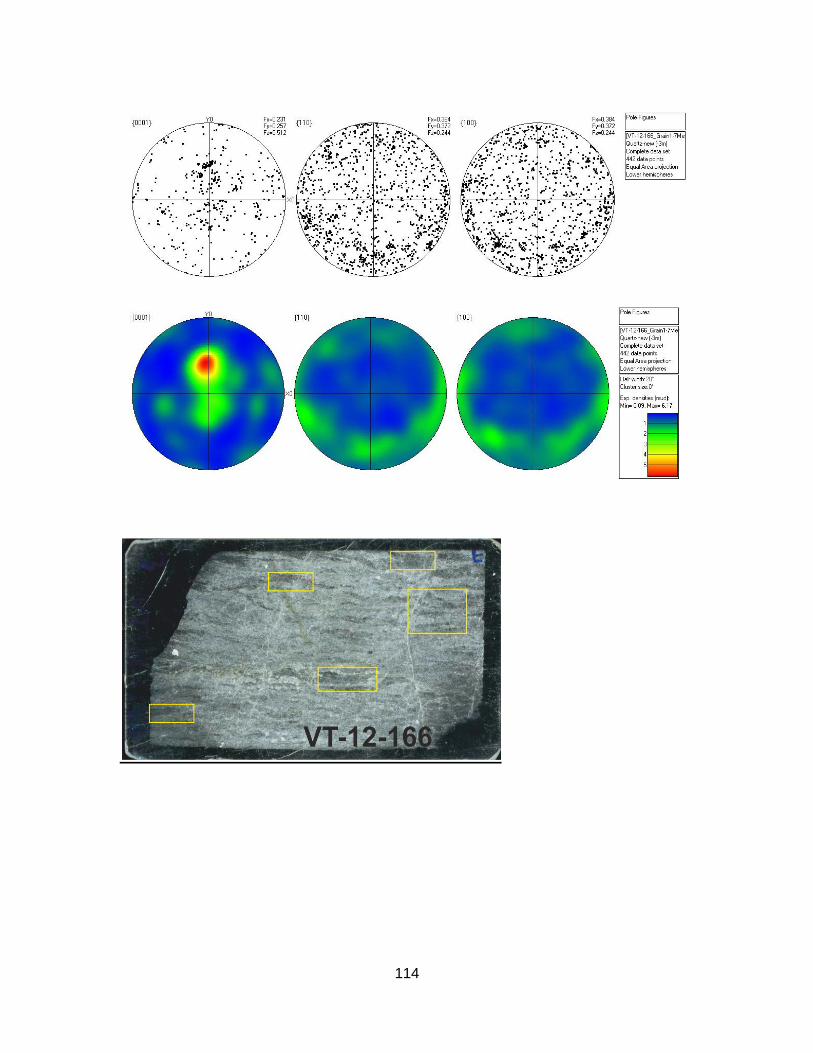
114
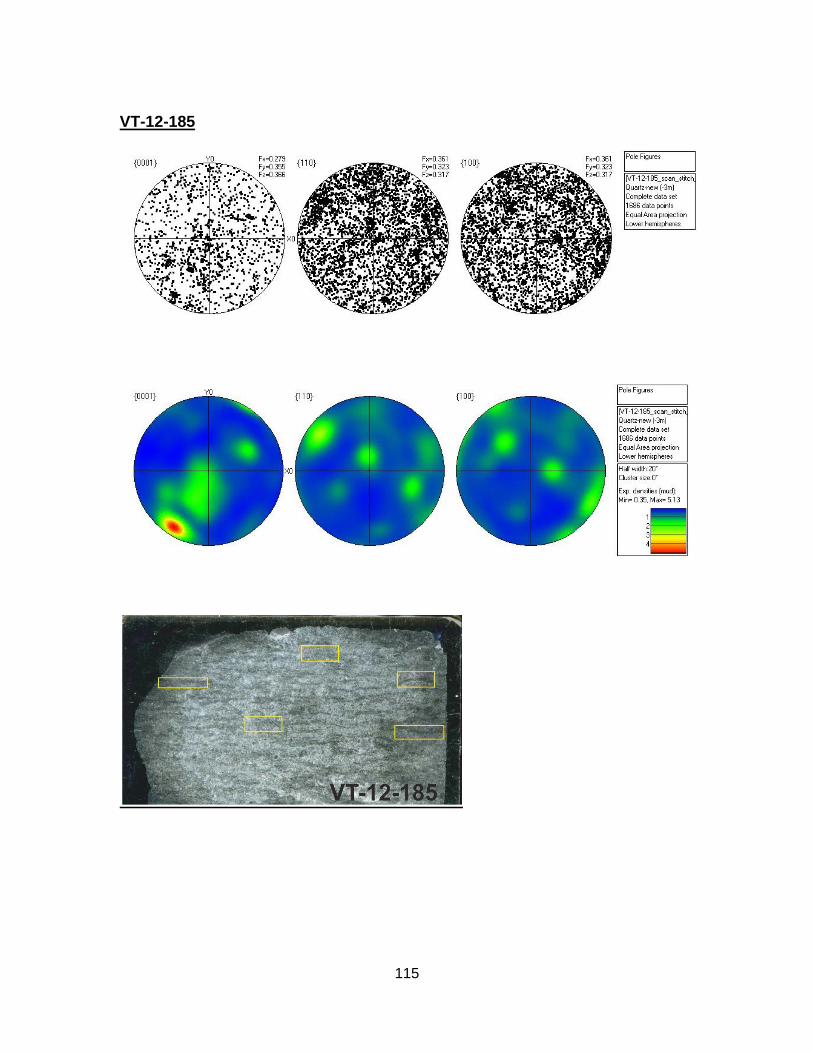
115
VT-12-185

116
Appendix C: Fabric Analyser data
Rec_2
n=2027
VT-12-11
n=381
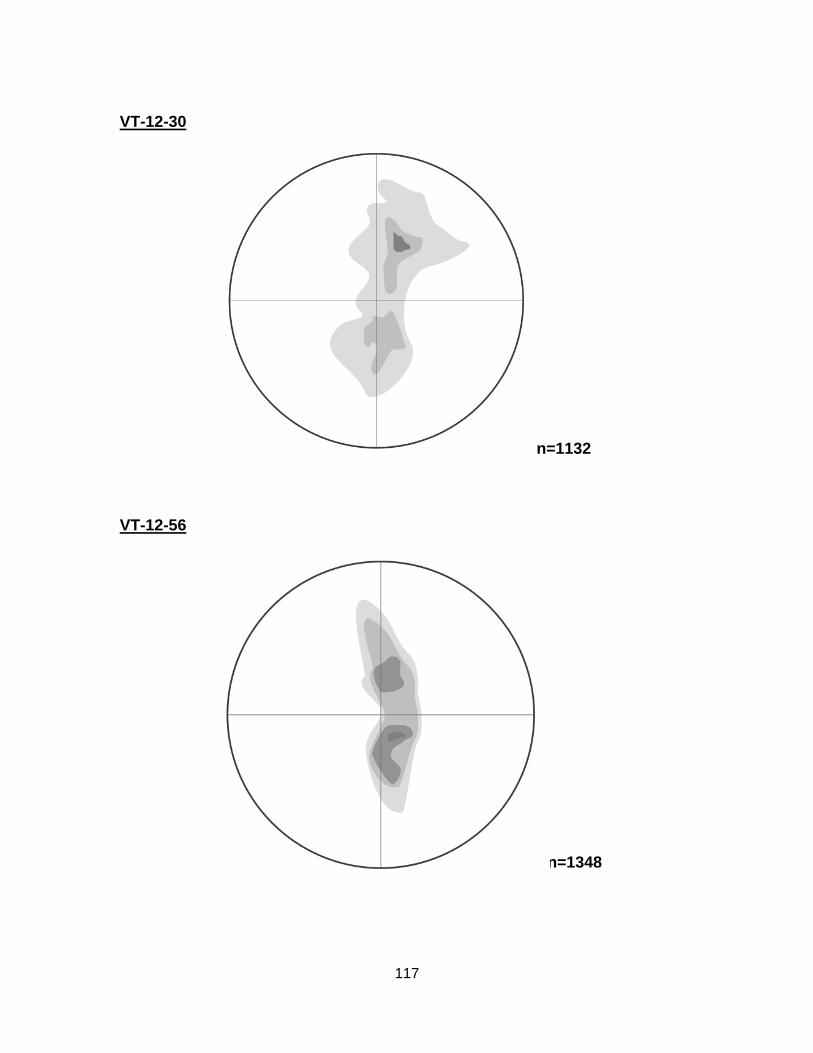
117
VT-12-30
n=1132
VT-12-56
n=1348
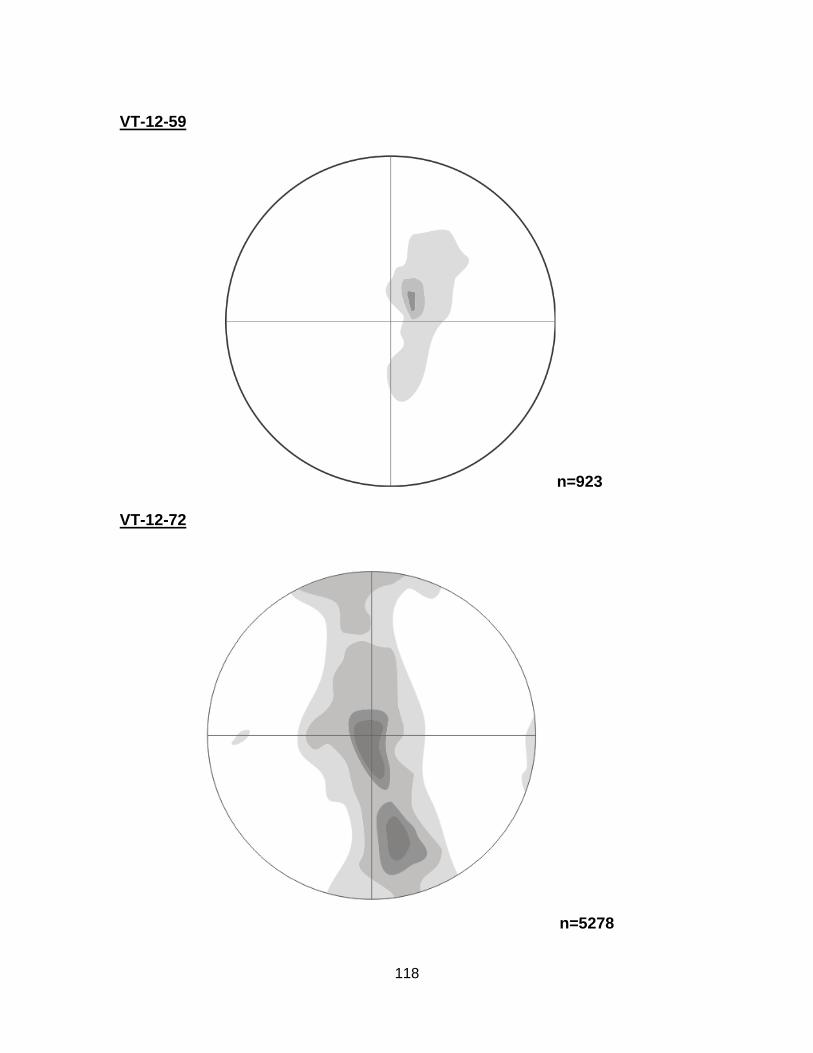
118
VT-12-59
n=923
VT-12-72
n=5278

119
VT-12-111
n=936
VT-12-154
n=1165

120
VT-12-166
n=207
VT-12-185
n=1068

121
Appendix D: Supplementary geometric data
C.1. Initial geothermal gradient
Assuming peak metamorphism conditions of 670±50 °C and ~6.2±1.0 kbar equivalent to ~17-23 km depth based on P-T data of Brown et al. (2012) (Fig. C.1).
°
°
°
°
Gap between 280°C and 670±50 °C; ~390 °C;
Hence initial geothermal gradient in 30-39 °C km-1 range.
Figure C.1. Calculation of initial geothermal gradient assuming 670±50 °C equivalent to ~17-23 km depth based on P-T data of Brown et al. (2012).

122
C.2. Approximate vertical shortening
Assuming vertical section of OVsz between 1-1.5 km (Fig. C.2)
Vertical shortening based on equation:
ev = vertical stretching/extension
lf = final distance between 280-670 °C isotherms following deformation
lo = initial distance between 280-670 °C isotherms following deformation
% shortening
85-92% Vertical shortening approx.
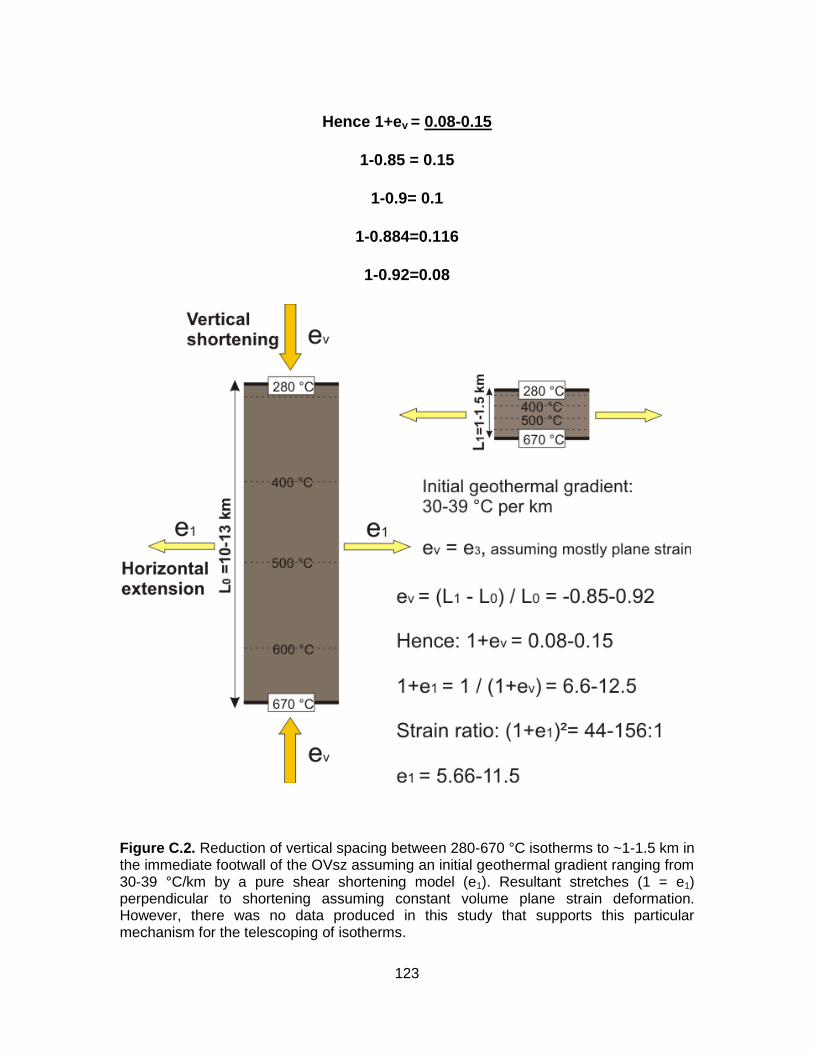
123
Hence 1+ev = 0.08-0.15
1-0.85 = 0.15
1-0.9= 0.1
1-0.884=0.116
1-0.92=0.08
Figure C.2. Reduction of vertical spacing between 280-670 °C isotherms to ~1-1.5 km in the immediate footwall of the OVsz assuming an initial geothermal gradient ranging from 30-39 °C/km by a pure shear shortening model (e1). Resultant stretches (1 = e1) perpendicular to shortening assuming constant volume plane strain deformation. However, there was no data produced in this study that supports this particular mechanism for the telescoping of isotherms.
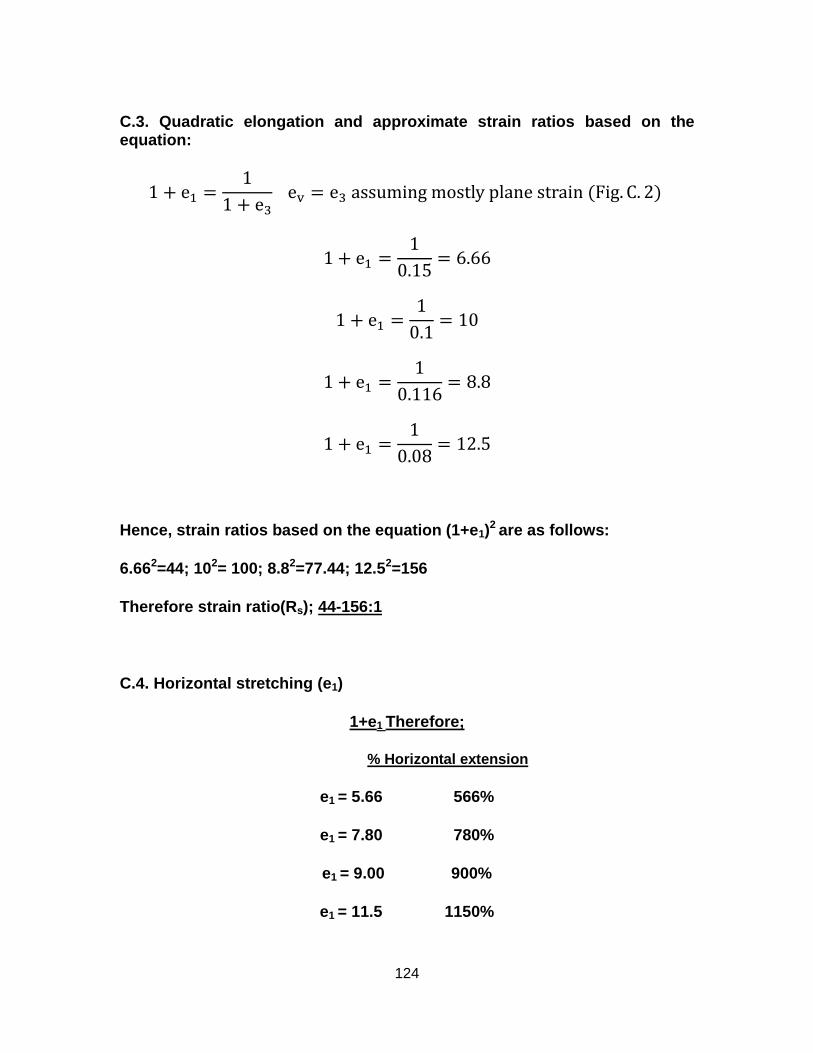
124
C.3. Quadratic elongation and approximate strain ratios based on the equation:
Hence, strain ratios based on the equation (1+e1)2 are as follows:
6.662=44; 102= 100; 8.82=77.44; 12.52=156
Therefore strain ratio(Rs); 44-156:1
C.4. Horizontal stretching (e1)
1+e1 Therefore;
% Horizontal extension
e1 = 5.66 566%
e1 = 7.80 780%
e1 = 9.00 900%
e1 = 11.5 1150%
125
References:
Brown, S. R., Gibson, H. D., Andrews, G.D.M., Thorkelson, D.J., Marshall, D.D., Vervoort, J.D., Rayner N., 2012. New constraints on Eocene extension within the Canadian Cordillera and identification of Phanerozoic protoliths for footwall gneisses of the Okanagan Valley shear zone. Lithosphere 4, 354-377.

126
Appendix E: Late to Post-kinematic volcanism within the Okanagan Mountain Provincial Park
Two post-kinematic dacitic outliers are mapped in northern limb of the pericline that defines the OVsz within the Okanagan Mountain Provincial Park (Fig. D.1) Dikes that feed into the outliers cut through the mylonitic gneiss. Euhedral to subhedral K-feldspar, hornblende, biotite phenocrysts are common in the felsic lavas which also contain minor subhedral, partly resorbed quartz xenocrysts in a vitrophyric groundmass. The outliers lack any of penetrative shear zone fabric suggesting they post-date the main phase of Eocene deformation. The outliers appear to be deposited within a paleotopographic low created by a small graben down-dropped along late, north-northeast trending high-angle faults that parallel the boundaries of the outliers. The long-axes of feldspar and hornblende phenocrysts within the lavas also parallel the boundaries (Fig. D.1). Despite being well within the ductily deformed structural section of the shear zone (~300-400m structural depth), the contacts of the mylonitic gneiss beneath theses outliers are cataclasized, brecciated and chloritized (Fig. D.1), indicating the felsic lavas were emplaced following the majority of exhumation facilitated by the OVsz.

127
Figure D.1. Outcrop appearance of the two dacitic outliers both approximately 300-400m down the vertical structural section of the OVsz. Note the alignment of the long axes of the orthoclase and hornblende phenocrysts in a NNE direction parallel to the strike of the high angle brittle fracture set in which the outliers are aligned. The contact with mylonitic gneiss is highly fractured, brecciated and chloritized.
These outliers are tentatively correlated with the Marama Formation based on previous mapping of similar felsic lava flows within and east of the OVsz (Church 1973, 1985; Bardoux, 1993). Cooling ages for volcanic rocks of these formations range from 48.4 Ma (whole rock) to 53.1 Ma (K/Ar-biotite) (Church 1973, 1985) suggesting the mid-lower section of the OVsz (i.e ~300-400m estimated structural depth) on which the lavas were extruded was exhumed to the surface by this time. The cooling ages of these regional volcanic outliers are coeval with the ages of leucosome, dikes and plutons interpreted to have been generated at mid-crustal depths (Bardoux, 1993). This suggests that ductile deformation lower in the structural succession may have been still ongoing while the mid-lower section of the OVsz was already at the surface.
128
References:
Bardoux, M. 1993. The Okanagan Valley normal fault from Penticton to Enderby—Southcentral British Columbia. Ph.D. Dissertation, Carleton University, Ottawa, Ontario, 292 p.
Church, B.N. 1973. Geology of the White Lake Basin, British Columbia. Department of Mines and Petroleum Resources, Bulletin 61, 3-141.
Church, B.N. 1985. Volcanology and structure of Tertiary outliers in south-central BritishColumbia. Field Trip Guidebook, B.C. Ministry of Energy. Mines, and Petroleum Resources, 46p.