three case histories of cracking … case histories of ... case 2: fatigue failure of a detail ......
TRANSCRIPT

AD-A252 8211111111 llil u 111 pill~ 111_UIL -EN -oo00
CIVIL ENGINEERING STUDIES (O7)STRUCTURAL RESEARCH SERIES NO. 569
ISSN: 0069-4274
THREE CASE HISTORIES OF CRACKING PROBLEMSASSOCIATED WITH
STEEL BRIDGE FLOOR BEAMS
--T hhsD TICIThis document ha' been approved ELECTEi,tri utio4 is unlimitecL U 1 92
L JUL 15~ 1992 IIBy
W. H. WalkerM. D. HolbrookandP A. Cassity
A Report on a Research ProjectSponsored by theSTATE OF ILLINOISDEPARTMENT OF TRANSPORTATION and theU. S. DEPARTMENT OF TRANSPORTATIONFederal Highway Administration
DEPARTMENT OF CIVIL ENGINEERINGUNIVERSITY OF ILLINOIS ATURBANA-CHAMPAIGNURBANA, ILLINOISJUNE 1992
92-18677

TECHNICAL REPORT STANDARO TITLE PAGE
1. Report No. 1. Government Accession No. 3. Reciplont's Ceflog No.
4. Title and Subtitle S. Report Dote
Three Case Histories of Cracking Problems June 1992Associated With Steel Bridge Floor Beams 6. Perfoe.ing Organieain Code
7. Autho,(s) 8. Performing Orgenization Report No.
W. H. Walker, M. D. Holbrook, and P. A. Cassity UILU-ENG-92-20079. Performing Org n i atio n HNomo end Address 10. Worb Unit No.
University of Illinois at Urbana-ChampaignDepartment of Civil Engineering 11. C et Grnt N.205 North Mathews AvenueUrbana, Illinois 61801-2352 IHR-312
13. Type of Report end Period Covered
12. Sponsoring Agency Nam. end Addres- FINAL REPORTIllinois Department of Transportation 7/88 through 12/91Bureau of Materials and Physical. ResearchSpringfield, Illinois 14. Sponsoring Agency Code
I5. Supplementary Notes
16, Abstract
Floor system cracking problems, the focus of the present study, occur in both structures of recent construction and inolder bridges which have been in service for many years. The present study has risen out of specific cases of floorsystem cracks which are not immediately detrimental to the structural integrity of the floor system and which do notat the outset seem related to a usual design basis load effects. The cases forming the central focus of this report are:(1) The 1-474 Shade-Lohmann Bridge over the Illinois River south of Peoria, (2) The 1-74 Bridge over the VermilionRiver at Danville, and (3) The 1-74 Bridge over the Sangamon near Mahomet in Champaign County.
The following is seen: Case 1: Cracking due to forces not associated with vertical vehicle loading. That is, evidenceis strong that cracking arises from longitudinal load transmitted through the out of plane flexure of the floor beam webin the segment between the connection clip angles and the flange at either end. Calculations show that a very modestinduced longitudinal deformation is associated with substantial local stresses at the web to flange junction which is thesite of the cracking. Case 2: Fatigue failure of a detail with adverse geometry but with forces induced by vehicle loadswhich clearly account for the damage. A repair detail to reduce member forces has been suggested and is evaluated.Case 3: The development of a fatigue crack at a cope detail associate with a reasonable stress state for the damageobserved, but with poor correlation with a limited controlled vehicle test and predictions of bridge behavior using agrid model. Additional field studies with more extensive instrumentation and a more comprehensive analytical modelis needed to resolve uncertainties in this case.
17. Key Werd@ 16. Distebuteon StatementBridges, Floorbeams, Cracking, Release UnlimitedFatigue and Fracture
19. Security Ctessif. (of this report 20. Security Clesf. (of this ieo) 21. No. of Paoes 22. Price
Unclassified Unclassified 61
Form DOT F 1700.7 g.oti

THREE CASE HISTORIES OF CRACKING PROBLEMSASSOCIATED WITH
STEEL BRIDGE FLOOR BEAMS
by
W. H. Walker, M. D. Holbrook and P. A. Cassity
Issued as the Final Report on
Project IHR-312 Accesion For
PROBLEMS WITH BRIDGE FLOOR BEAMS NTIS CRA&I _DTIC TAEconducted by the Unannounced Lconduted b theJustification
Department of Civil EngineeringEngineering Experiment Station .... *b -*io--
University of Illinois at Urbana-Champaign bo.Avdilabiiity Codes
in cooperation with Dist ASipij ac)1lor
STATE OF ILLINOISDEPARTMENT OF TRANSPORTATION 1A-l
and the
U. S. DEPARTMENT OF TRANSPORTATIONFederal Highway Administration
Urbana, Illinois
June 1992

ACKNOWLEDGEMENT
This report was prepared as part of the Illinois Cooperative Highway Research Program,Project IHR-312, Research on Problems Associated with Bridge Floor Beams, by the Depart-ment of Civil Engineering, in the Engineering Experiment Station, University of Illinois at Ur-bana-Champaign, in cooperation with the Illinois Department of Transportation and the U. S.Department of Transportation, Federal Highway Administration.
DISCLAIMER
The contents of this report reflect the views of the authors who are responsible for thefacts and the accuracy of the data presented herein. The contents do not necessarily reflect theofficial views or policies of the Illinois Department of Transportation or the Federal HighwayAdministration. This report does not constitute a standard, specification or regulation.

TABLE OF CONTENTS
Chapter Page
1. INTRODUCTION
1.1 General 1
1.2 Goals of This Report 2
1.3 Case Study Approach 4
1.4 Case Studies Used 4
1.5 Report Organization 5
2. THEORY OF CRACK INITIATION AND PROPAGATION
2.1 Introduction to Elastic Theory 6
2.2 Crack Propagation Life from an Initial Length 12
2.3 Critical Crack Length and Brittle Fracture 13
3. CASE 1: THE SHADE-LOHMANN BRIDGE3.1 Description of Bridges 17
3.2 Inspection and Detection 18
3.3 Finite Element Model 25
3.4 Repair and Fracture Control 28
4. CASE 2: THE 1-74 BRIDGE OVER VERMILION RIVER AT DANVILLE
4.1 Field Investigation 32
4.2 Structural Analysis of Bridge 34
4.3 Analysis of Retrofit 36
5. CASE 3: MAHOMET BRIDGE ON 1-74 OVER THE SANGAMON RIVER
5.1 Field Investigation 39
5.2 Structural Analysis of Bridge 41
5.3 Finite-Element Analysis of the Floor Beam Cope 42
6. SUMMARY AND CONCLUSIONS
6.1 Summary and Conclusions 47
6.2 On Methodology 48
6.3 Future Work 53
REFERENCES 54
ii
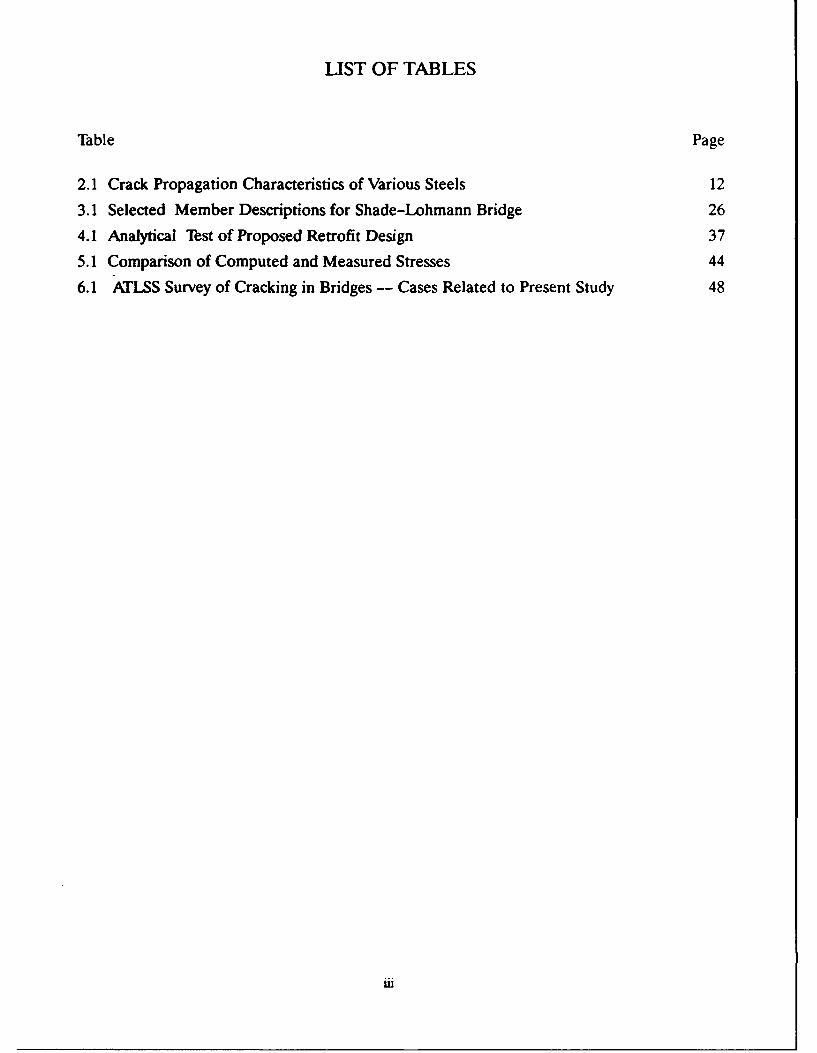
LIST OF TABLES
Table Page
2.1 Crack Propagation Characteristics of Various Steels 12
3.1 Selected Member Descriptions for Shade-Lohmann Bridge 26
4.1 Analytical Test of Proposed Retrofit Design 37
5.1 Comparison of Computed and Measured Stresses 44
6.1 AILSS Survey of Cracking in Bridges -- Cases Related to Present Study 48
ii

LIST OF FIGURES
Figure Page
2.1 Propagation of a Simple Through Edge Crack 7
2.2 Illustration of Crack Front Geometry 8
2.3 Reinitiation of a Crack from a Hole 9
2.4 Correction Factor for a Crack Propagating from a Hole 10
2.5 Three Basic Modes of Crack Surface Displacement 11
2.6 Wrious Correlations Between Kic and CVN 14
2.7 Kk Data For A-36 Steel Reported by Rolfe and Barsom 15
3.1 Sketch of the Shade-Lohmann Bridge 17
3.2 Sketch of Typical Floorbeam Crack Location 19
3.3 Photograph of Typical Web Cracking in Floor Beam 20
3.4a Crack Measurements at Floorbeam Ends, Various Panel Points 21
3.4b Crack Measurements at Floorbeam Ends, Various Panel Points 22
3.5a Crack Measurements at Floorbeam Ends Near Suspended Span HangersWest Bound Bridge 23
3.5b Crack Measurements at Floorbeam Ends Near Suspended Span HangersEast Bound Bridge 24
3.6 Effect of Transverse Vehicle Position on Stress at End of Floorbeam 27
3.7 Postulated Distortion Due To Longitudinal Forces 29
3.8 A Possible Repair Detail After Fisher 30
3.9 Shade-Lohmann Slab-flange Separation Detail 31
4.1 Cross Section of Vermillion River Bridge on 1-74 at Danville 32
4.2 Upper Flange Connection Detail for Cross Frame 33
4.3 Retrofit Scheme to Reduce Diagonal Forces 34
4.4 Plan View of Three-Span Grid Model of Bridge 35
4.5 Axial Force in Cross-Frame Diagonal Due to 32 Kip Axle 36
4.6 Sketch of Loading for Retrofit Cross Frame Study 37
4.7 Section Through Strain Relief Device 38
5.1 Bridge over the Sangamon River on 1-74 at Mahomet 39
5.2 Cope Area on 1-74 Bridge over the Sangamon River 40
5.3 Finite-Element Model of the Floor Beam Cope 42
5.4 Detail of Element Model Around Cope 43
5.5 FEM Study of Stresses Adjacent to Beam Cope 45
iv

Figure Page
6.1 Diagrammatic Flow of Methodology 51
6.2 Sketch of Fatigue Crack Gage -- After Reference 17 52

CHAPTER 1
INTRODUCTION
1.1 General
Floor system cracking problems, the focus of the present study, occur in both
structures of recent construction and in older bridges which have been in service for many
years. Thus this report deals with one of the several issues in the management of maintenance
and rehabilitation of bridges in the highway transportation system of the State of Illinois and
the nation. Recent inspections of steel bridge floor systems in Illinois have revealed the
existence of cracks in floor beam connection and cope regions which are not always
attributable to expected, load related, causes. Structural behavior due to loads or effects
outside of the usual realm of design calculation is present and deserves study.
The maintenance, rehabilitation and the planning for the replacement of bridge
structures consumes an ever increasing portion of resources and of the time of the staff of
IDOT and the various state bridge departments. Systematic inspections of bridge structures
are now either mandated or attempted as forces permit depending on the class of highway or
street usage and ownership. Invariably difficult decisions must be reached where damage is
evident and remaining life may be threatened.
The discovery of cracking in steel structures mandates a decision; the crack damage
should be measured, documented and carefully studied for at least two structuralpossibilities:
" The crack is visible and unsightly, but is stable and not growing (i.e., not
potentially fatal, nor in a fracture critical member ), and action iswarranted to remove the crack or treat it so as to preclude re-initiationof propagation so as to eliminate the need for continued and frequentmonitoring for possible growth.
" The crack is growing and potentially critical. It may extend to such alength as to become unstable -- the occurrence of a so-called brittle
fracture.
The issues associated with the existence of cracks in floor systems are a subset of more
general problems associated with the scheduling of maintenance, rehabilitation and theplanning for the replacement of bridge structures. The present study has risen out of specific
cases of floor system cracks which are not immediately detrimental to the structural integrity
of the floor system and which do not at the outset seem related to a usual design basis load
I

effects. These detected areas of damage represent obvious and visible cracking but are not inthe usual sense an issue for remaining overall structural fatigue life. The cracks may be theresult of high-cycle fatigue damage or they may be due to other conditions not usuallyassociated with fatigue. It is important to assess whether the cracks found can continue togrow and if they do, at what degree of extension do they represent a significant risk forcatastrophic failure.
The existence of a crack represents the completion of the initiation phase of thefatigue process and that the propagation phase is underway. In complex structuralassemblies, particularly in welded construction, it is often true that micro-defects andmicro-cracks arising from residual stresses pre-exist in the structure before service loadingbegins. Essentially the fatigue life of the structure in the context of the present study nearlyalways involves primarily the propagation phase of fatigue life.
The design process, particularly using the common standards of structural modellingand analysis. does not provide design or review information specific enough to address theissue of possible crack propagation in the locations represented in this study as a design limitstate. Analysis tools of a higher complexity to provide a three-dimensional modelling of theprimary load carrying system, girders or trusses and the floor system are needed as aminimum. This is not to be taken as a criticism of current design practice since the usualapproach is historically satisfactory when good detailing based on adequate field experienceis invoked.
1.2 Goals of This Report
This study is not intended to modify the current fatigue design procedures for mainload carrying members in bridges [1,21*. The present results could pertain to a structurewhich has been adequately designed for fatigue but has now developed secondary cracking inthe floor systim because of phenomena the same as or similar to those discussed herein.
It is the intent that this report both summarize the results of the Project IHR-312investigation of the subject problem, to serve as a guide to study of the present class ofproblems, and as an exposition on crack propagation problems at other locations in steelbridge structures. The theoretical background for understanding and predicting thepropagation of cracks under cyclic stress applications is well documented in the literature andverified by experimental evidence. This knowledge must be combined with information onsite specific loading conditions, the structural behavior both on a gross level and in detail atthe critical "hot spot" where cracking has been detected. Case histories will be used to
Numbers in Brackets refer to items in REFERENCES
2

illustrate both the results of findings for those cases and as a means for illustrating theinvestigative approach which is needed in a more general sense.
These methods are useful for review and decision making for repair, majorrehabilitation or replacement. It is not intended that these methods be appended to thecurrent fatigue design practice; it would be prohibitive in engineering time to investigate allpossible postulated cracking sites for their initiation and propagation life times. Good designpractice which minimizes adverse geometry in details and adequate quality assurance forconnections is an important factor in "crack free" steel construction.
A significant benefit is associated with a more complete understanding and resolutionof the specific floor beam cracking problems presented herein. These are problems which atpresent are deemed repairable, but which may have a high likelihood of reoccurrence.Without an understanding of the structural phenomena involved, the best present course of
action is to repair the floor beam d-.mage with frequent re-inspection of the repair detail andadjacent locations which might be subject to similar cracking. A methodology for handlingsimilar cracking and behavior problems can be directed along the lines followed in this study.
The essential needs in the study involve not only analysis and description of the
structure but also a careful assessment of the loading conditions both in magnitude, andtraffic volume.
For the subject bridges, available field observations, stress measurements and load
studies have been used as background for the present effort. Some general structural analysisof the bridges using 3-D analysis for forces in the region of the cracking zone were made priorto the present study.
All analytical studies have been made with FINITE [8], a comprehensive structural
software package with linear and non-linear FEM capabilities, implemented on the CivilEngineering Department computer laboratory facilities. Any comparable structural softwareproduct would be equally useful.

1.3 Case Study Approach
Floorbeam cracking problems can not be studied in the abstract; each instance of
damage has circumstances of loading, structural restraint, detail geometry, repair potential,
etc., that must be taken in context. Hence this problem area is well suited to investigation bythe case study approach. But for each case history there are common tasks:
" Identify and quantify the live load induced stresses or other environ-mentally induced conditions which are capable of initiating andpropagating the cracks observed.
" Determine the crack propagation rate and the nature and extent of thefatigue problem present, making use of stress analysis, truck traffic dataand load histories as available and fracture and fatigue theory.
" Develop a scheme for remedial action in the present structures andsuggest design changes for the future. Verify the suitability of thisscheme making use of the above results.
" Apply a methodology for estimating remaining life of a detail to
determine when replacement (as an alternatiw. to repair) will becomeessential. While the above objectives are stated with reference tospecific cracking problems in floor beams, these objectives would alsobear upon on the problems of fatigue cracking in steel bridge members,i.e., webs, stiffeners, cross frames, etc.
1.4 Case Studies Used
The cases forming the central focus of this report are: (1)The 1-474 Shade-Lohmann
Bridge over the Illinois River south of Peoria., (2) the 1-74 Bridge over the Vermillion River
at Danville, and (3) The 1-74 Bridge over the Sangamon near Mahomet in Champaign
County. These bridges had been the subject of concern of the Bridge Investigation Unit of theBureau of Materials and Physical Research and the Bureau of Bridges and Structures (IDOT).
The studies [7,11,12] were the responsibility of the late F. K. Jacobsen with J. M. South and
Ashraf Ali.
The floor system crack damage situation of concern at the outset of this study can be
summarized as follows:
(1) In the 1-474 Shade-Lohmann bridge the cracks occur at the ends of the floor beam
at the junction of the web and the top flange. This location carries zero calculated tension in
this crack region. No appreciable stress can be measured due to live load. In addition there
are small diagonal cracks at the same location near the clip angles which connect the floor
4

beams to the main truss system. The bridge is a large three span continuous through truss. Theweb cracks which are parallel to the flange have been initially arrested with a drilled hole.
Re-initiation is an issue. It appears that the cracks may turn downward and grow into the webif not arrested.
(2) At the 1-74 Bridge over the Vermillion River cracks were found the the
cross-frame connection details. The number of cracks was extensive and a specific retrofitdetail for the repair was developed.
(3) At Mahomet the cracks are found in a cope detail at the ends of the floor beam
about 20 ft. from the abutment in the side span of a three span continuous structure. Thecracks have been arrested by a hole; the issue of re-initiation remains. Measured stresses atthe location are significant, probably greater than 12 ksi, under truck traffic. However theselarger tensile stresses in the near vertical direction are associated with the vehicle crossing inthe center span, not when the vehicle is over the floor beam in question. A structural actioninvolving live load uplift forces seems to be involved.
These cases can be categorized to the extent that three broad situations are covered:
cracking where a potential fatigue situation exists; cracking in a region of no apparent fatiguepotential; and cracking in secondary bracing where fatigue design is not a usual practice.
1.5 Report Organization
The use of linear elastic fracture mechanics to assess the potential for crack growth isbasic to the studies herein and is reviewed in Chapter 2. The three case studies are presentedin detail in Chapters 3, 4 and 5. A presentation of a general methodology of approachingother cases of this class is outlined and discussed in Chapter 6; the chapter includes a summary
and conclusions.

3 CHAPTER 2
THEORY OF CRACK INITIATION AND PROPAGATION
2.1 Introduction to Elastic Theory
The theory of crack initiation and the linear elastic theory of crack propagation in
structural steel is well developed and has been extensively validated in the laboratory and the
field [3,4,5,6]. It is useful to review this theory to gain an insight into the significant
parameters of the problem.
Primary interest is in the propagation phase of the life of the structural element since
with the discovery of visible cracks the initiation phase is complete. That is, the total life, NT,
is the sum of the initiation life, N1, and the propagation life, Np. It can be shown that indeed
the initiation phase may dominate the total life of the structural element or detail where
cracking is present. But, for the present we seek to describe the remaining life of the
structural element or detail, i.e., the balance of the stable propagation phase. Alternatively
we can extend our analysis to include the effect of introducing hole to arrest the crack of other
modification proposed for repair. Lastly we may have to deal with the issue of re-initiation of
the crack in the repaired structure.
In thin plate elements typical of the problems studies in this program it is useful to
review and discuss first the growth of an edge crack in a moderately wide plate under uniform
stress, one of many standard cases that are documented in the literature (Mode I behavior, see
Fig. 2.5). The crack is assumed to be of length a and subjected to alternating cycles of stress
Ao which are, of course, intensified at the crack tip so that the crack growth is a function of
the variation of the stress intensity, AK. The stress intensity is also a function of a geometry
parameter k(a/b). These relationships are summarized in Fig. 2.1.
It is possible to trace the propagation of a crack through a relatively complex structural
details by making use of one or a combination of several simple propagation models. Thus
the following cases are useful for understanding the phenomena involved and can be
concatenated to give a useful picture of a crack propagation, in stages, first as a simple
through crack until it reaches, say, a flange plate where, second, it grows as a "penny shaped"
internal crack only finally to emerge again as, third, a through crack which threatens the
integrity of a main member.
6

(a) Geometry:I F
Uniform Stress: F = o . w . t
Paris law:da/dN = A(AK)
af whereAK = 1.12 Au a . k(a)
w 2b and k(f-) is the correctionb-factor shown in(b).
(b) Correction factor for width (Data, see Ref. 3):
0.5-
1 -"
I 2.
0'2 21 0.6 of 1 1.2
aa
bb
I Fig. 2.1 Propagation of a Simple Through Edge Crack
I 7

A common result of crack initiation from a welded connection or from a propagatingweb crack is the initiation of a "penny-shaped' crack in the edge of a flange plate as shown inFig. 2.2. This a crack advances as an elliptical crack front until it reached the bottom surfaceof the flange. At that stage it again becomes a through crack and again propagates accordingto the through crack formulation. The probable mechanism would be propagation into the
fillet weld and then down into the flange.
j- Simple through crack
~propagating in web
-.1,(D
[ 2
, crack growth
S2b
crack front geometryin the flange plate
Fig. 2.2 Illustration of Crack Front Geometry
In modelling the propagation of the crack illustrated in Fig. 2.2 it is usual for simplicity
to assume a constant proportion for the crack ( Ma = a constant ). The actual calculation forb
AK follows the same pattern as for Fig. 2.1, but with additional correction factors[3].
A common remedial measure for a crack is to drill a hole at the crack tip to (1) removethe discontinuity associated with the sharp crack tip and (2) to introduce a known and
8

moderated stress condition. Thus, it is useful to explore the stress intensity factors for a crack
which has re-initiated from a round hole -- a hole which has been drilled to arrest or slow
crack growth.
A F=w.t. Ao
w-2b
F
Fig. 2.3 Reinitiation of a Crack from a Hole
That is, as a through crack formulation as introduced previously corrected for the change in
effective stress intensity produced by the hole. The propagation from a hole can be studied
using the symmetrical geometry shown in Fig. 2.3. The formulation remains the same with a
correction factor fa), values of which are plotted in Fig. 2.4.J-r
The more general form of the expression for stress intensity is AK - Y Aio/, where
Y is a factor which represents the product of all needed correction factors[6,41. That is, Y will
correct for stress gradient, finite width, geometric shape factors, etc. The effect of this factor
on predicted life is reflected on page 12 with the modification of the factor C1 to include a
term (y)-m.

AK1 = AauI7rT a t- r3
r = radius of hole
a = crack length from one side of hole
and fl-fa) is a correction factor.r
(Data, see Ref. 3)
2
aft.-)
rTocracks
One crack
00 2 4 6 8 10
a
r
Fig. 2.4 Correction Factor for a Crack Propagating from a Hole
10

Iy
Mode I, Tensionx
Mode II, Shear x
Fig. 2.5 Three Basic Modes of Crack Surface Displacement
The fracture propagation information discussed has been in the simple crack openingmode wherein the crack is propagating in a tension field -- termed Mode I crack extension asdefined in Fig. 2.5. Two other modes are commonly noted: Mode II which is a shearingdisplacement and Mode III which is a displacement across the crack face out of the plane ofthe material. Instances exist where mixed modes of behavior are present.
11
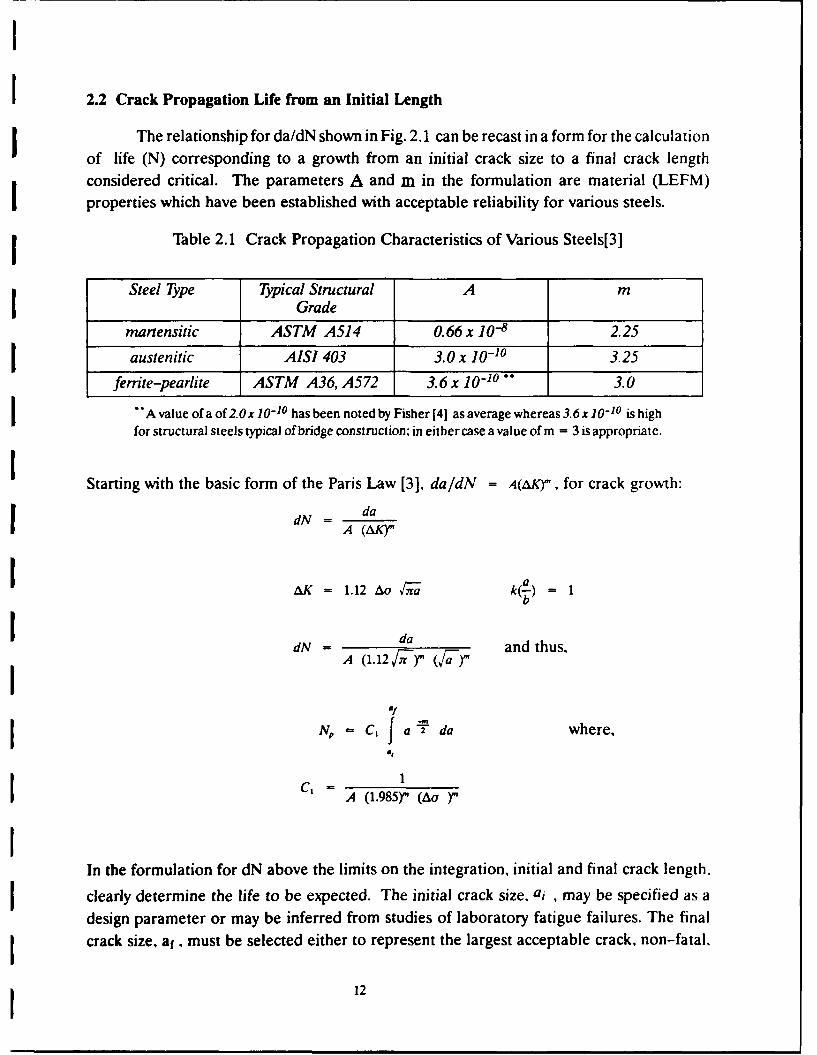
2.2 Crack Propagation Life from an Initial Length
The relationship for da/dN shown in Fig. 2.1 can be recast in a form for the calculation
of life (N) corresponding to a growth from an initial crack size to a final crack lengthconsidered critical. The parameters A and m in the formulation are material (LEFM)
properties which have been established with acceptable reliability for various steels.
Table 2.1 Crack Propagation Characteristics of Various Steels[31
Steel Type Typical Structural A mGrade
martensitic ASTM A514 0.66 x 10- 8 2.25
austenitic AISI 403 3. 0 x 10-10 3.25
ferrite-pearlite ASTM A36, A572 3.6 x 10-'° "" 3.0
I A value of a of 2.Ox 10-10 has been noted by Fisher [4] as average whereas 3.6x 10⁻¹⁰ is highfor structural steels typical of bridge construction; in either case a value of m = 3 is appropriate.
Starting with the basic form of the Paris Law [3], da/dN = A(AK", for crack growth:
dN = daA (AK"
d aAK = 1.12 Au Z u1 k(-) = I
dN = daand thus,
A (1. 12 F r and t
IINp = Cf a T da where,
a
= 1A (1.985)" (AO "
In the formulation for dN above the limits on the integration, initial and final crack length.
clearly determine the life to be expected. The initial crack size, ai , may be specified as a
design parameter or may be inferred from studies of laboratory fatigue failures. The final
crack size, af, must be selected either to represent the largest acceptable crack, non-fatal,
12

before repair is initiated, or it is limited by the critical crack length for the initiation of an
unstable running crack - brittle fracture.
2.3 Critical Crack Length and Brittle Fracture
From the above it is seen that the propagation life calculation may be carried out using a
reasonable assumption of initial crack length and a limit on final crack length. The length of
existing cracks (when visible) should be measured with reasonable accuracy on the bridge.
When cracks are not visible, the value of initial crack length ( ai ) may be inferred from test
data on similar structural details or assumed on a basis of a length related to the limits of
detection. The final crack length corresponding to the propagation life can be interpreted
several ways:
" As the maximum length acceptable before repair procedures are
deemed essential.
" The length at which the crack will become unstable and a brittle (fastrunning) crack will result.
The determination of the critical crack length must be related to the material
properties which govern fracture sensitivity. There are a number of parameters which are
significant including material type, temperature and crack length and geometry.
Fracture Toughness, CVN and K1 c
With the existence of a crack determined and the stress intensity at the crack tip
estimated, the assessment of unstable behavior requires a determination of the notch
toughness of the material at the damage site. Clearly material property determinations
including Charpy Tests, other fracture toughness tests such as a three point CTOD test would
be desirable, but might not be justified by a low criticality of the crack location or may involve
test program costs which exceed a simple repair of the damage. Where testing is not possible
the literature provides guidelines which are helpful.
Most toughness measures and the AASHTO specification are presented in terms of
limits on Charpy Test results -- CVN limits at specified temperatures. The correlationbetween CVN values and KI, values is important. One critical element in the determination
of KIc is loading rate. Rolfe and Barsom[3] present several correlations independent of
loading rate; numerical values for these are plotted in Fig. 2.6 following to illustrate the
scatter in these correlation equations. The most conservative relationship denoted "c", is
given as KI, = 7.616 (CVN)3/4 . This is derived from the relationship
K2c= 2 (CVN)3/2 . However this may be quite conservative and is not useful for low
E
13

strength steels. A more useful approach is to obtain CVN results and interpret them asdynamic values (Kid) values; the static values are obtained using a temperature shiftrelationship Tshift = 215 - 1.5 oy.. The reliable determination of CVN values for use in linearelastic fracture mechanics (LEFM) work is difficult for low strength steels such as A-36. Atthe material thickness encountered a large fraction of plastic action is usual and LEFM doesnot hold. Because of the elastic-plastic action the material undergoes ductile tearing ratherthan cleavage fracture.
K, - 9.35 (CVN) °63
210 (Roberts and Newton, Ref 19)
K = 15.5 (CVN)112
(Corten and Sailors, Ref 18)180 'P b= 7.616 (CVN)3'4
(Rolfe and Barsom)
150
120gic
(ksi in) 90
60
30
00 20 40 60 80 100 120 140
CVN (ft.-lbs)
Fig. 2.6 Various Correlations Between Ki, and CVN
All of the case studies presented herein are for floor systems fabricated of A-36 steel.All probably predate the use of toughness requirements for bridge steels, but A-36 in thethicknesses typical of the three case histories herein has been a fracture tolerant material.Data for KIc for A-36 steel has be shown to be difficult to evaluate for LEFM [9]: the datapresented in Fig. 2.7, reported by Barsom and Rolfe [31, provides a guide to approximate KIcvalues consistent with CVN limits. The temperature shift equation is illustrated on this plot.
14

50-
45- A
40- A A
35- sA
30030- OP7 uts
25 A Illsration of
K, temperature shift =
(kr) 20- 215 - 1.5 x 36 = 1611 F
15-
10-
5-
400 -350 -300 -250 -200 -150 -100 -50 0 50
Temperature, OF
Fig. 2.7 Kic Data for A-36 Steel Reported by Rolfe and Barsom
The data shown in Fig. 2.7 are for dynamic load, and are terminated at Kic values for whichthe parameter controlling plane-strain is exceeded, 13 = 0.4. This is the Irwin (LEFM)
plane-strain limit, fc = B(Klc/Oys)2 , where B is the specimen thickness.
To illustrate the application of a Ki, limit consider a hypothetical case of a locationwhere the cyclic stress induced by traffic is 10 ksi, i.e., Ao = 10 ksi, and the variation of stressintensity is that of an edge crack on a wide plate element:
15

I (a) AK = 1.12 Ao Vn-.
(b) Also let us consider that the temperature and material are consistent with aKIc value of 40 (ksin).
(c) Thus we can write the following relationship: 40 = 1.12 x 10 x i7rWC
(d) Solve the expression in (c) for the critical value of crack length, acrHence, acr is determined to be 4.1 in.
The determination of a valid level of fracture toughness as measured by K-value (in
(ksiin) ) is not simple for A-36 steel for use in limits in LEFM. In the case of material
thicknesses from 3/8 up to 3/4 in. seen in the present cases the brittle behavior limit on
thickness as given by 151c = (Kl/y,)2 is violated (IIc = 0.4 )and ductile tearing can
be expected to dominate the failure. That is, for a Kic value of 40 (ksi n) and a Oyp of 36 ksithen the value of B calculated is 3.1 in. This value has the meaning that for a material less thansay 3 inches in thickness ductile tearing can be expected and LEFM does not hold exactly.
For safety purposes, the lowest value of fracture toughness consistent with the lowestclimatic temperature for the bridge's location should be used for any design or repaircalculation of critical crack size.
The value of stress variation used above is high for at least one of our cases histories. Ifthe above calculation is repeated for only Ao = 2 ksi then the calculated value of acr isdetermined to be 102 in. Such a value is beyond the geometric validity of the model beingused or the dimensions of the structural cross sections of concern herein.
16

CHAPTER 3
CASE 1: THE SHADE-LOHMANN BRIDGE
I3.1 Description of Bridges
The 1-474 Shade-Lohmann Bridges are a pair of identical three span, cantileverthrough trusses, as sketched (not to scale) inFig. 3.1. These twin truss bridges,built in 1973,carry interstate highway, 1-474, over the Illinois River at Creve Coeur in Tazewell County,
Illinois. The bridges are designed for HS20-44 live load, and are symmetrical about thecenter with 300 ft. anchorspans and a 540 ft. main span; the main span contains a 300 ft. longsuspended center section. The panel point designation scheme used for identification ofcrack damage in the floorbeams is illustrated in the sketch of the bridge shown in Fig. 3.1. Thetwo spans are identical and each truss is symmetrical about the centerline. Panel points 14, 15and 16 are at the hinge section of the suspended center span; the vertical member at panel 15(U 15-LI5) is the span hanger. Member L14-L15 and U 15-U 16 have slotted connections at
points L15 and U15 to provide for longitudinal movement.The average daily truck traffic(ADTT) was 1450 in 1984.
centerline
u10 [__,uspended span ]
U1I4 U151116
- 1 2 3 4 5 6 7 8 9 -IO 11 12 13 L4L516 17 18 19
Lanchor span -- 300 ft. rmainspan = 540 ft.
Fig. 3.1 Sketch of the Shade-Lohmann Bridge
The trusses are 42 ft. deep in the parallel chord segments in the anchor and suspendedspans and increase in depth to 76 ft. over the interior piers. The composite concrete deck has a
17

Ithickness of 7 1/2 inches and a total width of 42.5 feet. The clear roadway width is 39 feet. Thedeck has been covered with a coal tar interlayer and 1 1/2 inch thick bituminous concretewearing surface. Both superstructures have welded plate girder approach spans.
3.2 Inspection and Detection
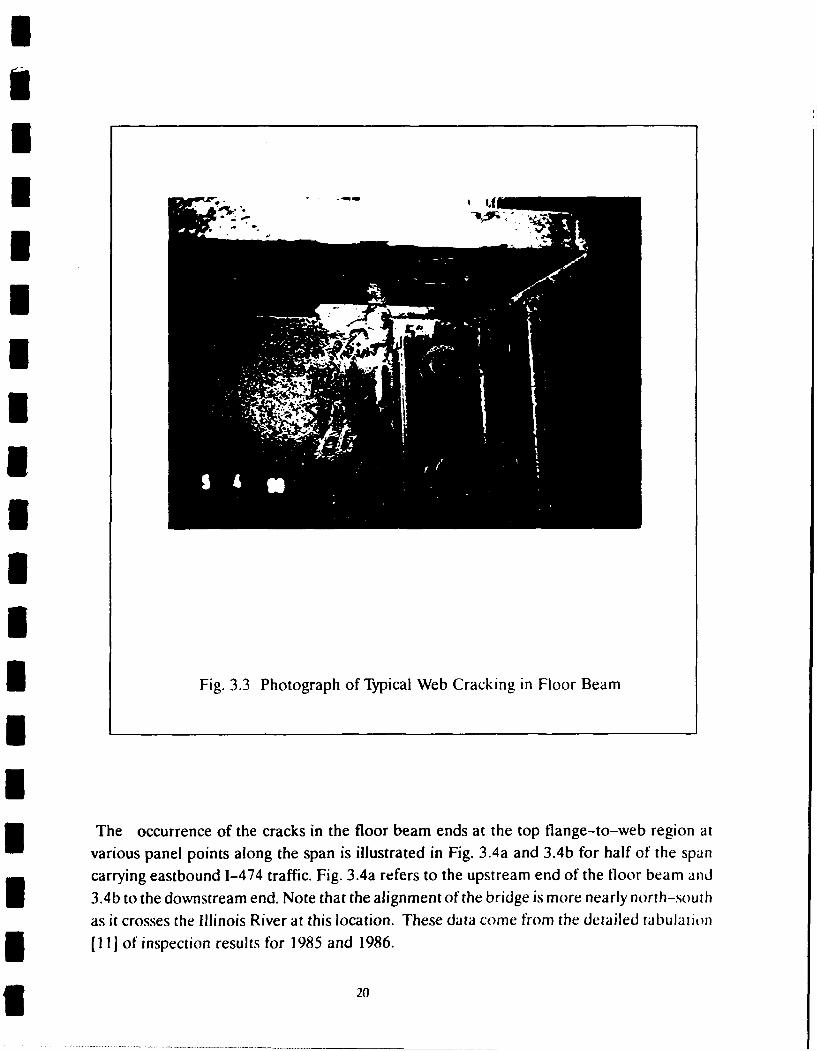
IInspections (1986-1989) of the steel girder floor beams on the Shade-LohmannBridges revealed the existence of cracks [11] which are not attributable to expected causes.These cracks occur in the web to flange weld at the ends of the floor beam girders and arepropagating horizontally inward (i.e. towards the center-line of the bridge). A typical crackconfiguration is illustrated in a sketch of the floor beam end with the crack location is shownin Fig. 3.2 and a typical crack is also shown in the photograph in Fig. 3.3.
The cracks typified by the sketch in Fig. 3.2 are located just slightly below the junction of theweb and flange of the floor beam at the fillet weld toe. The inspection report [11, p. 13] notesthe following:
"The predominant and most serious defect occurring in the truss spans iscracking in the ends of the floorbeams. The cracks are in the topflange-to-web fillet weld toe at both ends of most of the floor beams andusually on both sides of the web. Holes were drilled in the webs and throughwelds at or near the tip of the cracks to arrest crack growth. A few of the cracks,though, have propagated past the drill holes and still others past a second holedrilled because of previous crack growth. New cracks have also beendiscovered in the floorbeam ends at locations where none were first reported.A few locations were also found where cracks have initiated in the webs wheresmall tack welds were used to secure the clip angles of the floorbeam..."
18

crack length (Figs. 3.2 and 3.3)
S 0
0 Crack near Mco
S S 0
*0 Floor beam00
Bottomn 0
I Fig. 3.2 Sketch of Typical Floorbeamn Crack Location
19
I7
I
Fig. 3.3 Photograph of Typical Web Cracking in Floor Beam
The occurrence of the cracks in the floor beam ends at the top flange-to-web region at
various panel points along the span is illustrated in Fig. 3.4a and 3.4b for half of the span
carrying eastbound 1-474 traffic. Fig. 3.4a refers to the upstream end of the floor beam and
3.4b to the downstream end. Note that the alignment of the bridge is more nearly north-souit)
as it crosses the Illinois River at this location. These data come from the detailed tabulatio~n
[I1I] of inspection results for 1985 and 1986.
20

10
8 f West Face of FloorbeamI8[I East Face of Floorbeam
6
Cracklength(inches) 4
1 2
W-01 2 3 4 5 6 7 8 9 10 11 12 13 14 15 16 17 18 19
Panel point, upstream side, East Bound Bridge(Carrying eastbound traffic, the bridge alignment is more nearly norih-south.)
Fig. 3.4a Crack Measurements at Floorbeam Ends, Various Panel Points
21

6
5 West Face of Floorbeam4 [ East Face of Floorbeam
Cracklengih(inches) 2
* 1i
0 W-01 2 3 4 5 6 7 8 9 10 11 12 13 14 15 16 17 18 19Panel point, downstream side, East Bound Bridge
(Canrying eastbound traffic, the bidge alignment is more nealy north-south.)
Fig. 3.4b Crack Measurements at Floorbeam Ends, Various Panel Points
The most common crack lengths are on the order of 2 to 3in., but with instances of locationswhere cracks of 6 to 8 in. are present.
The above has emphasized sites where cracking occurs. In reviewing all data, the twotruss spans have a total of 156 floorbeam end locations; if two faces of the web surface areconsidered, 312 possible surface crack locations exist to inspect. Of the 312 locations, 71 onthe east bound and 57 on the west bound bridges, respectively, were found free of visiblecracks or 46 % and 37 %, respectively, free of cracking. In Fig. 3.5a and 3.5b additionalmeasurements are shown for both ends of the floorbeams located at panel points near thesuspended span ends in both truss, i.e. carrying west and east bound traffic, respectively.
22

8
7
6
54Crack Nlength 3(inches) I\ N
21 1"
0
W-14 W-15 W-16 E-14 E-15 E-16Selected Panel Points Near Suspended Span
mm west face * east face west face " east faceupstream end upstream end 0 downstream endm downstream end
Fig. 3.5a Crack Measurements at Floorbeam Ends Near Suspended Span HangersWest Bound Bridge
23

II
*I 10
!8
6
Cracklength 4(inches) k
2
0W- 14 W-15 W-16 E-14 E-15 E-16I0
Selected Panel Points Near Suspended Span
*[fl west face east face e west face m ] east face~ upstream end - upstream end downstream end downstream end
Fig. 3.5b Crack Measurements at Floorbeam Ends Near Suspended Span HangersEast Bound Bridge
II
Since the crack locations described above are near the top flange and adjacent to a clipangle connection on the web, it would be usual to assume some bending moment at this point.The degree of restraint offered by the web-only clip-angle connection is less than a full rigid
connection assumed in three dimensional frame behavior.
I The crack location is assumed in design to be under nominally low or zero calculatedbending stress (a pinned end), but the stresses measured in the field are significant. Thestresses must be attributable to structural behavior outside the realm of the designassumptions. An attempt to arrest the crack growth has been made by drilling holes at the
crack tips of some of the longer cracks. In a few of these cracks with drilled holes there has
I been re-initiation of the crack out of the drilled hole; see Fig. 3.3.
24

It appears that the cracks have a tendency to turn downward and grow into the webunless arrested. Growth downward in the web will serve to reduce shear capacity at thislocation and is of concern. It should be emphasized that this crack growth is in a region of lowcomputed live-load stress.
3.3 Finite Element Model
These truss bridges taken with their deck systems represent a potential for a very large,complex analytical model. The floor beam distress was deemed not sensitive to the globalmodelling of the entire bridge deck slab, although it might be influential in the grossstructural action of the entire bridge truss system. The influence of the deck could bereconsidered the the region adjacent to the cracked floor beam ends.
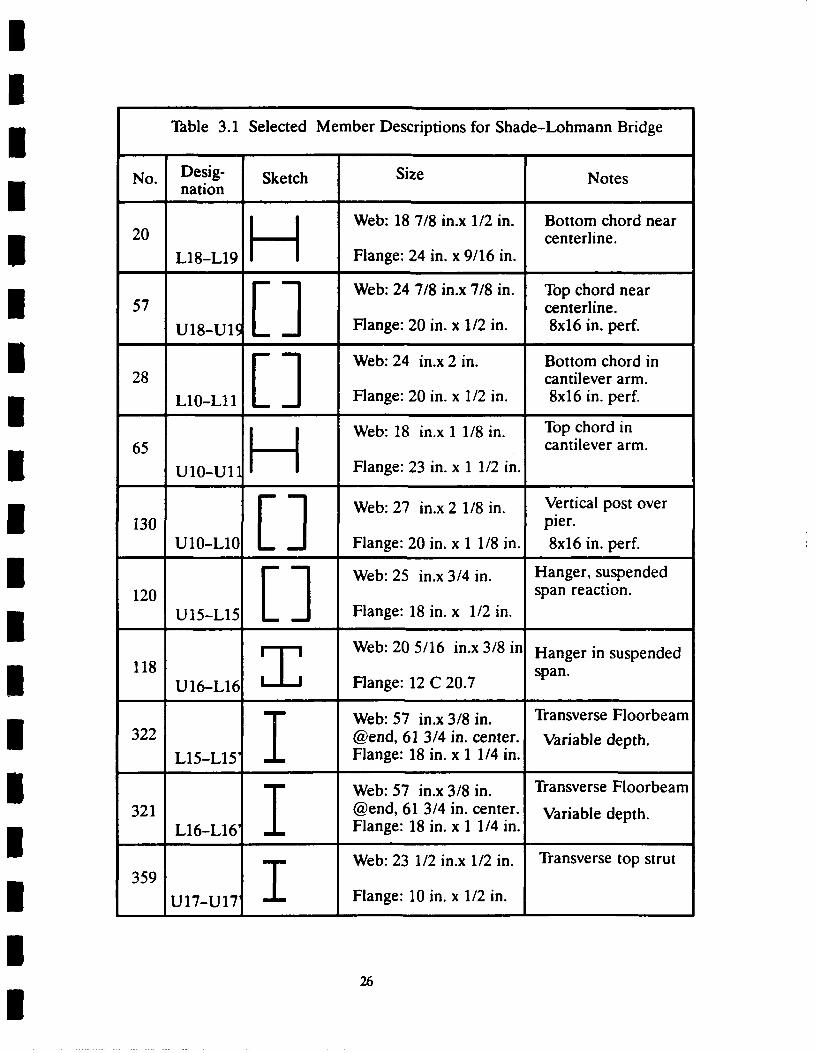
The entire truss bridge was modeled using the FINITE[8], a general structural andfinite element analysis program. In Table 3.1 typical member types are shown; these areselected from parts of the structure experiencing more extensive floor beam cracking. Thebridge was modeled as both a three-dimensional pin-connected space-truss and aspace-frame for comparison of the results. These models comprised 374 members and 152nodes (joints). For gross structural behavior of the main members the models acted very muchthe same. The axial loads were identical and the deflections were also the same. Thepin-connected truss, of course, did not yield results for so-called secondary moments at the
joints.
* The three-dimensional space-frame model is essential to accurately model the floor
beam connections so as to produce the primary and secondary moments in the floor beamends at the location of the cracks. The floor beam connection is made to the web of the plate
girder floor beam using dual riveted angles with 13 rivets along the angle. In addition, there isa horizontal bracing gusset plate which attaches to the floor beam bottom flange. This detail
* inhibits the rotation of the end of the floor beams but was not designed as a true momentresistant connection. For analysis, the connections were assumed to behave with fullfixed-end connectivity and thus moments are present at the ends of the members. It should be
noted that in actuality the top flanges of the floor beams are not connected to the truss andare ineffective in carrying large stresses due to moment at the ends of the floor beam.
The bridge was loaded with the dead load of the steel and nine inch thick concrete
deck, and the live load of an HS-20 truck on the floor beams of interest. That is, the effect of a
32 kip axle at standard wheel spacing was shifted transversely across the floor beam toproduce an influence line for maximum nominal stress at the weld location. This influenceline is shown in Fig. 3.6.
25
I
Thble 3.1 Selected Member Descriptions for Shade-Lohmann Bridge
No. Desig- Sketch Size Notes*nationWeb: 18 7/8 in.x 1/2 in. Bottom chord near
20 L18-L19 Flange: 24 in. x 9/16 in. centerline.
Web: 24 7/8 in.x 7/8 in. Top chord near57 centerline.
U18-UlI Flange: 20 in. x 1/2 in. 8x16 in. perf.] "Web: 24 in.x 2 in. Bottom chord in28 cantilever arm.
L10-LlI Flange: 20 in. x 1/2 in. 8x16 in. perf.
Web: 18 in.x 1 1/8 in. Top chord in65 U10-U1 Flange: 23 in. x 1 1/2 in. cantilever arm.
Web: 27 in.x 2 1/8 in. Vertical post over130 pier.
UIO-LI Flange: 20 in. x 1 1/8 in. 8x16 in. perf.] " Web: 25 in.x 3/4 in. Hanger, suspended120 span reaction.
U15-LI5 Flange: 18 in. x 1/2 in.
118 Web: 20 5/16 in.x 3/8 in Hanger in suspendedU16-L16 . Flange: 12 C 20.7 span.
Web: 57 in.x 3/8 in. Transverse Floorbeam322 1 @end, 61 3/4 in. center. Variable depth.
L15-L15' Flange: 18 in. x 1 1/4 in.
T Web: 57 in.x 3/8 in. Transverse Floorbeam321 @end, 61 3/4 in. center. Variable depth.
L16-L16' Flange: 18 in. x 1 1/4 in.
Web: 23 1/2 in.x 1/2 in. Transverse top strut3593 U17-U171 Flange: 10 in. x 1/2 in.
26

I
* 1.4-
1.2-I Nomi-
nal 1Stressat 0.8-Weld(ksi) 0.6-
0.4-
0.2
0-0 50 100 150 200 250 300 350 400 450 500
Transverse Position of vehicle, in.
Fig. 3.6 Effect of Transverse Vehicle Position on Stressat End of Floorbeam
The flexural stress range at the crack locations was determined to be about 1.2 ksi maximum,and does not seem to be the cause of the cracking distress. The most important factor being
that simple flexural stress of this prediction are parallel rather than perpendicular to the pathof travel of the crack. The stress estimate assumes fully rigid connections between the
floorbeam and the truss gusset perpendicular to the plane of the truss -- where in fact only
shear clip angles on the web of the floorbeam are present.
Neglecting the discrepancy between the direction of the stress and the direction of
propagation of the crack, this stress range of 1.2 ksi can be used to perform a fatigue life
calculation using a simple edge crack path model. It is assumed that there was a 0.1 inch edge
crack present at the time of fabrication and that a final crack length of 3 in. is representative.Thus from Art. 2.2:
27

I3-. -. _ _ _ _ _ _ _
N, - C, f a 2 da ,m = 3, A= Ox 10- 1 A (1.985) 3 (1.2ksi)3
0.1
N, - C, a 2da - 3.6995 108 (- 2)X 1 = 9.6 x 1 cycles
0.1
The large number of cycles, 9.6 x 10 8, required for propagation of these cracks at a Ao of
only 1.2 ksi, shows that this level of stress does not account for the damage. Other driving
forces must be present.
Some conclusions are evident from the above:
* Floor beams with the worst damage are all adjacent to expansion jointsin the bridge deck. This is consistent with the hypothesis that the
horizontal cracks at the flange to web weld are due to longitudinal
movement of the floor system relative to the bottom chord panel pointsof the trusses.
* The beams that are near the expansion joints in the pavement have theleast amount of restraint against this relative movement and are thus
experiencing the greater distress.I * This relative longitudinal movement causes out-of-plane movement of
the floor beam web above the connecting clip angles at the web end andinduces high stresses adjacent to the weld at the web to flange junction.
The damage discussed above was seen in the case of the floor system of the Prairie Du
Chien Tied Arch Bridge studied by Fisher [4] in the which he attributed fatigue damage to
longitudinal deck forces acting on a web and flange model.
In addition to the studies just described, the behavior of the bridge model under the
action of vertical vehicle loads was explored for various combinations of member release
conditions which simulated the supports for the suspended span. The releases include
moment release representing the pinned hanger members (such as U 15-115) and the slotted
horizontal members (L14-L15 or U15-U 16) which permit expansion of the suspended span.
In immobilizing these release conditions, to simulate failure of the slots or pins to act, no
significant adverse force or distortion conditions were seen at the points of serious cracking.
3.4 Repair and Fracture Control
The action needed to provide remediation for this form of damage is better
understood in the context of the sensitivity of the flange and web to longitudinal loads
transmitted at the top flange level, for example as sketched in Fig. 3.7. All of the force must be
28

transmitted in flexure across the segment of web between the clip angles and the top flange --
a distance g on the sketch. For simplicity this web segment is treated as a fixed-fixed beam
segment. To illustrate the sensitivity of the detail, a segment of web 12 in. long is considered.
If g = 4 in. and tw = 3/8 in. then the section modulus is I - -Lb d3 = 0.05273in. 4 , and12
1- b d 2 - 0.28125in?. If the longitudinal force is taken to be F, 1 kip, then the
calculated stress, Ob, is 7.1 ksi and the deflection, 8, is only 0.0035 in. In contrast to the
analysis on the previous page, if one modifies the calculation of Np for the a stress range of1
7.1 ksi, i.e. C, = A (1.985)Y (7.ksi )3 , then Np = 4.2 x 10⁶ cycles; if the stress range is as
much as 14.2 ksi then only 580,000 cycles are required to propagate a 3 in. long crack. Thus if
only a modest fraction of the vehicle longitudinal loads are transmitted in this manner a
substantial stress range will be induced at the web-to-flange junction. The relatively small
movement associated with a significant stress suggests that this phenomena may not be
immediately evident during inspection without measurements in t field.
motion due to- -longitudinal
forces
Web f bIIL 1 *I~***~9 tress, ab_ _ _ . .. g4 ,... .. .
' 0 t ---"0 [. .. . {tw
0t 0
0 0 .,. Longitudinal axis0 ! of bridge
Fig. 3.7 Postulated Distortion Due To Longitudinal Forces
Thus the remedial repair detail for this mechanism of damage must provide a direct
load path from the deck and floor beams to the truss at each panel point. A possible repair
solution is shown in Fig. 3.8 and is modelled after that described by Fisher in the case cited
29

above [4]. A connection to prevent the relative longitudinal movement of the floor systemmust include gussets in the horizontal plane to carry longitudinal loads directly from the floorsystem to the panel points of the truss. A similar longitudinal load capacity would probablyexist if full moment connections were provided at the ends of the floor beams. However, themoment connection between the floor beam and a truss vertical may induce fatigue problemsin the truss vertical (hanger) due to secondary bending.
10 .. ..........h " o o h rI Longitudinal load
Gusset plate
T0
Foremweb " ' 'Fabricated fromFloorbeam tee
bolted to gussetand top flange
Clip angles on web offloor beam.
Gusset plate (truss) P.,ongtudina
Fig. 3.8 A Possible Repair Detail After Fisher [4]
IIAlso, a detail where the slab is separated from the flange at the edge of the girder for
some distance, see Fig. 3.9, was included on the drawings of the Shade-Lohmann Bridge,but it was not built as shown, presumably to permit the use of simpler form-work for the fullwidth of the deck. The region of separation would have the possible effect of mitigating thestress concentration at the end of the floor beam to web detail and weld. It might also serve todirect more longitudinal force into the floor stringer system and to reduce the relativestiffness of the structural element at the top flange level carrying force into the clip angles. It is
30

In
nI0 Region o 1separation.
L Fig. 3.9 Shade-Lohmann Slab-flange Separation Detail
I not clear that the separation detail would prevent the development of the cracking seen. It isnot proposed as a remedial detail.
III
II
I3

CHAPTER 4
CASE 2: THE 1-74 BRIDGE OVER VERMILION RIVER AT DANVILLE
4.1 Field Investigation
The second case history bridge is located in Vermilion County on 1-74 over the
Vermilion River at Danville. The bridge carries eastbound traffic and was constructed in
1963. It is a 5-span continuous two-girder system with a 60 degree skew. The two outer spans
are 100 feet long and the three interior spans are each 126 feet long. The floor beams are
spaced at 11.5 foot intervals and the main girders are connected every 23 feet by a
cross-frame assembly in the vertical plane and also by lower lateral cross-bracing. A typical
cross-frame assembly is shown in Fig. 4.1. The trussed cross frame is not fully symmetrical,
that is, it lacks an upper chord member. The overhanging length of the floor beams is variable
but the 8 ft. dimension is typical.
8ft 20ft .L 8ft
I Deck
24 WF 94 or 100 or 110 Floor beams
See Fig. 4.2,-, 92 x 9/16 in. web
21 x 11/8 in. flangeI @ midspan.
Fig. 4.1 Cross Section of Vermillion River Bridge on 1-74 at Danville
As reported by the Illinois Department of Transportation, routine inspections have
discovered cracks near the copes of some of the plates connecting the cross-framing to the
main girders. Investigations have indicated possible poor weld details in these areas. A
sketch of the detail found to be cracked is shown in Fig. 4.2. The combination of the severe
32

II
cope and the attachment to a gusset on the top flange of the girder represents a very
3 un-favorable geometry.
3Flange,,i let weld Horizontal gusset plate
.-. ,Xrpe
3 3/8 in. gusset ,
3 Cross frame gusset 6x4x3/8 in. angle
3\( crack\ I
mU \rego
3 Fig. 4.2 Upper Flange Connection Detail for Cross Frame
I The damage in this case history is clearly the result of fatigue at an unfavorable
connection detail. The stress concentration at the cope and fillet weld is simply unacceptable
as indicated by the cracking observed. The retrofit, given the limited effectiveness of the
cross frames in the main structural action of the bridge, was designed to reduce the axial3 forces in the cross frame diagonals. The option of removing the cross frames is not acceptable
since their presence does contribute to the stability of the structural system.
3 This case study includes:
" Study of the influence of vehicle placement on cross frame response3 using results from a finite element model of the bridge loaded with a 32kip axle.
" Analysis of retrofit scheme proposed by I.D.O.T. using neoprene strain-
relief devices (Source: C. Hahin, Bureau of Materials and PhysicalResearch) in the cross-bracing to reduce the stress in the connection
* brackets.
3 33

U3 The determination of the maximum axial force in the cross-frame
members both before and after the application in the analytical modelof the retrofit proposed by the I.D.O.T
UL N N \ ." N,79Add IDOTI Istrain relief
Reinfforce existing gusset3 and modify geometry
IL
Fig. 4.3 Retrofit Scheme to Reduce Diagonal Forces
I 4.2 Structural Analysis of Bridge
The 1-74 bridge was modeled as a 60 degree skew continuous space frame comprisedof three spans of the five, using the finite element modeling program, FINITE. The spans are126.5 ft each with floor beams spaced 11.5 ft intervals and cross-frame assemblies at 23 ft3 intervals. Figure 4.4 shows a plan view of the model. The effects of the deck, parapet, lowerlateral cross-bracing, and stringers were ignored. It was assumed that the behavior of thecross frame in a given span would be affected mainly by the adjacent spans -- hence, 3-spanmodel results would give a sufficient representation of structural action relative to crossframe behavior.
III
34I

U support point
controlling cross frame
I|1
3I [email protected] ft= 126.5 ft.
Typical ofThree Spans
Fig. 4.4 Plan View of Three-Span Grid Model of Bridge
35

A 32 kip axle was moved longitudinally down the bridge to determine the location ofthe controlling cross-frame and axle position. The maximum axial force occurred in the firstcross-frame from the bridge end when the axle was directly above the cross-frame. Next, theaxle was stepped transversely across the corresponding floor beam to determine themaximum axial force in the controlling cross-frame. The resulting maximum axial force was14.2 kips. Aplot of the influence of the transverse location of the axle on the axial force in thecross-bracing is shown in Fig. 4.5.
16
14-
12
10
8-
* 6-
* 4-
2-
* 0-
-24 5 6 7 8 9 10 11 12 13 14 15
Distance from Cantilever End to Center of Axle, ft.
Fig. 4.5 Axial Force in Cross-Frame Diagonal Due to 32 Kip Axle
4.3 Analysis of Retrofit
In a preliminary report by IDOT, a retrofit consisting of neoprene strain- relief devicesinstalled in the cross-bracing was suggested to reduce the stress in the connection brackets.To investigate the results of this retrofit a 1-span 60 degree skew space frame, similar to the3-span model, was loaded with a 32 kip axle in the position shown below in Figure 4.6.
The comparative effect of the retrofit was tested using an equivalent single spanmodel; it was found that the additional complexity of the multispan model was not needed forthis comparison. A 5.25" x 2.75" x 0.75" neoprene member element with a modulus of
36
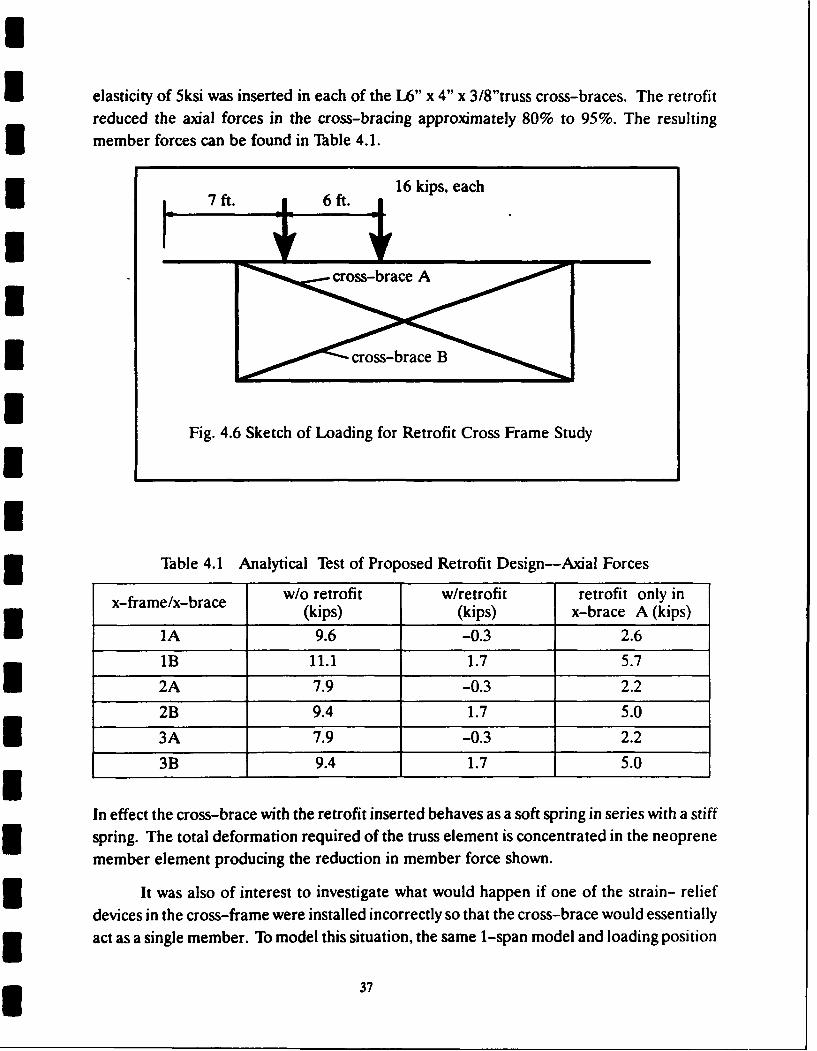
elasticity of 5ksi was inserted in each of the L6" x 4" x 3/8"truss cross-braces. The retrofitreduced the axial forces in the cross-bracing approximately 80% to 95%. The resultingmember forces can be found in Table 4.1.
1 f16 kips, each
* . cross-brace B
Fig. 4.6 Sketch of Loading for Retrofit Cross Frame Study
Table 4.1 Analytical Test of Proposed Retrofit Design-Axial Forces
x-frame/x-brace w/o retrofit w/retrofit retrofit only in(kips) (kips) x-brace A (kips)
1A 9.6 -0.3 2.6
1B 11.1 1.7 5.7
2A 7.9 -0.3 2.2
2B 9.4 1.7 5.0
3A 7.9 -0.3 2.2
3B 9.4 1.7 5.0
In effect the cross-brace with the retrofit inserted behaves as a soft spring in series with a stiffspring. The total deformation required of the truss element is concentrated in the neoprenemember element producing the reduction in member force shown.
3 It was also of interest to investigate what would happen if one of the strain- relief
devices in the cross-frame were installed incorrectly so that the cross-brace would essentiallyact as a single member. To model this situation, the same 1-span model and loading position
37

U3/4 in. ASTM A325 bolts,% , 4 total
[To be spliced into existing cross- N Ineoprene rubber strain relief
frame diagonals.] "[strain absorbers 112 to 314 in.thick as needed
Fig. 4.7 Section Through IDOT Strain Relief Device(Source: C. Hahin, Bureau of Materials and Physical Research)
were used, but the neoprene members were removed from cross-brace B in each of thecross-frames. The results are shown in the fourth column of Table 4.1; even with this partial
reduction in the stiffness of the cross frame the axial forces are substantially reduced (columntwo versus column four in Table 4. 1.).
38

CHAPTER 5
CASE 3: MAHOMET BRIDGE ON 1-74 OVER THE SANGAMON RIVER
5.1 Field Investigation
The third case history is concerned with the pair of bridges on 1-74 over the
Sangamon River, east of Mahomet in Champaign County. The east-bound and west-bound
bridges were built in 1966. Each bridge is a 3-span continuous two-girder system with side
spans of 105.9 feet and a center span of 135 feet. The top flange of the floor beams are coped
at the connections to the longitudinal girders to provide clearance for the top flange of the
girders. The structural scheme is sketched in Fig. 5.1. Note that the main girders have 17 x 1.5
in. flanges with 45 x 5/8 in. webs.
l_1_kips 16 kips -
I ks 16 ktransverse
2.5t 6ft. : load:5 position
II5.5 ft. 20. ft. 5.5 ft.
Deck
Cope area W 24 x 68
, " See Fig. 5.2
Fig. 5.1 Bridge over the Sangamon River on 1-74 at Mahomet
According to a report by the Illinois Department of Transportation [5], an inspectionin December of 1984 revealed cracks at the copes of some of the floor beams, especially at
floor beams located 22 to 33 feet from the west side abutment of the east-bound bridge.
39
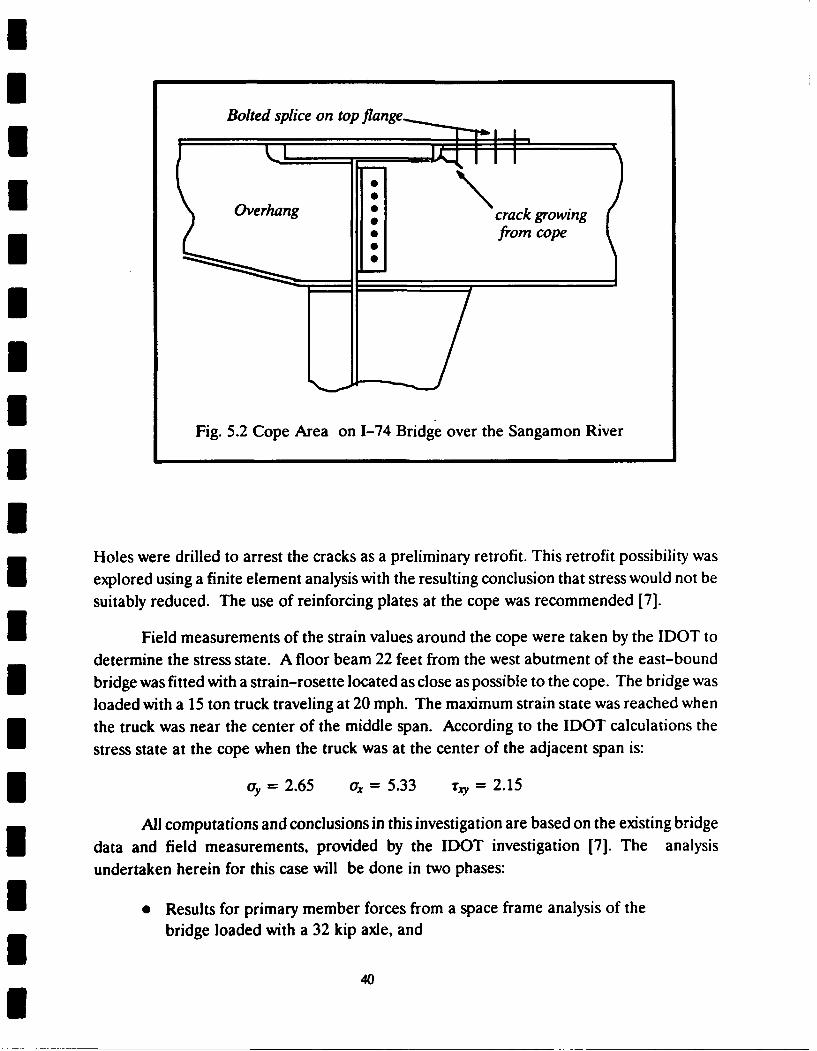
Bolted splice on top flange
Overhang,"' crack growingfrmcpU ____/
Fig. 5.2 Cope Area on 1-74 Bridge over the Sangamon River
Holes were drilled to arrest the cracks as a preliminary retrofit. This retrofit possibility wasexplored using a finite element analysis with the resulting conclusion that stress would not besuitably reduced. The use of reinforcing plates at the cope was recommended [7].
Field measurements of the strain values around the cope were taken by the IDOT todetermine the stress state. A floor beam 22 feet from the west abutment of the east-boundbridge was fitted with a strain-rosette located as close as possible to the cope. The bridge was
loaded with a 15 ton truck traveling at 20 mph. The maximum strain state was reached whenthe truck was near the center of the middle span. According to the IDOT calculations the
stress state at the cope when the truck was at the center of the adjacent span is:
ay = 2.65 a, = 5.33 ry = 2.15
All computations and conclusions in this investigation are based on the existing bridge
data and field measurements, provided by the IDOT investigation [7]. The analysisundertaken herein for this case will be done in two phases:
H Results for primary member forces from a space frame analysis of thebridge loaded with a 32 kip axle, and
40U

n
1 Results from a finite-element analysis of a section in the region of thecope for a typical floor beam.
The purpose of this step in the study is to try to develop representative models of the entire
bridge and of a typical floor beam to determine if an identifiable load effect produced by3 vehicle passages caused the cracks to develop.
5.2 Structural Analysis of Bridge
The 1-74 bridge was modeled as a 3-span continuous space frame using the
finite-element modeling program FINITE. The model has exterior spans of 110 feet long and
an interior span of 132 feet long. To simplify the model, the longitudinal girders are assumedto have an average depth of 48 inches; however, the girders in the actual bridge have a
variable cross-section. The W24 x 68 floor beams are spaced at 11 foot intervals. The
cantilevered sections of the floor beams actually have a linearly varying cross-section, but foranalysis purposes they were modeled as W24 x 68 sections. The 8.5 inch slab was modeled
using 'RFSHEL' elements [81 with a thickness of 8.5 inches, a Poisson's ratio of 0.15, and aYoung's modulus of 3000 ksi. The 'RFSHEL elements are rectangular and provide for bothin plane membrane forces and plate bending. Figure 5.1 shows a typical cross-section
through the bridge.
A 32 kip axle was stepped transversely across a floor beam located 22 feet from the end
support in an outer span until a maximum effect was obtained. The maximum moment occurswhen the center of the axle is 5.5 feet from the end of the cantilevered section of the floor
beam. The resulting shear and moment at the connection are:
M = 280 kip-in
V = 1.61 kips
Next, the axle was stepped transversely across the middle of the center span. The
maximum shear in the floor beam 22 feet from the end support, occurs when the axle is 5.5
feet from the end of the cantilevered section of the floor beam. The axle position is shown
also in Fig. 5.1. The moment in the floor beam is close to zero for all transverse axle positions
and the shear is:
V = 1.52 kips
The maximum stresses in the space frame model are generated when the axle is
directly over the floor beam in question. It is unclear why the maximum stresses measured in
the field in the subject floor beam resulted when the truck is near the center of the middlespan. The high stresses in the floor beams may be due to differential upward deflection of the
longitudinal girders when the bridge is loaded in the center span. Because the bridge has no
41

skew, it is unknown why the uplift forces would produce a significant differential deflection.This condition did not occur in the analytical model. Since the measured stresses from thefield cannot be reproduced in a general space frame model of the full bridge structure, theexact magnitudes of the shear and moments in the floor beam are not determined. However,it is still useful to make a finite-element analysis of the floor beam cope using specifiedinputs shear and moment which are retained as parameters of the problem.
5.3 Finite-Element Analysis of the Floor Beam Cope
U A finite-element mesh consisting of 8-node, quadratic, isoparametric elements('Q2DISOP'[81), was used to model a 60 inch long end section of a typical floor beam.
1 j 4 Nodal forces applied to represent bolt loads =
IV
l lyFig. 5.3 Finite-Element Model of the Floor Beam Cope
The finite-element mesh used to model the floor beam is shown in Figs. 5.3 and 5.4. The
beam is fixed on the end which connects to the longitudinal girder and free at the other end.To determine the shear and moment relationship at the free end, the interior floor beam wasmodelled as a fixed-fixed beam with a vertical displacement release on one end. Displacingthe released end causes a constant shear and linear moment in the beam which has thefollowing relationship.
M = V(L/2 - x)
Where: L = span length (240 inches)
x = position along beam (60 inches)
42
I

These equations yield the following for the applied moment and shear at the free end of theU partial floor beam model: M = 60V (kip-in).
The top flange of each cantilevered floor beam in the existing structure extends across
the top flange of the longitudinal girders and is connected to the top flange of the coped floorbeams with five bolts. To model this condition nodal forces are applied to the top flange ofthe coped floor beam, with five nodal forces along the top of the flange and five along thecorresponding nodes on the bottom.
3Wx
node 560
2.5 in.Y 1 in. 1R
Fig. 5.4 Detail of Element Model Around Cope
Because the magnitudes of the shear, moment, and nodal bolt loads are unknown, unitloads are applied to the floor beam to explore the sensitivity of the problem. The shear andmoment forces are represented as a separate loading set from the nodal bolt loads. Thestresses at a particular node for each loading condition are multiplied by two separatemagnitude factors and superimposed to obtain the stresses at that node. The closest stress
43

state to the measurements obtained in the field occurs at node 560 which is at the edge of thecope. The corresponding shear, moment, and nodal bolt forces are:
V = 1.60 kips
M = 96 kip-in
P = 0.2 kip (shear force in one bolt)
Figure 5.4 shows a detail of the finite element mesh around the cope. The stresses at node560 from the finite-element model and the stresses measured in the field are shown in Table5.1 below. The variability of O, a Y, and Ty with position around the cope as defines by theangle, E, are shown in Fig. 5.5.
Table 5.1 Comparison of Computed and Measured Stresses(Stresses Computed at Node 560)
Ox (ksi) Gy (ksi) T y (ksi)
Finite-Element 2.80 5.21 -3.26Model
Field 2.65 5.33 -2.15Measurements
44

12-
01, maximum principal stress
UyOxx
T", principal shear stress",
Stress, ksi"A,,..,
2- X..4-e.o
-1 02, minimum principal stress
- 0 10 20 30 40 50 60 70 80 90
E, angle, degrees
Fig. 5.5 FEM Study of Stresses Adjacent to Beam Cope
The results from the analysis are reasonably good considering that there are an infinitenumber of possible loading conditions and that a small two-dimensional mesh is being usedto model a complex three-dimensional structure. The applied shear in the finite-elementmodel (V = 1.60 kips) is very close to the resulting shear in the floor beam when the space
45

I
frame model is loaded at the center of the middle span (V = 1.52 kips) or at the floor beam(V = 1.61 kips). However, the resulting applied moment in the finite-element model is notclose to either of the moments for the loading cases in the space frame analysis.
The issues concerning the prediction of stress conditions at the cope raised in this case
need additional field testing with more extensive instrumentation to be resolved. This shouldbe accomplished to guide the development of a more complete analytical model for the
bridge which would include both frame and deck elements. The results of the present studyalso indicate some care is needed in assessing the behavior of and modelling of the bolted
splice plate on the top flange of the floor beam.
Repairs and modifications of cope details can involve two or more levels of action.First, the simplest level of action is to drill a hole at the end of the crack, removing al' visibleevidence of the crack tip. This action must be combined with continued regular inspection of
the repairs to detect possible re-initiation of the crack. The second level of action involvesremoving the crack tip with a drilled hole and adding gusset plates on either side of the coped
region of the web, fastened with high-strength bolts. The gusset plates will serve to reduce
the stresses in the region of the crack to halt further crack propagation.
4
I4

ICHAPTER 6
U SUMMARY AND CONCLUSIONS
I6.1 Summary and Conclusions
3 Floor system cracking problems, the focus of the three case studies of this research
study, occur in both structures of recent construction and in older bridges which have been in
service for many years. The issues associated with the existence of cracks in floor systems are a
subset of more general problems associated with the scheduling of maintenance,
rehabilitation and the planning for the replacement of bridge structures. The present study
has risen out of three specific cases of floor system cracks which were not immediately
detrimental to the structural integrity of the floor system but which required inspection,
3 monitoring, detailed investigation and eventual remedial action. At the outset these cases of
cracking did not seem related to a usual design basis load effects.
The cases forming the central focus of this report are: (1)The 1-474 Shade-LohmannBridge over the Illinois River south of Peoria., (2) the 1-74 Bridge over the Vermillion River
at Danville, and (3) The 1-74 Bridge over the Sangamon near Mahomet in Champaign
County.
3 These case histories produced evidence of three issues related to cracking:
" Case 1: Cracking due to forces not associated with vertical vehicleSloading. That is, evidence is strong that cracking arises from
longitudinal load transmitted through the out of plane flexure of the
floor beam web in the segment between the connection clip angles andthe flange at either end. Calculations show that a very modest inducedlongitudinal deformations are associated with substantial local stresses
*at the web to flange junction which is the site of the cracking.
" Case 2: Fatigue failure of a detail with adverse geometry but with forcesinduced by vehicle loads which clearly account for the damage. A repair
detail to reduce member forces has been suggested and is evaluated.
* Case 3: The development of a fatigue crack at a cope detail associated
with a reasonable stress state for the damage observed, but with poorcorrelation with a limited controlled vehicle test and predictions of3 bridge behavior using a grid model. A more extensive field study with
more extensive instrumentation and a more comprehensive analyticalN model appear need to resolve uncertainties in this case.
47
U
The results of the case histories also serve as a guide to the study of the present class
of problems and as an exposition on crack propagation problems at other locations in steel
bridge structures. The theoretical background for understanding and predicting the
propagation of cracks under cyclic stress applications is well documented in the literature and3verified by experimental evidence, and has been summarized here in brief. This knowledge
must be combined with information on site specific loading conditions, the structuralbehavior both on a gross level and in detail at the critical "hot spot" where cracking has been
detected.
The task of building an analytical model is approached in phases with a global
structural model of the bridge in a three-dimensional space frame or grid form used to
predict member forces in the floor beam element near the crack site. With these forces as
input a more refined finite element of the crack region is used.
3 A commentary on methodology is presented.
6.2 On Methodology
The case histories described herein are specialized and do not represent the full range
of cracking and fatigue problems seen in steel bridges, for example as has been compiledU under the study conducted at the Center for Advanced Technology for Large Structural
Systems (ATLSS), Lehigh University, by Fisher, Yen, Wang and Demers [14, 15, 161. Fisher et
al also add a useful summary of basic data and theory with excellent illustrations. Demers and
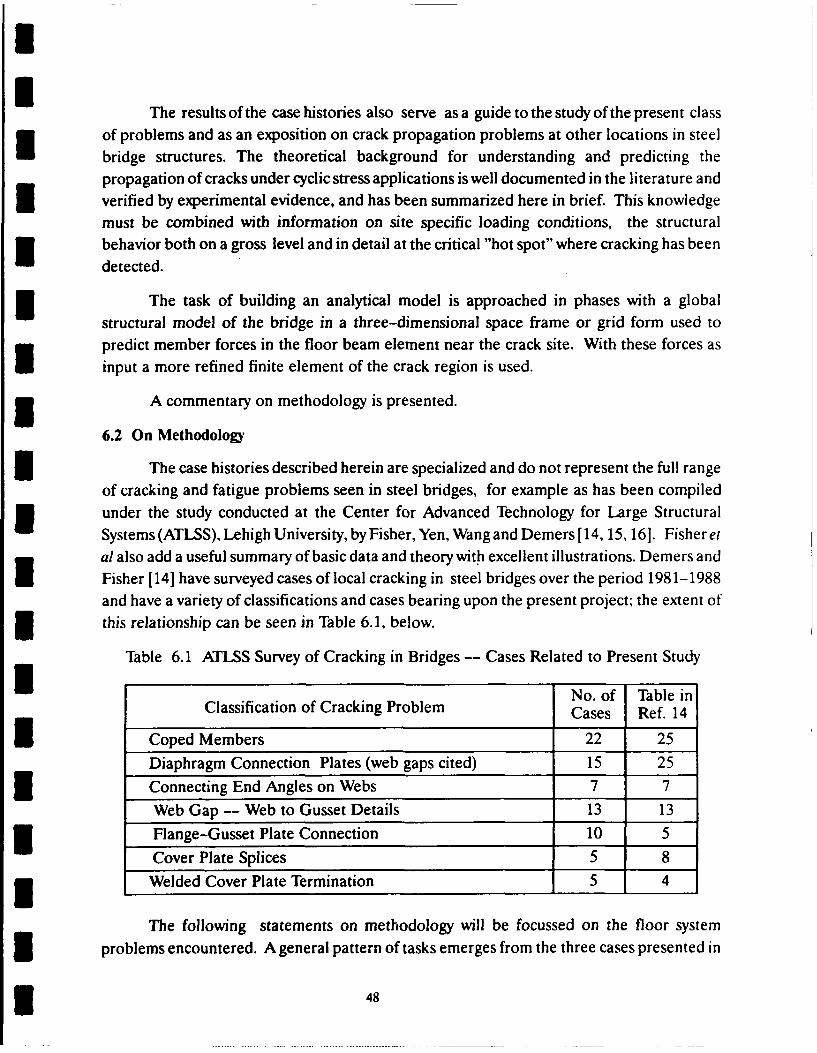
Fisher [141 have surveyed cases of local cracking in steel bridges over the period 1981-1988and have a variety of classifications and cases bearing upon the present project- the extent of3this relationship can be seen in Table 6.1, below.
Table 6.1 ATLSS Survey of Cracking in Bridges -- Cases Related to Present Study
C No. of Table inClassification of Cracking Problem Cases Ref. 14
U Coped Members 22 25
Diaphragm Connection Plates (web gaps cited) 15 25
3 Connecting End Angles on Webs 7 7
Web Gap -- Web to Gusset Details 13 13
3 Flange-Gusset Plate Connection 10 5
Cover Plate Splices 5 8
3 Welded Cover Plate Termination 5 4
The following statements on methodology will be focussed on the floor system3 problems encountered. A general pattern of tasks emerges from the three cases presented in
3 48

I
I this report. Most if not all of the following tasks, common to all fracture control plans,represent the general methodology for handling a review of a floor system cracking problem:
U S Information Needs and Data Gathering. The most important initialneed is for a careful inspection of the structure to assess the extent of3visible cracking.
* General Analytical Tasks3 Site Specific Crack Initiation and Propagation Studies
* Catastrophic Failure Assessment
3 * Field Testing and Assessment
* Assessment of Repair Details
3 * A Systematic Program of Inspection
The severity of the cracking problem must determine the degree to which all or part of the3 above tasks are undertaken. If no action is taken then sites of visible cracking must be subjectto ongoing periodic inspection. A full investigation might not be cost effective, or mightexceed the cost of simply using a known and reliable repair detail without extensive priorstudy; again, if such is the chosen course of action then a program of periodic inspectionremains important.
U The general analytical tasks must be approached with an appropriate level ofrefinement to match the task at hand. Full modelling of the entire structure is not feasible,3 nor always necessary. Good estimates of major member forces near the crack site are neededand then are used as input to a refined local model of the crack site or of the proposed repairdetail at that site. Thus it is true that for structures where inspections have not as yet revealedcracking, good judgement and reference to other cracking surveys must be used to select "hotspots" to review. In the study of the repair detail in Case 2, the repair detail has the effect of3reducing the major member forces as well as reducing the stress intensity at the crack site.
A possible path for the investigative process is diagrammed in Fig. 6.1. One canenvision a set of outcomes which may involve a decision to do one of the following:
* 1. repair using a detail which has been evaluated by the methodologyoutlined,
U 2. do not repair, but establish an inspection schedule and monitor crackbehavior,
3. establish that no significant problem exists and monitor as any other3structure, or,
3 49

II
4. establish that a total replacement of the floor system is needed, with amodified design - the most drastic outcome.
In the decision making process, the use of calculations of remaining life in most instancesshould be taken as base line for relative not absolute measures of improved life --particularly in the assessment of repair details. Although there are uncertainties in fatigue orcrack propagation behavior, the variability in the loadings and the uncertainties in makingUm measurements or calculations of the stress history at the fatigue critical location are thegreatest hindrance to the forecasting of an absolute fatigue life. Usually the lack of data for alife-long load history is the most important factor that prevents a greater refinement infatigue life estimates. That is, both traffic volume data and correlated information on vehicle3GVW and dimensions are unavailable for every bridge.
m
IU
I
I
3 50

Crack Damage
U Detected
General information: Detailed field measurements
0 ADT and GVW with inspection and crack
on trucks as avail, growth assessment.
0 Environmental loads
0 Obtain plans and review
the structural details
Analysis
General structural modelling for
1- structral analyis; determine forcesin the vacinity of region of
crack damage.
Crack initiation and crackpropagation studies
Refine stress analysisFEM modelling
Life Estimate
Make assessment of need forrepairs or replacement.
Inspection ProgramPrepare Repair Details
Re-analysis of repaired bridge structure Repair detail not needed
Assessment of Need for Inspection IntervalInspection Program Specifiedand/or Field Tests
Review for Future Design Changes
Fig. 6.1 Diagrammatic Flow of Methodology
51
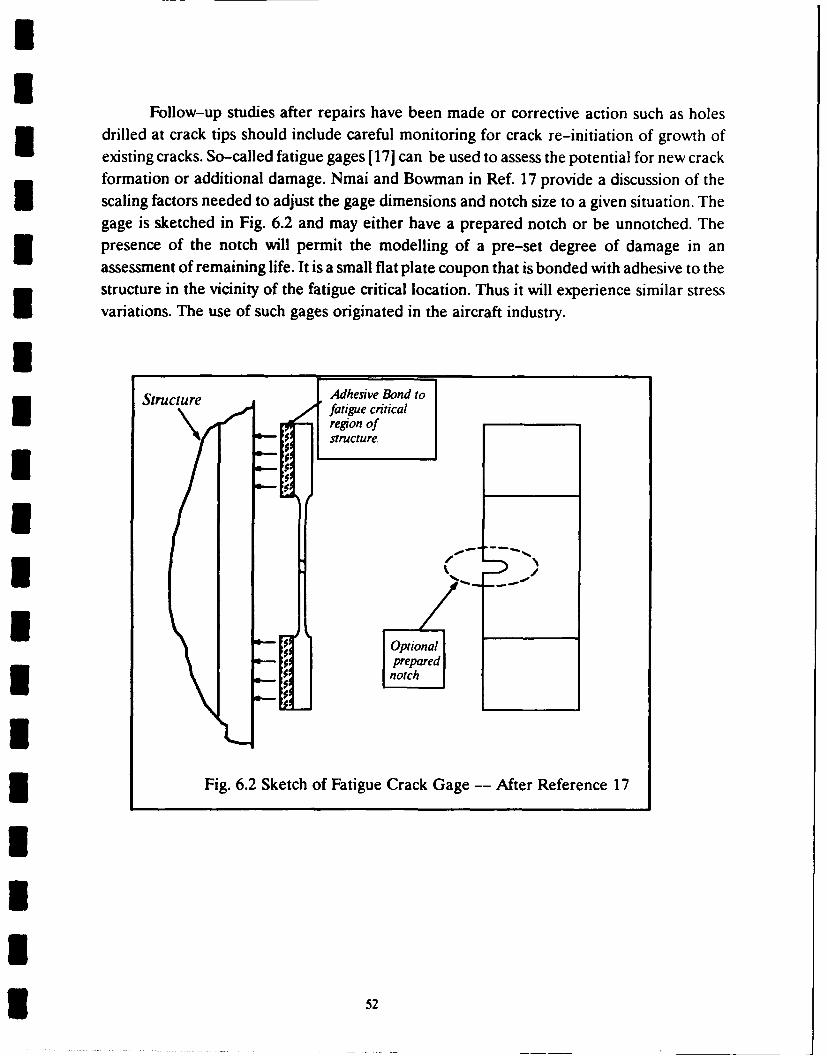
UI
Follow-up studies after repairs have been made or corrective action such as holesdrilled at crack tips should include careful monitoring for crack re-initiation of growth ofexisting cracks. So-called fatigue gages [17] can be used to assess the potential for new crackformation or additional damage. Nmai and Bowman in Ref. 17 provide a discussion of theIscaling factors needed to adjust the gage dimensions and notch size to a given situation. Thegage is sketched in Fig. 6.2 and may either have a prepared notch or be unnotched. The3 presence of the notch will permit the modelling of a pre-set degree of damage in anassessment of remaining life. It is a small flat plate coupon that is bonded with adhesive to thestructure in the vicinity of the fatigue critical location. Thus it will experience similar stressvariations. The use of such gages originated in the aircraft industry.
Siructure IAdhesive Bond toufatigue critical* region of
structure.
55
I1-- :Optional
Jc: preparedS notch
3 Fig. 6.2 Sketch of Fatigue Crack Gage -- After Reference 17
I
3 52

6.3 Future Work
Missing from the scope of the present study was the ability to do a sustained study of acase where the application of the remedial measure and follow-up field study of the responsecould be accomplished. Since field work is costly, it should be considered only where costeffective, for example:
o For a repetitive detail to be applied extensively on many structures.Example: a redesign of trussed bracing details.
o For a major repair where it is essential to monitor performance and checkfor possible re-development of damage.
Any extensive field program should be on structures with a reasonable life expectancy notlimited by other factors such as deterioration due to extensive corrosion or geometricobsolescence.
Longitudinal forces in bridge deck systems appear to be handled in a variety of ways,perhaps without adequate attention of the actual load path. The present study has addedanother case of damage (the Shade Lohmann Bridge) attributable to this source of adverseloading. Field studies of this behavior combined with analytical studies could be helpful inrevising design criteria.
U
I5
II
REFERENCESU1. American Association of State Highway and Transportation Officials,
Guide Specification for Fatigue Evaluation of Existing Steel Bridges,Washington, DC, 1990.
1 2. Moses, E, Schilling, and Raju, K. S., Fatigue Evaluation Procedures forSteel Bridges, NCHRP Report 299, Transportation Research Board,NRC, Washington, DC, November 1987.
3. Barsom, John M. and Rolfe, Stanley T, Fracture and Fatigue Control inStructures. 2nd Ed, Prentice-Hall, Inc., Englewood Cliffs, N.J., 1987.
4. Fisher, John W, Fatigue and Fracture in Steel Bridges -- Case Studies,John Wiley and Sons, 1984.
5. Gurney, T. R., Fatigue of Welded Structures. 2nd Ed., CambridgeUniversity Press, 1979.
6. Kanninen, Melvin E and Popelar, Carl H., Advanced FractureMechanics, Oxford University Press, 1985.
7. Jacobsen, Floyd K., Jeffrey M. South, AshrafAli. Mahomet Bridge Floor
Beam Project, Bridge Investigations Unit, Bureau of Materials andPhysical Research, Illinois Department of Transportation, December1987.
8. Lopez, Leonard A., Robert H. Dodds, Daniel R. Rehak, Richard J.Schmidt. POLO-FINITE User's Manual, Civil Engineering SystemsLaboratory, University of Illinois at Urbana..
1 9. Wellman, G. W, Sorem, W, A., Dodds, Jr., R. H., and Rolfe, S. T.,Specimen Thickness Effects for Elastic-Plastic CTOD Toughness of anA-36 Steel, Welding Research Council Bulletin No. 328, New York,November 1987.
10. Zuraski, P. D. and Johnson, J. E., Fatigue Strength of DeterioratedHighway Bridges, Journal of Structural Engineering, Vol. 116, No. 1989,pp. 2671-2690.
U 54
U 12. Inspection Report 1-474 Over Illinois River Shade-Lohmann BridgesE.B. Bridge No. 090-0108. W B. Bridge No. 090-0109, BridgeIInspection Team, IDOT Bureau of Maintenance, Springfield, Illinois,1987.
13. Jacobsen, F K. and South, J. M., Investigation of Cross-Frame Bracketson 1-74 Bridge over Vermillion River at Danville. Final Report, BridgeInvestigations Unit, Bureau of Materials and Physical Research, IDOT,July 1988.
14. Demers, C. E. and Fisher, J. W, A Survey of Localized Cracking inSte S.BLidgm, Center for Advanced Technology for Large StructuralSystems (ATLSS), Lehigh University, Bethlehem, Pennsylvania, ATLSSReport No. 89-01, July 1989.
15. Fisher, J. W, Yen, B. T, and Wang, D., Fatigue of Bridge Structures--ACommentary and Guide for Design. Evaluation and Investigation ofCracking, Center for Advanced Technology for Large StructuralSystems (ATLSS), Lehigh University, Bethlehem, Pennsylvania, ATLSSReport No. 89-02, July 1989.
16. Fisher, J. W, Executive Summary: Fatigue Cracking in Steel BridgeStructe Center for Advanced Technology for Large StructuralSystems (ATLSS), Lehigh University, Bethlehem, Pennsylvania, ATLSSReport No. 89-03, July 1989.
17. Nmai, C. K. and Bowman, M. D., Crack Gages for Detecting FatigueCrack Initiation. ASCE, Journal of Structural Engineering, Vol.113,No. 7, July, 1987.
18. Corten, J. T and Sailors, R. H., Relationship Between Material FractureToughness Using Fracture Mechanics and Transition Temperature Tests, T.& A. M. Report No. 346, University of Illinois, Urbana, Aug. 1971.
19. Roberts, R. and Newton, C., Report on Small-Scale Test Correlationswith Ktc Data, WRC Bulletin 299, November 1984.
55