thomas properties group, inclibrary.corporate-ir.net/library/17/178/178549/items/...thomas...
TRANSCRIPT

Thomas Properties Group, Inc. Supplemental Financial Information
For the Second Quarter 2007
1
Thomas Properties Group, Inc.1 Supplemental Financial Information
For the Second Quarter 2007
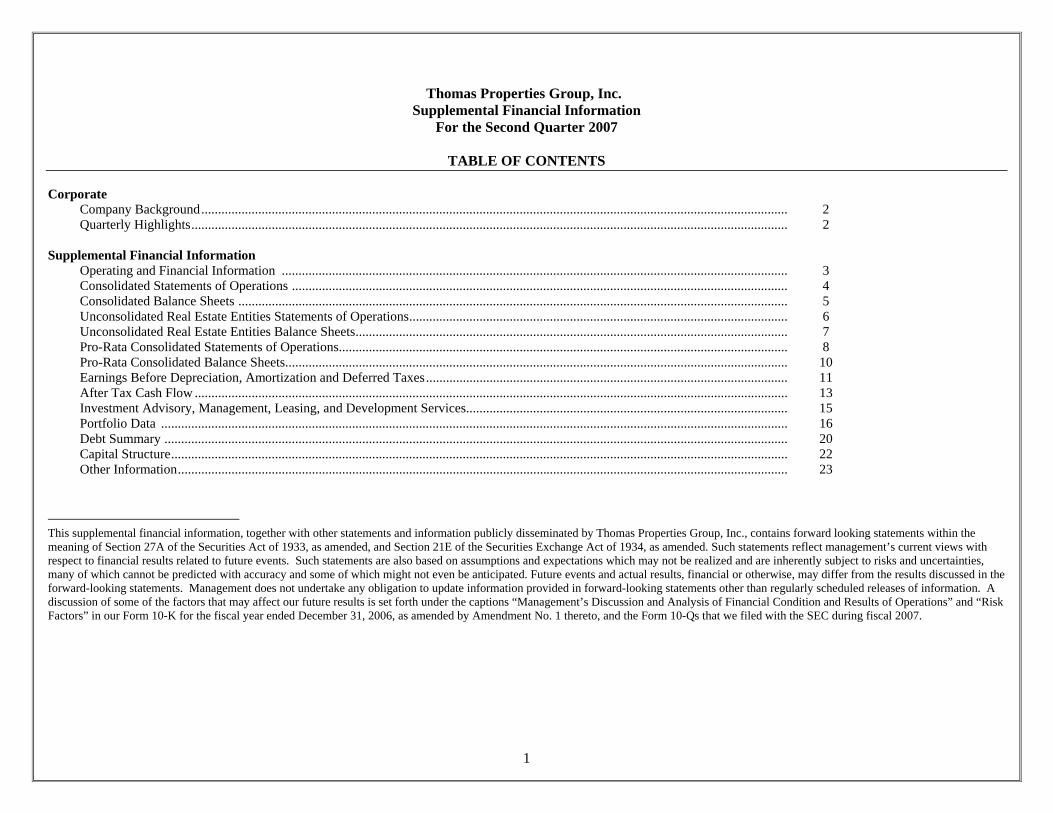
TABLE OF CONTENTS Corporate
Company Background............................................................................................................................................................................... 2 Quarterly Highlights.................................................................................................................................................................................. 2
Supplemental Financial Information
Operating and Financial Information ....................................................................................................................................................... 3 Consolidated Statements of Operations .................................................................................................................................................... 4 Consolidated Balance Sheets .................................................................................................................................................................... 5 Unconsolidated Real Estate Entities Statements of Operations................................................................................................................. 6 Unconsolidated Real Estate Entities Balance Sheets................................................................................................................................. 7 Pro-Rata Consolidated Statements of Operations...................................................................................................................................... 8 Pro-Rata Consolidated Balance Sheets...................................................................................................................................................... 10 Earnings Before Depreciation, Amortization and Deferred Taxes............................................................................................................ 11 After Tax Cash Flow ................................................................................................................................................................................. 13 Investment Advisory, Management, Leasing, and Development Services................................................................................................ 15 Portfolio Data ........................................................................................................................................................................................... 16 Debt Summary .......................................................................................................................................................................................... 20 Capital Structure........................................................................................................................................................................................ 22 Other Information...................................................................................................................................................................................... 23
This supplemental financial information, together with other statements and information publicly disseminated by Thomas Properties Group, Inc., contains forward looking statements within the meaning of Section 27A of the Securities Act of 1933, as amended, and Section 21E of the Securities Exchange Act of 1934, as amended. Such statements reflect management’s current views with respect to financial results related to future events. Such statements are also based on assumptions and expectations which may not be realized and are inherently subject to risks and uncertainties, many of which cannot be predicted with accuracy and some of which might not even be anticipated. Future events and actual results, financial or otherwise, may differ from the results discussed in the forward-looking statements. Management does not undertake any obligation to update information provided in forward-looking statements other than regularly scheduled releases of information. A discussion of some of the factors that may affect our future results is set forth under the captions “Management’s Discussion and Analysis of Financial Condition and Results of Operations” and “Risk Factors” in our Form 10-K for the fiscal year ended December 31, 2006, as amended by Amendment No. 1 thereto, and the Form 10-Qs that we filed with the SEC during fiscal 2007.
Thomas Properties Group, Inc. Supplemental Financial Information
2
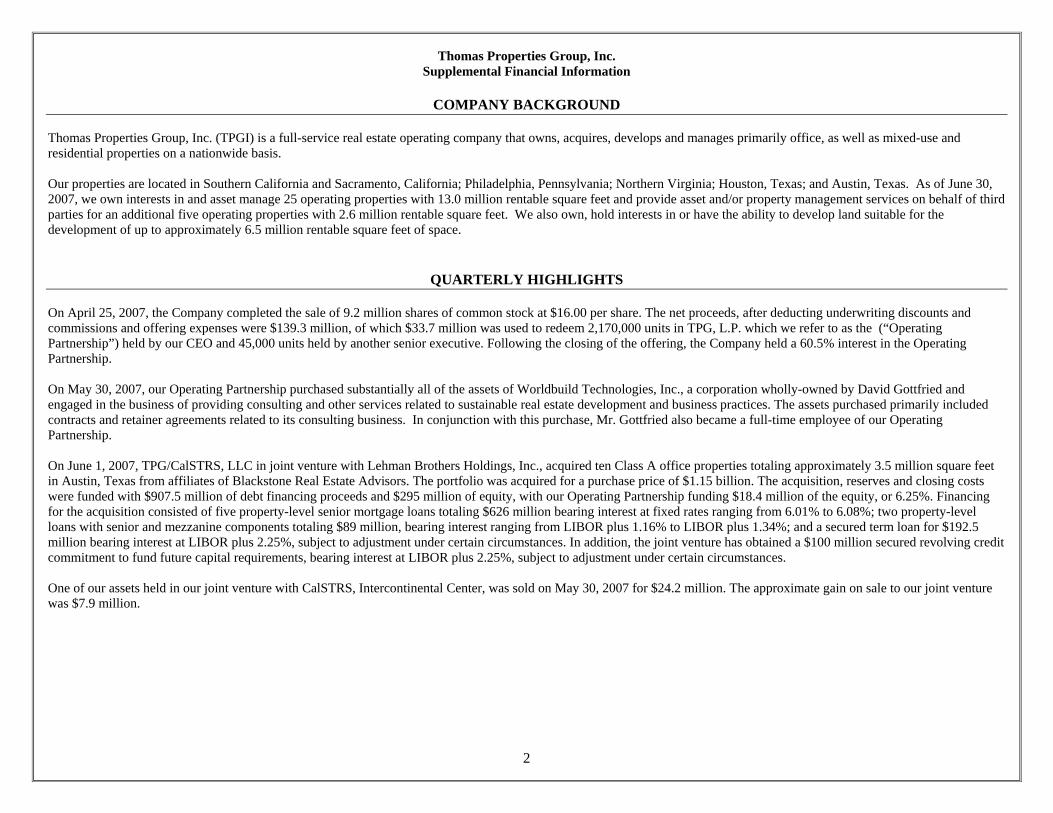
COMPANY BACKGROUND
Thomas Properties Group, Inc. (TPGI) is a full-service real estate operating company that owns, acquires, develops and manages primarily office, as well as mixed-use and residential properties on a nationwide basis. Our properties are located in Southern California and Sacramento, California; Philadelphia, Pennsylvania; Northern Virginia; Houston, Texas; and Austin, Texas. As of June 30, 2007, we own interests in and asset manage 25 operating properties with 13.0 million rentable square feet and provide asset and/or property management services on behalf of third parties for an additional five operating properties with 2.6 million rentable square feet. We also own, hold interests in or have the ability to develop land suitable for the development of up to approximately 6.5 million rentable square feet of space.
QUARTERLY HIGHLIGHTS
On April 25, 2007, the Company completed the sale of 9.2 million shares of common stock at $16.00 per share. The net proceeds, after deducting underwriting discounts and commissions and offering expenses were $139.3 million, of which $33.7 million was used to redeem 2,170,000 units in TPG, L.P. which we refer to as the (“Operating Partnership”) held by our CEO and 45,000 units held by another senior executive. Following the closing of the offering, the Company held a 60.5% interest in the Operating Partnership. On May 30, 2007, our Operating Partnership purchased substantially all of the assets of Worldbuild Technologies, Inc., a corporation wholly-owned by David Gottfried and engaged in the business of providing consulting and other services related to sustainable real estate development and business practices. The assets purchased primarily included contracts and retainer agreements related to its consulting business. In conjunction with this purchase, Mr. Gottfried also became a full-time employee of our Operating Partnership. On June 1, 2007, TPG/CalSTRS, LLC in joint venture with Lehman Brothers Holdings, Inc., acquired ten Class A office properties totaling approximately 3.5 million square feet in Austin, Texas from affiliates of Blackstone Real Estate Advisors. The portfolio was acquired for a purchase price of $1.15 billion. The acquisition, reserves and closing costs were funded with $907.5 million of debt financing proceeds and $295 million of equity, with our Operating Partnership funding $18.4 million of the equity, or 6.25%. Financing for the acquisition consisted of five property-level senior mortgage loans totaling $626 million bearing interest at fixed rates ranging from 6.01% to 6.08%; two property-level loans with senior and mezzanine components totaling $89 million, bearing interest ranging from LIBOR plus 1.16% to LIBOR plus 1.34%; and a secured term loan for $192.5 million bearing interest at LIBOR plus 2.25%, subject to adjustment under certain circumstances. In addition, the joint venture has obtained a $100 million secured revolving credit commitment to fund future capital requirements, bearing interest at LIBOR plus 2.25%, subject to adjustment under certain circumstances. One of our assets held in our joint venture with CalSTRS, Intercontinental Center, was sold on May 30, 2007 for $24.2 million. The approximate gain on sale to our joint venture was $7.9 million.
Thomas Properties Group, Inc. Supplemental Financial Information
3
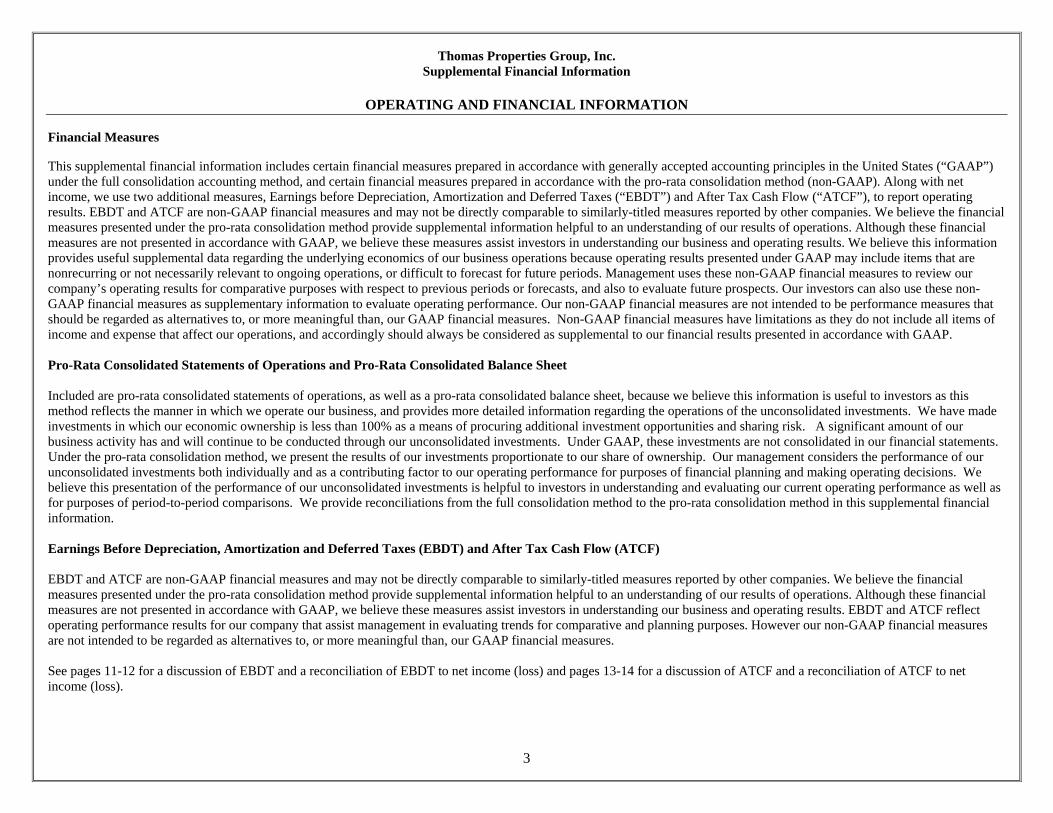
OPERATING AND FINANCIAL INFORMATION Financial Measures This supplemental financial information includes certain financial measures prepared in accordance with generally accepted accounting principles in the United States (“GAAP”) under the full consolidation accounting method, and certain financial measures prepared in accordance with the pro-rata consolidation method (non-GAAP). Along with net income, we use two additional measures, Earnings before Depreciation, Amortization and Deferred Taxes (“EBDT”) and After Tax Cash Flow (“ATCF”), to report operating results. EBDT and ATCF are non-GAAP financial measures and may not be directly comparable to similarly-titled measures reported by other companies. We believe the financial measures presented under the pro-rata consolidation method provide supplemental information helpful to an understanding of our results of operations. Although these financial measures are not presented in accordance with GAAP, we believe these measures assist investors in understanding our business and operating results. We believe this information provides useful supplemental data regarding the underlying economics of our business operations because operating results presented under GAAP may include items that are nonrecurring or not necessarily relevant to ongoing operations, or difficult to forecast for future periods. Management uses these non-GAAP financial measures to review our company’s operating results for comparative purposes with respect to previous periods or forecasts, and also to evaluate future prospects. Our investors can also use these non-GAAP financial measures as supplementary information to evaluate operating performance. Our non-GAAP financial measures are not intended to be performance measures that should be regarded as alternatives to, or more meaningful than, our GAAP financial measures. Non-GAAP financial measures have limitations as they do not include all items of income and expense that affect our operations, and accordingly should always be considered as supplemental to our financial results presented in accordance with GAAP. Pro-Rata Consolidated Statements of Operations and Pro-Rata Consolidated Balance Sheet Included are pro-rata consolidated statements of operations, as well as a pro-rata consolidated balance sheet, because we believe this information is useful to investors as this method reflects the manner in which we operate our business, and provides more detailed information regarding the operations of the unconsolidated investments. We have made investments in which our economic ownership is less than 100% as a means of procuring additional investment opportunities and sharing risk. A significant amount of our business activity has and will continue to be conducted through our unconsolidated investments. Under GAAP, these investments are not consolidated in our financial statements. Under the pro-rata consolidation method, we present the results of our investments proportionate to our share of ownership. Our management considers the performance of our unconsolidated investments both individually and as a contributing factor to our operating performance for purposes of financial planning and making operating decisions. We believe this presentation of the performance of our unconsolidated investments is helpful to investors in understanding and evaluating our current operating performance as well as for purposes of period-to-period comparisons. We provide reconciliations from the full consolidation method to the pro-rata consolidation method in this supplemental financial information. Earnings Before Depreciation, Amortization and Deferred Taxes (EBDT) and After Tax Cash Flow (ATCF) EBDT and ATCF are non-GAAP financial measures and may not be directly comparable to similarly-titled measures reported by other companies. We believe the financial measures presented under the pro-rata consolidation method provide supplemental information helpful to an understanding of our results of operations. Although these financial measures are not presented in accordance with GAAP, we believe these measures assist investors in understanding our business and operating results. EBDT and ATCF reflect operating performance results for our company that assist management in evaluating trends for comparative and planning purposes. However our non-GAAP financial measures are not intended to be regarded as alternatives to, or more meaningful than, our GAAP financial measures. See pages 11-12 for a discussion of EBDT and a reconciliation of EBDT to net income (loss) and pages 13-14 for a discussion of ATCF and a reconciliation of ATCF to net income (loss).
Thomas Properties Group, Inc. Supplemental Financial Information
4
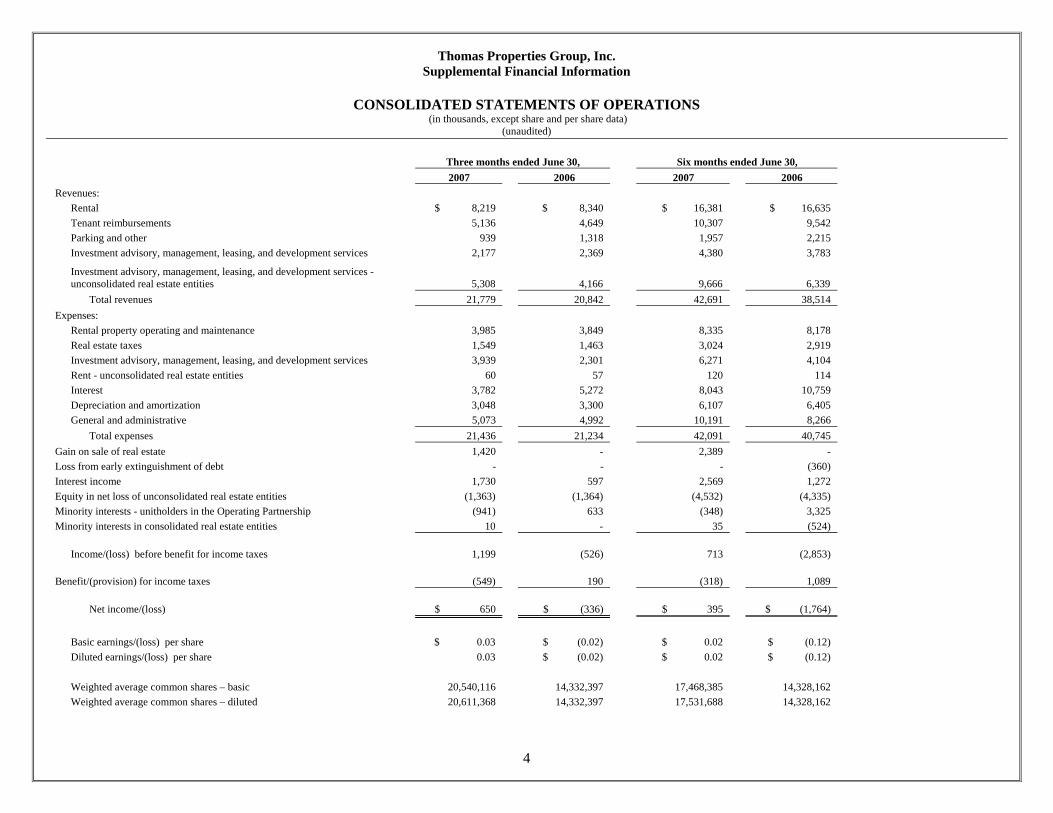
CONSOLIDATED STATEMENTS OF OPERATIONS (in thousands, except share and per share data)
(unaudited)
Three months ended June 30, Six months ended June 30, 2007 2006 2007 2006 Revenues: Rental $ 8,219 $ 8,340 $ 16,381 $ 16,635 Tenant reimbursements 5,136 4,649 10,307 9,542 Parking and other 939 1,318 1,957 2,215 Investment advisory, management, leasing, and development services 2,177 2,369 4,380 3,783
Investment advisory, management, leasing, and development services - unconsolidated real estate entities 5,308 4,166 9,666 6,339
Total revenues 21,779 20,842 42,691 38,514 Expenses: Rental property operating and maintenance 3,985 3,849 8,335 8,178 Real estate taxes 1,549 1,463 3,024 2,919 Investment advisory, management, leasing, and development services 3,939 2,301 6,271 4,104 Rent - unconsolidated real estate entities 60 57 120 114 Interest 3,782 5,272 8,043 10,759 Depreciation and amortization 3,048 3,300 6,107 6,405 General and administrative 5,073 4,992 10,191 8,266 Total expenses 21,436 21,234 42,091 40,745 Gain on sale of real estate 1,420 - 2,389 - Loss from early extinguishment of debt - - - (360) Interest income 1,730 597 2,569 1,272 Equity in net loss of unconsolidated real estate entities (1,363) (1,364) (4,532) (4,335) Minority interests - unitholders in the Operating Partnership (941) 633 (348) 3,325 Minority interests in consolidated real estate entities 10 - 35 (524) Income/(loss) before benefit for income taxes 1,199 (526) 713 (2,853) Benefit/(provision) for income taxes (549) 190 (318) 1,089 Net income/(loss) $ 650 $ (336) $ 395 $ (1,764)
Basic earnings/(loss) per share $ 0.03 $ (0.02) $ 0.02 $ (0.12) Diluted earnings/(loss) per share 0.03 $ (0.02) $ 0.02 $ (0.12) Weighted average common shares – basic 20,540,116 14,332,397 17,468,385 14,328,162 Weighted average common shares – diluted 20,611,368 14,332,397 17,531,688 14,328,162
Thomas Properties Group, Inc. Supplemental Financial Information
5
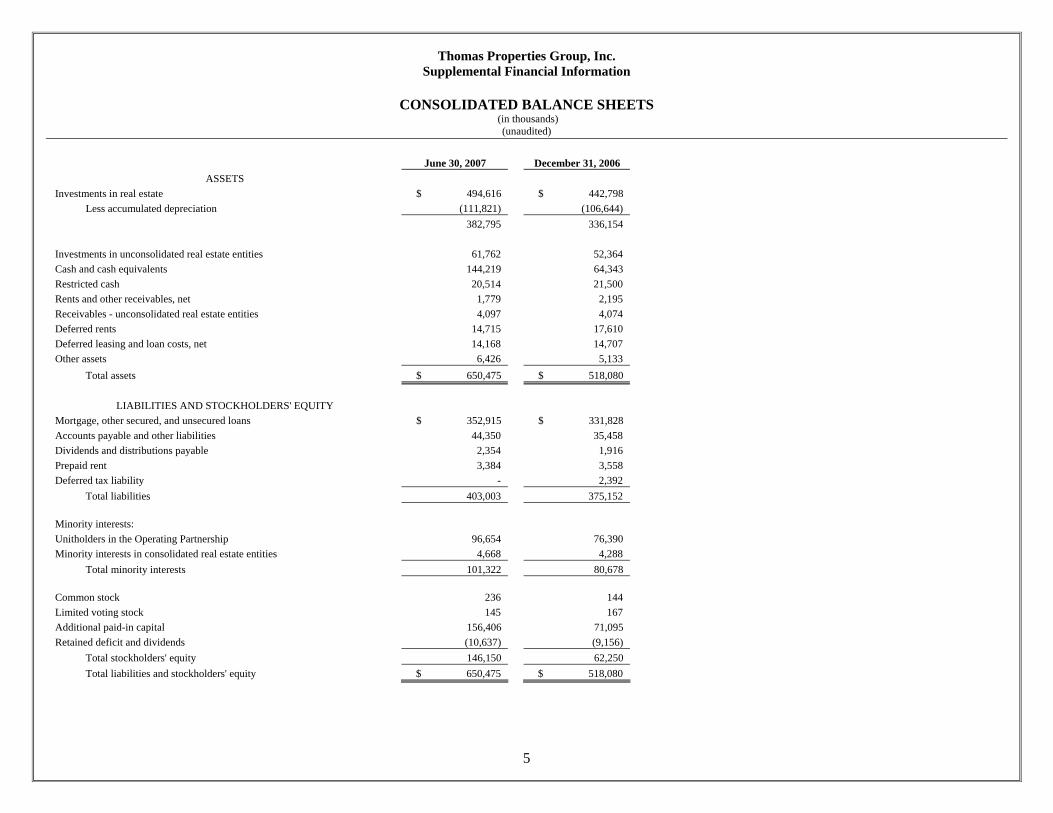
CONSOLIDATED BALANCE SHEETS (in thousands)
(unaudited)
June 30, 2007 December 31, 2006 ASSETS
Investments in real estate $ 494,616 $ 442,798 Less accumulated depreciation (111,821) (106,644) 382,795 336,154 Investments in unconsolidated real estate entities 61,762 52,364 Cash and cash equivalents 144,219 64,343 Restricted cash 20,514 21,500 Rents and other receivables, net 1,779 2,195 Receivables - unconsolidated real estate entities 4,097 4,074 Deferred rents 14,715 17,610 Deferred leasing and loan costs, net 14,168 14,707 Other assets 6,426 5,133 Total assets $ 650,475 $ 518,080
LIABILITIES AND STOCKHOLDERS' EQUITY Mortgage, other secured, and unsecured loans $ 352,915 $ 331,828 Accounts payable and other liabilities 44,350 35,458 Dividends and distributions payable 2,354 1,916 Prepaid rent 3,384 3,558 Deferred tax liability - 2,392 Total liabilities 403,003 375,152 Minority interests: Unitholders in the Operating Partnership 96,654 76,390 Minority interests in consolidated real estate entities 4,668 4,288 Total minority interests 101,322 80,678 Common stock 236 144 Limited voting stock 145 167 Additional paid-in capital 156,406 71,095 Retained deficit and dividends (10,637) (9,156) Total stockholders' equity 146,150 62,250 Total liabilities and stockholders' equity $ 650,475 $ 518,080
Thomas Properties Group, Inc. Supplemental Financial Information
6
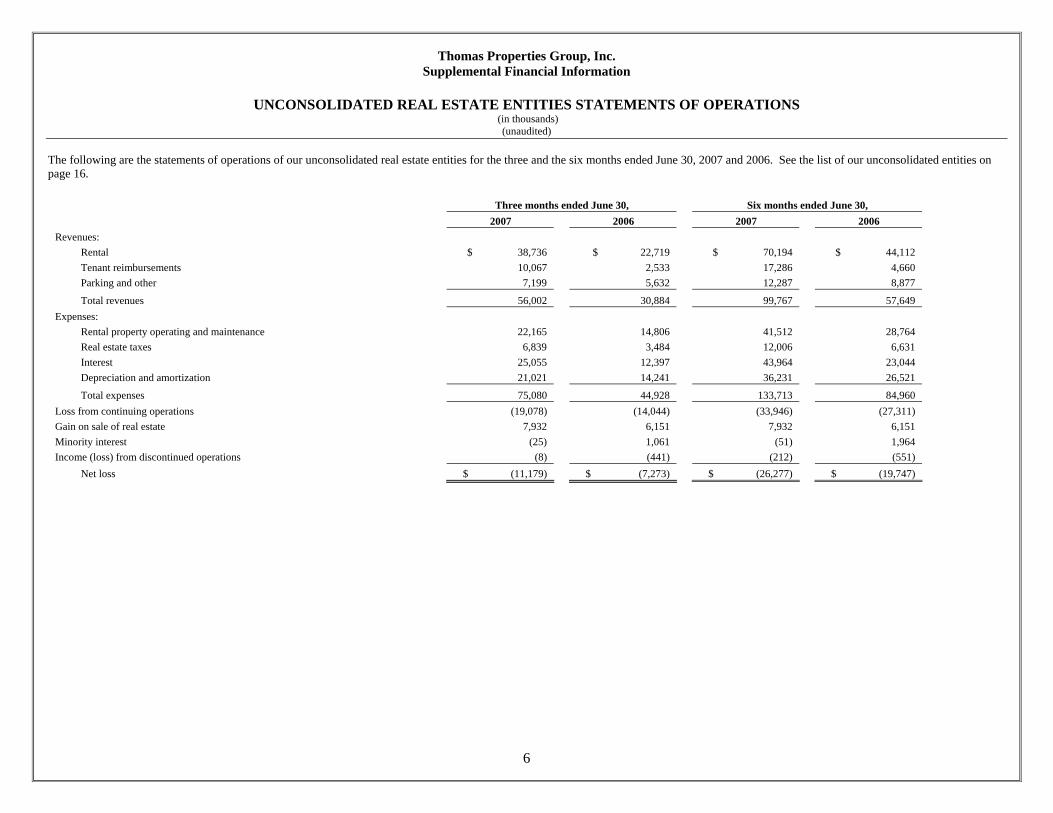
UNCONSOLIDATED REAL ESTATE ENTITIES STATEMENTS OF OPERATIONS (in thousands)
(unaudited) The following are the statements of operations of our unconsolidated real estate entities for the three and the six months ended June 30, 2007 and 2006. See the list of our unconsolidated entities on page 16. Three months ended June 30, Six months ended June 30, 2007 2006 2007 2006 Revenues: Rental $ 38,736 $ 22,719 $ 70,194 $ 44,112 Tenant reimbursements 10,067 2,533 17,286 4,660 Parking and other 7,199 5,632 12,287 8,877
Total revenues 56,002 30,884 99,767 57,649 Expenses: Rental property operating and maintenance 22,165 14,806 41,512 28,764 Real estate taxes 6,839 3,484 12,006 6,631 Interest 25,055 12,397 43,964 23,044 Depreciation and amortization 21,021 14,241 36,231 26,521
Total expenses 75,080 44,928 133,713 84,960 Loss from continuing operations (19,078) (14,044) (33,946) (27,311) Gain on sale of real estate 7,932 6,151 7,932 6,151 Minority interest (25) 1,061 (51) 1,964 Income (loss) from discontinued operations (8) (441) (212) (551) Net loss $ (11,179) $ (7,273) $ (26,277) $ (19,747)
Thomas Properties Group, Inc. Supplemental Financial Information
7
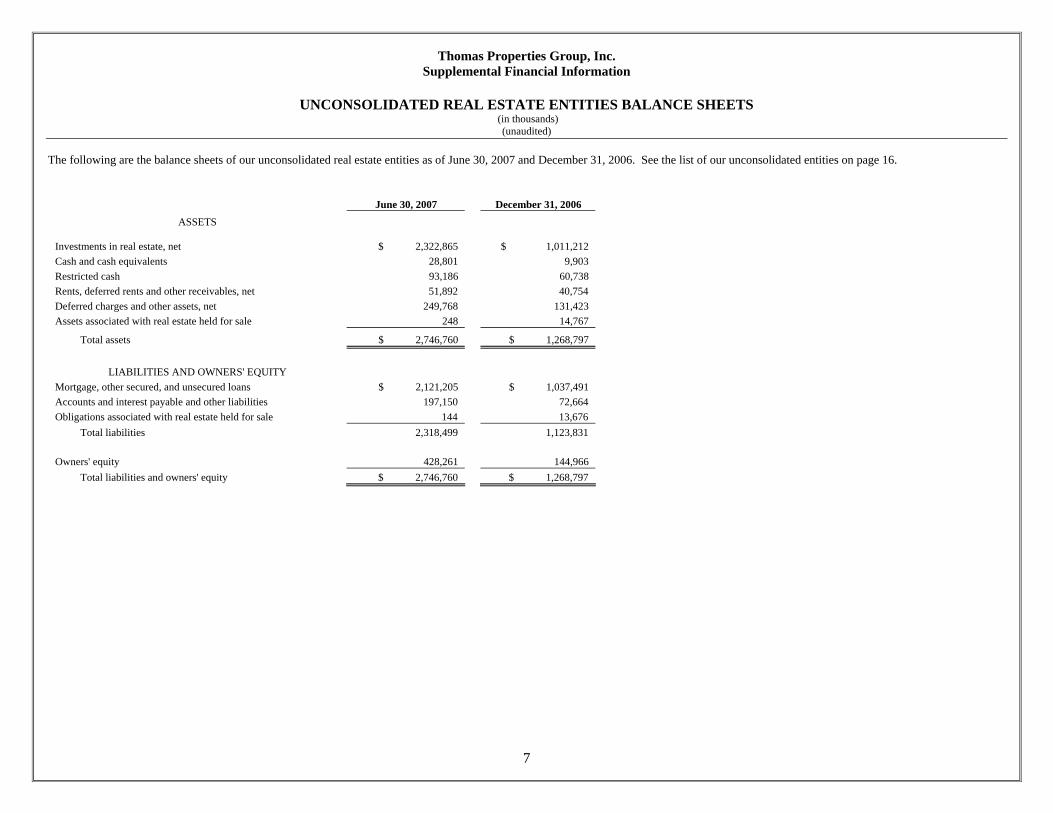
UNCONSOLIDATED REAL ESTATE ENTITIES BALANCE SHEETS (in thousands)
(unaudited) The following are the balance sheets of our unconsolidated real estate entities as of June 30, 2007 and December 31, 2006. See the list of our unconsolidated entities on page 16.
June 30, 2007 December 31, 2006 ASSETS
Investments in real estate, net
$ 2,322,865 $ 1,011,212 Cash and cash equivalents 28,801 9,903 Restricted cash 93,186 60,738 Rents, deferred rents and other receivables, net 51,892 40,754 Deferred charges and other assets, net 249,768 131,423 Assets associated with real estate held for sale 248 14,767
Total assets $ 2,746,760 $ 1,268,797
LIABILITIES AND OWNERS' EQUITY Mortgage, other secured, and unsecured loans $ 2,121,205 $ 1,037,491 Accounts and interest payable and other liabilities 197,150 72,664 Obligations associated with real estate held for sale 144 13,676 Total liabilities 2,318,499 1,123,831 Owners' equity 428,261 144,966 Total liabilities and owners' equity $ 2,746,760 $ 1,268,797

Thomas Properties Group, Inc. Supplemental Financial Information
8
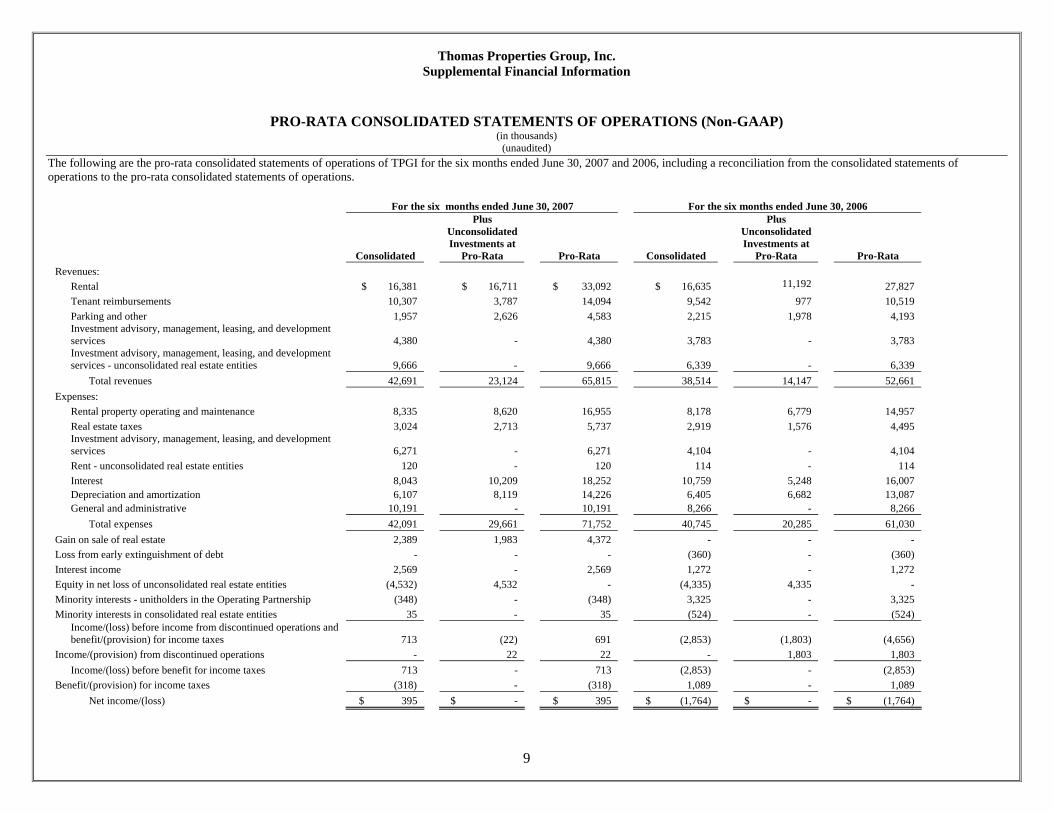
PRO-RATA CONSOLIDATED STATEMENTS OF OPERATIONS (Non-GAAP) (in thousands)
(unaudited) The following are the pro-rata consolidated statements of operations of TPGI for the three months ended June 30, 2007 and 2006, including a reconciliation from the consolidated statements of operations to the pro-rata consolidated statements of operations.
For the three months ended June 30, 2007 For the three months ended June 30, 2006
Consolidated
Plus Unconsolidated Investments at
Pro-Rata Pro-Rata Consolidated
Plus Unconsolidated Investments at
Pro-Rata Pro-Rata Revenues: Rental $ 8,219 $ 8,581 $ 16,800 $ 8,340 $ 5,667 $ 14,007 Tenant reimbursements 5,136 1,967 7,103 4,649 499 5,148 Parking and other 939 1,350 2,289 1,318 1,244 2,562
Investment advisory, management, leasing, and development services 2,177 -
2,177 2,369 - 2,369
Investment advisory, management, leasing, and development services - unconsolidated real estate entities 5,308 -
5,308 4,166 - 4,166
Total revenues 21,779 11,898 33,677 20,842 7,410 28,252 Expenses: Rental property operating and maintenance 3,985 4,222 8,207 3,849 3,585 7,434 Real estate taxes 1,549 1,413 2,962 1,463 801 2,264
Investment advisory, management, leasing, and development services 3,939 - 3,939 2,301 - 2,301
Rent - unconsolidated real estate entities 60 - 60 57 - 57 Interest 3,782 5,408 9,190 5,272 2,672 7,944 Depreciation and amortization 3,048 4,265 7,313 3,300 3,455 6,755 General and administrative 5,073 - 5,073 4,992 - 4,992 Total expenses 21,436 15,308 36,744 21,234 10,513 31,747 Gain on sale of real estate 1,420 1,983 3,403 - - - Interest income 1,730 -. 1,730 597 - 597 Equity in net loss of unconsolidated real estate entities (1,363) 1,363 - (1,364) 1,364 - Minority interests - unitholders in the Operating Partnership (941) - (941) 633 633 Minority interests in consolidated real estate entities 10 - 10 - - -
Income/(loss) income before income from discontinued operations and benefit/(provision) for income taxes 1,199 (64) 1,135 (526) (1,739) (2,265)
Income from discontinued operations - 64 64 - 1,739 1,739 Income/(loss) before benefit/(provision) for income taxes 1,199 - 1,199 (526) - (526) Benefit/(provision) for income taxes (549) - (549) 190 - 190 Net income/(loss) $ 650 $ - $ 650 $ (336) $ - $ (336)
Thomas Properties Group, Inc. Supplemental Financial Information
9
PRO-RATA CONSOLIDATED STATEMENTS OF OPERATIONS (Non-GAAP)
(in thousands) (unaudited)
The following are the pro-rata consolidated statements of operations of TPGI for the six months ended June 30, 2007 and 2006, including a reconciliation from the consolidated statements of operations to the pro-rata consolidated statements of operations.
For the six months ended June 30, 2007 For the six months ended June 30, 2006
Consolidated
Plus Unconsolidated Investments at
Pro-Rata Pro-Rata Consolidated
Plus Unconsolidated Investments at
Pro-Rata Pro-Rata Revenues: Rental $ 16,381 $ 16,711 $ 33,092 $ 16,635 11,192 27,827 Tenant reimbursements 10,307 3,787 14,094 9,542 977 10,519 Parking and other 1,957 2,626 4,583 2,215 1,978 4,193
Investment advisory, management, leasing, and development services 4,380 - 4,380 3,783 - 3,783
Investment advisory, management, leasing, and development services - unconsolidated real estate entities 9,666 - 9,666 6,339 - 6,339
Total revenues 42,691 23,124 65,815 38,514 14,147 52,661 Expenses: Rental property operating and maintenance 8,335 8,620 16,955 8,178 6,779 14,957 Real estate taxes 3,024 2,713 5,737 2,919 1,576 4,495
Investment advisory, management, leasing, and development services 6,271 - 6,271 4,104 - 4,104
Rent - unconsolidated real estate entities 120 - 120 114 - 114 Interest 8,043 10,209 18,252 10,759 5,248 16,007 Depreciation and amortization 6,107 8,119 14,226 6,405 6,682 13,087 General and administrative 10,191 - 10,191 8,266 - 8,266 Total expenses 42,091 29,661 71,752 40,745 20,285 61,030 Gain on sale of real estate 2,389 1,983 4,372 - - - Loss from early extinguishment of debt - - - (360) - (360) Interest income 2,569 - 2,569 1,272 - 1,272 Equity in net loss of unconsolidated real estate entities (4,532) 4,532 - (4,335) 4,335 - Minority interests - unitholders in the Operating Partnership (348) - (348) 3,325 - 3,325 Minority interests in consolidated real estate entities 35 - 35 (524) - (524)
Income/(loss) before income from discontinued operations and benefit/(provision) for income taxes 713 (22) 691 (2,853) (1,803) (4,656)
Income/(provision) from discontinued operations - 22 22 - 1,803 1,803 Income/(loss) before benefit for income taxes 713 - 713 (2,853) - (2,853) Benefit/(provision) for income taxes (318) - (318) 1,089 - 1,089 Net income/(loss) $ 395 $ - $ 395 $ (1,764) $ - $ (1,764)

Thomas Properties Group, Inc. Supplemental Financial Information
10
PRO-RATA CONSOLIDATED BALANCE SHEETS (Non-GAAP) (in thousands)
(unaudited) The following is the pro-rata consolidated balance sheets of TPGI as of June 30, 2007 and December 31, 2006, including reconciliations from the consolidated balance sheets to the pro-rata consolidated balance sheets.
June 30, 2007 December 31, 2006
Consolidated
Plus Unconsolidated Investments at
Pro-Rata Pro-Rata Consolidated
Plus Unconsolidated Investments at
Pro-Rata Pro-Rata ASSETS
Investments in real estate, net $ 382,795 $ 364,864 $ 750,659 $ 336,154 $ 252,612 $ 588,766 Investments in unconsolidated real estate entities 61,762 (61,762) - 52,364 (52,364) - Cash and cash equivalents 144,219 3,560 147,779 64,343 2,554 66,897 Restricted cash 20,514 15,877 36,391 21,500 14,044 35,544 Rents, deferred rents and other receivables, net 20,591 11,757 32,348 23,879 10,062 33,941 Deferred charges and other assets, net 20,594 37,962 58,556 19,840 37,998 57,838 Assets associated with real estate held for sale - 62 62 - 3,692 3,692 Total assets $ 650,475 $ 372,320 $ 1,022,795 $ 518,080 $ 268,598 $ 786,678
LIABILITIES AND STOCKHOLDERS' EQUITY Mortgage, other secured, and unsecured loans $ 352,915 $ 346,716 $ 699,631 $ 331,828 $ 246,755 $ 578,583 Accounts payable, dividends and distributions payable, and other liabilities 50,088 25,568 75,656 43,324 18,424 61,748 Obligations associated with real estate held for sale - 36 36 - 3,419 3,419 Total liabilities 403,003 372,320 775,323 375,152 268,598 643,750 Minority interests 101,322 - 101,322 80,678 - 80,678 Total stockholders' equity 146,150 - 146,150 62,250 - 62,250 Total liabilities and stockholders' equity $ 650,475 $ 372,320 $ 1,022,795 $ 518,080 $ 268,598 $ 786,678

Thomas Properties Group, Inc. Supplemental Financial Information
11
EARNINGS BEFORE DEPRECIATION, AMORTIZATION AND DEFERRED TAXES (EBDT) (Non-GAAP) (in thousands, except share and per share data)
(unaudited)
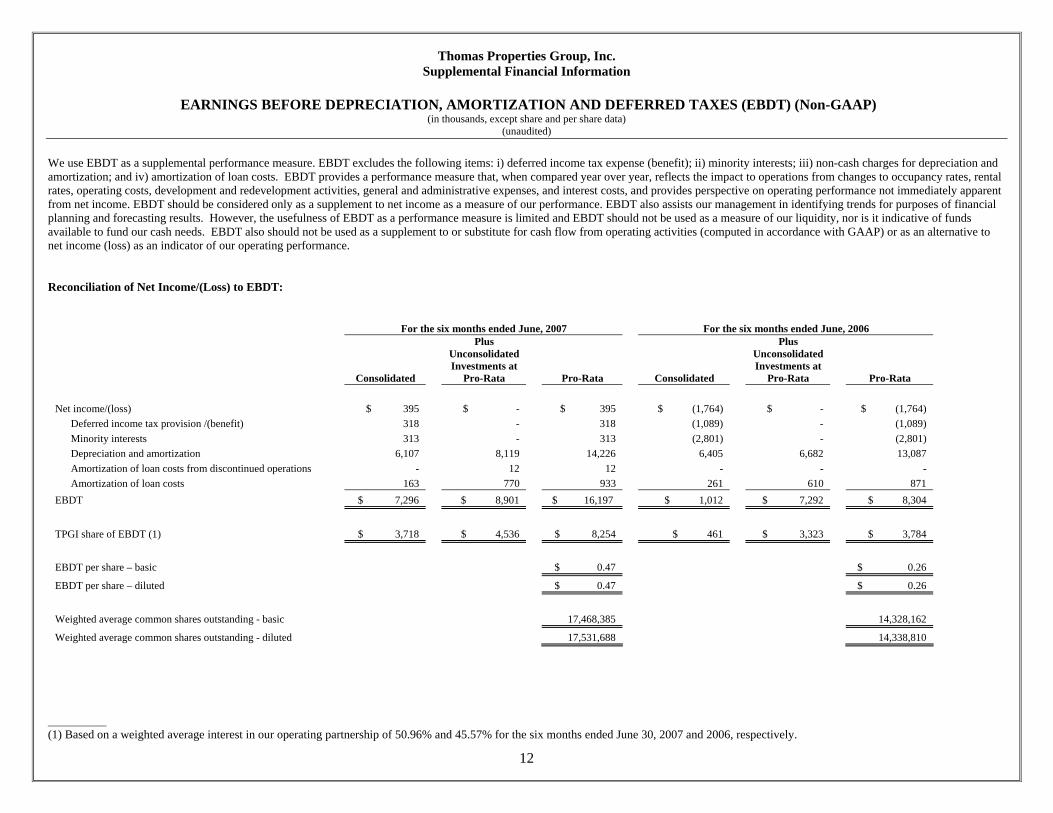
We use EBDT as a supplemental performance measure. EBDT excludes the following items: i) deferred income tax expense (benefit); ii) minority interests; iii) non-cash charges for depreciation and amortization; and iv) amortization of loan costs. EBDT provides a performance measure that, when compared year over year, reflects the impact to operations from changes to occupancy rates, rental rates, operating costs, development and redevelopment activities, general and administrative expenses, and interest costs, and provides perspective on operating performance not immediately apparent from net income. EBDT should be considered only as a supplement to net income as a measure of our performance. EBDT also assists our management in identifying trends for purposes of financial planning and forecasting results. However, the usefulness of EBDT as a performance measure is limited and EBDT should not be used as a measure of our liquidity, nor is it indicative of funds available to fund our cash needs. EBDT also should not be used as a supplement to or substitute for cash flow from operating activities (computed in accordance with GAAP) or as an alternative to net income (loss) as an indicator of our operating performance. Reconciliation of Net Income/(Loss) to EBDT:
For the three months ended June, 2007 For the three months ended June, 2006
Consolidated
Plus Unconsolidated Investments at
Pro-Rata Pro-Rata Consolidated
Plus Unconsolidated Investments at
Pro-Rata Pro-Rata Net income/(loss) $ 650 $ - $ 650 $ (336) $ - $ (336) Deferred income tax provision/(benefit) 549 - 549 (190) - (190) Minority interests 931 - 931 (633) - (633) Depreciation and amortization 3,048 4,265 7,313 3,300 3,455 6,755 Amortization of loan costs 82 358 440 89 318 407 EBDT $ 5,260 $ 4,623 $ 9,883 $ 2,230 $ 3,773 $ 6,003
TPGI share of EBDT (1) $ 2,947 $ 2,590 $ 5,537 $ 1,011 $ 1,710 $ 2,721
EBDT per share – basic $ 0.27 $ 0.19
EBDT per share – diluted $ 0.27 $ 0.19
Weighted average common shares outstanding - basic 20,540,116 14,332,397
Weighted average common shares outstanding - diluted 20,611,368 14,347,971 ___________ (1) Based on a weighted average interest in our operating partnership of 56.03% and 45.32% for the three months ended June 30, 2007 and 2006, respectively.
Thomas Properties Group, Inc. Supplemental Financial Information
12
EARNINGS BEFORE DEPRECIATION, AMORTIZATION AND DEFERRED TAXES (EBDT) (Non-GAAP) (in thousands, except share and per share data)
(unaudited)
We use EBDT as a supplemental performance measure. EBDT excludes the following items: i) deferred income tax expense (benefit); ii) minority interests; iii) non-cash charges for depreciation and amortization; and iv) amortization of loan costs. EBDT provides a performance measure that, when compared year over year, reflects the impact to operations from changes to occupancy rates, rental rates, operating costs, development and redevelopment activities, general and administrative expenses, and interest costs, and provides perspective on operating performance not immediately apparent from net income. EBDT should be considered only as a supplement to net income as a measure of our performance. EBDT also assists our management in identifying trends for purposes of financial planning and forecasting results. However, the usefulness of EBDT as a performance measure is limited and EBDT should not be used as a measure of our liquidity, nor is it indicative of funds available to fund our cash needs. EBDT also should not be used as a supplement to or substitute for cash flow from operating activities (computed in accordance with GAAP) or as an alternative to net income (loss) as an indicator of our operating performance. Reconciliation of Net Income/(Loss) to EBDT:
For the six months ended June, 2007 For the six months ended June, 2006
Consolidated
Plus Unconsolidated Investments at
Pro-Rata Pro-Rata Consolidated
Plus Unconsolidated Investments at
Pro-Rata Pro-Rata Net income/(loss) $ 395 $ - $ 395 $ (1,764) $ - $ (1,764) Deferred income tax provision /(benefit) 318 - 318 (1,089) - (1,089) Minority interests 313 - 313 (2,801) - (2,801) Depreciation and amortization 6,107 8,119 14,226 6,405 6,682 13,087 Amortization of loan costs from discontinued operations - 12 12 - - - Amortization of loan costs 163 770 933 261 610 871 EBDT $ 7,296 $ 8,901 $ 16,197 $ 1,012 $ 7,292 $ 8,304
TPGI share of EBDT (1) $ 3,718 $ 4,536 $ 8,254 $ 461 $ 3,323 $ 3,784
EBDT per share – basic $ 0.47 $ 0.26
EBDT per share – diluted $ 0.47 $ 0.26
Weighted average common shares outstanding - basic 17,468,385 14,328,162
Weighted average common shares outstanding - diluted 17,531,688 14,338,810 ___________ (1) Based on a weighted average interest in our operating partnership of 50.96% and 45.57% for the six months ended June 30, 2007 and 2006, respectively.
Thomas Properties Group, Inc. Supplemental Financial Information
13
AFTER TAX CASH FLOW (ATCF) (Non-GAAP)
(in thousands, except share and per share data) (unaudited)
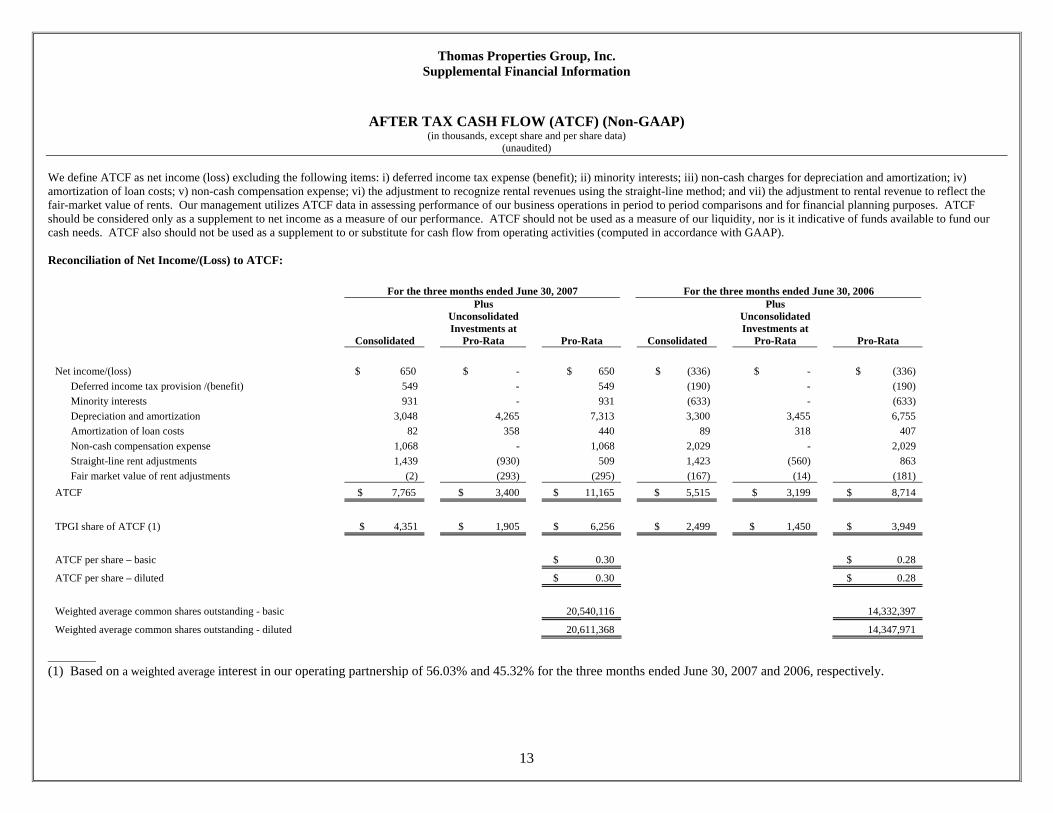
We define ATCF as net income (loss) excluding the following items: i) deferred income tax expense (benefit); ii) minority interests; iii) non-cash charges for depreciation and amortization; iv) amortization of loan costs; v) non-cash compensation expense; vi) the adjustment to recognize rental revenues using the straight-line method; and vii) the adjustment to rental revenue to reflect the fair-market value of rents. Our management utilizes ATCF data in assessing performance of our business operations in period to period comparisons and for financial planning purposes. ATCF should be considered only as a supplement to net income as a measure of our performance. ATCF should not be used as a measure of our liquidity, nor is it indicative of funds available to fund our cash needs. ATCF also should not be used as a supplement to or substitute for cash flow from operating activities (computed in accordance with GAAP). Reconciliation of Net Income/(Loss) to ATCF:
For the three months ended June 30, 2007 For the three months ended June 30, 2006
Consolidated
Plus Unconsolidated Investments at
Pro-Rata Pro-Rata Consolidated
Plus Unconsolidated Investments at
Pro-Rata Pro-Rata Net income/(loss) $ 650 $ - $ 650 $ (336) $ - $ (336) Deferred income tax provision /(benefit) 549 - 549 (190) - (190) Minority interests 931 - 931 (633) - (633) Depreciation and amortization 3,048 4,265 7,313 3,300 3,455 6,755 Amortization of loan costs 82 358 440 89 318 407 Non-cash compensation expense 1,068 - 1,068 2,029 - 2,029 Straight-line rent adjustments 1,439 (930) 509 1,423 (560) 863 Fair market value of rent adjustments (2) (293) (295) (167) (14) (181) ATCF $ 7,765 $ 3,400 $ 11,165 $ 5,515 $ 3,199 $ 8,714
TPGI share of ATCF (1) $ 4,351 $ 1,905 $ 6,256 $ 2,499 $ 1,450 $ 3,949
ATCF per share – basic $ 0.30 $ 0.28
ATCF per share – diluted $ 0.30 $ 0.28
Weighted average common shares outstanding - basic 20,540,116 14,332,397
Weighted average common shares outstanding - diluted 20,611,368 14,347,971 _________ (1) Based on a weighted average interest in our operating partnership of 56.03% and 45.32% for the three months ended June 30, 2007 and 2006, respectively.
Thomas Properties Group, Inc. Supplemental Financial Information
14
AFTER TAX CASH FLOW (ATCF) (Non-GAAP)
(in thousands, except share and per share data) (unaudited)
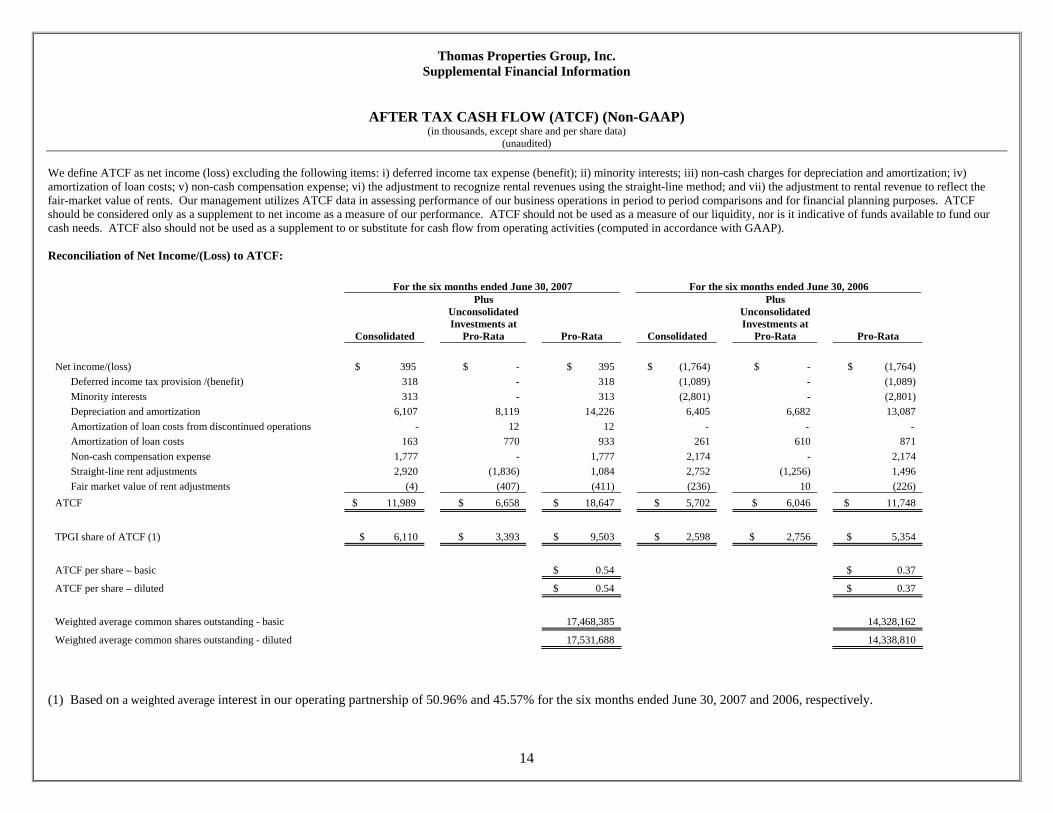
We define ATCF as net income (loss) excluding the following items: i) deferred income tax expense (benefit); ii) minority interests; iii) non-cash charges for depreciation and amortization; iv) amortization of loan costs; v) non-cash compensation expense; vi) the adjustment to recognize rental revenues using the straight-line method; and vii) the adjustment to rental revenue to reflect the fair-market value of rents. Our management utilizes ATCF data in assessing performance of our business operations in period to period comparisons and for financial planning purposes. ATCF should be considered only as a supplement to net income as a measure of our performance. ATCF should not be used as a measure of our liquidity, nor is it indicative of funds available to fund our cash needs. ATCF also should not be used as a supplement to or substitute for cash flow from operating activities (computed in accordance with GAAP). Reconciliation of Net Income/(Loss) to ATCF:
For the six months ended June 30, 2007 For the six months ended June 30, 2006
Consolidated
Plus Unconsolidated Investments at
Pro-Rata Pro-Rata Consolidated
Plus Unconsolidated Investments at
Pro-Rata Pro-Rata Net income/(loss) $ 395 $ - $ 395 $ (1,764) $ - $ (1,764) Deferred income tax provision /(benefit) 318 - 318 (1,089) - (1,089) Minority interests 313 - 313 (2,801) - (2,801) Depreciation and amortization 6,107 8,119 14,226 6,405 6,682 13,087 Amortization of loan costs from discontinued operations - 12 12 - - - Amortization of loan costs 163 770 933 261 610 871 Non-cash compensation expense 1,777 - 1,777 2,174 - 2,174 Straight-line rent adjustments 2,920 (1,836) 1,084 2,752 (1,256) 1,496 Fair market value of rent adjustments (4) (407) (411) (236) 10 (226) ATCF $ 11,989 $ 6,658 $ 18,647 $ 5,702 $ 6,046 $ 11,748
TPGI share of ATCF (1) $ 6,110 $ 3,393 $ 9,503 $ 2,598 $ 2,756 $ 5,354
ATCF per share – basic $ 0.54 $ 0.37
ATCF per share – diluted $ 0.54 $ 0.37
Weighted average common shares outstanding - basic 17,468,385 14,328,162
Weighted average common shares outstanding - diluted 17,531,688 14,338,810 (1) Based on a weighted average interest in our operating partnership of 50.96% and 45.57% for the six months ended June 30, 2007 and 2006, respectively.
Thomas Properties Group, Inc. Supplemental Financial Information
15
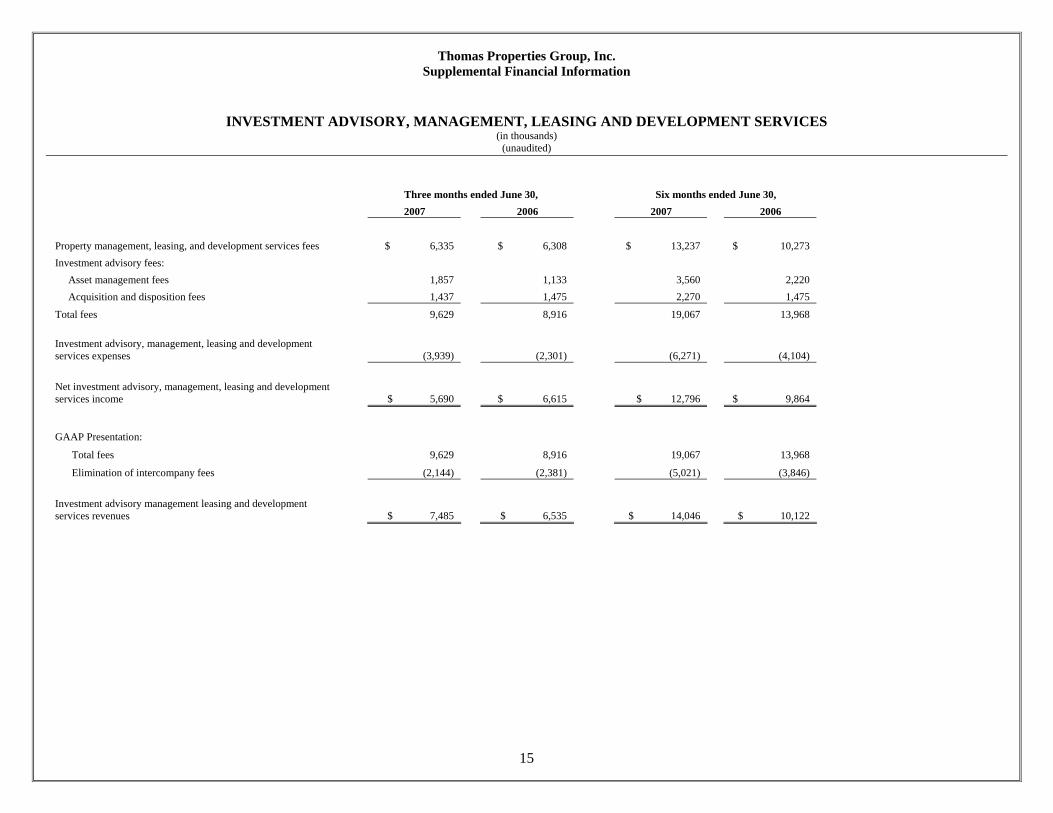
INVESTMENT ADVISORY, MANAGEMENT, LEASING AND DEVELOPMENT SERVICES
(in thousands) (unaudited)
Three months ended June 30, Six months ended June 30, 2007 2006 2007 2006 Property management, leasing, and development services fees $ 6,335 $ 6,308 $ 13,237 $ 10,273 Investment advisory fees: Asset management fees 1,857 1,133 3,560 2,220 Acquisition and disposition fees 1,437 1,475 2,270 1,475
Total fees 9,629 8,916 19,067 13,968 Investment advisory, management, leasing and development services expenses (3,939) (2,301) (6,271) (4,104)
Net investment advisory, management, leasing and development services income $ 5,690 $ 6,615 $ 12,796 $ 9,864
GAAP Presentation:
Total fees 9,629 8,916 19,067 13,968
Elimination of intercompany fees (2,144) (2,381) (5,021) (3,846)
Investment advisory management leasing and development services revenues $ 7,485 $ 6,535 $ 14,046 $ 10,122

Thomas Properties Group, Inc. Supplemental Financial Information
16
PORTFOLIO DATA as of June 30, 2007 Our Ownership Properties
Location
TPGI Percentage
Interest
RentableSquareFeet (1)
Percent Leased
Estimated Year
Stabilized (2)
Estimated
Stabilized Net Operating
Income (NOI) (3)
Expected Capital
Expenditures to Complete
Stabilization (4)
Loan Balance at June 30, 2007
Consolidated properties: One Commerce Square Philadelphia, PA 89.0% (5) 942,866 95.8 % N/A $ 12,827,000 N/A $ 130,000,000Two Commerce Square Philadelphia, PA 89.0 (5) 953,276 99.8 N/A
14,523,000(6)
N/A 154,538,000
Total/Weighted Average: 1,896,142 97.8 % $ 27,350,000 $ 284,538,000
Unconsolidated properties:
2121 Market Street (7) Philadelphia, PA 50.0% 22,135 100.0 % N/A $ 2,183,000 $ N/A $ 19,261,000Reflections I Reston, VA 25.0 123,546 100.0 N/A 2,782,000 N/A 22,699,000Reflections II Reston, VA 25.0 64,253 100.0 N/A 1,508,000 N/A 9,457,0002500 City West Houston, TX 25.0 578,284 92.7 N/A 7,124,000 N/A 77,104,000Fair Oaks Plaza Fairfax, VA 25.0 179,688 92.1 N/A 2,769,000 N/A 44,300,000City National Plaza Los Angeles, CA 21.3 2,496,084 75.3 2009 61,657,000 111,555,000 498,778,000Four Falls Corporate Center Conshohocken, PA 25.0 253,985 78.7 2008 4,928,000 3,447,000 52,067,000Oak Hill Plaza Wayne/King of Prussia, PA 25.0 164,360 92.9 2009 2,458,000 869,000 44,452,000Walnut Hill Plaza Wayne/King of Prussia, PA 25.0 150,573 74.9 2009 1,817,000 1,633,000 - (8)San Felipe Plaza Houston, TX 25.0 980,472 97.1 2007 12,994,000 4,789,000 106,990,000Brookhollow Central I, II and III Houston, TX 25.0 804,181 50.8 2009 8,228,000 34,001,000 40,900,000CityWestPlace Houston, TX 25.0 1,473,020 98.5 2007 22,993,000 3,453,000 206,699,000Centerpointe I, II Fairfax, VA 25.0 421,651 96.3 2010 9,139,000 22,899,000 91,000,000San Jacinto Center Austin, TX 6.3 403,329 93.3 2009 6,950,000 7,363,000 101,000,000Frost Bank Tower Austin, TX 6.3 530,533 81.6 2009 11,791,000 8,360,000 150,000,000One Congress Plaza Austin, TX 6.3 517,849 83.7 2009 8,507,000 6,855,000 128,000,000One American Center Austin, TX 6.3 505,770 79.5 2009 8,939,000 7,579,000 120,000,000300 W. 6th Austin, TX 6.3 446,637 84.2 2009 9,883,000 5,636,000 127,000,000Research Park Plaza I & II Austin, TX 6.3 271,882 86.5 2009 4,681,000 1,999,000 51,500,000Park 22 I-III Austin, TX 6.3 203,716 88.2 2009 2,035,000 2,528,000 (9)Great Hills Plaza Austin, TX 6.3 135,333 86.4 2009 2,289,000 2,395,000 (9)Stonebridge Plaza II Austin, TX 6.3 193,131 98.1 2009 2,984,000 776,000 37,500,000Westech 360 I-IV Austin, TX 6.3 178,777 83.8 2009 2,913,000 3,573,000 (9) Total/Weighted Average: 11,099,189 84.4 % $ 201,552,000 $ 229,710,000$ 1,928,707,000
(1) Total portfolio square footage includes office properties and mixed-use space (including retail), but excludes 168 apartment units at 2121 Market Street. (2) For properties under renovation, represents the year in which stabilization, or 93% occupancy, is expected to occur.

Thomas Properties Group, Inc. Supplemental Financial Information
17
PORTFOLIO DATA as of June 30, 2007 - continued
(3) For properties stabilized as of June 30, 2007, estimated stabilized net operating income (NOI) represents the expected annualized NOI as of June 30, 2007. For properties expected to become
stabilized in future years, estimated stabilized NOI represents the sum of i) the annualized straight-line rent under existing leases which will be in place in the year the properties are stabilized, calculated as if the leases began in the year of stabilization; ii) the annualized expected straight-line market rent for the remaining space (up to the stabilized occupancy percentage); and iii) estimated parking and other income, less estimated operating expenses.
(4) For properties under renovation, represents the capital expenditures, including tenant improvements and leasing commissions, expected to be spent to complete the stabilization of the property. (5) TPGI has an option to purchase the remaining 11% interests in One Commerce Square and Two Commerce Square for a maximum price of $4 million that we expect to exercise following
October 2007. (6) A major lease at Two Commerce Square which expires in 2008 and 2009 is at rates that are above market rates. The estimated stabilized NOI above does not include the over-market rental
amount. The estimated present value of the over-market rent as of June 30, 2007 is approximately $16,374,000. (7) The square footage, occupancy and NOI information presented for 2121 Market Street represents the information for two retail/office tenants only, and excludes the 168 residential units
comprising 132,823 square feet. (8) Oak Hill Plaza and Walnut Hill Plaza are co-borrowers under a loan agreement. The loan balance for this property is included with the Oak Hill Plaza loan balance. (9) Three of our Austin, Texas properties collectively secure a bank term loan in the aggregate amount of $192.5 million. Lease Expirations
YearExpiring Rentable
Square Feet
Annualized Rent Per
Leased Square Foot
Annualized Rent Per
Leased Square Foot at
Expiration YearExpiring Rentable
Square Feet
Annualized Rent Per
Leased Square Foot
Annualized Rent Per
Leased Square Foot at
Expiration YearExpiring Rentable
Square Feet
Annualized Rent Per
Leased Square Foot
Annualized Rent Per
Leased Square Foot at
ExpirationVacant 41,463 Vacant 1,733,772 Vacant 318,0032007 54,413 17.85$ 17.88$ 2007 692,488 14.85$ 14.78$ 2007 142,120 14.78$ 14.73$ 2008 301,014 23.87 24.05 2008 683,033 13.52 15.05 2008 110,799 12.41 14.19 2009 84,249 25.18 14.76 2009 675,360 16.35 17.01 2009 132,790 16.85 17.51 2010 74,764 29.75 19.37 2010 665,949 12.12 13.14 2010 103,243 11.88 12.88 2011 111,538 15.97 15.79 2011 729,312 14.98 18.48 2011 120,747 14.42 18.42 Thereafter 1,228,701 19.96 21.03 Thereafter 5,919,275 11.65 19.49 Thereafter 1,126,199 10.12 19.16 Total 1,896,142 Total 11,099,189 Total 2,053,901
Consolidated Properties' Lease Expirations Unconsolidated Properties' Lease ExpirationsTPGI Percentage Interest in Unconsolidated Properties' Lease
Expirations
Thomas Properties Group, Inc. Supplemental Financial Information
18
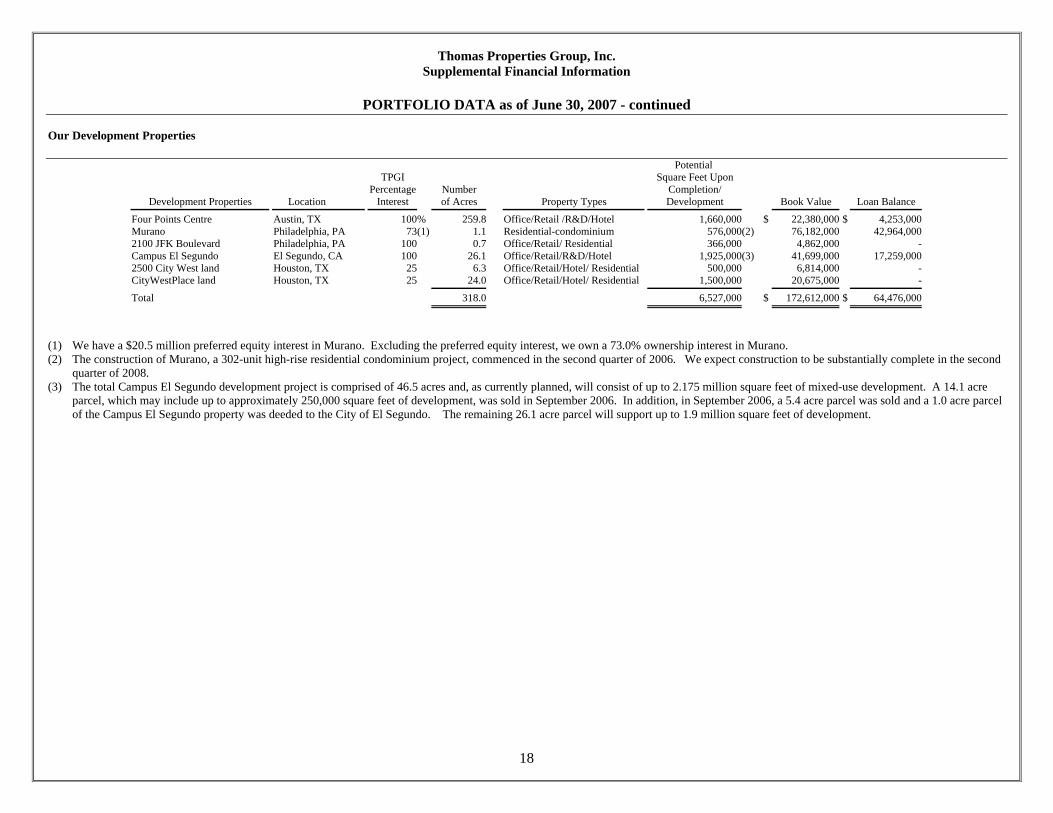
PORTFOLIO DATA as of June 30, 2007 - continued Our Development Properties
Development Properties
Location
TPGI Percentage
Interest
Numberof Acres
Property Types
Potential Square Feet Upon
Completion/ Development
Book Value
Loan Balance
Four Points Centre Austin, TX 100% 259.8 Office/Retail /R&D/Hotel 1,660,000 $ 22,380,000 $ 4,253,000Murano Philadelphia, PA 73(1) 1.1 Residential-condominium 576,000(2) 76,182,000 42,964,0002100 JFK Boulevard Philadelphia, PA 100 0.7 Office/Retail/ Residential 366,000 4,862,000 -Campus El Segundo El Segundo, CA 100 26.1 Office/Retail/R&D/Hotel 1,925,000(3) 41,699,000 17,259,0002500 City West land Houston, TX 25 6.3 Office/Retail/Hotel/ Residential 500,000 6,814,000 -CityWestPlace land Houston, TX 25 24.0 Office/Retail/Hotel/ Residential 1,500,000 20,675,000 - Total 318.0 6,527,000 $ 172,612,000 $ 64,476,000
(1) We have a $20.5 million preferred equity interest in Murano. Excluding the preferred equity interest, we own a 73.0% ownership interest in Murano. (2) The construction of Murano, a 302-unit high-rise residential condominium project, commenced in the second quarter of 2006. We expect construction to be substantially complete in the second
quarter of 2008. (3) The total Campus El Segundo development project is comprised of 46.5 acres and, as currently planned, will consist of up to 2.175 million square feet of mixed-use development. A 14.1 acre
parcel, which may include up to approximately 250,000 square feet of development, was sold in September 2006. In addition, in September 2006, a 5.4 acre parcel was sold and a 1.0 acre parcel of the Campus El Segundo property was deeded to the City of El Segundo. The remaining 26.1 acre parcel will support up to 1.9 million square feet of development.
Thomas Properties Group, Inc. Supplemental Financial Information
19
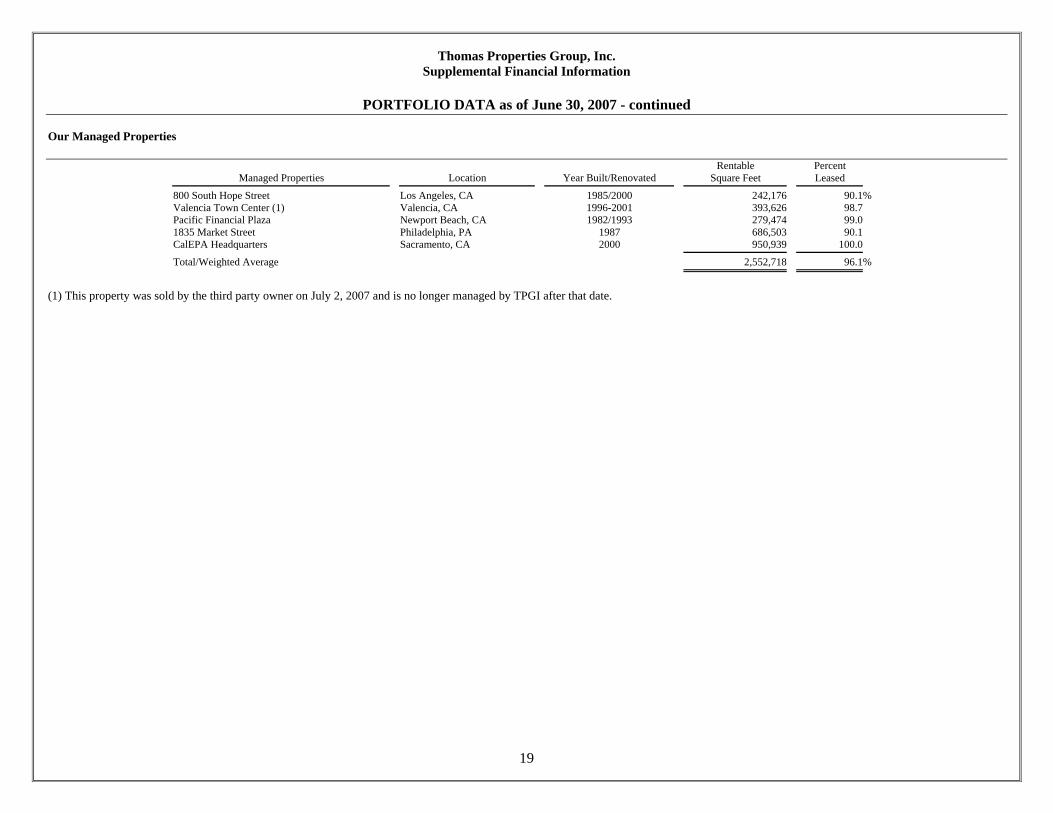
PORTFOLIO DATA as of June 30, 2007 - continued Our Managed Properties
Managed Properties
Location
Year Built/Renovated
Rentable Square Feet
Percent Leased
800 South Hope Street Los Angeles, CA 1985/2000 242,176 90.1% Valencia Town Center (1) Valencia, CA 1996-2001 393,626 98.7 Pacific Financial Plaza Newport Beach, CA 1982/1993 279,474 99.0 1835 Market Street Philadelphia, PA 1987 686,503 90.1 CalEPA Headquarters Sacramento, CA 2000 950,939 100.0 Total/Weighted Average 2,552,718 96.1%
(1) This property was sold by the third party owner on July 2, 2007 and is no longer managed by TPGI after that date.
Thomas Properties Group, Inc. Supplemental Financial Information
20
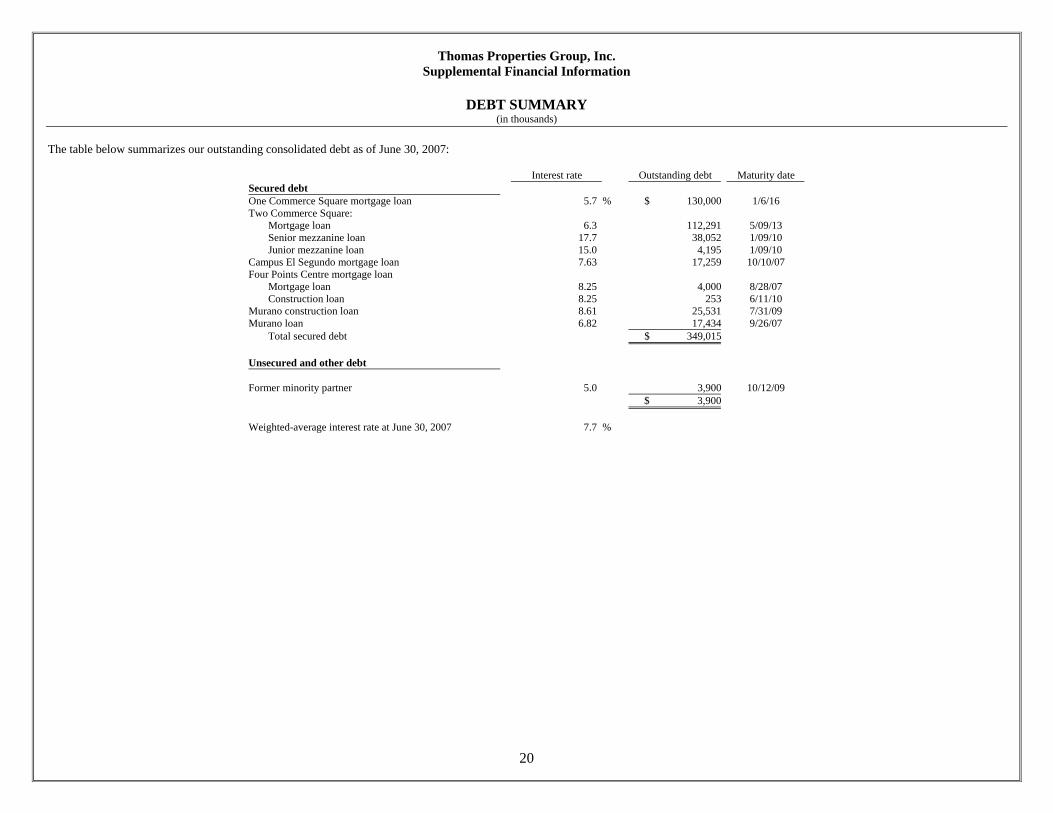
DEBT SUMMARY (in thousands)
The table below summarizes our outstanding consolidated debt as of June 30, 2007:
Interest rate Outstanding debt Maturity date Secured debt One Commerce Square mortgage loan 5.7 % $ 130,000 1/6/16 Two Commerce Square:
Mortgage loan 6.3 112,291 5/09/13 Senior mezzanine loan 17.7 38,052 1/09/10 Junior mezzanine loan 15.0 4,195 1/09/10
Campus El Segundo mortgage loan 7.63 17,259 10/10/07 Four Points Centre mortgage loan
Mortgage loan 8.25 4,000 8/28/07 Construction loan 8.25 253 6/11/10
Murano construction loan 8.61 25,531 7/31/09 Murano loan 6.82 17,434 9/26/07
Total secured debt $ 349,015
Unsecured and other debt Former minority partner 5.0 3,900 10/12/09 $ 3,900 Weighted-average interest rate at June 30, 2007 7.7 %
Thomas Properties Group, Inc. Supplemental Financial Information
21
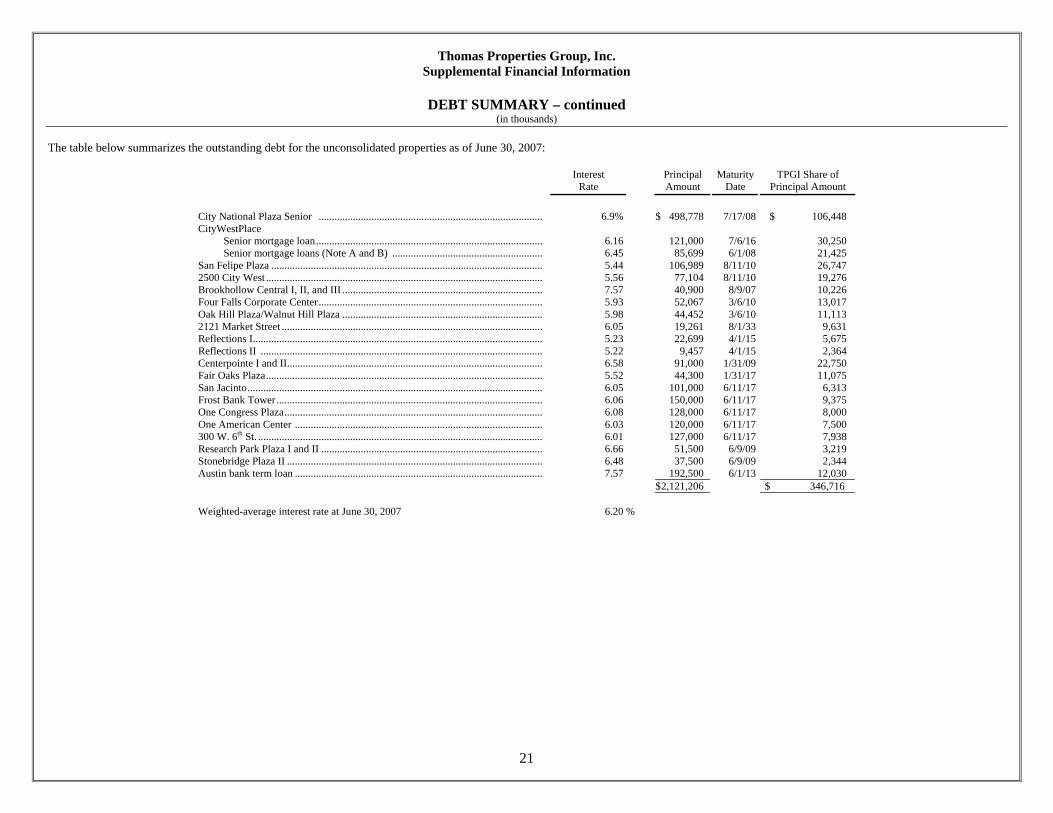
DEBT SUMMARY – continued (in thousands)
The table below summarizes the outstanding debt for the unconsolidated properties as of June 30, 2007:
Interest Rate
PrincipalAmount
MaturityDate
TPGI Share of Principal Amount
City National Plaza Senior ...................................................................................... 6.9% $ 498,778 7/17/08 $ 106,448 CityWestPlace
Senior mortgage loan....................................................................................... 6.16 121,000 7/6/16 30,250 Senior mortgage loans (Note A and B) .......................................................... 6.45 85,699 6/1/08 21,425
San Felipe Plaza ........................................................................................................ 5.44 106,989 8/11/10 26,747 2500 City West .......................................................................................................... 5.56 77,104 8/11/10 19,276 Brookhollow Central I, II, and III ............................................................................. 7.57 40,900 8/9/07 10,226 Four Falls Corporate Center...................................................................................... 5.93 52,067 3/6/10 13,017 Oak Hill Plaza/Walnut Hill Plaza ............................................................................. 5.98 44,452 3/6/10 11,113 2121 Market Street .................................................................................................... 6.05 19,261 8/1/33 9,631 Reflections I............................................................................................................... 5.23 22,699 4/1/15 5,675 Reflections II ............................................................................................................ 5.22 9,457 4/1/15 2,364 Centerpointe I and II.................................................................................................. 6.58 91,000 1/31/09 22,750 Fair Oaks Plaza.......................................................................................................... 5.52 44,300 1/31/17 11,075 San Jacinto................................................................................................................. 6.05 101,000 6/11/17 6,313 Frost Bank Tower...................................................................................................... 6.06 150,000 6/11/17 9,375 One Congress Plaza................................................................................................... 6.08 128,000 6/11/17 8,000 One American Center ............................................................................................... 6.03 120,000 6/11/17 7,500 300 W. 6th St. ............................................................................................................. 6.01 127,000 6/11/17 7,938 Research Park Plaza I and II ..................................................................................... 6.66 51,500 6/9/09 3,219 Stonebridge Plaza II .................................................................................................. 6.48 37,500 6/9/09 2,344 Austin bank term loan ............................................................................................... 7.57 192,500 6/1/13 12,030
$2,121,206
$ 346,716
Weighted-average interest rate at June 30, 2007 6.20 %

Thomas Properties Group, Inc. Supplemental Financial Information
22
CAPITAL STRUCTURE (in thousands, except share data)
The following is the capital structure of TPGI as of June 30, 2007:
Debt Aggregate Principal Mortgage loans $ 263,550 Other loans 89,365 Total consolidated debt 352,915 Company share of unconsolidated debt 346,716 Total combined debt $ 699,631
Equity Shares/Units Outstanding Market Value (1)
Common stock 23,747,936 $ 379,492 Operating partnership units 15,485,002 247,450 Total common equity 39,232,938 $ 626,942
Total consolidated market capitalization $ 979,857
Total combined market capitalization (2) $ 1,326,573
_________ (1) Based on the closing price of $15.98 per share of TPGI common stock on June 30, 2007. (2) Includes TPGI’s share of debt of unconsolidated real estate entities.

Thomas Properties Group, Inc. Supplemental Financial Information
23
OTHER INFORMATION Principal Corporate Office Thomas Properties Group, Inc. 515 South Flower Street Sixth Floor Los Angeles, CA 90071 Phone: (213) 613-1900 Fax: (213) 633-4760 www.tpgre.com The information contained on our website is not incorporated herein by reference and does not constitute a part of this supplemental financial information. Investor Relations Transfer Agent and Registrar Stock Market Listing Diana M. Laing Computershare Trust Company NASDAQ: TPGI Chief Financial Officer P.O. Box 43023 515 South Flower Street Providence, RI 02940-3023 Sixth Floor Phone: (781) 575-2879 Los Angeles, CA 90071 Phone: (213) 613-1900 E-mail: [email protected] Board of Directors and Executive Officers James A. Thomas Chairman, President and CEO Randall L. Scott Executive Vice President, Director John R. Sischo Executive Vice President, Director Thomas S. Ricci Executive Vice President Diana M. Laing Chief Financial Officer and Secretary Robert D. Morgan Senior Vice President, Accounting and Administration R. Bruce Andrews Director Edward D. Fox Director John L. Goolsby Director Winston H. Hickox Director