thomas p. rutten6 design and construction of the high power laser head 81 ... alex d, damian m,...
TRANSCRIPT

1064 nm injection mode-locked Nd:YAG laser
optimized for guide star applications
by
Thomas P. Rutten
Thesis submitted for the degree of
Doctor of Philosophy
in
the University of Adelaide
Department of Physics
December, 2009

2

Contents
1 Adaptive optics systems for astronomy 1
1.1 Introduction . . . . . . . . . . . . . . . . . . . . . . . . . . . . . . . . . . . 1
1.2 Conventional single-conjugate adaptive optics systems . . . . . . . . . . . . 3
1.3 Artificial guide stars . . . . . . . . . . . . . . . . . . . . . . . . . . . . . . 5
1.3.1 Rayleigh guide stars . . . . . . . . . . . . . . . . . . . . . . . . . . 5
1.3.2 Sodium guide stars . . . . . . . . . . . . . . . . . . . . . . . . . . . 6
1.4 Adaptive optics systems for future large-aperture observatories . . . . . . . 8
1.4.1 Multiple beacons for atmospheric tomography . . . . . . . . . . . . 8
1.4.2 Gemini guide star requirements for MCAO on ELTs . . . . . . . . . 8
1.5 This thesis . . . . . . . . . . . . . . . . . . . . . . . . . . . . . . . . . . . . 12
2 Injection mode-locked guide star laser design 15
2.1 Introduction . . . . . . . . . . . . . . . . . . . . . . . . . . . . . . . . . . . 15
2.2 Guide star system design overview . . . . . . . . . . . . . . . . . . . . . . . 15
2.3 Injection mode-locking . . . . . . . . . . . . . . . . . . . . . . . . . . . . . 17
2.3.1 Objective . . . . . . . . . . . . . . . . . . . . . . . . . . . . . . . . 17
2.3.2 Mode-locking of laser resonators . . . . . . . . . . . . . . . . . . . . 17
2.3.3 Injection mode-locking . . . . . . . . . . . . . . . . . . . . . . . . . 19
2.3.4 Conclusion . . . . . . . . . . . . . . . . . . . . . . . . . . . . . . . . 24
2.4 Slave resonator design . . . . . . . . . . . . . . . . . . . . . . . . . . . . . 24
2.4.1 Introduction . . . . . . . . . . . . . . . . . . . . . . . . . . . . . . . 24
2.4.2 Travelling wave ring resonator design . . . . . . . . . . . . . . . . . 24
2.4.3 Conclusion . . . . . . . . . . . . . . . . . . . . . . . . . . . . . . . . 26
2.5 High power sum frequency generation . . . . . . . . . . . . . . . . . . . . . 27
2.5.1 Introduction . . . . . . . . . . . . . . . . . . . . . . . . . . . . . . . 27
2.5.2 Theory of SFG . . . . . . . . . . . . . . . . . . . . . . . . . . . . . 28
2.5.3 Evaluation of common SFG materials . . . . . . . . . . . . . . . . . 29
2.5.4 Estimation of SFG conversion efficiency for LBO . . . . . . . . . . . 31
i

ii CONTENTS
2.6 Power scaling . . . . . . . . . . . . . . . . . . . . . . . . . . . . . . . . . . 34
2.6.1 Design options . . . . . . . . . . . . . . . . . . . . . . . . . . . . . 34
2.6.2 Master oscillator power amplifiers . . . . . . . . . . . . . . . . . . . 35
2.7 Comments 1319 nm lasers . . . . . . . . . . . . . . . . . . . . . . . . . . . 35
2.8 Frequency locking to the sodium line . . . . . . . . . . . . . . . . . . . . . 36
2.9 Conclusions . . . . . . . . . . . . . . . . . . . . . . . . . . . . . . . . . . . 38
3 Design verification experiments using a subscale, 1064 nm Nd:YAG
laser 39
3.1 Objective . . . . . . . . . . . . . . . . . . . . . . . . . . . . . . . . . . . . 39
3.2 Laser head . . . . . . . . . . . . . . . . . . . . . . . . . . . . . . . . . . . . 40
3.3 Slave resonator design details . . . . . . . . . . . . . . . . . . . . . . . . . 41
3.3.1 Resonator stability . . . . . . . . . . . . . . . . . . . . . . . . . . . 43
3.3.2 Intra-cavity telescopes . . . . . . . . . . . . . . . . . . . . . . . . . 45
3.4 Seed pulse generator . . . . . . . . . . . . . . . . . . . . . . . . . . . . . . 46
3.5 Q-switch driver . . . . . . . . . . . . . . . . . . . . . . . . . . . . . . . . . 47
3.6 Injection mode-locked slave laser performance . . . . . . . . . . . . . . . . 50
3.6.1 Aligning the ring oscillator . . . . . . . . . . . . . . . . . . . . . . . 50
3.6.2 Pulse energy . . . . . . . . . . . . . . . . . . . . . . . . . . . . . . . 50
3.6.3 Micro-pulse jitter . . . . . . . . . . . . . . . . . . . . . . . . . . . . 51
3.6.4 Bandwidth control . . . . . . . . . . . . . . . . . . . . . . . . . . . 52
3.7 Discussion and conclusions . . . . . . . . . . . . . . . . . . . . . . . . . . . 56
4 Q-switched pulse stretching 59
4.1 Introduction . . . . . . . . . . . . . . . . . . . . . . . . . . . . . . . . . . . 59
4.2 Experimental set-up . . . . . . . . . . . . . . . . . . . . . . . . . . . . . . 60
4.3 Numerical modelling of pulse stretching . . . . . . . . . . . . . . . . . . . . 62
4.4 Q-switch driver . . . . . . . . . . . . . . . . . . . . . . . . . . . . . . . . . 68
4.5 Results . . . . . . . . . . . . . . . . . . . . . . . . . . . . . . . . . . . . . . 69
4.6 Discussion and conclusions . . . . . . . . . . . . . . . . . . . . . . . . . . . 72
5 High power laser head design choice 73
5.1 Background . . . . . . . . . . . . . . . . . . . . . . . . . . . . . . . . . . . 73
5.2 Objective . . . . . . . . . . . . . . . . . . . . . . . . . . . . . . . . . . . . 73
5.3 Laser head requirements . . . . . . . . . . . . . . . . . . . . . . . . . . . . 74
5.4 Thermal effects in high power lasers . . . . . . . . . . . . . . . . . . . . . . 74
5.4.1 Thermal lensing . . . . . . . . . . . . . . . . . . . . . . . . . . . . . 75

CONTENTS iii
5.4.2 Thermal stress and thermal birefringence . . . . . . . . . . . . . . . 75
5.5 Rod lasers . . . . . . . . . . . . . . . . . . . . . . . . . . . . . . . . . . . . 76
5.6 Slab lasers . . . . . . . . . . . . . . . . . . . . . . . . . . . . . . . . . . . . 77
5.7 Design choice . . . . . . . . . . . . . . . . . . . . . . . . . . . . . . . . . . 79
5.8 Conclusions . . . . . . . . . . . . . . . . . . . . . . . . . . . . . . . . . . . 80
6 Design and construction of the high power laser head 81
6.1 Introduction . . . . . . . . . . . . . . . . . . . . . . . . . . . . . . . . . . . 81
6.2 Design summary . . . . . . . . . . . . . . . . . . . . . . . . . . . . . . . . 82
6.3 Laser slab design . . . . . . . . . . . . . . . . . . . . . . . . . . . . . . . . 83
6.3.1 Slab height . . . . . . . . . . . . . . . . . . . . . . . . . . . . . . . 83
6.3.2 Slab width . . . . . . . . . . . . . . . . . . . . . . . . . . . . . . . . 87
6.3.3 Slab length . . . . . . . . . . . . . . . . . . . . . . . . . . . . . . . 92
6.3.4 Parasitic oscillation control . . . . . . . . . . . . . . . . . . . . . . . 92
6.4 Laser head construction . . . . . . . . . . . . . . . . . . . . . . . . . . . . 92
6.4.1 Laser pump modules . . . . . . . . . . . . . . . . . . . . . . . . . . 92
6.4.2 Teflon coating . . . . . . . . . . . . . . . . . . . . . . . . . . . . . . 96
6.5 Conclusions . . . . . . . . . . . . . . . . . . . . . . . . . . . . . . . . . . . 99
7 Performance of the high power 1064 nm laser 101
7.1 Introduction . . . . . . . . . . . . . . . . . . . . . . . . . . . . . . . . . . . 101
7.2 Pump laser performance . . . . . . . . . . . . . . . . . . . . . . . . . . . . 102
7.2.1 QCW laser diode arrays . . . . . . . . . . . . . . . . . . . . . . . . 102
7.2.2 Laser diode drivers . . . . . . . . . . . . . . . . . . . . . . . . . . . 102
7.2.3 Water cooling system . . . . . . . . . . . . . . . . . . . . . . . . . . 103
7.2.4 Interlock system . . . . . . . . . . . . . . . . . . . . . . . . . . . . . 105
7.2.5 Performance of individual laser diode arrays . . . . . . . . . . . . . 105
7.2.6 Total pump power and absorbed pump power . . . . . . . . . . . . 106
7.3 Multi-mode performance of the high power laser head . . . . . . . . . . . . 108
7.3.1 The Mach-Zender interferometer . . . . . . . . . . . . . . . . . . . . 109
7.3.2 Measurement of thermal focal power using a tilted wavefront . . . . 113
7.4 Injection mode-locked laser performance . . . . . . . . . . . . . . . . . . . 115
7.4.1 Resonator design . . . . . . . . . . . . . . . . . . . . . . . . . . . . 115
7.4.2 Injection mode-locked laser power at 800 Hz PRF . . . . . . . . . . 117
7.4.3 Reproducibily of slab mounting . . . . . . . . . . . . . . . . . . . . 117
7.4.4 Q-switched pulse stretching . . . . . . . . . . . . . . . . . . . . . . 119
7.4.5 Beam quality measurement . . . . . . . . . . . . . . . . . . . . . . 120

iv CONTENTS
7.4.6 Laser bandwidth measurements . . . . . . . . . . . . . . . . . . . . 122
7.5 Conclusions . . . . . . . . . . . . . . . . . . . . . . . . . . . . . . . . . . . 124
8 Conclusions 129
A Publications 133
B Zero jitter picosecond delay generator 157
C High voltage high bandwidth attenuator 159
D Pulse stretching model parameters 163
E Laser slab and waveguide schematic diagrams 165

CONTENTS v
Abstract
In recent years, the emergence of powerful, sodium-resonant laser sources has led to a
dramatic improvement in resolution at many of the world’s large aperture observatories.
The lasers are used to create artificial beacons (or guide stars) by fluorescing atmospheric
sodium. Light from the beacon, returning from altitude, probes the intervening turbu-
lence and the phase distortions detected are subsequently corrected using adaptive optics.
Near-diffraction limited imaging has now been achieved on observatories with diameters
up to 8 m using this technique. Future 30-100 m diameter telescopes will require new
laser sources having higher average powers and innovative pulse formats to implement
new forms of atmospheric tomography and correction. In this thesis I present the design
and development of a new laser system for this purpose.
The laser design that I describe uses sum frequency generation (SFG) of 1064 nm
and 1319 nm Nd:YAG lasers to produce the sodium wavelength, and introduces the novel
application of injection mode-locking as a robust method to control the lasers wavelength
and bandwidth. The high peak power and low timing jitter of the mode-locked (micro)
pulses allows for efficient SFG of the 1064 and 1319 nm beams. Each slave laser is Q-
switched and the duration of the Q-switched (macro) pulses are optimised to reduce star
elongation and bleaching of the sodium.
The experimental work presented in this thesis is focused on the realization of a
1064 nm injection mode-locked slave laser, whose performance is optimised for use in
the SFG guide star system. The work can be roughly divided into two sections. Firstly,
results are presented from a low average power proof of principle laser which was used for
risk reduction experiments, then secondly, a higher average power laser using a new laser
head design is presented.
With the proof of concept laser it is shown that the injection mode-locking technique
is robust and can be used to generate an ideal pulse burst with both wavelength and
bandwidth control. A new method of Q-switched pulse stretching was implemented and
the results show that the Q-switched pulses can be extended by a factor of 4.5 without a
reduction in pulse energy.
The later part of the experimental work consists of a description of the design, con-
struction and testing of a new high average power laser head used to generate the power
levels required for the final guide star system. The laser head uses a zigzag Nd:YAG slab,
pumped from each side by high average power laser diode arrays. This laser is shown to
be capable of generating one of the highest average powers reported in the literature for
an electro-optically Q-switched, diffraction limited Nd:YAG laser in a stable cavity.

vi CONTENTS

CONTENTS vii
This work contains no material which has been accepted for the award of any other degree
or diploma in any university or other tertiary institution to Thomas Rutten and, to the
best of my knowledge and belief, contains no material previously published or written by
another person, except where due reference has been made in the text.
I give consent to this copy of my thesis when deposited in the University Library, being
made available for loan and photocopying, subject to the provisions of the Copyright Act
1968. The author acknowledges that copyright of published works contained within this
thesis (as listed below) resides with the copyright holder(s) of those works.
I also give permission for the digital version of my thesis to be made available on
the web, via the Universitys digital research repository, the Library catalogue, the Aus-
tralasian Digital Theses Program (ADTP) and also through web search engines, unless
permission has been granted by the University to restrict access for a period of time.
Publications resulting from this work: T. P. Rutten, P. J. Veitch, C. d’Orgeville and J. Munch, “Injection mode-locked
guide star laser concept and design verification experiments,” Opt. Express vol. 15
(5), pp. 2369-2374 Mar. 2007. T. P. Rutten, N. Wild and P. J. Veitch, “Fast rise time, long pulse width, kilohertz
repetition rate Q-switch driver,” Rev. Sci. Instrum. vol. 78, 073108 Jun. 2007. T. P. Rutten, P. J. Veitch and J. Munch, “Efficient pulse stretching of Q-switched
lasers,” IEEE J. Quantum Electron. vol. 44 (10), pp. 911-915 Oct. 2008. J. Munch, T. P. Rutten, N. Simakov, M. Hamilton, C. d’Orgeville and P. Veitch,
“A new guide star laser using optimized injection mode-locking,” Proc. SPIE, vol.
7015, June 2008
SIGNED: ..................................................
DATE: .....................
Supervisors: Prof. J. Munch and A/Prof. P. Veitch

viii CONTENTS

CONTENTS ix
Acknowledgments
It is tough road to travel when undertaking a PhD. When I first started, I stood back
and observed what seemed to be an impenetrable wilderness, with tangled undergrowth
and dangerous creatures lurking within. My supervisors, Jesper and Peter were the first
to show me where I had to go. They pointed to a region far on the horizon and, with
promises of great rewards and adventure, they showed me the direction in which to travel
and set me upon the road to completion. Thank you Jesper and Peter for your guidance
and support, without your help I would surely have been lost along the way.
To my colleagues in the optics group: Alex H, Alex D, Damian M, David H, Francois,
Keiron, Nikita, Miftar, Nick, Sean, Shu, Aidan, Mathew and Ka, you provided so much
helpful advice, thankyou for your assistance and for providing a place to rest where I
could forget about work and relax.
Damien, Murray and Dave O., we had many helpful discussions and you contributed
a great deal to the solution of many important problems I faced.
I would also like to thank all the technical staff who provided assistance with this
project. Neville, I am deeply indebted to you for being so generous with your time and
for having the patience to teach me. To Blair and Trevor, your assistance in the workshop
was essential and without your assistance I could not have progressed. I also thank the
two Bobs and Peter A. for the excellent contributions and advice you gave.
To Eva and my colleagues at the RAH, your encouragement and support while writing
was greatly appreciated.
I would like to thank the Gemini Observatory for providing funding for this work and
Northrop Grumman for the loan of vital hardware.
Lastly I would like to thank my Family and friends. You provided the personal support
and encouragement I needed to stick to my goals and keep going when times were tough.
Thank you.

x CONTENTS

Chapter 1
Adaptive optics systems for
astronomy
1.1 Introduction
Were it not for the last millisecond of its long journey through space, the light from
distant stars, emitted some millions of years earlier, would descend upon the Earths
surface in perfect plane waves and be focused by our telescopes with diffraction limited
resolution. In that last millisecond, unfortunately, the light must pass through a thin
but turbulent atmosphere, whose constant motions convey a time varying phase shift to
wavefronts of passing light. The distortion in phase is only small, around 2 wavelengths
pk-pk at 2 µm over an 8 m aperture [1], but this slight change is enough to blur the
images of ground based telescopes. A consequence of this effect is that there is a limit
to the maximum resolution achievable by ground based telescopes that is independent of
the telescope diameter. If there were no atmospheric turbulence, the angular resolution
θ of a diffraction limited telescope would scale as the inverse of the telescope diameter,
D, according to the well known formula 1.22λ/D, but in the presence of turbulence,
the maximum resolution is limited by the “seeing” of the atmosphere and is given by
θ = 1.22λ/r0, where r0 is Fried’s coherence length and is a measure of the seeing at a
specific location [2]. For this reason, many of the world’s best observatories are located
atop tall mountains where the thinner air affords better seeing. But even at the best
locations, such as Mauna Kea in Hawaii, the Fried’s parameter is typically around 10-
20 cm [3]. This means that a telescope with a diameter larger than this, while providing
an increased capacity to view dim objects, will not have any improvement in resolution
unless, of course, the telescope mirror is actively compensated for the turbulence using
adaptive optics.
1

2 CHAPTER 1. ADAPTIVE OPTICS SYSTEMS FOR ASTRONOMY
without adaptive optics with adaptive optics
Figure 1.1: Image credit: the Gemini Observatory. Dramatic differences in image quality
can be obtained by actively compensating for the effects of atmospheric turbulence using
adaptive optics.
The concept of atmospheric adaptive optics was first proposed by Babcock in 1953 [4]
and later developed by Fried [2], Greenwood [5], Thompson and Gardner [6], Fugate et
al. [7], Primmerman et al. [8] and others. The technique involves measuring the atmo-
spheric distortion by monitoring the phase fronts of light from a reference star (or guide
star) near the science object, computing the amount of compensation required, then ap-
plying this compensation to a deformable telescope mirror to shape the surface to the
conjugate of the incident wavefronts and thereby restore the plane waves of the distant
source for diffraction limited observations. A demonstration of the power of adaptive
optics can be seen in the images of Figure 1.1 which shows the difference in resolution
obtainable by correcting for atmospheric turbulence.
In this chapter an overview of current and future adaptive optics systems is presented,
with a particular emphasis on the laser systems required to generate the reference beacons
for these systems. Current adaptive optics systems are described in Section 1.2 and the
lasers for these systems are presented in Section 1.3. Both Rayleigh and Sodium beacons
are discussed and the present research on Sodium lasers is summarized.
Section 1.4.1 describes the next generation of adaptive optics systems, being planned
for use on future large aperture observatories. The laser systems required by these systems
have yet to be developed. Laser requirements from the Gemini observatory are listed in
Section 1.4.2 and an explanation of the these requirements is given. Finally, in Section 1.5,
an outline of this thesis is presented that describes the work undertaken by the author to
develop a new type of laser system aimed at meeting the Gemini requirements for future

1.2. CONVENTIONAL SINGLE-CONJUGATE ADAPTIVE OPTICS SYSTEMS 3
diffraction limitedimaging
wavefrontsensor
deformablemirror
beamsplitter
Figure 1.2: A simplified diagram of an astronomical adaptive optics system showing the
wavefront sensor, deformable mirror and control system used for correction of atmospheric
turbulence.
large aperture adaptive optics systems.
1.2 Conventional single-conjugate adaptive optics sys-
tems
Single conjugate adaptive optics systems have now been fitted on most of the world’s
large diameter telescopes including Lick, Gemini, Keck, SOR, ESO, Subaru and Mt.
Palomar. Each system has its own particular variations but most conform to the common
generalization depicted in Figure 1.2.
Key components of the system include a wavefront sensor to measure the atmospheric
distortion, a deformable mirror to correct it and a computer system to link the two.
Light from a reference beacon located close to the science object is collected by the tele-
scope primary mirror and directed onto the deformable mirror as shown. The deformable
mirror is usually 10-40 cm in diameter and consists of a thin reflective membrane dis-

4 CHAPTER 1. ADAPTIVE OPTICS SYSTEMS FOR ASTRONOMY
Figure 1.3: A schematic representation of a deformable mirror consisting of a continuous
faceplate sitting atop an array of piezo electric actuators.
tributed over an array of (usually piezo-electric) actuators as shown in Figure 1.3. The
number of actuators in the deformable mirror is a trade-off between the level of correction
required and the corresponding impact on system complexity and budgetary constraints.
The number of actuators used in present systems ranges from around 100 to as many as
1377, used by the ESO.
A Shack-Hartmann wavefront sensor is often used for the wavefront measurements as
these systems provide high signal to noise ratios in low light conditions [9]. A schematic
diagram outlining the principle of this device is shown in Figure 1.4. Incident wavefronts
from the guide star are directed onto an array of lenslets which focus the light into a series
of spots that are detected by a CCD. A computer algorithm is then used to locate the
centroids of the spots. The relative change in spot location represents the slope of the
wavefront incident on each lenslet. By collating the information from each lenslet, the
shape of the entire wavefront can be reconstructed, showing the change in phase caused
by the turbulence. This information is then fed back to the deformable mirror which
adjusts its contour to cancel the changes and generate a near plane wave that is incident
on the sensor.
The success of the adaptive optics system is dependent on having a suitably bright
reference star (magnitude 12 or brighter [10]) within an isoplanatic angle1 of the science
object. This star must be sufficiently bright that enough photons are recorded at the
wavefront sensor to provide a sufficient signal to noise ratio within the time period dictated
by the bandwidth of the adaptive optics system (≈ 1 ms). This represents a major
limitation to systems using natural guide stars, as the number of suitably bright stars is
relatively few, resulting in a sky coverage of less than 1 % [11]. This problem has led to
1The isoplanatic angle is another measure of atmospheric seeing and represents the angle over which
wavefronts can pass through the atmosphere suffering only minimal distortion

1.3. ARTIFICIAL GUIDE STARS 5
Incidentwavefronts
lenslet array
CCDdetector
Figure 1.4: A 2-D view of a Shack-Hartmann interferometer showing the wavefronts
incident on a lenslet array which focus the light into a series of spots read by the detector.
The location of the spot provides information on the slope of the incident wavefront at a
particular lenslet.
the conception of artificial guide stars, created by powerful laser beams directed into the
sky in the vicinity of the science object.
1.3 Artificial guide stars
The first public report detailing the feasibility of generating an artificial guide star using
a laser was published by Foy and Labeyrie in 1985 [12] although credit for the idea has
also been given to Happer and MacDonald from the U.S. Department of Defence for a
confidential military report in 1983 [7]. The first detailed experiments on laser guide stars
were presented by Thompson and Gardner [6] in 1987 before the U.S. Department of De-
fence declassified much of its experimental work into laser guide star systems resulting in
the publication of results from the first adaptive optics system to use an artificial beacon
generated by Rayleigh scatter to compensate for atmospheric distortion in 1991 [7] [8].
Results of the first turbulence measurements using a sodium layer beacon were also re-
leased in 1991 with the report by Humphreys et al. [13]. Rayleigh and sodium guide stars
are both discussed in this section.
1.3.1 Rayleigh guide stars
Rayleigh guide stars are generated by the Rayleigh backscatter from laser light in the lower
atmosphere. The advantage of using this approach is that there is no specific requirement
on the wavelength of the laser source, other than that it should have a short wavelength
(the magnitude of Rayleigh scatter depends inversely on the fourth power of wavelength)

6 CHAPTER 1. ADAPTIVE OPTICS SYSTEMS FOR ASTRONOMY
0
10
20
30
40
50
60
70
80
90km
Rayleighguide star
Sodiumguide star
un-sampledturbulence
Figure 1.5: The low altitude of guide stars generated by Rayleigh scatter results large
sections of the atmosphere that are not sampled. This phenomenon is known as focus
anisoplanatism (or the cone effect) as the beacon is located at a different focus to the
science object. Sodium guide stars ameliorate the problem to a certain extent, but the
field of view is still limited and there are some sections of the atmosphere that cannot
be compensated using a single guide star. This problem gets worse for larger aperture
observatories
so mature and relatively inexpensive laser technology can be used such as frequency
doubled Nd:YAG at 532 nm. A limitation of this technique is that Rayleigh scatter is
primarily concentrated in the lower 20-30 km of the atmosphere where the air is densest,
and the resulting close proximity of the beacon to the telescope means that turbulence
in the upper atmosphere cannot be corrected and the level of image correction reduces
rapidly in regions away from the beacon. This phenomena, known as focus anisoplanatism
or the cone effect (see Figure 1.5), is worse for large aperture observatories.
1.3.2 Sodium guide stars
An improvement on the early Rayleigh guide stars was the shift to sodium guide stars
which rely on resonant excitation of the sodium atoms in the upper atmosphere to generate
the beacon [14]. The high altitude of the sodium layer (90-100 km) provides a reduction

1.3. ARTIFICIAL GUIDE STARS 7
in focus anisoplanatism, but comes with an increase in laser system complexity as the
laser wavelength must be tuned to the exact resonant frequency of sodium (589.159 nm).
Generating light at the sodium wavelength with sufficient power to produce a reference
beacon bright enough to adequately illuminate a wavefront sensor is no trivial task, how-
ever, and numerous laser system designs have been proposed and used to address this
problem.
Current status of sodium guide star laser systems
The first sodium laser guide star adaptive optics system to be used routinely for astro-
nomical imaging was installed on the 3 m Shane telescope at the Lick observatory in
1995 [15] [16]. This system used a pulsed dye laser, initially designed by LLNL for use
in its isotope separation program, which was capable of delivering 20 W of 589 nm laser
power with 100 ns pulses at a repetition rate of 10 kHz. Since this time, research has
moved towards the development of sum frequency Nd:YAG lasers owing to the reliability
and longevity of these lasers. Research was first performed by Jeys et al. [17] who made
use of the fact that, coincidentally, the two strongest laser lines of Nd:YAG (1064 nm and
1319 nm) can be combined to produce the exact resonance frequency of sodium by sum
frequency generation (1/1064 + 1/1319 = 1/589). This approach has been used by other
authors, including Denman et al. [18], who generated a 50 W cw beacon for the SOR
observatory, Tracy et al. [19] who produced 12 W of cw mode-locked light for the Gemini
North observatory and Jeys et al. [17] who, together with Kibblewhite et al. [20], devel-
oped a quasi-cw mode-locked laser which delivers an average power of 8 W in mode-locked
pulse bursts lasting 150 µs at a pulse repetition frequency (PRF) of 400 Hz.
Another method of generating the sodium wavelength is to frequency shift a 532 nm
laser using an optical parametric amplifier [21]. With this system, 5.5 W was generated
in a cw mode-locked pulse train.
In recent times there has been a push to develop cw fibre lasers by Raman shifting
and frequency doubling the output of a ytterbium doped fibre [22] [23]. At present these
systems have reported powers of up to 3 Watts [22] in a diffraction limited cw beam.
With the introduction of multi conjugate adaptive optics systems (MCAO), currently
under development at a number of sites around the world, there will be new and demand-
ing requirements on the laser source being used to produce the reference beacons. This
will be discussed in the next section.

8 CHAPTER 1. ADVANCED ADAPTIVE OPTICS SYSTEMS
1.4 Adaptive optics systems for future large-aperture
observatories
1.4.1 Multiple beacons for atmospheric tomography
With the shift to telescopes of larger diameter, such as the extremely large telescopes
(ELTs) with diameters > 30 m, the current systems of single beacon adaptive optics will
not be acceptable as focus anisoplanatism will greatly restrict the level of atmospheric
correction achievable [24]. Any astronomical object that is angularly separated from the
reference beacon will receive only partial correction for turbulence because light from
it will take a different path through the atmosphere than the beacon. To improve the
correction, an approach using multiple beacons has been developed. This technique is
known as multi conjugate adaptive optics (MCAO) [11], and is illustrated in Figure 1.6.
With this approach, multiple beacons are used to probe the atmosphere and generate a
3D map of turbulence within the whole volume of atmosphere contained in the telescopes
field of view. The system uses multiple deformable mirrors, that are optically conjugate
to different altitudes, to correct for the turbulence encountered by rays of light from all
objects within the telescopes field of view, even if they are angularly separated from a
beacon.
Another method of atmospheric correction using multiple guide star beacons is a
simplification of MCAO, known as ground layer adaptive optics (GLAO) [25]. With this
approach, only one deformable mirror is used, conjugated to the lower atmosphere. This
allows correction over the telescopes full field of view, as does MCAO, but the correction
is only partial, as most of the turbulence in the upper atmosphere is not compensated.
1.4.2 Gemini guide star requirements for MCAO on ELTs
A MCAO system requires additional performance features from the laser source used to
generate the Na beacons. The current generation of guide star laser systems are all fitted
on telescopes with diameters ≤ 10 m and use either cw, cw mode-locked or quasi-cw mode-
locked beams to generate the beacon. For the next generation of guide star lasers that
are required for MCAO on ELTs, it has been acknowledged that a system that delivers
short optical pulses would be beneficial to eliminate problems such as spot elongation and
cross-talk between beacons (explained later) [24]. This led the Gemini Observatory to
issue a call for proposals for vendors to conduct research and development on pulsed laser
systems suitable for MCAO [26]. Table 1.1 lists the performance requirements they set.
The remainder of this section discusses the physics behind these requirements.

9
Guide stars
High altitudeturbulence
Ground layerturbulence
Deformable mirror 1(conjugate to ground layer)
Wavefront sensor
Deformable mirror 2(conjugate to altitude layer)
Figure 1.6: A diagram illustrating the concept of multi conjugate adaptive optics. Multi-
ple guide star beacons are used to probe the whole volume of atmosphere in the telescopes
field of view. The wavefront sensors detect the turbulence and drive deformable mirrors,
which are optically conjugated to different layers of the atmosphere.
Output power ≥ 10 W per beam, 5 beams (50 W total)
Temporal format Pulsed, PRF variable 600 Hz -800 Hz, pulse length 1-3 µs
Wavelength Na D2 line
Bandwidth 1-3 GHz
Beam quality < 1.2 x diffraction limited
Table 1.1: The Gemini performance requirements for a pulsed guide star system for
MCAO on ELTs [26]

10 CHAPTER 1. ADVANCED ADAPTIVE OPTICS SYSTEMS
10km
Na layer
le
Telescope
Figure 1.7: When the beacon is viewed from the telescope, an elongated spot of length le
will be observed due to the thickness of the Na layer.
The elongation effect
The primary advantage of a pulsed laser system is that the problem of spot elongation can
be solved. Spot elongation occurs due to the thickness of the Na layer producing a streak
of Na fluorescence, which is viewed as an elongated spot by the wavefront sensor [27], see
Figure 1.4.2. A pulsed laser can overcome this if the pulse duration is short enough (<
3 µs) that the beacon appears as a point source moving through the sodium layer. As
the pulse moves through the atmosphere, it can be followed by, for example, a fast tilting
mirror, to image the beacon onto the same spot of a CCD camera, thereby increasing the
brightness of the spot and improving the signal to noise ratio of the sensor.
In the presence of elongation, the spot will cover more pixels on the CCD, reducing
the signal to noise ratio of the wavefront sensor. More laser power will therefore be
required to achieve the same signal to noise ratio. It has been predicted that if spot
elongation is present, as it will be for cw or quasi-cw beacons, around three times more
laser power is required to achieve the same signal to noise ratio as a beacon that is not
elongated. [26]. Hence by using a pulsed laser system that has pulses short enough to
defeat spot elongation (< 3 µs) the total average power required from the laser source is
only a third as much as for cw systems.
A laser with good beam quality is also advantageous in producing point source beacons,
as the beam can be tightly focused in the atmosphere to produce a spot with minimal
dimensions and thereby improve the signal to noise ratio of the wavefront sensor.

11
Rayleigh scatter in the lower atmosphere
Rayleigh scatter in the lower regions of the atmosphere is a potential noise source for wave-
front measurements for Na beacons. For cw beacons, the noise from the Rayleigh scatter
can be removed by using wavefront sub-apertures to block the majority of the Rayleigh
plume and by periodically de-tuning the reference beacons from the sodium wavelength to
measure the Rayleigh background, then subsequently subtracting this background from
the wavefront measurements [15]. These systems require both power stability and pointing
stability of the laser source for the subtraction to be successful [15] as well as a wavelength
tuning capability. With a pulsed laser system, the Rayleigh scatter can be simply and
robustly gated out (without the need for background subtraction) provided the laser is
pulsed at a rate that ensures that there is never more than one pulse in the lower atmo-
sphere and sodium layer at one time. If this is the case, a shutter can be used to cover
the wavefront sensor while the pulse is traversing the lower atmosphere, then it can be
opened to view the beacon in the sodium layer. For this reason, the laser repetition rate
should be 600-800 Hz, enabling range gating at various telescope angles from zenith to 45
degrees.
Sodium bleaching
There is only a limited number of sodium atoms in the atmosphere2 and to maximise
the brightness of the beacon, all of these atoms should be used. The Doppler broadened
linewidth of the D2 line of atmospheric sodium is shown in Figure 1.8. It consists of two
lines (D2a and D2b) separated by 1.8 GHz. The relative motions of the atoms broaden
these lines to a total FWHM of approximately 3 GHz. The spectral width of the laser
source should not be greater than this, or laser power will be wasted. Conversely, if the
laser linewidth is too narrow, the high energy density of the laser pulses could saturate all
the sodium at the laser’s frequency and a loss of star brightness will result. If bleaching is
not found to be a problem a laser bandwidth of approximately 1 GHz may be beneficial,
as this spectrum can be matched to the higher cross-section D2a line giving better photon
returns. Alternatively, if bleaching is found to be significant, it may be better to use a
broad spectrum pulse (3 GHz) and cover the whole of the sodium linewidth. A laser
system that has an adjustable spectral width in the range of 1-3 GHz would have an
advantage as it could be optimised experimentally to maximise the brightness of the
beacon.
2The mesospheric sodium is thought to originate from meteorites that disintegrate in the upper at-
mosphere [28]

12 CHAPTER 1. ADVANCED ADAPTIVE OPTICS SYSTEMS
Frequency offset (Ghz)
Cro
ss-s
ection (
cm
)2
D2b
D2a
Figure 1.8: The Doppler broadened D2 absorption cross section of atmospheric sodium [29]
Another factor that will effect sodium bleaching is the pulse duration. It was stated
in Section 1.4.2 that the pulse duration should be kept less that 3 µs to defeat spot
elongation, but the pulse should not be made too short or the high energy density of the
short pulse could cause bleaching and reduce the brightness of the beacon to unacceptable
levels. Hence pulse widths of 1 - 3 µs was stated as an appropriate range in Table 1.1.
While a narrow band Na laser system making use of optical pumping [30] can produce
a very bright Na resonance output, this will only work for cw or quasi-cw systems, and
not for short 1 - 3 µs macro-pulses. If the bandwidth of the 1 - 3 µs pulse source is broad
enough, however, such that the spectrum will overlap regions of both the D2a and D2b
lines of sodium, all mesospheric sodium will be able to participate in resonance for a 1 -
3 µs macro-pulse laser system, without optical pumping.
1.5 This thesis
In this thesis, a new laser design is described and verified, which produces a pulse burst
waveform that can meet all the Gemini performance requirements of Table 1.1. The
design concept was first proposed by Munch and Veitch in 2004 [31] then developed and
verified by the author [32] [33].
The laser produces a pulse burst waveform that consists of a series of short micro-pulses
modulated by a macro-pulse envelope as shown in Figure 1.9. By using short micro-pulses,
the bandwidth of the laser can be controlled, as the pulse width and bandwidth are Fourier

1.5. THIS THESIS 13
1-3 sm
macro-pulse
micro-pulse
Figure 1.9: An ideal macro-micro pulse format, optimised for MCAO systems: The micro-
pulse width is set to control the laser’s bandwidth; the macro-pulse duration is optimised
to reduce spot elongation and sodium bleaching; the macro-pulse repetition rate is 600-
800 Hz to enable gating of Rayleigh scatter.
transform pairs. An additional feature is that the separation of micro-pulses can be made
close to the fluorescence lifetime of sodium (16 ns) to allow sodium atoms to relax between
micro-pulses and participate in more fluorescence.
Details of the laser system design are presented in Chapter 2. Chapter 3 presents
experimental results from a proof of principle laser and shows the successful generation
of macro-micro pulse bursts with both wavelength and bandwidth control. Chapter 4
presents a novel method for stretching the duration of Q-switched laser pulses and the
technique is used to lengthen the macro-pulse duration to 1-3 µs as required. Finally,
Chapters 5, 6 and 7 present the design and construction of a 800 Hz laser source with the
average power, pulse format and beam quality required from the final system design.

14 CHAPTER 1. ADVANCED ADAPTIVE OPTICS SYSTEMS

Chapter 2
Injection mode-locked guide star
laser design
2.1 Introduction
The design of the laser system for next generation adaptive optics systems presents an
interesting challenge for laser physics. The combined requirements of laser pulse format,
power, beam quality, wavelength and bandwidth, listed in Table 1.1, are difficult to fulfil
given that there is no reliable high power laser source that can emit directly at the sodium
wavelength. Previous authors have demonstrated various approaches for generating the
589 nm light including sum frequency generation (SFG) of Nd:YAG [17] [19] [20] and
fibre systems [23], dye lasers [34], second harmonic generation (SHG) of fibre raman
lasers [22] [35] [36] and optical parametric oscillators [21]. These systems have been
successful in meeting some of the requirements of Table 1.1, but there is still, at present,
no complete guide star system available that can simultaneously meet all the requirements.
The aim of this chapter is to present a system design for advanced guide star laser
systems, capable of meeting the complete set of performance requirements set down by the
Gemini observatory [26] (Table 1.1). The chapter begins with an overview of the design
in Section 2.2, injection mode-locking is described in Section 2.3, then each component of
the system design is described in detail during later sections.
2.2 Guide star system design overview
The outline of the guide star laser system design is represented by the block diagram of
Figure 2.1. It uses SFG of two mode-locked Nd:YAG lasers to achieve the sodium wave-
length similar to previous designs [17] [19] [20], but with the novel application of injection
15

16 CHAPTER 2. INJECTION MODE-LOCKED GUIDE STAR LASER DESIGN
SFG
HV Pulser
cw NaReference
Error signal
SFG
output589 nm
Pathmatching
cw 1064 nmNPRO
cw 1319 nmNPRO
Pulseslicer
Q-switched1319 nm slave
Q-switched1064 nm slave
Pulseslicer
Amp
Amp
Figure 2.1: Overall design concept. Two cw NPRO lasers provide the absolute wavelength
control and tuning, and synchronized pulse slicers provide timing and bandwidth control
of injection mode-locked slave lasers for subsequent SFG at the Na wavelength.
mode-locking as a robust method to control the wavelength, bandwidth, peak power and
timing for SFG. An additional feature is the use of stretched Q-switching as an efficient
method of producing the 1-3 µs pulses required to overcome spot elongation and avoid
bleaching of the Sodium. The combination of these two features enable the production of
a burst of high-peak-power micro-pulses optimized for efficient SFG, contained within a
longer macro-pulse, that has a duration that can be controlled by the Q-switching. The
power scalability of this design is assured by the use of Nd:YAG as the gain medium,
together with a master oscillator power amplifier (MOPA) configuration. This approach
has already been proven in previous studies to deliver output powers in excess of 50 W
with diffraction limited beam quality [37] [38].
A highlight of the design is that it uses cw, non planar ring oscillator (NPRO) lasers for
the master sources to guarantee the wavelength. These lasers each produce a stable, single-
frequency output that can be tuned to produce the exact wavelengths near 1064.59 nm
and 1319.25 nm required to achieve sodium resonance by SFG [17]. A robust frequency
lock can then be obtained by using the master lasers and a secondary, low power SFG
system to illuminate a sodium cell and generate an absolute frequency reference to the
sodium line. A simple feedback circuit can then be used to keep the lasers locked to the
sodium line [39] [33].
For injection mode-locking, a seed pulse of about 1 ns duration is sliced from the
NPRO beam and injected into the slave resonator [40]. In our case, the wavelength of
the slave laser is thereby set by the frequency locked master source and the bandwidth is

2.3. INJECTION MODE-LOCKING 17
controlled by adjusting the width of the seed pulse (a seed pulse width of 1 ns will have
a Fourier transform bandwidth of around 1 GHz for example). The seed pulse can be
produced using a Pockels cell placed between crossed polarisers, driven by a fast, high
voltage pulser. To eliminate timing jitter between 1064 nm and 1319 nm micro-pulses
for efficient SFG, the two pulse slicers are driven in series by the one high voltage pulser
to ensure perfect synchronization of the micro-pulses, without the need for complicated
servo electronics.
Given the high-peak-powers expected from the short duration macro and micro-pulses,
a simple single or double pass SFG stage can be used to generate the high power sodium
light. This offers a significant reduction in complexity when compared to cw systems,
which require two lasers to be locked to a resonant SFG cavity to increase the power
circulation through the SFG crystal [41].
2.3 Injection mode-locking
2.3.1 Objective
The aim of this section is to explain the theory of injection mode-locking and to show how
injection mode-locking can be used to control the bandwidth, wavelength and timing of
the output pulses of a laser, as required for advanced SFG guide star sources. The section
gives a general description of mode-locking in Section 2.3.2 then presents details specific
to injection mode-locking in Section 2.3.3.
2.3.2 Mode-locking of laser resonators
The total electric field, E(t), inside a laser resonator consists of the superposition of the
electric fields, En, from each frequency component or longitudinal mode, n, that is able
to resonate inside the cavity. The total electric field, E(t), can thus be written as [42]
E(t) =∑
n
Enei[(ω0+n∆ω)t+φn] (2.1)
where ω0 is the angular frequency of the mode at the centre of the laser’s spectrum,
∆ω = πc2L
(L is the cavity length) is the frequency difference between modes and φn is the
phase.
If the phase difference between modes, ∆φn, is non-zero at all points inside the laser
cavity, the electric field amplitude has a random nature and the laser output fluctuates
with time as depicted in Figure 2.2(a). If there is no time varying phase shift between

18 CHAPTER 2. INJECTION MODE-LOCKED GUIDE STAR LASER DESIGN
Intra-cavity output
outcouplermirrortime
(a)
L
2L
Intra-cavity output
outcouplermirror
ct =
time
(b)
Figure 2.2: The superposition of longitudinal modes inside a laser cavity can result in a)
an irregular output if there is no fixed phase relationship between modes, or, b) a well
defined pulse if there is a fixed phase relationship (ie. the laser is mode-locked). In the
mode-locked case (part b), the output consists of a train of pulses separated by the round
trip time of the resonator.
modes (ie. ∆φn = 0 at some point inside the cavity), the laser is said to be mode-locked
and the electric field can be written as
E(t) =
N−12∑
−N−1
2
Enei(ω0+n∆ω)t (2.2)
= eiω0t sin(N∆ωt/2)
sin(∆ωt/2)(2.3)
Where N is the total number of modes. The laser power P (t) ∼ E∗(t)E(t) is thus
proportional tosin2(N∆ωt/2)
sin2(∆ωt/2)(2.4)
resulting in a pulsed output from the laser as sketched in Figure 2.2(b). In this case, the
superposition of longitudinal modes in the cavity has resulted in constructive interference
to produce the short, high-peak-power intra-cavity pulse and has produced destructive
interference in the low light level regions between pulses.

2.3. INJECTION MODE-LOCKING 19
In practice, a laser can be mode-locked in a number of ways including both passive
and active techniques. For passive mode-locking, a nonlinear element such as a saturable
absorber or a Kerr lens is inserted into the optical cavity. Saturable absorbers are opaque
at low power levels but become highly transparent at high optical powers and thus favour
the generation of a short duration high-peak-power optical pulse in the laser cavity and
thereby mode-lock the laser resonator. Kerr lenses have an intensity-dependent focal
power and can be used to alter the stability and loss of the resonator so that only a
high-peak-power intra-cavity pulse will run stably.
Lasers can be actively mode-locked using an intra-cavity AM or FM modulator, which
also favour the production of short duration pulses inside the resonator and by injection-
mode-locking, which is the topic of the following section.
2.3.3 Injection mode-locking
The technique of injection mode-locking was first demonstrated by Alcock et al. in 1977
using CO2 lasers [40]. The technique is different from other methods of mode-locking in
that no intra-cavity element is required to mode-lock the laser. Rather, a short duration
seed pulse is injected into the resonator, and the frequencies in this pulse that match
the longitudinal modes of the resonator will be amplified and grow with a fixed phase
relationship to each other, mode-locking the slave resonator. Thus, in contrast to other
methods where the losses are increased for all but the mode-locked pulse, in this case the
gain for the preferred modes is increased.
To explain the process more clearly, Figures 2.3, 2.4 and 2.5 have been included sketch-
ing the temporal and frequency structure of the seed pulse and the mode-locked slave
resonator. Figure 2.3 shows the seed pulse prior to injection into the slave resonator.
For the guide star laser, this seed pulse is sliced from a cw single frequency NPRO beam
using a Pockels cell as mentioned in Section 2.2 and discussed in detail in Section 3.4.
If the temporal shape of the pulse is Gaussian then the spectral content of the pulse in
frequency space is also Gaussian according to the Fourier transform relationship
e−αt2 ⇔√
π
αe−
(πν)2
α (2.5)
for which the constant, α, is related to the FWHM pulse duration, ∆t, by
∆t =√
4/α ln(2) (2.6)
When the seed pulse is injected into the slave laser resonator, the only frequency
components of it that can resonate are those which match the longitudinal modes of

20 CHAPTER 2. INJECTION MODE-LOCKED GUIDE STAR LASER DESIGN
time
Dt
frequency
Dn
n0
am
plit
ude
t=0
Figure 2.3: The temporal and spectral characteristics of a Gaussian-shaped seed pulse.
The double arrow represents a Fourier transform.
frequency
Frequency componentsof intra-cavity pulse
frequency
resonatorlongitudinal modes
injected pulsespectrum
n0n0
Dn Dn
Figure 2.4: A diagram illustrating the changes in frequency spectrum which an optical
pulse undergoes when it is trapped inside a Fabry-Perot laser cavity. The LHS shows the
pulse spectrum before being injected into the cavity and also the allowed frequencies of
the slave longitudinal modes (spaced by ∆νm = c2L
where L is the cavity length). The
RHS shows the resulting spectrum of the pulse when trapped inside the cavity. The only
frequency components that can resonate are those which match the longitudinal modes.
These frequencies will then be amplified by the gain medium inside the laser cavity.
L
Intra-cavity
outcouplermirror
Dt Dt
seed pulse
2L
output
ct =
Dt
Figure 2.5: For injection mode-locking, a seed pulse is injected into a laser cavity then
amplified over repeated round trips by the gain medium (not shown). For each round trip
inside the cavity, part of the pulse is outcoupled producing a mode-locked waveform with
a PRF of c2L
as shown.

2.3. INJECTION MODE-LOCKING 21
the cavity, ie those which have an integer number of wavelengths per round trip. Hence
by trapping the seed pulse within the laser cavity, the frequency content of the pulse
will change as illustrated in Figure 2.4. If the seed pulse has greater energy than the
spontaneous emission of the laser, the seed pulse will be preferentially amplified and
dominate the output of the laser. Murray and Lowdermilk [43] found that a seed pulse
energy of as little as 1 fJ was required to overcome the spontaneous emission for their
Nd:YAG laser system.
Since the seed pulse is sliced from a cw single frequency beam, all frequency com-
ponents of the seed pulse will be in phase and when the seed is injected into the slave,
the longitudinal modes will be excited in phase and the slave will be mode-locked. The
laser will therefore produce the characteristic pulse burst of a mode-locked laser, shown in
Figure 2.5. When used in conjunction with Q-switching, the short duration micro-pulses
will be modulated by a macro-pulse set by the Q-switch, producing the ideal macro-micro
pulse waveform as depicted in Figure 1.9.
A variant of the injection mode-locked lasers are the so-called cavity-dumped lasers [43]
(not relevant to the current application). These lasers are different from injection mode-
locked lasers in that they do not have an outcoupling mirror to produce a micro-pulse
burst. Rather, these lasers employ an intra-cavity pockels cell to eject the entire intra-
cavity pulse once it has been fully amplified, producing a single, short duration high
energy pulse as the laser’s output.
Bandwidth control
The spectral bandwidth of the seed pulse is inversely proportional to the pulse duration as
shown, for example, by Equation 2.5. Hence by changing the pulse duration the bandwidth
of the pulse can be controlled. This allows the spectrum of the injection mode-locked laser
to be matched to the Doppler broadened linewidth of atmospheric sodium (Figure 1.8)
to maximise the brightness of the guide star. The ideal bandwidth of the laser will
be in the range of 1-3 GHz (Section 1.4.2) which will require a micro-pulse duration of
approximately 0.3-1 ns (assuming a unity time-bandwidth product). A variable-duration
seed pulse source that can produce pulses in this range is described in Section 3.4.
For the laser to be optimally injection mode-locked, multiple longitudinal modes need
to contribute to the laser’s spectrum. If too few modes are present, the laser’s spectrum
will not cover a broad frequency range but will contain only a few frequency spikes cor-
responding to the longitudinal modes. As a result, the brightness of the guide star will
be diminished, as not all sodium atoms will be in resonance with the laser. Moreover,
the laser will no longer produce a well defined pulse burst containing high-peak-power

22 CHAPTER 2. INJECTION MODE-LOCKED GUIDE STAR LASER DESIGN
micro-pulses and low light levels between pulses, resulting in reduced SFG efficiency. To
avoid these problems, the cavity length needs to be made significantly longer than the
seed pulse duration to reduce the frequency spacing between modes (∆νm = c2L
) and
ensure that the seed spectral width (∆ν ≈ 1∆t
) will overlap multiple longitudinal modes.
Wavelength control
An essential aspect of any laser guide star system design is the ability to tune the output
accurately to the sodium absorption line. Wavelength tuning in injection mode-locked
lasers can be simply and reliably achieved by tuning the wavelength of the master laser
used to generate the seed pulse. For our case, the seed pulse is generated by gating the
output of a cw NPRO laser using a Pockels cell (Section 3.4) so the centre frequency of
the seed pulse (and hence the slave laser) will be set by the frequency of the cw NPRO
laser1. This last statement can be proven using the convolution theorem: The seed pulse
can be thought of as the multiplication of the amplitude of the cw NPRO beam, a(t),
with a transmission function, f(t), representing the shape of the seed pulse, as shown in
the left hand side of Figure 2.6. By the convolution theorem, the spectrum of the seed
pulse is therefore given by the convolution of the Fourier transform of the cw beam, A(ν),
and the Fourier transform of the transmission function, F (ν) (see the right hand side of
Figure 2.6).
The centre frequency of the seed pulse (and hence the slave laser) will therefore be
centred at the frequency of the cw master beam used to generate the seed pulse, given
that the seed pulse spectrum is the convolution of a kronecker delta centred at the master
frequency, ν0, convolved with a Gaussian.
Section 2.8 presents experimental measurements showing that the SFG of 1064 nm and
1319 nm NPRO lasers can be accurately and reliably tuned to the sodium wavelength.
Timing jitter
The timing of the micro-pulses from an injection mode-locked laser is set by the timing
of the injected seed pulse plus a delay equal to the number of round trips the pulse
makes before being outcoupled from the laser cavity. Furthermore, the timing jitter of
the output micro-pulses is equal to the timing jitter in the seed pulse, provided there is
no intra-cavity element that introduces additional sources of jitter. For the SFG macro-
micro pulsed guide star, low timing jitter is essential for efficient frequency conversion as
short duration micro-pulses from the 1064 and 1319 nm slave lasers need to be closely
1The effects of frequency chirping will be negligible compared to the bandwidth of the injected seed
pulse

2.3. INJECTION MODE-LOCKING 23
time domain frequency domain
time frequency
time
time frequency
frequency
cw masterlaser
transmissionfunction
seedpulse
n0
u0
a(t)
f(t)
a(t) x f(t)
A( )n
F( )n
A( ) F(n n)
Figure 2.6: A graphical representation of the temporal and spectral content of the seed
pulse. The LHS shows the time domain and the seed pulse created by the multiplication
of the master laser amplitude a(t) with a Gaussian transmission function used to generate
the pulse, f(t). The RHS shows the Fourier transform of the LHS. The double arrows
represent Fourier transform pairs and the cross within the circle represents a convolution.

24 CHAPTER 2. INJECTION MODE-LOCKED GUIDE STAR LASER DESIGN
overlapped within the SFG crystal. If the seed pulse source can be made to have low
timing jitter, as is later proven in Section 3.4, the process of injection mode-locking can
be used to control the laser timing jitter, thus meeting an important system requirement.
2.3.4 Conclusion
This section presented details on the theory of injection mode-locking and showed that an
injection mode-locked laser can in theory be used to generate a burst of high-peak-power
micro-pulses having the combination of bandwidth control, wavelength control and low
timing jitter as required for advanced SFG guide star sources. In the following chapter
and in later parts of this thesis, the concept of injection mode-locking is demonstrated
with Nd:YAG lasers and is proven to be successful in meeting the spectral and timing
requirements of the guide star source.
2.4 Slave resonator design
2.4.1 Introduction
The specific requirements of the macro-micro pulse burst waveform place certain restric-
tions on the slave resonator design. Firstly, there must be some way of injecting the seed
pulse for injection mode-locking. Secondly, the resonator must have a long length to reduce
its free spectral range and ensure that the spectral width of the injected seed pulse will ex-
cite many longitudinal modes for effective injection mode-locking (Section 2.3). Thirdly,
there must some means of stretching the Q-switched macro-pulse to avoid bleaching in
the sodium layer. Finally, the resonator must be suitable for high peak and average intra-
cavity laser powers. It must therefore be efficient, stable and insensitive to changes in the
focusing power of the induced thermal lens. This section presents a description of a novel
ring resonator design that can facilitate all of these properties [44].
2.4.2 Travelling wave ring resonator design
A travelling wave ring resonator design was selected as the architecture of choice for
the injection mode-locked slave oscillator. A schematic of the ring design is shown in
Figure 2.7. For comparison, a standing wave design that could also be used for injection
mode-locking is described in Figure 2.8. The ring design offers several advantages over
standing wave designs, primarily relating to Q-switched pulse stretching, which will be
discussed later in this section. Other benefits include the fact that less optical isolation

2.4. SLAVE RESONATOR DESIGN 25
mirror mirror
Nd:YAGQ-switch HWP
TFP
outputinjectseed pulse
Figure 2.7: Slave laser configuration, showing pulse injection into a travelling ring oscil-
lator via a polarizing beam splitter (TFP), and the arrangement of polarizing elements
and Q-switch required to stretch the macro-pulse formed.
is required between the master and slave oscillators. For standing wave designs, the
master and slave beams counter-propagate on the same axis, so high contrast isolators
are required to prevent de-stabilization of the master oscillator by feedback from the slave.
This often requires multiple isolators, with each introducing a loss of around 10 % [45],
attenuating the input and output beams. Another advantage is that the ring architecture
does not require an intra-cavity polariser to be used in transmission, further reducing the
round trip loss by around 2 %2.
For injection mode-locking, a π-polarized seed pulse is injected into the ring through
the thin film polarizer (TFP). Its polarization is converted to σ by the half wave plate
(HWP) before it passes through the gain medium and Q-switch. There is initially no
voltage on the Q-switch, so the pulse will pass through without change in polarization and
be fully reflected by the TFP. The half wave voltage is then applied to the Q-switch which
traps the pulse within the resonator on second and subsequent round trips allowing a rapid
amplification in pulse energy with low loss. Once the pulse has built up sufficiently, the
voltage on the Q-switch is reduced slightly and the π-polarized component is outcoupled
through the TFP. A key feature of this resonator is that the outcoupling fraction can
be rapidly varied by controlling the voltage level applied to the Q-switch. If there is
a low voltage, there will be a high outcoupling and if the voltage is near half-wave the
outcoupling fraction will be small. If an appropriate Q-switch voltage waveform is chosen,
consisting of a voltage pulse with appropriate amplitude modulation, the outcoupling
fraction can be used to slow the development of the giant pulse and stretch its duration.
2Three 1064 nm TFP’s were obtained from CVI Laser and were measured to have near 100 % re-
flectance for σ-polaraized light and 98 % transmission of π

26 CHAPTER 2. INJECTION MODE-LOCKED GUIDE STAR LASER DESIGN
Pockelscell
QWPmirror
TFP Nd:YAGmirror
Faradayisolator
HWP
TFP
Output
Injectseed pulse
Figure 2.8: Example of a standing wave resonator that could be injection mode-locked.
The output pulse is separated from the input seed pulse using high contrast isolators.
More details on this technique are presented in Chapter 4 and in the publication found
in Appendix A. Unlike other pulse stretching schemes that introduce an intra-cavity loss
to slow the development of the giant pulse [46] [47] [48], this resonator offers a unique
advantage in that all losses are useful as the laser output, allowing much greater efficiency
(see Chapter 4).
Another inherent advantage of ring resonators in this application is that the pulse
makes only one traversal of the gain medium per round trip (as opposed to two for the
standing wave design) thereby halving the round trip gain and increasing the giant pulse
duration [49].
2.4.3 Conclusion
This section described a novel ring resonator design that facilitates both injection mode-
locking and pulse stretching to produce the preferred macro-micro pulse burst waveform.
The design contains few intra-cavity elements, enabling efficient operation, and the novel
pulse stretching technique uses all modulated losses as the laser output, so as not to reduce
the efficiency [50]. This resonator plays an integral role in the guide star laser system
design and has been proven to be very successful in achieving the laser requirements, as
detailed in later chapters of this thesis.

2.5. HIGH POWER SUM FREQUENCY GENERATION 27
2.5 High power sum frequency generation
2.5.1 Introduction
High power SFG is required at the output of the guide star system to convert the two
fundamental wavelengths of 1064 nm and 1319 nm to the sodium wavelength (589 nm).
SFG of Nd:YAG lasers at these wavelengths was first reported by Jeys et al. [17]. High
power SFG systems have been reported by Denman et al. [18] and Tracy et al. [19] who
produced 50 W and 16 W of sodium light respectively. Denman et al. used two cw lasers:
100 W at 1064 nm and 60 W at 1319 nm, together with a lithium tri-borate (LBO)
crystal to generate the sodium light. Due to the low peak power of the cw lasers, the
two lasers were phase-locked to an external resonant cavity containing the LBO crystal
using the Pound-Drever-Hall stabilization technique [18]. In Tracy et al., the SFG was
accomplished using periodically-poled nearly stoichiometric lithium tantalate (PPnSLT),
pumped by cw mode-locked lasers, which resulted in a maximum conversion efficiency of
40 % from a single pass through the PPnSLT crystal.
The injection mode-locked laser system proposed in Section 2.2 has a different pulse
format to any other guide star system and the the short duration micro-pulses are expected
to produce peak powers several orders of magnitude high than these cw and cw mode-
locked systems. Thus it was necessary to develop a preliminary concept design of the
SFG system best suited to this work and to estimate the expected conversion efficiency
so as to determine the laser powers at 1064 nm and 1319 nm required to produce 50 W
at the sodium wavelength. This section presents a summary of this investigation.
Section 2.5.2 gives a brief review of nonlinear optics and SFG. It is not intended to be
a comprehensive description of the field as this information is available in textbooks [51]
but it is hoped that this section is sufficient to provide an introduction to the topic and
discuss the issues that are important when designing an efficient SFG system for this laser.
Section 2.5.3 presents an evaluation of commonly available nonlinear crystals that may
be useful for 589 nm SFG systems, then in Section 2.5.4 a calculation of the conversion
efficiency for a likely candidate, LBO, is presented.
This thesis does not present experimental validation of the SFG system proposed in
this section as the equipment and 1319 nm lasers were not available at the time of this
work, but the results from this section are useful to validate the guide star system design
and to provide an estimate of the power levels required at the fundament wavelengths,
based on the estimated SFG conversion efficiency.

28 CHAPTER 2. INJECTION MODE-LOCKED GUIDE STAR LASER DESIGN
2.5.2 Theory of SFG
Optical processes are termed “nonlinear” when the response of a material to an applied
optical field depends in a nonlinear manner upon the strength of the optical field. In con-
ventional “linear” optics the material polarization, P (t), varies linearly with the electric
field:
P (t) = χ(1)E(t) (2.7)
where the constant of proportionality, χ(1), is termed the linear susceptibility and is a 2nd
rank tensor. In non-linear optics, the polarization is expanded in the form
P (t) = χ(1)E(t) + χ(2)E(t)2 + χ(3)E(t)3 + . . . (2.8)
where χ(2) is the second order susceptibility and is the parameter that relates to phenom-
ena such as SHG and SFG.
If the polarization is time varying, as is the case when the applied electric field is a laser
beam, charges are being accelerated, which implies that new EM radiation is generated.
If the frequency and direction of the laser beam are tuned correctly, new frequencies can
be created with, for example, twice the incident frequency (SHG). If two pump beams
are used to excite the material then light with the sum of the frequencies can be emitted
(SFG).
Some of the major factors that influence the conversion efficiency are:
Laser peak power The efficiency of SFG depends on the square of the electric field
strength of the incident optical field.
Effective nonlinear coefficient The effective nonlinear coefficient, deff , is a parameter
derived from the tensor χ(2). A high value of deff generally implies efficient conver-
sion, provided other material parameters are suitable. The value of deff depends on
the type of nonlinear material and the polarization and angle of the incident fields.
Phase matching For a nonlinear birefringent crystal, it is possible to select a laser prop-
agation angle that will result in a fixed phase relationship being maintained between
the converted frequency and the nonlinear polarization, P (t) [51]. This condition
is known as the phase matched state and can result in dramatic improvements in
extraction as it allows in-phase conversion along the whole crystal length instead
of a periodic oscillation between conversion and back conversion due to the phase
mismatch between fundamental and SFG beams.
Walk-off angle Walk-off occurs when the generated beam separates from the incident
beam due to double re-fraction. If the walk-off angle is large, the efficiency will

2.5. HIGH POWER SUM FREQUENCY GENERATION 29
be significantly reduced as the pump and generated waves will no longer overlap.
Walk-off occurs only when the incident field is at an angle to the optic axis of the
crystal, as is sometimes required to ensure phase matching.
Damage threshold To achieve high-peak-power for efficient conversion, the incident
beam should be focused to a small spot inside the crystal. The limitation on how
small this spot can be made is determined by the damage thereshold of the material.
An estimation of the conversion efficiency, η, for SFG can be obtained from the solution
to Maxwell’s equations in a nonlinear dielectric medium. The solution can be obtained
by reducing Maxwell’s equations to a pair of coupled wave or amplitude equations for
parametetric interactions that require that the gain in intensity at the summed wavelength
(I3) be counterbalanced by a reduction in power at the fundamental wavelengths (I1 and
I2) [52] [53]. The stepwise integration of these coupled wave equations can then yield
approximations to the conversion efficiency [54]. For the case in which plane waves with
top-hat profiles are assumed and cw beams, zero walk-off and perfect phase matching are
used, an analytical solution to the conversion efficiency can be written as [54]
η ≈ tanh2(√
η0)sin2[L δ kexp(η0.87
0 /6.7)/2]
[L δ kexp(η0.870 /6.7)/2]2
(2.9)
where
η0 = C2
(
1 +λ1
λ2
)2
L2 I1I2
I1 + I2(2.10)
and
C = 5.454(n1n2n3)−1/2deffλ1 (2.11)
for which the intensities Ii are given in GW/cm2, wavelengths λi in µm, phase mismatch
δk in cm−1 and deff is in pm/V.
For a more realistic treatment that includes Gaussian beam profiles, temporal variation
in peak power for pulsed lasers and walk-off a computer program can be used which
calculates the conversion efficiency of fields with time-varying amplitudes at a lattice of
points within the crystal volume. This is the approach taken in Section 2.5.4, which
presents example calculations of SFG conversion efficiency for macro-micro pulsed lasers.
2.5.3 Evaluation of common SFG materials
This section presents a discussion of which commonly available nonlinear crystals are suit-
able for use in the injection mode-locked guide star laser source. The desire is to realize
a simple and efficient single-pass SFG stage to convert the infra-red power at the funda-
mental wavelengths (1064 nm and 1319 nm) into a sodium-wavelength beam (589 nm).

30 CHAPTER 2. INJECTION MODE-LOCKED GUIDE STAR LASER DESIGN
KTP PPLN LBO BBO
deff (pm/V) 3.3 4.8 0.84 2.0
Phase matching angle () 62.5 0 3.4 21.4
Walk-off angle (mrad) 43.2 0 2.1 52.7
Damage threshold (GW/cm2) 0.5 0.1 2.5 1.5
Accept. angle (mrad-cm) 25 47 35 1.3
Max average power (W) 15 10 >100 >100
Table 2.1: Nonlinear material parameters for commonly available nonlinear crystals that
may be suitable for use in the injection mode-locked guide star system [55] [51]. The
values listed are for SFG of 1064 nm + 1319 nm lasers at 300K. The acceptance angle is
defined as the range for which the phase mismatch varies between −π and +π.
To achieve high conversion efficiencies, the nonlinear material must be transparent at the
wavelengths of 1064, 1319 and 589 nm, be of high optical quality and be able to handle
high average powers and the consequent thermal gradients without spoiling the phase
matching and beam quality. Table 2.1 presents a list of commonly available nonlinear
materials that may be suitable. Other nonlinear materials such as KD*P have been ex-
cluded from this table due to their failure to meet one or more of the aforementioned
requirements, making them unsuitable for use in the injection mode-locked guide star
source. KD*P, for example, suffers substantial absorption at 1319 nm and hence has been
excluded.
To produce 50 W of 589 nm average power, the required average power of the funda-
mental wavelengths will be of the order of 100 W, assuming a conversion efficiency of 50 %
can be obtained. For this application LBO and BBO are the prime candidates as they
have been proven to withstand average powers in excess of 100 W without degradation in
efficiency or beam quality [18] [56] [57].
Another option is to split the main beam into a number of sub-beams and perform
the SFG in several parallel stages. This technique may be acceptable as the guide star
source must be split to produce multiple beacons anyway. For this approach, greater
efficiency may be obtained with PPLN or the newly developed PPnSLT [19]. A single
SFG stage does have advantages however, as it reduces the complexity and price of the
system. Hence LBO and BBO are the preferred materials for the guide star system.
LBO has the advantage over BBO that it has a larger angular acceptance angle mean-
ing a tighter focus can be used within the crystal to increase peak power. The birefringence
in LBO can also be temperature tuned to provide zero walk-off at 39, which provides
further benefits to efficiency as smaller spotsizes can be used within the crystal without

2.5. HIGH POWER SUM FREQUENCY GENERATION 31
decreasing the beam overlap region due to walk-off. So, despite BBO having a larger
effective nonlinear coefficient, LBO should produce higher conversion efficiencies when
used in the injection mode-locked guide star laser system. This choice is supported by
other authors of high average power Na SFG laser systems who have also reported LBO
as their preferred material [18] [41].
2.5.4 Estimation of SFG conversion efficiency for LBO
Objective
The aim of this section is to provide an estimation of the conversion efficiency expected
for SFG of injection mode-locked macro-micro pulse waveforms in LBO. This value is
important as it indicates the power levels at 1064 nm and 1319 nm required to produce
50 W at the sodium wavelength.
Approach
The computer program SNLO [55] was used to estimate the conversion efficiency of the
SFG system. This program is freely available online and has become the industry standard
for nonlinear optics calculations [58] [59]. It is able to compute the conversion efficiency
at a lattice of points across the beam profiles and along the nonlinear crystal’s length
and then integrate the net conversion efficiency over time as a laser pulse passes through
the crystal. This allows the program to take account of factors such as Gaussian beam
profiles and the time varying peak power of micro-pulses for improved accuracy [58].
One of the required inputs to the program is the spot size of the fundamental beams
within the LBO crystal. A small spot size is desirable as it gives increased peak power
for greater efficiency, but the spot should not be so small that it causes damage. The
damage threshold of LBO is quoted as 25 J/cm2, 10ns pulse [55], which is higher than
most anti-reflection (AR) coatings which have a damage threshold of up to 10 J/cm2, 20 ns
pulse [60]. To lower reflection losses it is preferable to have the LBO crystal AR-coated3,
so the damage threshold of the coating will be the limiting factor when considering the
optimum focus for SFG.
The laser parameters used in the model were 1 ns micro-pulses separated by 12 ns
and a macro-pulse width of 2 µs with 800 Hz PRF. The total power at the fundamental
3For simplicity, an AR coated bare crystal is desirable. If problems with coating damage do occur, it
is possible to enclose an uncoated nonlinear crystal in a long-length cell containing index matching fluid,
then to focus the high power fundamental beams into the crystal from a distance, keeping the spot size
at the AR-coated entrance faces of the cell large to avoid peak power damage.

32 CHAPTER 2. INJECTION MODE-LOCKED GUIDE STAR LASER DESIGN
Spot size (mm) Fluence (J/cm2)
0.1 18.4
0.2 4.6
0.3 2.0
0.4 1.1
0.5 0.5
Table 2.2: The peak fluence of micro-pulses for a 100 W average power macro-micro-pulsed
laser for different laser spot sizes.
wavelengths (1064 nm and 1319 nm) was 100 W. The peak fluence estimations for different
spot sizes are found in Table 2.2. The damage thresholds of optical coatings are usually
specified for pulse duration 10 or 20 ns and for peak power damage these values scale as
the square root of the pulse width for pulses longer than 100 ps [60]. Hence a damage
threshold of 10 J/cm2, 20 ns pulse is equivalent to 2.2 J/cm2 for one nanosecond pulses.
Comparing this value with the data of Table 2.2 we see that the spot size should be kept
above 0.3 mm to avoid damage.
To have equal numbers of photons at the two wavelengths, the average power at 1064
nm should be 55.5 W while at 1319 nm the power should be 45.5 W. This is beneficial to
SFG guide star systems as Nd:YAG lases more efficiently at 1064 nm than 1319 nm [61].
Results
Table 2.3 shows the conversion efficiencies calculated using the SNLO computer program
for single pass SFG of 55.5 W 1064 nm and 45.5 W 1319nm macro-micro pulsed beams in
a 2 cm LBO crystal. The crystal length of 2 cm is the longest length found to be available
from vendors of high quality LBO. The crystal temperature was set to 39 for non-
critical phase matching and zero walk-off. The approximate, analytical expression for
conversion efficiency (Equation 2.9) predicts conversion efficiencies slightly higher than
Table 2.3. Using the same input parameters of pulse length, spotsize, crystal length etc
as the SNLO program, Equation 2.9 predicts a conversion efficiency of 71 % for a spotsize
of 0.5 mm and 90 % for a spotsize of 0.3 mm.
Table 2.3 shows that a theoretical conversion efficiency of 76 % can be obtained for a
0.3 mm spot size. In practice this is would be the upper limit to the single-pass efficiency as
it assumes that there is zero jitter between micro-pulses, the 1064 nm and 1319 nm macro-
pulse shapes are perfectly matched, the fundamentals have perfect beam quality and there
is no loss or wavefront distortion in the LBO crystal. If any of these parameters are less

2.5. HIGH POWER SUM FREQUENCY GENERATION 33
Spotsize (mm) Efficiency (%)
0.2 86.8
0.3 76.0
0.4 64.5
0.5 54.0
Table 2.3: The calculated SFG conversion efficiency for 1064 nm and 1319 nm beams
focused to different spot sizes within a LBO crystal.
than ideal in the final laser system the efficiency will be reduced from the theoretical
value.
It may also be possible to use multiple LBO crystals in series and pass unused 1064 nm
and 1319 nm power from the first SFG stage through a second stage and further improve
the efficiency.
Conclusions
This section presented a theoretical analysis of the high power SFG stage proposed for
the guide star system design. Several different nonlinear materials were investigated and
it was concluded that Lithium Triborate (LBO) would be the preferred material for SFG
as it has been proven to withstand high average powers, give good conversion efficiency
and it can be temperature tuned for non-critical phase matching and zero walk-off. The
conversion efficiency of a LBO crystal was calculated in Section 2.5.4 for macro-micro
pulse laser waveforms similar to that expected from the 1064 nm and 1319 nm injection
mode-locked lasers. It was found that the conversion efficiency could be as high as 76 %
for a single pass through a 2 cm LBO crystal, with higher efficiencies possible if multiple
crystals are used in series. Hence this section established that the high-peak-power of the
injection mode-locked oscillators will allow a simple and efficient single pass SFG stage to
be used for the guide star system, and that a combined average power of 100 W for the
1064 nm and 1319 nm beams should be sufficienct to generate 50 W of 589 nm power.
This predicted value is similar to the efficiency recorded by Tracy et al. [19], who achieved
40 % conversion efficiency from lower peak power cw mode-locked Nd:YAG lasers.
Detailed experimental investigations are, of course, necessary to determine the exact
conversion efficiency obtainable for the injection mode-locked lasers when non-ideal factors
such as the specific pulse format and beam quality of the lasers are taken into account.

34 CHAPTER 2. INJECTION MODE-LOCKED GUIDE STAR LASER DESIGN
2.6 Power scaling
In this section, several design options are discussed for scaling the average power of the
guide star system to 50 W, as required by Gemini. The approaches discussed in this
section are:
1. Having a single high average power oscillator in each of the 1064 nm and 1319 nm
lasers to achieve 50 W at the sodium wavelength in one step
2. having 5 identical, subscale, 10 W systems to achieve a total of 50 W
3. having a power amplifier to boost the power levels of 1064 nm and 1319 nm oscil-
lators.
Final design details are not presented in this section as the power scaling of the Na
system to 50 W is not a part of this thesis.
2.6.1 Design options
High average power Nd:YAG oscillators
The design that potentially requires the fewest optical components is one which uses a
single high average power oscillator at 1064 nm, and a single high average power oscillator
at 1319 nm to produce the required 50 W, Na. This would require around 55.5 W from
the 1064 nm oscillator and 45.5 W at 1319 nm as discussed in Section 2.5.4.
To date, the highest average power reported from an electro-optically Q-switched,
Nd:YAG oscillator operating in a stable, TEM00 cavity is around 10 - 20 W [62] [63] [64]4
at 1064 nm, so obtaining significantly high average powers than this may prove difficult.
The thermal distortions such as thermal birefringence and thermal lensing usually limit
the output power in high average power Nd:YAG laser heads, as is discussed in detail
during Chapter 5.
5 x 10 W oscillators
A different design is to use 5 identical, lower average power oscillators (5 x 10 W) to
achieve 50 W in total. Each laser system could then be used to produce one of the
five beacons required for MCAO. This approach has the advantage that if a technical
4Researchers of high powered near infra-red lasers have primarily focused on Yb:YAG and Nd:YVO4
when developing single oscillator systems due to the better quantum defect and thermal properties of
these materials [65] [66] [67], but they cannot be used for SFG guide star systems due to their emission
wavelength.

2.7. COMMENTS 1319 NM LASERS 35
problem arises with one of the lasers at the observatory and requires repairs, the adaptive
optics system could still be used to correct for turbulence using the 4 remaining beacons
(although the performance of the system will be reduced), and would not require the shut
down of the adaptive optics system.
This approach is also a safer research option to pursue as the Nd:YAG laser technology
has already been demonstrated at these power levels [62] [63] [64].
A disadvantage with this approach is the increased system complexity as 10 medium
power oscillators (five at 1064 nm and five at 1319 nm) will be required.
2.6.2 Master oscillator power amplifiers
Another approach to power scaling is to use a low average power master oscillator (approx.
2 W) to produce the desired macro-micro pulse waveform, and then use an amplification
stage to boost the power to the required level. This technique is known as a master
oscillator power amplifier (MOPA).
High average powers have been achieved with this technique, with several systems
reporting in excess of 50 W with Nd:YAG (and Yb:YAG) [68] [69] [70] [71]. MOPAs
have an advantage over high average power oscillators in that the major heat load (from
pumping) is removed from the oscillator laser crystal, thereby limiting the number of
times the laser beam must pass through a gain medium with high heat load and potential
thermal distortions.
Potential issues with this approach are whether the wavelength and beam quality of
the master beam can be preserved during amplification.
2.7 Comments 1319 nm lasers
The operation of Nd:YAG lasers at 1319 nm is more challenging than at 1064 nm primary
due to the lower emission cross section at that wavelength: 0.95 × 10⁻¹⁹ cm2 for 1319
vs. 2.8 × 10⁻¹⁹ cm2 for 1064 nm. Hence Nd:YAG will preferentially lase at 1064 nm so
this emission needs to be suppressed to allow the 1319 nm power to build up. 1319 nm
operation can be achieved using narrow-band mirrors made from multi-layer dielectric
coatings that are highly reflective at 1319 nm and transmissive at 1064 nm, but the lower
gain at 1319 nm will still result in lower average powers at 1064 nm for a given pump
power. Tracy et al [19] reported an output power of 16.8 W at 1064 nm and 9.8 W at
1319 nm using cw mode-locked lasers while Denman et al [18] reported 100 W at 1064 nm
and 60 W at 1319 nm in a cw beam.

36 CHAPTER 2. INJECTION MODE-LOCKED GUIDE STAR LASER DESIGN
In Section 4.3 a model is presented for predicting the output of an injection mode-
locked Q-switched Nd:YAG laser. This model accurately reproduces the 1064 nm output
pulse energy and pulse width of the laser described in Chapter 3 for a range of pump
energies (Figure 4.3). This model was used to provide an indication of the performance
expected from an injection mode-locked, Q-switched laser at 1319 nm relative to an iden-
tical laser operating at 1064 nm. Full details of the model are presented in Chapter 4 and
only the results are given here. At 1064 nm, for a small-signal gain coefficient g0 = 0.307,
the model predicts that the laser will output 10 mJ in an injection mode-locked, Q-
switched pulse with a near-Gaussian-shaped pulse having width 0.4 µs. For 1319 nm, a
small-signal gain coefficient g0 = 0.102 was input, representing the one third stimulated
emission cross section at this wavelength. With all other parameters identical, the model
predicts output energy of 1 mJ and a pulse width of 1.9 µs, highlighting the difficulty
expected at this wavelength.
To increase the power from a 1319 nm laser, the pump density within the laser crystal
can be increased, either by reducing the dimensions of the Nd:YAG gain medium or
by increasing the pump energy. This approach will only be effective if there are no
performance limitations from thermal lensing or parasitic oscillations for example.
Another challenge will be overlaying the 1064 nm and 1319 nm macro-pulses in the
SFG crystal for high-efficiency SFG. The different gains at the two wavelengths will result
in different Q-switch build up times so to synchronize macro-pulses the 1064 nm macro-
pulse will need to be delayed relative to 1319 nm. As was discussed in Section 2.2, to
achieve low timing jitter between micro-pulses the Pockels cells in the seed pulse generator
should be driven using the same drive pulse, so the 1064 nm and 1319 nm seed pulses will
be generated at approximately the same time. It may be possible, however, to delay the
injection of the 1064 nm seed pulse into the slave resonator to account for the difference
in build up times by using an optical fibre delay line and adjust the length of the delay
line to synchronize macro-pulses. Macro-pulse shapes should also be matched for high
SFG efficiency, which may be possible using the Q-switch pulse modulation techniques
described in Chapter 4.
A demonstration of high-average-power injection mode-locked laser power at 1319 nm
laser is not a part of this thesis.
2.8 Frequency locking to the sodium line
A robust frequency lock is required to guarantee that the slave lasers are accurately tuned
to generate sodium light by SFG. The Doppler broadened line width of the atmospheric

2.8. FREQUENCY LOCKING TO THE SODIUM LINE 37
cw 1064 nmmaster 0.5W
cw 1319 nmmaster 0.5W
PPLN
filter
chopper sodium cell
photodiodephase sensitivedetection
mirror
feedback
Figure 2.9: The master oscillators are locked to the sodium D2a line using low power SFG
in PPLN and a double pass through a sodium cell to generate an error signal which is
fed back to one of the master oscillators. Phase sensitive detection is used to reduce the
noise of the system.
sodium D2a line is about 3 GHz [72] and thus the frequency drift of the slave oscillators
should be kept well within this limit to maintain a high photon return from the guide
star.
Frequency locking of the injection mode-locked guide star source can be achieved by
using the NPRO master lasers to drive a secondary, low power SFG stage to illuminate a
sodium cell and provide an absolute reference to the sodium absorption band. A simple
feedback system can then be used to control the temperature of the NPRO crystal and
accurately tune the wavelength to enable a robust independent lock to the sodium line.
This technique has already been demonstrated by Moosmuller et al. [39] and also in-house
by N. Simakov [33]. The work of the latter is discussed in this section to show the viability
of the approach.
A schematic of the set up used by Simakov is shown in Figure 2.9. This system uses
two 0.5 W NPRO’s and periodically poled lithium niobate (PPLN) to generate 11 mW of
Na light to illuminate a sodium cell. Phase sensitive detection is used to generate a low
noise error signal which is fed back to the temperature control unit of the 1319 nm NPRO
for frequency control. With this set-up the frequency was maintained to within 3 MHz
of the sodium D2a line for long periods. This represents a drift of approximately one
1000th of the Na absorption bandwidth showing that the output of the injection mode-
locked guide star can be held at precisely the right wavelength for maximal guide star
brightness.

38 CHAPTER 2. INJECTION MODE-LOCKED GUIDE STAR LASER DESIGN
2.9 Conclusions
This chapter presented a system design for an injection mode-locked guide star source
that can potentially meet the Gemini performance requirements of Table 1.1. The design
is based on SFG of injection mode locked Nd:YAG lasers to provide both power scalability
and also the spectral, wavelength and timing properties required of the guide star.
Injection mode locking was discussed in Section 2.3 then a new resonator design was
presented in Section 2.4 that facilitates both injection mode-locking and stretched Q-
switching. This resonator design is used for the experimental investigations of injection
mode-locking, pulse stretching and power scaling found in later chapters of this thesis and
has been found to be very successful at achieving the required laser pulse format with
high efficiency.
Section 2.5 presented an analysis of the high powered SFG system required to generate
the Na light and concluded that the high-peak-power of the injection mode-locked macro-
micro pulse waveform generated by the injection mode-locked slave lasers will enable
efficient conversion to 589 nm with a simple single pass SFG system in LBO.
Section 2.6 presented a discussion of approaches to scaling the average power of the
guide star laser, then in Section 2.8, the design of the frequency locking servo was described
which can hold the frequency of the master lasers to within 3 MHz of the Na line.
The remainder of this thesis describes the experimental verification of injection mode-
locking, Q-switched pulse stretching and power scaling in a 1064 nm Nd:YAG oscillator
and includes experimental evidence justifying some parts of the guide star system design.
Other sections from this chapter, such as the design of the high power SFG stage and
MOPA remain as a design only and experimental validation of these aspects remains for
future work.

Chapter 3
Design verification experiments
using a subscale, 1064 nm Nd:YAG
laser
3.1 Objective
To verify key concepts of the injection mode-locked laser guide star design a low power, a
subscale 1064 nm laser was built and tested. While this laser was not designed to handle
the high thermal loadings required for a 10 W average power laser, it was capable of reach-
ing the same energy per macro-pulse required of the final laser, but at a repetition rate of
50 Hz, instead of the 800 Hz required of the final design. Nevertheless, a number of key
design features such as injection mode-locking, timing jitter, bandwidth and wavelength
control could all be verified with this low average power proof-of-principle laser.
Injection mode-locking has been previously used to produce short pulses in CO2 [40]
and Nd:YAG [43], but to the best of the author’s knowledge at the time of this work,
there has been no description of injection mode-locking being applied to Nd:YAG to
produce long macro-pulses consisting of many micro-pulses with simultaneous control of
the bandwidth.
This chapter presents the design and characterisation of an injection mode-locked
Nd:YAG oscillator. It begins with a description of the Nd:YAG laser head in Section 3.2
with details of the Nd:YAG crystal geometry, pumping and cooling configuration and
multi-mode power output. Then Section 3.3 describes the resonator design and the com-
bination of intracavity telescopes and resonator length required to achieve dynamic stabil-
ity. A Description of the seed pulse source is given in Section 3.4 for which measurements
are presented that show variable duration sub-nanosecond seed pulses can be created. In
39

40 CHAPTER 3. DESIGN VERIFICATION EXPERIMENTS
(a) (b)
Figure 3.1: The side-pumped, top and bottom cooled, Brewster-angled Nd:YAG slab, a),
and laser diode arrays, b), used for the design verification experiments.
Section 3.6 injection mode locking in Nd:YAG is demonstrated. Results are presented
that show the laser’s spectral bandwidth can be controlled over a useful range and the
timing jitter of the micro-pulses is sufficiently low.
3.2 Laser head
The proof-of-principle laser head, in part provided courtesy of TRW Inc., consists of a
1 at. % doped Nd:YAG zigzag slab with Brewster-angled entrance and exit faces and
measures 4.32 mm in width, 4.00 mm in height and 36.14 mm in length [73]. The slab
is side-pumped in the zigzag plane by two 808 nm quasi-cw laser diode arrays and is
clamped between copper blocks to enable conduction cooling through the top and bottom
surfaces. The copper blocks and the laser diode arrays were water cooled. Figure 3.1
shows pictures of the laser crystal, clamping arrangement and pump diodes.
Each laser diode array was driven by a quasi-cw laser diode driver capable of delivering
80 A, 200 µs pulse-width drive pulses at a maximum repetition rate of 50 Hz. The pulse
energy from the laser diode arrays is shown plotted in Figure 3.2.
This laser head was tested by using a short standing-wave resonator with two flat
mirrors; one maximum reflectivity 1064 nm mirror and the other a 1064 nm output coupler
of 75 % reflectivity. This test resonator was assembled to assess the performance of the

3.3. SLAVE RESONATOR DESIGN DETAILS 41
0 20 40 60 80
0
20
40
60
80
100
120
Ene
rgy
per
puls
e (m
J)
Pump current (A)
Diode 1 Diode 2
Figure 3.2: Laser pump energy produced by the laser diode arrays shown in figure 3.1(b).
laser head and to provide an estimate of the amount of 1064 nm laser power available for
extraction. The output power from this resonator is plotted in Figure 3.3 showing that a
maximum 1064 nm output energy of 60 mJ was obtained with a slope efficiency of 46 %.
The results from other zigzag slab lasers reported in the literature show a reduction in
slope efficiency of around one half to two thirds when running in a single transverse mode
as compared to muli-mode [74], and this reduction would correspond to a reduction in
pulse energy from 60 mJ to 20-30 mJ for this laser system, which in excess of the 10-15 mJ
required from this proof-of-principle laser. This is verified experimentally in Section 3.6.2.
3.3 Slave resonator design details
The slave laser head was included in a travelling wave ring resonator for injection mode-
locking. The design of the resonator was discussed in Section 2.4 and a schematic of the
design showing the zigzag slab and other intracavity elements is displayed in Figure 3.4.
This set-up was used to obtain the experimental results presented in this chapter.
A π-polarized seed pulse is injected through the TFP for injection mode-locking and
converted to σ by the half wave plate. The Brewster angled windows of the laser slab cause

42 CHAPTER 3. DESIGN VERIFICATION EXPERIMENTS
0 50 100 150 200 250 0
10
20
30
40
50
60
70 Slope efficency 46%
O
utpu
t ene
rgy
(mJ)
Total pump energy (mJ)
Figure 3.3: Output energy using a flat-flat standing-wave resonator with one max-R
mirror and a R=75 % output coupler.
TFP
mirror
HWP
mirrormirror
Q-switchSlab
telescope
pulseslicerNPRO
Figure 3.4: A schematic of the ring laser used for the proof-of-principle tests. The design
uses a zigzag Nd:YAG slab, KD*P Q-switch and a combination of polarizer (TFP) and half
wave plate (HWP) to facilitate injection mode-locking and pulse stretching. Telescopes
are included to reduce the resonator length while maintaining dynamic stability.

3.3. SLAVE RESONATOR DESIGN DETAILS 43
a 30 % reflection loss on the first round trip, but before the second round trip, voltage is
applied to the Q-switch and the now pi-polarized pulse builds up rapidly with low loss.
The Q-switch is a dual crystal KD*P cell, with a half wave voltage of 3.4 kV for 1064 nm.
This cell was used for these initial experiments as it was available from a previous project,
but was replaced with a BBO cell for later work as discussed in section 4.2.
The resonator was configured for maximum dynamic stability by optimising the res-
onator length and incuding intra-cavity telescopes. These topics will be discussed in the
following sections.
3.3.1 Resonator stability
With high power lasers, the large pump power and quantum defect can lead to significant
amounts of heat deposited in the laser crystal. A well-designed laser head will minimize
thermal wavefront distortion, but there will inevitably be some effects such as thermal
lensing and thermal birefringence [75]. With careful design of the resonator architecture,
however, the effect of this distortion can be reduced. Thermal birefringence, for example,
can be compensated by using two laser heads with an intermediate quarter-wave plate to
cancel out birefringence [76], but with a slab-type laser crystal, as was chosen for this work,
the effects of thermal bi-refringence are already reduced by the zigzag optical path [77].
Thermal lensing however, is still a problem in slab lasers and if it is not accounted for in
the design of the resonator the maximum TEM00 mode power obtainable will be reduced.
Furthermore, lasers are often required to operate in conditions where the thermal lens
changes with time. These changes could be caused by changes in pump power, if the laser
is required to operate at different average powers, or could be due to aging effects such as
the deterioration of laser diode output, or misalignments of the cavity optics resulting in
different amounts of energy being extracted from the laser head. Hence it is often required
that a laser has dynamic stability [78].
Dynamic stability is achieved if the spotsize of the laser mode inside the slab, ωslab,
is made insensitive to changes in the focal power of the induced thermal lens, ftherm. If
the mode is too large, then losses can occur due to the beam clipping on the slab edges
and conversely, if the beam is too small then it will not adequately overlap the pumped
volume resulting in inefficient energy extraction. So for dynamic stability, the required
condition is:∂ωslab
∂ftherm
= 0 (3.1)
To see how this equation applies to the ring resonator of figure 3.4, we first consider the
ring resonator without intra-cavity telescopes as shown in figure 3.5. The inclusion of the

44 CHAPTER 3. DESIGN VERIFICATION EXPERIMENTS
HWPmirror
slabQ-switchmirror
TFP
Seed pulse Output
lens
Figure 3.5: A traveling ring resonator similar to Figure 3.4 but with no intra-cavity
telescopes and with a stabilizing lens.
ftherm fm
curved mirror
f
L
mirror (TFP)
Figure 3.6: A standingwave hemispherical resonator with the same ABCD matrix as
Figure 3.5.
telescopes is treated later, in Section 3.3.2.
To apply equation 3.1 to the resonator of Figure 3.5 it is necessary to have an analytic
expression for ωslab, written in terms of other resonator parameters. This can be obtained
by treating the ring resonator as a standing wave hemispherical resonator, for which a
simple equation for ωslab already exists. This treatment is legitimate, provided the two
resonators are equivalent, ie. they have identical round trip ABCD matricies. An example
equivalent resonator is shown in Figure 3.6, for which the slab is represented by a lens of
focal length ftherm and the curved mirror is represented by the combination of the lens,
fm, and flat mirror.
It can be shown that for a hemispherical resonator, the spotsize at the right hand side
mirror, ωslab, is given by [79]
ω2slab =
λf
π
√
L
f − L(3.2)
with f = ftherm + fm. Taking the derivative of equation 3.2 with respect to ftherm gives
∂ωslab
∂ftherm
=1
4
(
f − 2L
f − L
)(
1 +ftherm
fm
)
−1ωslab
ftherm
(3.3)

3.3. SLAVE RESONATOR DESIGN DETAILS 45
from which we see that the condition for dynamic stability, equation 3.1, occurs when
f = 2L, which requires that
L =ω2
slabπ
2λ(3.4)
Equation 3.4 shows that the required cavity length, L, is dependent on the square of the
spotsize ωslab.
For the proof-of-principle laser head of a beam size ωslab =1.2 mm is required to
adequately fill the crystal aperture and efficiently extract the available pump energy. So,
if operating at 1064 nm, equation 3.4 implies a cavity round trip length of 4.25 m is
required to achieve dynamic stability, while if operating at 1319 nm, the length is 3.43 m.
Both of these lengths are comfortably in excess of the minimum length required for robust
injection mode-locking with seed pulse durations of 1 ns, as discussed in Section 2.3. A
resonator length of 4.25 m will have a free spectral range (FSR) of 70 MHz1, meaning that
approximately 14 longitudinal modes will contribute to a mode-locked pulse of bandwidth
1 GHz.
3.3.2 Intra-cavity telescopes
Hanna [78] has shown that the introduction of intra-cavity telescopes allows the resonator
length to be reduced while maintaining dynamic stability. With an intra-cavity telescope,
the expression for the cavity length, equation 3.4 becomes [78]
L =ω2
slabπ
2M2λ(3.5)
where M is the telescope magnification. An intra-cavity telescope may be useful in the
final guide star laser design, as it allows a spotsize larger than 1.2 mm to be used, reducing
the risk of damage to optics from the high-peak-power micro-pulses, without requiring
an impractically large resonator length to maintain dynamic stability. An intra-cavity
telescope could also be used in the 1064 nm laser to reduce its length from 4.25 m to
3.43 m, making the length of the 1064 nm and 1319 nm slave lasers equal and thus
ensuring proper overlap of 1064 nm and 1319 nm micro-pulses in the SFG crystal. For
these reasons, the subscale, 1064 nm slave laser had intra-cavity telescopes incorporated
in its resonator design, as shown in Figure 3.4, to test the viability of this concept.
1For a ring resonator FSR=c/L where c is the speed of light and L is the round trip length.

46 CHAPTER 3. DESIGN VERIFICATION EXPERIMENTS
3.4 Seed pulse generator
To injection mode-lock the slave laser, a wavelength tuneable, transform limited seed
pulse is required, with a pulse-width that can be adjusted to set the required bandwidth.
Previous authors have reported the generation of seed pulses by gating a single pulse out
of a cw mode-locked master laser [43] or by slicing the seed pulse from a single-frequency
cw beam using a Pockels cell (PC) and fast driver [40]. We chose the latter technique
for its simplicity and ease of wavelength control when using a cw NPRO as the master
laser. To drive the PC, high voltage pulses of nanosecond or sub-nanosecond duration are
required, which can be produced using avalanche transistor circuits [80]. These devices
can produce pulses with amplitudes of over 4 kV and rise times of 100 ps, as well as having
long lifetimes, of the order of 1010 shots, making them suitable for guide star applications.
It is difficult to create a high voltage pulse source with a variable pulse duration using
these devices, however. We thus employed a dual Pockels cell system, shown in Figure 3.7,
that uses two fast, 50 ohm Pockels cells [81], each driven by an independent avalanche
transistor driver [82]. In this system, the first Pockels cell (PC1) receives a 100 ps rise
time, 1 ns duration, 4 kV voltage pulse, creating the leading edge of the optical seed pulse,
then after a short delay, a 100 ps rise time, 3 ns duration, 4 kV voltage pulse is applied
to PC2, producing the trailing edge of the seed pulse. The delay between firing the first
and second PC sets the seed pulse width. The delay was introduced by controlling the
arrival time of the trigger pulse to the 3 ns PC driver using an in-house built zero-jitter
control box shown in Appendix B.1. This device can implement delays ranging between
0 and 3 ns in 100 ps steps by switching in different lengths of coaxial cable to delay the
trigger pulse.
Traces of the high voltage PC drive pulses from the 1 ns and 3 ns pulsers are displayed
in Figure 3.8(a) and Figure 3.8(b), which were taken using a fast sampling oscilloscope
after a 78 dB attenuation, using the high voltage, high bandwidth attenuator described
in Appendix C.
Using the dual Pockels cell pulse slicing technique, optical seed pulses with widths
between 200 ps and 1 ns have been produced, with examples shown in Figure 3.9. The
near-cw light rejected by the second polarizer in Figure 3.7 could be used to provide
a cw reference to the sodium wavelength via a secondary SFG system, as discussed in
Section 2.2.
As can be seen in Figure 3.8, the electrical pulses produced by the avalanche transistor
pulsers have significant post-pulse noise, typical of these devices [80]. This noise would
manifest itself as a tail to the seed pulses if a single PC system is used. By having a second

3.5. Q-SWITCH DRIVER 47
NPRO
PC1PC2
cw Na ref.
A
Figure 3.7: The dual Pockels cell pulse slicer used to create variable duration seed pulses
for injection mode-locking. It consists of a single frequency cw master source (NPRO) two
Pockels cells, PC1 and PC2, and three polarizers. The double-headed arrows indicate the
polarization of the light. The near-cw light reflected off the second polarizer can be used
to provide a cw reference to the sodium wavelength. If a half wave plate is inserted at
point “A”, a cw beam is transmitted through the system that can be used for alignment
purposes.
PC that is diven by a long duration electrical pulse, the noise tails will be extinguished as
all light incident on the third polarizer in Figure 3.7 will be reflected while PC2 has half
wave volts. The extinction of the post-pulse noise is demonstrated in Figure 3.9(d) which
shows a clean seed pulse with little trailing noise. This represents another significant
advantage of the dual PC seed pulse source over a single PC system.
With the fast 50 ohm PCs used in this system [81], the PC behaves like a section of
a 50 ohm transmission line, so the high voltage drive pulse applied to the cell needs to
be terminated once it has passed through, to avoid back-reflections. To do this, the exit
port of the PC was connected to a 100 m length of RG 58 coaxial cable, which attenuates
the high frequency components of the pulse (eg. by 36 dB/100 m at 400 MHz frequencies
and greater for higher frequencies [83]) and terminated by a series-parallel combination
of carbon film resistors. It was observed that the drive pulse exiting the PC appeared to
be unchanged after passing through the cell and could possibly be used to drive either
the second PC via an intermediate length of cable, or it could be used to drive PC1 in
the 1319 nm laser system, resulting in zero timing jitter between 1064 nm and 1319 nm
micro-pulses, thereby improoving the SFG efficiency.
3.5 Q-switch driver
To trap the injected seed pulse inside the ring, the Q-switch is changed from no polariza-
tion rotation to half-wave rotation in approximately the time it takes the seed pulse to
make one round trip of the ring resonator. If the Q-switch is driven slower than this then
the resulting large out-coupling fraction for the π-polarized pulse could attenuate the seed

48 CHAPTER 3. DESIGN VERIFICATION EXPERIMENTS
0 1 2 3 4 5
-0.05
0.00
0.05
0.10
0.15
0.20
Vol
tage
(A
.U.)
Time (ns)
(a) 1ns
0 2 4 6 8 10
-0.05
0.00
0.05
0.10
0.15
0.20
Vol
tage
(A
. U.)
Time (ns)
(b)
Figure 3.8: Measured high voltage electrical pulses from the (a 1 ns and (b) 3 ns avalanche
transistor pulsers. The pulses were attenuated using the in-house built high voltage high
bandwidth attenuator described in Appendix C. The measurement bandwidth is 2 GHz.

3.5. Q-SWITCH DRIVER 49
0.0 0.5 1.0 1.5 2.0
Am
plitu
de (
a.u.
)
Time (ns)
(a) FWHM = 0.2 ns
0.0 0.5 1.0 1.5 2.0
Am
plitu
de (
a.u.
) Time (ns)
(b) FWHM = 0.6 ns
0.0 0.5 1.0 1.5 2.0
Am
plitu
de (
a.u.
)
Time (ns)
(c) FWHM = 1 ns
0 1 2 3 4 5
Time (ns)
Am
plitu
de (
AU
)
(d) FWHM = 1 ns
Figure 3.9: Example of variable duration optical pulses prduced by the pulse slicer of
Figure 3.7. These measurements were taken using a 12 GHz photodiode and 20 GHz
sampling oscilloscope

50 CHAPTER 3. DESIGN VERIFICATION EXPERIMENTS
pulse below the noise level of amplified spontaneous emission and the slave would not be
injection mode-locked. The Q-switch drive pulse, therefore, needs a rise time from 0 V
to 3.4 kV of approximately 10 ns. In addition, the long duration of the output pulses
from this laser require a drive pulse width in excess of 1 µs. Circuits that can deliver
either fast rise times or long duration pulses exsist in the literature [84] [85] [86] as these
circuits are commonly used for lasers that have high or low gain respectively. But for a
low-gain injection mode-locked source, the Q-switch drive pulse needs a combination of
the two. Circuit designs for this type of device have not previously been published. Work
was therefore undertaken to produce a fast rise time, long pulse width Q-switch driver
suitable for use in the injection mode-locked oscilator described in this chapter. Details
of this work were published [87] and can be found in Appendix A.
3.6 Injection mode-locked slave laser performance
3.6.1 Aligning the ring oscillator
To align the slave resonator, the laser was first set in standing-wave configuration using
two flat output couplers, specifically selected for low wedge angle. The beam emanating
from each side was used to align the Q-switch, mirrors, telescopes, HWP and TFP of the
ring resonator (Figure 3.4). Care was taken to set the TFP at the exact angle required
to provide maximum reflection of σ-polarization while simultaneously transmitting max-
imum π. Several TFP’s were examined and the one with highest reflection and lowest
transmission was selected.
3.6.2 Pulse energy
To couple the seed pulse energy into the slave resonator efficiently, the seed pulse source
(i.e. the NPRO) must be mode matched to the resonator. To do this, the mode size and
divergence angle of the seed pulse beam must be the same as the mode size and divergence
angle of the slave mode inside the resonator [88].
To mode-match the seed beam, a half wave plate was inserted between the first polar-
izer and first Pockels cell of the seed pulse generator (point “A” on Figure 3.7) to allow the
cw NPRO beam to pass through the pulse slicer for alignment purposes. The mode size
of this beam was measured using a CCD camera. Then, to mode-match the seed beam
onto the slave mode, a single lens with focal length f =1.5 m was inserted between the
NPRO and the outcoupler of the slave (shown on Figure 3.4). Afterwards, the half wave
plate was removed, and the seed pulses produced by the pulse slicer were used to injection

3.6. INJECTION MODE-LOCKED SLAVE LASER PERFORMANCE 51
100ns
Figure 3.10: Injection mode-locked output from the slave laser showing a burst of short
micro-pulses with the overall macro-pulse envelope of a Q-switched laser.
mode-lock the slave resonator to produce the macro-micro pulse burst waveform shown
in Figure 3.10. This waveform consists of a series of short 1 ns micro-pulses, separated by
the round trip time of the resonator (around 12 ns), as required for the guide star design.
The laser produced pulse energies in excess of 15 mJ in a near-diffraction-limited beam
(97 % fit to gaussian) at a repetition rate of 50 Hz. Figure 3.11 shows the output pulse
energy of the laser. The slope efficiency is 16 %.
It was observed that the output micro-pulse shape closely resembled the input seed
pulses. Traces of a seed pulse overlayed with an output micro pulse are displayed in
Figure 3.12.
3.6.3 Micro-pulse jitter
For the injection mode-locked guide star design to be viable, it is critical that the timing
jitter between 1064 nm and 1319 nm micro-pulses be small compared to the micro-pulse
width to ensure good SFG efficiency using the high-peak-power macro-micro pulse burst
waveform. To measure the timing jitter, the leading edge of an individual micro pulse
was monitored over many macro-pulses using a 12 GHz photodiode and 20 GHz sampling
oscilloscope. The oscilloscope was independently triggered by a commercial, low-jitter
trigger generator at a fixed time after the trigger given to the first avalanche transistor
pulser in the pulse slicer. The scatter in arival time of the micro-pulse edge is a measure
of the combined jitter from the trigger generator, avalanche transistor pulser and any

52 CHAPTER 3. DESIGN VERIFICATION EXPERIMENTS
60 80 100 120 140 160 180 200 0
2
4
6
8
10
12
14
16
18
Slope efficiency 16 %
O
utpu
t ene
rgy
(mJ)
Pump energy (mJ)
Figure 3.11: Output energy of the injection mode-locked slave laser.
jitter due to seed pulse amplification in the slave laser. The total jitter was measured to
be less than 12 ps rms. An example screenshot of a jitter measurment, taken with the
sampling oscilloscope, is shown in Figure 3.13 and a schematic diagram explaining the
content of this screenshot is shown in Figure 3.14. The micro-pulse jitter did not vary for
micro-pulses at the start, middle and end of the macro-pulse, indicating that the passage
of the micro-pulse through the slave laser has a negligible effect on the timing jitter.
3.6.4 Bandwidth control
An important aspect of the guide star laser system design is the ability to control the laser’s
spectral width and to accurately match the spectral width to the Doppler-broadened
linewidth of atmospheric sodium. This ensures that all the sodium atoms participate in
the fluorescence for maximum brightness of the artificial star. To achieve this, it was
proposed to control the micro-pulse width, so that the Fourier transform of the micro-
pulse temporal shape gives the desired frequency bandwidth. Section 3.4 demonstrated
that the seed pulse source can produce low energy seed pulses with an adjustable width
ranging from 0.4 ns to 1.0 ns and in this section, it is shown that when the slave laser is
injection-mode-locked with these seed pulses, the bandwidth of the high energy output of

3.6. INJECTION MODE-LOCKED SLAVE LASER PERFORMANCE 53
0.0 0.5 1.0 1.5 2.0 2.5 3.0 3.5 4.0 -0.02
0.00
0.02
0.04
0.06
0.08
0.10
0.12
Seed pulse Slave micro pulse
Time (ns)
Am
plitu
de (
AU
)
Figure 3.12: A comparison of an injected seed pulse and an output micro-pulse from the
injection mode-locked slave laser. Both traces were taken with the same photodiode and
sampling oscilloscope and are averaged over several seconds (the sampling oscilloscope
cannot measure in real time).
Figure 3.13: Measurement of timing jitter made with a 20 GHz sampling oscilloscope.
The geen dots are sample points from the front edge of a micropulse (the fast photodiode
used gives a negative output) and the white lines show a histogram of the sample point
distribution. The rms jitter is 11.6 ps.

54 CHAPTER 3. DESIGN VERIFICATION EXPERIMENTS
# o
f p
oin
ts
time
micro-pulse
a) b)
time
ph
oto
dio
de
vo
lta
ge
dtdt
t0
t0
Figure 3.14: These sketches have been included to explain the information contained
in Figure 3.13. Part a) shows a micro-pulse from the output of the slave laser and an
expanded view of the sample points in the leading edge of this micro-pulse. These sample
points are the green dots in Figure 3.13. The width of this line is representative of the
timing jitter of micro-pulses. Part b) is a histogram showing the number of sample points
that arive in each time interval dt. The histogram is shown as the white lines in Figure 3.13
and is used to calculate the rms jitter.

3.6. INJECTION MODE-LOCKED SLAVE LASER PERFORMANCE 55
the slave laser can be controlled.
To measure the laser’s bandwidth, the injection mode-locked pulse burst waveform
from the slave laser was passed through a commercial spherical-mirror scanning Fabry-
Perot interferometer (FP). The free spectral range (FSR) of this device was 10 GHz (mirror
separation 7.5 mm, FSR = C4d
). The resolution was measured by recording the FWHM
of the transmission peak from a cw, single frequency NPRO beam and was found to be
40 MHz. The 40 MHz transmission peak and the 10 GHz FSR are displayed schematically
in Figure 3.15. One of the FP mirrors is mounted on a piezoelectric actuator which allows
the FP mirror separation to be varied, thereby providing tunability of the FP transmission
peak by adjusting the voltage on the piezo. For the bandwidth measurements, a saw-tooth
voltage was applied to the piezo as shown in the upper part of Figure 3.15. This scanned
the transmission peak over one FSR (10 GHz) every 93 ms. The slave laser output is
pulsed with a repetition rate of 50 Hz (20 ms period). Whenever the FP transmission
is tuned to coincide with part of the laser’s spectrum, and a laser pulse is incident, a
pulse of laser light will be transmitted through the FP with amplitude proportional to
the fraction of laser power at the FP transmission frequency. The throughput of the FP
was recorded with a photodiode and a digital oscilloscope set to integrate the throughput
pulses. Over a period of a few seconds, the shape of the laser’s spectrum became visible,
providing the images of Figure 3.16. This figure shows the injection mode-locked laser
spectrum for input seed pulse widths ranging from 0.57 - 1.02 ns. The laser bandwidth
was taken as the FWHM of a Gaussian fit to the pictures.
Figure 3.17 summarizes the results of the measurements and shows the laser’s band-
width plotted against the seed pulse width. This result shows that the laser’s bandwidth
can be controlled by adjusting the seed pulse width and that the bandwidth was adjusted
over the range of 0.8 GHz - 2.3 GHz. The bandwidth of the final SFG is expected to be
approximately twice that of the fundamental wavelengths [17] and the results obtained
thus essentially satisfy the system requirements. For bandwidths lower than 0.8 GHz, a
longer seed pulse would be required, which can be generated by driving the first PC in
the pulse slicer with the 3 ns pulser, as is demonstrated later, in Section 7.4.6.
A fit to the curve of Figure 3.17 shows that the time bandwidth product of the laser is
0.91 indicating that the laser is essentially transform limited. For a theoretical Gaussian-
shaped transform limited pulse, the value for the time-bandwidth product is 0.44 while for
a rectangular “top-hat” pulse shape the time-bandwidth product is 0.9. The complicated
structure of the real laser pulses (Figure 3.9) makes it difficult to determine what the
minimum time-bandwidth product for this pulse shape would be, especially as the pulse
profile changes shape slightly as the pulse is shortened.

56 CHAPTER 3. DESIGN VERIFICATION EXPERIMENTS
frequency
time
voltage
Tra
nsm
issio
n
FSR = 10 Ghz
Fabry- Perottransmission
40 MhzLaser spectrum
~1 GHz
93 ms
Figure 3.15: A schematic diagram showing the saw tooth voltage applied to the piezo on
the Fabry Perot mirror (upper) and the FP transmission (lower). The transmission of
the FP is scanned repeatedly over the free spectral range (FSR) to build up the outline
of the laser spectrum.
With this spectrum measurement technique it was not possible to record the spectrum
of individual pulses; the spectra shown in Figure 3.16 are made up from the integration
of many macro-pulses. It is, however, expected that the measurements in Figure 3.16
are representative of the spectrum of each individual macro-pulse, as measurements of
the temporal pulse shape, such as Figure 3.12, did not show evidence of pulse to pulse
variations in the temporal shape of macro/micro pulses (Figure 3.12 shows a trace from
a sampling oscilloscope which builds up from sample points taken from multiple macro-
pulses. If there were pulse to pulse shape variations, the lines of this trace would show
more scatter and the features would be blurred).
3.7 Discussion and conclusions
This chapter presented the design and performance of a proof of principle 1064 nm injec-
tion mode-locked laser. Many key concepts of the guide star design were demonstrated
in this section, in particular, it was demonstrated for the first time, that injection mode-
locking combined with Q-switching, can be successfully applied to Nd:YAG to produce
a burst of of short duration micro-pulses in a Q-switched macro-pulse, while simultane-
ously maintaining control of the laser’s bandwidth. The laser’s bandwidth was controlled

3.7. DISCUSSION AND CONCLUSIONS 57
(a) 0.83 GHz (b) 0.97 GHz
(c) 1.3 GHz (d) 1.6 GHz
Figure 3.16: Macro-pulse spectra measured with a scanning Fabry-Perot interferometer
with one horizontal division equal to 540 MHz. The micro-pulse widths for these pictures
are (a) 1.02 ns, (b) 0.93 ns, (c) 0.76 ns and (d) 0.57 ns

58 CHAPTER 3. DESIGN VERIFICATION EXPERIMENTS
0 200 400 600 800 1000 12000
500
1000
1500
2000
2500 = 0.91
La
se
r b
an
dw
idth
(M
Hz)
Micro-pulse width (ps)
D Dt u
Figure 3.17: Plot of measurements of slave laser bandwidth versus the width of the seed
pulse. The curve is a fit to the data with a time-bandwidth product of 0.91 as shown.
over a useful range of 0.8 - 2.3 GHz and the laser micro-pulses were shown to have very
low timing jitter, an important requirement for efficient SFG. Furthermore, resonator
design concepts such as dynamic stability and intracavity telescopes were trialed in this
experiment and found to be practical and useful for a power-scaled version of this laser.

Chapter 4
Q-switched pulse stretching
4.1 Introduction
1Conventional Q-switched solid state lasers, that have a constant out-coupling fraction,
produce pulses that have typical durations of 10-100 ns. For the guide star laser, it is
necessary to have longer duration pulses (1-3 µs) to reduce the effects of bleaching in the
sodium layer [89]. More generally, long pulses are also required for other applications
including coherent laser radar systems to increase the single-shot velocity resolution.
The sum frequency macro-micro pulsed guide star laser would additionally benefit
from long-duration pulse envelopes having near flat-tops. This would enable improved
conversion efficiency by allowing a tighter focus within the nonlinear crystal, giving a
higher peak power over the whole pulse duration and improved sum-frequency efficiency,
while still remaining below damage threshold. A flat-topped pulse source will also allow
more uniform bleaching and thus more efficient Na return.
One way to increase the duration of Q-switched pulses is to increase the resonator
length [49], but this approach is not always practical, is limited by the mechanical sta-
bility of the resonator and the dynamic stability of the laser mode in high power lasers
with varying thermal effects [78]. Other techniques for increasing or stretching the du-
ration of Q-switched pulses have been reported, including using intra-cavity non-linear
absorbers [90] [91] or second harmonic generation [92] to limit the intra-cavity peak power
and thus slow the development of the giant pulse. Pulse stretching by discarding power
from the resonator has also been demonstrated [46] [47] [93] [48]. While pulse durations
of up to 1 µs have been achieved, the pulse energy decreased by as much as a factor of
4 when compared with an un-stretched Q-switched pulse at the same pump energy. In
1Much of the material contained in this chapter was also written up as a paper which can be found
in Appendix A
59

60 CHAPTER 4. Q-SWITCHED PULSE STRETCHING
HWPmirror
slabQ-switchmirror
TFP
Seed pulse Output
lens
Figure 4.1: The ring resonator used for pulse stretching experiments. The round trip
length is 4.2 m.
theory, more efficient pulse stretching can be achieved by using the modulated loss as the
laser output [93]. Pulse stretching factors of 7-10 have been demonstrated [93], with a
maximum duration of 650 ns and a flatness of 7 % for 500 ns pulses, but the difference in
energy between stretched and unstretched pulses was not reported. Using the polarizer
as the out coupler in a standing-wave laser significantly complicates injection seeding of
the Q-switched laser, as the giant pulse travels back towards the master laser, requiring
large amounts of optical isolation to prevent destabilization and potential damage of the
master laser.
In this chapter, a new pulse stretching technique is described and demonstrated, which
uses the novel ring resonator of Chapter 3 and a throttled Pockels cell Q-switch to produce
flat-topped Q-switched pulses stretched by a factor of 4.5, without any reduction in pulse
energy. The chapter is structured as follows: Firstly, a description of the experimental
set-up is presented in Section 4.2, then a numerical model is described which predicts
the shape and energy of laser pulses for different Q-switch drive waveforms. Section 4.4
describes the electrical circuit which produces the high voltage pulses used to drive the
Q-switch then in Section 4.5, experimental measurements are presented which show the
successful production of long duration, flat-topped Q-switched laser pulses.
4.2 Experimental set-up
For the pulse stretching experiments detailed in this chapter, a ring resonator without
intra-cavity telescopes was used as shown in Figure 4.1. General telescope needs were
satisfied with a single 2 m lens in this design.
For this resonator, the TFP acts as a polarization dependent output coupler as it
transmits (outcouples) all π-polarized light and reflects all σ-polarized light incident upon

4.2. EXPERIMENTAL SET-UP 61
it. The voltage on the Q-switch controls the amount of π-polarized light outcoupled on
each round trip. With this configuration, the outcoupling fraction can be changed rapidly
by adjusting the voltage on the Q-switch which in turn controls the round trip gain of
the laser, G, according to2
G = (1 − loc)eg0l (4.1)
where loc is the outcoupling fraction determined by the Q-switch and is given by
loc = sin2(
π
2
V
VHW
)
(4.2)
for which V is the voltage applied to the Q-switch, and VHW is the Q-switch half-wave
voltage.
If a suitable Q-switch drive waveform is applied, the round trip gain can be controlled
to slowly release the energy stored in the gain medium and produce long-duration output
pulses. Moreover, since there are no losses introduced using this technique, high efficiencies
are possible. It is important to note that our technique does not involve the storage of
large amounts of optical power within the resonator, then the subsequent slow release of
this power using the outcoupler. Approaches using such methods tend to be inefficient
due to the cumulative effect of the repeated round trips of large amounts of optical energy
through the Q-switched resonator having typical round trip losses of 5-10 %. In contrast,
with our technique, the pulse energy remains stored inside the laser gain medium and the
Q-switch voltage waveform is used to control the round trip emission rate from the gain
and thereby slowly releasing the stored energy from the gain medium.
A KD*P Q-switch was used for the initial experiments of Chapter 3 since it was
available from a previous project, but for the pulse stretching experiments reported here a
BBO cell was used to take advantage of the low piezo electric ringing in this material [80].
The presence of piezo-electric ringing makes the polarization rotation of the Q-switch
harder to control and the pulse stretching more difficult, as the voltage applied to the
Q-switch does not independently determine the out-coupling fraction. Measurements of
the piezo-electric ringing in the KD*P cell is shown in Figure 4.2(a), which shows an
optical pulse sliced out of a cw beam by the Q-switch placed between crossed polarizers.
As can be seen, an oscillation is present in this waveform, even though the drive pulse
applied to the Q-switch had a flat top. Figure 4.2(b) shows the response of the BBO cell,
also driven by a flat-topped drive pulse, and shows little piezo-electric ringing.
Unfortunately, BBO has a large half wave voltage of around 8 kV for a dual-crystal cell
at 1064 nm, which complicates the drive electronics, but this difficulty can be overcome,
2This formula ignores other sources of loss such as scatter, absorption etc. They can be included by
adding a loss term to the multiplication factor (1 − loc) in Equation 4.1.

62 CHAPTER 4. Q-SWITCHED PULSE STRETCHING
as is demonstrated later in the chapter.
4.3 Numerical modelling of pulse stretching
Lowdermilk and Murray [94] have presented a numerical model for calculating the build
up of pulse fluence in a cavity-dumped regenerative amplifier that is seeded by a short
optical pulse. The model assumes a uniform gain distribution and a top-hat pulse but has
also been shown to accurately describe the performance of resonators with Gaussian beam
profiles [43]. We have adapted this model to describe pulses stretching in an injection
mode-locked Q-switched laser.
In their analysis, Lowdermilk and Murray begin with Maxwell’s wave equation de-
scribing the optical electric field and a Schroedinger-like equation for the polarization
and population inversion within the gain medium, then by applying the aforementioned
approximations and other generalizations typical of solid state laser systems, they arrive
at a pair of recurrence equations that describe the build up of pulse fluence in the laser
cavity. In these equations, the intra-cavity pulse fluence, Jk, and small signal gain, gk,
after k passes of the seed pulse around the laser amplifier are related by [94]
Jk+1 = TJs lnGk[exp(Jk)/Js) − 1] + 1 (4.3)
gk+1 = gk − ∆Jk/2Js (4.4)
where
Gk = exp(gk) (4.5)
∆Jk = Jk+1T−1 − Jk (4.6)
Js is the saturation fluence and T is the energy transmission coefficient for one pass of
the amplifier, including both loss and out-coupling. These equations have been used to
model our pulse-stretched, injection mode-locked ring laser, by including a variable term
in the round trip transmission:
T = 1 − l − loc (4.7)
where l is the fixed round trip loss due to scatter, absorption, misalignment and beam
clipping at apertures. loc is the out-coupling fraction:
loc = 1 − sin2(
π
2
Vk
VHW
)
(4.8)
where Vk is the voltage applied to the Q-switch for pass k, and VHW is the Q-switch
half-wave voltage.
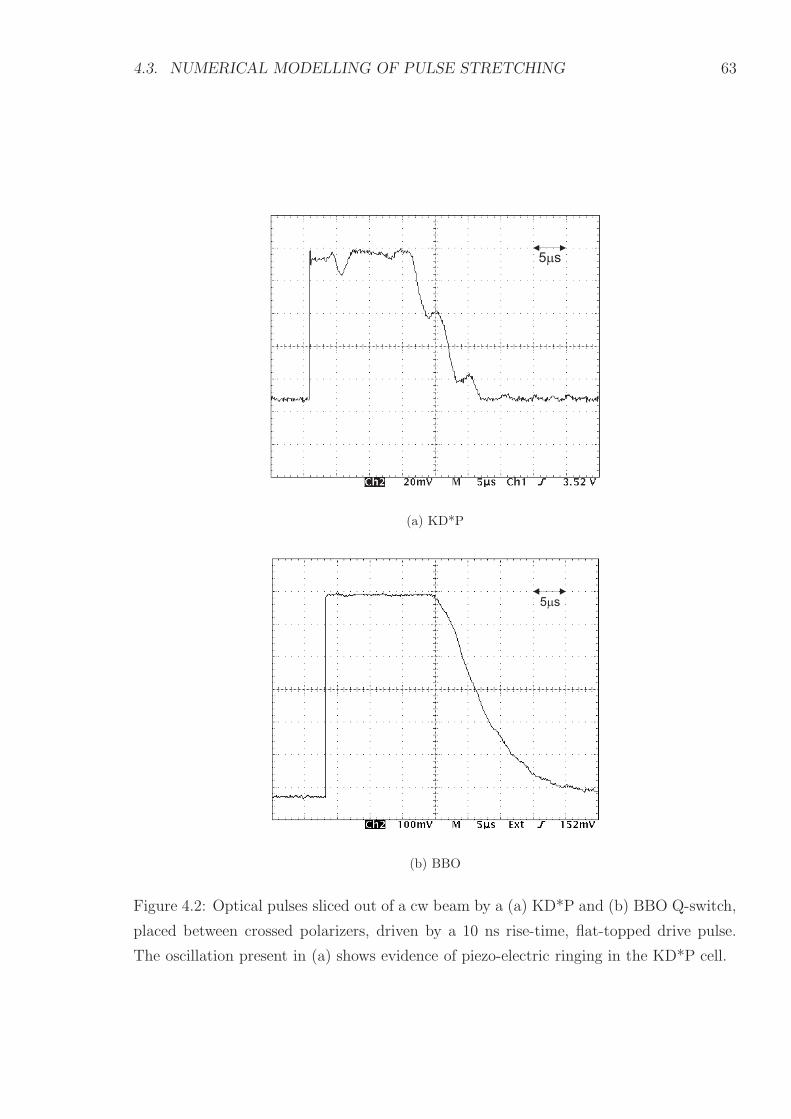
4.3. NUMERICAL MODELLING OF PULSE STRETCHING 63
5 sm
(a) KD*P
5 sm
(b) BBO
Figure 4.2: Optical pulses sliced out of a cw beam by a (a) KD*P and (b) BBO Q-switch,
placed between crossed polarizers, driven by a 10 ns rise-time, flat-topped drive pulse.
The oscillation present in (a) shows evidence of piezo-electric ringing in the KD*P cell.

64 CHAPTER 4. Q-SWITCHED PULSE STRETCHING
The output pulse energy is given by
E =∑
k
Ek =∑
k
JkAloc (4.9)
where Ek is the energy out-coupled after each pass and A is the cross-sectional area of
the laser mode in the gain medium.
For our analysis, we used an injected pulse energy of 3×10⁻¹⁰ J and saturation fluence
Js = 0.66 J/cm2 [61]. The values of l, A and g0 were determined by measuring the energy
and duration of the injection-mode-locked macro pulse for conventional Q-switching and
adjusting the parameters to yield the best agreement. The measurements and model
prediction for different pump levels are shown in Figure 4.3. For each pump level, the
voltage was adjusted to provide the maximum pulse energy in both the simulated and
measured data. This procedure resulted in g0 = 0.31 for the pump energy used to produce
the 10 mJ output pulse. Values of l and A were used that were consistent with values
expected for the resonator (see Appendix D) and produced good agreement between
theoretical and measured results (Figure 4.3). The values were l = 5.0 % for the round
trip loss and A = 5.5 mm2 for the beam area. These parameters were then used for all
subsequent modelling of the effect of variable outcoupling on the macro-pulse envelope.
The model predicts that Q-switching the injection mode-locked laser using the op-
timum, constant out-coupling at the highest pulse energy in Figure 4.3 yields a macro
pulse duration and energy of 0.41 µs and 10.0 mJ. By shaping the Q-switch voltage wave-
form, the outcoupling fraction is changed and can be used to modulate the optical pulse
shape and stretch the duration. The model was used to investigate the effect of different
waveforms and to determine a waveform that produces long duration flat-topped pulses.
Another requirement is that the waveform must have a shape that can be produced ex-
perimentally using a reliable high voltage circuit. Hence waveforms having exponential
shapes were preferentially modelled as these shapes can be easily produced with long life-
time transistor switches and capacitor-resistor networks, as we shall see in the following
section.
The first Q-switch voltage waveform to be trialled was one having a single step-
exponential fall as shown schematically in Figure 4.4. Initially, half wave voltage is applied
to the Q-switch, allowing the giant pulse to build up rapidly with no outcoupling. Then
the outcoupling is increased sharply by reducing the Q-switch voltage (point t1 in Fig-
ure 4.4) to arrest the build up of the giant pulse and output part of the pulse, then an
exponential rise in Q-switch voltage reduces the outcoupling fraction of the resonator.
Part of this voltage waveform is displayed in Figure 4.5 along with the model prediction
of the laser output for this voltage pulse.

4.3. NUMERICAL MODELLING OF PULSE STRETCHING 65
0 1 2 3 4 5 6 7 8 9 10 11 0
200
400
600
800
1000
1200
1400
Model Measured
Output pulse energy (mJ)
Pul
se w
idth
(ns
)
Figure 4.3: Measured FWHM macro pulse duration plotted against the slaves injection
mode-locked output energy for various pump levels. At each pump level, the Q-switch
voltage was adjusted to maximise the pulse energy. The solid line shows the prediction
of the numerical model for the best fit parameters.
Time
step-exponentialshape
Zerovoltage
Half wavevoltage
t1
Figure 4.4: A sketch showing the overall shape of the Q-switch voltage waveform modelled
in these experiments. This waveform has a single step exponential change in voltage for
pulse stretching.

66 CHAPTER 4. Q-SWITCHED PULSE STRETCHING
0.5 1.0 1.5 2.0 2.5 3.0 3.5 -1.0
-0.9
-0.8
-0.7
-0.6
-0.5
-0.4
-0.3
-0.2
-0.1
0.0
Q-switch voltage Laser output
Time (microsec)
Q-s
witc
h vo
ltage
(re
lativ
e to
hal
f wav
e)
0.0
0.2
0.4
0.6
0.8
1.0
1.2
B
B
A
A
Lase
r ou
tput
(A
.U.)
Figure 4.5: Two Q-switch voltage waveforms, A and B, with the macro pulse envelopes
predicted by the numerical model using best-fit laser parameters determined using the
measurements in figure 4.3. The Q-switch is switched from high loss (Q-switch voltage =
0) to low loss(Q-switch voltage = -1) at Time = 0.
In Figure 4.5 A), a slowly falling exponential waveform is modelled. With this wave-
form, the laser pulse width was increased to 1.71 µs, with an energy decrease of 8 %
to 9.22 mJ and a pulse flatness of < ± 25 %. In Figure 4.5 B) the initial outcoupling
fraction is reduced to prevent the excessive suppression of the giant pulse. This improves
flatness to < ± 6 % and pulse energy to 9.71 mJ (a drop of only 3 %) but results in a
pulse duration of 1.01 µs.
These examples illustrate the general behaviour of the macro-pulse for Q-switch volt-
age waveforms of this type, which have a single exponential increase in Q-switch voltage:
using this approach it is not possible to stretch the duration by more than about twice
that of a constant out-coupling pulse while maintaining a flat-top.
A double-exponential voltage waveform can better satisfy both requirements as shown
in Figure 4.6. The predicted duration and energy of the stretched pulse is 1.73 µs and
9.65 mJ, a 420 % increase and a decrease of only 3.5 % respectively compared to the con-
stant out-coupling pulse, which is also plotted in Figure 4.6. Adding a third exponential
to decrease the out-coupling faster when the pulse intensity starts to decrease, at about
Time = 2 µs in this example, would further stretch the pulse.
The recursive equations 4.3 and 4.4 that were used in this model to describe the

4.3. NUMERICAL MODELLING OF PULSE STRETCHING 67
0.5 1.0 1.5 2.0 2.5 3.0 3.5 -1.0
-0.9
-0.8
-0.7
-0.6
-0.5
-0.4
-0.3
-0.2
-0.1
0.0
B
B A
A
Q-switch voltage Laser output
Time (microsec)
Q-s
witc
h vo
ltage
(re
lativ
e to
hal
f wav
e)
0.0
0.2
0.4
0.6
0.8
1.0
Lase
r ou
tput
(A
.U.)
Figure 4.6: (A) Optimised Q-switch voltage waveform and predicted stretched macro pulse
envelope. (B) Constant out-coupling Q-switch voltage and predicted envelope. Note that
the B envelope has been divided by 3 to facilitate plotting. Both predictions use the
best-fit laser parameters determined from the measurements in figure 4.3.

68 CHAPTER 4. Q-SWITCHED PULSE STRETCHING
Pockelscell
HTS101
HTS81
400k
-5kV 660W 100k100k
6M
-7.3kV
9.4nFB
0.5nFA
2.2nFC
Figure 4.7: Electrical circuit used to drive the Q-switch. It uses two high voltage switches,
HTS 101 and HTS81, two high voltage power supplies, and a combination of resistors and
capacitors to produce the required waveform. The Pockels cell has a nominal capacitance
of 4 pF.
pulse fluence and gain inside the resonator have been shown to reduce exactly to the rate
equations describing the photon density and population inversion in a regular Q-switched
oscillator (not injection mode-locked) for the case when changes in pulse fluence and gain
on successive round trips is small [94]. This indicates that the pulse stretching model
described in this section is not limited to injection mode-locked Q-switched systems, but
is also applicable more generally to injection seeded Q-switched systems that have low
gain.
4.4 Q-switch driver
The circuit used to produce the shaped Q-switch voltage is shown in Figure 4.7 and its
output voltage as a function of time is shown in Figure 4.8. It uses two high voltage
MOSFET switches that can switch voltages of 10 kV (Behlke HTS101) and 8 kV (Behlke
HTS81) with a switching time of around 10 ns. We chose to use MOSFET switches
rather than kryotrons or planar triodes, which were used in previous pulse stretching
circuits [46] [47] [93], as we required a circuit that could operate at a pulse repetition
frequency of 800 Hz for long periods, and contained modern all solid state switches.
Initially, both the switches are open, and two independent high voltage power supplies
charge capacitors A, B and C. At the end of the laser pump pulse, the HTS101 switch
is closed, applying the near half-wave voltage of -7.3 kV to the Q-switch. A voltage less

4.5. RESULTS 69
1.1kV
500ns
t1
t2
Figure 4.8: Q-switch drive pulse used for pulse stretching, produced by the circuit in Fig.
6. The symbols t1 and t2 denote the times at which (1) the fast decrease in Q-switch
voltage, and (2) the change in the exponential time constant occur.
than the half-wave voltage (-7.8 kV) was used so that a small amount of the intra-cavity
power was out-coupled, thereby limiting the intra-cavity power and thus reducing the risk
of damage to optics. At time t1, the laser pulse has built-up sufficiently and the HTS81
switch is closed, rapidly discharging capacitor A and producing a fast decrease in the
voltage on the Q-switch. The charge on capacitor B then flows onto capacitors A and
C, increasing the voltage with a time constant set by the 660 Ω resistor and the parallel
combination of capacitors A and C. At time t2, the HTS81 switch is re-opened, which
increases the rate of charging of capacitor A.
4.5 Results
A typical measurement of the stretched macro-micro pulse and the Q-switch drive is
shown in Figure 4.9. The laser pulse energy is 10 mJ and the FWHM pulse duration is
1.8 µs. The transition from low out-coupling to high out-coupling (t1 in Figure 4.8) and
the time at which the change of the exponential time constant occurs (t2 in Figure 4.8)
were both adjusted to optimize the flatness of the pulse. For the laser used in this
measurement, the flatness of the pulse envelope varied by less than ±5 % over a period
of 1 hour. Optimisation of the pulse flatness maximised the macro-pulse energy and
yielded an energy that was the same, to within a 1 % measurement error, as that of the
un-stretched pulse.

70 CHAPTER 4. Q-SWITCHED PULSE STRETCHING
Figure 4.9: A 10 mJ, injection mode-locked, stretched laser pulse (lower trace), produced
using a Q-switch drive pulse similar to that of figure 4.8. The upper trace (0.8 kV/division)
shows part of the Q-switch drive pulse. The un-stretched laser pulse in this case was
similar to figure 3.10, with a pulse width of 0.43 µs and pulse energy of 10 mJ.
The timing of transition t1 was the most critical parameter for optimising the flatness
of the pulses, requiring a timing resolution of about 5 ns, about 0.5 % of the pulse build-up
time or 35 % of the round-trip time. If this parameter was not set within these limits,
irregular shaped pulses were produced. Other circuit parameters were found to be much
less critical; the voltages applied to the circuit needed to be adjusted to within only
0.1 kV, and standard tolerance resistors and capacitors could be used.
Fluctuations in pump energy could also degrade the flatness of the macro-pulse. The
predicted dependence of the pulse envelope on small signal gain is plotted in Figure 4.10.
A 1 % change in gain significantly degrades the pulse flatness but has approximately
no effect on the laser efficiency. The change in pump energy could be compensated by
moving transition t1 earlier (for curve C) or later (for curve B) by one round trip (the
minimum temporal resolution for the numerical model). The timing of this transition
could be controlled by monitoring the onset of the giant pulse during the pre-lase and
using a comparator circuit to set the time at which the transition t1 occurs [93].

4.5. RESULTS 71
0.5 1.0 1.5 2.0 2.5 3.0 3.5 -1.0
-0.9
-0.8
-0.7
-0.6
-0.5
-0.4
-0.3
-0.2
-0.1
0.0
Q-switch voltage
Time (microsec)
Q-s
witc
h vo
ltage
(re
lativ
e to
hal
f wav
e)
0.0
0.2
0.4
0.6
0.8
1.0
A, Laser output B, Laser output C, Laser output
Lase
r ou
tput
(A
.U.)
Figure 4.10: Plots of the modelled macro-pulse envelope for small signal gain that (A) is
the value for which the Q-switch waveform was optimised, (B) is 1 % less than the opti-
mum, and (C) is 1 % larger than the optimum. These results were confirmed qualitatively
during experiments.

72 CHAPTER 4. Q-SWITCHED PULSE STRETCHING
4.6 Discussion and conclusions
This chapter presented a new and simple technique for efficiently stretching the duration
of Q-switched laser pulses. The work reported here was applied to an injection mode-
locked Nd:YAG laser for guide star applications, but is also more generally applicable to
other types of gain media and injection-seeded laser systems.
While the repetition rate used for these experiments was limited to 50 Hz by the laser
head (Section 3.2), the high voltage switches, resistors and capacitors used in the drive
circuit can run at repetition rates in excess of 800 Hz and are thus suitable for the final
guide star design. It is not expected that the response of the laser to the Q-switch drive
pulse is dependent on the repetition rate used.
Chapter 5
High power laser head design choice
5.1 Background
The Nd:YAG gain medium has been extensively researched and has received wide-spread
use and popularity owing to its high emission cross section, good thermal conductivity,
strong material properties and mature technology (crystals, coatings, diode lasers etc) [61].
Consequently, a multitude of Nd:YAG laser head designs have been reported in the litera-
ture. Designs range from the popular rod geometries [76] to thin disc [95], microchip [96]
and slab lasers [97][74][98], with each of these designs being further subdivided by the dif-
ferent pumping and cooling geometries implemented. It is usually the thermal effects in
the laser gain medium, such as thermal birefringence and thermal lensing, which limit the
power scalability of each design, with the choice of laser crystal configuration, pumping
and cooling geometry being crucial to the performance of the laser.
5.2 Objective
The aim of this chapter is to describe the fundamental principles of a high power laser
head design and to use these principles to formulate a design that may be suitable for
the high power injection mode-locked guide star source. The chapter begins by listing
the requirements imposed on the laser head by the guide star application in Section 5.3,
then goes on to describe the thermal effects that limit the power scalability of different
designs in Section 5.4. Rod and slab type designs are explored as possible candidates for
the guide star source in Sections 5.5 and 5.6, before it is concluded that an edge-pumped
slab design would be suitable.
73

74 CHAPTER 5. HIGH POWER LASER HEAD DESIGN CHOICE
5.3 Laser head requirements
For an injection mode locked guide star source, the choice of laser head architecture is
narrowed considerably by the following requirements: An average power of approximately 10 W (or greater) is required in a 1064 nm
diffraction limited, polarized beam. The exact power required depends on the power
scaling architecture adopted. For a system of five 10 W oscillators around 10 W at
1064 nm is required, depending on the conversion efficiency of the SFG stage. For
a MOPA system, less power is required. In general, the more power the better. The amount of thermal lensing present should be controllable when using a long-
length ring resonator (this is particularly important if the thermal lensing is astig-
matic, such as in slab lasers, and the laser cannot be made stable in both the x and
y-directions). The laser must have a stable resonator to allow polarization outcoupling for pulse
stretching (Chapter 4). This eliminates designs such as the Innoslab design [98]. The laser must be robust and able to operate for long periods without maintenance.
At the observatory, the laser will be expected to operate at 800 Hz, 10 h/day, for
approximately 150 day/year between maintenance intervals. This equates to around
1 G shot/year.
5.4 Thermal effects in high power lasers
The large pump powers required for high power lasers inevitably lead to significant heating
of the laser gain medium. The transition from lamp pumped systems to laser diode
based systems has significantly reduced the heat load due to direct pumping of the upper
laser level. Heating of the crystal still occurs, however, primarily due to the energy
difference between pump and laser photons (the quantum defect) which is transferred to
heat through non-radiative transitions. For Nd:YAG, the quantum defect is
808nm
1064nm= 0.76 (5.1)
and thus an absolute minimum of 25 % of the pump power is converted to heat.1 Problems
arise when there are temperature gradients in the gain medium caused by non-uniform
1Another source of heat is the non-radiative decay of excited electrons to the ground state. Nd:YAG
has a 10 % branching ratio to non-radiative transitions, the other 90 % are for spontaneous emissions [61].

5.4. THERMAL EFFECTS IN HIGH POWER LASERS 75
heating and surface cooling. This gives rise to phenomena such as thermal lensing and
stress-induced thermal birefringence that limit the maximum power extractable from the
gain medium. The challenge in designing a high power, diffraction limited laser is to
implement pumping and cooling geometries to minimize the thermal gradients in the gain
medium and to avoid the deleterious effects of thermal lensing and stress-induced thermal
birefringence.
5.4.1 Thermal lensing
Thermal lensing occurs due to the temperature dependence of the refractive index of the
gain material. For Nd:YAG [61],
∂n
∂t= 7.3 × 10⁻⁶K−1 (5.2)
and a temperature gradient across the slab or rod aperture imposes a focal power to the
passing wavefront. As an example, the end-pumped, dual rod, cw Nd:YAG laser system
presented by Tidwell et al. [99] had a thermal lens of 12.9 cm for 235 W pump and 60 W
output power.
In the case of a non-uniform thermal contact at the Nd:YAG/heatsink interface, or
a non-uniform pump distribution, the non-uniform refractive index profile created will
impose wavefront distortion on the laser mode, which will transfer power to higher order
transverse modes of the resonator. This will degrade the beam quality and also introduce
a loss mechanism for lasers designed for diffraction limited operation which use an intra-
cavity aperture to allow only the TEM00 mode to run with low loss. The higher order
modes have a larger spatial extent and far-field divergence angle and so they will suffer
large clipping losses at the intra-cavity aperture.
5.4.2 Thermal stress and thermal birefringence
Mechanical stresses arise in a laser crystal from the heated central region of the rod or slab
being constrained from thermal expansion by the coolder outer surfaces in contact with a
heat sink. While Nd:YAG has a low natural bi-refringence, the stresses that build up in
a Nd:YAG crystal under a heat load result in stress-induced thermal birefringence, which
can cause substantial polarization losses in polarized lasers. An example is presented by
Uehara et al. [100] who described a cw 26.5 W linearly polarized, side pumped, rod laser
for which the single pass de-polarization losses were 5.1 %. The amount of depolarization
is dependent on the specific configuration of the laser head and resonator used.

76 CHAPTER 5. HIGH POWER LASER HEAD DESIGN CHOICE
pump fiberbundle
Nd:YAG90 quartz
rotator
o 1064 nmmirror
pump fiberbundle
Un-dopedend cap
pumphomogenizer
Imaginglens
Figure 5.1: Schematic diagram of an end-pumped rod laser design [76]. This design uses
two identical rods with an intermediate quartz rotator(QWP) to reverse the effects of
thermal birefringence between each rod.
Care must also be taken to avoid temperature gradients and stresses at the ends and
edges of the rod or slab, which are not in contact with a heat sink. Large gradients in
these areas can cause surface bulging, introducing wavefront distortion on a passing mode,
or even crystal fracture in the case of large pump densities. In some lasers, this can be
avoided by bonding an un-doped end-cap, which does not absorb pump light and thus
reduces the thermal stress at the end surface [76].
5.5 Rod lasers
Rod gain media are perhaps the most popular choice for commercial lasers as they are
inexpensive to manufacture and can provide high laser powers with reasonably good beam
quality. An advantage of rod-type lasers is their cylindrical symmetry, which allows ther-
mal lensing to be easily compensated by using inexpensive spherical optics. Unfortunately,
cooling the surface of the rod while heating the core leads to stress-induced thermal bire-
fringence which usually limits the power in polarized rod lasers.
A good example of a rod laser is presented by Frede et al. [76] who have developed a
100 W cw diffraction limited Nd:YAG rod laser optimised for gravitational wave detectors.
A schematic of this design is shown in Figure 5.1. The design uses two rods, with an
intermediate quarter wave plate to reverse the thermal de-polarization effects when passing
from one rod to the next. Each rod is end-pumped by fiber-coupled lasers diodes and uses
a pump-homogenizer to provide an even pump distribution for improved beam quality. A
composite rod with un-doped end-caps was used to reduce the surface stress caused by
the high pump flux at these faces.
Fibre-couple laser diodes are, unfortunately, an expensive form of pump light and
retail for at least double the price of similar-power laser diode arrays.
A successful variation of the rod architecture is the thin disc designs that have a disc

5.6. SLAB LASERS 77
Cooling
Cooling
Figure 5.2: A schematic diagram of a laser slab with the plane of the zigzag path in the
direction of the cooling. With this configuration, the thermal distortions caused by the
cooling will be averaged out by the zigzag path.
of gain material bonded to a heat sink on one face [95]. The surface of the disc in contact
with the heat sink is mirror coated to double-pass the laser beam through the gain on each
round trip. These designs have achieved high average powers and good beam quality but
require complex pumping geometries to focus the pump light through the narrow edge of
the disc. Both rod and thin disc designs represent a major divergence from the proven
research capabilities of our institution which has primarily focused it knowledge and skills
base on the design of zigzag slab lasers, which will be discussed in the following section.
5.6 Slab lasers
The primary advantage of slab lasers is that they enable a zigzag path to be used inside
the gain medium, which averages out the effects of thermal lensing and birefringence in
the plane of the zigzag [61].
Ideally, the plane of the zigzag path should be in the direction of cooling, as this is
usually the direction with maximal thermal gradient. Then, if the pumping arrangement
is chosen to have minimal gradients in the orthogonal plane, low thermal distortions and
high laser powers are possible. A zigzag slab design, with this cooling geometry is shown
in Figure 5.2.
End-pumping is often cited as an effective way of providing a uniform pump distri-
bution, as the long absorption length combined with multiple bounces of the pump light
along the slab length provides an even pump profile [101]. This often requires complicated

78 CHAPTER 5. HIGH POWER LASER HEAD DESIGN CHOICE
Figure 5.3: The end-pumped slab design described by Goodno et al. [97]. For this design,
the pump light is reflected off the end faces of the slab. The laser mode takes a zigzag
path in the direction of cooling, with the TIR at the cooled faces maintained by a thin
layer of silicon dioxide.
transfer optics to condense the pump light from the pump source and focus it into the
small aperture of the slab end face, however. An example of an end-pumped slab laser is
presented by Goodno et al. [97] and is shown in Figure 5.3. This design uses a waveguide
to focus and transfer the pump light from collimated laser diode arrays into the slab.
If the large-aperture faces on the sides of the slab are used as the pump windows,
the pump transfer optics can be simplified, but the pump uniformity is decreased. An
example of this slab design is the so-called “edge-pumped” laser described by Rutherford
et al. [74], and is shown in Figure 5.4. For this design, a horizontal thermal gradient
exists due to the exponential absorption of pump light from each side, but the measured
thermal lens was found to be relatively weak, with f =420 mm at 300 W pump power.
This laser produced 28 W of cw light with M2 = 1.5 from 175 W pump [74].
Both of the designs illustrated in Figures 5.3 and 5.4 have de-coupled pump and cooling

5.7. DESIGN CHOICE 79
Heat sink
Cooling
PumpingEnd view:
Side view:
Figure 5.4: The edge-pumped laser head design of Rutherford et al. [74], showing a zigzag
slab conduction cooled through top and bottom surfaces and pumped through the large
aperture side faces.
faces which allows the slab to be conduction cooled. This provides increased reliability
and simplified engineering when compared to designs that are water cooled and use the
same surface for pumping and cooling [77][102]. Unfortunately, both the edge-pumped
and end-pumped slab designs can suffer from parasitic oscillations, which arise from closed
TIR mode paths being formed between the polished sides of the slab. To avoid this, both
designs need to have one side wedged to destroy the TIR paths of the parasitic mode.
This topic is treated in more detail in Section 6.3.4.
An additional advantage of the slab gain medium is that Brewster-angled entrance
and exit faces can be used, removing the need for AR-coatings on these surfaces.
5.7 Design choice
To summarize, Table 5.1 presents a comparison of the advantages and disadvantage of
the three laser head designs discussed.
A laser head design based on the edge-pumped architecture was selected for the high
power guide star laser. This design has been shown to be scaleable to medium average
powers and it offers significant simplifications in the pumping and cooling requirements
over other slab and rod designs. In particular, the large pump windows, consisting of
the whole side faces of the slab, enable a large pump flux to be easily directed into the
slab without the need for complicated waveguides or focusing optics. Even though the
original design presented by Rutherford et al. [74] used fibre-couple laser diodes to pump
the slab, un-collimated diode arrays could also be used, given that the pump windows

80 CHAPTER 5. HIGH POWER LASER HEAD DESIGN CHOICE
Laser head architecture
Rod [76] TRW slab [97] Edge-pumped slab [74]
Relatively inexpensive
Simple waveguide
Symmetric thermal lens
No parasitic ocillations
Low thermal bi-refringence
Table 5.1: Advantages and disadvantages of three laser head designs that can potentially
be used in the guide star system design.
are so large. This offers a significant cost saving as fast- and slow-axis collimated arrays
are around 50 % more expensive than un-collimated arrays of the same power, and fibre
coupled diode lasers are more than double the price [103].
The specifics of the edge-pumped slab design used for the high power slave laser are
discussed in detail in the following chapter.
5.8 Conclusions
This chapter presented the design requirements for the high power guide star laser head.
The dominant factor in the choice of laser head architecture is the management of thermal
effects such as thermal lensing and thermal birefringence, with the pumping and cooling
geometries selected to avoid uncontrolled thermal gradients being formed in the gain
medium. This chapter presented a few of the schemes implemented by previous authors
to manage the thermal effects in both rod and slab lasers, before it was decided to use a
design based on the edge-pumped architecture [74], because of its performance, simplicity
and potential cost savings over other designs.

Chapter 6
Design and construction of the high
power laser head
6.1 Introduction
A slab-type design based on the edge-pumped architecture was chosen for the high power
guide star source, as discussed in Chapter 5. This design was selected primarily for
its large pump windows, which simplify the pumping arrangement and allow the use of
inexpensive, large aperture laser diode arrays.
In this Chapter, design and construction details of the high power laser head are
presented. Characterization of this laser is then described in Chapter 7. The design is
not intended to be the final version of the laser head for the guide star source but is
aimed to demonstrate power scaling concepts and to trial design options for the final field
deployable system.
Section 6.2 contains a design summary, then Section 6.3 presents details on the slab
dimensions. The slab height (in the cooling direction) is discussed in Section 6.3.1. This
parameter sets the mode size in the resonator, which impacts the damage susceptibility of
resonator optics and also influences the pump volume and pump density which determine
the small signal gain of the laser. The slab width (in the pumping direction) is discussed
in Section 6.3.2. This parameter, in combination with the doping concentration, deter-
mines both the pump absorption percentage and the pumping uniformity. An analysis is
presented of the trade-off that exists between the desire to have high pump absorption and
also a high pump uniformity to minimize thermal lensing in the width direction. The slab
length is discussed in Section 6.3.3, then Section 6.3.4 a method for controlling parasitic
oscillations by tilting one side to destroy the TIR mode paths within the slab. Finally,
technical details of the laser head construction are presented in Section 6.4, showing the
81

82 CHAPTER 6. HPL DESIGN AND CONSTRUCTION
UNCOLLIMATEDDIODE ARRAY HEATSINK
WAVEGUIDE
Nd:YAG SLAB
SIDE VIEW:
END VIEW:
TOP VIEW:
cooling
length
height
width
pumping
Figure 6.1: Diagram of the high power laser head. It consists of a Nd:YAG slab clamped
between copper cooling blocks and pumped from each side by laser diode arrays. The laser
mode takes a zigzag path through the slab to average out the major thermal distortions
in the vertical direction.
pumping assembly, slab mount and cooling configuration.
6.2 Design summary
A schematic of the laser head design is shown in Figure 6.1. It consists of a side pumped,
conduction cooled zigzag slab with Brewster angled windows [33]. With the whole sides
of the slab available for pumping, the pump light from the laser diode arrays has only to
be condensed by a factor of 2.5 to enter the slab which greatly simplifies the waveguide
design. Un-collimated laser diode arrays, which are the most inexpensive form of pump
light, can then be used as the pump source and their large fast- and slow-axis divergence
is beneficial in this case as it helps to mix up the pump light in the waveguide and provide
uniform illumination of the whole slab aperture providing uniform heating. The top and
bottom surfaces of the slab are coated with a thin, 2.5 µm, layer of silicon dioxide to
maintain TIR when in contact with the heat sink,

6.3. LASER SLAB DESIGN 83
6.3 Laser slab design
The dimensions of the final Nd:YAG laser slab are shown in Figure 6.2 and a detailed tech-
nical drawing that includes tolerances and surface finishes can be found in Appendix E.
The slab was cut from high purity, low wavefront distortion Nd:YAG material from Sci-
entific Materials Corp. The Nd:YAG was taken from the boule with a crystallographic
direction that minimizes the effect of thermal birefringence and growth striations [104],
as specified in Appendix E.
The dimensions and doping concentration were carefully chosen to optimise the per-
formance of the laser. This section describes how these values were selected.
6.3.1 Slab height
The slab height determines the size of the laser mode in the slab since a circular mode
profile will be used, and the slab width will be made larger than the height to improve
the thermal properties of the laser head (Section 6.3.2). The slab height will therefore be
the limiting aperture inside the resonator and the mode size should be made to fit the
slab height. By determining the mode size, the slab height will also determine the lasers
small signal gain, Q-switched energy extraction efficiency and Q-switched pulse-width for
a given pump energy, as explained below.
For a 4-level laser such as Nd:YAG, the logarithmic small-signal gain, g0l, is given
by [61]
g0l =(
σ21
hνV
)
ηEp (6.1)
Where σ21 is the stimulated emission cross section, hν is the photon energy, V is the
pumped volume, Ep is the pump energy and η is an efficiency term which is the prod-
uct of the quantum defect, beam overlap efficiency, absorption efficiency, energy storage
efficiency and quantum efficiency.
The small-signal gain is related to the slab height through the volume term in Equa-
tion 6.1. Generally, a high small signal gain is desirable as this leads to high laser effi-
ciencies [49], but for guide star lasers requiring long macro-pulse widths to avoid sodium
bleaching, a high gain is not desired as it also decreases the Q-switched pulse-width of
the laser [49].
The relationship between pulse width and small signal gain of a Q-switched laser can
be obtained from a solution to the laser rate equations [105]. These equations have been
solved by Degnan [49] for the case where the laser outcoupling fraction has been optimized
and top-hat beam profiles and uniform pump densities are assumed. He showed that the
pulse width, output energy and extraction efficiency can all be expressed in terms of the

84 CHAPTER 6. HPL DESIGN AND CONSTRUCTION
62.1 mm
5o
width4.6 mm
height4.3 mm
bounce angle57
oheight
clear aperture4.0 mm
no clipping height
Figure 6.2: Dimensions of the Nd:YAG laser slab. One side of the slab is wedged to
prevent parasitic oscillations as is discussed in Section 6.3.4. Note that the slab height is
slightly larger than the clear aperture to prevent the clear aperture being reduced inside
the slab due to clipping at the Brewster window after its first TIR bounce inside the slab.
See Appendix E for a detailed technical drawing.

6.3. LASER SLAB DESIGN 85
dimensionless variable Z defined as
Z =2g0l
L(6.2)
with g0l being the logarithmic small signal gain and L being the round trip loss, not
including the outcoupling fraction. An expression for the Q-switched pulse width, tp, can
the be written as [49]
tp =tRL
(
ln Z
Z[1 − a (1 − ln a)]
)
, (6.3)
where
a =Z − 1
Z lnZ(6.4)
and tR is the resonator round trip time. Equation 6.3 shows that the Q-switched pulse
width gets shorter for increasing small signal gain. Hence to produce long pulses, which
is desired for the guide star laser, the small signal gain should be small.
A negative consequence of reducing the small signal gain is that the laser extraction
efficiency, ηe, which represents the fraction of useful energy stored in the upper laseing
state, reduces with lower small signal gains according to [49]
ηe = 1 −(
1 + ln Z
Z
)
(6.5)
A plot of the Q-switch extraction efficiency is shown in Figure 6.3.
Hence the small signal gain of the laser should be optimised so that long Q-switched
pulse lengths are obtained without a significant drop in pulse energy occuring.
In Chapter 4 it was observed that for a small signal gain value of 0.31, 10 mJ output
pulses were produced. Using equation 6.5, this results in a Q-switched extraction efficiency
of approximately 71 %. This value is situated at the “knee” of Figure 6.3. This is an
ideal place to operate as the small signal gain is low, giving long Q-switched pulse widths
(Equation 6.3), but any further reduction in small signal gain is undesirable as it will lead
to a significant drop in extraction efficiency, as can be observed in Figure 6.3.
Hence it was decided to operate the high power laser with the same mode size, (ω =
1.2 mm), as the low power laser.
For a beam size of ω = 1.2 mm the vertical clear aperture of the slab was chosen to be
4.0 mm so that the mode diameter fills 60 % of the clear aperture for efficient opperation
as recommended by Siegman [106]. The slab was chosen slightly larger (4.3 mm) to
preserve the clear aperture by preventing clipping on the Brewster window as illustrated
in Figure 6.2.

86 CHAPTER 6. HPL DESIGN AND CONSTRUCTION
0 20 40 60 80 0.0
0.2
0.4
0.6
0.8
1.0
Proof of principle laser operation point
Ext
ract
ion
effic
ienc
y
z
Figure 6.3: The Q-switched energy extraction efficiency plotted against the parameter Z.
The Z-value at which the proof of principle laser operates is highlighted.

6.3. LASER SLAB DESIGN 87
6.3.2 Slab width
The width of the slab, combined with the Nd doping concentration, determine the fraction
of the pump light absorbed in the slab and also the thermal lensing in the width direction,
as the pump light is absorbed exponentially from the edge of the slab resulting in non-
uniform heating. This section presents an analysis of the pump absorption fraction and
pump uniformity in an edge-pumped slab laser pumped with a broad-band (2-5 nm) pump
source and uses the results to determine the width and doping concentration for the slave
laser crystal.
Rutherford et al. [74] presented an edge-pumped laser design using narrow-band (<
1 nm) fibre-coupled lasers as the pump source (Figure 5.4). This design has a height of
1.45 mm and width of 4.57 mm to increase the single-pass pump absorption, increase the
area of the cooling surfaces, and reduce the slab temperature. An astigmatic mode size
in the laser slab must be used for this design to sweep out all available gain in the width
direction. This requires intra-cavity cylindrical optics.
For our case, the large slab height of 4.3 mm enables the slabs aspect ratio to be
made approximately 1:1 enabling a circular beam, while still having reasonable pump
absorption efficiency and good gain sweep out. This simplifies the resonator design by
requiring fewer intra-cavity lenses and allows the use of spherical lenses which can be
manufactured with greater precision than cylindrical lenses, thereby reducing the round
trip losses of the cavity.
To calculate the amount of pump absorption in our slab, an equation must be used
which can account for the broad spectral width and angular distribution of the un-
collimated laser diode arrays. Barnes et al. [107] have shown that the fractional absorp-
tion, ηA, of a pump source with spectral width, ∆λ, and angular intensity distribution,
F (θ, φ), in a slab of width l can be calculated by integrating the absorption fraction of
pump rays over all angles (θ, φ) and wavelengths λ. They arrive at the equation
ηA =
∫ λ2λ1
∫
π
20
∫
π
20 P (λ)F (θ, φ)[1− exp(−β(λ)l(θ, φ))] sin θdθdφdλ
∫ λ2λ1
∫
π
20
∫
π
20 P (λ)F (θ, φ) sin θdθdφdλ
(6.6)
where P (λ) is a function defining the spectral distribution of the laser diode array and
β(λ) is the absorption coefficient as a function of wavelength.
This equation can be solved if the absorption coefficient, β(λ), for the broad-bandwidth
pump source is approximated by the absorption coefficient for a single frequency source,
β that produces similar absorption as the broad spectrum source. For a 2 nm 808 nm
pump source β =0.52, while for a 5 nm pump source β =0.39 [107]. The bandwidths 2 nm
and 5 nm are typical of commercially available 808 nm laser diode arrays. Using these

88 CHAPTER 6. HPL DESIGN AND CONSTRUCTION
qavg
Nd:YAG n=1.82air n=1
lavg
w=4.5mm
Figure 6.4: An average pump ray is incident on the slab at an angle θavg and experiences
an absorption pathlength lavg given by Equation 6.7
numbers, the pump absorption is shown plotted in Figure 6.5 for 1 % doped Nd:YAG and
808 nm pump beams of bandwidth 2 nm and 5 nm. For this figure, a uniform top-hat
angular distribution (F (θ, φ) = 1) of pump light is assumed. To account for the real
angular distribution of the pump light entering the slab, a mean absorption pathlength,
lavg, can be used, which represents the pathlength of an average ray in the slab, having
an angle of θavg with respect to the input pump face. This can be derived using Snell’s
law and some simple trigonometry using the parameters in Figure 6.4. The value of lavg
can be calculated using the following trigonometric relationship
lavg =w
cos[arcsin(
1n
sin(θavg))
](6.7)
where w is the width of the slab, n is the refractive index of Nd:YAG and θavg is approx-
imately 30 for the pump light exiting the waveguides of Figure 6.11 using un-collimated
laser diode arrays having typical fast axis divergence of 30 (FWHM) and slow axis di-
vergence 10.
For a slab width of 4.5 mm, Equation 6.7 gives lavg = 4.7 mm. From Figure 6.5, it
can be seen that this width will result in substantial pump absorption, of approximately
84 % for a 5 nm bandwidth pump source and 91 % for a 2 nm source. A slab width of
4.5 mm would be ideal for the high power laser crystal, as it enables a close-to-square
aspect ratio to be used2, allowing a circular beam in the slab and alleviating the need for
lossy cylindrical resonator optics. Hence this value was chosen as the slab width.
For the edge-pumped laser design, the slab is pumped from each side (Figure 6.1),
which introduces a thermal gradient in the horizontal direction, as the pump density is
1More details of the waveguides can be found in Section 6.4.12the width should be made slightly wider than the height to enable one side to be wedged to destroy
parasitic mode paths, as discussed in Section 6.3.4

6.3. LASER SLAB DESIGN 89
0 2 4 6 8 0.0
0.2
0.4
0.6
0.8
1.0 1% Nd:YAG
2 nm
5 nm
Abs
orpt
ion
effic
ienc
y
Pathlength (mm)
Figure 6.5: Absorption percentage of 1 % doped Nd:YAG when pumped with a broad
bandwidth pump source with spectral bandwidths 2 nm and 5 nm, centred at 808 nm.

90 CHAPTER 6. HPL DESIGN AND CONSTRUCTION
highest at the edge face and lowest at the centre. This gradient is transverse to the
direction of zigzag and hence will not be averaged by the zigzag beam path. A thermal
lens will therefore exist in the horizontal direction. The extent of lensing is determined
by the pump uniformity across the width, which for a given pump energy and slab width,
is determined by the doping concentration of the crystal.
The amount of lensing can be quantified by examining the pump absorption profile
across the slab width. The absorption profile will have a hyperbolic shape, cosh(β∆λx),
since the slab is pumped from opposing sides and the pump light is absorbed exponentially
from the edge3. In this formula, β∆λ is the absorption coefficient for a pump source of
spectral width ∆λ and x is the position across the width (zero is defined to be the centre
of the slab). With the appropriate constant of proportionality, the pump absorption,
normalized to the absorbtion at the slab edge, ρnorm(x), can then be written as [108]
ρnorm(x) =1
ρ(w/2)
exp(
−β∆λw2
)
1 − Rpe−β∆λwcosh(β∆λx) (6.8)
where the factor Rp represents the reflectivity of the side faces of the slab and takes
account of the fact that some fraction of the pump light will bounce back a forth between
the side faces of the slab.
Equation 6.8 can be plotted to show the pump uniformity in the slab and an example
is shown in Figure 6.6, for −w/2 ≤ x ≥ w/2, 1 % doped Nd:YAG and 5 nm pump source.
Table 6.1 uses Equations 6.8 and 6.6 to display the relationship between pump uni-
formity and total pump absorption for various Nd doping concentrations.4 It shows that
a trade-off exists between the two, that is, to achieve a uniform pump absorption and
hence low thermal lensing in the horizontal direction, a low doping concentration should
be selected, but this is at the expense of pump absorption percentage.
Given the data of Table 6.1, it was decided to select a doping concentration of 1.0 %
Nd. This gives a balance between good pump absorbtion (84 %) and reasonable pump
uniformity (ρnorm(0) = 0.71. If in practice it is found that the horizontal thermal lensing
is too strong, the laser diodes can be detuned from the peak absorption band to increase
the pump uniformity and reduce the lensing.
3cosh(x) ≡ 1
2(ex + e−x)
4The doping concentration of Nd:YAG is limited to approximately 1.1 %. Higher doping levels can
quench the upper state lifetime due to up-conversion and introduce strain in the crystal, reducing the
optical quality.

6.3. LASER SLAB DESIGN 91
-2 -1 0 1 2 0.0
0.2
0.4
0.6
0.8
1.0
Rel
ativ
e ab
sorp
tion
Position in slabs width (mm)
Figure 6.6: The calculated pump absorption profile across the slabs width when pumping
from opposing sides by a 5 nm bandwidth, 808 nm pump source. A 1 % doped Nd:YAG
slab is used for this example and the pump absorption at the centre is approximately
71 % that of the edges.
Nd (%) ρnorm(0), 5 nm η(A), 5 nm
0.6 0.88 66.7
0.7 0.84 72.3
0.8 0.80 76.9
0.9 0.75 80.8
1.0 0.71 84.0
1.1 0.67 86.7
Table 6.1: Calculated values of the pump absorption at the centre of the slab relative
to the edge, ρnorm(0), and the pump absorption percentage, η(A), for a 5 nm spectral
bandwidth pump source and various Nd doping concentrations. The slab width in this
case is 4.5 mm.

92 CHAPTER 6. HPL DESIGN AND CONSTRUCTION
6.3.3 Slab length
An even-bounce slab design was chosen as this configuration is less sensitive to mirror
pointing errors than odd-bounce designs [109], and reduces the slab manufacturing costs
by having parallel entrance and exit faces. An 8-bounce geometry was used to provide
enough bounces for effective averaging of thermal distortions and to provide a large pump
window. Having more bounces increases the mode loss from scatter and absorption arising
from each TIR bounce inside the slab. The 8-bounce geometry also makes the slab long
enough to allow pumping by 4 cm laser diode arrays on each side as will be described
later.
6.3.4 Parasitic oscillation control
Parasitic oscillations occur when low loss, closed TIR paths can be formed within the
laser crystal, allowing an internal mode to develop and drain the energy stored in the
crystal. A couple of possible parasitic-mode paths are shown for a Brewster angled zigzag
slab in Figure 6.7. The top and bottom of the slab have SiO2 coatings of refractive index
1.45 and the Nd:YAG has a refractive index of 1.82, making the critical angle for TIR
at this interface 52.9. For the air-Nd:YAG interface the angle is 33.4. So if one of the
slab sides is not wedged, the parasitic modes in Figure 6.7 have low-loss TIR paths within
the slab, clamping the lasers gain at a very low level. Tilting one of the sides of the slab
by a small angle, as in Figure 6.2, causes the path of parasitic modes to pick up twice
the wedge angle on each round trip, quickly destroying TIR and introducing significant
Fresnel losses to the mode. It was estimated that for the slab of Figure 6.2, a wedge
angle of 2.5 is sufficient to cause round trip losses and kill the parasitic modes shown in
Figure 6.7. It was decided to use a wedge angle slightly larger than this (5), to be safe
from these modes and any other modes that were not predicted. It may be necessary to
run a finite element simulation with the predicted small signal gain to fully examine the
different parasitic modes paths that are possible.
6.4 Laser head construction
6.4.1 Laser pump modules
The slab is pumped from each side by the laser pump modules shown in Figure 6.8. Each
module consists of a pair of laser diode arrays and a glass wave-guide to channel the pump
light into the slab.

6.4. LASER HEAD CONSTRUCTION 93
33o
57o
SiO2
a)
b)
Figure 6.7: Two possible paths for parasitic oscillations in a Brewster-angled zigzag slab.
Part a) shows a mode running in the slabs cross-section while part b) shows a mode taking
a cork-screw path down the slabs length and reflecting off the Brewster angled windows.
Both of these modes undergo TIR bounces making them low loss.
waveguide
laser diodearrays
coolant manifold
Figure 6.8: Photograph of a laser pump module. The light from two laser diode arrays is
condensed and transferred to the slab using a glass waveguide. The assembly is mounted
on a linear translation stage to enable the waveguide to be brought close to the slab.

94 CHAPTER 6. HPL DESIGN AND CONSTRUCTION
6.7o
Laser diodearray
waveguide
10mm
12mmmount point
3.5mm
40mm
Figure 6.9: Cross section of the laser diode array and waveguide used to pump the slab.
The slow-axis of the array runs in the vertical direction (divergance angle shown) and the
fast axis is into the page.
A schematic of the waveguide and laser diodes is shown in Figure 6.9, and detailed
technical drawings can be found in Appendix E. The un-collimated light from the laser
diode arrays has a FWHM divergence angle of 30 in the fast axis and 10 in the slow
axis. This large divergence angle enables the striped output from the individual bars in
the array to be mixed in the waveguide to produce a close to uniform pump distribution in
the slab. The entrance and exit faces of the waveguide are coated with a broad-angle AR
layer to reduce pump losses and the edges were kept sharp (without chamfer) to minimize
transmission losses. The total loss from the diode output to the output of the waveguide
was measured to be 3 %.
The height of the waveguide at the end near the diode array was made 12 mm, slightly
taller than the array height (10 mm) to allow all pump rays to enter the waveguide. There
is a horizontal ledge on the top and bottom for mounting as shown in Figure 6.9. The
height tapers down to 3.5 mm at the end nearest the slab to allow the exit rays to enter
the slab (the slab height is 4.3 mm). The length of the waveguide was made 40 mm to
give space between the pump diodes and the slab heatsinks. This resulted in a taper angle
of 6.6 as shown.
The laser diodes are 50-bar, high peak power, water-cooled arrays manufactured by
SDL diode laboratories5.The performance of the laser diodes will be described in Chap-
ter 7.
The majority of rays emitted from the pump source will undergo one TIR bounce
within the waveguide but some rays will have no bounces and some will have two as
shown in Figure 6.10. For each TIR bounce, the ray will pick up twice the slant angle of
the waveguide (13.2) causing a striped pattern observed in the output of the waveguide.
5The author gratefully acknowledges Northrop Grumman (NGST) for the loan of the laser diodes

6.4. LASER HEAD CONSTRUCTION 95
Waveguide
Striped output6.6
o
Laser diodearray
Figure 6.10: The divergent light emitted by the laser diode array can make zero, one
or two TIR bounces within the waveguide. Each bounce adds 13.2 to the rays angle
resulting in the striped output shown (stripes into page).
Waveguide
Heatsink
Figure 6.11: The striped output from the waveguides undergoes a TIR bounce within the
slab resulting in improved pump uniformity.
Each stripe has an angular separation of 13.2, corresponding to groups of rays that have
undergone 0, 1 or 2 TIR bounces. This pattern was observed using a hand held infra-red
viewer and has been reproduced schematically in Figure 6.10.
For the efficient operation of a high power solid state laser, it is usually desirable
to have a uniform pump distribution to ensure uniform heating of the gain region, so a
striped output from the waveguides is not ideal, but with the slab butted up close to the
exit port of the waveguide as in Figure 6.11, the extra TIR bounce inside the slab will
help improve pump uniformity.
Slab mounting and cooling configuration
The Nd:YAG laser slab was clamped between two, water cooled copper blocks as shown
in the photograph of Figure 6.12. To reduce the thermal impedance of the Nd:YAG-
copper interface a thin, 0.125 mm, layer of indium foil was inserted between the slab and
copper. Indium is a soft malleable material that can fill the surface irregularities of the

96 CHAPTER 6. HPL DESIGN AND CONSTRUCTION
machined copper surface and improve the thermal contact between the Nd:YAG crystal
and heat sink. The assembly of the heatsink-indium-Nd:YAG-indium-heatsink sandwich
is no trivial task as it is difficult to achieve an intimate, even, thermal contact without
applying excessive clamping stress on the crystal. A lot of time was spent refining the
assembly procedure to achieve maximal performance from the laser (performance details
in Chapter 7). The best technique was found to be the following: Firstly, the pieces of
indium foil were lightly rolled onto the Nd:YAG crystal to reduce the Nd:YAG-indium
thermal resistance. This is the most important interface as the Nd:YAG has the least
thermal conductance of the sandwich.6 The Nd:YAG and indium layers are then placed
on the lower copper block of figure 6.12, and the upper copper block is brought down
square using the stainless steel guiding pins, seen in figure 6.12. Pressure is then applied
to the centre of the upper cooling block with a single screw, before the four screws at the
corners of the upper cooling block are tightened to hold the pressure.
The source of cooling water for the copper heat sinks is a recirculating chiller [110],
which was used to cool both the laser diodes and the laser slab. A corrosion inhibitor and
algaecide [111] was added to the cooling water to protect the micro-channels of the laser
diodes from decay.
The complete laser head assembly, including the slab mount and pump modules is
shown in Figure 6.13.
6.4.2 Teflon coating
Unfortunately, some of the laser slabs were damaged on arrival from the manufacturer,
with some areas of the silicon dioxide layers lifting off. An example is shown in the pho-
tograph of Figure 6.14. To fix this problem and to restore the TIR interface between
the Nd:YAG and heatsink, a thin film of low refractive index Teflon AF, (n=1.29) was
applied to the damaged areas of the slab [112]. Like SiO2, Teflon is a relatively poor ther-
mal conductor, so it is necessary to apply only a thin film to minimize thermal resistance.
Hence the Teflon was first dissolved in a solvent (FC-75) with a 4 % Teflon, 96 % solvent
solution. This solution was then applied to the damaged area of the slab with a fine paint
brush. After application the solvent quickly evaporates leaving only a thin layer of Teflon.
Unlike SiO2, the Teflon coating is very soft and can be easily rubbed off so the slab had
to be cleaned and recoated for each rebuild of the laser head. With the Teflon coating
applied and the slab mounted it was observed that the single pass loss of the slab was not
diminished by this procedure.
6the thermal conductivity of Nd:YAG is around 6-times lower than indium and more than a thousand
times lower than copper.

6.4. LASER HEAD CONSTRUCTION 97
Nd:YAG slab
Figure 6.12: The mounting and cooling arrangement for the laser slab. The slab is
clamped between water-cooled copper heatsinks, with an intermediate layer of indium foil
to improve the thermal contact. During assembly, the top heatsink is guided down on the
stainless steel pins seen at the corners of the mount.

98 CHAPTER 6. HPL DESIGN AND CONSTRUCTION
Figure 6.13: Picture of the completed laser head showing the slab mount, pumping mod-
ules and cooling lines.
Damaged area
Figure 6.14: The Nd:YAG laser slab with damage to the SiO2 coating.

6.5. CONCLUSIONS 99
6.5 Conclusions
This chapter presented the design and construction details of the high power laser head.
It was shown that the choice of crystal dimensions can have a significant impact on the
performance of the laser and aspects such as the slabs height, width and length were
all chosen to optimize the performance for an injection mode-locked slave laser. The
height was chosen to be 4.3 mm, fixing the mode size in the slab to be ω = 1.2 mm,
and setting the lasers small signal gain to provide long duration Q-switched pulses while
maintaining a substantial Q-switch energy extraction efficiency and placing a limit on the
maximum intra-cavity pulse energy before the onset of damage to optics. The slab width
was chosen to be 4.5 mm to provide a close-to-square slab ratio to enable the use of high
quality spherical optics, and also to provide a reasonable pump absorption efficiency and
good pump uniformity. Section 6.3.4 presented an analysis of possible parasitic mode
paths that exist in slabs with polished sides, and concluded that one side of the slab
should be wedged at 5 to destroy the TIR paths. Finally, some construction details were
presented in Section 6.4.1, including the slab mounting configuration and procedures to
establish a uniform thermal contact between the slab and heatsink.

100 CHAPTER 6. HPL DESIGN AND CONSTRUCTION

Chapter 7
Performance of the high power 1064
nm laser
7.1 Introduction
A low average power 50 Hz repetition rate 1064 nm laser was presented in Chapter 3
and used to demonstrate that the approach of injection mode-locking and stretched Q-
switching can simultaneously satisfy the requirements of wavelength, bandwidth and pulse
width for advanced SFG guide-star systems. The outstanding requirements that could
not be demonstrated with that laser was the need for high average powers (10 W) and a
high repetition rate (800 Hz) to provide adequate sampling of the time varying effects of
atmospheric turbulence.
The primary issue in scaling the average power is the management of thermal effects
such as thermal lensing and thermal birefringence, associated with the high heat loads
deposited in the gain medium by a high power pump source. Chapter 6 presented design
and construction details of a new laser head design, which aims to minimize thermal
gradients within the laser crystal, thus enabling power scaling of the injection mode-
locked laser.
This chapter presents the characterization and performance testing of this new laser.
It begins with a description of the laser pump modules, including the power output and
spectral properties of the laser diode arrays, then goes on to present the performance
results of the completed Nd:YAG laser head assembly. Initially the laser was run in a
short, standing-wave test resonator to asess the total output power available and to anal-
yse the thermal properties within the Nd:YAG slab. Measurements of the thermal lens
focal length were taken and the results are presented. The thermal lens value is used to
design a stable single mode ring resonator, into which the laser head was incorporated.
101

102 CHAPTER 7. PERFORMANCE OF THE HIGH POWER 1064 NM LASER
Performance results from this high power injection mode-locked slave laser are then pre-
sented, showing the combination of high power levels, good beam-quality and excellent
bandwidth control when operating at 800 Hz PRF [33].
7.2 Pump laser performance
This section describes the performance of the laser diodes and outlines the measurements
of wavelength, output power and spectral width that were undertaken to optimise the
efficiency of the Nd:YAG laser. The diode driver and the cooling system used to control
the temperature of the arrays, and the safety interlock system are also discussed.
7.2.1 QCW laser diode arrays
Quasi-cw (QCW) laser diode arrays were selected for use in the high power laser head
as this mode of operation will give greater laser efficiency compared to cw laser diodes
for the PRF required. The difference in efficiency can be accounted for by noting that
the laser is required to operate at 800 Hz PRF (1.25 ms period) while the upper-state
fluorescence lifetime of Nd:YAG is only 230 µs, and so the efficiency of a laser using a
cw-pump source is expected to be approximately 230 µs1.25 ms
≈ 0.2 that of a QCW source.
One advantage that cw diodes do have is the longer operating lifetime of these devices,
which could be as much as a 2-4 times [113] [61] longer than a QCW diode. This would
help to reduce the cost of maintaining the guide star source. The maintenance interval for
the replacement of laser diodes can, however, be substantially increased for both QCW
and cw arrays by purchasing higher power arrays (at an increased initial cost) then running
at a power level less than the maximum rated output.
The laser diodes used for the high power experiments of this chapter are un-collimated,
water cooled QCW arrays manufactured by Spectra Diode Laboratories (SDL-3251-HK)1.
These diodes were obtained from a previous application, but their specifications, shown
in Table 7.1, are suitable for use in the injection mode-locked guide star laser head.
7.2.2 Laser diode drivers
The duty cycle of the laser diodes is 2 % (Table 7.1) which is unusually low for 808 nm
diode arrays (the duty cycle is commonly 10-20 %). This means that the pump pulse width
is restricted to 25 µs for a pulse repetition rate of 800 Hz, duty cycle 2 % (compared to
≈ 200µs for a 20 % duty cycle array). This poses no problems optically, but does place
1Thank you to Northrop Grumman Corporation for the loan of the diodes.

7.2. PUMP LASER PERFORMANCE 103
Wavelength 808 nm ±4 nm
Spectral width <4 nm FWHM
No. bars 50, 0.2 mm pitch
Peak power 5000 W
Duty cycle 2 %
Voltage 96 V (min)
Current 125 A (max)
Beam divergence 30 x 10 FWHM
Table 7.1: Manufacturers specifications and performance ratings for the SDL-3251-HK
laser diode arrays
demands on the hardware used to drive the arrays, as the current drive pulse edges must
have fast rise and fall times to get up and down within 25 µs. The required voltage
of ≥ 96 V is also un-commonly high for laser diodes, limiting the choice of suitable,
commercially available laser diode drivers further.
A Northrop Grumman e-Drive cw-QCW diode driver was selected for its reasonably
fast rise time (5 µs) and high maximum voltage (350 V) as well as its high average power
rating. The high compliance voltage enabled two laser diodes to be run from the one
driver by connecting the arrays in series.
Given the high slew rate of the current pulse (up to 120 A in 5 µs), low inductance
cable must be used to deliver the drive pulse to reduce back emf’s and prevent overshoot
and ringing on the rising and falling edges of the drive pulse. Any reverse bias on a laser
diode array can be extremely hazardous and damage can be caused by as few as two volts
of reverse bias. The high average power load on the cable prevents the use of coaxial
cable, so Supra Ply loud speaker low inductance (0.2 µH/m) cable was chosen to deliver
the current pulse to the laser diodes. When testing the cables with 100 A current pulses
it was observed that the shape of the pulse was the same when using a cable length of
40 cm and 4 m, indicating that the inductance of the cable does not substantially affect
the drive pulse.
7.2.3 Water cooling system
The SDL laser diode arrays require direct water cooling. The copper heatsinks used to
cool the Nd:YAG slab were also designed for liquid cooling. To supply the coolant a
Polyscience 6506T recirculating chiller was purchased. This unit can control the water
temperature between -10 and 40 with a stability of ± 0.1, enabling the laser diodes

104 CHAPTER 7. PERFORMANCE OF THE HIGH POWER 1064 NM LASER
Recirculatingchiller
Flow sensor
Flow meters
Laser diodes
Laser heatsink
Filter
Figure 7.1: Block diagram of the water cooling system. The one chiller provides the
temperature controlled coolant for the four laser diodes and heatsinks in the laser head.
to be temperature tuned to the 808 nm absorption band of Nd:YAG with an accuracy
of ± 0.03nm. Ideally, the coolant to each laser diode should be individually temperature
controlled to account for the slight wavelength differences between arrays (arising from
manufacturing variations), and the laser slab heatsinks should be made as cold as pos-
sible to exploit the improved thermal properties of YAG at low temperatures [61]. For
simplicity, however, the four laser diodes and the slab heatsinks were all cooled using the
same chiller unit using an optimised water temperature. Section 7.2.5 contains further
details on temperature tuning. To prevent blockage of the coolant micro-channels within
the laser diode assembly, a 5 micron particle filter was fitted to reduce particulate matter.
Figure 7.1 shows a block diagram of the cooling system.
Corrosion is a common problem in cooling systems having a low, un-monitored pH
and in systems where different metals are in contact with the same cooling fluid, leading
to degradation from galvanic processes. The above cooling system contains brass, copper
and steel in the plumbing manifolds and laser diode arrays as well as other metals inside
the chiller pump and plumbing. All of these metals are in contact with the coolant flow.
To avoid corrosion, a corrosion inhibitor and algicide (Optishield Plus) was added to
distilled water and used as the coolant.

7.2. PUMP LASER PERFORMANCE 105
7.2.4 Interlock system
Interlock systems are an essential feature of field deployable laser systems and also for
lab based systems where the high optical powers generate safety issues and the high heat
loads present a danger of catastrophic failure of the laser diodes and slab. An automated
interlock shutdown system was therefore installed. The system consists of an electronic
control box2 and sensors to monitor the temperature of the laser diode arrays, a flow of
coolant flow and door opening. The unit is designed to trip the laser diode power supplies
if the laser diodes get too hot, if the coolant flow stops or if the laboratory door is opened.
The laser diode temperature was monitored using LM35 temperature sensors. These
devices output a voltage that is directly proportional to their temperature. To provide
an accurate reading, the LM35’s were glued onto each array near the emitting aperture.
The interlock unit was set to trip when the diode temperature exceeded 40.
7.2.5 Performance of individual laser diode arrays
It is important to have diodes with matching power and bandwidth on opposite sides
of the laser slab to minimize thermal gradients in the width direction. If the diodes on
one side have a slightly higher power output, that side of the laser crystal will be hotter
resulting in a net thermal wedge created within the slab. Variation in spectral width
and centre wavelength will also result in an asymmetric pump distribution and thermal
wedging.
General specifications for the SDL laser diode arrays are shown in Table 7.1, but
individual arrays can have markedly different properties, even when purchased from the
same manufacturer and the same fabrication batch. These differences arise from the
variation in semi-conductor material and from the mechanical tolerances present during
assembly. Individual arrays can have different wavelengths, powers and bandwidths.
Table 7.2 summarizes the performance of each laser diode array, and shows that the
centre wavelengths are within 1 nm, the spectral widths are between 2.4 nm and 4.9 nm
and the average powers are within 7 % for 50 A, 25 µs current pulses at 800 Hz.
The data of Table 7.2 indicates that diodes U443 and U438 are well matched in power,
spectral width and wavelength and so these two arrays were set opposite each other in the
laser head, as were diodes U444 and U544, to give the most even pump distribution across
the slab. Figure 7.2 shows the configuration of arrays within the laser head. Measurements
of the thermal gradients within the slab (presented in Section 7.3.1) show that the thermal
2Credit for the design of the electronic control box goes to N. Wild, D. Mudge, D. Hosken, M. Heintze,
B. Nation and other members of the optics group

106 CHAPTER 7. PERFORMANCE OF THE HIGH POWER 1064 NM LASER
Serial No. Wavelength (25) Spectral width (FWHM) Power (avg at 50 A, )
U438 810 nm 2.4 nm 19.7 W
U443 810 nm 2.6 nm 19.8 W
U444 811 nm 2.4 nm 21.1 W
U544 811 nm 4.9 nm 20.4 W
Table 7.2: Measured performance of the four SDL-3251-HK laser diode arrays used in the
laser head.
U443
U444
U438
U544
waveguide
slab
diodearrays
Figure 7.2: Optimized array configuration within the laser head showing arrays matched
in power, wavelength and spectral width situated opposite each other
lensing is symmetric in the pump direction indicating that similar pump power is being
delivered from each side of the slab.
7.2.6 Total pump power and absorbed pump power
The total pump power exiting the waveguides was measured for each pump module. The
results are plotted in Figure 7.3. To determine the fraction of pump power absorbed in
the slab, the power transmitted through the slab was measured. It was found that at
least 17 % was transmitted indicating that the absorption in the slab is 83 %, or slightly
lower, due to the difficulty in collecting the entire pump light transmitted through the
slab. Some losses may of occurred during the transmission measurement due to the pump
light impinging on the slab heat sink after passing through the slab.
The measured value of absorption (83 %) is similar to the theoretical prediction of
77 %, which includes an 8.5 % reflection loss from the un-coated Nd:YAG surface and
approximately 84 % absorption in the 4.5 mm thick 1 at. % Nd:YAG crystal, as calculated
in Section 6.3.2.

7.2. PUMP LASER PERFORMANCE 107
30 35 40 45 50 55 60 0
10
20
30
40
50
Ene
rgy
per
puls
e (m
J)
Pump current (A)
U544U438 U443U444
(a)
30 35 40 45 50 55 0
10
20
30
40
50
60
70
80
90
Ene
rgy
per
puls
e (m
J)
Pump current (A)
(b)
Figure 7.3: Plot of the total pump energy exiting the waveguides and incident on the slab.
Part a) shows the energy from individual pump modules and part b) shows the sum of
energy from both pump modules. The pulse repetition rate is 800 Hz for each case and
the pulse width is 25 µs.

108 CHAPTER 7. PERFORMANCE OF THE HIGH POWER 1064 NM LASER
20 40 60 80 100 120
10
20
30
40
50 Output (mJ) Slope efficiency 49%
Lase
r ou
tput
(m
J)
Optical pump energy (mJ)
Figure 7.4: The multi-mode power output from the laser head when operated in standing
wave configuration. The results shown are for a PRF of 800 Hz.
Most of the pump light that is not absorbed by the slab is incident on the opposing
diode arrays, changing the temperature and hence wavelength of the pump light. For this
reason, the temperature tuning of the laser diodes was optimised when the laser head was
fully assembled, so as to maximise the 1064 nm output power of the laser.
7.3 Multi-mode performance of the high power laser
head
To assess the performance of the laser head and to determine the maximum amount of
laser power available for extraction, the laser was run in standing wave configuration with
two mirrors placed close to the laser slab. One of the mirrors was a flat, max R and the
other 2 m radius of curvature and a transmission of 90 %.
The output energy from the slave laser is shown plotted in Figure 7.4. As can be seen
in this figure, a total of 50 mJ per pulse at 800 Hz was obtained from a pump energy of
107 mJ. The pump energy was not increased beyond the value shown in Figure 7.4 for
fear of damaging the laser diode arrays.

7.3. MULTI-MODE PERFORMANCE OF THE HIGH POWER LASER HEAD 109
7.3.1 The Mach-Zender interferometer
An accurate measurement of the thermal lens focal power within the laser crystal is
essential for the design of a stable, efficient resonator. While the laser head was designed
with the objective of minimizing thermal gradients, some thermal lensing is to be expected
due to the non-uniform horizontal pump distribution within the slab. Measurements of
the thermal lens were thus undertaken to asses the extent of the gradients.
Thermal lensing can be measured by shining a probe beam through the slab and
detecting the shift in waist position [114], or by using interferometry [115]. A Mach-
Zender interferometer was used because it gives an accurate measurement of thermal lens
focal power and also provides a useful diagnostic for other thermal effects such as thermal
wedging and non-uniform thermal contact between the slab and heatsinks and near field
variations in heat, not seen in the far field.
A schematic of the measurment set-up is shown in Figure 7.5. It uses a helium-neon
beam that is split into a reference and object beam; the latter passes through the laser
slab and the former passes through a similar optical path length in air. The object
beam accumulates phase changes from any differences in optical path length caused by
inhomogeneities in refractive index which, when recombined with the reference beam,
show up as a series of light and dark fringes from constructive and destructive interference.
Hence temperature gradients within the slab can be directly measured by analysis of the
fringe pattern recorded using a CCD. A lens was used to image the slab onto the CCD,
thereby eliminating diffraction fringes from the slab aperture and providing magnification
to make use of the full CCD array, which improves the resolution of images.
The measurement technique was tested using a lens of known focal length placed in
front of the slab. In absence of these lenses no fringes were observed in the interferogram.
Figure 7.6 shows interferograms for lenses of nominal focal lengths f = 100 cm and f =
50 cm.
The focal power of the thermal lens can be estimated by counting the number of fringes
in the images in Figure 7.6. The focal length of the lens f is given by
f 2 ≡ R2 = d2 + (R − ∆S)2 ⇒ R =d2
2∆S(7.1)
where d is the aperture size as in Figure 7.7, R is the radius of curvature of the wavefront
after the lens and ∆S, the sag, is measured by the interferometer by counting the number
of fringes, with each fringe equivalent to a ∆S = 633 × 10−9 m, the wavelength of the
HeNe probe laser. The slab aperture in the horizontal direction is d = 2.2 × 10⁻³ m
so, using Equation 7.1, if there were one fringe across the slab aperture, the focal length
would be 3.8 m, for two fringes f = 1.9 m and so on. Using this analysis, the focal lengths

110 CHAPTER 7. PERFORMANCE OF THE HIGH POWER 1064 NM LASER
He
-Ne
Beam expander
Wedge
Wedge
He-Nemirror
He-NemirrorSlab
Power meter
1064nmout-coupler
1064nmmirror
1064nmmirror
CCDcamera
He-Ne line filter
Imaging lens
Reference arm
Object arm
Figure 7.5: Schematic of the Mach-Zender interferometer used to measure thermal lensing
and thermal distortion within the laser slab. The He-Ne beam is split into an object and
reference arm, with object beam passing through the slab and the other passing through
the same path length in air. When the beams are recombined, phase differences between
the two wavefronts are detected as light and dark interference fringes on the CCD.
(a) (b)
Figure 7.6: Pictures showing the interference patern produced by placing a lens of focal
length 100 cm (a) and 50 cm (b) in the object arm of the Mach-Zender interferometer.

7.3. MULTI-MODE PERFORMANCE OF THE HIGH POWER LASER HEAD 111
He-Newavefront
Lens
d
Ds R- sD
He-Newavefront
Figure 7.7: Diagram illustrating how the thermal lens can be estimated by counting the
number of fringes in the interferogram. In this picture, the slab is represented by the lens
with aperture width d. Wavefronts from the He-Ne probe beam are incident upon the
lens and ∆S is measured by the interferometer.
of the lenses in Figure 7.6 can be estimated as being approximately 125 cm and 60 cm,
which is close to their known values of 100 cm and 50 cm respectively.
Measuring the thermal lensing in this way provides useful visual information of thermal
distortions over the whole slab aperture. For example, if there are hot and cold spots across
the slab or a thermal wedge is present, this will be observed in the interference pattern. In
the next section, a different analysis technique is presented which provides more accurate
values for the thermal lens focal length (as it does not require human counting of fringes)
but it does not provide visual information overm the whole slab aperture.
Interferograms of the laser slab were taken when pumping with average powers of
25 W, 40 W, 55 W and 70 W for 25 µs pump pulses at a repetition rate of 800 Hz.
Typical measurements are shown in Figure 7.8. For these measurements the laser was not
lasing. Measurements taken while the laser was running and a comparison between the
two sets of data are presented in Section 7.3.2.
From these figures it can be seen that the centre of the thermal lens does not coincide
with the centre of the slab, indicating that a thermal wedge is being formed within the
gain medium. The lens centre drifts towards the top of the slab, indicating that the top
is slightly cooler than the bottom. The reason for this could be due to the top surface of
the slab being slightly larger in area than the bottom (212 mm2 vs 194 mm2) due to the
tilt introduced to combat parasitic oscillations (see Section 6.3.4) or due to variations in
thermal contact. The larger area in contact with the top heat sink would result in more
effective cooling through this surface.

112 CHAPTER 7. PERFORMANCE OF THE HIGH POWER 1064 NM LASER
(a) 25 W, f ≈ 10 m (b) 40 W, f ≈ 6 m
(c) 55 W, f ≈ 4 m (d) 70 W, f ≈ 3 m
Figure 7.8: Interferograms of the laser slab under heat load when pumping with average
powers of 25-70 W. The thermal lens focal length (stated beneath the figures) was esti-
mated by counting fringes as described previously. A more accurate method of calculating
the thermal lens value is presented in the next section. For these measurements the laser
was not lasing.

7.3. MULTI-MODE PERFORMANCE OF THE HIGH POWER LASER HEAD 113
(a) 0 W pump (b) 70 W pump
Figure 7.9: Interferograms with a horizontal tilt in the reference arm mirror of the Mach-
Zender interferometer.
7.3.2 Measurement of thermal focal power using a tilted wave-
front
A more accurate measurement of the thermal focal power can be obtained by introducing
a tilt in the reference arm, thereby creating an increased number of fringes and increasing
the number of sample points across the wavefront.
Interferograms using a horizontal tilt in the reference arm mirror are presented in
Figure 7.9. Figure 7.9(a) shows the slab with no heat load and Figure 7.9(b) is for an
average pump power of 70 W. The image without heat load is used as a reference to
subtract the effect of the tilt from the pumped image. This is accomplished by taking a
1-D slice thought the image, finding the maxima of the fringes and plotting the this data as
shown in Figure 7.10(a). The slope of this plot is then subtracted from the data obtained
from a slice through of the pumped image, giving the profile shown in Figure 7.10(b).
This plot shows the change in phase across the slab aperture due to thermal distortion.
The focal power of the lens is calculated by fitting a parabola of the form a + c(x − b)2
and extracting the values of constants a, b and c, from which the focal power, f , can be
calculated using3
f =1
nγ sin(γL)(7.2)
3the focal length is given by f = − 1
Cwhere C is the [2,1] (second row, first column) element of the
ABCD matrix of a Gaussian lens duct representing the laser slab [88].

114 CHAPTER 7. PERFORMANCE OF THE HIGH POWER 1064 NM LASER
0 1 2 3 4 5 0
25
50
75
100
125
150 Fringe maxima Linear fit
P
hase
(R
ad)
Distance across slab (mm)
(a) 0 W pump
0 1 2 3 4 5 -45.0
-42.5
-40.0
-37.5
-35.0
-32.5
-30.0
Fringe maxima Polynomial fit
Pha
se c
hang
e (R
ad)
Distance across slab (mm)
(b) 70 W pump
Figure 7.10: Plots showing the maxima of interference fringes from Figure 7.9. Part a)
is with no pumping, and the slope of this plot is subtracted from part b) to remove the
phase change introduced by the tilt. A parabola is fitted to part b) and used to calculate
the value of the thermal lens.

7.4. INJECTION MODE-LOCKED LASER PERFORMANCE 115
Pump Power (W)not lasing lasing
fh (m) fv (m) fh (m) fv (m)
25 13.7 27.1 18.3 48.4
40 6.0 9.5 8.5 11.2
55 4.2 5.5 5.8 9.5
70 3.1 4.2 3.7 5.2
Table 7.3: Measurements of the thermal lens in the horizontal, fh and vertical, fv direc-
tions for various pump powers. Measurements were taken when the slab was lasing (in
multi-mode configuration) and also when not lasing.
where n is the refractive index of Nd:YAG (1.82), L is the length of the slab and
γ =
√
cλ
πLn(7.3)
Measurements of the thermal lens focal lengths were taken with and without lasing.
When lasing, a flat mirror and flat outcoupler were placed on either side of the slab as
in Figure 7.5. For the not lasing measurements, these mirrors were removed. The results
of the thermal lens measurements for both cases are presented in Table 7.3. The results
show that the thermal focal power was around 20 % lower when the laser was lasing due
to additional heat being removed by optical power when lasing. This value is consistent
with the results of other groups [61]. The fact that the thermal lens is different when
lasing in a multimode cavity (compared to when not lasing) also sugests that the thermal
lens will be different when lasing TEM00, see below.
Importantly, Table 7.3 show that the thermal lensing is weak and relatively symmetric
in horizontal and vertical directions (the vertical direction is around 20 % weaker for high
pump powers when the lens is significant). As was discussed in Chapter 5, a weak,
symmetric thermal lens is essential for the simple, efficient incorporation of the laser head
within a long, stable TEM00 resonator.
7.4 Injection mode-locked laser performance
7.4.1 Resonator design
The proof of principle laser described in Chapters 3 and 4 used a resonator designed for
dynamic stability whereby the beam size in the laser slab was made insensitive to changes
in the thermal lens focal length, as detailed in Section 3.1. While the proof of principle
laser was operated only at low average power and so would not benefit significantly from

116 CHAPTER 7. PERFORMANCE OF THE HIGH POWER 1064 NM LASER
HWPmirror
slabQ-switchmirror
TFP
Seed pulse Output
lens
Figure 7.11: Resonator design for the injection mode-locked slave laser showing the single
intra-cavity spherical lens used to compensate the thermal lens within the slab. The round
trip length was made 4.2 m for dynamic stability as before.
the dynamic stability, the tests showed that the long resonator was simple to align and had
good long term stability and efficiency. It was therefore decided to use the same resonator
design for the high power laser(Figure 7.11). The only difference between the two lasers
is the stronger thermal lensing measured in the high power laser due to the increased
average pump power. As reported in the preceding section, the thermal focal length in
the slab at 70 W pump power when lasing multimode is around f = 4.5 m (average of
fh and fv). The effect of this lens can be compensated by altering the intra-cavity lens
required for stability. If there was no thermal lensing, the value of this lens should be
f = 2.1 m (half the round trip length) to make the trace of the resonator’s round trip
ABCD matrix zero as required for optimum stability. But with the thermal lens reported
above, the value of this lens should be lengthened to f = 3.9 m to compensate.
High quality spherical lenses are available off-the-shelf with focal lengths of f = 1 m,
1.5 m, 2 m, 5 m and 10 m [60]. Using a combination of the longer focal length lenses can
provide intermediate values.
When the resonator was assembled and tested in TEM00 operation, it was found ex-
perimentally that an intra cavity lens of f =1.5 m was most effective, producing higher
average powers and slope efficiencies than either the 1 m or 2 m lenses (performance re-
sults are presented in the next section). The reason for the difference between predicted
and experimentally determined lenses can be attributed to a combination of two effects.
Firstly, there are different thermal conditions present when running in TEM00 mode as
compared to the multimode conditions for which the thermal lens was measured (Sec-
tion 7.3.2). In TEM00 mode, less power is extracted from the wings of the slab, resulting
in a hotter sides and a reduced thermal lens focal length. When lasing multimode with a
flat-flat resonator design, there is more power extracted from the sides (where the pump

7.4. INJECTION MODE-LOCKED LASER PERFORMANCE 117
density is highest) compared to the centre so a stronger lens was measured in Section 7.3.2.
The long length of the ring resonator (4.2 m) made thermal lens measurements difficult
when running a TEM00 mode due to fringe stability issues arising from the long object
and reference arms. These measurements were not performed.
Another aspect that can affect the optimum focal length of the intra-cavity lens is the
size of the beam passing through the slab. Modelling shows that an intra-cavity lens with
with a focal length of 1.5 m will produce a slightly larger mode size within the slab than
a lens with f = 2 m. This could result in a more efficient sweep out of the laser gain and
give higher output power.
7.4.2 Injection mode-locked laser power at 800 Hz PRF
A plot of the output from the injection mode-locked slave laser is presented in Figure 7.12,
showing a maximum output energy of 12 mJ per macro-pulse is obtained at a PRF of
800 Hz. This equates to an average power of 9.4 W and ranks as one of the highest average
powers reported for a single mode electro-optically Q-switched Nd:YAG laser system in a
stable cavity. Other authors of similar, high average power systems have reported powers
of 15 W [63], 11 W [64] and 10 W [62].
For pump powers higher than the maximum value displayed in Figure 7.12, the output
of the slave laser was seen to roll off and was limited to 12 mJ. This is thought to be due to
the thermal lens drifting towards the top heat sink of the slab as shown in Figure 7.8, from
improper thermal contacts. One way to correct for this occurance is to have independent
temperature control of the top and bottom heat sinks of the slab. This modification
remains for future work.
The average power recorded from the 1064 nm laser is sufficient to satisfy two of the
three power scaling design options presented in Section 2.6. The design options discussed
in Section 2.6 were: using a MOPA to boost the average power of the slave oscillator to
50 W; having a system of five 10 W 589 nm laser systems that each generate one of the
five beacons required for MCAO, and, having a single oscillator produce the entire 50 W
in one step. The 1064 nm slave laser described in this chapter can meet the average power
requirements of the first two of these design options.
7.4.3 Reproducibily of slab mounting
The maximum average power produced by the laser varied on successive rebuilds of the
head. The variations were caused by the thermal contact between the Nd:YAG and heat
sinks. As described in Section 6.4, indium foil was placed between the N:YAG and the

118 CHAPTER 7. PERFORMANCE OF THE HIGH POWER 1064 NM LASER
0 10 20 30 40 50 60 70 80 90 100
2
4
6
8
10
12
Slope efficiency = 16.4%
Ene
rgy
per
puls
e (m
J)
Pump Energy (mJ)
Figure 7.12: A plot of the injection mode-locked Q-switched single-transverse-mode out-
put from the high power oscillator. These measurements were taken at a PRF of 800 Hz
and show that a maximum average power of 9.4 W was obtained with a slope efficiency
of 16.4 %.

7.4. INJECTION MODE-LOCKED LASER PERFORMANCE 119
copper heat sink to improve thermal contact. Any irregularities in indium thickness or the
copper clamping pressure/uniformity will affect the performance. On successive rebuilds
the laser produced 8.0 W, 3.3 W, 7.6 W, 9.4 W, 3.2 W and 8.0 W of injection mode-
locked average power. 9.4 W was the maximum obtained and the results are plotted in
Figure 7.12.
During each rebuild, the assembly technique was refined slightly to try to improve per-
formance. Some of the experimentations performed were: bringing the top heat sink down
squarely using a height feeler gauge; clamping the slab with a single screw pushing down
on the centre of the top heat sink; rolling the indium first onto the slab and then crushing
with the copper blocks. The final assembly technique was described in Section 6.4.
Experiments were also conducted with the indium. It was observed that when the
indium is heated to close to its melting point (157C) it becomes softer than at room
temperature. It was hoped that this would help the indium flow into inhomogeneities of
the slab/copper interface and reduce thermal impedance of the laser head. To test this
hypothesis, the assembled laser head was heated in an oven to 152C and held at this
temperature for 4 hours. Unfortunately, this warped the laser head structure so that the
top copper heat sink no longer slid down freely on the locating pins (Figure 6.12). Since
heating, the laser head could not reproduce its former performance and the average power
was limited to 2-5 W.
7.4.4 Q-switched pulse stretching
Q-switched pulse stretching was successfully demonstrated with the proof of principle laser
by driving the Q-switch with a tailored high voltage waveform so as to vary the lasers
output coupling fraction and control the build-up of the giant pulse. This technique was
used to stretch the duration of a 10 mJ macro-pulse from 400 ns to 1.8 µs. The test
laser was operated at 50 Hz PRF, but scaling the repetition rate is not expected to be a
problem as the high voltage circuit was shown to work reliably at 800 Hz and the BBO
Pockels cell did not show any ringing at this higher frequency.
It was observed, however, that the commercial QCW power supplies used to drive
the laser diode arrays exhibited an un-expected variation in pulse width as shown in
Figure 7.13. The variation in width was measured to be 1.5 µs, representing a 6 %
variation in pump energy from the laser diodes. This variation has a large effect on the
build up time of the giant pulse and consequently distorts the stretched macro-pulse shape
as shown in Figure 7.14, as the level shift between low and high outcoupling fraction (time
t1 in Figure 4.8) was triggered at a fixed time after the start of the Q-switch drive pulse.
The observed variation in stretched macro-pulse shape is clearly not acceptable as it will

120 CHAPTER 7. PERFORMANCE OF THE HIGH POWER 1064 NM LASER
10 sm
8A
(a)
2.5ms
8A
(b)
Figure 7.13: Overlay of multiple current pulses from the laser diode driver (a). The
measurement was taken with an oscilloscope set to trigger on the front edge of the pulse
and the width of the back edge (b) shows the deleterious variation in pulse width.
reduce SFG efficiency from the mismatch between 1064 and 1319 nm macro-pulse shapes
and could result in damage to intra-cavity optics if the giant pulse is allowed to build up
too high before outcoupling.
This problem is caused by a fault in the laser diode driver control system and the
manufacturer has agreed to attempt to fix the problem if the units are returned.
7.4.5 Beam quality measurement
Good beam quality is essential for guide star lasers at 589 nm as it enables a tight focus
of the beam in the sodium layer, creating a bright, near-point-source beacon that can be
detected by the wavefront sensor in the adaptive optics system with maximum signal-
to-noise ratio. This minimizes the total average power required of the guide star laser
source. Good beam quality is also essential for high SFG efficiency as it enables a tighter
focus inside the SFG crystal, giving high peak powers. To achieve good beam quality at
589 nm, the 1064 nm and 1319 nm lasers must have good beam quality.
Laser beam quality can be measured using Hartmann or Shack-Hartmann wavefront
sensors [116], by measuring the transmission through a mode-matched passive optical
cavity [117] or by the approach recommended by the ISO Standard 11146 where the spot
size of the beam is recorded at a focus and at points beyond the Rayleigh range. It was
decided to use the later approach as this technique offers an accurate measurement using
a simple experimental setup.

7.4. INJECTION MODE-LOCKED LASER PERFORMANCE 121
(a) (b)
Figure 7.14: Variation in the stretched macro-pulses (lower trace) resulting from the pump
pulse-width jitter. The upper trace shows part of the Q-switch drive waveform. These
are single-shot measurements recorded using a digital oscilloscope and some aliasing is
present due to insufficient sampling of the micro-pulses. The overall pulse shape can still
be observed in these figures, however.
The injection mode-locked output of the slave laser was focused to a waist as depicted
in Figure 7.15 and the spot-size of the beam was sampled at multiple points both around
the waist region and outside the Rayleigh range. The beam propagation factor, M2, can
then be obtained by fitting a curve of the form
ω(z)2 = ω20 + θ2z2 (7.4)
and using the fit to obtain values of the waist spot-size, ω0, and far field divergence angle,
θ. The beam propagation factor, M2, can then be calculated using
M2 =ω0θπ
λ(7.5)
For increased accuracy, the spot-size of the beam should be sampled at many points;
at least five times within the Rayleigh range to obtain an accurate value for ω0 and at
least five times at > ±2 Rayleigh ranges to obtain an accurate value of θ.
The definition of spot-size used in Equations 7.4 and 7.5 assumes a near-gaussian
profile with ω(z) being the radius that encloses 1/e2 or 86.5 % of the beam energy. For
beams that are far from diffraction limited, the 1/e2 definition of spot-size becomes less
meaningful and alternative definitions can be used [118]. Since the laser beam in this case
has a Gaussian intensity shape (see results section) the 1/e2 definition was adopted.

122 CHAPTER 7. PERFORMANCE OF THE HIGH POWER 1064 NM LASER
w0
q
z
w(z)
Figure 7.15: To measure the beam quality of the slave laser, the beam is focused by a
lens and the spot-size, ω(z), is measured at various location, z. For greatest accuracy,
multiple measurements should be taken near the waist (ω0) and in the far field.
Avg. Power M2x M2
y
2 W 1.05±0.05 0.98±0.05
7 W 1.05±0.05 1.02±0.05
Table 7.4: Measurements of beam quality for the injection mode-locked slave laser show-
ing near-diffraction limited performance in both x- and y-directions. The measurement
uncertainty is due to the accuracy of the translation stage used to measure the beam
waist.
The spot-size was measured by translating a knife-edge across the beam and recording
the distance travelled to block 10 % then 90 % of the beam power and multiplying this
value by 0.781 to obtain the spot-size [119].
Measurements of the injection mode-locked slave laser beam quality were recorded at
output power levels of 2 W and 7 W. Plots of the spot-size data, together with a least
squares fit to the data using Equation 7.4 are displayed in Figure 7.16.
The beam propagation factor, M2, was measured independently for the x and y-axes
(horizontal and vertical respectively) and the results are summarized in Table 7.4. The
near-diffraction-limited beam quality measured for both axes at the high power levels
stated in Table 7.4 shows that the laser performs in excess of the requirement set for
advanced guide star sources (M2 < 1.2).
7.4.6 Laser bandwidth measurements
As in Section 3.6.4, bandwidth control of the high power injection mode-locked slave laser
was measured by injecting a variable-width seed pulse and recording the bandwidth of
the output using a scanning Fabry-Perot interferometer. The Fabry-Perot recordings were

7.4. INJECTION MODE-LOCKED LASER PERFORMANCE 123
-400 -200 0 200 400 600 0.0
0.2
0.4
0.6
0.8
1.0
1.2
1.4
Measurement Fit
Distance (mm)
Spo
t siz
e (m
m)
(a) 2 W, M2
x = 1.05
-400 -200 0 200 400 600 0.0
0.2
0.4
0.6
0.8
1.0
1.2
1.4
Measurement Fit
Distance (mm)
Spo
t siz
e (m
m)
(b) 2 W, M2
y = 0.98
-400 -200 0 200 400 600 0.0
0.2
0.4
0.6
0.8
1.0
1.2
1.4 Measurement Fit
Distance (mm)
Spo
t siz
e (m
m)
(c) 7 W, M2
x = 1.05
-200 0 200 400 600 0.0
0.2
0.4
0.6
0.8
1.0
1.2
1.4
Measurement Fit
Distance (mm)
Spo
t siz
e (m
m)
(d) 7 W, M2
y = 1.02
Figure 7.16: Measurement of laser beam quality showing the measured points and a least
squares fit to the data.

124 CHAPTER 7. PERFORMANCE OF THE HIGH POWER 1064 NM LASER
integrated over many macro-pulses, giving spectra as shown in Figure 7.17. The results
are summarized in the plot of Figure 7.18(a).
Comparing these results with the low power laser head (Figure 7.18(b)), we see good
agreement, with a time bandwidth product 0.91 in each case. The range of bandwidth
measurements was extended in Figure 7.18(a) by generating seed pulses of width 1.99-
2.67 ns by swapping HV pulsers in the pulse slicer. Previously (Section 3.4), the 1 ns HV
pulser was used to drive the first Pockels cell (creating the leading edge of the seed pulse)
then the 2.7 ns HV pulser created the trailing edge of the seed pulse using the second
Pockels cell. Hence the maximum seed pulse width was 1 ns (the length of the drive
pulse to PC1) resulting in a minimum bandwidth of 840 MHz. Longer seed pulses were
obtained by swapping the HV drivers, giving the narrower bandwidths in Figure 7.18(a).
The narrower bandwidths in Figure 7.18(a) may be beneficial for the final guide-
star laser if sodium bleaching is not significant for the given pulse format and power
level. Either way, the broad range of bandwidths achievable and the ability to adjust
the bandwidth to maximise photon return makes the injection mode-locked laser system
ideally suited to guide star applications.
7.5 Conclusions
This Chapter presented the results of a new high-average-power injection mode-locked
slave laser, optimised for efficient SFG and advanced guide star laser systems. The laser
uses a side pumped, conduction cooled Nd:YAG slab design and was able to demonstrate
power levels of up to 10 W with near-diffraction limited beam quality. The lasers spectral-
width was shown to be adjustable over a range of 0.36-2 GHz by controlling the width of
the injected seed pulse. These properties, combined with the inherent low timing jitter
and wavelength control of injection mode-locking, demonstrate that the laser design is
able to meet all requirements of the 1064 nm slave oscillator for advanced SFG guide star
systems on ELT’s. A power amplifier is planned to follow the slave oscillator to boost the
power levels to 50 W as discussed in Chapter 2.
One remaining issue is the fault discovered in the commercial laser diode drivers. It
was found that substantial pulse jitter exists in the current pulses produced by these
devices. This prevented the use of Q-switched pulse stretching due to the variation in
build up time of the giant pulse. The pulse stretching technique of Chapter 4 was, however,
demonstrated with macro-pulses of the same energy as reported in this Chapter and the
pulse stretching electronics is capable of running at an 800 Hz PRF, so pulse stretching

7.5. CONCLUSIONS 125
Po
we
r
108MHz
(a) 364 MHz
108MHz
(b) 466 MHz
Po
we
r
270MHz
(c) 842 MHz
270MHz
(d) 1423 MHz
Figure 7.17: Measurements of bandwidth of the slave laser output taken with a scanning
Fabry-Perot interferometer. One horizontal division represents 108 MHz in part a) and
b) and 270 MHz for part c) and d). The gaps seen in the spectra are due to the limited
sampling rate of the oscilloscope used to record the measurements. The stated bandwidth
(BW) is the FWHM of a Gaussian fit to the data. The duration of the injected seed pulse
was 2.7 ns for part a) 2.2 ns for b), 1.1 ns for c) and 0.6 ns for part d).

126 CHAPTER 7. PERFORMANCE OF THE HIGH POWER 1064 NM LASER
0 500 1000 1500 2000 2500 30000
500
1000
1500
2000
2500Laser
bandw
idth
(M
Hz)
Micro-pulse width (ps)
Measured
= 0.93DtDu
(a)
400 600 800 1000 1200500
1000
1500
2000
2500
HPS
LPS
=0.91DtDn
La
se
r b
an
dw
idth
(M
Hz)
Micro-pulse width (ps)
(b)
Figure 7.18: Plots showing the range of bandwidth tunability of the high power injection
mode-locked oscillator. Part a) shows the full range of bandwidth tuning while part b)
shows the high power slave measurements (black) overlaid with the measurements from
the low power slave (red) with the same measurement range as Figure 3.17

7.5. CONCLUSIONS 127
is not expected to be a problem if a suitable replacement driver is obtained.

128 CHAPTER 7. PERFORMANCE OF THE HIGH POWER 1064 NM LASER

Chapter 8
Conclusions
This thesis presents the design and development of a new type of guide star laser source,
capable of producing a pulse burst waveform that can essentially meet all of the re-
quirements for next generation adaptive optics systems. The pulse burst contains short
duration micro-pulses whose width can be adjusted to set the lasers bandwidth and the
Q-switched macro pulse duration is optimised to avoid star elongation and reduce sodium
bleaching. The 1064 nm experiments presented in this thesis have proven that the design
works, in that the lasers spectral requirements can be achieved, and the average power
can be scaled to a level that is sufficient to produce a guide star system composed of five
subscale (10 W) systems, or to saturate an amplifier stage to boost the average power to
the required 50 W.
Details of the laser system design were presented in Chapter 2. The design uses SFG of
1064 nm and 1319 nm Nd:YAG lasers to achieve the sodium wavelength and includes the
novel concept of injection mode-locking as a robust way to control the lasers wavelength,
bandwidth and timing for SFG. The design uses a new ring resonator, which allows both
injection mode-locking and efficient Q-switched pulse stretching. The high peak power
and low timing jitter of the short micro-pulses allow a simple, efficient single pass SFG
stage to be used, simplifying the design.
A low average power injection mode-locked 1064 nm laser was assembled to test key
design features and the results of these experiments were presented in Chapter 3 and
published in ref. [32]. The seed pulses for injection mode-locking were produced using
a double Pockels cell switch that was capable of producing short duration pulses with a
variable duration ranging from 0.3 to 2.7 ns. The wavelength of the seed pulse is used to
set the wavelength of the slave laser which can be locked to the sodium absorption line.
The width of the seed pulse is adjusted to match the lasers spectral bandwidth to the
Doppler broadened linewidth of atmospheric sodium.
129

130 CHAPTER 8. CONCLUSIONS
A new method for stretching the duration of Q-switched laser pulses was described in
Chapter 4. The method uses a tailored high voltage waveform to drive the Q-switch which
rapidly varies the resonator outcoupling fraction to slowly release the energy stored in the
gain medium and lengthen the output pulses. This technique is facilitated by a novel ring
resonator design that uses all modulated energy as the laser output, thus enabling near-
unity efficiency to be achieved by this technique. Furthermore, the rapid control of the
outcoupling enabled shaping of the macro-pulses and flat-topped pulses were generated
that were stretched by a factor of 4.5 to 1.8 µs.
Chapters 5, 6 and 7 presented the design, construction and development of a new
high average power Nd:YAG laser head, optimised for use in the guide star system. The
design uses a zigzag Nd:YAG laser slab, pumped from each side by a pair of un-collimated
laser diode arrays. The diode light is transported to the slab via a custom built, low-loss
waveguide that mixes up the pump light to reduce inhomogenaeities and condenses the
light to match the slab aperture. The pumping and cooling geometry was selected to
minimize thermal distortions within the slab and enable scaling to high average powers.
Measurements of the thermal lensing under pumping showed that the thermal focal length
was kept low, enabling the simple integration of the laser head into a long length resonator.
Injection mode-locking was demonstrated with this laser for a PRF of 800 Hz as required
of the final guide star design. The lasers spectral control was seen to be identical to
the lower PRF proof of principle laser and bandwidth measurements were taken showing
adjustability over a useful range of 0.36 - 2 GHz. Power scaling experiments showed
that this laser was capable of generating a maximum output of 10 W with an injection
mode-locked pulse burst at 800 Hz PRF with near diffraction limited beam quality. This
power level is comfortably sufficient to saturate an amplification stage to further boost
the average power to the 50 W level required by the system design.
Further work is currently in progress to develop the 1064 nm system, reported in this
thesis, into a complete field deployable unit that can be operated remotely at a large
aperture observatory. This work includes the replication and optimisation of the laser for
1319 nm operation. This task will involve replacing the 1064 nm resonator optics with
optics coated at 1319 nm and conducting experiments to determine the maximum output
available at 1319 nm using the current slab and resonator design. Modifications may have
to be made to the laser slab and resonator design to boost the gain if it is found that
there is insufficient energy produced at this wavelength. The high average power MOPA
and SFG stages also remain for future work, although a discussion of design options were
presented in Chapter 2. Finally, to complete the laser system, the laser must be adapted
for automated control and undergo extensive reliability and field testing. Detailed designs

131
and proof of concept experiments for these systems remain to be done, but some work has
already been demonstrated by previous authors, including the realization of high average
power MOPAs [69], SFG [18] and remotely operated Nd:YAG systems [19].

132 CHAPTER 8. CONCLUSIONS

Appendix A
Publications
Several papers were prepared for publication in peer reviewed journals from material di-
rectly related to the work presented in this thesis. This section presents copies of these
papers for the readers convenience.
The papers contained in this section are: T. P. Rutten, P. J. Veitch, C. d’Orgeville and J. Munch, “Injection mode-locked
guide star laser concept and design verification experiments,” Opt. Express vol. 15
(5), pp. 2369-2374 Mar. 2007. T. P. Rutten, N. Wild and P. J. Veitch, “Fast rise time, long pulse width, kilohertz
repetition rate Q-switch driver,” Rev. Sci. Instrum. vol. 78, 073108 Jun. 2007. T. P. Rutten, P. J. Veitch and J. Munch, “Efficient pulse stretching of Q-switched
lasers,” IEEE J. Quantum Electron. vol. 44 (10), pp. 911-915 Oct. 2008. J. Munch, T. P. Rutten, N. Simakov, M. Hamilton, C. d’Orgeville and P. Veitch,
“A new guide star laser using optimized injection mode-locking,” Proc. SPIE, vol.
7015, June 2008
133

134 APPENDIX A. PUBLICATIONS
Injection mode-locked guide star laser concept and design verification experiments
Thomas P. Rutten1, Peter J. Veitch1, Céline d'Orgeville2 and Jesper Munch11Department of Physics, The University of Adelaide, Adelaide SA 5005, Australia
2Gemini Observatory, Colina el Pino s/n, Casilla 603, La Serena, Chile [email protected]
Abstract: Injection mode-locking combined with stretched Q-switching of a ring resonator are proposed and demonstrated as a promising approach for advanced, guide star lasers. The concept uses two Nd:YAG lasers, producing a macro-micro pulse-burst output, optimized for efficient sum-frequency generation. We demonstrate wavelength, bandwidth and timing control required to maximize the atmospheric Na fluorescence.
2007 Optical Society of America
OCIS codes: (140.3580) Lasers, solid-state; (010.1080) Adaptive optics.
References and links
1. P. W. Milonni, “Resource letter: AOA-1: Adaptive optics for astronomy,” Am. J. Phys. 67, 476 (1999). 2. N. Ageorges and C. Dainty, Laser Guide Star Adaptive Optics for Astronomy (Kluwer Academic Publishers,
2000). 3. N. Hubin, B. L. Ellerbroek, R. Arsenault, R. M. Clare, R. Dekany, L. Gilles, M. Kasper, G. Herriot, M. Le
Louarn, E. Marchetti, S. Oberti, J. Stoesz, J. P. Veran and C. Vérinaud, “Adaptive optics for Extremely Large Telescopes,” in Proceedings IAU Symposium No. 232, 60-85 (2005).
4. R. Foy and A. Labeyrie, “Feasibility of adaptive telescope with laser probe,” Astron. Astrophys. 152, 29 (1985). 5. Requirements from Gemini RFP no. N231397, Dec. 2003. 6. C. E. Max, K. Avicola, J. M. Brase, H. W. Friedman, H. D. Bissinger, J. Duff, D. T. Gavel, J. A. Horton, R.
Kiefer, J. R. Morris, S. S. Olivier, R. W. Presta, D. A. Rapp, J. T. Salmon and K. E. Waltjen, “Design, layout, and early results of a feasibility experiment for sodium-layer laser-guide-star adaptive optics,” J. Opt. Soc. Am. A. 11, 813 (1994).
7. T. H. Jeys, A. A. Brailove and A.Mooradian, “Sum frequency generation of sodium resonance radiation,” Appl. Opt. 28, 2588 (1989).
8. A. Tracy, A. Hankla, C. Lopez, D. Sadighi, N. Rogers, K. Groff, I. McKinnie and C. d'Orgeville, "High-Power Solid-State Sodium Beacon Laser Guidestar for the Gemini North Observatory," Proc. SPIE 5490, 998-1009 (2004).
9. D. M. Pennington, R. Beach, J. Dawson, A. Drobshoff, Z. Liao, S. Payne, D. Bonaccini, W. Hackenberg and L. Taylor, “Compact fiber laser approach to generating 589 nm laser guide stars,” in Proceedings of Conference on Lasers and Electro-Optics Europe, 730 (2003).
10. D. Bonaccini Calia, W. Hackenberg, C. Araujo, I. Guidolin and J. L. Alvarez, "Laser guide star related activities at ESO," Proc. SPIE 5490, 974-980 (2004).
11. E. J. Kibblewhite and F. Shi, “Design and field test of an 8 watt sum-frequency laser for adaptive optics,” Proc. SPIE 3353, 300-309 (1998).
12. Response to Gemini RFP no. N231397, Jan 2004. 13. T. P. Rutten, P. J. Veitch and J. Munch, “Development of a Sodium Laser Guide Star for Astronomical
Adaptive Optics Systems,” presented at the Australasian Conference on Optics, Lasers and Spectroscopy,Rotorua, New Zealand, 5-9 Dec. 2005.
14. A. J. Alcock, P. B. Corkum and D. J. James, “A simple mode-locking technique for large-aperture TEA CO2 lasers,” Appl. Phys. Lett. 30, 148 (1977).
15. J. E. Murray and W. H. Lowdermilk, “ND:YAG regenerative amplifier,” J. Appl. Phys. 51, 3548 (1980). 16. Australian Patent PCT/AU2006/ 001852, Dec. 2006. 17. T. J. Kane and R. L. Byer, “Monolithic, unidirectional single-mode Nd:YAG ring laser,” Opt. Lett. 10, 65
(1985). 18. J. C. Bienfang, C. A. Denman, B. W. Grime, P. D. Hillman, G. T. Moore and J. M. Telle, “20 W of continuous-
wave sodium D2 resonance radiation from sum-frequency generation with injection-locked lasers,” Opt. Lett. 28, 2219 (2003).
#79105 - $15.00 USD Received 18 January 2007; revised 19 February 2007; accepted 22 February 2007
(C) 2007 OSA 5 March 2007 / Vol. 15, No. 5 / OPTICS EXPRESS 2369

135
19. D. C. Hanna, C. G. Sawyers and M. A. Yuratich, “Telescopic resonators for large-volume TEM00-mode operation,” Opt. Quantum Electron. 13, 493 (1981).
20. J. J. Degnan, “Theory of the Optimally Coupled Q-Switched Laser,” IEEE J. Quantum Electron. 25, 214 (1989). 21. C. A. Denman, P. D. Hillman, G. T. Moore, J. M. Telle, J. E. Preston, J. D. Drummond and R. Q. Fugate,
“Realization of a 50-watt facility-class sodium guidestar pump laser,” Proc. SPIE 5707, 46-49 (2005)
1. Introduction
The use of lasers to create artificial guide stars for adaptive optics is currently revolutionizing ground based astronomy by permitting correction of the optical aberrations due to the atmosphere and allowing near diffraction limited performance of large aperture, ground based telescopes when no natural guide star is available near the science object [1, 2]. Light emitted at 589 nm is used to excite sodium fluorescence in the upper atmosphere, thereby creating an artificial point-like source of light, or guide star, which can be used as a source for adaptive optics in a telescope to correct for aberrations in the intervening atmosphere. For extremely large ground based telescopes (ELTs) in the 30 m to 100 m diameter class [3], a single Na guide star does not provide sufficient sampling of the atmosphere [4] and a more complex approach is required using multiple laser guide stars distributed across the aperture of the telescope to allow tomography of the intervening atmospheric aberrations [2]. This approach has resulted in the need to develop improved laser sources. There is thus a demand for increased power and improved pulse burst formats to maximize utility and efficiency [3]. The particular requirements for our work are summarized in Table 1 [5] and include a total optical power ≥ 50 W and a waveform consisting of pulses of duration less than 3 µs, operating at pulse repetition frequencies (PRF) up to 800 Hz. Furthermore, the emission must be exactly tunable to the D2 line of Na, and have a bandwidth that can be optimized between 1 GHz and 3 GHz to enable use of all the Doppler broadened Na available and maximize photon return [1]. Finally, engineering requirements of reliability, robustness and efficiency are important for applications of lasers to telescopes situated on remote mountain tops.
Table 1. Laser Performance Requirements
Output power ≥ 10 W per beam, 5 beams Temporal format Pulsed, PRF variable 600 Hz -800 Hz
Pulse length 1-3 µs Wavelength Na D2 with ability to tune on/off Bandwidth 1-3 GHz
Beam quality < 1.2 x diffraction limited
Approaches to the laser include the first generation dye lasers [6], the more reliable sum-frequency generation (SFG) using solid state lasers [7,8] and recently fiber lasers [9,10], combined with various laser waveform techniques ranging from cw to mode-locking [11]. However, to the best of our knowledge no single approach has fully satisfied all the requirements simultaneously. We have proposed a novel approach [12, 13] using injection mode- locking [14,15] that has the potential to satisfy the above requirements. The concept is summarized below and we also describe critical design verification experiments to demonstrate the viability of the concept.
2. Injection mode-locked guide star laser concept.
Our approach uses sum-frequency generation of two mode-locked Nd:YAG lasers to achieve the desired Na wavelength, similar to previous designs [7,8,11]. Our major contribution is the application of injection mode-locking [14, 15] as a robust method for simultaneous control of the absolute wavelength, bandwidth and timing for SFG. An additional feature is the use of a novel, efficient resonator involving stretched Q-switching [16]. Together, these two techniques are used to produce a burst of high peak power micro-pulses optimized for efficient SFG and contained in longer macro-pulses, separately optimized to minimize bleaching of the sodium in the upper atmosphere. While injection mode-locking using a single
#79105 - $15.00 USD Received 18 January 2007; revised 19 February 2007; accepted 22 February 2007
(C) 2007 OSA 5 March 2007 / Vol. 15, No. 5 / OPTICS EXPRESS 2370

136 APPENDIX A. PUBLICATIONS
injected pulse has previously been used to create single short pulses in CO2 [14] and Nd:YAG [15] lasers, to the best of our knowledge it has not previously been used to produce a long macro-pulse consisting of many micro-pulses with simultaneous control of the bandwidth.
The overall concept is shown in Fig. 1. It uses two cw non planar ring oscillator (NPRO) lasers [17], each stabilized accurately to the wavelengths near 1064 nm and 1319 nm required to produce the Na wavelength by SFG [7]. For robust operation and control we propose using an active servo to accomplish this as shown, but in practice this may not be necessary due to the inherent stability of the NPROs [18]. From the output of each of these cw lasers, we slice a pulse of about 1 ns duration to inject into the slave power resonator for injection mode-locking. Accurate control of the width of the injected pulse is used to control the bandwidth of the micro-pulses of the injection mode-locked output. Precise timing of the two injected pulses is required for efficient single-pass SFG. This is ensured by operating both pulse slicers in series from the same high voltage pulser, thus minimizing timing jitter between the 1064nm and the 1319 nm micro-pulses.
Fig. 1. Overall design concept. Two cw NPRO lasers provide the absolute wavelength control and tuning, and synchronized pulse slicers provide timing and bandwidth control of injection mode-locked slave lasers for subsequent SFG at the Na wavelength.
3. Design verification experiments using a subscale, 1064nm laser.
3.1 Seed pulse production
To investigate bandwidth control by injection mode-locking, we have assembled a versatile pulsed seed source consisting of an NPRO master laser followed by two 50 ohm Pockels cells between linear polarizers. Two independent high voltage avalanche transistor pulsers are used to provide fast rise time (100 ps) electrical pulses to the Pockels cells. This setup allows complete control of the optical pulse width, by using one Pockels cell to turn on the pulse and the other to turn it off, with an adjustable time delay between the two events.
Using this pulse slicer, we have produced optical seed pulses of peak power up to 0.5 W, and pulse duration continuously adjustable between 1 ns and 200 ps, with examples shown in Fig. 2. The near-cw light rejected by the pulse slicer would be used to lock the master lasers to the sodium wavelength by cw SFG, if required. The jitter between the trigger of the high voltage pulse generators and the output of the mode-locked laser (see below) was measured, using a fast sampling oscilloscope, to be < 10 ps rms. This low jitter proves that timing of the output micro-pulses is determined by the input pulse, as required for efficient SFG of two mode-locked lasers, and allows for very precise control of the pulse width in our design verification experiments.
SFG
cw 1064 nm NPRO
HV Pulser
Pulseslicer
Pulseslicer
cw NaReference
Error signal
Q-switched1064 nm slave
Q-switched1319 nm slave
SFG
output
Path matching
cw 1319 nm NPRO
#79105 - $15.00 USD Received 18 January 2007; revised 19 February 2007; accepted 22 February 2007
(C) 2007 OSA 5 March 2007 / Vol. 15, No. 5 / OPTICS EXPRESS 2371

137
Fig. 2. Optical pulses of variable duration produced by our double Pockels cell switch.
3.2 Slave laser
The slave laser (Fig. 3) was assembled for use in the design verification experiments only. It uses a conduction cooled Nd:YAG zigzag slab, 4.00 mm x 4.32 mm x 36.14 mm, which is side pumped in the zigzag plane by pulsed semiconductor lasers. The laser makes use of a 3.5 m long ring oscillator incorporating a Q-switch, a thin film polarizer (TFP) for injection and extraction and a half wave plate (HWP). Together, these elements allow the efficient production of stretched Q-switched pulses [16]. Telescopes were included to provide resonator stability while creating a large size TEM00 mode (ω = 1.2 mm) inside the zigzag slab [19]. This configuration permits efficient extraction of the stored energy, avoids damage to optics from the high peak power micro-pulses and reduces the optical gain per round trip, which lengthens the output macro-pulse width [20].
Fig. 3. Slave laser configuration, showing pulse injection into a traveling ring oscillator via a polarizing beam splitter (TFP), and the arrangement of polarizing elements (HWP) and Q-switch required to stretch the macro-pulse formed.
For injection mode-locking, a π-polarized seed pulse is injected into the resonator through the TFP. For the first pass, the seed pulse polarization is converted to σ by the HWP, and with no voltage applied to the Q-switch the seed pulse passes through without a change in polarization. It is thus completely reflected by the TFP and then converted to π polarization by the HWP. Voltage has meanwhile been applied to the Q-switch rotating the polarization back to σ thus trapping the pulse within the ring and enabling development of the giant pulse. Once the pulse has built up sufficiently, the voltage applied to the Q-switch is reduced slightly, allowing a controlled out-coupling fraction of the TFP. By varying this voltage the stretching of the output pulse can be controlled. Thus the Q-switch in our resonator produces no polarization rotation losses during build-up of the pulse and, instead of being opened completely to cavity dump the pulse as in conventional regenerative amplifiers [15], it is used to stretch the output pulse. Due to the broad bandwidth of the injected seed pulse, no servo was required to keep the slave locked to the master oscillator.
mirror mirror
slabQ-switch HWP
TFP
NPRO
Pulseslicer
mirror
telescope
200 ps 200 ps
#79105 - $15.00 USD Received 18 January 2007; revised 19 February 2007; accepted 22 February 2007
(C) 2007 OSA 5 March 2007 / Vol. 15, No. 5 / OPTICS EXPRESS 2372

138 APPENDIX A. PUBLICATIONS
3.3 Design verification results.
Initial experiments were done to investigate injection mode-locking with no pulse stretching. The slave laser produced a near diffraction limited (M2 = 1.06) 1064 nm beam. A typical output of the injection mode-locked slave resonator is shown in Fig. 4. The optimized output was 20 mJ per macro-pulse at 50 Hz PRF, limited by the pump lasers used. This is the energy per macropulse of a laser with average power of 16 W operating at 800 Hz PRF, and our initial result is thus already of significance to conventional laser guide star requirements. Each macro-pulse consists of more than 30 micro-pulses separated by 12 ns, the round trip time of the slave resonator. This could be adjusted in terms of the 16 ns Na fluorescence life time [1,7] to minimize bleaching and thus optimize the photon return from the guide star. The waveform shown was obtained on every pulse without the need for any feedback to the slave oscillator and it was observed that the shape of each micro-pulse from the slave laser closely resembled that of the input seed pulse.
Fig. 4. A single macro-micro pulse output, consisting of a train of injection mode-locked micro-pulses. The time scale is 50 ns per half cm, or 0.9µs across the whole picture.
The input pulse width was measured using a sampling oscilloscope and a fast detector with an overall detection bandwidth of 12 GHz, with typical seed pulse shapes obtained as shown in Fig. 2. The bandwidth of the output of the slave laser was measured by integrating the output of a scanning Fabry-Perot interferometer over many macro-pulses. An example of one of these bandwidth measurements is shown in Fig. 5(a). While the resolution of the Fabry-Perot is 40 MHz, longitudinal laser modes can not be resolved in this figure due to the drift of modes within the envelope of the lasers spectrum, caused by changes in the slave cavity length from thermal expansion. The irregular shape of the spectrum is believed due to the irregular shape of the injected seed pulse (Fig. 2). A plot of the FWHM of a Gaussian fit to each spectrum is shown as a function of the injected seed pulse width in Fig. 5(b). We thus succeeded in controlling the bandwidth of the output from 0.8 GHz to 2.3 GHz. The bandwidth of the final SFG is expected to be approximately twice that of the fundamental wavelengths [7] and the results obtained thus essentially satisfy the system requirements. It is not expected to be difficult to modify the temporal shape of the seed pulse or to increase its duration slightly if a lower bandwidth is desired.
The BBO Q-switch was driven by a specially designed pulser, capable of pulse stretching as discussed. Excellent throttled Q-switching and resulting macro-pulse stretching with no loss in pulse energy was achieved as shown in Fig. 6. The tendency towards a flat top envelope will facilitate subsequent SFG optimization.
#79105 - $15.00 USD Received 18 January 2007; revised 19 February 2007; accepted 22 February 2007
(C) 2007 OSA 5 March 2007 / Vol. 15, No. 5 / OPTICS EXPRESS 2373

139
Fig. 5. (a). Spectrum of the slave output corresponding to a seed pulse width of 760 ps. The FWHM bandwidth is 1.3 GHz. (b) Plot of measurements of slave laser bandwidth versus the width of the seed pulse. The curve is a fit to the data with a time-bandwidth product of 0.91 as shown.
Fig. 6. Example of a stretched macro-pulse, 10 mJ per pulse, 50 Hz. The un-stretched macro-pulse in this case is similar to Fig. 4, but with FWHM width of 300ns.
4. Discussion and conclusion
We have proposed a new concept for sodium guide star lasers that appears to satisfy most critical requirements for planned telescope designs. Our design verification experiments have demonstrated the viability of our approach, including demonstrating a preferred pulse burst waveform, detailed bandwidth control, wavelength control and low timing jitter. Additional work is in progress to demonstrate the concept at 1319 nm and to optimize the concept at the power and wavelengths for the Na guide star. This optimization will include a simplified pulse slicer, optimized laser sources, the possible use of additional laser power amplifiers and optimized SFG. Detailed designs and proof of concept experiments for our approach remain to be done, but some critical design issues have already been demonstrated by others such as the operation of simple extra cavity SFG using mode-locked pump lasers [11] and the realization of 50W class SFG Na guide star lasers [21].
Acknowledgments
This paper is based upon work supported by the National Science Foundation under Cooperative Agreement No. AST0084699. We thank B. Ellerbroeck and J. C. Shelton for useful discussions and R. F. Wuerker, B. Middlemiss and N. Wild for technical contributions.
0.2 0.4 0.6 0.8 1
0.5
1
1.5
2
2.5
3
Ba
ndw
idth
(GH
z)
Injected seed pulse width (ns)
Fit: ∆τ∆ν = 0.91
a) b)540 MHz
#79105 - $15.00 USD Received 18 January 2007; revised 19 February 2007; accepted 22 February 2007
(C) 2007 OSA 5 March 2007 / Vol. 15, No. 5 / OPTICS EXPRESS 2374

Rutten, T.P., Wild, N. and Veitch, P.J. (2007) Fast rise time, long pulse width, kilohertz repetition rate Q-switch driver. Review of Scientific Instruments, v.78 (7), pp. 073108-1-073108-2, 2007
NOTE: This publication is included on pages 140 – 141 in the
print copy of the thesis held in the University of Adelaide Library.
It is also available online to authorised users at:
http://dx.doi.org/10.1063/1.2757474

Rutten, T.P., Veitch, P.J. and Munch, J. (2008) Efficient pulse stretching of Q-switched lasers IEEE Journal of Quantum Electronics, v.44 (10), pp. 911-915, October 2008
NOTE: This publication is included on pages 142 - 146 in the print
copy of the thesis held in the University of Adelaide Library.
It is also available online to authorised users at:
http://dx.doi.org/10.1109/JQE.2008.925140

Munch, J., Rutten, T.P., Simakov, N., Hamilton, M., d’Orgeville, C. and Veitch, P.J. (2008) A new guide star laser using optimized injection mode-locking. Proceedings of SPIE, v.7015, pp. 70150K-1 – 70150K-9, June 2008
NOTE: This publication is included on pages 147 - 155 in the print
copy of the thesis held in the University of Adelaide Library.
It is also available online to authorised users at:
http://dx.doi.org/10.1117/12.791011

Appendix B
Zero jitter picosecond delay
generator
As was discussed in Section 3.4, a seed pulse source was constructed to generate the low
energy seed pulses required for injection mode-locking. Seed pulses were generated by
gating the output of a cw NPRO master laser using the dual Pockels cell (PC) switch
shown in Figure 3.7. To create the seed pulse, a fast rise time flat-topped high voltage
electrical pulse is delivered to the first PC in the pulse slicer to create the leading edge of
the seed pulse, then after a short delay, voltage is given to the second PC to create the
trailing edge of the seed pulse. The length of the delay between firing PCs sets the width
of the seed pulse. The delay needs to be in the range of 300 ps - 3 ns and adjustable
to produce a suitably short seed pulse to provide the spectral bandwidths required for
the guide star laser (1-3 GHz). Hence there was a need to design and construct a delay
generator to delay the arrival time of the trigger pulse to the high voltage Pockels cell
driver on the second PC in the pulse slicer, to control the seed pulse width. This delay
generator was designed and built by the author and is shown in Figure B.1. It consists of
a series of mechanical switches and lengths of coaxial cable to implement the delay. The
trigger pulse enters the delay box through the top BNC connector shown in Figure B.1
and exits through the bottom. When all switches are turned “off” the minimum delay
is set and the trigger pulse travels through the shorted right hand side of the switches.
When a switch is turned on, the trigger pulse is redirected through a short length of
coaxial cable on the left hand side of the switch which delays the pulse arrival time. The
speed of an electrical signal in coaxial cable is 0.695 c (for RG174), so a cable length
of 1 cm represents a delay of 43 ps. By switching various combinations of switches, the
delay box shown in Figure B.1, can produce delays of up to 3 ns in 100 ps increments.
An important feature of this device is that the delay is generated passively and does not
157

158 APPENDIX B. ZERO JITTER PICOSECOND DELAY GENERATOR
Figure B.1: A photograph of the delay generator used to control the width of the seed
pulses required for injection mode-locking. Lengths of coaxial cable are switched into or
out of the dignal path to control the length of the time delay.
introduce any timing jitter to the trigger pulse. Electronic devices, that generate a delay
using a timing circuit, invariably introduce significant timing jitter that will introduce
micro-pulse width jitter in the guide star system resulting in sub-optimum bandwidth
matching to the Doppler broadened Sodium absorption line.

Appendix C
High voltage high bandwidth
attenuator
To measure the voltage pulses generated by the avalanche transistor circuits (HV pulsers)
that were used to drive the fast Pockels cells in the seed pulse source (Section 3.4) a high
voltage, high bandwidth attenuator was designed and constructed.
The HV pulsers generate 4 kV pulses with 1 or 3 ns duration and a have rise time of
approximately 100 ps. To view these pulses on a sampling oscilloscope, the voltage needs
to be reduced to around 1 V (a reduction of 72 dB) to avoid damaging the instrument.
The attenuator must also have a high bandwidth of at least 2 GHz to prevent distortion
of the pulse shape. Commercial high voltage attenuators are generally low bandwidth
devices (tens of MHz) due to the difficulty in maintaining the characteristic impedance of
a transmission line over high voltage resistors in a voltage divider (attenuating) network.
A simple high voltage high bandwidth attenuator was constructed in house out of a
series of lengths of coaxial cable and T-junctions as shown in Figure C.1. This device
uses the cable reflections at the T-junctions to attenuate the pulse, rather than a resistive
voltage divider, thereby providing improved bandwidth. At each T-junction, the cable
impedance changes from 50 ohms to 25 ohms (two 50 ohm lines in parallel) and hence
there is a 30 % reflection loss at each junction. The attenuator consisted of a total of 5
junctions resulting in a total of 18 dB attenuation.
To test the attenuator, a 10 V pulse from a commercial pulse generator was observed
before and after attenuation. A comparison is shown in Figure C.2, showing that the
attenuation is approximately 18 dB.
This method of attenuation results in only a short time interval with which to view
the pulse before the signal is distorted by the arrival of back-reflections from alternate
T-junctions. After a time equal to twice the delay time of the shortest length of coaxial
159

160 APPENDIX C. HIGH VOLTAGE HIGH BANDWIDTH ATTENUATOR
50W
T-junction
AttenuatedHV pulse
RG-8coax
HV Pulser
50W50W
Figure C.1: The high voltage attenuator makes use of the 30 % reflection loss occurring
at each T-junction to provide attenuation while maintaining signal bandwidth.
-5 0 5 10 15 20 25
0.0
0.3
0.6
0.9
1.2
1.5
Atten. Unatten.
Time (ns)
Vol
tage
(at
tenu
ated
)
0
2
4
6
8
10
Voltage (U
nattenuated)
Figure C.2: An overlay plot showing a voltage pulse before and after passing through
the attenuator. The pulse amplitude is reduced from 10 V to 1.2 V (approx 18 dB). At
time= 12 ns, back-reflections from the T-junctions in the attenuator are detected in the
attenuated signal. Any signal recorded past this time is not representative of the true
pulse shape.

161
cable (12 ns in our case), the signal back-reflected from neighbouring T-junctions will
arrive at the output of the attenuator. By making the lengths of coaxial cable between
T-junctions longer, the viewing period will be increased.
Following the high voltage high bandwidth attenuator of Figure C.1 a series of 3
commercial, low voltage 20 dB 20 GHz attenuators were used to further reduce the voltage
to below 1 V. The bandwidth of the attenuator is limited by the inherent frequency
response of the coaxial cable. The Rg-8 cable used has an attenuation of 0.135dB/m
for 400 MHz frequencies, .262 dB/m at 1 GHz, .525 dB/m at 3 GHz and .886 dB/m at
5 GHz frequencies. The total length of cable used between the HV pulser and oscilloscope
was 7.7 m resulting in a bandwidth limit of approximately 2 GHz for the attenuator
constructed for this work. Using higher bandwidth cable will improve the frequency
response of the attenuator. The output of the HV pulsers after passing through the high
voltage attenuator can be seen in Figure 3.8.

162 APPENDIX C. HIGH VOLTAGE HIGH BANDWIDTH ATTENUATOR

Appendix D
Pulse stretching model parameters
In Section 4.3 a theoretical model is described that predicts the Q-switched pulse shapes
from an injection mode-locked laser. Inputs to the model include the cross-sectional area,
A, of the laser mode inside the slab and the round trip loss, l, of the resonator. This
section presents an estimation of the real values of mode size and loss expected for the
ring resonator of Figure 4.1. The values used in the model were A = 5.5 mm2 and l = 5 %.
The size of the laser mode just outside the slab is ω =1.2 mm (see Figure D.1). Inside
the slab, the size of the mode is larger, 1.2 mm (horizontal) and 2.42 mm (vertical) due
to magnification from the Brewster-angled window, as shown in Figure D.1. This gives a
mode area of 9.1 mm2 inside the slab if the beam size is defined by the 1/e2 radius (ω).
If the beam size is defined by the FWHM, the beam area is 3.6 mm2.
The theoretical model of Section 4.3 assumes that the beam profile has a rectangular
“top-hat” intensity distribution. The laser used for these experiments is near diffraction
limited and hence has a Gaussian intensity profile. Hence the beam size used in the model
should be an approximation to the real beam size. A value of A = 5.5 mm2 was used
= 1.2 mmw slab
= 2.42 mmw
Figure D.1: This sketch shows the size of the laser outside and inside the laser slab. In
the vertical direction the mode size expands by a fact of approximately 2 due to the angle
of the slab window. In the horizontal direction (into the page) the mode size is 1.2 mm
both outside and inside the slab.
163

164 APPENDIX D. PULSE STRETCHING MODEL PARAMETERS
in the model which is between the 1/e2 and FWHM values. This gives good agreement
between predicted and measured data, as shown in Figure 4.3.
The round trip resonator loss, l, is made up of the sum of the losses from scatter
and absorption at each resonator optic (Q-switch, slab, TFP, mirrors and lens) and also
diffraction losses caused by the surface error of each of these optics. The loss from surface
errors will manifest when the laser is running in a TEM00 resonator and surface errors will
transfer energy to higher order modes that will suffer losses from clipping on intra-cavity
apertures (the slab window).
The scatter and absorption losses were measured by recording the transmission or
reflection of a cw NPRO probe beam incident upon an optic in question. Using this
technique, the loss of the Q-switch was measured to be 0.6 % ± 0.06, the slab was 1.6 %
± 0.2, the TFP was 0.6 % ± 0.06, the mirrors were 0.5 % ± 0.05 and the lens was 0.6 %
± 0.06, giving a total loss for scatter and absorption of 4.4 % ± 0.6. The measurement
uncertainty is from the accuracy of the laser power meter used.
Round trip losses caused by surface errors and resonator misalignment were not mea-
sured.

Appendix E
Laser slab and waveguide schematic
diagrams
This section contains the schematic diagrams and specifications that were sent to the
manufacturer for the procurement of the Nd:YAG slab and waveguides. The Nd:YAG
material was obtained from Scientific Materials Corp. [120] and the cut and polishing of
the slab and waveguides was done by BAE Systems [121]. All specifications and tolerances
were calculated and then subsequently drawn up by the author.
165

166 APPENDIX E. SLAB AND WAVEGUIDE SCHEMATIC DIAGRAMS
W
T
<211>
Nd
:YA
G B
ou
le (
To
p V
iew
)
**N
OT
E:
MA
TE
RIA
LF
RO
MB
OU
LE
LA
RG
E F
AC
ET
**
AX
IS O
F S
LA
B <
11
0>
(WIT
HIN
5 D
EG
RE
ES
)
<111
> D
IRE
CT
ION
OU
TO
F P
AG
E
W:
MIN
IMU
M 2
4m
mT:
MIN
IMU
M 4
.5m
m(s
ee
dim
en
sio
ns b
e-
low
)
Th
e U
niv
ers
ity o
fA
de
laid
e,
De
pa
rtm
en
t o
f P
hysic
s
Re
qu
ire
me
nts
of
Nd
:YA
G b
lan
k,
Pa
ge
1 o
f 1
.
MA
TE
RIA
L·Y
ttriu
mA
lum
iniu
m G
arn
et
do
pe
d w
ith
Ne
od
ym
ium
to o
ne
ato
mic
pe
rce
nt
(1.0
% N
d:Y
AG
).·S
Pg
rad
e -
hig
h p
urity
su
ita
ble
fo
r la
se
r sla
bs.
·Ma
teria
l m
ust
be
cu
t fr
om
th
e b
ou
le w
ith
cry
sta
llog
rap
hic
dire
ctio
nsh
ow
n in
dia
gra
m o
pp
osite
.
SP
EC
IFIC
AT
ION
S·U
n-f
inis
he
d b
lan
k.
·Min
imu
m d
ime
nsio
ns s
ho
wn
in
dia
gra
m b
elo
w.
Min
imu
m D
ime
nsio
ns:
64
mm
24
mm
24
mm
4.5
mm

167
4.0
0 m
m ±
0.0
5m
m
0.5
7 m
m ±
0.0
5m
m
0.3
1 m
m ±
0.0
5m
m
28
°47
' ± 2
'
4.3
1 m
m ±
0.0
5m
m
3
Deta
il
0.3
1 ±
0.0
5m
m
1
Sh
arp
ed
ge
, m
inim
al
ch
ips
no
ch
am
fer
C
54
.80
mm
± 0
.1m
m
62
.08
mm
± 0
.1m
m
63
.21
mm
4.6
0 m
m ±
0.1
mm
2
<2 w
ave
D //C
0 ± 1
oo
<2 w
ave
2
<0.2
wave
//A
0 20"
o
B3
A
<0.2
wave
<0.1
wave
3
Sh
arp
ed
ge
, m
inim
al
ch
ips
no
ch
am
fer
3
The U
niv
ers
ity o
fA
dela
ide, D
epart
ment of P
hysic
sLaser
Sla
b, page 2
of 2
62.0
8±0.1
mm
<0.1
wave
E
//0 1'
oE
1F
ine G
rind
2P
olis
hed, 40-2
0 s
cra
tch/d
ig
Surf
ace form
err
or
key to s
ym
bols
3P
olis
hed, 10-5
scra
tch/d
ig

168 APPENDIX E. SLAB AND WAVEGUIDE SCHEMATIC DIAGRAMS
4.0
± 0
.2m
m
40.0
± 0
.2m
m
6°4
4' ±
20'
44.0
± 0
.2m
m
12.0
± 0
.2m
m
90°±
20'
3.5
± 0
.1m
m
1
BA //B
1
C
D //C A
0
20
'o
0
20
'o
The U
niv
ers
ity o
fA
dela
ide, D
epart
ment of P
hysic
s
Waveguid
e to d
eliv
er
pum
p lig
ht fr
om
laser
dio
de a
rray
to N
d:Y
AG
sla
b. P
age 1
of 1.
MA
TE
RIA
L:
·BK
7
QU
AN
TIT
Y:
·Fiv
e
MA
NU
FA
CT
UR
E R
EQ
UIR
EM
EN
TS
:·A
ll polis
hed s
urf
aces to h
ave 2
-wave fla
tness
·Edges b
ord
ering s
ide C
cham
fere
d, 45 d
egre
es
·All
oth
er
edges s
harp
with m
inim
al chip
pin
g, especia
llyedges b
ord
ering s
ide D
·Sid
e C
and D
bro
ad a
ngle
AR
coat fo
r 808nm
- c
oating
dete
rmin
ed p
revio
usly
1F
ine
Grin
d
2P
olis
he
d,
40
-20
scra
tch
/dig
2
2
2 2
0
20
'o
2 2

Bibliography
[1] P. A. Knutsson and M. Owner-Petersen, “Emulation of dual-conjugate adaptive
optics on an 8-m class telescope,” Opt. Express, vol. 11, no. 18, pp. 2231–2237,
2003.
[2] D. L. Fried, “Limiting Resolution Looking Down Through the Atmosphere,” J. Opt.
Soc. Am., vol. 56, pp. 1380–1384, 1966.
[3] H. M. Dyck and R. R. Howell, “Seeing measurements at Mauna Kea from infrared
speckle interferometry,” Publ. Astron. Soc. Pac., vol. 95, pp. 786–791, 1983.
[4] H. W. Babcock, “The possibility of compensating astronomical seeing,” Publ. As-
tron. Soc. Pac., vol. 65, p. 229, 1953.
[5] D. P. Greenwood, “Bandwidth specification for adaptive optics systems,” J. Opt.
Soc. Am., vol. 67, pp. 390–393, 1977.
[6] L. A. Thompson and C. S. Gardner, “Experiments on laser guide stars at Mauna
Kea Observatory for adaptive imaging in astronomy,” Nature, vol. 328, pp. 229–231,
1987.
[7] R. Q. Fugate, D. L. Fried, G. A. Ameer, B. R. Boeke, S. L. Browne, P. H. Roberts,
R. E. Ruane, G. A. Tyler, and L. M. Wopat, “Measurement of atmospheric wave-
front distortion using scattered light from a laser guide-star,” Nature, vol. 353,
pp. 144–146, 1991.
[8] C. A. Primmerman, D. V. Murphy, D. A. Page, B. G. Zollars, and H. T. Barclay,
“Compensation of atmospheric optical distortion using a synthetic beacon,” Nature,
vol. 353, pp. 141–143, 1991.
[9] R. V. Shack and B. C. Platt, “Production and use of a lenticular Hartmann screen,”
J. Opt. Soc. Am., vol. 61, p. 656, 1971.
169

170 BIBLIOGRAPHY
[10] R. K. Tyson, Introduction to adaptive optics. Bellingham, Washington 98227-0010:
SPIE press, 1st ed., 2000.
[11] J. M. Beckers, “Adaptive optics for astronomy - Principles, performance, and ap-
plications,” Annu. Rev. Astron. Astrophys., vol. 31, pp. 13–62, 1993.
[12] R. Foy and A. Labeyrie, “Feasibility of adaptive telescope with laser probe,” Astron.
Astrophys, vol. 152, no. 2, pp. L29–L31, 1985.
[13] R. A. Humphreys, C. A. Primmerman, L. C. Bradley, and J. Herrmann,
“Atmospheric-turbulence measurements using a synthetic beacon in the mesospheric
sodium layer,” Opt. Lett., vol. 16, pp. 1367–1369, 1991.
[14] W. Happer, G. J. MacDonald, C. E. Max, and F. J. Dyson, “Atmospheric-turbulence
compensation by resonant optical backscattering from the sodium layer in the upper
atmosphere,” J. Opt. Soc. Am. A, vol. 11, p. 263, 1994.
[15] H. W. Friedman, G. V. Erbert, T. C. Kuklo, T. Salmon, D. A. Smauley, G. R.
Thompson, J. G. Malik, J. N. Wong, V. K. Kanz, and K. P. Neeb, “Sodium beacon
laser system for the Lick Observatory,” in Proc. SPIE, vol. 2534, p. 150, 1995.
[16] C. E. Max, S. S. Olivier, H. W. Friedman, J. An, K. Avicola, B. V. Beeman,
H. D. Bissinger, J. M. Brase, G. V. Erbert, D. T. Gavel, K. Kanz, M. C. Liu,
B. Macintosh, K. P. Neeb, J. Patience, and K. E. Waltjen, “Image Improvement
from a Sodium-Layer Laser Guide Star Adaptive Optics System,” Science, vol. 277,
no. 5332, pp. 1649–1652, 1997.
[17] T. H. Jeys, A. A. Brailove, and A.Mooradian, “Sum frequency generation of sodium
resonance radiation,” Appl. Opt., vol. 28, no. 13, pp. 2588–2591, 1989.
[18] C. A. Denman, P. D. Hillman, G. T. Moore, J. M. Telle, J. E. Preston, J. D. Drum-
mond, and R. Q. Fugate, “Realization of a 50-watt facility-class sodium guidestar
pump laser,” in Proc. SPIE, vol. 5707, pp. 46–49, 2005.
[19] A. Tracy, A. Hankla, C. Lopez, D. Sadighi, N. Rogers, K. Groff, I. McKinnie,
and C. d’Orgeville, “High-power solid-state sodium beacon laser guidestar for the
Gemini North Observatory,” in Proc. SPIE, vol. 5490, pp. 998–1009, 2004.
[20] E. J. Kibblewhite and F. Shi, “Design and field test of an 8 watt sum-frequency
laser for adaptive optics,” in Proc. SPIE, vol. 3353, pp. 300–309, 1998.

BIBLIOGRAPHY 171
[21] M. Duering, V. Kolev, and B. Luther-Davies, “Generation of tuneable 589nm radia-
tion as a Na guide star source using an optical parametric amplifier,” Opt. Express,
vol. 17, no. 2, pp. 437–446, 2009.
[22] D. Georgiev, V. P. Gapontsev, A. G. Dronov, M. Y. Vyatkin, A. B. Rulkov, S. V.
Popov, and J. R. Taylor, “Watts-level frequency doubling of a narrow line linearly
polarized Raman fiber laser to 589nm,” Opt. Express, vol. 13, pp. 6772–6776, 2005.
[23] D. M. Pennington, R. Beach, J. Dawson, A. Drobshoff, Z. Liao, S. Payne, D. Bonac-
cini, W. Hackenberg, and L. Taylor, “Compact fiber laser approach to generating
589 nm laser guide stars,” in Proceedings of Conference on Lasers and Electro-Optics
Europe, p. 730, 2003.
[24] N. Hubin, B. L. Ellerbroek, R. Arsenault, R. M. Clare, R. Dekany, L. Gilles,
M. Kasper, G. Herriot, M. L. Louarn, E. Marchetti, S. Oberti, J. Stoesz, J. P.
Veran, and C. Verinaud, “Adaptive optics for Extremely Large Telescopes,” in in
Proceedings IAU Symposium No. 232, pp. 60–85, 2006.
[25] F. Rigaut, “Ground-Conjugate Wide Field Adaptive Optics for the ELTs,” in Be-
yond Conventional Adaptive Optics, 2001. Venice.
[26] Requirements from Gemini RFP no. N231397, Dec. 2003.
[27] J. M. Beckers, “Overcoming perspective elongation effects in laser-guide-star-aided
adaptive optics,” Appl. Opt., vol. 31, no. 31, pp. 6592–6594, 1992.
[28] J. Cabannes, J. Dufay, and J. Gauzit, “Sodium in the Upper Atmosphere,” Astro-
phys. J., vol. 88, pp. 164–172, 1938.
[29] P. W. Milonni, R. Q. Fugate, and J. M. Telle, “Analysis of measured photon returns
from sodium beacons,” J. Opt. Soc. Am. A, vol. 15, no. 1, pp. 217–233, 1998.
[30] T. H. Jeys, R. M. Heinrichs, K. F. Wall, J. Korn, T. C. Hotaling, and E. Kibble-
white, “Observation of optical pumping of mesospheric sodium,” Opt. Lett., vol. 17,
pp. 1143–1145, 1992.
[31] Response to Gemini RFP no. N231397, Jan 2004.
[32] T. P. Rutten, P. J. Veitch, C. d’Orgeville, and J. Munch, “Injection mode-locked
guide star laser concept and design verification experiments,” Opt. Express, vol. 15,
no. 5, pp. 2369–2374, 2007.

172 BIBLIOGRAPHY
[33] J. Munch, T. P. Rutten, N. Simakov, M. Hamilton, C. d’Orgeville, and P. J. Veitch,
“A new guide star laser using optimized injection mode-locking,” in Proc. SPIE,
vol. 7015, p. 70150K, 2008.
[34] C. E. Max, K. Avicola, J. M. Brase, H. W. Friedman, H. D. Bissinger, J. Duff,
D. T. Gavel, J. A. Horton, R. Kiefer, J. R. Morris, S. S. Olivier, R. W. Presta,
D. A. Rapp, J. T. Salmon, and K. E. Waltjen, “Design, layout, and early results of
a feasibility experiment for sodium-layer laser-guide-star adaptive optics,” J. Opt.
Soc. Am. A., vol. 11, no. 2, pp. 813–824, 1994.
[35] D. B. Calia, W. Hackenberg, C. Araujo, I. Guidolin, and J. L. Alvarez, “Laser guide
star related activities at ESO,” in Proc. SPIE, vol. 5490, pp. 974–980, 2004.
[36] Y. Feng, S. Huang, A. Shirakawa, and K. Ueda, “589 nm light source based on
Raman fiber laser,” Jap. J. Appl. Phys.-2, vol. 43, pp. L722–L724, 2004.
[37] M. Frede, B. Schulz, R. Wilhelm, P. Kwee, F. Seifert, B. Willke, and D. Kracht,
“Fundamental mode, single-frequency laser amplifier for gravitational wave detec-
tors,” Opt. Express, vol. 15, pp. 459–465, 2007.
[38] H. J. E. A. Haase and R. Menzel, “100-watt average output power 1.2 diffraction
limited beam frompulsed neodymium single-rod amplifier with sbs phase conjuga-
tion,” IEEE J. Quantum Electron., vol. 31, pp. 1265–1269, 1995.
[39] H. Moosmuller and J. D. Vance, “Sum-frequency generation of continuous-wave
sodium D2 resonance radiation,” Opt. Lett., vol. 22, pp. 1135–1137, 1997.
[40] A. J. Alcock, P. B. Corkum, and D. J. James, “A simple mode-locking technique
for large-aperture TEA CO2 lasers,” Appl. Phys. Lett., vol. 30, no. 3, pp. 148–150,
1977.
[41] J. C. Bienfang, C. A. Denman, B. W. Grime, P. D. Hillman, G. T. Moore, and J. M.
Telle, “20 W of continuous-wave sodium D2 resonance radiation from sum-frequency
generation with injection-locked lasers,” Opt. Lett., vol. 28, no. 22, pp. 2219–2221,
2003.
[42] J. H. Eberly and P. W. Milonni, Lasers. Springer, Berlin: John Wiley and Sons
Inc, 1st ed., 1988.
[43] J. E. Murray and W. H. Lowdermilk, “ND:YAG regenerative amplifier,” J. Appl.
Phys., vol. 51, no. 7, pp. 3548–3554, 1980.

BIBLIOGRAPHY 173
[44] Australian Patent no. PCT/AU2006/001852, Dec. 2006.
[45] Specification from OFR VHP series isolators at 1064 nm, website: www.ofr.com.
[46] R. Lovberg, E. Wooding, and M. Yeoman, “Pulse stretching and shape control
by compound feedback in a Q-switched ruby laser,” IEEE J. Quantum Electron.,
vol. QE-11, no. 1, pp. 17–21, 1975.
[47] G. Harigel, C. Baltay, M. Bregman, M. Hibbs, A. Schaffer, H. Bjelkhagen,
J. Hawkins, W. Williams, P. Nailor, R. Michaels, and H. Akbari, “Pulse stretching
in a Q-switched ruby laser for bubble chamber holography,” Appl. Opt., vol. 25,
no. 22, pp. 4102–4110, 1986.
[48] P. Heinz, W. Kriegleder, and A. Laubereau, “Feedback control of an actively-
passively mode-locked Nd:Glass laser,” Appl. Phys. A, vol. 43, pp. 209–212, 1987.
[49] J. J. Degnan, “Theory of the optimally coupled Q-switched laser,” IEEE J. Quan-
tum Electron., vol. 25, no. 2, pp. 214–220, 1989.
[50] T. P. Rutten, P. Veitch, and J. Munch, “Efficient pulse stretching of Q-switched
lasers,” IEEE J. Quantum Electron., vol. 44, no. 10, pp. 911–915, 2008.
[51] R. W. Boyd, Nonlinear Optics. Academic Press, 2nd ed., 2003.
[52] J. A. Armstrong, N. Bloembergen, J. Ducuing, and P. S. Pershan, “Interactions be-
tween Light Waves in a Nonlinear Dielectric,” Phys. Rev., vol. 127, no. 6, pp. 1918–
1939, 1962.
[53] C. L. Tang and L. K. Cheng, Fundamentals of Optical Parametric Processes and
Oscillators. Newark, NJ, United States: Harwood academic publishers, 1st ed.,
1996.
[54] D. A. Roberts, “Simplified characterization of uniaxial and biaxial nonlinearopti-
cal crystals: a plea for standardization of nomenclature andconventions,” IEEE J.
Quantum Electron., vol. 28, no. 10, pp. 2057–2074, 1992.
[55] A. Smith, ”SNLO software package”, retrieved May, 2008, http://www.as-
photonics.com/?q=SNLO.
[56] A. Liu, M. A. Norsen, and R. D. Mead, “60-W green output by frequency doubling
of a polarized Yb-doped fiber laser,” Opt. Lett., vol. 30, pp. 67–69, 2005.

174 BIBLIOGRAPHY
[57] D. Eimerl, L. Davis, S. Velsko, E. K. Graham, and A. Zalkin, “Optical, mechanical,
and thermal properties of barium borate,” J. Appl. Phys., vol. 62, pp. 1968–1983,
1987.
[58] A. V. Smith, W. J. Alford, T. D. Raymond, and M. S. Bowers, “Comparison of a
numerical model with measured performance of a seeded, nanosecond KTP optical
parametric oscillator,” J. Opt. Soc. Am. B, vol. 12, pp. 2253–2267, 1995.
[59] A. V. Smith, “How to select nonlinear crystals and model their performance using
SNLO Software,” in Proc. SPIE, vol. 3928, pp. 62–69, 2000.
[60] CVI catalogue, 2005.
[61] W. Koechner, Solid-State Laser Engineering. New York: Springer-Verlag, 5th ed.,
1999.
[62] E. Armandillo, C. Norrie, A. Cosentino, P. Laporta, P. Wazen, and P. Maine,
“Diode-pumped high-efficiency high-brightness Q-switched ND:YAG slab laser,”
Opt. Lett., vol. 22, no. 15, pp. 1168–1170, 1997.
[63] J. Richards, “Birefringence compensation in polarization coupled lasers,” Appl.
Opt., vol. 26, no. 13, pp. 2514–2517, 1987.
[64] P. R. Stysley, D. Poulios, D. B. Coyle, and R. B. Kay, “Highly efficient dual head
100 mJ TEM00 Nd:YAG Oscillator,” Opt. Laser Technol., vol. 40, pp. 435–440,
2008.
[65] T. Y. Fan, “Heat generation in Nd:YAG and Yb:YAG,” IEEE J. Quantum Electron.,
vol. 29, no. 6, pp. 1457–1459, 1993.
[66] G. D. Goodno, S. Palese, J. Harkenrider, and H. Injeyan, “Yb:YAG power oscillator
with high brightness and linear polarization,” Opt. Lett., vol. 26, no. 21, pp. 1672–
1674, 2001.
[67] L. McDonagh, R. Wallenstein, R. Knappe, and A. Nebel, “High-efficiency 60 W
TEM00 Nd:YVO4 oscillator pumped at 888 nm,” Opt. Lett., vol. 31, pp. 3297–3299,
2006.
[68] S. Saraf, K. Urbanek, R. L. Byer, and P. J. King, “Quantum noise measurements
in a continuous-wave laser-diode-pumped Nd:YAG saturated amplifier,” Opt. Lett.,
vol. 30, no. 10, pp. 1195–1197, 2005.

BIBLIOGRAPHY 175
[69] R. J. S. Pierre, D. W. Mordaunt, H. Injeyan, J. G. Berg, R. C. Hilyard, M. E. Weber,
M. G. Wickham, G. M. Harpole, and R. Senn, “Diode array pumped kilowatt laser,”
IEEE J. Sel. Top. Quantum Electron., vol. 3, no. 1, pp. 53–58, 1997.
[70] S. Amano and T. Mochizuki, “High average and high peak brightness slab laser,”
IEEE J. Quantum Electron., vol. 37, no. 2, pp. 296–303, 2001.
[71] M. Ostermeyer, P. Kappe, R. Menzel, and V. Wulfmeyer, “Diode-pumped Nd:YAG
master oscillator power amplifier with high pulse energy, excellent beam quality, and
frequency-stabilized master oscillator as a basis for a next-generation lidar system,”
Appl. Opt., vol. 44, no. 4, pp. 582–590, 2005.
[72] C. S. Gardner, “Sodium resonance fluorescence lidar applications in atmospheric
science and astronomy,” Proc. IEEE, vol. 77, no. 3, pp. 408–418, 1989.
[73] Laser head provided by TRW Space and Technology Group, 1 Space Park, Redondo
Beach, California, 90278.
[74] T. S. Rutherford, W. M. Tulloch, S. Sinha, and R. L. Byer, “Yb:YAG and Nd:YAG
edge-pumped slab lasers,” Opt. Lett., vol. 26, no. 13, pp. 986–988, 2001.
[75] T. J. Kane, J. M. Eggleston, and R. L. Byer, “The slab geometry laser−part II:
Thermal effects in a finite slab,” IEEE J. Quantum Electron., vol. QE-21, no. 8,
pp. 1195–1209, 1985.
[76] M. Frede, R. Wilheim, M. Brendel, C. Fallnich, F. Seifert, B. Willke, and K. Danz-
mann, “High power fundamental mode Nd:YAG laser with efficient birefringence
compensation,” Opt. Express, vol. 12, pp. 3581–3589, 2004.
[77] J. Eggleston, T.Kane, K. Kuhn, J. Unternahrer, and R. Byer, “The slab geometry
laser−part I: Theory,” IEEE J. Quantum Electron., vol. 20, no. 3, pp. 289–301,
1984.
[78] D. C. Hanna, C. G. Sawyers, and M. A. Yuratich, “Telescopic resonators for large-
volume TEM00-mode operation,” Opt. Quantum Electron., vol. 13, pp. 493–507,
1981.
[79] D. C. Hanna, C. G. Sawyers, and M. A. Yuratich, “Large-volume TEM00 mode
operation of Nd:YAG lasers,” Opt. Commun., vol. 37, no. 5, pp. 359–362, 1981.
[80] A. I. Bishop and P. F. Barker, “Subnanosecond Pockels cell switching using
avalanche transistors,” Rev. Sci. Instrum, vol. 77, p. 044701, 2006.

176 BIBLIOGRAPHY
[81] Fastpulse Technology Inc. model 1112, www.fastpulse.com.
[82] Avalanche transistor pulsers custom made by Pulstek, www.pulsetek.com.
[83] ACME Engineering Co. Pty. Ltd. Coaxial cable catalogue.
[84] A. K. Dharmadhikari, J. A. Dharmadhikari, K. P. Adhi, N. Y. Mehendale, and
R. C. Aiyer, “Low cost fast switch using a stack of bipolar transistors as a pockel
cell driver,” Rev. Sci. Instrum., vol. 67, no. 12, pp. 4399–4400, 1996.
[85] S. A. Riley, S. May, and M. P. Augustine, “High-voltage pulse switching hardware for
electro-optic studies of conducting aqueous solutions,” Rev. Sci. Instrum., vol. 73,
no. 8, pp. 3080–3084, 2002.
[86] R. E. Continetti, D. R. Cyr, and D. M. Neumark, “Fast 8 kv metal-oxide semicon-
ductor field-effect transistor switch,” Rev. Sci. Instrum., vol. 63, no. 2, pp. 1840–
1841, 1992.
[87] T. P. Rutten, N. Wild, and P. J. Veitch, “Fast rise time, long pulse width, kilohertz
repetition rate q-switch driver,” Rev. Sci. Instrum., vol. 78, p. 073108, 2007.
[88] H. Kogelnik and T. Li, “Laser beams and resonators,” App. Opt., vol. 5, no. 10,
pp. 1550–1567, 1966.
[89] K. Avicola, J. M. Brase, J. R. Morris, H. D. Bissinger, J. M. Duff, H. W. Friedman,
D. T. Gavel, C. E. Max, S. S. Olivier, R. W. Presta, D. A. Rapp, J. T. Salmon, and
K. E. Waltjen, “Sodium-layer laser-guide-star experimental results,” J. Opt. Soc.
Am. A., vol. 11, no. 2, pp. 825–831, 1994.
[90] W. R. Callen, R. H. Pantell, and J. Warszawski, “Pulse stretching of Q-switched
lasers,” Opto-Elelectron., vol. 1, pp. 123–127, 1969.
[91] S. Seidel and G. Phillipps, “Pulse lengthening by intracavity stimulated Brillouin
scattering in a Q-switched, phase-conjugated Nd:YAG laser oscillator,” Appl. Opt.,
vol. 32, no. 36, pp. 7408–7416, 1993.
[92] D. Kracht and R. Brinkmann, “Green Q-switched microsecond laser pulses by over-
coupled intracavity second harmonic generation,” Opt. Commun., vol. 231, pp. 319–
324, 2004.
[93] W. E. Schmid, “Pulse Stretching in a Q-switched Nd:YAG Laser,” IEEE J. Quan-
tum Electron., vol. QE-16, no. 7, pp. 790–794, 1980.

BIBLIOGRAPHY 177
[94] W. H. Lowdermilk and J. E. Murray, “The multipass amplifier: Theory and numer-
ical analysis,” J. Appl. Phys., vol. 51, pp. 2436–2444, 1980.
[95] A. Giesen, H. Hugel, A. Voss, K. Wittig, U. Branch, and H. Opower, “Scalable
concept for diode-pumped high-power solid-state lasers,” Appl. Phys. B, vol. 58,
p. 363, 1994.
[96] J. J. Zayhowski and A. Mooradian, “Single-frequency microchip Nd lasers,” Opt.
Lett., vol. 14, no. 1, pp. 24–26, 1989.
[97] G. D. Goodno, Z. Guo, R. J. D. Miller, I. J. Miller, J. W. Montgomery, S. R.
Adhav, and R. S. Adhav, “Investigation of β − BaB2O4 as a Q-switch for high
power applications,” Appl. Phys. Lett., vol. 66, no. 13, pp. 1575–1577, 1995.
[98] K. Du, N. Wu, J. Xu, J. Giesekus, P. Loosen, and R. Poprawe, “Partially end-
pumped Nd:YAG slab laser with a hybrid resonator,” Opt. Lett., vol. 23, pp. 370–
372, 1998.
[99] S. C. Tidwell, J. F. Seamans, and M. S. Bowers, “Highly efficient 60-W TEM00 cw
diode-end-pumped Nd:YAG laser,” Opt. Lett., vol. 18, pp. 116–118, 1993.
[100] N. Uehara, K. Nakahara, and K. Ueda, “Continuous-wave TEM00-mode 26.5-W-
output virtual-point-source diode-array-pumped Nd:YAG laser,” Opt. Lett., vol. 20,
no. 16, pp. 1707–1709, 1995.
[101] R. A. Fields, T. S. Rose, M. E. Innocenzi, H. T. Jura, and C. L. Fincher, Diode laser
end-pumped neodymium lasers: The road to higher powers. OSA, 301-308, 1st ed.,
1989.
[102] D. Mudge, P. J. Veitch, J. Munch, D. Ottaway, and M. W. Hamilton, “High-Power
Diode-Laser-Pumped CW Solid-State Lasers Using Stable-Unstable Resonators,”
IEEE J. Sel. Top. Quantum Electron., vol. 3, no. 1, pp. 19–25, 1997.
[103] Private correspondence with Cutting Edge Optronics, 20 Point West Boulevard St.
Charles, MO 63301. Website: http://www.st.northropgrumman.com/ceolaser.
[104] M. Ostermeyer, D. Mudge, P. J. Veitch, and J. Munch, “Thermally induced bire-
fringence in Nd:YAG slab lasers,” Appl. Opt., vol. 45, no. 21, pp. 5368–5376, 2006.
[105] H. Statz and G. A. de Mars, Quantum electronics. New York: Columbia Univ.
Press, 1960.

178 BIBLIOGRAPHY
[106] A. E. Siegman, Lasers. University Science Books, 1986.
[107] N. P. Barnes, M. E. Storm, P. L. Cross, and M. W. S. Jr, “Efficiency of Nd laser
materials with laser diode pumping,” IEEE J. Quantum Electron., vol. 26, no. 3,
pp. 558–569, 1990.
[108] T. S. Rutherford, W. M. Tulloch, E. K. Gustafson, and R. L. Byer, “Edge-pumped
quasi-three-level slab lasers: design and power scaling,” IEEE J. Quantum Electron.,
vol. 36, no. 2, pp. 205–219, 2000.
[109] D. B. Coyle, R. B. Kay, P. R. Stysley, and D. Poulios, “Efficient, reliable, long-
lifetime, diode-pumped nd:yag laser for space-based vegetation topographical al-
timetry,” Appl. Opt., vol. 43, no. 27, pp. 5236–5242, 2004.
[110] Polyscience recirculating chiller, model 6550T 21A130E.
[111] ”Optishield plus” corrosion inhibitor by Opti Temp.
[112] R. J. S. Jr., A. J. Alfrey, and R. L. Byer, “40-W cw, TEM00-mode, diode-laser-
pumped, Nd:YAG miniature-slab laser,” Opt. Lett., vol. 20, no. 5, pp. 459–461,
1995.
[113] Y. Durand, A. Culoma, R. Meynart, J. L. Pinsard, and G. Volluet, “Performance
of high-power laser diode arrays for spaceborne lasers,” Appl. Opt., vol. 45, no. 22,
pp. 5752–5757, 2006.
[114] J. Murray, “Pulsed gain and thermal lensing of Nd:LiYF4,” IEEE J. Quantum
Electron., vol. QE-19, no. 4, pp. 488–491, 1983.
[115] D. Mudge, M. Ostermeyer, P. J. Veitch, J. Munc, B. Middlemiss, D. J. Ottaway,
and M. W. Hamilton, “Power scalable TEM00 CW Nd:YAG laser with thermal lens
compensation,” IEEE J. Sel. Top. Quantum Electron., vol. 6, no. 4, pp. 643–649,
2000.
[116] J. D. Mansell, J. Hennawi, E. K. Gustafson, M. M. Fejer, R. L. Byer, D. Clubley,
S. Yoshida, and D. H. Reitze, “Evaluating the Effect of Transmissive Optic Thermal
Lensing on Laser Beam Quality With a Shack-Hartmann Wave-Front Sensor,” Appl.
Opt., vol. 40, pp. 366–374, 2001.
[117] P. Webels and C. Fallnich, “Highly sensitive beam quality measurements on large-
mode-area fiber amplifiers,” Opt. Express, vol. 11, pp. 3346–3351, 2003.

BIBLIOGRAPHY 179
[118] E. Siegman, ”How to (Maybe) Measure Laser Beam Quality,” Tutorial presentation
at the Optical Society of America Annual Meeting, Long Beach, California, October
1997.
[119] N. Hodgson and H. Weber, Laser Resonators and Beam Propagation: Fundamentals,
Advanced Concepts and Applications . Springer, Berlin: Springer series in optical
sciences, 2nd ed., 2005.
[120] Scientific Materials Corp. 31948 East Frontage Road Bozeman, MT 59715.
[121] BAE Systems Australia, Taranaki Road Edinburgh Parks Edinburgh SA 5111 Aus-
tralia.