thom dammrich - national marine manufacturers … dammrich industry... · the 1970s and 1980s were...
TRANSCRIPT

President,
National Marine Manufacturers Association
Thom Dammrich

Recreational Boating
Industry Trends

-
100,000
200,000
300,000
400,000
500,000
600,000
Ind
us
try V
olu
me
Calendar Year
1965 -1991
Average 400,000 1992 - 2006
Average 309,000
U.S. Industry Retail Powerboats (1965 – 2010)
’06-’10
-55%
Significant Decline in Demand Bottomed in 2010
Last 5 Years
2006 291,900
2007 267,300
2008 203,000
2009 153,550
2010 139,000

Total Recreational Boats In Use
15.00
15.50
16.00
16.50
17.00
17.50
18.00
89 90 91 92 93 94 95 96 97 98 99 00 01 02 03 04 05 06 07 08 09 10
E
Year
Mill
ion
s

The 1970s and 1980s were very good to boating. And PWCs helped
sustain this level of boat ownership through the1990s.
5,000
6,000
7,000
8,000
9,000
10,000
11,000
12,000
13,000
14,000
15,000
100,000
150,000
200,000
250,000
300,000
350,000
To
tal B
oat
Reg
istr
ati
on
s (
000)
US
Po
pu
lati
on
(000)
YEAR
US Boat Registrations vs. PopulationIncluding PWCs
Population Boat Registrations
The Boating Boom
The PWC Boom
Source: Info-Link Technologies Inc.

But traditional boat ownership (non-PWC) has not kept up with the
population. It has been relatively flat for the past 20 years.
US Boat Registrations vs. PopulationExcluding PWCs
100,000
150,000
200,000
250,000
300,000
350,000
1972
1974
1976
1978
1980
1982
1984
1986
1988
1990
1992
1994
1996
1998
2000
2002
2004
2006
2008
2010
YEAR
US
Po
pu
lati
on
(000)
5,000
6,000
7,000
8,000
9,000
10,000
11,000
12,000
13,000
14,000
15,000
To
tal
Bo
at
Reg
istr
ati
on
s (
000)
Population Boat Registrations
Source: Info-Link Technologies Inc.
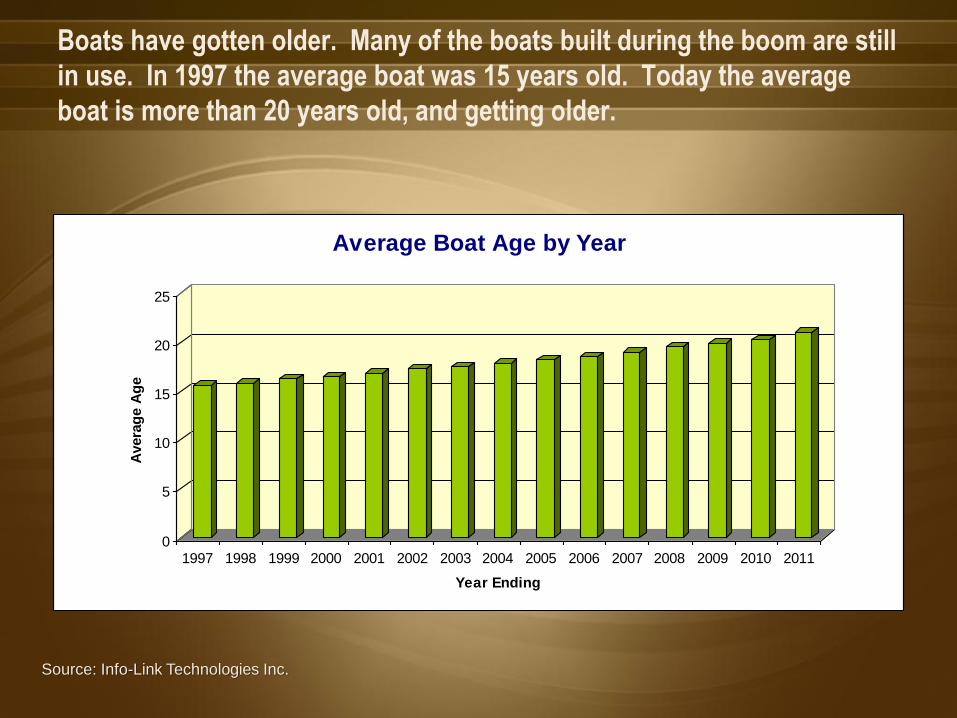
Boats have gotten older. Many of the boats built during the boom are still
in use. In 1997 the average boat was 15 years old. Today the average
boat is more than 20 years old, and getting older.
0
5
10
15
20
25
Avera
ge A
ge
1997 1998 1999 2000 2001 2002 2003 2004 2005 2006 2007 2008 2009 2010 2011
Year Ending
Average Boat Age by Year
Source: Info-Link Technologies Inc.

Meanwhile, boat owners have gotten older. Today there are fewer owners
in their 30s and more in their 50s and 60s.
Age Distribution of Powerboat Owners1998 vs 2011
0%
2%
4%
6%
8%
10%
12%
14%
16%
<25 25-29 30-34 35-39 40-44 45-49 50-54 55-59 60-64 65-69 70-74 75+
Age Range
2011 1998
Source: Info-Link Technologies Inc.

This is especially evident among sailors. They tend to be loyal to the
sport but grinding winches in your 70s gets old too.
Age Distribution of Sailboat Owners1998 vs 2011
0%
2%
4%
6%
8%
10%
12%
14%
16%
18%
20%
<25 25-29 30-34 35-39 40-44 45-49 50-54 55-59 60-64 65-69 70-74 75+
Age Range
2011 1998
Many of these people are still sailing
But sailing is
physical so…
Source: Info-Link Technologies Inc.

U.S. Boating Participation History (1990 – 2010)
0
10
20
30
40
50
60
70
80
19901991
19921993
19941995
19961997
19981999
20002001
20022003
20042005
20062007
20082009
2010
Milli
ons
of P
artic
ipan
ts
No. of Adults Boating
33.4%
28.3% 30.5%
29.2%
26.6% 26.0%
28.8% 28.9%
30.4%
29.2%
32.3%
33.4% 35.8%
36.0%
33.6%
35.6%
36.2%
36.2%
36.1%
36.3%
36.5%
Source: NMMA
% of adults boating No. of adults boating (in millions)
2010 reflects highest level of participation since 2000

Total Recreational Boats In Use
15.00
15.50
16.00
16.50
17.00
17.50
18.00
89 90 91 92 93 94 95 96 97 98 99 00 01 02 03 04 05 06 07 08 09 10
E
Year
Mill
ion
s

U.S. Boating Participation History (1990 – 2010)
0
10
20
30
40
50
60
70
80
19901991
19921993
19941995
19961997
19981999
20002001
20022003
20042005
20062007
20082009
2010
Milli
ons
of P
artic
ipan
ts
No. of Adults Boating
33.4%
28.3% 30.5%
29.2%
26.6% 26.0%
28.8% 28.9%
30.4%
29.2%
32.3%
33.4% 35.8%
36.0%
33.6%
35.6%
36.2%
36.2%
36.1%
36.3%
36.5%
Source: NMMA
% of adults boating No. of adults boating (in millions)
2010 reflects highest level of participation since 2000

Boating Participation – Exposure to
Boating as a Child Drives Adult Participation
36.9%
41.2%
1.2%
21.6%
Boated as child and parents owned a boatBoated as child and parents did not own a boatDid not boat as a child and parents owned a boat
9.3%
29.4%
1.2%
60.1%
Boated as a child and
parents owned a boat
Boated as a child and
parents did not own a
boatDid not boat as a child
and parents owned a
boatDid not boat as a child
and parents did not
own a boat
Childhood Boating Experience
Current Participant Non - Participant

Boat Owner Demographics by Ethnicity
2010 Any Powerboat
90.0%
3.4%
1.1% 0.8%3.0% 2.1% 1.1%
White Black Asian or Pacific IslanderNative American/Alaskan Native Mixed Racial Background Other RaceDeclined to Answer

Percent of United States Population
by Age Group and Ethnicity, 2000
Hobby Center for the Study of Texas at Rice University

Percent of United States Population
by Age Group and Ethnicity, 2050
Hobby Center for the Study of Texas at Rice University


Numeric Change in the Projected U.S. Population by Race
and Hispanic Origin: 2000 to 2050 (in millions)
Hobby Center for the Study of Texas at Rice University
7.6
17.523.0
11.6
97.2
156.9
Non-Hispanic
White alone
Non-Hispanic
Black alone
Non-Hispanic
Asian alone
Non-Hispanic all
other races
Hispanic (any
race)
Total
Source: U.S. Census Bureau, 2008 National Projections

Creating a Robust Future for Recreational Boating
Developing a shared industry
ten year growth action agenda
based on a shared vision of
success in 2021

Visions for 2021
1. Unified Industry Cross Sector Collaboration
Brings Results—Boating Now Preferred
Recreation Choice
2. Boating participation soars! New Generation and
Greater Diversity attracted to boating
3. Expanded Access to the Water and the Lifestyle
Has Been Achieved
4. Smarter and Fewer Regulations, and Better
Boating Education Results in Safe, Affordable and
Enjoyable Boating

Joint Actions to be Considered
• Encourage boaters to invite friends on the water
• Each stakeholder group commits to deliver collaborative efforts to their stakeholders
• Encourage universal support of Discover Boating’s Welcome to the Water Campaign
• Focus recreational boating recruitment more on kids and minorities
• Improve efforts on providing better boater education
• Form and strengthen industry partnerships
• Encourage greater diversity within the industry
• Expand American Boating Congress to all stakeholders

So…What’s Happening Today
Boating remains big business
$30+ billion

Estimated New Boat and Engine Sales by Key
Global Markets
$7.6
$2.1
$0.3
$7.0
$1.0 $1.0 $1.0
$2.0
$0.5
$-
$1.0
$2.0
$3.0
$4.0
$5.0
$6.0
$7.0
$8.0
Estimated New Boat/Engine Sales
in U.S. $ (Billions)

U.S. Recreational Boat Trade
$-
$200
$400
$600
$800
$1,000
$1,200
$1,400
$-
$500
$1,000
$1,500
$2,000
$2,500
$3,000
2005 2006 2007 2008 2009 2010 2011
Tra
de
Ba
lan
ce
Mill
ion
s
Ex
po
rts
/Im
po
rts
Mill
ion
s
Exports Imports Trade BalanceSource: USITC

Info-Link’s Bellwether: Retail Sales are Growing
for the First Time in 5 Years
Source: Info-Link Technologies Inc.

So…What’s Happening
• Boating remains big business - $30 billion
• North America remains 44% of Global Market
and a Net Exporting Industry
• Retail Sales are Growing for First Time in 5
Years
• Wholesale Shipments of New Boats Up 23% in
Units and 33% in Dollars in 2011

ITR Economics’ Forecast of Shipments: Continuing Growth through 2015
-80
-40
0
40
80
120
-80
-40
0
40
80
120
'00 '01 '02 '03 '04 '05 '06 '07 '08 '09 '10 '11 '12 '13 '14 '15
Rates-of-Change
3/12
12/12
Source: ITR Economics

Comparison of Consumer Confidence to Wholesale
Boat Shipments as of February 14, 2012
Jan-12, 57.8
Nov-11, 139,489
0
50,000
100,000
150,000
200,000
250,000
300,000
350,000
400,000
450,000
500,000
0
20
40
60
80
100
120
140
160
Dec-6
7
Dec-7
1
Dec-7
5
Sep
-78
Sep
-80
Sep
-82
Sep
-84
Sep
-86
Sep
-88
Sep
-90
Sep
-92
Sep
-94
Sep
-96
Sep
-98
Sep
-00
Sep
-02
Sep
-04
Sep
-06
Sep
-08
Sep
-10
Ro
llin
g 1
2-m
on
th B
oat
Sh
ipm
ents
Co
nsu
mer
Co
nfi
den
ce r
olli
ng
12
-mo
nth
Rolling 12-month CCI Rolling 12-month Wholesale Shipments
CP1
BP1
CV1
BT1
CP2
BP2
CV2
BT2
CP3
BP3
CV3
BT3
CP4
BP4
BT4 CV4
CP5
CV5
BP
BT
CP6
BP6
BT6 BP7
CV
6

Consumer Spending Back On Track
2011-Q4, 2%
-6%
-4%
-2%
0%
2%
4%
6%
8%
2000-Q1 2001-Q1 2002-Q1 2003-Q1 2004-Q1 2005-Q1 2006-Q1 2007-Q1 2008-Q1 2009-Q1 2010-Q1 2011-Q1
PER
CEN
T C
HA
NG
E FR
OM
PR
ECED
ING
PER
IOD
Real Personal Consumption Expenditures on Goods and Services
source: Bureau of Economic Analysis
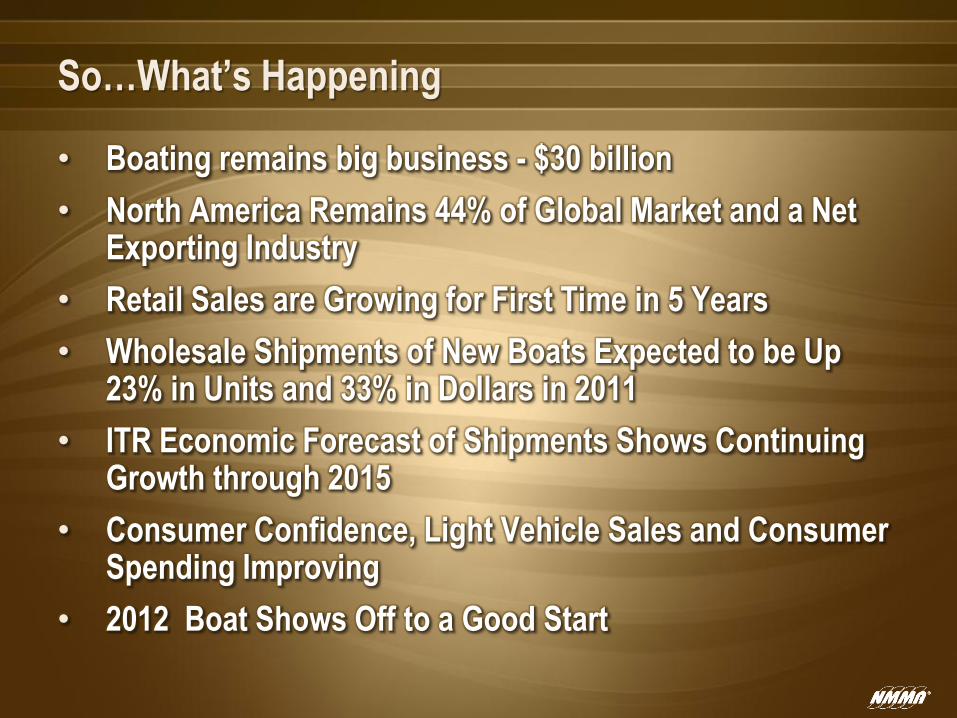
So…What’s Happening
• Boating remains big business - $30 billion
• North America Remains 44% of Global Market and a Net Exporting Industry
• Retail Sales are Growing for First Time in 5 Years
• Wholesale Shipments of New Boats Expected to be Up 23% in Units and 33% in Dollars in 2011
• ITR Economic Forecast of Shipments Shows Continuing Growth through 2015
• Consumer Confidence, Light Vehicle Sales and Consumer Spending Improving
• 2012 Boat Shows Off to a Good Start

2012 Objectives.
• Grow awareness of Discover Boating/Welcome
to the Water among our target community.
• Increase positive perceptions of the boating
lifestyle.
• Increase participation in the boating lifestyle.
• Increase desire to own a boat.
• Deliver qualified leads to manufacturers and
dealers.


Point of Sale
New – Coming Soon
Beginners Guide
To Boating Brochure
Window Clings

Thank you for your continued support.
Have a great show!