this work has been submitted to chesterrep – the...
TRANSCRIPT

Is physical inactivity related to body mass index and waistcircumference in a sample of Maltese adult population?
Item Type Thesis or dissertation
Authors Micallef, Maria C.
Publisher University of Chester
Download date 01/09/2018 07:53:25
Link to Item http://hdl.handle.net/10034/313968

This work has been submitted to ChesterRep – the University of Chester’s
online research repository
http://chesterrep.openrepository.com
Author(s): Maria Carmela Micallef
Title: Is physical inactivity related to body mass index and waist circumference in a sample of Maltese adult population? Date: September 2013 Originally published as: University of Chester MSc dissertation Example citation: Micallef, M. C. (2013). Is physical inactivity related to body mass index and waist circumference in a sample of Maltese adult population? (Unpublished master’s thesis). University of Chester, United Kingdom. Version of item: Submitted version Available at: http://hdl.handle.net/10034/313968

Department of Clinical Sciences MSc Weight Management
Module Title: Research Project
Module Code: XN7211 September 2013
Assessment Number H06785 Word count: Review Paper 5299 Word count: Research article 4683
ii
Acknowledgements
I would like to express my sincere gratitude to Dr Stephen Fallows for his guidance and
help throughout the whole process of my research project. I am also grateful to Dr
Mike Morris for his support and encouragement in data analysis.
I would also like to thank all the lecturers and administrative staff within the
Department of Clinical Sciences for their constant support and attention.
Many thanks to the people who answered my questionnaire and to my friends for their
patience and understanding though out this year. A special thanks to Anton Buhagiar
for his help and guidance.
Finally sincere thanks go out to my husband Dino, my daughter Valentina, my parents
and mother in‐law for their love, understanding, support and encouragement.

iii
Originality Declaration
This work is original and has not been previously submitted in support of a Degree,
qualification or other course.
Signed……………………………………………………
Date………………………………………………………

iv
List of Contents
Module Title …………..………………………………………………………….……………..……. i
Acknowledgements……………………………………………………………………….....…….. ii
Originality declaration…………………………………………………………….………….….. iii
List of contents……………………………………………………………………………….……….. iv
List of abbreviations………………………….……………………………………………………… xi
Paper 1: Literature Review
Paper 1 Title ……………………………………………………………………………………………. 1
Abstract Review Paper.………..…………………………………………………………….…… 2
1.1 General Introduction………………………..……….……………………… 3
1.2 Background literature review……………….………………………….. 4
1.2.1 Physical activity and physical inactivity……………….……………. 4
1.2.1.1 Definition of physical activity………………………….………………… 4
1.2.1.2 Definition of physical inactivity…………………..……………………. 5
1.2.2 Health issues related to physical activity and physical inactivity………………………………………………………………………….. 5
1.2.3 Prevalence of physical inactivity……………………….……………... 6
1.2.4 Physical activity levels in Malta………………….…………………..… 7
1.2.5 Assessing physical activity .………………………..……………..…….. 9
1.2.5.1 Direct methods to assess PA…….……………………………..………. 10
1.2.5.1.1 Calorimetry and double labelled water…………………………..… 10

v
1.2.5.1.2 Direct observation …………………………………………….……..……… 11
1.2.5.1.3 Motion sensor and monitors…………..………………………………… 11
1.2.5.2 Indirect methods to assess PA…………………..…………….……….. 12
1.2.6 International Physical Activity Questionnaire (IPAQ) ….……. 12
1.2.6.1 Strengths and weaknesses of IPAQ ………………………….…….… 14
1.2.7 Physical activity recommendations and guidelines... ……….. 15
1.2.8 Maltese recommendations for physical activity ...………….… 19
1.3 Obesity …………………………………………………………………..…….... 20
1.3.1 Obesity and health implications related to obesity ………….. 20
1.3.2 Definition of obesity and factors causing obesity....…………. 21
1.3.3 Assessment of overweight and obesity using body mass index and waist circumference ………………………………………. 22
1.3.3.1 Body mass index …………………………………………………………..…. 22
1.3.3.2 Waist circumference .………………………………………………………. 25
1.3.4 Waist circumference in Maltese study..………….………………… 24
1.3.5 Obesity prevalence in Malta .……….………………………..………... 26
1.3.6 Conclusion ………………………………………………………………………. 29
List of Tables Table 1: Prevalence of comorbidities related to obesity and
inactivity in Malta compared to European and Worldwide median……………………………………….…………….……. 4
Table 2: Development of PA recommendations for adults………..…… 17

vi
Table 3: Cut‐off points of BMI for the classification of weight……..… 23
Table 4: Sex specific cut‐points for WC….…………………………..………..… 26 Table 5: Overweight and obesity in adults between 2002 and 2008 ……………………………………………………………………………... 27
Table 6: Comparison of results from MONICA 1984 and EHES Pilot Study 2010………………………………………………………………. 28
List of Figures
Figure 1: Physical activity levels in Malta between 2002 and 2008…. 8 Figure 2: Participation in exercise and sports by the Maltese
compared to EU average…................................................... 9 Figure 3: Physical activity pyramid for the Maltese adults issued
by the Maltese Health Department…………………….………..…. 20 Figure 4a: Males prevalence of obesity and overweight in Europe ….. 27 Figure4b: Females prevalence of obesity and overweight in Europe.. 28
References Review Paper ……………………………………………….……..….....………. 30

vii
Paper 2: Research Article
Title …........................................................................................................... 42
Choice of Journal …………………………………………………………………….…..……….… 43
Abstract Research Project …......................................................................... 44
2.0 Aims and significance of the research……………………….…….. 45
2.01 The primary aims of the research .……………………..…….……… 45
2.02 Ethical approval …................................................................. 46
2.03 Hypothesis of the research……………………………..………..…….. 46
2.1 Method……………………………………………………………………………. 46
2.1.1 Participants…………………………………………………………….….….... 46
2.1.2 Sample size determination and response rate …..……………. 46
2.1.3 Research methods….….……………….……………………………………. 47
2.1.4 Translation of IPAQ……………..…………………………………………… 47
2.1.5 IPAQ long form .………………………………………………………..….… 48
2.1.6 Anthropometric measures...………………………………………..….. 48
2.1.7 Statistical analysis …............................................................. 50
2.2 Results.…………………….………………………………………..……………. 51
2.2.1 Descriptive characteristics of research subjects …………..…. 51
2.2.2 Physical activity levels analysis ……………………………………….. 54
2.2.2.1 IPAQ results by BMI and WC …………………………………………… 54
2.2.2.2 BMI and WC…………………………………………………………………….. 57

viii
2.2.3 Physical activity in the separate domains...…….………………… 57
2.2.4 PA domain and sub‐scores by gender, education and age… 59
2.3 Discussion……………………………………………………………………….. 60
2.3.1 Limitations and strengths ………………………………………..……… 63
2.3.2 Recommendations for future action and research………...… 65
2.3.3 Conclusion…………………………………………………………….….……… 66
List of Tables
Table 1: Anthropometric characteristics of research subjects by gender…………………………………………………………………….………. 53
Table 2: IPAQ results by BMI (N=416) …………………………………………… 55 Table 3: IPAQ results by WC (N=416) ………………………………………...… 56 Table 4: Medians and quartiles for all respondents of four PA
domains, PA sub‐scores and daily sitting time. (N=416)…... 58
List of Figures
Figure 1: Percentages of normal, overweight and obese subjects according to age group………………..…………………………………. 52
References Research Project ………………………………………………………………….. 67
Appendices …………………………………………………………………………………..……….. 72
Appendix A……………………………………………………………………………………..……… 72
A1: Ethical Approval from the University of Chester……….……… 73

ix
A2: Measuring instruments used……………..…………………..………… 75
A3: Changes made to questionnaire………………………………………. 75
A4: Schematic outline of the study process………………….………… 76
A5a: Recruitment Letter in English……………………………….………….. 77
A5b: Recruitment Letter in Maltese……………………………….………… 78
A6a: Participation information sheet in English………………..……… 79
A6b: Participant information sheet in Maltese………………………… 81
A7a: Consent Form in English…………………………………………………… 83
A7b: Consent form in Maltese…………………………………………………. 84
A8a: Questionnaire English Version……………………………………….…. 85
A8b: Questionnaire Maltese Version………………………………………… 92
A9: IPAQ long form Scoring protocol and guidelines for computing continuous and categorical scores…………….…… 100
Appendix B Additional Results.
Table B1 Age, Educational Level and Marital Status by Gender……… 102 Table B2 Crosstabulation of BMI group by education and age …….…. 104 Table B3 Waist circumference by education and age……………………… 105
Table B4 Crosstabulation of WC risk group by BMI group………………. 106 Table B5 Table showing frequencies and percentages of different
levels of PA.…………………………………….…………………….……….. 106
Table B6 Kolmogorov‐Smirnov test of normality for total PA scores and sub‐scores, and of some transformed variables………... 107
Table B7 Frequencies and percentages of number of walking days
in the leisure domain..…………………………………………..…….…… 107

x
Table B8 Kruskal‐Wallis Test for the median of the four PA domains, PA sub‐scores and daily sitting time by gender…………...…… 108
Table B9 Kruskal‐Wallis Test for the median of the four PA domains,
PA sub‐scores and daily sitting time by education ……..……. 109
Table B10 Kruskal‐Wallis Test for the median of the four PA domains, PA sub‐scores and daily sitting time by age …………………….. 110
List of Figures
Figure B1 Percentages of the different levels of PA…………………………. 106 Figure B2 Number of subjects reporting 00 METs –min/wk in the
four domains of the IPAQ…………………………………………………. 112
Figure B3 Percentages of WC by gender ……………………………………….…. 112

xi
Abbreviations
ACSM American College of Sports Medicine AHA American Heart Association BMI body mass index CDC Centers of Disease Control and Prevention CMO Chief Medical Officer CVD cardiovascular disease cm centimetres DHIR Department of Health Information and Research EASO European Association for the Study of Obesity EC European Commission EE Energy expenditure EHES European Health Examination Survey EHIS European Health Interview Survey EU European Union IARC International Agency for Research on Cancer IASO International Association for the Study of Obesity IPAQ International Physical Activity Questionnaire m meters max maximum kg kilogrammes MET resting metabolic equivalents min minimum Min minutes N number of subjects in total n number of subjects in sub‐group NICE National Institute of Health and Clinical Excellence NIH National Institute of Health NHLBI National Heart Lung and Blood Institute NCDs non‐communicable diseases OECD Organisation for Economic Co‐operation and Development PA physical activity SD standard deviation SPSS Statistical Package for Social Sciences UKDH British Department of Health UHDHHS United States Department of Health and Human Services VO2 max maximal oxygen uptake WC waist circumference WHO World Health Organisation wk week % percent
1
General Title:
Is Physical Inactivity Related to Body Mass Index and Waist Circumference in a Sample of
Maltese Adult Population?
Title Paper 1:
Physical Activity Levels and Obesity Prevalence
Amongst the Maltese.

2
Abstract Review Paper
Purpose: Plenty of research shows that physical inactivity and obesity increase the risk
of many co‐morbidities and mortality. The alarming increase in the prevalence of
obesity and low physical activity (PA) levels in the Maltese population, which have
been documented in a limited number of studies, give cause for concern. The use of
body mass index (BMI), waist circumference (WC) and International Physical Activity
Questionnaire (IPAQ) are discussed as measures to assess PA and weight status in
population based studies.
Method: Different electronic databases were systematically searched for international
and Maltese literature and studies related to physical inactivity, physical activity, body
mass index, waist circumference and International Physical Activity Questionnaire.
Results: Existing literature show that in many European countries including Malta
physical activity levels are low and obesity and overweight is high. This challenging
situation is now well recognised by international and national health bodies and lead
to the current recommendations of physical activity.
Conclusion: The high prevalence of overweight and obesity and the low levels of
physical activity are major risk factors for non‐communicable diseases globally
including Malta. Most Maltese studies on obesity prevalence and PA levels are based
on self reported data, which might not always reflect the true picture. Thus more
research is required to help policy makers to design effective programmes to promote
more PA and to try and reduce the obesity prevalence amongst the Maltese.
Key words: Physical activity, physical inactivity, obesity prevalence, International
Physical Activity Questionnaire, body mass index, waist circumference.

3
1.1 General Introduction
Physical inactivity and excess weight are two major public health problems
(World Health Organisation [WHO], 2000, 2006). In 2008, the worldwide prevalence of
overweight and obesity was estimated to be more than 1.4 billion adults (over 20
years), of these over 200 million men and almost 300 million women were obese
(WHO, 2008). Furthermore, WHO (2013) estimated that in 2008, globally, 31% of
adults aged 15 and over were insufficiently active (28% men and 34% women). This
unhealthy behaviour was estimated to cause 600,000 deaths annually and lead to a
loss of 5.3 million years of healthy life due to premature death and disability (WHO,
2002). If physical inactivity were to be reduced by 10‐25%, more than 1.3 million lives
could be saved annually (Lee et al., 2012).
In Malta, the situation is similarly grim. It is troubling to note that Maltese men
rank top in European obesity chart and Maltese women place third (Eurostat, 2011).
Furthermore, Malta is labelled as one of the most sedentary populations on earth
(Stagno‐Navarro, 2012), with 71.9% of the population failing to meet recommended
levels of PA (Hallal et al., 2012). It was estimated that Malta could gain an increase of
1.2% years in life expectancy if physical inactivity were eliminated (Lee et al., 2012).
Lee et al. (2012) revealed that Malta has the highest estimate for coronary heart
disease (CHD), type 2 diabetes, breast cancer, colon cancer and all‐cause mortality,
compared to other European countries, almost double to the European and Worldwide
median in all variables (Table 1).

4
Table 1: Prevalence of comorbidities related to obesity and inactivity in Malta compared to European and Worldwide median
Coronary Heart Disease
Type 2 Diabetes
Breast Cancer
Colon Cancer
All‐cause mortality
Malta Median 11.9% 14.7% 19.1% 21.3% 19.2%
European Median 5.5% 6.8% 9.3% 9.8% 8.8%
Worldwide Median 5.8% 7.2% 10% 10.4% 9.4%
Source: Adapted from Lee et al. (2012)
1.2 Background Literature Review.
1.2.1 Physical activity and physical inactivity
1.2.1.1 Definition of physical activity
PA is a complex, fundamental human behaviour. It is part of everyone’s daily
life and includes a wide range of activities including exercise, conditioning, sports,
dance, leisure‐time activities, occupation, gardening, transportation, household and
family related activities (WHO, 2013). Caspersen, Powell, and Christenson (1985)
define PA as “any bodily movement produced by skeletal muscles that results in
energy expenditure” (p.126), which can be categorised in different ways, that which is
of light, moderate or heavy intensity, that which is wilful or compulsory, or that which
is weekday or weekend activities. PA also has volume, duration, frequency, intensity
and model type (Cale & Harris, 2005).

5
1.2.1.2 Definition of physical inactivity
Physical inactivity is defined as a “state in which bodily movement is minimal
and energy expenditure approximates the resting metabolic rate” (p.6, International
Agency for Research on Cancer [IARC], 2002). It refers to low levels or the lack of PA
and sedentary behaviours where little energy beyond resting metabolic rate is used
(Sjostrom, Hagstromer, & Ruiz, 2008).
1.2.2 Health issues related to PA and physical inactivity.
PA has been described as the “best buy in public health” (WHO, 2001), as
becoming more active is likely to bring significant health benefits. By participating in
150 minutes of PA or the equivalent each week, it is estimated that this reduces the
risks of:‐ ischaemic heart disease by 30%, diabetes by 27%, certain types of cancer by
21 to 25% (WHO, 2013), and premature death 20‐30 % (Chief Medical Officer [CMO],
2004). It also lowers the risk of stroke, hypertension and depression (CMO, 2004; Hu
et al., 2004; Stephenson & Bauman, 2000; Warburton, Nicol, & Bredin, 2006). In
addition, PA is a key determinant to energy expenditure and, hence, very important to
energy balance and weight control (Jeffrey, 2000; Wing, 1999; WHO, 2002, 2004).
Physical inactivity is identified as the fourth leading risk factor for global
mortality causing an estimate of 3.2 million deaths annually, i.e., 5.5% of deaths
globally (WHO, 2009). Research suggests that leading a physically inactive lifestyle has
major implications for general health of people worldwide and for the prevalence of

6
non‐communicable diseases (NCDs) such as CHD, stroke, diabetes, cancer and mental
health disorder (Bauman, & Craig, 2005; CMO 2004; Lee et al., 2012; Morris, Clayton,
Everitt, Semmence, & Burgess, 1990; Pate et al., 1995; Warburton et al., 2006). Thus
physical inactivity is as high a risk factor to health, as are smoking and obesity (Lee et
al., 2012)
1.2.3 Prevalence of physical inactivity
WHO (2013) estimated that approximately 35% of all people in the WHO
European regions are insufficiently physically active. Men tend to be more active than
women and it has been revealed that nearly every second woman is insufficiently
physically active, especially in high income countries (WHO, 2013). The European
Health Interview Survey (EHIS) in 2002, using the International Physical Activity
Questionnaire (short form), showed that only 31% of the adult population in the
European Union (EU) reached the recommended levels of PA (Sjostorm, Oja,
Hagströmer, Smith, & Bauman, 2006). In 2010 the European Commission (EC), using
different questions than those used in EHIS (2002), showed that 25% of the
respondents across the then 25 EU member states were completely or almost inactive.
This shows that despite the efforts to increase PA across all ages, in many countries the
message is just not getting across and the level of physical inactivity is still very high.

7
1.2.4 PA levels in Malta
Data on PA in Malta is lacking but the few available sources (The First National
Health Interview Survey [NHIS], 2002; EC, 2004, 2006, 2010; EHIS [Malta] 2008)
indicate that, overall, it appears that PA is not very popular with the Maltese public. In
2005, 78% of the Maltese adult population declared that they never spend time on
vigorous activity (EC, 2006). This was the highest percentage among a number of EU
countries taking part in the study and a considerably higher percentage than the EU
average of 45% (EC, 2006). Furthermore, the Maltese subjects in this study declared
that they only devote 29.8 minutes a week to vigorous PA and less than one hour of
moderate PA a week, compared to the EU average of 91.6 minutes and 2.5 hours a
week respectively (EC, 2006).
The NHIS (2002) revealed that PA levels of the Maltese public were very poor
(7.1% reporting moderate‐intensity PA) and way below desirable levels (Ministry of
Education, Youth and Employment, 2007; Department of Health Information and
Research [DHIR], 2008). This low prevalence of regular PA could be a contributing
factor to the high levels of overweight and obesity, heart disease, diabetes, cancer and
other related health risks (Department of Environmental Health – Malta, 2009, Lee et
al., 2012 ). The EHIS (2008) showed a small improvement when comparing PA levels to
the NHIS 2002 (both using IPAQ short form). The proportion of Maltese respondents
reporting moderate‐intensity PA has more than doubled (16%), however the
proportion of respondents reporting high levels of PA (26.9%) has remained stable
since 2002 (26.3%, DHIR, 2008).

8
Figure 1: Physical activity levels in Malta between 2002 and 2008 Source: Adapted from Department of Health, Information and Research (2008)
A more recent study, published by the EC (2010) on sports and PA, points out
that 38% of the Maltese never exercise or play sports. This is one percent less than the
European average. One can note an improvement from the previous study in 2004,
where 43% of the Maltese subjects stated that they never played sports or exercised
(EC, 2004). Furthermore, in 2010, 24% of the Maltese subjects in the study declared
that they never engaged in PA and 13% were seldom physically active while the
European average was 14% and 20% respectively (EC, 2010, Figure 2).
0.0% 10.0% 20.0% 30.0% 40.0% 50.0% 60.0% 70.0%
High levels of PA
Moderate levels of PA
Low levels of PA
2008
2002

9
Figure 2: Participation in exercise and sports by the Maltese compared to EU average Source: Adapted from European Commission 2010. PA Special Euro barometer
1.2.5 Assessing Physical Activity
Several methods of assessing PA and energy expenditure (EE) are available
(Ainsworth, 2009; Lamonte & Ainsworth, 2001; Westerterp, 2009). These include
direct and indirect methods either by assessing the behaviour or the energy cost of
that behaviour as it occurs. However, no method is 100% accurate and all have their
limitations (Welk, 2002). Direct methods provide a more accurate estimate of energy
expenditure as they do not involve elements of recall like indirect methods, however,
direct methods require the use of instruments and/or complex measurement systems
which may not always render them so practical (Ainsworth, 2009).
0% 10% 20% 30% 40% 50%
European Average
Malta
Seldom Active
Never Active
Never Exercise or Play Sports

10
1.2.5.1 Direct Methods to assess PA
1.2.5.1.1 Calorimetry and double labelled water
Direct measures include direct and indirect calorimetry techniques. The direct
method monitors the body’s rate and quantity of energy produced by measuring the
body’s heat production in a sealed insulated chamber (Miles, 2007; Startling, 2002;
Dishman, Washburn & Heath, 2004). This laboratory technique is very accurate
(Dishman et al., 2004). The indirect method estimates EE by measuring respiratory
gases, where the subject has to wear a mask and carry equipment to analyse expired
air (Startling, 2002).
Doubly labelled water (DLW) technique is a biochemical procedure used to
assess PA and EE under laboratory and field conditions (Speakman, 1998). It involves
measuring integral production of CO2 by the difference between the elimination rates
of 2H and 18O as both water and CO2 after a loading dose of water labelled with the
stable isotopes of 2H and 18O. EE is then determined from CO2 production (IARC,
2002). This method for measuring EE was labelled as ‘gold standard’ for the validation
of field methods of PA (Melanson, Freedson & Blair 1996; Westerterp & Pasqui, 2004).
These methods are highly accurate, however, rather expensive compared to
indirect methods and require the use of specialised equipment making them
impractical in large studies.
11
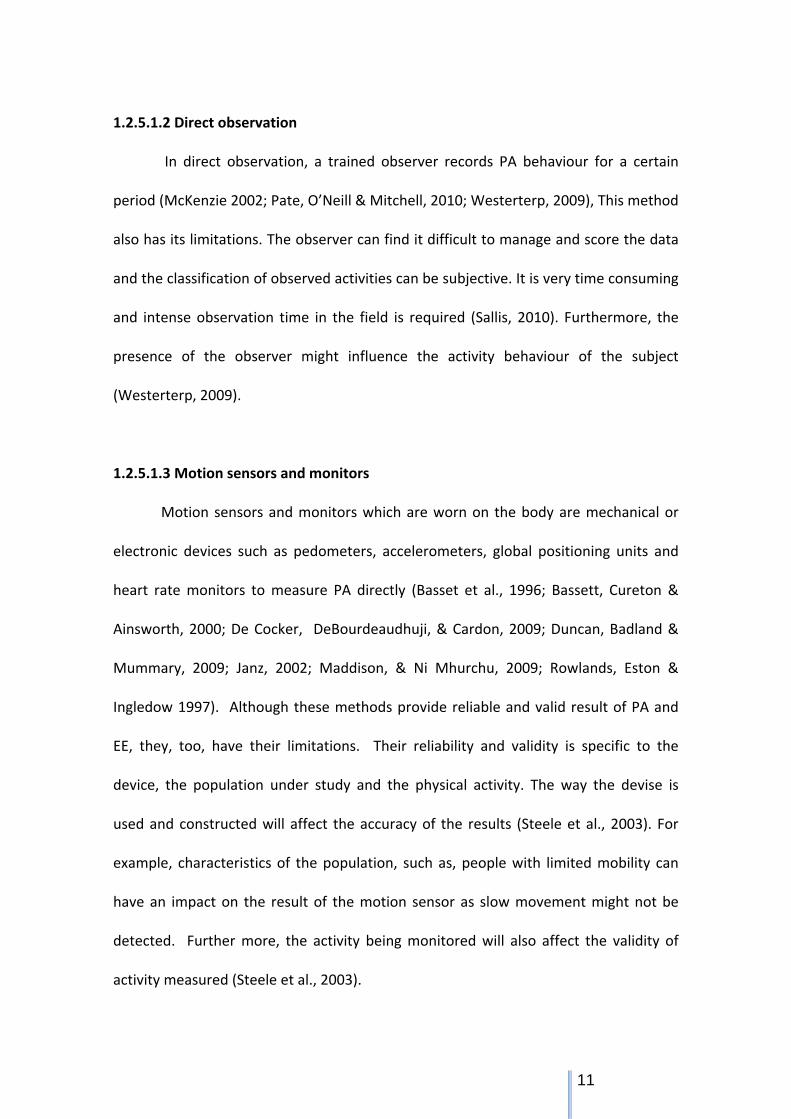
1.2.5.1.2 Direct observation
In direct observation, a trained observer records PA behaviour for a certain
period (McKenzie 2002; Pate, O’Neill & Mitchell, 2010; Westerterp, 2009), This method
also has its limitations. The observer can find it difficult to manage and score the data
and the classification of observed activities can be subjective. It is very time consuming
and intense observation time in the field is required (Sallis, 2010). Furthermore, the
presence of the observer might influence the activity behaviour of the subject
(Westerterp, 2009).
1.2.5.1.3 Motion sensors and monitors
Motion sensors and monitors which are worn on the body are mechanical or
electronic devices such as pedometers, accelerometers, global positioning units and
heart rate monitors to measure PA directly (Basset et al., 1996; Bassett, Cureton &
Ainsworth, 2000; De Cocker, DeBourdeaudhuji, & Cardon, 2009; Duncan, Badland &
Mummary, 2009; Janz, 2002; Maddison, & Ni Mhurchu, 2009; Rowlands, Eston &
Ingledow 1997). Although these methods provide reliable and valid result of PA and
EE, they, too, have their limitations. Their reliability and validity is specific to the
device, the population under study and the physical activity. The way the devise is
used and constructed will affect the accuracy of the results (Steele et al., 2003). For
example, characteristics of the population, such as, people with limited mobility can
have an impact on the result of the motion sensor as slow movement might not be
detected. Further more, the activity being monitored will also affect the validity of
activity measured (Steele et al., 2003).

12
1.2.5.2 Indirect methods to assess PA
Indirect methods include PA diaries, logs, interviews and recall questionnaires
which provide a detailed account of all, the PA performed during a specific period of
time (Ainsworth, 2009; Lamonte & Ainsworth, 2000; Mathews, 2002; Sallis & Saelens
2000; Westerterp, 2009). Logs and diaries can identify:‐ the type of activity
performed, such as, walking, gardening, and lifting; the purpose of activity, such as,
home maintenance and transportation; the duration, such as, minutes; self‐rating
intensity (light, moderate or vigorous); and body position (standing, walking, sitting)
for all the activities performed within a period of time (Ainsworth, 2009). Self‐
reporting, recall questionnaires/surveys are used more frequently to assess PA and EE
in large scale epidemiological studies as they are fairly inexpensive and non‐reactive
methods (Lamonte & Ainsworth, 2000). Recall questionnaires can reflect various
domains of activities, such as, exercise, occupational, leisure time, gardening, family
care and transportation. However, these have the fundamental problem of recall bias
(Ainsworth, 2009; Rutten et al., 2003), for instance, certain strenuous activity tends to
be recalled more accurately than moderate‐intensity activity (IARC, 2002). Rutten et
al. (2003) argue that time spent in vigorous‐intensity activity can be overestimated
while habitual daily activity such as walking can be difficult to recall, hence, may be
underestimated (Bassett et al., 2000).
1.2.6 International Physical Activity Questionnaire (IPAQ)
In response to the global demand for comparable and valid measures of PA
within and between countries, the IPAQ questionnaire was developed in 1997 by a

13
multinational working group supported by WHO as a comparable and standardized
self‐report instrument to measure multiple domains of PA levels across different
countries and socio‐cultural environment, targeting people between 18 and 69 years
of age (Craig et al., 2003; Rutten et al., 2003; Maddison et al., 2007).
The IPAQ questionnaire has a short (7 items) and long version (27 items), both
involving a seven‐day recall PA form, which can be self‐administered or done via
telephone or through personal interviews. The short form is suitable for measuring PA
in international and regional surveillance systems. The long form is more suitable for
interventions that require more precise PA quantification as it provides more detailed
information and measures four domains of PA (IPAQ, 2005). These include
occupational (7 items), transportation (6 items), garden and household tasks and
family caring (6 items), leisure time (6 items), plus, it collects data on total sitting time
(2 items) (IPAQ, 2005; Maddison et al., 2007; Van der Ploeg et al., 2010).
A reliability and validity study of the measurement properties of IPAQ was held
across fourteen centres from twelve developed and developing countries (Craig et al.,
2003). The results demonstrated that all IPAQ questionnaire versions produce reliable
data (Spearman’s r of 0.81 for the long form and 0.76 for the short form) and
acceptable criterion validity against CSA accelerometer (r = 0.30), and 75% of test‐
retest correlation coefficient (within the same week) in the twelve countries were
above 0.65 (Craig et al., 2003). Since then, the IPAQ has been investigated
internationally for validity and reliability and used in different settings and different
14
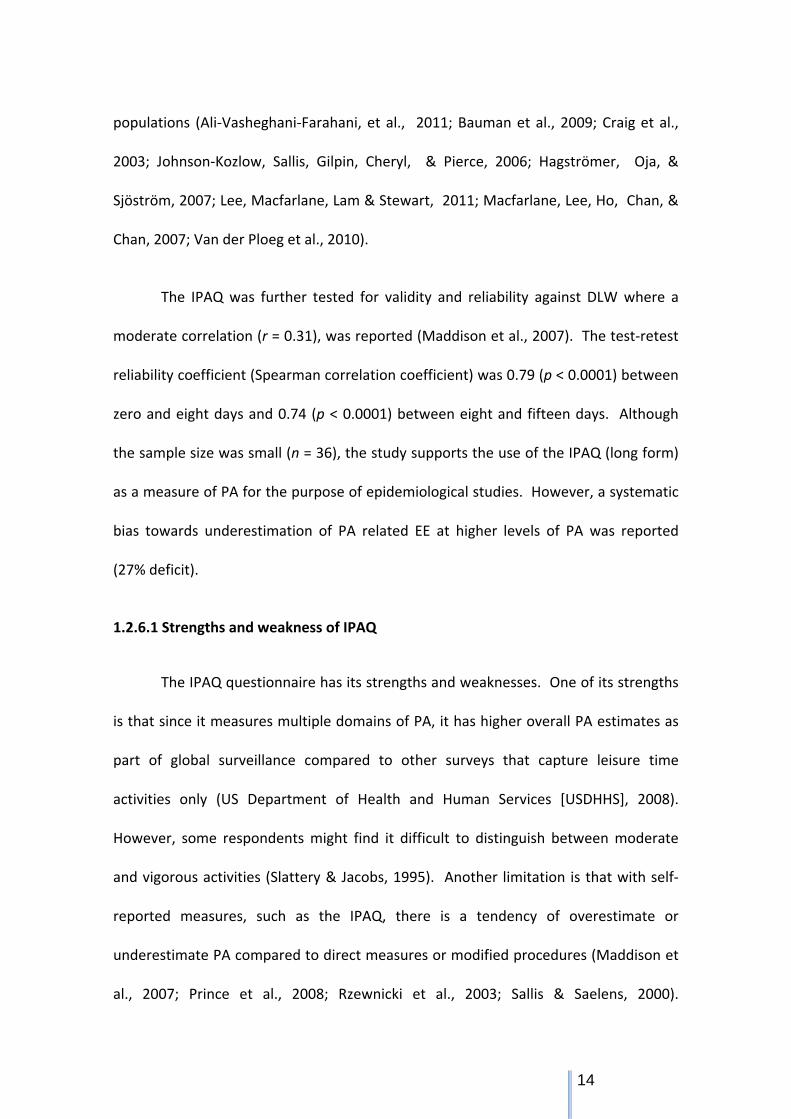
populations (Ali‐Vasheghani‐Farahani, et al., 2011; Bauman et al., 2009; Craig et al.,
2003; Johnson‐Kozlow, Sallis, Gilpin, Cheryl, & Pierce, 2006; Hagströmer, Oja, &
Sjöström, 2007; Lee, Macfarlane, Lam & Stewart, 2011; Macfarlane, Lee, Ho, Chan, &
Chan, 2007; Van der Ploeg et al., 2010).
The IPAQ was further tested for validity and reliability against DLW where a
moderate correlation (r = 0.31), was reported (Maddison et al., 2007). The test‐retest
reliability coefficient (Spearman correlation coefficient) was 0.79 (p < 0.0001) between
zero and eight days and 0.74 (p < 0.0001) between eight and fifteen days. Although
the sample size was small (n = 36), the study supports the use of the IPAQ (long form)
as a measure of PA for the purpose of epidemiological studies. However, a systematic
bias towards underestimation of PA related EE at higher levels of PA was reported
(27% deficit).
1.2.6.1 Strengths and weakness of IPAQ
The IPAQ questionnaire has its strengths and weaknesses. One of its strengths
is that since it measures multiple domains of PA, it has higher overall PA estimates as
part of global surveillance compared to other surveys that capture leisure time
activities only (US Department of Health and Human Services [USDHHS], 2008).
However, some respondents might find it difficult to distinguish between moderate
and vigorous activities (Slattery & Jacobs, 1995). Another limitation is that with self‐
reported measures, such as the IPAQ, there is a tendency of overestimate or
underestimate PA compared to direct measures or modified procedures (Maddison et
al., 2007; Prince et al., 2008; Rzewnicki et al., 2003; Sallis & Saelens, 2000).

15
Additionally, the IPAQ scoring protocol does not reflect the intensity of all activities for
everyone. For example, a participant who indicates that he/she walks 30 minutes 5
days a week has used an equivalent 495 METs min/week. However, different variables
such as weather and geography may affect one’s walking speed and intensity which
will, in turn, affect the 3.3 METs (Ainsworth et al., 1993), which can result in
misrepresentation of the energy cost of the activity (Maddison et al., 2007). Another
weakness is that individuals who are physically fitter than others may rate moderate
and vigorous activity differently compared to those who are more sedentary and less
fit, thus, confounding self‐report derived EE (Maddison et al., 2007).
1.2.7 PA recommendations and guidelines
Evidence based on public health recommendations have been issued since
1995 (US Center for Disease Control and Prevention [CDC] and American College of
Sports Medicine [ACSM]). The CDC/ACSM (1995) recommendations state that “every
US adult should accumulate 30 minutes or more of moderate intensity PA on most,
preferably all days of the week” (Pate et al., 1995 p. 402). The purpose of this
recommendation was to encourage sedentary US adults to increase their PA levels and
to improve their general health and disease prevention. This recommendation created
some controversy because it suggested that the activity can be accumulated in bouts
of at least six to ten minutes which was different from the previous recommendations
that emphasised on one longer continuous and rather strenuous session (ACSM, 1985).

16
This recommendation has been adopted worldwide (Oja & Titze, 2011) and
since then a general consensus has been reached on the amount and type of PA
recommendations to improve and maintain health (CMO [UKDoH], 2004, EASO [Tsigos
et al.,] 2008; USDHHS Physical Activity Guidelines for Americans, 2008; USDHHS ‐
Surgeon General’s report and the US National Institute of Health Consensus Report,
1996; WHO, 2000, 2004, 2010). Table 2 shows the development of PA
recommendations for adults by various organisations.
WHO (2010) adopted the updated evidence based recommendations by ACSM/
AHA, 2007 (Haskell et al., 2007) and recommended that adults aged 18‐65 years
engage in at least 150 minutes of moderate‐intensity aerobic PA weekly in addition to
performing regular strength and flexibility training or at least 75 minutes of vigorous‐
intensity aerobic PA throughout the week or an equivalent combination of moderate
and vigorous‐intensity activity. Furthermore, WHO (2010) recommends that for
additional health benefits, adults should increase their moderate‐intensity aerobic PA
to twice the recommended amount (300 minutes per week or 150 minutes of
vigorous‐intensity aerobic PA per week or an equivalent combination of moderate and
vigorous‐intensity activity).

17
Table 2: Development of PA recommendations for adults
Organisation Date Recommendation Rationale
AHA/ACSM (first guidelines)
1975 3‐ 4 times a week for 20 – 60 minutes at 70 ‐85% max HR.
Health and fitness
ACSM 1978 3‐5 times per week, 15‐60 minutes each time, 60‐90% max HR. Stressed on continuous aerobics activity.
Health and Fitness
CDC/ACSM, Pate et al.
1995 30 minutes of at least moderate‐intensity on most, preferably all days of the week which can be accumulated in bouts of at least 10 minutes duration.
Health
CDC, US Surgeon General report
1996 Start moderate levels of PA for 30 ‐ 45 minutes 3 to 5 days a week with long term goal of accumulating at least 30 minutes or more of moderate‐intensity such as walking on most, and preferably all days of the week.
Health
ACSM, 1998 3‐5 times per week, 20‐60 minutes each time, 50‐ 85% max HR on aerobic exercise and include strength and flexibility training.
Maintaining or improving fitness.
IASO, Sairs et al.
2003 For prevention of obesity: 45‐60 minutes per day of least moderate‐ intensity activity. For maintenance: 60‐90 minutes per day of moderate‐intensity or lesser amount of vigorous‐intensity activity.
Prevention of obesity Maintain weight loss.
IOM, Chief Medical Officer
2003 Prevention of excess weight: 60 minutes a day.
Prevention of obesity.
WHO 2004 30 minutes of moderate‐intensity activity on most days of the week.
Health

18
Table 2 (Continued) Organisation
Date
Recommendation
Rationale
Department of Health UK, Chief Medical Officer
2004 At least 30 minutes a day of moderate‐intensity PA on 5 or more days a week. 45‐ 60 minutes of moderate‐intensity of PA a day to prevent obesity.
Health Prevention of obesity
ACSM/ AHA Haskell et al.
2007 30 minutes of at least moderate‐intensity activity daily or 20 minutes of vigorous activity 3 times a week, in addition to 2 times a week of strength training.
150‐250 min/week of moderate‐intensity PA. More than 250 min/week of moderate intensity PA.
Health and Fitness
Prevention of weight gain Weight loss and weight maintenance after loss.
USDHHS, Physical Activity Guidelines Advisory Committee Report.
2008 Adults aged 18‐64: 150 minutes of moderate‐intensity PA a week or at least 75 minutes of vigorous PA a week or the equivalent combination per week in addition to strength training in bouts of at least 10 minutes. More health benefits are gained if PA is doubled. Suggest that some activity is better than none.
Health
WHO 2010 Recommendations are specific to age group. All adults aged 18‐65: 150 minutes of moderate‐intensity PA a week or at least 75 minutes of vigorous PA a week or the equivalent combination per week in addition to strength training.
Health and fitness
Department of Health, PA, Health Improvement and Protection UK
2011 Should be active at least 150 minutes a week (30 minutes, 5 times a week) at moderate‐intensity or 75 minutes of vigorous‐intensity exercise a week or combination of both. Should also include strength training at least twice a week and reduce the time spent being sedentary as much as possible.
Health

19
1.2.8 Maltese recommendations for PA
The current Maltese PA guidelines promoted by the Department for Health
Promotion and Disease Prevention (2008) recommend that all adults should achieve at
least 30 minutes of moderate‐intensity aerobic activity daily which can be accumulated
in bouts of 10 minutes. This recommendation appears to be sufficient to reduce
health risks.
As part of the promotion to encourage PA on daily basis for people of all ages
throughout Malta and Gozo the Health Department issued a PA pyramid which
illustrates activities to be carried out throughout the week for weight control and to
feel physically and mentally healthy (Department for Health Promotion and Disease
Prevention, 2008). The activities are in decreasing order of preference with those
activities that one should do mostly on daily basis such as sweeping, going up the stairs
and walking the dog at the base of the pyramid, followed by, aerobic activity which is
recommended three to five times weekly. Resistance activities are more toward the
top and those that one should do less frequently, such as, sedentary activities at the
top of the pyramid. Figure 3 illustrates the Maltese physical activity pyramid.

20
Figure 3: Physical Activity Pyramid for the Maltese adults issued by the Maltese Health Department
Source: Department for Health Promotion and Disease Prevention (Malta). 2008. Caqlaq għal Saħħtek. Msida, Malta: (Author)
1.3 Obesity
1.3.1 Obesity and health implications related to obesity
The worldwide rapid increase in the prevalence of overweight and obesity in
the last few decades has been a growing public health challenge as it is creating a

21
“health crisis” in the form of an “obesity epidemic” (WHO, 2010). Obesity is a
chronic disease and like physical inactivity, it has become a serious threat to health. It
is estimated that excess weight is responsible for 2.8 million deaths annually, i.e., 4.8%
of global mortality (WHO, 2009). A number of diseases and disorders including
diabetes, CHD, stroke, certain forms of cancer, back pain, musculoskeletal problems,
respiratory problems, loss of function and psychological problems have all been linked
to obesity (CMO, 2004; Haslam & Wittert, 2009; National Heart, Lung and Blood
Institute [NHLBI], 1998; OECD, 2010; WHO 2000). Furthermore, obesity doubles the
risk of all‐cause mortality and reduces life expectancy by an average of nine years
(CMO, 2004). Similar findings were reported by Fontaine, Redden, Wang, Westfall,
and Allison (2003), where they concluded that obesity at the age of 40, reduced life
expectancy by seven years.
1.3.2 Definition of obesity and factors causing obesity
WHO (2013) defines obesity and overweight as “abnormal or excessive fat
accumulation that may impair health”. Obesity can also be expressed as excess weight
in relation to height (WHO 2000), which is called the body mass index (BMI) where
individuals are classified into weight categories (Prentice & Jebb, 2001). BMI is defined
as a person’s weight in kilograms (kg) divided by the square of his/her height in meters
(kg/m2).
Obesity is complex and multi‐factorial (Haslam & James, 2005). It results from
a long term positive energy imbalance, where energy intake exceeds energy

22
expenditure over a long period of time (WHO, 1997; Bouchard, Blair, & Huskell, 2006).
Thus, reduction in PA levels is assumed to be one of the main factors for the rapid
increase in overweight and obesity (WHO, 2010). However, behavioural, cultural,
environmental, social, physiological, metabolic and genetic factors all play an
important part (NHLBI, 1998). Additionally, the changes in culture and environment,
such as, the increased availability of high energy dense foods, increased portion sizes,
low PA levels and increased sedentary lifestyle, as well as, eating disorders, are
contributing major factors that had an impact on the observed changes in the
prevalence of the obesity epidemic over the last 50 years (Tsigos et al., 2008).
1.3.3 Assessment of overweight and obesity using BMI and WC
BMI and WC are common ways to assess obesity as they are considered
practical, easy and inexpensive to administer and valid and reliable tools to provide
possible proxies to measure total body fatness (Flegal et al., 2009; NHBLI, 1998;
Prentice & Jebb, 2001)
1.3.3.1 Body Mass Index
BMI originally known as the Quetelet Index, is not a perfect measure of obesity,
but, it is a valuable and practical tool for public health. In 1995, WHO recognised BMI
as suitable method to classify into broad categories an adult person’s weight as
normal, overweight or obese. Table 3 shows this classification.

23
Table 3: Cut‐off points of BMI for the classification of weight
Obesity class BMI ( kg/m2) Popular description
Underweight <18.5 Thin
Normal 18.5‐24.9 Healthy, normal or acceptable weight
Overweight 25.0‐29.9 Overweight or ‘preobese’
Obese I 30.0‐ 34.9 Obese
II 35.0‐39.9 Obese
Extremely obese III 40< Morbidly obese
Source : Adapted from WHO Expert committee 1995‐ PA status. The use and interpretation of Anthropometry. Tech Report series No 854. Geneva WHO;
Preventing and Managing the Global Epidemic of Obesity. Report of WHO consultation of obesity . Series No 894. WHO Geneva June 1997
Research results suggest that BMI is correlated with direct measures, such as,
underwater weighing (Willet, 1998), dual‐energy X–ray absorption and magnetic
resonance imaging (Rothman, 2008; Janssen et al., 2002a). Janssen et al. (2002a)
found a correlation between BMI and total body fat percentage r = .92 and .78 in
women and men respectively. Thus, BMI provides an acceptable approximation for
assessment of total body fat for the majority of subjects (Janssen et al., 2002a; Flegal
et al., 2009) and can be used to classify people on terms of excess body fat (IARC,
2002).
BMI provides a practical indicator of the severity of obesity, nevertheless it has
its limitations and can be an imperfect way to measure obesity especially if BMI

24
measured is based on self‐reported weight and height (Maddison et al., 2007). Some
limitations include that it does not take into account sex, age, ethnicity, variance in
bone density, muscle mass and body fat distribution and may not correspond to the
same degree of fatness or associated health risk in different individuals (Carroll et al.,
2008; Ellis, 2000; Jackson, Ellis, McFarlin, Sailors & Bray, 2009; Prentice & Jebb, 2001).
For example, a person with a high percentage of lean muscle mass may have a high
BMI and it can underestimate body fat in individuals who have lost muscle such as the
elderly (IARC, 2002; NHLBI, 1998). This can lead to misclassification of individuals with
respect to body fat and that miscalculation can in turn introduce bias in studies.
Janssen et al. (2002a), in their study, concluded that although BMI and WC
combined were highly correlated with percentage body fat for both sexes (r = .92 and
.79 in women and men respectively), WC independent of sex was a stronger correlate
to abdominal and visceral fat than BMI (Abdominal fat: WC r = .73 and .68 in women
and men respectively; BMI r = .68 and .76 in women and men respectively. Visceral
Fat: WC r = .76 and .55 in women and men respectively, BMI r = .60 and .46 in women
and men respectively, p < 0.001). On the other hand, Flegal et al. (2009) reported that
percentage body fat was significantly highly correlated with WC than with BMI in men
(p < .00001), but significantly more correlated with BMI than WC in women (p<0.0001).
Furthermore, Janssen et al. (2004) concluded that although BMI is a significant
predictor of metabolic health risk, their results suggest that WC (abdominal fatness) is
a better marker of health risk than BMI, and BMI and WC together provide a better
predictor of abdominal fatness than BMI alone (Dagan, Segev, Novikov & Dankner,

25
2013; Janssen et al., 2002a; Janseen, Katzmarzyk & Ross, 2002b). Therefore, WC
should be given more importance in obesity classification systems, as it reflects
adipose rather than muscle tissue and may thus be a more precise estimate of overall
adiposity than weight alone or BMI (IARC, 2002).
1.3.3.2 Waist Circumference
WC is a simple, inexpensive and convenient way that provides information on
the distribution of body fat (Brown, 2009) as opposed to BMI (Dagan et al., 2013).
Research indicates that WC correlates positively with abdominal fat content ( r = .87
and .68 in women and men respectively, Janssen et al., 2002a) giving an acceptable
indication of the severity of abdominal obesity (Abate, Gorge, Peshoch Stray‐
Gundersen, & Adams‐Huet,1996; Albu, Murphy, Frager, Johnson, & Pi‐Sunyer, 1997;
Janssen et al., 2002a; Janssen et al., 2004; Lean, Han, & Morrison, 1995).
Lean et al. (1995) developed sex specific WC cut‐off points by comparing WC
and the BMI in a large and heterogeneous sample of white men and women. In that
sample a WC of > 94cm for men and > 80 cm for women corresponded to BMI of > 25
kg/m2 whilst WC of > 102cm for men and 88 cm for women corresponded to a BMI of
30, with only about two percent of the sample population being misclassified. These
cut‐off points were then adopted by WHO (1997, 2000) and used in NHLBI (1998)
guidelines and other studies as an indication of health risk factors and obesity related
disease (Janssen et al., 2002b). However, in individuals with very high BMIs, over 35

26
kg/m2, the WC will lose its predictive power as usually, these individuals have greater
WC than cut‐off points (NHLBI, 1998).
Table 4 Sex specific cut‐off points for WC
Low Risk Increased Risk High risk
Men <93cm 94 ‐101 cm > 102 cm ( > 40 inches)
Women <79cm >80‐87cm > 88 cm ( >35 inches)
Source: Adapted from Lean, Hans and Morrison (1995)
1.3.4 Waist circumference in Maltese study
The 2010 European Health Examination Survey (EHES) pilot study (DHIR 2012),
which is the only study in Malta that gives measured WC, revealed that the average
WC amongst males was 96.6 cm, which is within the ‘increased risk’ category but
below the threshold for ‘high risk’. Whilst the average WC for females was above the
‘high risk’ threshold with an average of 89.3cm.
1.3.5 Obesity prevalence in Malta
As in many other European countries, in Malta (Figure 4a and 4b), overweight
and obesity is a major public health concern. The existing literature points to a high
prevalence of overweight and obesity in the Maltese population (MONICA, 1984 cited
in DHIR, 2012; NHIS , 2003; EHIS, 2008; EHES Pilot study, 2010, Eurostat, 2011). Table
5, compares the results of NHIS, (2002) and EHIS (2008) with regards to overweight
and obesity prevalence in Malta over the six year period using self reported measures.

27
Table 5: Overweight and obesity in adults between 2002 and 2008
Overweight Obese
Men Women Av Total Men Women Av Total
EHIS 2002
EHIS 2008
40%
45%
29%
28%
35%
37%
25%
24%
21%
21%
23%
22%
Source: DHIR (EHIS) 2008,
When comparing the 2008, EHIS results to other EU states, for which data is available,
Malta has the highest rate of obesity amongst males (24.7%, circled in figure 4) and the
third highest rate amongst females (21.1% , circled in figure 2). This is much higher
than the EU average of 16.5% and 16.7% respectively (OECD, 2010).
Figure 4a: Males prevalence of obesity and overweight in Europe Source: Overweight and obesity ‐ BMI statistics (Eurostat, 2011)

28
Figure 4b: Females prevalence of obesity and overweight in Europe Source: Overweight and obesity ‐ BMI statistics (Eurostat, 2011)
MONICA (1984, cited in DHIR, 2012) and the EHES Pilot Study (2010, DHIR,
2012), both health examination surveys that give measured data of height and weight
in a sample of Maltese adult population between the ages of 25 and 64, indicate that
during a 26‐year period the proportions of overweight and obesity have remained
fairly stable, with only 1% drop in overweight in the same age group (Table 6).
Table 6: Comparison of results from MONICA 1984 and EHES Pilot Study 2010
Overweight Obese
1984 (MONICA) 38% men and women 29% men and women
2010 (EHES Pilot study) 37% men and women 29% men and women
Source: DHIR (2012), European Health Examination Survey Pilot Study 2010.
However, over this period more males have become obese, (22% in 1984, 30% in 2010)
while there is a shift of BMI for women towards a normal weight when compared with

29
the 1984, MONICA study. In 1984, 35% of women were obese, while in 2010, the
percentage was reduced by seven, and the proportion of women who are of normal
weight has increased from 33% in 1984 to 45% in 2010.
1.3.6 Conclusion
One has to take into account that most studies on PA and weight involving
Maltese population were based on self‐reporting of PA. Only the MONICA (1984) and
EHES Pilot study (2010), use measured weight and height. Self‐reporting may provide
biased estimates of the levels of PA and the prevalence of obesity and overweight in
these studies (Graff‐Iversion et al., 2007; McAdams, Van Dam, & Hu, 2007; Pirie,
Jacobs, Jeffery, & Hannan, 1981; Rzewnicki et al., 2003; Wing, Epstein, Ossip, & La
Porte, 1979). Nevertheless, the existing literature appears to point to a high
prevalence of overweight and obesity and low levels of PA amongst the Maltese. The
fact that both excess weight and lack of PA are closely linked to comorbidities and
premature mortality (Ainsworth & Macera, 2012; CMO, 2004; Hardman & Stensel,
2009; Hu et al., 2004; Lee et al (2012); NHLBI, 1998; USDHHS, 1996; Warburten et al.,
2006; WHO, 1997, 2004) and that the Maltese rank high in EU obesity chart, highlights
the necessity to investigate if the lack of PA levels and weight status among the
Maltese adult population are correlated.

30
References Review Paper. Abate, N., Garg, A., Peshock, R. M., Stray‐Gundersen, J., & Adams‐Huet, B. G. S. (1996).
Relationship of generalized and regional adiposity to insulin sensitivity in men with NIDDM. Diabetes, 45(12), 1684‐93. Doi: 10.2337/diab.45.12.1684
Ainsworth, B. E. (2009). How do I measure physical activity in my patients?
Questionnaires and objective methods. British Journal of Sports Medicine, 43(1), 6–9. Doi:10.1136/bjsm.2008.052449
Ainsworth, B. E., Haskell, W. L., Leon, A. S ., Jacobs, D. R., Montoye, H. J., Sallis, J. F.,
& Paffenbarger, R. S. (1993). Compendium of physical activities: classification of energy costs of human physical activities. Medicine & Science in Sports & Exercise. 25(1), 71‐80. Retrieved from http://www.ncbi.nlm.nih.gov/ pubmed/8292105
Ainsworth, B. E. & Macera, C. A. (2012). Physical Activity and Public Health Practice. Boca Raton: CRC Press Taylor & Francis Group.
Albu, J. B., Murphy, L., Frager, D. H., Johnson, J. A., & Pi‐Sunyer, F. X. (1997). Visceral fat and race‐dependent health risks in obese nondiabetic premenopausal women. Diabetes, 46(3), 456‐62. Retrieved from http://diabetes. diabetesjournals.org/content/46/3/456.full.pdf
Ali Vasheghani‐Farahani, A., Tahmasbi, M., Asheri, H., Ashraf, H., Nedjat, S, & Kordi, R. (2011). The Persian, Last 7‐day, Long form of the International Physical Activity Questionnaire: Translation and Validation Study. Asian Journal of Sports Medicine, 2(2), 106‐116. Retrieved from http://www.ncbi.nlm.nih.gov/pmc/ articles/PMC3289200/#
American College of Sports Medicine. (1978). Guidelines for Graded Exercise Testing and Exercise Prescription. Philadelphia: Lea & Febiger.
American College of Sports Medicine. (1985). Guidelines for Graded Exercise Testing and Exercise Prescription. 3rd Edition. Philadelphia: Lea & Febiger.
American College of Sports Medicine. (1998). Resource Manual for Guidelines for Exercise Testing and Exercise Prescription. 3rd Edition. Baltimore, Maryland USA: Lippincott Williams & Wilkins. A Wolters Kluwer Company
American Heart Association/ American College of Sports Medicine (AHA/ACSM). (1975). Guidelines for graded Exercise Testing and Prescription. Philadelphia: Lea & Febiger.

31
Bassett, D. R. Jr. (2000). Validity and reliability issues in objective monitoring of physical activity. Research Quarterly for Exercise and Sport , 71(2), 30‐36. Retrieved from http://www.ncbi.nlm.nih.gov/pubmed/10925822
Basset, D. R. Jr., Ainsworth, B. E., Leggett, S. R., Mathien, C. A., Main, J. A., Hunter, D. C., & Duncan, G. E. (1996). Accuracy of five electronic pedometers for measuring distance walked. Medicine & Science in Sports & Exercise, 28(8), 1071‐1077. Retrieved from http://www.ncbi.nlm.nih.gov/pubmed/8871919
Bassett, D. R. Jr, Cureton, A. L., & Ainsworth, B. E. (2000). Measurement of daily walking distance‐ questionnaire vs. a pedometer. Medine & Science Sports &Exercise, 32(5), 1018‐23.Retrieved from http://www.ncbi.nlm.nih.gov/ pubmed/10795795
Bauman, A., Bull, F., Chey, T., Craig, C. L., Ainsworth, B. E., Sallis, J. F., … Pratt. M. (2009). The International Prevalence Study on Physical Activity: results from 20 countries. The International Journal of Behavioural Nutrition and Physical Activity, 6(21). Doi:10.1186/1479‐5868‐6‐21
Bauman, A., & Craig, C. L. (2005). The place of physical activity in the WHO Global Strategy on Diet and Physical Activity. The International Journal of Behavioural Nutrition and Physical Activity, 2(10). Doi:10.1186/1479‐5868‐2‐10
Bouchard, C. Blair, S. N., & Huskell, W. L. (2006). (Eds.). Physical Activity and Health. Champaign. IL. USA: Human Kinetics.
Brown, P. (2009). Waist circumference in primary care. Primary Care Diabetes, 3(4), 259–61. Doi:10.1016/j.pcd.2009.09.006
Cale, L., & Harris, J. (2005). Getting the buggers fit‐ why bother? Getting the Buggers Fit. (Google book). Retrieved from http://books.google.com.mt/books? id=jMEcouaJAfIC&printsec=frontcover&source=gbs_ge_summary_r&cad=0#v=onepage&q&f=false
Carroll, J. F., Chiapa, A. L., Rodriquez, M., Phelps, D. R., Cardarelli, K. M., Vishwanatha, J. K., … Cardarelli, R. (2008). Visceral fat, waist circumference, and BMI: impact of race/ethnicity. Obesity (Silver Spring, Md.), 16(3), 600–607. Doi:10.1038/oby. 2007. 92
Caspersen, C. J., Powell, K. E., & Christenson, G. M. (1985). Physical activity, exercise, and physical fitness: definitions and distinctions for health‐related research. Public Health Reports (Washington, D.C. : 1974), 100(2), 126–31. Retrieved from http://www.pubmedcentral.nih.gov/articlerender.fcgi?artid=1424733& tool=

32
Chief Medical Officer Report. British Department of Health (2004). At least five a week. Evidence on the impact of physical activity and its relationship to health. Retrieved from http://www.dh.gov.uk/prod_consum_dh/groups/dh digitalassets/@dh/@en/documents/digitalasset/dh_4080981.pdfD
Craig, C. L., Marshall, A. L., Sjöström, M., Bauman, A. E., Booth, M. L., Ainsworth, B. E., … Oja, P. (2003). International physical activity questionnaire: 12‐country reliability and validity. Medicine and Science in Sports and Exercise, 35(8), 1381–95. Doi:10.1249/01.MSS.0000078924.61453.FB
Dagan, S. S., Segev, S., Novikov, I., & Dankner, R. (2013). Waist circumference vs. body mass index in association with cardiorespiratory fitness in healthy men and women: a cross sectional analysis of 403 subjects. Nutrition Journal, 12(1), 12. Doi:10.1186/1475‐2891‐12‐12
De Cocker, K. A., De Bourdeaudhuij, I. M., & Cardon, G. M. (2009). What do pedometer counts represent? A comparison between pedometer data and data from four different questionnaires. Public Health Nutrition, 12(1), 74–81. Doi:10.1017/S1368980008001973
Department for Environmental Health. (2009). Environment and Health Performance Review Malta. WHO 2009.
Department of Health. (Malta) (2003). The First National Health Interview Survey (NHIS) 2002. G’ Mangia, Malta : Author
Department of Health Information and Research. (2012). The European Health Examination Survey (EHES) Pilot Study 2010. Marsa, Malta: Governmnet printing Press
Department of Health Information and Research Strategy and Sustainability Division Secretariat for Health Ministry for Health, the Elderly and Community Care. (2008). European health Interview Survey (EHIS) 2008. Lifestyle Report. Marsa, Malta: Government printing Press
Department for Health Promotion and Disease Prevention (Malta). 2008. Caqlaq għal Saħħtek. Msida, Malta: (Author).
Department of Health, Physical Activity, Health Improvement and Protection (2011). Start active, stay active: a report on physical activity from the four home countries. London: Chief Medical Officers.
Dishman, R. K., Washburn, R. A & Heath G.W. (2004). Physical Activity Epidemiology. USA Champaign. IL: Human Kinetics.

33
Duncan, M, J., Badland, H, M & Mummery, W, K. (2009). Applying GPS to enhance understanding of transport‐related physical activity. Journal of Science and Medicine in Sport. 12(5), 549‐556. Doi:10.1016/j.jsams.2008.10.010
Ellis, K. J. (2000). Human Body Composition : In Vivo Methods. Physiological Reviews 80(2), 649–681. Retrieved from http://physrev.physiology.org/content/80 /2/649.long
European Commission (EC). (2004). The citizens of the European Union and Sport. Special Eurobarometer 213/Wave162.0. Retrieved from http://ec. europa.eu/public_opinion/archives/ebs/ebs_213_summ_en.pdf
European Commission (EC). (2006). Health and food. Special Eurobarometer 246/Wave 64.3. Retrieved from http://ec.europa.eu/ health/ph_publication/ eb_food_en.pdf
European Commission (EC). (2010). Sport and physical activity. La Pediatria medica e chirurgica : Medical and Surgical Paediatrics, 32(6), 280–3. Retrieved from http://www.ncbi.nlm.nih.gov/pubmed/21462450
Eurostat. (2011). Overweight and obesity ‐ BMI statistics. Retrieved from http://epp.eurostat.ec.europa.eu/statistics_explained/index.php/Overweight_and_obesity_‐_BMI_statistics#Further_Eurostat_information
Flegal, K. M., Shepherd, J. A., Looker, A. C., Graubard, B. I., Borrud, L. G., Ogden, C. L., … Schenker N. (2009). Comparisons of percentage body fat , body mass index , waist circumference , and waist‐stature ratio in adults. American Journal of Clinical Nutrition, 89(2),500–508. Doi:10.3945/ajcn.2008.26847.
Fontaine, K. R., Redden, D. T., Wang, C., Westfall, A. O., & Allison, D. B. (2003). Years of life lost due to obesity. JAMA, 289(2), 187–93. Retrieved from http://www.ncbi. nlm.nih.gov/pubmed/12517229
Gallagher, D., Visser, M., Sepúlveda, D., Pierson, R. N., Harris, T., & Heymsfield, S. B. (1996). How useful is body mass index for comparison of body fatness across age, sex, and ethnic groups? American Journal of Epidemiology, 143(3), 228–39. Retrieved from http://www.ncbi.nlm.nih.gov/pubmed/8561156
Graff‐Iversen, S., Anderssen, S. A., Holme, I. M., Jenum, A. K., & Raastad, T. (2007). An adapted version of the long International Physical Activity Questionnaire (IPAQ‐L): construct validity in a low‐income , multi‐ethnic population study from Oslo, Norway. International Journal of Behavioural Nutrition and Physical Activity, 4(13). Doi:10.1186/1479‐5868‐4‐13

34
Hagströmer, M., Oja, P., & Sjöström, M. (2007). The International Physical Activity Questionnaire (IPAQ): a study of concurrent and construct validity. Public Health Nutrition, 9(6), 755–762. Doi:10.1079/PHN2005898
Hallal, P. C., Andersen, L. B., Bull, F. C., Guthold, R., Haskell, W., & Ekelund, U. (2012). Global physical activity levels: surveillance progress, pitfalls, and prospects. Lancet, 380(9838), 247–57. Doi:10.1016/S0140‐6736(12)60646‐1
Hardman, A. E. & Stensel, D. J. (2009). Physical Activity and Health: The Evidence Explained (2nd ed.). Oxon, United Kingdom: Routledge.
Haskell, W. L., Lee, I.‐M., Pate, R. R., Powell, K. E., Blair, S. N., Franklin, B. A., … Bauman, A. (2007). Physical activity and public health: updated recommendation for adults from the American College of Sports Medicine and the American Heart Association. Circulation, 116(9), 1081–1093. Retrieved from http://www.ncbi. nlm.nih.gov/pubmed/17671237
Haslam, D. W., & James, W. P. T. (2005). Obesity. Lancet, 366(9492), 1197–209. Doi:10.1016/S0140‐6736(05)67483‐1
Haslam, D., & Wittert, G. (2009). Fast Facts: Obesity. Oxford UK: Health Press Limited.
Hu, F. B., Willett, W. C., Li, T., Stampfer, M. J., Colditz, G. A, & Manson, J. E. (2004). Adiposity as compared with physical activity in predicting mortality among women. The New England Journal of Medicine, 351(26), 2694–703. Doi:10.1056/NEJMoa042135
Institute of Medicine (IOM). (2003). Dietary reference intakes for energy, carbohydrate, fibre, fat, fatty acids, cholesterol, protein, and amino acids. Washington, DC: National Academy Press. Retrieved from http://www.nap.edu/books/ 0309085373 /html
International Agency for Research on Cancer. (2002). IARC Handbooks for cancer
Prevention, Volume 6, Weight Control and Physical Activity. Lyon: IARC Press.
IPAQ. (2005). Guidelines for Data Processing and Analysis of the International Physical Activity Questionnaire ( IPAQ ) – Short and Long Forms, (November), 1–15. Retrieved from http://www.ipaq.ki.se/scoring.pdf
Jackson, A. S., Ellis, K. J., Mcfarlin, B. K., Sailors, M. H., & Bray, M. S. (2009). Body mass index bias in defining obesity of diverse young adults: the Training Intervention and Genetics of Exercise Response (TIGER) Study, 102(7), 1084–1090. Doi:10.1017/S0007114509325738.Body

35
Janssen, I., Heymsfield, S. B., Allison, D. B., Kotler, D. P., & Ross, R. (2002a). Body mass index and waist circumference independently contribute to the prediction of nonabdominal, abdominal subcutaneous, and visceral fat. The American Journal of Clinical Nutrition, 75(4), 683–688. Retrieved from http://www.ncbi. nlm.nih.gov/pubmed/11916754
Janssen, I., Katzmarzyk, P. T., & Ross, R. (2002b). Body Mass Index, Waist Circumference, and Health Risk: Evidence in Support of Current National Institutes of Health Guidelines. Archives of International Medicine, 162(18), 2074‐2079. Doi:10.1001/archinte.162.18.2074.
Janssen, I., Katzmarzyk, P. T., & Ross, R. (2004). Waist circumference and not body mass index explains obesity‐related health risk. The American Journal of Clinical Nutrition, 79(3), 379–384. Retrieved from http://www.ncbi.nlm .nih.gov /pubmed/14985210
Janz, K. F. (2002). Use of Heart Rate monitors to assess physical activity. In G.J. Welk (Ed.). Physical Assessment for Health – Related Research. Champaign, IL: Human Kinetics.
Jeffery, R. W., Drewnowski, A., Epstein, L. H., Stunkard, A. J., Wilson, G. T., Wing, R. R., & Hill, D. R.(2000). Long‐term maintenance of weight loss: current status. Health Psychology, 19(1), 5‐16. Doi: 10.1037/0278‐6133.19.Suppl1.5
Johnson‐Kozlow, M., Sallis, J. F., Gilpin, E. A., Cheryl, L., & Pierce, J. P. (2006). Comparative validation of the IPAQ and the 7‐Day PAR among women diagnosed with breast cancer. International Journal of Behavioural Nutrition and Physical Activity, 3(7), 1‐10. Doi:10.1186/1479‐5868‐3‐7.
Lamonte, M. J., & Ainsworth, B. E. (2001). Quantifying energy expenditure and physical activity in the context of dose response. Medicine and Science in Sports and Exercise, 33(6), 370–380. Retrieved from http://www.ncbi.nlm.nih.gov/ pubmed/11427762
Lean, M. E., Han, T. S., & Morrison, C. E. (1995). Waist circumference as a measure for indicating need for weight management. BMJ (Clinical research ed.), 311(6998), 158–61. Retrieved from http://www.pubmedcentral.nih.gov/ articlerender. fcgi? artid=2550221&tool=pmcentrez&rendertype=abstract
Lee, I. M., Shiroma, E. J., Lobelo, F., Puska, P., Blair, S. N., & Katzmarzyk, P. T. (2012). Effect of physical inactivity on major non‐communicable diseases worldwide: an analysis of burden of disease and life expectancy. Lancet, 380(9838), 219–229. Doi:10.1016/S0140‐6736(12)61031‐9

36
Lee, P. H., Macfarlane, D. J., Lam, T. H., & Stewart, S. M. (2011). Validity of the International Physical Activity Questionnaire Short Form (IPAQ‐SF): a systematic review. The International Journal of Behavioural Nutrition and Physical Activity, 8(115). Doi:10.1186/1479‐5868‐8‐115
Macfarlane, D. J., Lee, C. C. Y., Ho, E. Y. K., Chan, K. L., & Chan, D. T. S. (2007). Reliability and validity of the Chinese version of IPAQ (short, last 7 days). Journal of Science and Medicine in Sport / Sports Medicine Australia, 10(1), 45–51. Doi:10.1016/j.jsams.2006.05.003
Maddison, R., & Ni Mhurchu, C. (2009). Global positioning system: a new opportunity in physical activity measurement. The International Journal of Behavioural Nutrition and Physical Activity, 6(73). Doi:10.1186/1479‐5868‐6‐73
Maddison, R., Mhurchu, C. N., Jiang, Y., Vander, S., Rodgers, A., Lawes, C. M. M., & Rush, E. (2007). International Physical Activity Questionnaire ( IPAQ ) and New Zealand Physical Activity Questionnaire ( NZPAQ ): A doubly labelled water validation. International Journal of Behavioural Nutrition and Physical Activity, 4(62), Doi:10.1186/1479‐ 5868‐4‐62
Mathews, C. E. (2002). Use of self‐report instruments to assess physical activity. In G .J. Welk (Ed). Physical Assessment for health–related Research. (p.107‐123) Champaign, IL: Human Kinetics.
McAdams, M. A, Van Dam, R. M., & Hu, F. B. (2007). Comparison of self‐reported and measured BMI as correlates of disease markers in US adults. Obesity (Silver Spring, Md.), 15(1), 188–96. Doi:10.1038/oby.2007.504
McKenzie, T.L. (2002). The use of direct observation to assess physical activity. In G. Welk (Ed.) Physical Activity Assessments for Health‐Related Research (pp. 179‐195). Champaign, IL: Human Kinetics.
Melanson, E. L., Freedson, P. S. & Blair, S. (1996). Physical activity assessment: A review of methods. Critical Reviews in Food Science and Nutrition, 6(5), 385‐396. Doi: 10.1080/10408399609527732
Miles, L. (2007). Physical activity and health. Nutrition Bulletin, 32(4), 314–363. Doi:10.1111/j.1467‐3010.2007.00668.x
Ministry of Education, Youth and Employment. (2007). Re‐Shaping Sport. Retrieved from https://www.education.gov.mt/MediaCenter/Docs/1_reshaping_ sports. pdf

37
Morris, J. N., Clayton, D. G., Everitt, M. G., Semmence, a M., & Burgess, E. H. (1990). Exercise in leisure time: coronary attack and death rates. British Heart Journal, 63(6), 325–34. Retrieved from http://www.pubmedcentral.nih.gov/ articlerender.fcgi?artid=1024515&tool=pmcentrez&rendertype=abstract
National Heart, Lung, and Blood Institute (NHLBI) Obesity Education Initiative Expert Panel on the Identification, Evaluation, and Treatment of Obesity in Adults (US). (1998). Clinical Guidelines on the Identification, Evaluation, and Treatment of Overweight and Obesity in Adults‐The Evidence Report. Report No: 98‐4083.. Retrieved from http://www.ncbi.nlm.nih.gov/books/NBK2003/
National Institutes of Health Consensus Development Panel on Physical Activity and Cardiovascular Health. (1996). Physical Activity and Cardiovascular Health. JAMA. 276(3), 241‐246. Doi:10.1001/jama.1996.03540030075036
OECD. (2010). Health at a Glance: Europe 2010. OECD Publishing.
Oja, P., & Titze, S. (2011). Physical activity recommendations for public health: development and policy context. The EPMA Journal, 2(3), 253–9. Doi:10.1007/s13167‐011‐0090‐1
Pate, R. R., O’Neill, J. R., & Mitchell, J. (2010). Measurement of physical activity in preschool children. Medicine and Science in Sports and Exercise, 42(3), 508–12. Doi:10.1249/MSS.0b013e3181cea116
Pate, R. R., Pratt, M., Blair, S. N., Haskell, W. L., Macera, C. A., Bouchard, C., … Wilmore, J. H. (1995). Physical Activity and Public Health. A Recommendation from the Centers for Disease Control and Prevention and the American College of Sports Medicine . JAMA, 273(5), 402‐407. Doi:10.1001/jama.1995.03520290054029
Pirie, P., Jacobs, D., Jeffery, R., & Hannan, P. (1981). Distortion in self‐reported height
and weight data. Journal of American Dietetic Association, 78(6), 601‐606. Retrieved from http://www.ncbi.nlm.nih.gov/pubmed/7252014
Prince, S. A, Adamo, K. B., Hamel, M. E., Hardt, J., Connor Gorber, S., & Tremblay, M. (2008). A comparison of direct versus self‐report measures for assessing physical activity in adults: a systematic review. The International Journal of Behavioural Nutrition and Physical Activity, 5(56). Doi:10.1186/1479‐5868‐5‐56
Prentice, A. M., & Jebb, S. A. (2001). Beyond body mass index. Obesity reviews : an Official Journal of the International Association for the Study of Obesity, 2(3), 141–7. Retrieved from http://www.ncbi.nlm.nih.gov/pubmed/12120099
Rothman, K. J. (2008). BMI‐related errors in the measurement of obesity. International Journal of Obesity (2005), 32(3), 56–9. Doi:10.1038/ijo.2008.87

38
Rowlands, A. V., Eston, R. G., & Ingledew, D. K (1997). Measurement of physical activity in children with particular reference to the use of heart rate and pedometry. Sports Medicine, 24(4), 258‐272. Retrieved from http://www.ncbi.nlm.nih.gov/pubmed/9339494
Rütten, A., Ziemainz, H., Schena, F., Stahl, T., Stiggelbout, M., Auweele,... Welshman, J. (2003). Using different physical activity measurements in eight European countries. Results of the European Physical Activity Surveillance System (EUPASS) time series survey. Public Health Nutrition, 6(4), 371–6. Doi:10.1079/PHN2002450
Rzewnicki, R., Vanden Auweele, Y., & De Bourdeaudhuij, I. (2003). Paper 2. Addressing over‐reporting on the International Physical Activity Questionnaire (IPAQ) telephone survey with a population sample. Public Health Nutrition, 6(3), 299‐305. Retrieved from http://faber.kuleuven.be/doctorandi/doctoraten/ rzewnicki/G.%20Paper%202%20IPAQ%20overreporting.pdf
Sallis, J. (2010). Measuring Physical Activity: Practical Approaches for Program Evaluation in Native American Communities. Journal of Public Health Management Practice, 16(5), 404–410. Doi:10.1097/PHH.0b013e3181d52804.
Sallis, J. F., & Owen, N. (1999). Physical Activity and Behavioural Medicine. California: Sage Publications.
Sallis, J. F., & Saelens, B. E. (2000). Assessment of Physical Activity by Self‐Report Status, Limitations, and Future Directions. Research Quarterly for Exercise and Sport American Alliance for Health, Physical Education, Recreation and Dance (AAHPERD) HighBeam Research. http://www.highbeam.com
Saris, W. H. M., Blair, S. N., Van Baak, M. A., Eaton, S. B., Davies, P. S. W., Di Pietro, L., … Wyatt, H. (2003). How much physical activity is enough to prevent unhealthy weight gain? Outcome of the IASO 1st Stock Conference and consensus statement. Obesity Reviews : an Official Journal of the International Association for the Study of Obesity, 4(2), 101–14. Retrieved from http://www.ncbi. nlm.nih.gov/pubmed/12760445
Sjostrom, M., Hagstromer, M., & Ruiz, J. R. (2008). EU Platform on Diet, Physical Activity and Health. Platform Working Paper on Physical Activity. Retrieved from http://ec.europa.eu/health/ph_determinants/life_style/nutrition/platform/docs/ev_20080917_wp_en.pdf
Sjöström, M., Oja, P., Hagströmer, M., Smith, B. J., & Bauman, A. (2006). Health‐enhancing physical activity across European Union countries: the Euro barometer study. Journal of Public Health, 14(5), 291‐300. Doi:10.1007/s10389‐006‐0031‐y

39
Slattery, M. L., & Jacobs, D. R. (1995). Assessment of ability to recall physical activity of several years ago. Annals of Epidemiology, 5(4), 292‐296. Retrieved from http://dx.doi.org/10.1016/1047‐2797(94)00095‐B
Speakman, J. R. (1998). The history and theory of the doubly labelled water technique. The American Journal of Clinical Nutrition, 68(4), 932–938. Retrieved from http://www.ncbi.nlm.nih.gov/pubmed/9771875
Stagno‐Navarro, K. (2012, July 18). Malta, one of the world’s most inactive nations‐ The Lancet. Malta Today. Retrieved from http://www. maltatoday.com.mt/en/ newsdetails/news/national/Malta‐one‐of‐the‐world‐s‐most‐inactive‐nations‐The‐Lancet‐20120718
Startling, R. D. (2002). Use of doubly labelled water and indirect calorimetry to assess physical activity. In G.J. Welk (Ed) Physical assessment for health‐related research. Champaign, IL: Human Kinetics
Steele, B. G., Belza, B., Cain, K., Warms, C., Coppersmith, J., & Howard, J. (2003). Bodies in motion: monitoring daily activity and exercise with motion sensors in people with chronic pulmonary disease. Journal of Rehabilitation Research and Development, 40(5), 45-58. Retrieved from http://www.ncbi.nlm.nih.gov/pubmed/15074453
Stephenson, J., & Bauman, A. (2000). The cost of illness attributable to physical inactivity in Australia. A preliminary study. Health and Aged Care, 2704, 1‐81. Retrieved from http://www.health.gov.au/internet/main/publishing.nsf/ Content /6D0DE946E48007CCCA256F1900044E27/$File/phys_costofillness.pdf
Sjöström, M., Hagströmer, M., & Ruiz, J. R. (2008). EU Platform on Diet, Physical Activity and Health. Retrieved from http://ec.europa.eu/health/ph_ determinants/life_style/nutrition/platform/docs/ev_20080917_wp_en.pdf
Sjöström, M., Oja, P., Hagströmer, M., Smith, B. J., & Bauman, A. (2006). Health‐enhancing physical activity across European Union countries: the Euro barometer study. Journal of Public Health, 14(5), 291‐300. Doi: 10.1007/s10389‐006‐0031‐y
Tsigos, C., Hainer, V., Basdevant, A., Finer, N., Fried, M., Mathus‐Vliegen, E., … Zahorska‐Markiewicz, B. (2008). Management of obesity in adults: European clinical practice guidelines. Obesity facts, 1(2), 106–16. Doi:10.1159/000126822
US Department of Health and Human Services, (USDHHS). (1996). Physical Activity and Health. A report of the Surgeon General. Atlanta G.A. US Department of Health and Human Services, CDC (Center for Disease Control) and Prevention, National Center for Chronic Disease Prevention and Health Promotion. Retrieved from http://www.cdc.gov/nccdphp/sgr/pdf/sgrfull.pdf

40
US Department of Health and Human Services, (USDHHS). (2008). Physical Activity
Guidelines Advisory Committee Report. Activity Guidelines Advisory Committee Report, 2008. Washington: US Department of Health and Human Services; 2008. Retrieved from http://www.health.gov/paguidelines/pdf/ paguide. pdf
Van der Ploeg, H. P., Tudor‐Locke, C., Marshall, A. L., Craig, C., Hagströmer, M., Sjöström, M., & Bauman, A. (2010). Reliability and Validity of the International Physical Activity Questionnaire for Assessing Walking. Research Quarterly for Exercise and Sport 81(1) 97‐101. Doi: 10.1080/02701367.2010.10599632
Warburton, D. E. R., Nicol, C. W., & Bredin, S. S. D. (2006). Health benefits of physical activity: the evidence. CMAJ : Canadian Medical Association Journal, 174(6), 801–809. Doi:10.1503/cmaj.051351
Welk, G. J. (2002). Use of Accelerometry‐ based activity monitors to assess physical activity. In G. Welk (Ed.). Physical Activity Assessments for Health‐related Research. United States: Human Kinetics publication.
Westerterp, K. R., & Plasqui, G. (2004). Physical activity and human energy
expenditure. Current Opinion in Clinical Nutrition & Metabolic Care. Nutrition and Physiological Function, 7(6 ), 607‐613.
Westerterp, K. R. (2009). Assessment of physical activity: a critical appraisal. European Journal of Applied Physiology, 105(6), 823–828.Doi:10.1007/s00421‐009‐1000‐2
Willet, W. (1998). Nutritional Epidemiology Monographs in Epidemiology and Biostatistics, Vol. 30, New York, Oxford University press.
Wing, R. R. (1999). Physical activity in the treatment of the adulthood overweight and obesity current evidence. Medicine and Science in Sports and Exercise, 31(11), 547‐552. Doi:10.1097/00005768‐199911001‐00010
Wing, R. R., Epstein, L . H., Ossip, D. J., & La Porte, R. E. (1979). Reliability and validity of self‐report and observers' estimates of relative weight. Addictive Behaviors 4(2), 133‐140. Retrieved from http://dx.doi.org/10.1016/0306‐4603(79)90047‐9
WHO. World Health Organisation. (1995). PA status. The Use and Interpretation of Anthropometry. Expert Committee Report. Tech Report series No 854. Geneva WHO. Retrieved from: http://helid.digicollection.org/en/d/Jh0211e/
WHO. World Health Organisation. (1997). Obesity: Preventing and Managing the Global Epidemic of Obesity. Report of WHO consultation of obesity. Series No 894. WHO Geneva June 1997

41
WHO. World Health Organisation. (2000). Obesity: Preventing and managing the global epidemic. Report of a WHO consultation. WHO technical Report series 894. Retrieved from http://whqlibdoc.who.int/trs/WHO_TRS_894.pdf
WHO. World Health Organisation. (2001). The world health report 2001 ‐ Mental Health: New Understanding, New Hope. Retrieved from http://www. who.int/whr/2001/en/
WHO. World Health Organisation. (2002). Reducing Risks, Promoting Healthy Life. Retrieved from http://www.who.int/whr/2002/en/
WHO. World Health Organisation. (2004). Global Recommendations on Physical Activity for Health. 57th World Health Assembly. Retrieved from: http://www.who.int/dietphysicalactivity/trategy/eb11344/strategy_english _web. pdf
WHO. World Health Organisation. (2006). Physical activity and health in Europe: evidence for action. N. Cavill, S. Kahlmeier & F. Racioppi. Retrieved from http://www.euro. who.int/__data/assets/pdf_file/0011/87545/E89490.pdf
WHO. World Health Organisation. (2009). Global health risks: mortality and burden of disease attributable to selected major risks. Geneva 27, Switzerland. Retrieved from http://www.who.int/healthinfo/global_burden_disease/GlobalHealth Risks_report_full.pdf
WHO. World Health Organisation. (2010). Global Recommendations on Physical Activity for Health. Geneva 27, Switzerland. Retrieved from: http://whqlibdoc. who.int/publications/2010/9789241599979_eng.pdf
WHO. World Health Organisation. (2013). Obesity and Overweight. Fact sheet N°311. Retrieved from: http://www.who.int/mediacentre/factsheets/fs311/en/

42
Research Article
Title Paper 2:
Is Physical Inactivity Related to Weight Status in a Sample of Maltese Adult Population?
Word count: 4683
Key words: Physical activity; IPAQ; Body Mass Index; Waist Circumference

43
Choice of Journal
Rationale
The present research examines the relationship between physical activity levels and
weight status of a Maltese adult sample. The Journal of Physical Activity and Health
accepts papers that examine the behaviour, community and environmental
interventions that may affect physical activity on an individual and/or population basis.
Thus, the present research is deemed to be in conformity with the requirements
requested by the journal.

44
Abstract Research Project
Objective: The aims of this study are to present information regarding PA levels and
body composition based on body mass index (BMI) and waist circumference (WC) in a
sample of Maltese adults and to investigate if there is a relationship between physical
activity (PA) levels, BMI and WC and to explore any association between these
variables and the subjects’ socio‐demographic characteristics.
Method: Four hundred sixteen (416) Maltese citizens between the ages of 18‐65 years
filled in the International Physical Activity Questionnaire (IPAQ) long form and a
general information sheet and were subjected to anthropometric measurements. Chi‐
squared and analyses of variance with post hoc analysis were used to investigate
possible association between socio‐demographic variables with BMI, WC risk level and
PA level. Chi‐squared tests and ANOVA were used to determine whether there is
relationship between PA levels, BMI, WC risk and total sitting time.
Results: No significant relationship was found using the X2‐test between PA levels and
BMI (X2=0.440, df=4, p=.979) and between PA levels and WC risk levels (X2=1.748, df =
4, p=.078). A significant association was found between WC risk level and age (X2
=40.259, df=8, p=.000) and education (X2 =10.583, df=4, p=.032). BMI was found to be
associated with gender (X2 = 18.079, df = 2, p =.000) and depended on age (X2 =27.472,
df=8, p=.001). BMI and WC were strongly associated (rs=.742, p=.000).
Conclusion: No significant relationship was found in this research between PA levels
measured using IPAQ long form and BMI or WC risk level. Forty two %, 39% and 19%
of the respondents were classified in moderate, high, and low levels of PA respectively.
However, given the extent of misreporting in many PA surveys, it remains unclear
whether these high PA levels observed reflect reality and whether the cutpoints for
the IPAQ classification of PA are too low.

45
2.0 Aims and Significance of the Research
The high rates of physical inactivity and excess weight among the Maltese
population is of great concern. Studies on PA and obesity prevalence in the Maltese
adult population are limited (National Health Interview Survey [NHIS], 2003; European
Health Interview Survey [EHIS], 2008; European Health Examination Survey [EHES]
pilot study 2010; European Commission [EC], 2004, 2006, 2010), thus, awareness of
the potential impact of PA on weight in Malta is unclear. Therefore, the information
provided by this research can be a valuable addition to the existing limited literature
and can be beneficial in designing and implementing effective health promotion
programmes targeting individuals of different age groups.
2.01 The primary aims of the research
a) To present information about the PA profile and weight status of a sample of
adult Maltese population.
b) To explore if there is a relationship between participants BMI categories in
relation to their PA levels based on the scoring in the IPAQ (long form).
c) To explore if there is a relationship between participants WC class in relation to
their PA level based on the scoring in the IPAQ (long form).
d) To investigate the influence of socio‐demographic measures, including, age,
gender and education level on PA and WC and BMI.

46
2.02 Ethical approval
Ethical approval was granted from the Faculty of Applied Sciences, Research
Ethics Committee at the University of Chester, UK (A1). All participants gave informed
consent before participation in accordance with the ethical guidelines.
2.03 Hypothesis of the research
The research null hypothesis (HO) could be stated as follows:
HO1: There is no significant relationship between PA levels (IPAQ) and BMI.
HO2: There is no significant relationship between PA levels (IPAQ) and WC.
2.1 Method 2.1.1 Participants
Clients, members from a social club, friends and others who were invited to
participate in the study constituted the sampling frame. To be eligible, subjects had to
be Maltese citizens, not pregnant and between the ages of 18‐65.
2.1.2 Sample size and response rate
Four hundred sixty questionnaires were distributed, to Maltese citizens, of
which 436 were collected. Out of these, nine were excluded as they were outliers,
with more than 960 minutes of PA per day (IPAQ, 2005a). Another 11 were excluded
as they had a missing sheet or were not properly filled in. This formed a response rate
of 90%, of which 182 were men (44%) and 234 were women (56%) for a total of 416
respondents (N=416, 100%).

47
2.1.3 Research methods
Participants were given a “recruitment” and an “information” sheet which
included information about the purpose of the research, confidentiality, voluntary
participation and the ability to withdraw at any time without explanation (A5 and A6).
A consent form was signed by all participants before anthropometric measures were
taken by the author (A7). A translated Maltese version of IPAQ long form (A 8b) was
distributed. The English version was also available (A 8a). A general information sheet
was included with the IPAQ, asking for self‐reported socio‐demographic questions
(gender, age, education level and status). Most participants answered the
questionnaire there and then and some returned it within 15 days. The questionnaires
were checked for completion and fully completed questionnaires were allotted a
number based on the order in which they were received from participants (A4). The
data was then entered into SPSS for analysis and outliers were removed (A9), as
indicated by guidelines for data processing and analyses of the IPAQ (2005a).
2.1.4 Translation of IPAQ
The “forward‐backward” (IPAQ, 2005b) standard procedure was used to
translate the IPAQ long form from English to Maltese according to the instructions
given in the IPAQ manual for reliability and validity (IPAQ, 2005b). A final version was
provided with some minor changes applied to make the questions more culturally
relevant to the Maltese environment (A3). A small pilot test (A8b) involving ten
participants was administered to test the IPAQ long form in Maltese, to check that it
took about fifteen minutes to answer and to tackle any difficulties.

48
2.1.5 IPAQ long from
The IPAQ has been tested for reliability and validity and used internationally
and in different settings (Ali‐Vasheghani‐Farahani, et al., 2011; Bauman et al., 2009;
Bauman & Marshal, 2001; Craig et al., 2003; Hagströmer, Oja, & Sjöström, 2007; Lee,
Macfarlane, Lam & Stewart, 2011; Van der Ploeg et al., 2010).
IPAQ long form assesses PA in four domains (work, transport, home and
leisure). Additionally, it measures the minutes of total sitting time in a weekday and in
a weekend day, separately (including sitting whilst travelling). Only PA lasting 10
minutes should be recorded. The IPAQ data were converted into metabolic equivalent
(MET) scores according to the activity (vigorous activity, moderate activity and
walking) and multiplied by the duration (in minutes) of the activity per week (MET‐
min/wk). A total PA score was then calculated by summing up the MET score over the
different activities (IPAQ, 2005a). The average MET value for walking is 3.3, 4 for
moderate intensity and 8 for vigorous activity. Cycling and vigorous garden activities
are coded as moderate–intensity activities (MET value of 6 and 5.5). The PA levels
were recoded into three categorical scores corresponding to low, medium and high
levels of PA (IPAQ, 2005a).
2.1.6 Anthropometric measures.
After signing the consent form, each participant was measured by the author
for body weight, height and WC, following the same order for every participant, to
avoid examiner variability and to reduce misreporting of weight, height and WC which

49
is common in self‐reporting questionnaires (Gorber, Tremblay, Moher, & Gorber, 2007;
Rothman, 2008). For all anthropometric measurements, the subjects were in light
clothes, bare feet or light socks, with weight evenly distributed on both feet, arms by
the sides, and looking straight ahead. Body weight was measured to the nearest 0.1 kg
using electronic scales (Weylux 284 BMI). Height was measured to the nearest 0.5cm
using a portable stadiometer (Seca 213). The headboard of the stadiometer was
positioned so that it touched the highest point of the head. WC was measured using
waist watcher tape to the nearest 0.5cm. At the end of expiration, with abdomen
relaxed, the subjects were measured with the measuring tape placed horizontally at
about the level of the umbilicus between the last rib and the iliac crest as suggested by
Lean, Hans & Morrison (1995). BMI was calculated as weight in kilograms (kg) divided
by squared height in meters (m2) and individuals were classified as underweight (BMI
<18.4 kg/m2), normal weight (BMI between 18.5 and 24.9 kg/m2), overweight ( BMI
between 25 and 30 kg/m2) or obese (BMI > 30 kg/m2).
The main criteria for the selection of IPAQ, BMI and WC as instruments to
measure PA levels and weight status were that they had to be practical, quick, valid,
reliable, applicable to large groups, cost effective, of low subject burden and of
minimal discomfort to participants and that they required no sophisticated equipment.
(Craig et al., 2003; Flegal et al., 2009; Janssen et al., 2002; NICE, 2006).

50
2.1.7 Statistical analysis
After having defined all variables in the questionnaire, all data were entered
into SPSS spread sheet (data editor) accordingly. The Statistical Package for Social
Sciences (SPSS) version 20 for Windows (SPSS Inc., Chicago, IL) was used for all data
analyses. The continuous PA scores obtained from the IPAQ long form were converted
into METs‐min/wk, and were computed for each subject according to the IPAQ scoring
guidelines. PA was also recoded into three categories of PA levels (low, moderate and
high), for categorical analysis using Chi‐squared (X2) test (Table 2 and 3). PA score was
also transformed logarithmically, to restore the variable to normality. This enables the
use of classical analysis of variance on the transformed version of such variable. The
data’s normality of distribution was checked using Kolmogorov‐Smirnov test (Table
B6), whilst Levene’s statistic was used to check homogeneity of variance. The
logarithmic transformation was applied to the average daily sitting time. Means and
confidence intervals of these variables could be obtained for each group by
transforming the logged variable back to the original.
Analysis of variance, both parametric and non‐parametric, was used to test for
dependence of PA and sitting time on the various grouping variables. Post‐hoc tests
were used to determine which groups differed from each other.
For variables that were nominal or ordinal the X2 test was used to investigate if
there is an association between subjects’ anthropometric measures (BMI and WC risk),

51
and their socio‐demographic characteristic (age, gender, education level) (Table 1 and
Table B2 and B3 ).
The level of statistical significance (alpha level) was set at a < 0.05, while all p
values two‐tailed (Franks & Huck, 1986). Continuous variables are presented as mean
± standard deviation (SD), and/or medians and quartiles. In the case of transformed
variables, PA and sitting time 95% confidence intervals (95% C.I.) are presented instead
of the SD. Categorical variables are presented as frequencies (numbers of subjects)
and relative frequencies (percentages).
2.2 Results
2.2.1 Descriptive Characteristics of Research Subjects
Socio‐demographic and anthropometric characteristics of the participants are
presented in Table 1. In all, 416 participants were eligible, 182 (44%) males and 234
(56%) females. Overall, the mean ± SD for weight, height, BMI, WC was 78.4 (±18) kg,
165.9 (± 9.6) centimetres (cm), 28.4 (±5.2) Kg/m2, and 92 (±14.2) cm, respectively
(Table 1).
No subjects were underweight, 30%, 37% and 33% of the respondents were of
normal weight, overweight and obese respectively (Table 1). This makes 70% of the
subjects overweight or obese of which 2.4% were morbidly obese. Cross tabulation of
BMI by gender shows a significant association (p < .000) between these two variables
(43% males obese as opposed to 26% females). No significant association was found

52
between BMI and education (p = .407) although the % of overweight and obese
subjects seems to decrease from 86% in the primary education group to 66% in the
tertiary group (Table B2). Conversely, in the cross tabulation of BMI by age (Table B2)
the proportion of obese subjects seems to increase with age, starting from 18% of the
18‐24‐year‐olds, and gradually increasing to 54% of 55‐65‐year‐olds (p= .001). This can
also be seen in Figure 1.
Figure 1: Percentages of normal, overweight and obese subjects according to age group
As for the WC risk, 35%, 22% and 43% were of low risk, increased risk and high
risk respectively (Table 1). However, no association was found between WC risk class
and gender (p = .094, Table 1 and Figure B3). Furthermore the table of WC risk by
education (Table B3), shows that higher level of education is associated with less WC
risk, although this effect is not large (p = .032) and the proportion of subjects at high
WC seems to increase with age (p = .000, Table B3).
0
10
20
30
40
50
60
18‐24 25‐34 35‐44 45‐54 55‐65
Percentages of normal, overweight and obese subjects according to age group
Normal Overweight Obese

53
Table 1: Anthropometric characteristics of research subjects by gender
Gender Total N=416(100%)
Males n=182 (44%)
Females N=234 (56%)
Mean (±SD) Quartiles
Mean (±SD) Quartiles
Mean (±SD) Quartiles
Body Height (cm) †
165.9(±9.6) 158.0, 164.5, 173.5
173.4 (±7.7) 168.4, 174.3, 178.6
160.0 (±6.2) 156.0, 159.1, 163.6
Body Weight (kg) †
78.4(±18) 65.2, 75.9, 90.0
88.9 (±16.9) 76.2, 87.0, 98.1
70.3 (±14.2) 59.1, 68.1, 77.5
BMI (Kg /m‐2) †#
28.4 (±5.2) 24.1, 27.7, 32.0
29.6 (±5.4) 25.4, 29.0, 33.0
27.4 (±5.0) 24.0, 26.2, 30.0
WC(cm) † 92 (±14.2) 82.0, 90.8, 102.9
97.9 (±13.1) 86.9, 96.5, 107.0
87.5 (±13.5) 77.0, 85.8, 96.1
For all variables, Kruskal‐Wallis test is significant; p < 0.000
BMI CLASS N (%) n (%) n (%)
Normal Weight (18.8‐24.9 Kg/m2) ‡
123 (30%)
38 (21%) 85 (36%)
Overweight (25.0‐ 29.9 Kg/m2) ‡
154 (37%) 65 (36%) 89 (38%)
Obese (>30 Kg/m2) ‡
138 (33%) 79 (43%) 60 (26%)
TOTAL 416 (100%) 182 (100%) 243 (100%)
Significant: X2 = 18.079, df = 2, p = 0.000
WC Class N (%)
n (%)
n (%)
Low risk‡‡ 146 (35%)
74 (41%)
72 (31%)
Increased risk ‡‡ 93 (22%) 35 (19%)
58 (25%)
High risk ‡‡ 177 (43%) 73 (40%) 104 (44%)
TOTAL
416 (100%)
182 (100%)
234 (100%)
Not Significant: X2 = 4.179, df = 2, p = 0.094
*Definition of abbreviations and symbols: N= number of subject in total, n= number of subjects in subgroups, SD =standard deviation, cm =centimetres, m= metres, kg= kilograms, BMI =body mass index, WC = waist circumference. †# Measured BMI was calculated using physical measures of height and weight
† Anthropometric characteristics are presented as means ± SD.
‡ Cell frequencies of BMI by gender are presented, together with % within gender. ‡‡Cell frequencies of WC class are presented, together with % within gender.

54
2.2.2 Physical activity levels analysis
On the basis of IPAQ long form classification criteria (A9), surprisingly, 163
(39%), 176 (42%), 77 (19%) of subjects were classified as highly active, moderately
active and low physically active (sedentary) respectively (Table B5 and Figure B1).
Tables 2 and 3 shows the descriptive statistical analysis for PA scores in relation to BMI
and WC risk (respectively), where the median and means of PA levels and PA
continuous scores as well as total sitting time are presented.
2.2.2.1 IPAQ results by BMI and WC
Surprisingly, the highest PA score (median 2473MET ‐min/wk) was observed
among the overweight subjects, while, as expected, the lowest score (median
1915MET‐min/wk) was observed among the obese. However, the medians of the
three BMI categories were quite similar and the difference between them was not
statistically significant (p = .979, Table 2). There was no dependence of sitting time on
BMI (p > .05). However, as expected, the obese had the highest mean for total sitting
time relative to the other BMI groups, and lowest medians in all PA scores or sub‐
scores.
No significant dependence was found between PA level and WC risk (p = .078)
and total sitting time by WC risk (p > .05, Table 3). Only vigorous PA score was
significant (p = 0.000).

55
Table 2: IPAQ results by BMI (N=416)
BMI: Normal Overweight Obese Total PA level n (%) N (%) N (%) N (%)
Low PA levels † †
22 (29%) 28 (36%) 27 (35%) 77 (100%)
Mod PA levels†† 53 (30%) 63 (36%) 60 (34%) 176 (100%) High PA levels † †
48 (29%)
63 (39%)
52 (32%)
163 (100%)
PA by BMI is not significant: X2 = 0.440, df = 4, p = 0.979; rs = ‐0.018, p = 0.716.
IPAQ Continuous scores PA scores (METs‐ min/week)
Median Quartiles
Median Quartiles
Median Quartiles
Median Quartiles
Total PA score † 2214
933‐4428 2473
1214‐4115 1915
912‐ 4326 2164
975‐4305
Total Vig PA score †
00 0‐800
00 0‐510
00 0‐400
00 0‐480
Total Mod PA score†
1080 240‐2400
1230 270‐2535
840 120‐2400
1010 240‐2520
Total Walk PA score †
495 132‐1089
594 124‐1312
445 99‐1386
495 132‐1283
Total sit min/day #
330 163‐451
326 197‐460
330 197‐489
328 190‐463
For all variables by BMI, Kruskal‐ Wallis tests are not significant: p > 0.05
Variables Mean 95% C.I.
Mean 95% C.I.
Mean 95% C.I.
Mean 95% C.I.
Total Sit min/day #
314 282‐347
322 296‐350
335 304‐368
324 307‐342
Total PA ## Score MET min/wk
2080 1697‐2532
2224 1885‐2614
1987 1646‐2385
2100 1891‐2328
Oneway ANOVA on BMI is not significant: for both variables p > 0.05 Definition of abbreviations and symbols: n= number of subjects in subgroups, C.I. = confidence interval of mean, PA= physical activity, Vig = vigorous physical activity, mod = moderate physical activity, Total sit min/day= total sitting and sitting travel time in minutes per day, min/wk = minutes per week.
† † Cell frequencies of PA by BMI are presented, together with % within PA group.
† IPAQ continuous score total PA score, total Vig PA score, total Mod PA score, and total walk score data are presented as METs ‐ min/week in medians and quartiles.
# Daily sitting, including travel sitting time per day, presented in minutes/day as means and 95% C.I.
## Average PA per week is presented in MET‐min/week as means and 95% C.I.

56
Table 3: IPAQ results by WC (N=416)
WC: Low Risk
Increased Risk
High Risk
Total
PA levels n (%) n (%) n (%) n (%)
Low PA levels † † 28 (36%) 14(18%) 35 (46%)
77 (100%)
Mod PA levels† † 61 (35%) 38 (22%) 77 (44%) 176 (100%) High PA levels † †
57 (35%)
41 (25%)
65 (40%)
163 (100%)
PA by WC is not significant: X2 = 1.748, df = 4, p = .078; rs = ‐ .023, p = .641
IPAQ Continuous scores PA scores (METs‐ in/week)
Median Quartiles
Median Quartiles
Median Quartiles
Median Quartiles
Total PA score † 2198 953‐4591
2490 925‐4069
2052 1052‐4239
2164 975‐4305
*Total Vig PA score†
00 0‐1440
00 0‐480
00 0‐240
00 0‐480
Total Mod PA score†
720 233‐2160
1410 263‐2520
900 215‐2730
1010 240‐2520
Total Walk PA score †
553 124‐1436
545 107‐990
396 116‐1386
495 132‐1283
Total sit min/day#
349 223‐498
300 184‐459
317 180‐458
328 190‐463
*For Vig, Kruskal‐ Wallis test is significant by WC: p = .000; All the other variables not significant by WC: p > .05.
Variables Mean 95% C.I.
Mean 95% C.I.
Mean 95% C.I.
Mean 95% C.I.
Total Sit min/day #
345 315‐376
301 269‐335
319 293‐347
324 307‐342
Total PA Score MET min/wk##
2151 1769‐2600
2103 1708‐2572
2058 1760‐2398
2100 1891‐2328
Oneway ANOVA on WC is not significant: for both variables p > .05 Definition of abbreviations and symbols: n= number of subjects in subgroups, C.I. = confidence interval of mean, PA= physical activity, Vig = vigorous physical activity, mod = moderate physical activity, Total sit min/day= total sitting and sitting travel time in minutes per day
† † Cell frequencies of PA by WC are presented, together with % with the PA group.
† IPAQ continuous score total PA score, total Vig PA score, total Mod PA score, and total walk score data are presented in METs ‐ min/week, as medians and quartiles.
# Daily sitting including travel sitting time per day is presented in minutes/day as means and 95% C.I.
## Average PA per week is presented in MET‐ min/wk as means and 95% C.I.

57
2.2.2.2 BMI and WC
As expected, there is a significant relation between BMI and WC risk (Table B4).
A high association between the two variables was found, with 81% of subjects with
normal weight falling in the low WC risk category and 86% of the obese falling in the
high WC risk group. For this table, X2 = 250.957, df = 4, p = .000 and Spearmans’
correlation rs = .742, p = .000.
2.2.3 Physical activity in the separate domains
The medians and quartiles of the four PA domains and sub‐scores (walking,
moderate and vigorous PA) are presented in Table 4. All four domains have a quartile
0, implying that at least 25% of the respondents were not physically active in each of
the domains. The work domain had a median of 0 indicating that at least half the
respondents did not do any PA at work. This is true also for the vigorous activity sub‐
score (totalscoreva).
The median for total ‘travelmet’ (walking or cycling for non‐leisure purposes) is
only 90.8MET‐min/wk, which is equivalent to 4 minutes walking daily. Similarly,
‘totalscorewalk’ (total walking for leisure, work and other purposes) has a median of
495MET‐min/wk, which is equivalent to about 21 minutes walking daily. Sitting time
(including sitting during travel) has a median of 327.9 min/day which is equivalent to
5.47 hours/day. This reflects a rather sedentary lifestyle.

58
Table 4: Medians and Quartiles for all respondents of four PA domains, PA subscores and daily sitting time. (N=416).
Variable Lower Quartile Median Upper Quartile
PA domains MET‐ min/week
Totalworkmet totaltravelmet totalgarhommet totalleismet
0.0 0.0 0.0 0.0
0.0 90.8 360.0 240.0
990.0 396.0 1410.0 1039.5
PA sub‐scores MET‐ min/week
Totalscorewalk totalscoremod totalscorevig
132.0 240.0 0.0
495.0 1010.0 0.0
1282.9 2520.0 480.0
PA total MET‐ min/week
Totalpascore 975.0 2163.8 4305.0
Daily sitting Min/day
Sittotal 190.2 327.9 462.9
This is also confirmed by the number of subjects with 00MET in the various
domains as shown in Figure B2. A striking 276 (66%) and 67 (16%) subjects reported
no vigorous and no moderate PA (00 METs) respectively and a further 90 (22%)
subjects reported no (00METs) walking in a week (from all domains).
The above considerations contrast with the frequencies in Table B5, where,
according to the criteria of IPAQ (IPAQ, 2005), a high proportion of subjects are
classified as moderately active (42%) and highly active (39%) with only 19% being
categorised as low PA.
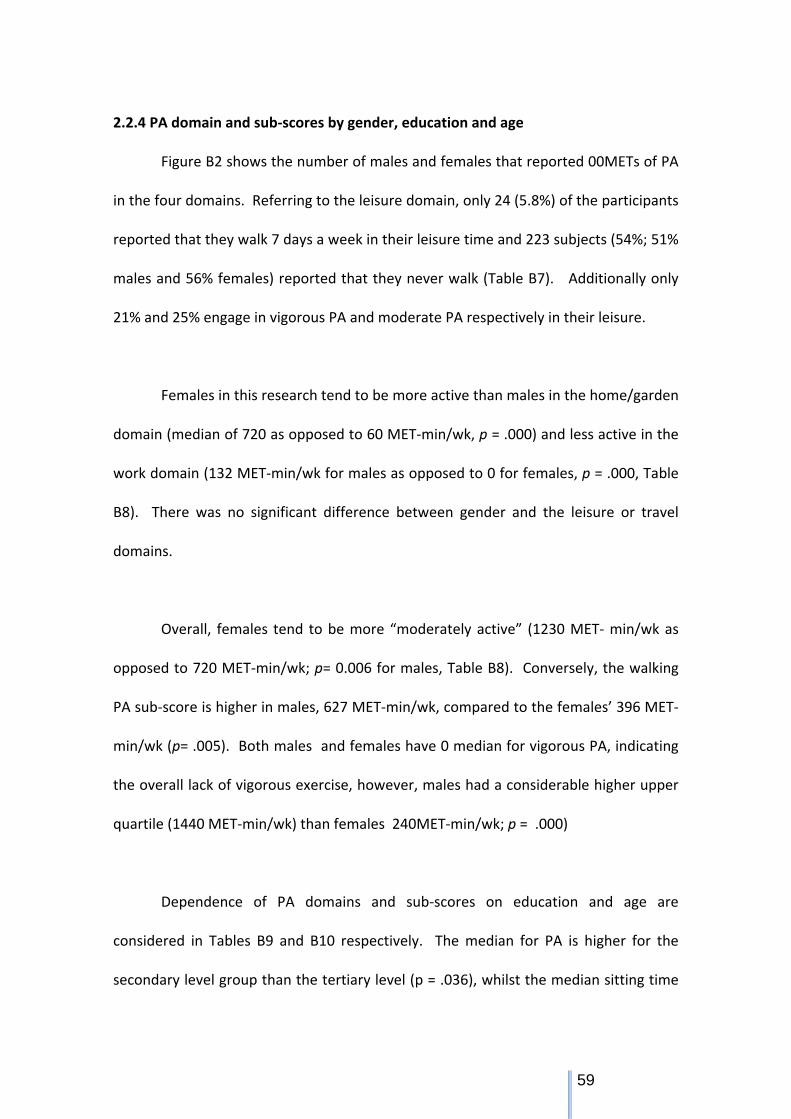
59
2.2.4 PA domain and sub‐scores by gender, education and age
Figure B2 shows the number of males and females that reported 00METs of PA
in the four domains. Referring to the leisure domain, only 24 (5.8%) of the participants
reported that they walk 7 days a week in their leisure time and 223 subjects (54%; 51%
males and 56% females) reported that they never walk (Table B7). Additionally only
21% and 25% engage in vigorous PA and moderate PA respectively in their leisure.
Females in this research tend to be more active than males in the home/garden
domain (median of 720 as opposed to 60 MET‐min/wk, p = .000) and less active in the
work domain (132 MET‐min/wk for males as opposed to 0 for females, p = .000, Table
B8). There was no significant difference between gender and the leisure or travel
domains.
Overall, females tend to be more “moderately active” (1230 MET‐ min/wk as
opposed to 720 MET‐min/wk; p= 0.006 for males, Table B8). Conversely, the walking
PA sub‐score is higher in males, 627 MET‐min/wk, compared to the females’ 396 MET‐
min/wk (p= .005). Both males and females have 0 median for vigorous PA, indicating
the overall lack of vigorous exercise, however, males had a considerable higher upper
quartile (1440 MET‐min/wk) than females 240MET‐min/wk; p = .000)
Dependence of PA domains and sub‐scores on education and age are
considered in Tables B9 and B10 respectively. The median for PA is higher for the
secondary level group than the tertiary level (p = .036), whilst the median sitting time

60
is higher for the tertiary level than for the secondary one (p = .000). The medians and
quartiles are all presented in Table B9. Respondents in the youngest group (18‐24‐
year‐ olds) are the least active and have the longest daily sitting time, while the older
respondents are more active (Table B10).
2.3 Discussion
Apart from presenting information regarding the PA profile and weight status
of a sample of adult Maltese population, the main purpose of this research was to
investigate if there is a relationship between PA and weight status (BMI and WC) and if
there is an association between socio‐demographic factor of education, age and
gender in relation to PA, BMI and WC.
Based on the research findings, no subjects were underweight and 70% of the
study population were classified as overweight or obese. Other Maltese studies
indicate that 67% (MONICA, 1984 as cited in DHIR, 2012), 57% (EHIS, 2002), 59% (EHIS,
2008), 66 % (EHES pilot study, 2010), of the subjects were overweight and obese. This
shows a slight increase in the percentage of overweight/obese persons in Malta over
the period of 2002 and 2013.
The EHES pilot study (DHIR, 2012) which presents measured weight, height and
WC (like the present research) indicates a discrepancy between self‐reported
measures of obese BMI calculations in EHIS, 2008 (DHIR, 2008) and EHES pilot study,
2010 of 6.8%. This underestimation of self‐reported measures was more pronounced

61
in females with a 10% less being classified as obese in EHES (2008). The
underestimation of BMI based on self‐reported data was reported in other studies
(McAdams, Van Dam, & Hu, 2007; Pirie, Jacobs, Jeffery, & Hannan, 1981; Wing,
Epstein, Ossip, & La Porte, 1979). In the present study, in both men and women, high
prevalence of overweight and obesity occurred in all ages especially those over 25
(Figure 1 and Table B2). Similar to the EHIS (2008) and EHES pilot study (2010) more
Maltese men were reported to be obese, with 43% of males and 26% of females in the
obese category (Table 1).
The mean WC of the present study for males and females was 97.9cm and
87.4cm respectively, both in the ‘increased risk’ category. This is 1.3cm more for the
males and 1.9cm less for the females compared to the EHIS (2010) pilot study which
seems to be the only Maltese study which measures WC (DHIR, 2012). When
categorising the WC measurements according to the risk thresholds, 44% of the
women are in the high risk category compared to 40% of males, and more males (41%)
are in the low risk group compared to females (31%, Table 1). This same 10%
difference was reported in the EHIS pilot study (2010).
No significant correlation was found between the PA levels of the participants
(IPAQ long form) and BMI and WC risk. This implies that all subjects, regardless of BMI
and WC class, had similar PA profiles. Nevertheless, this observation contrasts existing
literature based on an objective measure of PA assessment that indicates that obese
subjects tend to be less physically active than overweight and normal weight subjects

62
(Davis, Hodges & Gilham, 2006; Tudor‐Locke et al, 2010). Furthermore, contrary to
the author’s expectations, PA levels, as presented in this study, are generally higher
than those reported in other studies involving Maltese adult population. However, the
other Maltese studies did not use the IPAQ long form in their study, hence, proper
comparison can be difficult. The high PA prevalence reported in this research is likely
to be related to everyday living rather than PA at leisure. Looking at PA levels in the
leisure domain, only 21% and 25% reported vigorous activity and moderate activity
and 54% reported that they never walk in their leisure time. Furthermore, it was
estimated that the subjects in this sample only walked a total of about 21 minutes
daily (median 495MET‐min/week) which is 15 minutes less then what was reported in
the EC, (2006). Additionally, a striking 62% reported 00MET at work in the last seven
days, similar to the EC (2006) where 63% of the Maltese respondents reported no PA
at work in the last seven days.
A significant difference was found between gender and work domain and
gender and house/garden domain (Table B8). Females seem to be more moderately
active than males in the home/garden domain. This is expected especially when
considering the fact that 74% of those who are non‐employed are females. Males
seem to be more highly active than females especially in the work domain. These
findings seem to be consistent with previous studies (EHIS, 2008; CDC, 2004; Forrest et
al., 2001; Ali‐Vashaghani et al., 2011). However, one cannot rule out the over‐
reporting of self‐reporting PA (Graff‐Iversion et al., 2007; Rzewnicki et al., 2003) and
the difficulty of some subjects in distinguishing between vigorous and moderate PA

63
(Craig et al., 2003; Slattery & Jacobs, 1995; Slootmaker, Schuit, Chinapaw, Seidell &
Van Mechhelen, 2009).
The proportion of the research subjects who were sufficiently and vigorously
active, based on three or more days of vigorous intensity activity of at least 20
min/day, was 39% (43% males and 36% females). A further 42% (37% males and 47%
females) reported sufficient moderate and walking activity based on five or more days
of moderate intensity activity and walking of at least 30 min/day. The prevalence of
high PA category estimates from IPAQ was reported by other investigators (Brown,
Bauman, Chey, Trost, & Mummery, 2004; Graff‐Iversen et al., 2007; Rzewkicki et al.,
2003). This could be due to the overreport of PA when using IPAQ long form when
compared to other objective measures of PA (Rzewnicki et al., 2003; Sallis & Saelens
2000) and due to the fact that IPAQ long form gives more precise PA quantification as
it provides more detailed information and measures four domains of PA (IPAQ, 2005a).
One can aslo question whether the cutpoints for the IPAQ classification of PA are too
low.
2.3.1 Limitations and Strengths
Limitations of the research have to be acknowledged before interpreting the
results of this study. Although 416 is a good sample, it is a convenient sample rather
than a random sample, since any subject who wanted to take part was welcome. This
may have inflated the estimates therefore caution should be exercised in generalising
the results.

64
For practical reasons the IPAQ questionnaire was used to assess PA. However,
self‐reporting of PA is a key concern in how accurately the subjects reported their
habitual PA in the last seven days. Self‐reporting questionnaires are subjective and
prone to recall bias, social desirability and misreporting (Adams et al., 2005; Maddison
et al., 2007; Prince et al., 2008; Rzewnicki et al., 2003; Slootmaker et al., 2009).
Besides, the fact that most daily activities are sporadic may lead to inaccurate recall
and significant overestimation of time spent on daily activity (Slootmaker, et al., 2009).
Furthermore, less fit individuals can rate activities at higher intensity than more fit
individuals (Montoye, Kemper, & Saris, 1996). These factors may have led to
misclassification of the true PA levels.
In addition, the research outcomes may have been influenced by seasonality in
PA patterns, since the data were collected in Malta in early June (2013), when it starts
to be too warm to exercise. The opposite could happen in cooler countries, where
some people might start to exercise more as warmer weather and longer day light
hours can motivate people to be more physically active, spending more time outdoors
in activities such as gardening and walking (Buchowski et al., 2009; Chan, & Ryan,
2009; Dannenberg, Keller, Wilson, & Castelli, 1989; Graff‐Iversen et al., 2006; Tucker &
Gilliland, 2007). Furthermore, the fact that in this research, most of the respondents
were from the more rural North of Malta, may have affected the results, because as
the EC (2006) indicate, respondents from rural parts are more likely to perform
vigorous activities.

65
Overweight and obesity were measured indirectly by measuring body weight
BMI and WC which, although conducted by the author to reduce bias, might not have
captured variations in fat and fat free body mass (Frankenfield, Rowe, Cooney, Smith,
& Becker, 2001).
The study has important strengths. Anthropometric measures were done by
the author following the same pattern with each subject to reduce examiner variability
and bias of self‐reporting measurements. Finally, IPAQ long form provides more
precise PA quantification as it gives detailed information on the four PA domains as
well as total sitting time (IPAQ, 2005a; Van der Plog et al., 2010). Furthermore, IPAQ
long form is a translated, internationally recognised questionnaire which is reliable and
validated, (Craig et al., 2003) while the few other studies assessing PA in Maltese
subjects have used PA questionnaire designed especially for their study or the IPAQ
short form.
2.3.2 Recommendations for future action and research
In view of the lack of epidemiological data regarding PA levels and weight
status of the general Maltese adult population, future nationwide representative
sample studies and investigations, using a combination of different, objective, valid
and reliable measures of PA and obesity, are required. Stronger evidence and research
on both PA and obesity prevalence in the Maltese population can help public health
policy makers in Malta design and implement effective prevention and health
promotion strategies to combat obesity, sedentarism and to enhance physical fitness

66
in Maltese adults catering for different ages and needs. Policy makers should take into
consideration the obesogenic environment, biological, psychological, behavioural, and
socioeconomic factors of the Maltese islands that can affect obesity and PA
participation.
2.3.3 Conclusion
In conclusion, the results of this analysis show that 70% of the study population
are overweight or obese. No significant relationship was found in this population
between PA levels (IPAQ long form) and BMI or WC. However, given the extent of
misreporting in many PA surveys it remains unclear whether the high PA levels
observed in this research reflect reality and whether the cutpoints for the IPAQ
classification of PA are too low. Both BMI and WC risk seem to depend on age, whilst
BMI also depends on gender. Sitting time seems to decrease as PA increases, with the
younger subjects (18‐24‐year‐olds) and subjects from the tertiary education group
have considerably longer sitting times. The fact that more participants (especially
females) are in the high risk WC class than the BMI of obesity suggests that WC can
give an earlier indication to start treating obesity. Thus, like previous studies, this
research supports the need to measure WC, as well as, BMI in clinical and research
settings to evaluate better the health status in both sexes (Dagan et al., 2013, NICE,
2006). The current findings contribute to the growing body of evidence that indicates
that age is related to BMI and WC risk class, thus indicating that public health
campaigns should consider targeting different age groups separately to combat weight
problems and lack of PA.

67
References Research Project
Adams, S. A., Matthews, C. E., Ebbeling, C. B., Moore, C. G., Joan, E., Fulton, J., & Hebert, J. R. (2005). The effect of social desirability and social approval on self ‐reports of Physical Activity. American Journal of Epidemiology, 161(4), 389–398. Doi:10.1093/aje/kwi054.
Ali Vasheghani‐Farahani, A., Tahmasbi, M., Asheri, H., Ashraf, H., Nedjat, S, & Kordi, R. (2011). The Persian, Last 7‐day, Long form of the International Physical Activity Questionnaire: Translation and Validation Study. Asian Journal of Sports Medicine, 2(2), 106‐116. Retrieved from http://www.ncbi.nlm.nih.gov/pmc/ articles/PMC3289200/#
Bauman, A., Bull, F., Chey, T., Craig, C. L., Ainsworth, B. E., Sallis, J. F., … Pratt. M. (2009). The International Prevalence Study on Physical Activity: results from 20 countries. The International Journal of Behavioural Nutrition and Physical Activity, 6, 21. Doi:10.1186/1479‐5868‐6‐21
Bauman, A. & Marshal, A. (2001). The International Physical Activity Questionnaire : Summary Report of the Reliability & Validity Studies. Produced by the IPAQ Executive Committee, 1–25. Retrieved from: http://www.ipaq.ki.se/ questionnaires/IPAQSummaryReport03‐01.pdf
Brown, W., Bauman, A., Chey, T., Trost, S., & Mummery, K. (2004). Comparison of surveys used to measure physical activity. Australian and New Zealand Journal of Public Health, 28(2), 128‐34. Retrieved from: http://www.ncbi.nlm.nih.gov/ pubmed/15233351
Buchowski, M. S., Choi, L., Majchrzak, K. M., Acra, S., Charles, E., & Chen, K. Y. (2009). Seasonal Changes in Amount and Patterns of Physical Activity in Women. Journal of Physical Activity and Health, 6(2), 252–261. Retrieved from http:// www.ncbi.nlm.nih.gov/pmc/articles/PMC2800047/pdf/nihms163011.pdf
Chan, C. B., & Ryan, D. A. (2009). Assessing the effects of weather conditions on physical activity participation using objective measures. International Journal of Environmental Research and Public Health, 6(10), 2639–54. Doi: 10.3390/ijerph6102639
Craig, C. L., Marshall, A. L., Sjöström, M., Bauman, A. E., Booth, M. L., Ainsworth, B. E., … Oja, P. (2003). International physical activity questionnaire: 12‐country reliability and validity. Medicine and Science in Sports and Exercise, 35(8), 1381–1395. Doi:10.1249/01.MSS.0000078924.61453.FB

68
Dagan, S. S., Segev, S., Novikov, I., & Dankner, R. (2013). Waist circumference vs. body mass index in association with cardiorespiratory fitness in healthy men and women: a cross sectional analysis of 403 subjects. Nutrition Journal, 12(1), 12. Doi:10.1186/1475‐2891‐12‐12
Dannenberg, A. L., Keller, J. B., Wilson, P. W. F., & Castelli, W. P. (1989). Leisure time physical activity in the Framingham offspring study. American Journal of Epidemiology, 129(1), 76–88. Retrieved from http://www.ncbi.nlm.nih. gov/pubmed/2910074
Davis, J. N., Hodges, V. A., & Gilham, M. B. (2006). Physical activity compliance:
differences between overweight/obese and normal‐weight adults. Obesity (Silver Spring), 14(12), 2259‐65. Retrieved from: http://www.ncbi.nlm.nih.gov/ pubmed/17189554
Department of Health. (Malta) (2003). The First National Health Interview Survey (NHIS) 2002. G’ Mangia, Malta : Author
Department of Health Information and Research. (DHIR). (2012). The European Health Examination Survey Pilot Study 2010. Marsa, Malta: Government printing Press
Department of Health Information and Research Strategy and Sustainability Division Secretariat for Health Ministry for Health, the Elderly and Community Care. (2008). European Health Interview Survey (EHIS) 2008. Lifestyle Report. Marsa, Malta: Government printing Press
European Commission (EC). (2004). The citizens of the European Union and Sport. Special Eurobarometer 213/Wave162.0. Retrieved from http://ec. europa.eu/public_opinion/archives/ebs/ebs_213_summ_en.pdf
European Commission (EC). (2006). Health and food. Special Eurobarometer 246/Wave 64.3. Retrieved from http://ec.europa.eu/ health/ph_publication/ eb_food_en.pdf
European Commission (EC). (2010). Sport and physical activity. La Pediatria medica e chirurgica : Medical and Surgical Paediatrics, 32(6), 280–3. Retrieved from http://www.ncbi.nlm.nih.gov/pubmed/21462450
Flegal, K. M., Shepherd, J. A., Looker, A. C., Graubard, B. I., Borrud, L. G., Ogden, C. L., … Schenker N. (2009). Comparisons of percentage body fat , body mass index , waist circumference , and waist‐stature ratio in adults. American Journal of clinical Nutrition, 89(2), 500–508. Doi:10.3945/ajcn.2008.26847.
69
Forrest, K. Y., Bunker, C. H., Kriska, A. M., Ukoli, F. A., & Huston, S. L., (2001). Physical activity and cardiovascular risk factors in a developing population. Medicine & Science in Sports & Exercise, 33(9), 1598–1604. Retrieved from http://www.ncbi.nlm.nih.gov/pubmed/11528351
Frankenfield, D. C., Rowe, W. A., Cooney, R. N., Smith, J. S. & Becker, D. (2001). Limits of body mass index to detect obesity and predict body composition. Nutrition, 17(1):26‐30. Retrieved from http://www.nutritionjrnl.com/article/ S0899‐9007(00)00471‐8/abstract
Franks, B. D. & Huck S. W. (1986). Why does everyone use the 0.5 significance level? Research Quarterly for Exercise and Sports , 57(3), 245‐249.
Gorber, S. C., Tremblay, M., Moher, D., & Gorber, B. (2007). A comparison of direct vs. self‐report measures for assessing height, weight and body mass index: a systematic review. Obesity Reviews : an Official Journal of the International Association for the Study of Obesity, 8(4), 307–26. Doi:10.1111/j.1467‐789X.2007.00347.x
Graff‐Iversen, S., Anderssen, S. A., Holme, I. M., Jenum, A. K., & Raastad, T. (2007). An adapted version of the long International Physical Activity Questionnaire (IPAQ‐L): construct validity in a low‐income , multi‐ethnic population study from Oslo, Norway. International Journal of Behavioural Nutrition and Physical Activity, 4(13). Doi:10.1186/1479‐5868‐4‐13
Hagströmer, M., Oja, P., & Sjöström, M. (2007). The International Physical Activity Questionnaire (IPAQ): a study of concurrent and construct validity. Public Health Nutrition, 9(06), 755–762. Doi:10.1079/PHN2005898
IPAQ. (2005a). Guidelines for Data Processing and Analysis of the International Physical Activity Questionnaire (IPAQ) – Short and Long Forms, (November), 1–15. Retrieved from http://www.ipaq.ki.se/scoring.pdf
IPAQ. (2005b). Cultural Adaptation. Retrieved from http://www.ipaq.ki.se/cultural.htm
Janssen, I., Heymsfield, S. B., Allison, D. B., Kotler, D. P., & Ross, R. (2002). Body mass index and waist circumference independently contribute to the prediction of nonabdominal, abdominal subcutaneous, and visceral fat. The American Journal of Clinical Nutrition, 75(4), 683–688. Retrieved from http://www.ncbi. nlm.nih.gov/pubmed/11916754
Johnson‐Kozlow, M., Sallis, J. F., Gilpin, E. A., Cheryl, L., & Pierce, J. P. (2006). Comparative validation of the IPAQ and the 7‐Day PAR among women diagnosed with breast cancer. International Journal of Behavioural Nutrition and Physical Activity, 3(7), . Doi:10.1186/1479‐5868‐3‐7

70
Lean, M. E., Han, T. S., & Morrison, C. E. (1995). Waist circumference as a measure for indicating need for weight management. BMJ (Clinical research ed.), 311(6998), 158–61. Retrieved from http://www.pubmedcentral .nih.gov/ articlerender.fcgi?artid=2550221&tool=pmcentrez&rendertype=abstract
Lee, P. H., Macfarlane, D. J., Lam, T. H., & Stewart, S. M. (2011). Validity of the International Physical Activity Questionnaire Short Form (IPAQ‐SF): a systematic review. The International Journal of Behavioural Nutrition and Physical Activity, 8(1), 115. Doi:10.1186/1479‐5868‐8‐115
Maddison, R., Mhurchu, C. N., Jiang, Y., Vander, S., Rodgers, A., Lawes, C. M. M., & Rush, E. (2007). International Physical Activity Questionnaire ( IPAQ ) and New Zealand Physical Activity Questionnaire ( NZPAQ ): A doubly labelled water validation. International Journal of Behavioural Nutrition and Physical Activity, 4 (62). Doi:10.1186/1479‐5658‐4‐64
McAdams, M. A, Van Dam, R. M., & Hu, F. B. (2007). Comparison of self‐reported and measured BMI as correlates of disease markers in US adults. Obesity (Silver Spring, Md.), 15(1), 188–96. Doi:10.1038/oby.2007.504
Montoye, H. J., Kemper H. C. G., Saris, W. H. M. (1996). Measuring Physical Activity and Energy Expenditure. Champaign, IL. Human Kinetics.
National Institute for Health and Clinical Excellence (NICE). (2006). Obesity guidance on the prevention, identification, assessment and management of overweight and obesity in adults and children. NICE, 1–84. Retrieved from http://www.nice.org.uk/nicemedia/pdf/CG43NICEGuideline.pdf
Pirie, P., Jacobs, D., Jeffery, R., & Hannan, P. (1981). Distortion in self‐reported height and weight data. Journal of American Dietetic Association, 78(6), 601‐606. Retrieved from http://www.ncbi.nlm.nih.gov/pubmed/7252014
Prince, S. A, Adamo, K. B., Hamel, M. E., Hardt, J., Connor Gorber, S., & Tremblay, M. (2008). A comparison of direct versus self‐report measures for assessing physical activity in adults: a systematic review. The International Journal of Behavioural Nutrition and Physical Activity, 5(56). Doi:10.1186/1479‐5868‐5‐56
Rothman, K. J. (2008). BMI‐related errors in the measurement of obesity. International Journal of Obesity (2005), 32(3), 56–9. Doi:10.1038/ijo.2008.87
Rzewnicki, R., Vanden Auweele, Y., & De Bourdeaudhuij, I. (2003). Paper 2 Addressing over‐reporting on the International Physical Activity Questionnaire ( IPAQ ) telephone survey with a population sample. Public Health Nutrition,6(3), 299‐305. Retrieved from http://faber.kuleuven.be/doctorandi/doctoraten/ rzewnicki/G.%20Paper%202%20IPAQ%20overreporting.pdf

71
Sallis, J. F., & Saelens, B. E. (2000). Assessment of Physical Activity by Self‐Report Status, Limitations, and Future Directions. Research Quarterly for Exercise and Sport American Alliance for Health, Physical Education, Recreation and Dance (AAHPERD) HighBeam Research. http://www.highbeam.com
Slattery, M. L., & Jacobs, D. R. (1995). Assessment of ability to recall physical activity of several years ago. Annals of Epidemiology, 5(4), 292‐296. Retrieved from http://dx.doi.org/10.1016/1047‐2797(94)00095‐B
Slootmaker, S. M., Schuit, A. J., Chinapaw, M. J., Seidell, J. C., & Van Mechelen, W. (2009). Disagreement in physical activity assessed by accelerometer and self‐report in subgroups of age, gender, education and weight status. The International Journal of Behavioural Nutrition and Physical Activity, 6(17). Doi:10.1186/1479‐5868‐6‐17
Tucker, P. & Gilliland, J. (2007). The effect of season and weather on physical activity: a systematic review. Public Health. 121(12), 909‐922. Retrieved from: http:// www.ncbi.nlm.nih.gov/pubmed/17920646
Tudor‐Locke, C., Brashear, M. M., Johnson, W. D., & Katzmarzyk, P. T. (2010). Accelerometer profiles of physical activity and inactivity in normal weight, overweight, and obese U.S. men and women. The International Journal of Behavioural Nutrition and Physical Activity, 7(60). Doi: 10.1186/1479‐5868‐7‐60
Van der Ploeg, H. P., Tudor‐Locke, C, Marshall, A. L., Craig, C., Hagströmer, M., Sjöström, M., & Bauman, A. (2010). Reliability and Validity of the International Physical Activity Questionnaire for Assessing Walking. Research Quarterly for Exercise and Sport 81(1), 97‐101. Doi: 10.1080/02701367.2010.10599632
Wing, R. R., Epstein, L . H., Ossip, D. J., & La Porte, R. E. (1979) Reliability and validity of
self‐report and observers' estimates of relative weight. Addictive Behaviors 4(2), 133‐140. Retrieved from http://dx.doi.org/10.1016/0306‐4603(79)90047‐9

72
Appendices Research Paper
Appendix A


74

75
A 2: Measuring instruments used
A digital electronic scales (Weylux 284 BMI, made in UK).
A potable stadiometer (Seca 213, Hamburg, Germany).
A 1.5meter long waist watcher tape.
IPAQ long form questionnaire.
General questions information sheet.
A 3: Changes made to IPAQ questionnaire Minor modifications were made to questions 8, 14 and 16 as these did not fully apply
to the Maltese environment. In question 8, train and tram as a method of travelling
were removed as these are not available in Malta and motor cycle was added as it is a
popular means of travelling. In question 14, chopping wood and shovelling snow were
removed as they do not apply to Malta. And in question 16, washing windows was
removed and added to question 18 as in Malta window washing is a house chore.

76
A 4: Schematic outline of the study process
Application to Ethics committee Participation the ethics approval granted information letter committee detailing study
Questionnaires Anthropometric Consent form distributed measurements signed taken
Questionnaires Questionnaires checked for Fully completed Collected completion questionnaires
allotted a number based on order they were received back
Computing of IPAQ according to IPAQ protocol

77
A 5a: Recruitment Letter in English
Recruitment Letter Survey to find if there is a relationship between physical inactivity and weight status.
Dear participant, As part of my MSc in Weight Management at the University of Chester, UK, I am undertaking a research project designed to investigate the relationship between physical inactivity, BMI and waist circumference in the Maltese population between the ages of 18‐65. I am looking for as many participants as possible to take part. If you choose to participate in this project, I will be taking some measurements, such as weight, height and waist circumference and asking you to complete the enclosed questionnaire and return it to me for analysis. The project is described further in the attached participant information sheet. To be eligible to fill in the questionnaire, one should be of Maltese nationality, between the ages of 18 and 65 and must not be pregnant. All information provided will be treated in the strictest confidence, it will be stored securely and will be accessible only to me. Thank you for your time and help with this survey. Yours sincerely, Marika Micallef

78
A 5b: Recruitment Letter in Maltese
Ittra ta’ reklutaġġ Survey biex insib jekk hemmx relazzjoni bejn in‐nuqqas ta’ attività fiżika u piż. Għażiż participant/a Bħala parti mill‐istudju tiegħi MSc f’Weight Management fl‐Università ta’ Chester, UK qed nagħmel riċerka biex ninvestiga jekk hemmx relazzjoni bejn in‐nuqqas ta’ attività fiżika u l‐piż, BMI u ċ‐ċirkonferenza tal‐qadd fil‐popolazzjoni Maltija ta’ bejn it‐18 u l‐65 sena. Għandi bżonn kemm jista’ jkun partiċipanti, li fil‐każ li jaċċettaw ikolli bżonn noħdilhom il‐piż, it‐tul, u nkejjel d‐dawra taż‐żaqq, imbagħad kemm jimlew kwestjonarju li jkunu iridu jagħtuni lura biex inkun nista’ nagħmel analiżi. Issib aktar informazzjoni dwar dan il‐proġett fil‐karta li jmiss li tissejjaħ ‘Informazzjoni għall‐Parteċipant’ Biex tiparteċipa trid tkun Malti/ja, bejn l‐età tat‐18 u l‐ 65 sena u mhux tqila. L‐informazzjoni kollha miġbura hija kunfidenzjali fejn jien biss ikolli aċċess għaliha. Grazzi tal‐ħin u tal‐għajnuna tiegħek. Dejjem tiegħek Marika Micallef

79
A 6a: Participant information sheet in English
Participant information sheet Title of study A survey to investigate the relationship between physical inactivity and weight status in the Maltese population between the ages of 18‐65. You are invited to take part in a research study, but before you decide whether to take part or not, it is important for you to understand why the research is being done and what it will involve. Please read the following information carefully. Please do not hesitate to ask if you need clarification or if you require more information. Take your time to decide whether you wish to take part or not. Thank you for taking the time to read this. What is the purpose of the study? The purpose of the study is to investigate the relationship between physical inactivity and weight status between the ages of 18‐65. Why have I been chosen? You have been chosen because you are a Maltese citizen between the ages of 18‐65 Do I have to take part? It is entirely up to you to decide whether you want to take part or not. If you decide to take part, you are still free to withdraw at any time and without giving a reason. What will happen to me if I take part? If you decide to take part you will be given this information sheet plus a consent form which will need to be read and signed. Your height, waist circumference and weight will be measured and you will be required to fill in the questionnaire truthfully. The questionnaire involves some general questions about yourself and about your physical activity in the last 7 days. What are the possible disadvantages and risks of taking part? There are no disadvantages or risks foreseen in taking part in the study.

80
What are the possible benefits of taking part? By filling in the questionnaire you can increase your awareness of your own physical activity levels. By taking part you will be contributing to finding out whether the lack of physical activity in the Maltese population as a whole is related to the increased prevalence of weight gain in the Maltese population. The findings will be passed on to the Health Department so that the information can be used in the promotion of physical activity and weight management. What if something goes wrong? If you wish to complain or have any concerns about any aspect of the way you have been approached or treated during the study, please contact Prof. Sarah Andrew, Dean of the faculty of Applied Sciences, University of Chester, Parkgate Road, Chester, CH1, 4BJ, U.K. (+44) 1244513055.
Will my taking part in the study be kept confidential? Yes. All the information collected during the study will be treated in strict confidence and will be seen only by the researcher carrying out the study and the research supervisor within the University of Chester. Your name will not be recorded for any reason. What will happen to the results of the research study? The results will be written up in a dissertation. It is hoped that the findings will give an idea of the level of physical activity carried out by the Maltese and if this is related to their weight. A copy of the findings will be forwarded to the Maltese Department of Health in the hope that it will lead to more promotion regarding physical activity. Who is organising and funding the research? The research is non‐funded and it is being organised with supervision from the Department of Clinical Sciences by Marika Micallef as part of an MSc in Weight Management with the approval of the University of Chester, UK. Who am I to contact for further information? If you would like more information about the research before you decide whether or not you would like to take part, please contact: Name: E mail: Thank you for your interest in this research

81
A 6b: Participant information sheet in Maltese
Informazzjoni għall‐Parteċipant Titlu Survey biex ninvestiga relazzjonijiet bejn nuqqas ta’ attività fiżika u piż fil‐Maltin ta’ bejn it‐18 u l‐65 sena. Int ġejt mistieden biex tiparteċipa f’dan l‐istudju imma qabel tiddeċiedi jekk tridx tieħu sehem jew le, importanti li tifhem għaliex din ir‐riċerka qed issir u x’tinvolvi. Jekk jogħġbok aqra sew din l‐informazzjoni. Jekk għandek bżonn tiċċara xi affarijiet jew tkun taf iżjed dwar dan l‐istudju tista’ dejjem ssaqsini. Ħu l‐ħin tiegħek biex tiddeċiedi jekk tixtieqx tieħu sehem jew le. Grazzi talli ħadt il‐ħin biex taqra din l‐informazzjoni. X’inhu l ‐għan ta’ dan l‐istudju? L‐għan ta’ dan l‐istudju hu biex ninvestiga jekk hemmx xi relazzjoni bejn in‐nuqqas ta’ attività fiżika u l‐ piż tal‐Maltin ta’ bejn l‐età tat‐18 u l‐65 sena. Għaliex gejt magħżul/a? Ġejt magħżul/a għax int Malti/ja ta’ bejn it‐18 u l‐65 sena. Bilfors irrid niehu sehem? L‐għażla hi f’idejk jekk tridx tieħu sehem jew le. Jekk tiddeċiedi li tieħu sehem, int liberu li titlaq x’ħin trid mingħajr ma’ tagħti spjegazzjoni. X’jiġri jekk nieħu parti? Jekk tieħu parti f’dan l‐istudju, tingħata din il‐karta bl‐informazzjoni, trid tiffirma karta li qrajt din l‐informazzjoni u li int trid tieħu sehem. Imbagħad neħodlok l‐piż, it‐ tul u nkejjillek iċ‐ċirkonferenza ta’ qaddek u wara timla l‐kwestjonarju li jinvolvi xi mistoqsijiet ġenerali dwarek u dwar l‐attività fiżika li għamilt f’dawn l‐aħħar sebat (7) ijiem. X’inhuma l‐iżvantaġġi jew riskji jekk tieħu sehem? Ma hemm l‐ebda riskji jew żvantaġġi jekk tieħu sehem.

82
X’inhuma l‐benefiċċji jekk tieħu sehem? Meta timla l‐kwestjonarju ser tkun tista’ tinduna kemm tagħmel attività fiżika fil‐ ġimgħa. Billi tieħu sehem tkun qed tgħin biex insib jekk hemmx relazzjoni bejn in‐nuqqas ta’ attività fiżika fl‐popolazzjoni Maltija u l‐piż. Ir‐riżultati ser ikunu mgħoddija lid‐dipartiment tas‐saħħa biex l‐informazzjoni tkun tista’ tintuża għall‐ promozzjoni tal‐attività fiżika u mmaniġġjar tal‐piż. X’nista' nagħmel jekk xi ħaġa tmur ħażin? Jekk tixtieq tagħmel xi oġġezzjoni jew jekk għandek xi ħaġa li dejqitek, bħall‐mod kif ġejt avviċinat jew trattat waqt dan l‐istudju, tista’ tikkuntattja lill‐Professur Sarah Andrew, Dean tal‐fakultà ta’ Applied Sciences fl‐Università ta’ Chester, Parkgate Road, Chester, CH1, 4BJ, UK, (+44) 1244513055 Il‐parteċipazzjoni tiegħi ser tkun kunfidenzjali? Iva. L‐informazzjoni kollha miġbura hi kunfidenzjali u tkun użata biss minni u s‐supervisor tiegħi mill‐Università ta’ Chester għal dan l‐istudju. L‐ismijiet mhux ser jidhru mkien. X’jiġri mir‐riżultati ta’ dan l‐istudju? Ir‐ riżultati ser ikunu miktuba ġo dissertation. L‐għan ta’ dan l‐istudju hu li nara jekk hemmx relazzjoni bejn il‐piż u l‐livell tal‐attività fiżika. Kopja ta’ dan l‐istudju ser tgħaddi lid‐Dipartiment tas‐Saħħa bil‐għan li jgħin fil‐promozzjoni tal‐attività fiżika u l‐immaniġġjar tal‐piż. Min qed jorganizza u jipprovdi l‐fondi għal dan l‐istudju? M’hemmx fondi provduti għal dan l‐istudju. Qed jiġi organizzat minn Marika Micallef b’superviżjoni tad‐Dipartiment tax‐Xjenza Klinika tal‐Università ta’ Chester, U.K. bħala parti mill‐MSc in Weight Management. Lil min nista’ nikkuntattja għal aktar informazzjoni? Jekk tixtieq aktar informazzjoni dwar dan l‐istudju qabel tideċiedi tridx tieħu sehem tista’ tikkuntattja lil: Isem: E mail: Grazzi tal‐interess tiegħek f’dan l‐istudju.

83
A 7a: Consent Form in English
Consent Form A survey to investigate relationships between physical inactivity and weight status in the Maltese population between the ages of 18‐65. Researcher: Marika Micallef
1) I confirm that I have read and understood the information sheet for the above study and have had the opportunity to ask questions.
2) I understand that my participation is voluntary and that I am free to withdraw at any time, without giving any reason.
3) I agree to take part in the above study. __________________ ______________ _______________ Name of Participant Date Signature __________________ ______________ ______________ Name of researcher Date Signature

84
A 7b: Consent Form in Maltese
Formula tal‐Kunsens Survey biex ninvestiga relazzjonijiet bejn in‐nuqqas ta’ attività fiżika u l‐piż fil‐popolazzjoni Maltija ta’ bejn it‐18 u l‐65 sena. Riċerkatriċi: Marika Micallef
1) Jien nikonferma li qrajt u fhimt din l‐informazzjoni dwar dan l‐istudju msemmi hawn fuq u li kelli l‐opportunità li nsaqsi mistoqsijiet.
2) Jien fhimt li l‐parteċipazzjoni tiegħi hi voluntarja u li nista’ nieqaf meta rrid mingħajr ma nagħti spjegazzjoni.
3) Jien naċċetta li nieħu sehem f’ dan l‐istudju.
__________________ ______________ _______________ Isem il‐ Parteċipant Data Firma __________________ ______________ _______________ Isem ir‐ riċerkatrici Data Firma

85
A 8a: Questionnaire in English GENERAL INFORMATION
1) Gender: Female Male
2) Age: 18 ‐24
25 ‐ 34
35 ‐ 44
45 ‐54
55‐ 65
3) Education level: primary level
secondary level
tertiary level
4) State: Single
Married
Widowed
Divorced
Cohabit
5) Weight: ______ kg 6) Length ______ cm 7) Waist circumference: ______cm 8) BMI: ______kg/m2
9) How much physical activity is recommended for adults by the Maltese Health Promotion Unit?
1 hour of moderate‐ intensity daily
30 minutes of moderate ‐intensity daily
1 hour twice a week
30 minutes five times a week

86
INTERNATIONAL PHYSICAL ACTIVITY QUESTIONNAIRE I am interested in finding out about the kinds of physical activities that people do as part of their everyday lives. The questions will ask you about the time you spent being physically active in the last 7 days. Please answer each question even if you do not consider yourself to be an active person. Please think about the activities you do at work, as part of your house and yard work, to get from place to place, and in your spare time for recreation, exercise or sport. Think about all the vigorous and moderate activities that you did in the last 7 days. Vigorous physical activities refer to activities that take hard physical effort and make you breathe much harder than normal. Moderate activities refer to activities that take moderate physical effort and make you breathe somewhat harder than normal.
PART 1: JOB‐RELATED PHYSICAL ACTIVITY The first section is about your work. This includes paid jobs, farming, volunteer work, course work, and any other unpaid work that you did outside your home. Do not include unpaid work you might do around your home, like housework, yard work, general maintenance, and caring for your family. These are asked in Part 3. 1. Do you currently have a job or do any unpaid work outside your home?
Yes
No
If you answered no skip to PART 2: TRANSPORTATION The next questions are about all the physical activity you did in the last 7 days as part of your paid or unpaid work. This does not include traveling to and from work. 2. During the last 7 days, on how many days did you do vigorous physical activities like
heavy lifting, digging, heavy construction, or climbing up stairs as part of your work? Think about only those physical activities that you did for at least 10 minutes at a time.
____ days per week ____ No vigorous job‐related physical activity
If you answered no skip to question 4
3. How much time did you usually spend on one of those days doing vigorous physical activities as part of your work?
_____ hours per day
_____ minutes per day

87
4. Again, think about only those physical activities that you did for at least 10 minutes at
a time. During the last 7 days, on how many days did you do moderate physical activities like carrying light loads as part of your work? Please do not include walking.
_____ days per week
_____ No moderate job‐related physical activity
If you answered no skip to question 6 5. How much time did you usually spend on one of those days doing moderate physical
activities as part of your work? _____ hours per day _____ minutes per day 6. During the last 7 days, on how many days did you walk for at least 10 minutes at a
time as part of your work? Please do not count any walking you did to travel to or from work.
_____ days per week _____No job‐related walking
If you answered no skip to PART 2: TRANSPORTATION 7. How much time did you usually spend on one of those days walking as part of your
work?
_____ hours per day _____ minutes per day
PART 2: TRANSPORTATION PHYSICAL ACTIVITY These questions are about how you travel from place to place, including to places like work, stores, movies, and so on. 8. During the last 7 days, on how many days did you travel in a motor vehicle
bus, car, or motor cycle? _____ days per week _____ No traveling in a motor vehicle
If you answered no skip to question 10

88
9. How much time did you usually spend on one of those days traveling in a bus, car, or other kind of motor vehicle?
_____ hours per day
_____ minutes per day
Now think only about the bicycling and walking you might have done to travel to and from work, to do errands, or to go from place to place. 10. During the last 7 days, on how many days did you bicycle for at least 10 minutes at a
time to go from place to place?
_____ days per week
_____No bicycling from place to place If you answered no skip to question 12 11. How much time did you usually spend on one of those days to bicycle from place to
place?
_____ hours per day _____ minutes per day
12. During the last 7 days, on how many days did you walk for at least 10 minutes at a time to go from place to place?
_____ days per week
_____No walking from place to place
If you answered no skip to PART 3: HOUSEWORK, HOUSE MAINTENANCE, AND CARING FOR FAMILY 13. How much time did you usually spend on one of those days walking from place to
place?
_____ hours per day _____ minutes per day

89
PART 3: HOUSEWORK, HOUSE MAINTENANCE, AND CARING FOR FAMILY This section is about some of the physical activities you might have done in the last 7 days in and around your home, like housework, gardening, yard work, general maintenance work, and caring for your family. 14. Think about only those physical activities that you did for at least 10 minutes at a time.
During the last 7 days, on how many days did you do vigorous physical activities like heavy lifting, or digging in the garden or yard?
_____ days per week _____No vigorous activity in garden or yard
If you answered no Skip to question 16 15. How much time did you usually spend on one of those days doing vigorous physical
activities in the garden or yard?
_____ hours per day _____ minutes per day
16. Again, think about only those physical activities that you did for at least 10 minutes at a time. During the last 7 days, on how many days did you do moderate activities like carrying light loads, sweeping, and raking in the garden or yard?
_____ days per week
_____No moderate activity in garden or yard
If you answered no skip to question 18 17. How much time did you usually spend on one of those days doing moderate physical
activities in the garden or yard?
_____ hours per day _____ minutes per day
18. Once again, think about only those physical activities that you did for at least 10 minutes at a time. During the last 7 days, on how many days did you do moderate activities like carrying light loads, washing windows, scrubbing floors and sweeping inside your home?
_____ days per week
_____No moderate activity inside home
If you answered no Skip to PART 4: RECREATION, SPORT AND LEISURE‐TIME PHYSICAL ACTIVITY

90
19. How much time did you usually spend on one of those days doing moderate physical
activities for at least 10 minutes inside your home?
_____ hours per day
_____ minutes per day
PART 4: RECREATION, SPORT, AND LEISURE‐TIME PHYSICAL ACTIVITY This section is about all the physical activities that you did in the last 7 days solely for recreation, sport, exercise or leisure. Please do not include any activities you have already mentioned. 20. Not counting any walking you have already mentioned, during the last 7 days, on how
many days did you walk for at least 10 minutes at a time in your leisure time?
_____ days per week
_____No walking in leisure time If you answered no skip to question 22 21. How much time did you usually spend on one of those days walking in your leisure
time?
_____ hours per day _____ minutes per day
22. Think about only those physical activities that you did for at least 10 minutes at a time. During the last 7 days, on how many days did you do vigorous physical activities like aerobics, running, fast bicycling, or fast swimming in your leisure time?
_____ days per week _____No vigorous activity in leisure time
If you answered no skip to question 24 23. How much time did you usually spend on one of those days doing vigorous physical
activities in your leisure time?
_____ hours per day _____ minutes per day

91
24. Again, think about only those physical activities that you did for at least 10 minutes at a time. During the last 7 days, on how many days did you do moderate physical activities like bicycling at a regular pace, swimming at a regular pace, and doubles tennis in your leisure time?
_____ days per week _____No moderate activity in leisure time
If you answered no skip to PART 5: TIME SPENT SITTING 25. How much time did you usually spend on one of those days doing moderate physical
activities in your leisure time?
_____ hours per day _____ minutes per day
PART 5: TIME SPENT SITTING The last questions are about the time you spend sitting while at work, at home, while doing course work and during leisure time. This may include time spent sitting at a desk, visiting friends, reading or sitting or lying down to watch television. Do not include any time spent sitting in a motor vehicle that you have already told me about. 26. During the last 7 days, how much time did you usually spend sitting on a weekday?
_____ hours per day _____ minutes per day
27. During the last 7 days, how much time did you usually spend sitting on a weekend day?
_____ hours per day
_____ minutes per day
This is the end of the questionnaire, thank you for participating.

92
A 8b: Questionnaire in Maltese Informazzjoni Ġenerali
1) Sess: Mara Raġel
2) Età: 18 ‐24
25 ‐ 34
35 ‐ 44
45 ‐54
55‐ 65
3) Edukazzjoni: livell primarju
livell sekondarju
livell terzjarju
4) Stat: Single
Miżżewweġ/a
Armel/a
Divorzjat/a
Ngħix ma’ persuna oħra
5) Piż: ______ kg 6) Tul: ______ ċm 7) Ċirkonferenza tal‐qadd: ______ċm 8) BMI: ______kg/m2 9) Kemm hu rakomandat li jsir eżerċizzju mill‐ adulti skond id‐ Dipartiment tas‐
Saħħa ta’ Malta?
Siegħa ta’ eżerċizzju moderat kuljum
30 minuta ta’ eżerċizzju moderat kuljum
Siegha darbtejn fil‐ġimgħa
30 minuta ħames darbiet fil‐ ġimgħa

93
INTERNATIONAL PHYSICAL ACTIVITY QUESTIONNAIRE Jien interesata li nsib informazzjoni dwar x’ tip ta’ attivita fiżika jagħmlu n‐ nies bħala parti mill‐ ħajja tagħhom ta’ kuljum. Nixtieq nistaqsik dwar il‐ħin li qattajt tagħmel eżerċizzju fiżiku f‘dawn l‐aħħar sebat (7) ijiem. Jekk jogħġbok, wieġeb kull mistoqsija anke jekk taħseb li mintix daqshekk attiv/a. Aħseb dwar l‐attivitajiet li tagħmel fix‐xogħol tiegħek, bħala parti mix‐xogħol tad‐dar u fil‐ġnien, biex tasal minn post għal ieħor u fil‐ħin liberu tiegħek għar‐rikreazzjoni, eżerċizzju jew sport. Aħseb dwar l‐attivitajiet intensi ħafna u dawk moderati li għamilt f’dawn l‐aħħar sebat ijiem. Attivitajiet intensi, jiġifieri, li jirrikjedu sforz fiżiku kbir u jġiegħluk tieħu nifs aktar qawwi minn normal (tilheġ). Attivitajiet moderati huma attivitajiet li jirrikjedu sforz fiżiku moderat u jġiegħluk tieħu nifs ftit aktar qawwi minn normal.
SEZZJONI 1: ATTIVITÀ FIŻIKA RELATATA MAX‐XOGĦOL Din il‐parti hi relatata max‐xogħol tiegħek. Dan jinkludi xogħol imħallas, biedja, xogħol volontarju, course work u kull tip ieħor ta’ xogħol li mintix imħallas/imħallsa għalih u li sar barra mid‐dar. Tinkludix xogħol li għamilt f’dar bħal faċendi tad‐dar, xogħol fil‐ġnien, manutenzjoni fid‐dar u biex tieħu ħsieb il‐familja. (Dawn ser issibhom f’sezzjoni 3)
1. Bħalissa għandek xogħol bi ħlas jew bla ħlas barra mid‐dar tiegħek?
Iva
Le
Jekk irrispondejt le mur f’sezzjoni 2: TRASPORT. Il‐mistoqsijiet li ġejjin jinkludu biss attività fiżika li saret f’dawn l‐aħħar sebat (7) ijiem bħala parti mix‐xogħol tiegħek barra mid‐dar. Ma jinkludux attività fiżika biex vjaġġajt lejn ix‐ xogħol u lura. 2. F’dawn l‐aħħar sebat (7) ijiem kemm‐il jum għamilt attivitajiet fiżiċi intensi ħafna bħal irfigħ ta’ piżijiet kbar, xogħol ta’ tħaffir, tlugħ ta’ tarġien bħala parti mix‐xogħol tiegħek? Aħseb biss fuq dawk l‐ attivitajiet fiżiċi li domt tagħmel tal‐inqas għaxar (10) minuti kull darba.
____ Jiem fil‐ġimgħa ____ Ma nagħmilx attività fiżika intensa relatata max‐xogħol.
Jekk ma tagħmilx attività fiżika intensa fix‐xogħol tiegħek mur għall‐mistoqsija erbgħa (4).

94
3. Kemm għamilt ħin, f’wahda minn dawn il‐ġranet, tagħmel attività intensa ħafna bħala parti mix‐xogħol tiegħek?
____sigħat fil‐ġurnata ____ minuti fil‐ġurnata 4. Aħseb dwar attivitajiet ta’ intensità moderata li għamilt f’dawn l–aħħar sebat
(7) ijiem li domt tagħmel tal–anqas għaxar (10) minuti kull darba, bħal ġarr ta’ piżijiet ħfief. Tinkludix mixi.
____ Jiem fil‐ ġimgħa ____ Ma nagħmilx attività fiżika moderata relatata max‐xogħol.
Jekk ma tagħmilx attività fiżika moderata fix‐xogħol tiegħek mur f’sezzjoni sitta (6). 5. B’ kollox kemm qattajt ħin f’attivitajiet fiżiċi ta intensità moderata bħala parti
mix‐xogħol tiegħek?
____sigħat fil‐ġurnata ____ minuti fil‐ġurnata 6. F’dawn l‐aħħar sebat (7) ijiem, kemm‐il darba imxejt tal‐inqas għaxar (10)
minuti kull darba bħala parti mix‐xogħol tiegħek? Tinkludix mixi li għamilt biex tasal minn post għal ieħor fix‐xogħol tiegħek.
____ Jiem fil‐gimgħa ____ Ma nagħmilx mixi relatat max‐xogħol.
Jekk ma tagħmilx mixi relatat max‐xogħol mur f’sezzjoni tnejn (2). 7. B’kollox, kemm qattajt ħin fil‐mixi, tal‐inqas għaxar (10) minuti kull darba
bħala parti mix‐xogħol tiegħek?
____sigħat fil‐ġurnata ____ minuti fil‐ġurnata

95
SEZZJONI 2: TRASPORT U ATTIVITÀ FIŻIKA Dawn huma mistoqsijiet dwar kif tivvjaġġa minn post għal ieħor, li jinkludu, fost oħrajn, postijiet ta’ xogħol, ħwienet, u postijiet ta’ divertiment. 8. F’dawn l‐aħħar sebat (7) ijiem kemm‐il darba vvjaġġajt b’ karozza, karozza
tal‐ linja, mutur jew prajvit? ____ Jiem fil‐ġimgħa
____ Ma vvjaġġajtx b’vetturi.
Jekk ma vvjaġġajtx b’vetturi mur għal mistoqsija numru 10. 9. B’ kollox kemm qattajt ħin tivvjaġġa b’karozza, karozza tal‐linja, mutur jew
prajvit f’waħda minn dawn il‐ġranet ?
____sigħat fil‐ġurnata ____ minuti fil‐ġurnata Issa aħseb dwar il‐ħin li qattajt timxi jew issuq ir‐rota biex tasal minn post għal ieħor biex tasal ix‐xogħol u lura, biex tagħmel xi qadi jew biex tmur minn post għal ieħor. 10. F’dawn l‐aħħar sebat (7) ijiem, kemm‐il darba soqt ir‐rota tal‐ inqas 10 minuti
kull darba biex tasal minn post għal ieħor?
____ Jiem fil‐ġimgħa ____ Ma nsuqx rota biex nasal minn post għal ieħor.
Jekk ma ssuqx rota biex tasal minn post għal ieħor mur għal mistoqsija numru 12. 11. B’kollox kemm qattajt ħin issuq ir‐rota, tal‐inqas 10 minuti, biex tasal minn
post għall‐ieħor.
____sigħat fil‐ġurnata ____ minuti fil‐ġurnata 12. F’dawn l‐aħħar sebat (7) ijiem, kemm mxejt tal‐inqas 10 minuti kull darba
biex tasal minn post għal ieħor?
____ Jiem fil‐ġimgħa ____ Ma nimxix biex nasal minn post għal ieħor.
Jekk ma timxix biex tasal minn post għal ieħor mur għal sezzjoni 3.

96
13. B’kollox kemm qattajt ħin timxi tal‐inqas 10 minuti kull darba biex tasal minn post għal ieħor.
____sigħat fil‐ġurnata
____ minuti fil‐ġurnata
SEZZJONI 3: XOGĦOL TAD‐ DAR, MANUTENZJONI F’ DAR U XOGĦOL
RELATAT MAL‐ FAMILJA Din il‐parti tinkludi attivitajiet fiżiċi li stajt għamilt dawn l‐aħħar sebat (7) ijiem fid‐dar tiegħek. Bħal xogħol tad‐dar, fil‐ġnien, bitħa, manutenzjoni tad‐dar u biex tieħu ħsieb il‐familja. 14. Aħseb dwar il‐ħin li qattajt f’dawn l‐aħħar sebat (7) ijiem tagħmel attivitajiet
fiżiċi intensivi u li domt tagħmel tal‐inqas 10 minuti kull darba, bħal‐irfigħ ta’ piżijiet kbar, xogħol ta’ tħaffir fil‐ġnien eċċ.
____ Jiem fil‐ġimgħa ____ M’għamiltx xogħol ta’ intensità qawwija fil‐ġnien jew bitħa
Jekk m’għamiltx xogħol ta’ intensità qawwija fil‐ġnien jew bitħa mur għal mistoqsija 16. 15. B’kollox kemm qattajt ħin tagħmel attivitajiet fiżiċi intensi tal‐inqas 10 minuti
kull darba fil‐ġnien jew bitħa? ____sigħat fil‐ġurnata
____ minuti fil‐ġurnata 16. Aħseb dwar attivitajiet ta’ intensità moderata li għamilt f’dawn l‐aħħar sebat
(7) ijiem li domt tagħmel tal‐anqas 10 minuti kull darba eż. iġġorr piż ħafif, taħsel il‐bitħa, tiġbor il‐ħaxix ħażin mill‐ġnien eċċ.?
____ Jiem fil‐ġimgħa ____ M’għamiltx xogħol ta’ intensità moderata fil‐ġnien.
Jekk m’għamiltx xogħol ta’ intensità moderata fil‐ġnien jew bitħa mur għal mistoqsija 18.

97
17. B’kollox kemm qattajt ħin tagħmel attivitajiet fiżiċi ta’ intensità moderata tal‐inqas 10 minuti kull darba fil‐ġnien jew bitħa?
____sigħat fil‐ġurnata
____ minuti fil‐ġurnata 18. Erġa’ aħseb dwar attivitajiet ta’ intensità moderata li għamilt f’dawn l‐aħħhar
sebat (7) ijiem li domt tagħmel tal‐anqas 10 minuti bħal iġġorr piż ħafif, taħsel il‐ħġieġ, taħsel l‐art, tiknes eċċ.
____ Jiem fil‐ġimgħa ____ M’għamiltx xogħol ta’ intensità moderata fid‐dar.
Jekk m’għamiltx xogħol ta’ intensità moderata fid‐dar mur għal sezzjoni 4. 19. B’kollox kemm qattajt ħin tagħmel attivitajiet fiżiċi ta’ intensità moderata tal‐
anqas 10 minuti kull darba fid‐dar? ____sigħat fil‐ġurnata
____ minuti fil‐ġurnata
SEZZJONI 4: ATTIVITAJIET FIŻIĊI TA’ REKREAZZJONI, SPORTS U ĦIN LIBERU Din is‐sezzjoni hi dwar attivitajiet fiżiċi li għamilt f’dawn l‐aħħar sebat (7) ijiem bħala rekreazzjoni, sport jew delizzju. Jekk jogħġbok terġax tinkludi attivitajiet li diġà semmejt. 20. Mingħajr ma terġa’ tniżżel il‐mixi li diġà semmejt kemm‐il darba mxejt tal‐
inqas 10 minuti fil‐ħin liberu tiegħek?
____ Jiem fil‐ġimgħa ____ M’għamiltx mixi fil‐ħin liberu tiegħi
Jekk ma mxejtx fil‐ħin liberu tiegħek mur għal mistoqsija 22. 21. B’kollox kemm qattajt ħin timxi fil‐ħin liberu tieghek.?
____sigħat fil‐ġurnata

98
____ minuti fil‐ġurnata 22. Aħseb dwar il‐ħin li f’dawn l‐aħħar sebat (7) ijiem li għamilt attivitajiet fiżiċi
intensivi li domt tagħmel tal‐inqas 10 minuti kull darba bħal aerobics, tiġri, issuq ir‐rota b’veloċità qawwija, tgħum b’intensità qawwija fil‐ħin liberu tiegħek.
____ Jiem fil‐ġimgħa ____ M’għamiltx attivitajiet fiżiċi intensivi fil‐ħin liberu tiegħi
Jekk m’għamiltx attività fiżika intensiva mur għal mistoqsija 24. 23. B’kollox kemm qattajt ħin tagħmel attivitajiet fiżiċi intensivi fil‐ħin liberu
tiegħek?
____sigħat fil‐ġurnata ____ minuti fil‐ġurnata 24. Ahseb dwar attivitajiet ta’ intensità moderata li għamilt f’dawn l‐aħħar sebat
(7) ijiem li domt tagħmel tal‐anqas 10 minuti kull darba bħal issuq ir‐rota b’ ritmu regolari, jogging bil‐mod, tgħum b’ritmu regolari, u tilgħab doubles f’ tennis fil‐ħin liberu tiegħek?
____ Jiem fil‐ġimgħa ____ M’għamiltx attivitajiet fiżiċi moderati fil‐ħin liberu tiegħi
Jekk m’għamiltx attivitajiet fiżiċi moderati mur għal sezzjoni 5 25. B’kollox kemm qattajt ħin tagħmel attivitajiet fiżiċi moderati fil‐ħin liberu
tiegħek?
____sigħat fil‐ġurnata ____ minuti fil‐ġurnata

99
SEZZJONI 5: ĦIN LI TQATTA’ BILQIEGĦDA L‐aħħar żewġ mistoqsijiet huma dwar il‐ħin li tqatta’ bilqiegħda waqt ix‐xogħol, id‐dar, waqt course work, u waqt il‐ħin liberu tiegħek. Dan jista’ jkun ħin li tagħmel bil‐qiegħda mal‐ iskrivanija, għand il‐ħbieb, taqra, quddiem il‐kompjuter, bilqiegħda jew mimdud/a tara it‐ televixin. 26. F'dawn l‐aħħar sebat (7) ijiem kemm qattajt ħin bilqiegħda f’gurnata matul il‐ ġimgħa?
____sigħat fil‐ġurnata
____ minuti fil‐ġurnata 27. F'dawn l‐aħħar sebat (7) ijiem kemm qattajt ħin bilqiegħda f’ġurnata matul l‐
aħħar tal‐ġimgħa (week end)?
____sigħat fil‐ġurnata
____ minuti fil‐ġurnata Grazzi tal‐parteċipazzjoni tiegħek.

100
A9 : IPAQ Long form scoring protocol and guidelines for computing continuous and categorical scores.
Scoring protocol and formulas for computation of continuous scores. PA score = MET level X (daily minutes of activity ) X (days/week)
Vig PA score = 8.0 X (daily minutes of vigorous‐intensity activity ) X (days/week)
Mod PA score = 4.0 X (daily minutes of moderate‐intensity activity ) X (days/week)
Walking PA score = 3.3 X (daily minutes of walking activity ) X (days/week)
Total PA score = Vig PA score + Moderate PA score + Walk PA score
Participants should only record PA that lasted at least 10 minutes
Any responses to duration provided in hours‐ minutes format are converted into minutes.
Any responses to duration reported as weekly are converted into an average daily time by dividing by 7.
The recorded PA with duration less than 10 min/day are recorded to zero min/day
The recorded PA with duration more than 180 min/day are recoded to 180 min/day
Questionnaires with missing data for time or days or ‘don’t know/ not sure’ are excluded from analysis.
Questionnaires with total duration > 960 minutes are excluded from analysis.
Questionnaires with PA frequency >9 days are excluded from analysis.
Recoding of categorical PA Levels Low level of PA No activity reported Or Total PA score <600 METs/min/wk Moderate level of PA ≥3 days of vigorous PA, ≥ 20 min/day of vigorous PA score, ≥ 480METs‐min/ wk
Or >5 days of moderate PA, ≥ 30 min/day of moderate PA score, ≥ 600METs‐min/ wk Or >5 days of walking PA, ≥ 30 min/day of walking PA score, ≥ 495METs –min/ wk Or >5 days of vigorous PA, ≥ total 600 METs –min/wk‐1 High level of PA >3 days of vigorous PA, ≥ Vigorous PA, ≥ 1500 METs –min/wk Or >7 days of total PA, ≥ total PA score ≥ 3000 METs –min/wk
*Definition of abbreviations and symbols: min = minutes, wk = week, PA= physical activity, Vig = vigorous physical activity, mod = moderate physical activity, METs= metabolic equivalents ( 1MET= 3.5ml 02/kg/min, representing the average rate of energy expenditure at rest All PA scores are expressed as METs – min /wk.

101
Appendix B
Additional Results

102
Appendix Table B1: Age, Educational Level and Marital Status by Gender. Frequencies, Column percentages and χ2 statistics are given. Age by gender
Gender Total male female
Age 18‐24 Count 27 30 57
% within Gender 14.8% 12.8% 13.7%
25‐34 Count 43 66 109 % within Gender 23.6% 28.2% 26.2%
35‐44 Count 49 64 113
% within Gender 26.9% 27.4% 27.2%
45‐54 Count 29 51 80 % within Gender 15.9% 21.8% 19.2%
55‐65 Count 34 23 57
% within Gender 18.7% 9.8% 13.7%
Total Count 182 234 416 % within Gender 100.0% 100.0% 100.0%
χ2 = 8.813, df = 4, p = 0.066
Educational level by gender
Education level
primary level
Count % within Gender
7
3.8%
7
3.0%
14 3.4%
secondary level
Count % within Gender
91 50.0%
124 53.0%
215 51.7%
tertiary level
Count % within Gender
84 46.2%
103 44.0%
187 45.0%
Total Count 182 234 416
% within Gender 100.0% 100.0% 100.0%
χ2 = 0.503, df = 2, p = 0.777

103
Table B1 (continued) Marital status by gender
Gender Total male female
State single Count 51 57 108
% within Gender
28.0% 24.4% 26.0%
married Count 112 157 269 % within Gender
61.5% 67.1% 64.7%
widowed Count 3 3 6 % within Gender
1.6% 1.3% 1.4%
divorced Count 3 1 4 % within Gender
1.6% .4% 1.0%
cohabit Count 13 16 29 % within Gender
7.1% 6.8% 7.0%
Total Count 182 234 416 % within Gender 100.0% 100.0% 100.0%
χ2 = 2.714, df = 4, p = 0.607
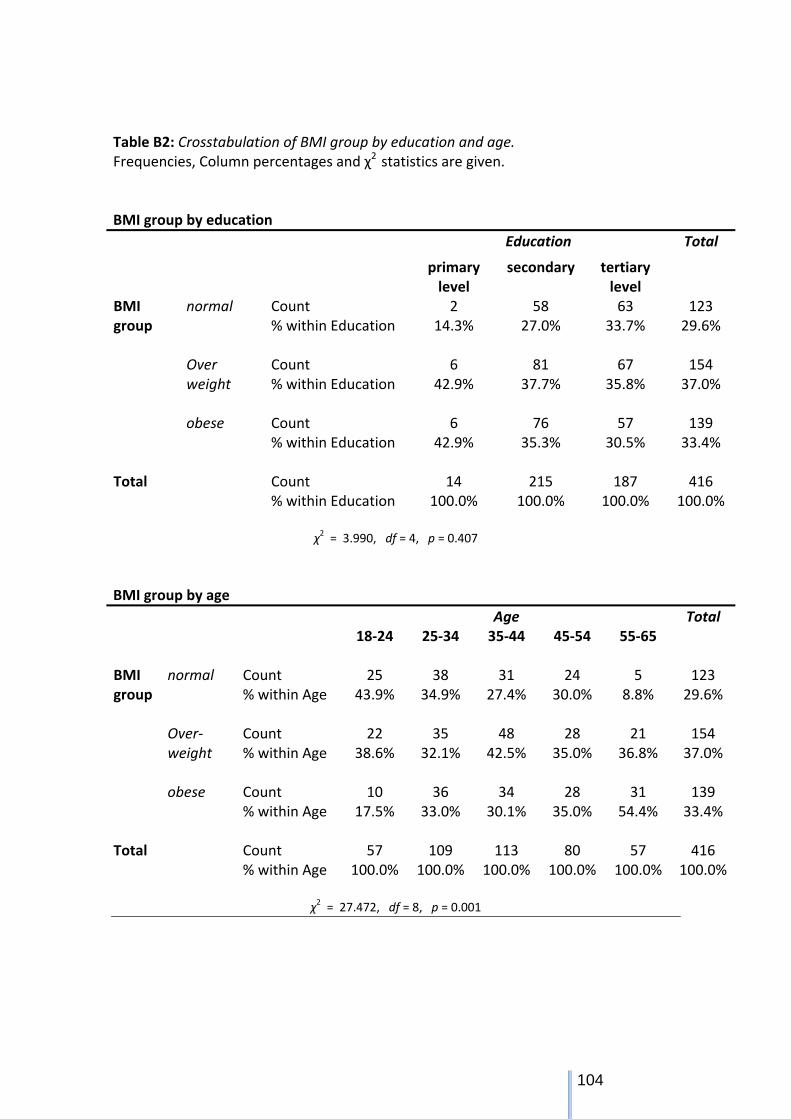
104
Table B2: Crosstabulation of BMI group by education and age. Frequencies, Column percentages and χ2 statistics are given. BMI group by education
Education Total
primary level
secondary tertiary level
BMI group
normal Count 2 58 63 123 % within Education 14.3% 27.0% 33.7% 29.6%
Over weight
Count % within Education
6 42.9%
81 37.7%
67 35.8%
154 37.0%
obese Count 6 76 57 139
% within Education 42.9% 35.3% 30.5% 33.4%
Total Count 14 215 187 416 % within Education 100.0% 100.0% 100.0% 100.0%
χ2 = 3.990, df = 4, p = 0.407
BMI group by age
Age Total 18‐24 25‐34 35‐44 45‐54 55‐65
BMI group
normal Count % within Age
25 43.9%
38 34.9%
31 27.4%
24 30.0%
5 8.8%
123 29.6%
Over‐weight
Count % within Age
22 38.6%
35 32.1%
48 42.5%
28 35.0%
21 36.8%
154 37.0%
obese Count % within Age
10 17.5%
36 33.0%
34 30.1%
28 35.0%
31 54.4%
139 33.4%
Total Count 57 109 113 80 57 416 % within Age 100.0% 100.0% 100.0% 100.0% 100.0% 100.0%
χ2 = 27.472, df = 8, p = 0.001

105
Table B3: Waist circumference by education and age. Frequencies, Column percentages and χ2 statistics are given. Waist circumference by education
Education level Total
primary level
secondary tertiary level
WC group
WC low Count % within Education
2 14.3%
64 29.8%
80 42.8%
146 35.1%
Increased Risk
Count % within Education
5 35.7%
52 24.2%
36 19.3%
93 22.4%
High Risk Count 7 99 71 177 % within Education 50.0% 46.0% 38.0% 42.5%
Total
Count
14
215
187
416
% within Education 100.0% 100.0% 100.0% 100.0%
χ2 = 10.583, df = 4, p = 0.032
Waist circumference by age
Age Total 18‐24 25‐34 35‐44 45‐54 55‐65
WC group
WC low Count % within Age
34 59.6%
44 40.4%
35 31.0%
26 32.5%
7 12.3%
146 35.1%
Increased Risk
Count % within Age
8 14.0%
26 23.9%
34 30.1%
12 15.0%
13 22.8%
93 22.4%
High Risk Count 15 39 44 42 37 177 % within Age 26.3% 35.8% 38.9% 52.5% 64.9% 42.5%
Total
Count
57
109
113
80
57
416
% within Age 100.0% 100.0%
100.0%
100.0% 100.0%
100.0%
χ2 = 40.259, df = 8, p = 0.000

106
Table B4: Crosstabulation of WC risk group by BMI group. Frequencies, Column percentages, χ2 statistics and correlation are given. Waist circumference by BMI
BMIgroup Total normal Over‐
weight obese
WCgroup WC low Count 100 43 3 146
% within BMI 81.3% 27.9% 2.2% 35.1% Increased Risk
Count % within BMI
23
18.7%
53
34.4%
17
12.2%
93
22.4% High Risk Count 0 58 119 177 % within BMI .0% 37.7% 85.6% 42.5%
Total
Count
123
154
139
416
% within BMI 100.0% 100.0% 100.0% 100.0% χ2 = 250.957, df = 4, p = 0.000;
Spearman correlation rs = 0.742, p = 0.000.
Table B5: Table showing frequencies and percentages of different levels of PA. A barchart is also presented.
Frequency Percent
PA_Low 77 18.5
Moderate 176 42.3
High 163 39.2
Total 416 100
Figure B1: Percentages of the different levels of PA
PA_Low Moderate High
PAgroup
0
50
100
150
200
Freq
uenc
y
PAgroup

107
Table B6: Kolmogorov‐Smirnov test of normality for total PA scores and sub‐scores, and of some transformed variables. Variable Z Significance
totalpascore 3.315 0.000 totalscoreva 6.795 0.000 totalscorema 3.625 0.000 totalscorewalk 4.303 0.000 sittotal 1.447 0.030 * logpa 0.785 0.568 + lsittotal 1.242 0.091 *+ transformed variables * logpa = lg10(400+totalpascore) or totalpascore = 10^logpa – 400. + lsittotal = lg10(300+sittotal) or sittotal = 10^lsitttotal – 300.
Table B7: Frequencies and percentages of number of walking days in the leisure domain

Table B8: Kruskal‐Wallis Test for the median of the four PA domains, PA sub‐scores and daily sitting time by gender. (N Males(M) = 182, N Females(F) = 234).
Variable χ2 df Signif. p
Group Lower Quartile
Median
Upper Quartile
PA domains MET‐min/week totalworkmet 26.533 1 0.000
* M F
0.0 0.0
132.0 0.0
3157.0 241.9
totaltravelmet 1.040 1 0.308 M F
0.0 0.0
66.0 99.0
396.0 449.6
Totalgarhom met
45.367 1 0.000*
M F
0.0 177.5
60.0 720.0
773.8 1867.5
totalleismet 0.194 1 0.660 M F
0.0 0.0
198.0 240.0
1078.1 1032.8
PA sub‐scores
MET‐min/week
totalscorewalk 7.824 1 0.005*
M F
198.0 24.8
627.0 396.0
1447.9 1014.8
totalscorema 7.465 1 0.006*
M F
112.5 315.0
720.0 1230.0
2145.0 2700.0
totalscoreva 13.578 1 0.000+
M F
0.0 0.0
0.0 0.0
1440.0 240.0
totalpascore 0.081 1 0.776 M F
891.0 1110.0
2139.0 2286.0
5008.0 3850.5
Daily sitting sittotal 13.115 1 0.000
* M F
257.0 162.9
368.6 287.1
497.1 454.2
* Medians of these variables significantly different by gender. + Median of this variable = 0 for males and females, but upper quartile significantly different by gender.

109
Table B9: Kruskal‐Wallis Test for the median of the four PA domains, PA sub‐scores and daily sitting time by education. (N Primary(P) = 14, N Secondary(S) = 215, N Tertiary(T) = 187).
Variable χ2 df Signif. p
Group Lower Quartile
Median
Upper Quartile
PA domains MET‐min/week totalworkmet 0.344 2 0.842 P
S T
0.0 0.0 0.0
0.0 0.0 0.0
3051.0 1680.0 678.0
totaltravelmet 4.971
2 0.083 P S T
0.0 0.0 0.0
0.0 49.5 99.0
136.1 396.0 412.5
Totalgarhom met
17.37 2 0.000* P S T
127.5 0.0 0.0
2085.0 630.0 180.0
3015.0 1650.0 900.0
totalleismet 3.191 2 0.203 P S T
0.0 0.0 0.0
24.8 198.0 396.0
631.1 960.0 1314.0
PA sub‐scores MET‐min/week
totalscorewalk 1.421
2 0.491 P S T
0.0 132.0 132.0
594.0 594.0 462.0
1212.8 1386.0 1056.0
totalscorema 17.37 2 0.000* P S T
402.5 240.0 180.0
2085.0 1320.0 720.0
5325.0 2880.0 1800.0
totalscoreva 1.879 2 0.391 P S T
0.0 0.0 0.0
0.0 0.0 0.0
720.0 480.0 800.0
totalpascore 6.817
2 0.033* P S T
1235.0 1215.0 918.0
2574.0 2602.5 1956.0
7382.6 4761.0 3546.0
Daily sitting sittotal
50.139 2 0.000* P S T
210.0 154.3 282.9
257.1 265.7 402.9
302.1 398.6 557.1
* Medians of these variables significantly different by education.

110
Table B10: Kruskal‐Wallis Test for the median of the four PA domains, PA sub‐scores and daily sitting time by age. (N 18‐24 years = 57, N 25‐34 = 109, N 35‐44 = 113, N 45‐54 = 80, N 55‐65 = 57).
Variable χ2 df Signif. p
Group Lower Quartile
Median
Upper Quartile
PA domains MET‐min/week totalworkmet 1.720 4 0.787 18‐24
25‐34 35‐44 45‐54 55‐56
0.0 0.0 0.0 0.0 0.0
0.0 0.0 0.0 0.0 0.0
1534.5 1314.0 876.0 953.3 519.0
totaltravelmet 7.854 4 0.097 18‐24 25‐34 35‐44 45‐54 55‐56
0.0 0.0 0.0 0.0 0.0
99.0 66.0 0.0 198.0 198.0
363.0 371.3 297.0 693.0 594.0
totalgarhommet 23.108 4 0.000* 18‐24 25‐34 35‐44 45‐54 55‐56
0.0 0.0 22.5 0.0 0.0
0.0 360.0 510.0 600.0 637.5
360.0 1275.0 1305.0 1755.0 1965.0
totalleismet 7.901 4 0.095 18‐24 25‐34 35‐44 45‐54 55‐56
0.0 0.0 0.0 0.0 0.0
264.0 198.0 186.0 544.5 198.0
918.0 1179.0 795.0 1499.7 727.5
PA sub‐scores MET‐min/week totalscorewalk 10.284 4 0.036 18‐24
25‐34 35‐44 45‐54 55‐56
198.0 33.0 0.0 297.0 198.0
495.0 396.0 445.5 792.0 627.0
1237.5 990.0 1039.5 1765.5 1410.8
totalscorema 15.390 4 0.000* 18‐24 25‐34 35‐44 45‐54 55‐56
0.0 240.0 240.0 360.0 190.0
420.0 1140.0 1080.0 1230.0 1410.0
1030.0 2160.0 2700.0 2700.0 2700.0

111
Table B10 (continued) Variable χ2 df Signif.
p Group Lower
Quartile Median
Upper Quartile
totalscoreva 4.403 4 0.354 18‐24 25‐34 35‐44 45‐54 55‐56
0.0 0.0 0.0 0.0 0.0
0.0 0.0 0.0 0.0 0.0
600.0 960.0 480.0 570.0 120.0
Totalpascore 9.593 4 0.048* 18‐24
25‐34 35‐44 45‐54 55‐56
627.0 1182.0 798.5 1437.0 1006.5
1236.0 2160.0 2092.0 2700.0 2160.0
4030.8 3991.5 4158.0 4999.5 3844.5
Daily sitting sittotal 53.547 4 0.000* 18‐24
25‐34 35‐44 45‐54 55‐56
324.6 222.9 183.2 146.3 170.1
458.6 360.0 319.3 225.0 280.7
589.3 499.6 484.3 327.9 380.7
* Medians of these variables significantly different by age.

112
Figure B2: Number of subjects reporting 00 METs –min/wk in the four domains of the IPAQ.
Figure B3 : Percentages of WC by gender
257
186
134
164
88
86
88
71
169
100
46
93
0 50 100 150 200 250 300
Total Work
Total transportation
Total Gard/home
Total Leisure
Females Males Total
0
5
10
15
20
25
30
35
40
45
50
Males Females
Waist circumference percentages according to gender
Low WC
Increased risk
High risk

113