this report is for information purposes and should not be considered a solicitation to buy or sell...
TRANSCRIPT
This report is for information purposes and should not be considered a solicitation to buy or sell any security. Neither S&P Capital IQ nor any other party guarantees its accuracy or makes warranties regarding results from its usage. Redistribution is prohibited without written permission. Copyright © 2013 by Standard & Poor’s Financial Services LLC. All rights reserved. Standard & Poor’s, S&P and S&P 500 are registered trademarks of the Standard & Poor's Financial Services LLC. All required disclosures and analyst certification appear on pages 19-24 of this presentation.
The Basics of Investing
Sam StovallChief Equity StrategistS&P Capital IQ
January 11, 2013
2. Permission to reprint or distribute any content from this presentation requires the prior written approval of S&P Capital IQ. Not for distribution to the public.
The Basics of Investing
• Why invest?
– Get a piece of the action – legally
– Free $$$
Company matching
Power of compounding
– Deferred consumption

3. Permission to reprint or distribute any content from this presentation requires the prior written approval of S&P Capital IQ. Not for distribution to the public.
Don’t Even THINK of Investing Until…
• Pay down debt
– An easy road to a double-digit return
• Establish an emergency fund
• Get disability insurance
– Disability = the living death
– Protect your greatest asset

4. Permission to reprint or distribute any content from this presentation requires the prior written approval of S&P Capital IQ. Not for distribution to the public.
Measure Twice, Cut Once
• Understand yourself (risk tolerance)
– Are you emotional?
– Or disciplined?
• Match investments with time horizons
– Return OF your money
– Return ON your money

5. Permission to reprint or distribute any content from this presentation requires the prior written approval of S&P Capital IQ. Not for distribution to the public.
Aren’t Stocks Risky?
Annual % Change in S&P 500 (Excluding Dividends) 12/31/45-12/31/12
Source: S&P Capital IQ. Indexes are unmanaged, statistical composites and it is not possible to invest directly in an index. These results are inherently limited because they do not represent the results of actual trading and were constructed with the benefit of hindsight. The returns shown do not reflect payment of any sales charges or fees an investor would pay to purchase the securities they represent. The imposition of these fees and charges would cause actual and back tested performance to be lower than the performance shown. Returns exclude dividends. Past performance is no indication of future results.
-50%-40%-30%-20%-10%
0%10%20%30%40%50%
Y19
46
Y19
49
Y19
52
Y19
55
Y19
58
Y19
61
Y19
64
Y19
67
Y19
70
Y19
73
Y19
76
Y19
79
Y19
82
Y19
85
Y19
88
Y19
91
Y19
94
Y19
97
Y20
00
Y20
03
Y20
06
Y20
09
Y20
12

6. Permission to reprint or distribute any content from this presentation requires the prior written approval of S&P Capital IQ. Not for distribution to the public.
Volatility Was Unusually Low in 2012
Source: S&P Capital IQ. Indexes are unmanaged, statistical composites and it is not possible to invest directly in an index. The returns shown do not reflect payment of any sales charges or fees an investor would pay to purchase the securities they represent. The imposition of these fees and charges would cause actual and back tested performance to be lower than the performance shown. Returns exclude dividends. Past performance is no indication of future results.
Number of One-Day Declines of 2% or More
15
21
3
0
5
10
15
20
25
2000-12 Annual Average 2011 2012

7. Permission to reprint or distribute any content from this presentation requires the prior written approval of S&P Capital IQ. Not for distribution to the public.
More Up Years Than Down Years
Source: S&P Capital IQ. Indexes are unmanaged, statistical composites and it is not possible to invest directly in an index. The returns shown do not reflect payment of any sales charges or fees an investor would pay to purchase the securities they represent. The imposition of these fees and charges would cause actual and back tested performance to be lower than the performance shown. Returns include dividends. Past performance is no indication of future results.
S&P 500 Total Returns 1929-2012
18# of Years 2012
63 201072% 2006 15
2004 2009# of Years 13 1993 2003
24 12 2011 1988 1999 1228% 2000 2007 1986 1998 1997
1990 2005 1979 1996 19951981 1994 1972 1983 19911977 1992 1971 1982 19891969 1987 1968 1976 1985
6 1962 1984 1965 1967 19802001 1953 1978 1964 1963 19751973 1946 1970 1959 1961 1955
3 1966 1939 1960 1952 1951 1945 32 2002 1957 1934 1956 1949 1950 1938 2 1954
1 2008 1974 1941 1932 1948 1944 1943 1936 1958 19351931 1937 1930 1940 1929 1947 1926 1942 1927 1928 1933
(50%)-(40%) (40%)-(30%) (30%)-(20%) (20%)-(10%) (10%)-0% 0%-10% 10%-20% 20%-30% 30%-40% 40%-50% 50%-60%

8. Permission to reprint or distribute any content from this presentation requires the prior written approval of S&P Capital IQ. Not for distribution to the public.
The Power of Compounding (8% Annual Return)
Source: S&P Capital IQ. Past performance is no guarantee of future results.
Years Contribution Portfolio Contribution PortfolioY1 2,000$ 2,160$ -$ Y2 2,000$ 4,493$ -$ Y3 2,000$ 7,012$ -$ Y4 2,000$ 9,733$ -$ Y5 2,000$ 12,672$ -$ Y6 2,000$ 15,846$ -$ Y7 2,000$ 19,273$ -$ Y8 2,000$ 22,975$ -$ Y9 24,813$ 2,000$ 2,160$ Y10 26,798$ 2,000$ 4,493$ Y11 28,942$ 2,000$ 7,012$ Y12 31,257$ 2,000$ 9,733$ Y13 33,758$ 2,000$ 12,672$ Y14 36,459$ 2,000$ 15,846$ Y15 39,375$ 2,000$ 19,273$ Y16 42,525$ 2,000$ 22,975$ Y17 45,927$ 2,000$ 26,973$ Y18 49,602$ 2,000$ 31,291$ Y19 53,570$ 2,000$ 35,954$ Y20 57,855$ 2,000$ 40,991$ Y21 62,484$ 2,000$ 46,430$ Y22 67,482$ 2,000$ 52,304$ Y23 72,881$ 2,000$ 58,649$ Y24 78,711$ 2,000$ 65,500$ Y25 85,008$ 2,000$ 72,900$ Y26 91,809$ 2,000$ 80,893$ Y27 99,154$ 2,000$ 89,524$ Y28 107,086$ 2,000$ 98,846$ Y29 115,653$ 2,000$ 108,914$ Y30 124,905$ 2,000$ 119,787$ Totals 16,000$ 124,905$ 44,000$ 119,787$
9. Permission to reprint or distribute any content from this presentation requires the prior written approval of S&P Capital IQ. Not for distribution to the public.
Investing Is a Journey
• Either you can drive
– Asset allocation
– Securities selection (stocks/funds)
• Or someone else can
– Financial planner/broker
– Mutual fund manager

10. Permission to reprint or distribute any content from this presentation requires the prior written approval of S&P Capital IQ. Not for distribution to the public.
Sage Investment Advice
“A man’s got to know his limitations.”
-- Dirty Harry

11. Permission to reprint or distribute any content from this presentation requires the prior written approval of S&P Capital IQ. Not for distribution to the public.
Many Investors Are
• Indecisive
• Impatient
• Emotional

12. Permission to reprint or distribute any content from this presentation requires the prior written approval of S&P Capital IQ. Not for distribution to the public.
Sector Strategies Using “The Seven Rules of Wall Street”
• Let Your Winners Ride, But Cut Your Losers Short
• As Goes January, So Goes the Year
• Sell in May, Then Go Away
• No Free Lunch on Wall Street (Oh Yeah, Who Says?)
• Don’t Get Mad -- Get Even!
• Don’t Fight the Fed (At Least for Too Long)
• There’s Always a Bull Market Someplace

13. Permission to reprint or distribute any content from this presentation requires the prior written approval of S&P Capital IQ. Not for distribution to the public.
Seasonality: “Sell in May, Then Go Away”Average Semi-Annual S&P 500 Price Changes: 04/30/45-4/30/12
Source: S&P Capital IQ. Indexes are unmanaged, statistical composites and it is not possible to invest directly in an index. The returns shown do not reflect payment of any sales charges or fees an investor would pay to purchase the securities they represent. The imposition of these fees and charges would cause actual and back tested performance to be lower than the performance shown. Returns exclude dividends. Past performance is no indication of future results.
6.9%
1.2%
0%
1%
2%
3%
4%
5%
6%
7%
8%
Nov-Apr May-Oct
14. Permission to reprint or distribute any content from this presentation requires the prior written approval of S&P Capital IQ. Not for distribution to the public.
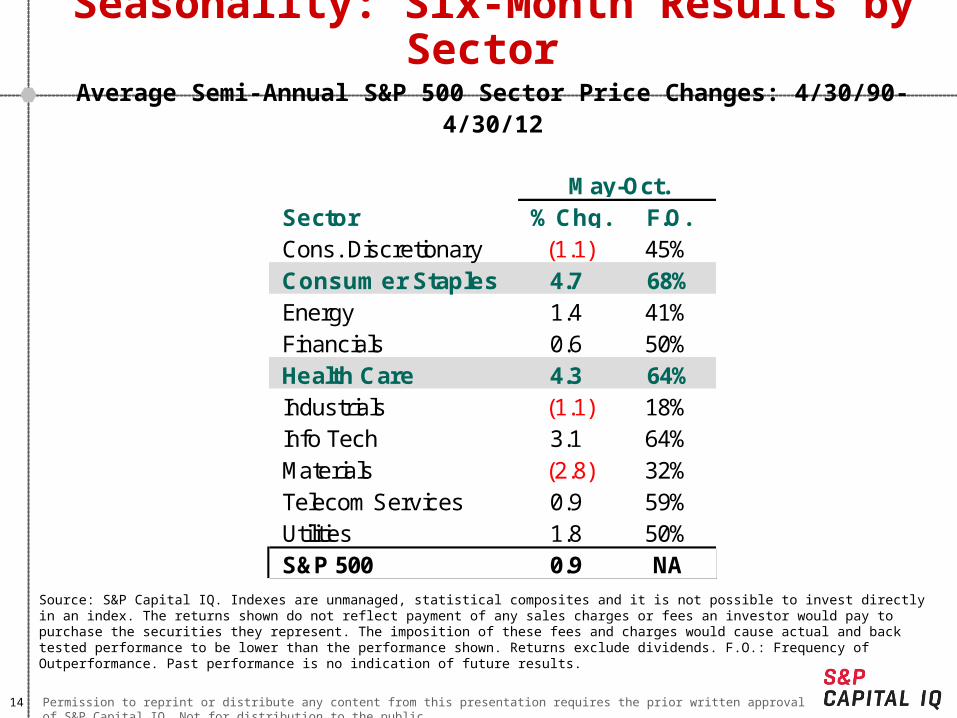
Seasonality: Six-Month Results by Sector
Average Semi-Annual S&P 500 Sector Price Changes: 4/30/90-4/30/12
Source: S&P Capital IQ. Indexes are unmanaged, statistical composites and it is not possible to invest directly in an index. The returns shown do not reflect payment of any sales charges or fees an investor would pay to purchase the securities they represent. The imposition of these fees and charges would cause actual and back tested performance to be lower than the performance shown. Returns exclude dividends. F.O.: Frequency of Outperformance. Past performance is no indication of future results.
Sector % Chg. F.O.Cons. Discretionary (1.1) 45%Consumer Staples 4.7 68%Energy 1.4 41%Financials 0.6 50%Health Care 4.3 64%Industrials (1.1) 18%Info Tech 3.1 64%Materials (2.8) 32%Telecom Services 0.9 59%Utilities 1.8 50%S&P 500 0.9 NA
May-Oct.
15. Permission to reprint or distribute any content from this presentation requires the prior written approval of S&P Capital IQ. Not for distribution to the public.
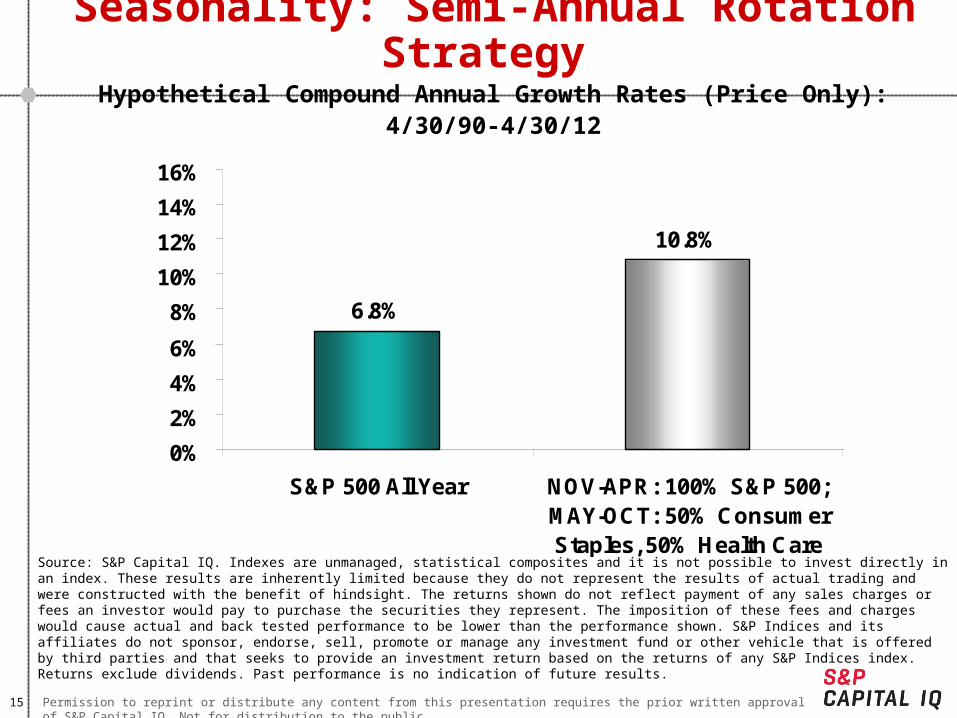
Seasonality: Semi-Annual Rotation Strategy
Hypothetical Compound Annual Growth Rates (Price Only): 4/30/90-4/30/12
Source: S&P Capital IQ. Indexes are unmanaged, statistical composites and it is not possible to invest directly in an index. These results are inherently limited because they do not represent the results of actual trading and were constructed with the benefit of hindsight. The returns shown do not reflect payment of any sales charges or fees an investor would pay to purchase the securities they represent. The imposition of these fees and charges would cause actual and back tested performance to be lower than the performance shown. S&P Indices and its affiliates do not sponsor, endorse, sell, promote or manage any investment fund or other vehicle that is offered by third parties and that seeks to provide an investment return based on the returns of any S&P Indices index. Returns exclude dividends. Past performance is no indication of future results.
6.8%
10.8%
0%
2%
4%
6%
8%
10%
12%
14%
16%
S&P 500 All Year NOV-APR: 100% S&P 500;MAY-OCT: 50% ConsumerStaples, 50% Health Care
NOV-APR: 50% Industrials,50% Materials. MAY-OCT:50% Consumer Staples,
50% Health Care

16. Permission to reprint or distribute any content from this presentation requires the prior written approval of S&P Capital IQ. Not for distribution to the public.
Wall Street Careers: Focus on your Strengths
What kind of a person are you?
17. Permission to reprint or distribute any content from this presentation requires the prior written approval of S&P Capital IQ. Not for distribution to the public.
Glossary
S&P STARS - Since January 1, 1987, S&P Capital IQ Equity Research has ranked a universe of U.S. common stocks, ADRs (American Depositary Receipts), and ADSs (American Depositary Shares) based on a given equity’s potential for future performance. Similarly, S&P Capital IQ Equity Research has used STARS® methodology to rank Asian and European equities since June 30, 2002. Under proprietary STARS (STock Appreciation Ranking System), S&P equity analysts rank equities according to their individual forecast of an equity’s future total return potential versus the expected total return of a relevant benchmark (e.g., a regional index (S&P Asia 50 Index, S&P Europe 350® Index or S&P 500® Index)), based on a 12-month time horizon. STARS was designed to meet the needs of investors looking to put their investment decisions in perspective. Data used to assist in determining the STARS ranking may be the result of the analyst’s own models as well as internal proprietary models resulting from dynamic data inputs.
S&P Quality Rankings (also known as S&P Earnings & Dividend Rankings)- Growth and stability of earnings and dividends are deemed key elements in establishing S&P’s earnings and dividend rankings for common stocks, which are designed to capsulize the nature of this record in a single symbol. It should be noted, however, that the process also takes into consideration certain adjustments and modifications deemed desirable in establishing such rankings. The final score for each stock is measured against a scoring matrix determined by analysis of the scores of a large and representative sample of stocks. The range of scores in the array of this sample has been aligned with the following ladder of rankings:
A+ Highest B- Lower
A High C Lowest
A- Above Average D In Reorganization
B+ Average NR Not Ranked
B Below Average
S&P Issuer Credit Rating - A Standard & Poor’s Issuer Credit Rating is a current opinion of an obligor’s overall financial capacity (its creditworthiness) to pay its financial obligations. This opinion focuses on the obligor’s capacity and willingness to meet its financial commitments as they come due. It does not apply to any specific financial obligation, as it does not take into account the nature of and provisions of the obligation, its standing in bankruptcy or liquidation, statutory preferences, or the legality and enforceability of the obligation. In addition, it does not take into account the creditworthiness of the guarantors, insurers, or other forms of credit enhancement on the obligation.
S&P Capital IQ EPS Estimates – S&P Capital IQ earnings per share (EPS) estimates reflect analyst projections of future EPS from continuing operations, and generally exclude various items that are viewed as special, non-recurring, or extraordinary. Also, S&P Capital IQ EPS estimates reflect either forecasts of S&P Capital IQ equity analysts; or, the consensus (average) EPS estimate, which are independently compiled by Capital IQ, a data provider to S&P Capital IQ Equity Research. Among the items typically excluded from EPS estimates are asset sale gains; impairment, restructuring or merger-related charges; legal and insurance settlements; in process research and development expenses; gains or losses on the extinguishment of debt; the cumulative effect of accounting changes; and earnings related to operations that have been classified by the company as discontinued. The inclusion of some items, such as stock option expense and recurring types of other charges, may vary, and depend on such factors as industry practice, analyst judgment, and the extent to which some types of data is disclosed by companies.
S&P Core Earnings – S&P Capital IQ Core Earnings is a uniform methodology for adjusting operating earnings by focusing on a company's after-tax earnings generated from its principal businesses. Included in the S&P Capital IQ definition are employee stock option grant expenses, pension costs, restructuring charges from ongoing operations, write-downs of depreciable or amortizable operating assets, purchased research and development, M&A related expenses and unrealized gains/losses from hedging activities. Excluded from the definition are pension gains, impairment of goodwill charges, gains or losses from asset sales, reversal of prior-year charges and provision from litigation or insurance settlements.
S&P 12 Month Target Price – The S&P Capital IQ equity analyst’s projection of the market price a given security will command 12 months hence, based on a combination of intrinsic, relative, and private market valuation metrics, including S&P Fair Value.
18. Permission to reprint or distribute any content from this presentation requires the prior written approval of S&P Capital IQ. Not for distribution to the public.
Glossary
S&P Capital IQ Equity Research – S&P Capital IQ Equity Research U.S. includes Standard & Poor’s Investment Advisory Services LLC; Standard & Poor’s Equity Research Services Europe includes McGraw-Hill Financial Research Europe Limited trading as Standard & Poor’s; Standard & Poor’s Equity Research Services Asia includes McGraw-Hill Financial Singapore Pte. Limited’s offices in Singapore, Standard & Poor’s Investment Advisory Services (HK) Limited in Hong Kong, Standard & Poor’s Malaysia Sdn Bhd, and Standard & Poor’s Information Services (Australia) Pty Ltd.
Abbreviations Used in S&P Capital IQ Equity Research Reports
CAGR- Compound Annual Growth Rate
CAPEX- Capital Expenditures
CY- Calendar Year
DCF- Discounted Cash Flow
EBIT- Earnings Before Interest and Taxes
EBITDA- Earnings Before Interest, Taxes, Depreciation and Amortization
EPS- Earnings Per Share
EV- Enterprise Value
FCF- Free Cash Flow
FFO- Funds From Operations
FY- Fiscal Year
P/E- Price/Earnings
PEG Ratio- P/E-to-Growth Ratio
PV- Present Value
R&D- Research & Development
ROE- Return on Equity
ROI- Return on Investment
ROIC- Return on Invested Capital
ROA- Return on Assets
SG&A- Selling, General & Administrative Expenses
WACC- Weighted Average Cost of Capital
Dividends on American Depository Receipts (ADRs) and American Depository Shares (ADSs) are net of taxes (paid in the country of origin).
19. Permission to reprint or distribute any content from this presentation requires the prior written approval of S&P Capital IQ. Not for distribution to the public.
Required Disclosures
In contrast to the qualitative STARS recommendations covered in this report, which are determined and assigned by S&P Capital IQ equity analysts, S&P’s quantitative evaluations are derived from S&P’s proprietary Fair Value quantitative model. In particular, the Fair Value Ranking methodology is a relative ranking methodology, whereas the STARS methodology is not. Because the Fair Value model and the STARS methodology reflect different criteria, assumptions and analytical methods, quantitative evaluations may at times differ from (or even contradict) an equity analyst’s STARS recommendations. As a quantitative model, Fair Value relies on history and consensus estimates and does not introduce an element of subjectivity as can be the case with equity analysts in assigning STARS recommendations.
S&P Global STARS Distribution
In North America
As of September 28, 2012, research analysts at S&P Capital IQ Equity Research North America recommended 37.9% of issuers with buy recommendations, 55.9% with hold recommendations and 6.2% with sell recommendations.
In Europe
As of September 28, 2012, research analysts at S&P Capital IQ Equity Research Europe recommended 31.8% of issuers with buy recommendations, 50.8% with hold recommendations and 17.4% with sell recommendations.
In Asia
As of September 28, 2012, research analysts at S&P Capital IQ Equity Research Asia recommended 38.3% of issuers with buy recommendations, 52.3% with hold recommendations and 9.4% with sell recommendations.
Globally
As of September 28, 2012, research analysts at S&P Capital IQ Equity Research globally recommended 37.0% of issuers with buy recommendations, 54.8% with hold recommendations and 8.2% with sell recommendations.
5-STARS (Strong Buy): Total return is expected to outperform the total return of a relevant benchmark, by a wide margin over the coming 12 months, with shares rising in price on an absolute basis.
4-STARS (Buy): Total return is expected to outperform the total return of a relevant benchmark over the coming 12 months, with shares rising in price on an absolute basis.
3-STARS (Hold): Total return is expected to closely approximate the total return of a relevant benchmark over the coming 12 months, with shares generally rising in price on an absolute basis.
2-STARS (Sell): Total return is expected to underperform the total return of a relevant benchmark over the coming 12 months, and the share price is not anticipated to show a gain.
1-STARS (Strong Sell): Total return is expected to underperform the total return of a relevant benchmark by a wide margin over the coming 12 months, with shares falling in price on an absolute basis.
20. Permission to reprint or distribute any content from this presentation requires the prior written approval of S&P Capital IQ. Not for distribution to the public.
Required Disclosures
Relevant benchmarks: In North America, the relevant benchmark is the S&P 500 Index, in Europe and in Asia, the relevant benchmarks are generally the S&P Europe 350 Index and the S&P Asia 50 Index.
For All Regions:
All of the views expressed in this research report accurately reflect the research analyst's personal views regarding any and all of the subject securities or issuers. No part of analyst compensation was, is, or will be, directly or indirectly, related to the specific recommendations or views expressed in this research report. Analysts generally update stock reports at least four times each year.
S&P Global Quantitative Recommandations Distribution
In North America
As of September 28, 2012, Standard & Poor's Quantitative Services North America recommended 40.0% of issuers with buy recommendations, 20.1% with hold recommendations and 39.9% with sell recommendations.
In Europe
As of September 28, 2012, Standard & Poor's Quantitative Services Europe recommended 43.4% of issuers with buy recommendations, 20.9% with hold recommendations and 35.7% with sell recommendations.
In Asia
As of September 28, 2012, Standard & Poor's Quantitative Services Asia recommended 53.0% of issuers with buy recommendations, 18.9% with hold recommendations and 28.1% with sell recommendations.
Globally
As of September 28, 2012, Standard & Poor's Quantitative Services globally recommended 46.5% of issuers with buy recommendations, 19.8% with hold recommendations and 33.7% with sell recommendations.

21. Permission to reprint or distribute any content from this presentation requires the prior written approval of S&P Capital IQ. Not for distribution to the public.
Required Disclosures
About Capital IQ’s Distributors Disclosures
This report has been prepared and issued by S&P Capital IQ and/or one of its affiliates. In the United States, research reports are prepared by Standard & Poor’s Investment Advisory Services LLC (“SPIAS”). In the United States, research reports are issued by Standard & Poor’s Financial Services LLC (“S&P”); in the United Kingdom by McGraw-Hill Financial Research Europe Limited, which is authorized and regulated by the Financial Services Authority and trades as Standard & Poor’s; in Hong Kong by Standard & Poor’s Investment Advisory Services (HK) Limited, which is regulated by the Hong Kong Securities Futures Commission; in Singapore by McGraw-Hill Financial Singapore Pte. Limited (MHFSPL), which is regulated by the Monetary Authority of Singapore; in Malaysia by Standard & Poor’s Malaysia Sdn Bhd (“S&PM”), which is regulated by the Securities Commission; in Australia by Standard & Poor’s Information Services (Australia) Pty Ltd (“SPIS”), which is regulated by the Australian Securities & Investments Commission; and in Korea by SPIAS, which is also registered in Korea as a cross-border investment advisory company.
The research and analytical services performed by SPIAS, McGraw-Hill Financial Research Europe Limited, MHFSPL, S&PM, and SPIS are each conducted separately from any other analytical activity of S&P Capital IQ.
S&P Capital IQ or an affiliate may license certain intellectual property or provide pricing or other services to, or otherwise have a financial interest in, certain issuers of securities, including exchange-traded investments whose investment objective is to substantially replicate the returns of a proprietary Standard & Poor's index, such as the S&P 500. In cases where S&P Capital IQ or an affiliate is paid fees that are tied to the amount of assets that are invested in the fund or the volume of trading activity in the fund, investment in the fund will generally result in S&P Capital IQ or an affiliate earning compensation in addition to the subscription fees or other compensation for services rendered by S&P Capital IQ. A reference to a particular investment or security by S&P Capital IQ and/or one of its affiliates is not a recommendation to buy, sell, or hold such investment or security, nor is it considered to be investment advice.
Indexes are unmanaged, statistical composites and their returns do not include payment of any sales charges or fees an investor would pay to purchase the securities they represent. Such costs would lower performance. It is not possible to invest directly in an index.
S&P Capital IQ and its affiliates provide a wide range of services to, or relating to, many organizations, including issuers of securities, investment advisers, broker-dealers, investment banks, other financial institutions and financial intermediaries, and accordingly may receive fees or other economic benefits from those organizations, including organizations whose securities or services they may recommend, rate, include in model portfolios, evaluate or otherwise address.
For details on the S&P Capital IQ research objectivity and conflict-of-interest policies, please visit:
http://www.standardandpoors.com/products-services/equity-research-main/en/us/
For a list of companies mentioned in this report with whom S&P Capital IQ and/or one of its affiliates has had business relationships within the past year, please go to:
http://www.standardandpoors.com/products-services/articles/en/us/?assetID=1245187982940
22. Permission to reprint or distribute any content from this presentation requires the prior written approval of S&P Capital IQ. Not for distribution to the public.
Disclaimers
With respect to reports issued to clients in a language other than English and in the case of inconsistencies between the English and translated versions of a report, the English version prevails. Neither S&P Capital IQ nor its affiliates guarantee the accuracy of the translation. Assumptions, opinions and estimates constitute our judgment as of the date of this material and are subject to change without notice. Past performance is not necessarily indicative of future results.
S&P Capital IQ, its affiliates, and any third-party providers, as well as their directors, officers, shareholders, employees or agents (collectively S&P Parties) do not guarantee the accuracy, completeness or adequacy of this material, and S&P Parties shall have no liability for any errors, omissions, or interruptions therein, regardless of the cause, or for the results obtained from the use of the information provided by the S&P Parties. S&P PARTIES DISCLAIM ANY AND ALL EXPRESS OR IMPLIED WARRANTIES, INCLUDING, BUT NOT LIMITED TO, ANY WARRANTIES OF MERCHANTABILITY, SUITABILITY OR FITNESS FOR A PARTICULAR PURPOSE OR USE. In no event shall S&P Parties be liable to any party for any direct, indirect, incidental, exemplary, compensatory, punitive, special or consequential damages, costs, expenses, legal fees, or losses (including, without limitation, lost income or lost profits and opportunity costs) in connection with any use of the information contained in this document even if advised of the possibility of such damages. Capital IQ is a business of S&P Capital IQ.
Ratings from Standard & Poor’s Ratings Services are statements of opinion as of the date they are expressed and not statements of fact or recommendations to purchase, hold, or sell any securities or to make any investment decisions. Standard & Poor’s assumes no obligation to update its opinions following publication in any form or format. Standard & Poor’s ratings should not be relied on and are not substitutes for the skill, judgment and experience of the user, its management, employees, advisors and/or clients when making investment and other business decisions. Standard & Poor’s rating opinions do not address the suitability of any security. Standard & Poor’s does not act as a fiduciary. While Standard & Poor’s has obtained information from sources it believes to be reliable, Standard & Poor’s does not perform an audit and undertakes no duty of due diligence or independent verification of any information it receives.
S&P Capital IQ keeps certain activities of its business units separate from each other in order to preserve the independence and objectivity of their respective activities. As a result, certain business units of S&P Capital IQ may have information that is not available to other S&P Capital IQ business units. S&P Capital IQ has established policies and procedures to maintain the confidentiality of certain non-public information received in connection with each analytical process.
Standard & Poor’s Ratings Services did not participate in the development of this report. Standard & Poor’s may receive compensation for its ratings and certain credit-related analyses, normally from issuers or underwriters of securities or from obligors. Standard & Poor’s reserves the right to disseminate its opinions and analyses. Standard & Poor’s public ratings and analyses are made available on its Web sites, www.standardandpoors.com (free of charge), and www.ratingsdirect.com and www.globalcreditportal.com (subscription), and may be distributed through other means, including via Standard & Poor’s publications and third-party redistributors. Additional information about our ratings fees is available at www.standardandpoors.com/usratingsfees.
This material is not intended as an offer or solicitation for the purchase or sale of any security or other financial instrument. Securities, financial instruments or strategies mentioned herein may not be suitable for all investors. Any opinions expressed herein are given in good faith, are subject to change without notice, and are only current as of the stated date of their issue. Prices, values, or income from any securities or investments mentioned in this report may fall against the interests of the investor and the investor may get back less than the amount invested. Where an investment is described as being likely to yield income, please note that the amount of income that the investor will receive from such an investment may fluctuate. Where an investment or security is denominated in a different currency to the investor’s currency of reference, changes in rates of exchange may have an adverse effect on the value, price or income of or from that investment to the investor. The information contained in this report does not constitute advice on the tax consequences of making any particular investment decision. This material is not intended for any specific investor and does not take into account your particular investment objectives, financial situations or needs and is not intended as a recommendation of particular securities, financial instruments or strategies to you. Before acting on any recommendation in this material, you should consider whether it is suitable for your particular circumstances and, if necessary, seek professional advice.
Additional information on the subject company may be available upon request.

23. Permission to reprint or distribute any content from this presentation requires the prior written approval of S&P Capital IQ. Not for distribution to the public.
Disclaimers
Each S&P Capital IQ research report is not directed to, or intended for distribution to or use by, any person or entity who is a citizen or resident of or located in any locality, state, country or other jurisdiction where such distribution, publication, availability or use would be contrary to law or regulation or which would subject Standard & Poor’s or its affiliates to any registration or licensing requirements in such jurisdiction.
For residents of Australia – Research reports are distributed by Standard & Poor's Information Services (Australia) Pty Ltd ("SPIS") in Australia. Any express or implied opinion contained in this report is limited to "General Advice" and based solely on consideration of the investment merits of the financial product(s) alone. The information in this report has not been prepared for use by retail investors and has been prepared without taking account of any particular person's financial or investment objectives, financial situation or needs. Before acting on any advice, any person using the advice should consider its appropriateness having regard to their own or their clients' objectives, financial situation and needs. You should obtain a Product Disclosure Statement relating to the product and consider the statement before making any decision or recommendation about whether to acquire the product. Each opinion must be weighed solely as one factor in any investment decision made by or on behalf of any adviser and any such adviser must accordingly make their own assessment taking into account an individual's particular circumstances. SPIS holds an Australian Financial Services License Number 258896. Please refer to the SPIS Financial Services Guide for more information at http://reports.fundsinsights.com.au/static/FinancialServicesGuide.pdf
Warning: Past performance is not a reliable indicator of future performance. Any express or implied Standard & Poor's rating or advice is limited to "General Advice" and based solely on consideration of the investment merits of the financial product(s) alone. The information has not been prepared for use by retail investors and has been prepared without taking account of any particular person's financial or investment objectives, financial situation or needs. Before acting on any advice, any person using the advice should consider its appropriateness having regard to their own or their clients' objectives, financial situation and needs. You should obtain a Product Disclosure Statement relating to the product and consider the statement before making any decision or recommendation about whether to acquire the product. Each rating or other opinion must be weighed solely as one factor in any investment decision made by or on behalf of any adviser and any such adviser must accordingly make their own assessment taking into account an individual's particular circumstances.
Standard & Poor's from time-to-time provides fund managers and other clients with investment data, research software, and other financial planning services. Standard & Poor's is a wholly owned member of The McGraw-Hill Companies, Inc., a New York Corporation. The analytic services and products provided by Standard & Poor's and its associates are the result of separate activities in order to preserve the independence and objectivity of each analytic process. Each analytic product or service is based on information received by the analytic group responsible for such product or service. Standard & Poor's and its associates have established policies and procedures to maintain the confidentiality of non-public information received during each analytic process. STANDARD & POOR’S and S&P are registered trademarks of Standard & Poor’s Financial Services LLC. Copyright ©2012 Standard & Poor's Information Services (Australia) Pty Limited. Certain funds data contained herein may be proprietary to Morningstar, Inc.
For residents of Dubai (DIFC): The information contained in research reports distributed by S&P Capital IQ is intended for persons who are “professional clients” as defined in Rule 2.3.2(2) of the Conduct of Business Module (COB) of the DFSA Rulebook.
For residents of Hong Kong - Research reports are distributed in Hong Kong by Standard & Poor’s Investment Advisory Services (HK) Limited, which is regulated by the Hong Kong Securities Futures Commission. No information in the research reports shall be treated as soliciting, offering or inducing or attempting to induce any person to enter into an agreement for or with a view to acquire, dispose, subscribe or underwrite any securities and shall not be construed to imply any relationship, advisory or otherwise, between S&P and the recipient user of the report unless expressly agreed by S&P Capital IQ. S&P Capital IQ is not acting nor should it be deemed to be acting, as a "fiduciary" or as an "investment manager" or "investment advisor" to any recipient of this information unless expressly agreed by S&P Capital IQ.
For residents of Malaysia - All queries in relation to this report should be referred to Ching Wah Tam and Ahmad Halim.

24. Permission to reprint or distribute any content from this presentation requires the prior written approval of S&P Capital IQ. Not for distribution to the public.
Disclaimers
For residents of Saudi Arabia: Residents of Saudi Arabia should be aware that the distributor of this research report may not be permitted to distribute the investment research either (i) from a permanent place of business in or otherwise within the territory of the Kingdom of Saudi Arabia; or (ii) to a person in the Kingdom of Saudi Arabia unless that person is a CMA authorized person or the Saudi Arabian Monetary Agency.
For residents of Singapore - S&P Capital IQ’s research reports are issued in Singapore by McGraw-Hill Financial Singapore Pte. Limited, which is regulated by the Monetary Authority of Singapore. Any recommendations contained in the reports are intended for general circulation and do not take into account the specific investment objectives, financial situation or particular needs of any particular person. Advice should be sought from a financial adviser regarding the suitability of an investment product, taking into account the specific investment objectives, financial situation or particular needs of any person in receipt of the recommendation, before the person makes a commitment to purchase an investment product.
Users of Extracts from S&P Capital IQ research reports should be aware that the reports are not prepared, issued or reviewed by McGraw-Hill Financial Singapore Pte. Limited and McGraw-Hill Financial Singapore Pte. Limited assumes no responsibility for the research reports, and nothing referenced by McGraw-Hill Financial Singapore Pte. Limited should be considered to be a solicitation or recommendation to buy or sell any security, nor should it be considered to be investment advice.
For residents of the United Arab Emirates (UAE): Standard & Poor’s and its affiliates neither undertake banking, financial, or investment consultations business in or into the UAE within the meaning of the Central Bank Board of Directors’ Resolution No. 164/8/94 regarding the regulations for investment companies nor provides financial analysis or consultation services in or into the UAE within the meaning of UAE SECURITIES AND COMMODITIES AUTHORITY DECISION NO. 48/R OF 2008 concerning financial consultation and financial analysis. If you do not understand any of the contents of the service, you should contact a financial advisor.
Investment research distributed by Standard & Poor’s and its affiliates is not and is not intended to amount to an offer of securities within the meaning of DIFC Law NO. 12 OF 2004 (the DIFC Markets Law) or the equivalent laws, rules and regulations made by the Central Bank of the UAE and their Emirates Securities and Commodities Authority. Neither the Dubai Financial Services Authority, the UAE Securities nor Commodities Authority of the Central Bank of the UAE has reviewed or verified any of the information provided through the service, or has any responsibility for it. If you do not understand any of the contents of the service, you should contact a financial advisor. Users of extracts of investment research reports should be aware that if it is distributed in the UAE by an intermediary, the intermediary is solely responsible for the distribution and content of the investment research in the UAE.
For residents of the United Kingdom - For residents of the U.K. - This report is only directed at and should only be relied on by persons outside of the United Kingdom or persons who are inside the United Kingdom and who have professional experience in matters relating to investments or who are high net worth persons, as defined in Article 19(5) or Article 49(2) (a) to (d) of the Financial Services and Markets Act 2000 (Financial Promotion) Order 2001, respectively. S&P Capital IQ’s Stock Reports, are to be read in conjunction with “Your Guide to S&P Capital IQ’s Stock Reports” which can be found at www.standardandpoors.com/stockreportguide.
Additional country-specific disclosures can be found at http://www.standardandpoors.com/regulatory-affairs/equity-research/en/us.
STANDARD & POOR’S, S&P, S&P 500, S&P Europe 350 and STARS are registered trademarks of Standard & Poor’s Financial Services LLC.
25. Permission to reprint or distribute any content from this presentation requires the prior written approval of S&P Capital IQ. Not for distribution to the public.
Copyright © 2012 by Standard & Poor’s Financial Services LLC (S&P), a subsidiary of The McGraw-Hill Companies, Inc. All rights reserved. No content (including ratings, credit-related analyses and data, model, software or other application or output therefrom) or any part thereof (Content) may be modified, reverse engineered, reproduced or distributed in any form by any means, or stored in a database or retrieval system, without the prior written permission of S&P. The Content shall not be used for any unlawful or unauthorized purposes. S&P, its affiliates, and any third-party providers, as well as their directors, officers, shareholders, employees or agents (collectively S&P Parties) do not guarantee the accuracy, completeness, timeliness or availability of the Content. S&P Parties are not responsible for any errors or omissions, regardless of the cause, for the results obtained from the use of the Content, or for the security or maintenance of any data input by the user. The Content is provided on an “as is” basis. S&P PARTIES DISCLAIM ANY AND ALL EXPRESS OR IMPLIED WARRANTIES, INCLUDING, BUT NOT LIMITED TO, ANY WARRANTIES OF MERCHANTABILITY OR FITNESS FOR A PARTICULAR PURPOSE OR USE, FREEDOM FROM BUGS, SOFTWARE ERRORS OR DEFECTS, THAT THE CONTENT’S FUNCTIONING WILL BE UNINTERRUPTED OR THAT THE CONTENT WILL OPERATE WITH ANY SOFTWARE OR HARDWARE CONFIGURATION. In no event shall S&P Parties be liable to any party for any direct, indirect, incidental, exemplary, compensatory, punitive, special or consequential damages, costs, expenses, legal fees, or losses (including, without limitation, lost income or lost profits and opportunity costs) in connection with any use of the Content even if advised of the possibility of such damages.
Credit-related analyses, including ratings, and statements in the Content are statements of opinion as of the date they are expressed and not statements of fact or recommendations to purchase, hold, or sell any securities or to make any investment decisions. S&P assumes no obligation to update the Content following publication in any form or format. The Content should not be relied on and is not a substitute for the skill, judgment and experience of the user, its management, employees, advisors and/or clients when making investment and other business decisions. S&P’s opinions and analyses do not address the suitability of any security. S&P does not act as a fiduciary or an investment advisor. While S&P has obtained information from sources it believes to be reliable, S&P does not perform an audit and undertakes no duty of due diligence or independent verification of any information it receives.
S&P keeps certain activities of its business units separate from each other in order to preserve the independence and objectivity of their respective activities. As a result, certain business units of S&P may have information that is not available to other S&P business units. S&P has established policies and procedures to maintain the confidentiality of certain non–public information received in connection with each analytical process.
S&P may receive compensation for its ratings and certain credit-related analyses, normally from issuers or underwriters of securities or from obligors. S&P reserves the right to disseminate its opinions and analyses. S&P's public ratings and analyses are made available on its Web sites, www.standardandpoors.com (free of charge), and www.ratingsdirect.com and www.globalcreditportal.com (subscription), and may be distributed through other means, including via S&P publications and third-party redistributors. Additional information about our ratings fees is available at www.standardandpoors.com/usratingsfees.
STANDARD & POOR’S and S&P are registered trademarks of Standard & Poor’s Financial Services LLC.
www.standardandpoors.com