this page intentionally left blank doc/2015 ood csna report web... · this page intentionally left...
TRANSCRIPT

2015 Vocational Rehabilitation Comprehensive Statewide Needs Assessment
2
This Page Intentionally Left Blank

2015 Vocational Rehabilitation Comprehensive Statewide Needs Assessment
3
Acknowledgements Special Thanks to the following advisory groups and agencies:
Consumer Advisory Committee (CAC) for providing valuable feedback on the Opportunities for
Ohioans with Disabilities (OOD) Participant Survey. Special thanks to CAC members Victoria
Baker-Willford and Shonda Causey, and OOD Commission Chair Jacqueline Romer-Sensky, for
their time in helping administer the phone portion of the survey.
Workforce Integration Taskforce for their focus on engaging in focus groups and surveys of
employers and individuals that supported their work in making recommendations that
specifically address the needs of individuals with visual and hearing impairments.
State agency partners and key staff for their time in providing data and explanations for the
purposes of understanding state agency data:
Ohio Department of Aging - Marc Molea, Chief, Strategic Partnerships and Stakeholder Relations Ohio Department of Developmental Disabilities - Kristen Helling, Community Advisor, Ohio Department of Developmental Disabilities Ohio Department of Education - Lawrence Dennis, Educational Consultant, Secondary Transition Services Ohio Department of Job and Family Services - Lewis Horner, Labor Market Administrator, Julie McKay, Project Manager, and Tanya Calbert, Project Manager
Ohio Department of Mental Health and Addiction Services - Kraig J. Knudsen, Ph.D., Chief, Office of Research and Evaluation Ohio Department of Veterans’ Services - Danny Eakins, Veterans Programs Administrator Ohio Development Services Agency - Dr. Jian He – State Demographer, Research Office
2015 CSNA Research and Analysis Resources Opportunities for Ohioans with Disabilities Agency
Raivo Murnieks, Deputy Director, Division of Performance & Innovation (CSNA Lead)
Susan Pugh, Deputy Director, Division of Vocational Rehabilitation (VR Policy)
Stephen Trammell, Planner, Division of Performance & Innovation (OOD Trend Data and Maps)
Christy Hauck, Performance & Reporting Manager, Division of Performance & Innovation (Surveys)
Shelly Rhodes, AWARE Manager, Division of Performance & Innovation (Social Security Analysis)
Maria Seaman, Budget Manager, Division of Fiscal Management (Budget Trends)
Bruce Willis, Database Administrator, Information Technology (OOD and OhioMeansJobs)
Kent State University
Research and Evaluation Bureau and The Center for Innovation in Transition and Employment
Dr. Robert Baer, Dr. Deborah Shama, and Eddie Bolden “Transition-age Youth and Young Adults”
analysis report.

2015 Vocational Rehabilitation Comprehensive Statewide Needs Assessment
4
Executive Summary
Opportunities for Ohioans with Disabilities (OOD), Division of Performance and Innovation (DPI), produced this 2015 Comprehensive Statewide Needs Assessment (CSNA) building upon the framework methodology developed from the 2012 CSNA, which was designed to assess the vocational rehabilitation (VR) service needs of individuals related to six primary disability categories. These disabilities include visual impairments, hearing impairments, communicative impairments, physical impairments, psychosocial impairments and cognitive impairments. This methodology focuses on penetration rates (of the extent to which OOD was serving prospective jobseekers with disabilities), and proportionality (how well OOD is balanced in serving the cross-section of individuals with disabilities who are seeking employment). In order to position OOD to effectively meet the workforce needs of employers, as well as the new federal Workforce Innovation and Opportunity Act (WIOA) of 2014, the methodology for this CSNA is being applied to focus on the working age population, as well as identifying success factors for serving youth and students with disabilities. OOD contracted with Kent State University, which has been on the forefront of the Ohio Longitudinal Transition Study, to analyze and make recommendations specifically related to serving youth and students with disabilities. Additions to the 2015 CSNA include:
A summary evaluation of the progress made on the 12 recommendations from the 2012 CSNA.
2014 Workforce Integration Task Force - Data Analysis, Surveys and Focus Group Data, based on the Task Force Recommendations Report to the Governor that focuses on better outreach and services to advance employment outcomes for individuals with visual and hearing impairments.
The automation of penetration and proportionality data, which will enable OOD’s bureaus of Vocational Rehabilitation and Services for Visually Impaired to interactively analyze existing service levels with projected needs.
Data Collection Strategies OOD developed 2016 projections of the number of individuals with disabilities by category and county of residence in Ohio. Similarly, service data from OOD’s VR case management system and employment statistics were utilized to develop estimates of the number of individuals likely to need VR services by disability category and by county. This provided a basis for developing estimates of the number of individuals actively participating in the labor force that need services to assist them in finding a job and could benefit from OOD VR services. Information was used from other key agencies that serve individuals with disabilities through the analysis of a variety of reports, documents and service data. As a follow-up to the 2012 CSNA recommendations, OOD has aggressively gathered and analyzed data through the Workforce Integration Taskforce (WIT), focused on services for individuals who are deaf and blind, as well as service delivery capacity available through Ohio’s network of Community Rehabilitation Programs (CRPs). Data collection strategies, including surveys of individuals with disabilities and employers, is described in detail in later sections of this report and data collection instruments are included in Appendices. OOD contracted with Kent State University, as a compliment to the Ohio Longitudinal Transition Study, to specifically address the six questions regarding youth and students with disabilities. Finally, a Survey of Disability and Employment (SDE) (Mathematica, 2014), of over 1,000 OOD VR applicants was conducted to assist OOD to better understand the needs of individuals with disabilities.

2015 Vocational Rehabilitation Comprehensive Statewide Needs Assessment
5
Need for Services Review of Existing Data. According to the American Community Survey (ACS), in 2013 more than 1.5 million (13.6 percent) Ohioans experience disabilities; which ranks Ohio 6th among states/territories in the number of residents with disabilities and 20th in the percentage of individuals with disabilities of total population. For Ohioans age 18 to 64, ambulatory disabilities are the largest category of disabilities (50.9 percent of individuals with disabilities) and visual impairments are the smallest (17.4 percent of individuals with disabilities). Approximately one-third (33.5 percent) of individuals with disabilities ages 18 to 64 were employed and 31.8 percent were living in poverty. As might be anticipated, individuals with disabilities tend to earn less than individuals without disabilities. The median annual income for individuals with disabilities was $18,960 while the median annual income for individuals without disabilities was $30,271. These patterns also hold true for veterans with disabilities. (Institute on Disability)
In 2014, as compared to 2011:
OOD received $15,706,680, which was a 21 percent increase, in General Revenue Funding;
4,580 OOD participants, or 36 percent more, achieved a successful employment outcome;
85 percent increase in the number new VR case service plans written. Race and Ethnicity. ACS 2012 (Erickson, Lee, & von Schrader, 2014) data indicate that the estimated prevalence of disability for working age Ohioans (age 21-64) was: 11.7 percent among whites, estimated 647,300 individuals 17.0 percent among Black/African Americans, estimated 131,800 individuals 4.3 percent among Asians, estimated 5,600 individuals 29.1 percent among Native Americans, estimated 4,400 individuals 15.9 percent other race(s), estimated 23,400 In 2014, OOD served 27,227 individuals; 6,941 or 25.2 percent were African American. Estimates indicate that 17.0 percent of working age African Americans experience disabilities. This translates into 160,044 Ohioans. Other estimates indicate that of the more than 30 percent or 54,000 African Americans with disabilities, almost 31 percent (or 15,000), may be seeking employment at any particular point in time. Thus, OOD is serving approximately 46.3 percent of working age African Americans who are seeking employment and could benefit from VR services. More than eight (8) out of 10 working age African Americans (80.5 percent) reside in the following seven Ohio counties: Cuyahoga, Franklin, Hamilton, Montgomery, Lucas, Summit, and Mahoning. (U.S. Census - ACS, 2013) (Erickson, Lee, & von Schrader, 2014)

2015 Vocational Rehabilitation Comprehensive Statewide Needs Assessment
6
Hispanic/Latino Population. In 2013, 3.2 percent (or 367,394) of Ohio’s population was comprised of individuals with an ethnicity of Latino or Hispanic. Estimates indicate that 10.3 percent of Hispanics experience disabilities (Erickson, Lee, & von Schrader, 2014). Thus 37,842 individuals of all ages of individuals of Latino/Hispanic ethnicity experience a disability in Ohio; for working age population, the prevalence of disability is estimated to be 11.0 percent which translates into 25,382 individuals. Other estimates indicate that 13.9 percent, or 1,610 of Hispanic/Latino ethnicity actively participating in the labor force, but not employed, may be seeking employment at any specific point in time. Thus, OOD is serving approximately 34.7 percent of Hispanics who could benefit from OOD VR services. Almost two-thirds of Ohio’s Hispanic working population (230,742 individuals) reside in Butler, Cuyahoga, Franklin, Hamilton, Lorain, Lucas, Mahoning, and Montgomery counties. (U.S. Census - ACS, 2013) Age – Youth with Disabilities. As OOD implements provisions of the 2014 Workforce Innovation and Opportunity Act (WIOA) and the new partnership with the Ohio Department of Education (ODE), a greater focus in producing outcomes for youth and students with disabilities must be addressed. U.S. Census and ODE data support the need for OOD’s services amongst youth with disabilities. In 2013, there were 1,583,227 youth in Ohio between the ages of 14 and 24. Estimates suggest that approximately 100,000 of this population may experience disabilities. In 2014, OOD served 11,959 youth between 14 and 24 years of age. (OOD - AWARE) In addition, the Ohio Department of Education estimates that there are more than 50,000 school-age youth (starting at age 14) with an individualized education program (IEP) and who also have identified disabilities, potentially qualifying them for OOD VR services. (ODE - EMIS, 2012-2013). As a result, there is a significant need to provide VR services to youth and students with disabilities throughout Ohio. Age - Older Adults. There are 1,681,232 individuals in Ohio over age 65 (U.S. Census - ACS, 2013). Estimates suggest that 585,030 may experience disabilities. OOD served 303 individuals over age 65 in 2014. The network of providers for the federal Senior Community Service Employment Program (SCSEP) served 372 or 13.8 percent individuals with disabilities (Ohio Department of Aging , 2014). As of April 2015, more than 19.5 percent of individuals engaged with OOD were 55 and older, and 17.8 percent were between the ages of 50 and 64 (OOD - AWARE). This population age 50-64 is where OOD’s partnership with Ohio Department of Aging (ODA) can continue to have the greatest impact. It is important to note that less than two percent of individuals age 65 and older with a disability, who are not in the labor force, are actually seeking work (Bureau of Labor Statistics, 2013-2015). So although the vocational rehabilitation outcomes tied to competitive employment may not be a focus of Ohioans with disabilities age 65 and older, the expanded partnership with ODA, as well as OOD’s strategy in strengthening its Independent Living and Older Blind program, could further help address the needs of this population.
Disability Categories OOD VR Service Penetration Rates in Ohio Counties. Maps and tables in Section V of this report indicate projected penetration rates for 2015 for the six major OOD disability categories for all 88 counties in Ohio. A penetration rate represents the number of working age Ohioans with disabilities who received OOD VR services out of the total number who want to work that could be served. Penetration rate data indicate that OOD has made significant progress in serving individuals with cognitive and psychosocial disabilities, and still needs to focus on individuals with hearing and visual impairments. The highest projected penetration rate of the six primary disability categories in 2013 was 45.3 percent for psychosocial impairment, while it is estimated that it was only 4.9 percent for individuals with communicative impairments.

2015 Vocational Rehabilitation Comprehensive Statewide Needs Assessment
7
Number of Counties by Disability Category and OOD Service Penetration Rate Range - 2016
Range Cognitive Communicative Hearing Physical Psycho- Social Visual
0 to 10% 3 68 61 8 2 17
10.1% to 25% 38 17 24 51 17 57
25.1% to 40% 29 3 2 17 26 13
Higher than 40% 18 0 1 12 43 1
Counties with Low and High Penetration Rates. Seven counties (Belmont, Clinton, Hardin, Holmes,
Lake, Lorain, and Noble) did not have an OOD service penetration rate of more than 25 percent for
any of the six primary disability impairment categories. The penetration rates for Allen and Auglaize
counties stand out positively, in the fact that the rate of individuals with disabilities served by OOD
were higher for three disability categories (cognitive, physical, and psychosocial), and was not
below 10 percent for communicative, hearing or visual.
Proportionality Rates. The distribution and proportionality differences statewide suggests that OOD has been able to make significant progress in identifying and serving individuals with psychosocial and cognitive impairments, which has resulted in a greater gap for the other four disability categories, in particular those with hearing impairments. This can be explained by the fact that OOD has engaged in direct working relationships with local behavioral health authorities and the state and local developmental disabilities boards; all of which have representation in every county.
Special Populations. Prevalence estimates suggest that individuals with disabilities, within OOD’s
disability categories, may also experience conditions that include (but are not limited to)
developmental disabilities, autism, traumatic brain injury and/or alcohol and other drug use. There
have been significant increases in the number of individuals impacted by autism over the last
decade. For example, prevalence of autism in U.S. children increased by 119.4 percent, from 1 in
150 in 2000 to 1 in 68 in 2010 - (CDC - Autism & Developmental Disabilities Monitoring (ADDM)
Network, 2014). This 1.5 percent prevalence estimate is reflective of children who are currently 13
years of age. Thus, in the next three years, OOD may see an increase in individuals served with
autism.
Individuals Served by Other State Agencies. The Ohio Department of Education has identified over
50,000 youth, age 14 to 22, with an individualized education program (IEP) and identified
disabilities, who could be eligible for OOD VR services. In 2014, 1,907 individuals could be served
statewide via the federally funded Senior Community Service Employment Program (SCSEP), which
is a 40 percent decrease from the 2,691 served in 2013. In state fiscal year 2014, the Ohio
Department of Mental Health and Addiction Services reported that 212,808 Ohioans with severe
mental illnesses and/or drug addiction were served, a subset of which might also benefit from OOD
VR services. The Ohio Department of Developmental Disabilities (DODD), through local county
boards, serves over 32,000 individuals with developmental disabilities, age 14-64, who are engaged
in facility-based work, facility-based non-work, or integrated employment. According to the
Veteran’s Benefits Administration, a total of 133,796 Veterans with disabilities received disability
benefits in 2014.

2015 Vocational Rehabilitation Comprehensive Statewide Needs Assessment
8
Perceptions of Individuals with Disabilities and Key Informants OOD and Mathematica Surveys of OOD Participants Increased engagement should include the use of technology, with 75 percent of individuals surveyed indicating that they would be interested in working with their VR counselor online. Unfortunately, with 35.9 percent of VR applicants surveyed indicating that they have taken advantage of OOD for help with employment, suggests most people who have recently applied for VR services do not understand that they are working with OOD. This may be a symptom of the need for increased engagement with individuals receiving services and better branding of our services. Workforce Integration Taskforce Surveys and Focus Groups Constituents About 20 percent of the respondents said they had turned down work or extra hours to keep their SSI or SSDI benefits. In general, respondents reported less difficulty doing a job than they did finding a job. About 47 percent said their disability made it somewhat or very difficult to do a job, and about 18 percent said they had no difficulty or trouble doing a job. The commonly mentioned barrier was employer attitudes toward the disability (about 65 percent). Getting needed accommodations was mentioned by 31 percent. Reliable transportation was mentioned by about 39 percent. Providers About 45 percent said that between 25 and 74 percent of their clients, associates or family had turned down work for benefits. The most common occupational challenge the business community sees is safety and liability issues – about 73 percent reported this. The providers thought that the most common non-occupational challenge was the cost of accommodations—about 73 percent mentioned this. A distant second was transportation cost mentioned by 40 percent. This was followed by health care costs, which was mentioned by 32 percent. Employers About 66 percent of companies said they had experience hiring persons with disabilities. Seventy-three percent of the employers said the hearing or vision requirements of the jobs would pose challenges for those with hearing or vision impairments. Thirty-five percent said the physical demands of the work. The most commonly mentioned non-occupational challenge was ‘lack of applicants,’ with about 37 percent saying this. There are two points to consider here. First, from the focus groups we know that some people have problems with online applications (which could be due to the individual needs training or the website is not accessible). Second, many if not most employers probably don’t know if an applicant has a disability unless the applicant discloses the need for reasonable accommodation when applying. Transportation was mentioned by about a third of the employers. Accommodation costs were mentioned by about 22 percent of employers.

2015 Vocational Rehabilitation Comprehensive Statewide Needs Assessment
9
Trends and Other Considerations Social Security Disability Insurance (SSDI) and Labor Force Participation.
SSDI - Workers with disabilities accounted for the group with the largest percent change for
beneficiaries receiving SSDI during 2010 and 2013. There has been a 12.8 percent increase in the
number of workers with a disability who are classified as beneficiaries as compared to the total
population receiving federally administered payments.
Labor Force Participation - In 2014, the U.S. unemployment rate for working age (16-64) individuals
with disabilities was 13.9 percent, while the U.S. Labor Force Participation Rate for individuals with
a disability age 16-64 was 30.2 percent, down from 31.6 percent in 2012. Although unemployment
has trended lower, so has the labor force participation of individuals with disabilities; meaning
fewer individuals with disabilities are working and/or actively seeking work.
Implications of the Workforce Innovation and Opportunity Act (WIOA). Although final regulations
for implementing the provisions of WIOA will not be available until 2016, the law is focused on
ensuring Ohio’s VR program is aligned with workforce development and employment strategies,
which are funded through the U.S. Departments of Labor and Education. The three primary focus
areas that OOD must be prepared to address and be a part of are: 1) A Unified State Workforce
Plan; 2) Focus on Youth and Students with Disabilities; and 3) Common Workforce Performance
Measures; which include outcomes for individuals served related to job retention, earnings,
credential/skills gains, as well as employer satisfaction.
Elimination of Ohio’s Wait List for VR Services. OOD was able to eliminate the wait list for individuals seeking VR services for all categories of disability (MSD, SD, and D). OOD will need to plan and manage its financial and human capital resources to effectively meet service delivery needs for all eligible applicants without interruption.

2015 Vocational Rehabilitation Comprehensive Statewide Needs Assessment
10
Recommendations
The data summarized above and in more detail in the following report suggested several formal recommendations. Recommendations were developed as a prelude to and support for formal planning activities. The recommendations are provided below and are accompanied by a brief explanation and reference of the data which support the recommendation.
1. Actively engage OOD VR counselors in the early stages of a student’s Individualized Education
Program (IEP) development and utilize the VR services that have yielded positive outcomes.
OOD outcome data and the Ohio Longitudinal Transition Study results identify specific
strategies that contribute to successful service delivery and outcomes for youth and students
with disabilities. Ohio’s State Fiscal Year 2016/17 Budget provides the Ohio Department of
Education (ODE) with funding that will allow OOD counselors to work with local education
agencies to serve students with disabilities through partnership with local career technical
planning districts. The number of youth who have an IEP, as well as a qualifying disability for
OOD services, provide OOD and ODE a strategic foundation to identify immediate areas of need.
Sources:
Section VII – Youth and Students with Disabilities - Comprehensive Statewide Needs
Assessment (CSNA) For Transition-age Youth and Young Adults (R. Baer, 2015)
2. Formalize efforts to increase services to individuals with visual and hearing disabilities;
specifically evaluate and prioritize identified recommendations cited in the Workforce
Integration Task Force (WIT). The penetration rate and proportionality rate data tables and
maps suggest that additional opportunity and emphasis for individuals with hearing and visual
impairments should be a priority. OOD should evaluate and prioritize the recommendations of
the WIT as a roadmap for planning and implementation.
Sources:
Section IV. Prevalence & Penetration Rate Projections of Unmet Need
Map 3 and 6 Hearing & Visual Impairment - OOD Service Penetration Rate - 2016 Projection
Table 24 - Number of Counties by Disability Category and OOD Service Penetration Rate
Range – 2016 projection
Table 25 - OOD Service Penetration Rate Ranges – Counts by County – 2016 Projection
Section VIII. Workforce Integration Workforce Integration Task Force
Final Report to Governor John R. Kasich (Workforce Integration Task Force (WIT), 2014)
3. Expand and leverage new employer and state agency partnerships to achieve Workforce
Innovation and Opportunity Act common performance measure outcomes. OOD should build
upon the existing business engagement activities, as well as state partnerships facilitated by the
Governor’s Office of Workforce Transformation, to promote labor exchange between OOD
participants and employers seeking talent; with an emphasis on in-demand occupations.
Sources:
Section VIII. OhioMeansJobs.com and In-Demand Occupations
Section IX. Survey Results – Workforce Integration Task Force

2015 Vocational Rehabilitation Comprehensive Statewide Needs Assessment
11
4. Meet the workforce needs of employers by evaluating in-demand occupations as a standard approach of VR counselors’ work in developing job goals and service plans for OOD job seekers. OOD has emphasized employers as a dual customer and a critical component for the success of individuals with disabilities that are seeking employment. The Governor’s Office of Workforce Transformation has diligently worked to strategically align Ohio’s workforce programs to focus efforts in meeting employers’ workforce needs. One strategy is through the identification and monthly monitoring of Ohio’s in-demand occupations. It is recommended that VR counselors, as part of informed choice, review the in-demand occupations, and where appropriate, focus job goals and training around those. It is recommended that OOD utilize labor market information, Wanted Analytics, and OhioMeansJobs.com to facilitate this activity.
Sources:
Section VIII. OhioMeansJobs.com and In-Demand Occupations
Appendix C – OhioMeansJobs.com – All In-Demand Occupations
http://jfs.ohio.gov/owd/OMJResources/State-AllOpenings.stm
5. Work with the Social Security Administration to identify strategies for referring disability
claimants to the Vocational Rehabilitation program. As the trend of Social Security Disability
Insurance (SSDI) and Supplemental Security Income (SSI) recipients is continuing to rise, the
trend for individuals with disabilities participating in the labor force is on the decline for working
age (16-64) individuals with disabilities compared to individuals without disabilities. OOD and
SSA should identify ways to stem and reverse this trend though collaborative efforts.
Sources:
Section IV. Disability Demographics and Employment Status:
Tables 4 - Annual U.S. Unemployment of Civilians Ages 16 to 64 by Disability Status – 2012-
2014 Bureau of Labor Statistics (Table A-6):
Table 8 - Ohio: Number and Employment of SSI Beneficiaries: 2002-2012
Chart 1 - SSDI – U.S. Disabled Worker Beneficiary Trend Disabled Worker Data
Chart 2 - SSDI – U.S. Number in Current Payment Status at End of Month
6. Concentrate efforts to bring awareness and assist OOD VR served individuals to register with
OhioMeansJobs.com (OMJ) as means to achieving their employment goals. Data from ODJFS
labor exchange registration in the OhioMeansJobs.com (OMJ) system suggests that more
individuals that are served by OOD could be registered and take advantage of the tools in OMJ.
Sources:
Section VIII. OhioMeansJobs.com and In-Demand Occupations: A Focused Outcome
Strategy for OOD
Map 14 OOD Participants* Registered in OhioMeansJobs.com
Tables 32 and 33 - OOD Served and Rehab Compared to OMJ Registrants as of April 2015

2015 Vocational Rehabilitation Comprehensive Statewide Needs Assessment
12
7. Utilize technology to increase access to OOD services and improve operational efficiencies.
A survey of OOD participants supports the need for OOD to enhance its technological
infrastructure as means for promoting access to VR services, as well as facilitating their
interaction with their VR counselor. This will also promote efficiency and quality of service
delivery.
Source: Section IX and Appendix B – Survey Results Opportunities for Ohioans with
Disabilities (OOD) Participant Survey
8. Design a formal business plan model that allows for agile deployment of human and financial
resources across Ohio counties when new opportunities to expand VR services arise. With
the elimination of the wait list for VR services, new WIOA regulations, and focus on WIT
recommendations to meet the needs of hearing and visually impaired individuals, OOD needs
to be prepared to deploy counseling staff and resources that correspond to changes designed
to promote more balance across the system. When addressing significant discrepancies in the
“balance” (proportionality) of services provided across counties in Ohio, it will require a
methodical approach to achieve success, including efforts to access available federal funding
which may be required to support the provision of expanded services.
Source: Section VI. Relative Proportionality: Comparison of Needs to Service Provision
9. Re-evaluate the partnership with the Ohio Department of Aging, leveraging both Vocational
Rehabilitation and the Independent Living and Older Blind programs. More than 19.5 percent
of individuals engaged with OOD were 55 and older, and 17.8 percent were between the ages
of 50 and 64. Only two percent of individuals age 65 and older with a disability, who are not in
the labor force, are actually seeking work. Thus, OOD could also leverage the Independent
Living and Older Blind program in meeting the needs of the 65+ population.
Sources:
Table 5 - Persons not in the labor force by disability status, age, and sex, 2014 annual averages
Bureau of Labor Statistics (Table A-5)
Section X. Information from Other State Agencies Ohio
Appendix A - Department of Aging (ODA) Program Year 2014 Senior Community Service
Employment Program (SCSEP)

2015 Vocational Rehabilitation Comprehensive Statewide Needs Assessment
13
Executive Summary
Table of Contents
Section I. Introduction 14
Section II. Background Information and Methodology 17
Section III. Progress and Follow-Up to 2012 CSNA Recommendations 32
Section IV. Disability Demographics and Employment Status 34
Section V. Prevalence & Penetration Rate Projections of Unmet Need 40
Section VI. Relative Proportionality: Comparison of Needs to Service Provision 59
Section VII. Youth and Students with Disabilities 70
Section VIII. Workforce Integration and OhioMeansJobs.com 76
Section IX. Survey Results (OOD, WIT, and Mathematica) 85
Section X. Information from Other State Agencies 89
Section XI. Recommendations 97
Bibliography 100
Appendix A 'Comprehensive Statewide Needs Assessment (CSNA) for Transition-age
Youth and Young Adults' - Kent State University
Appendix B Surveys
Appendix C Other State Agency Data

2015 Vocational Rehabilitation Comprehensive Statewide Needs Assessment
14
I. Introduction
This report provides the Opportunities for Ohioans with Disabilities (OOD) agency with findings and recommendations related to the vocational rehabilitation (VR) needs of Ohioans with disabilities.
Recent Trends in Funding and Past and Current Needs Assessments
The current needs assessment builds upon the methodologies developed from the 2012 CSNA by evaluating penetration rates and relative proportionality with projections estimated for 2016. These data were considered critical in order to develop policy and resource allocation recommendations responsive to future needs. Procedures and specific data were collected in response to recent change in funding trends. Responses to recommendations form the 2012 CSNA are highlighted, as well as financial and service trend data in sections of the CSNA.
Purpose of the Comprehensive Statewide Needs Assessment (CSNA)
The primary purpose of OOD’s vocational rehabilitation CSNA is to provide a basis for allocating resources to support individuals with a variety of disabilities in Ohio. In order to make policy decisions about the optimal distribution of resources, this CSNA provides OOD information about the prevalence of disabilities in counties in Ohio. Prevalence is defined as the total number of estimated cases present in a specific population and location at a particular point in time (Green & Kreuter, 1991). Prevalence rate is calculated by dividing the number of individuals reporting a disability by the total number of individuals in the population (Erickson, Lee, & von Schrader, 2014). Individuals served by OOD’s VR program are divided into one of the following categories: visual impairments, hearing impairments, communicative impairments, physical impairments, psychosocial impairments, or cognitive impairments.
OOD’s 2012 CSNA provided the basis to find estimates of the prevalence of disabilities consistent with the classification system for disabilities used by OOD and defined by Rehabilitation Services Administration (RSA). Although definitions of a specific category of disability may not precisely match definitions used by OOD or definitions that facilitate clinical practice, the prevalence estimates used in the CSNA and corresponding definitions were the most appropriate for estimating the prevalence of disabilities consistent with the classification system used by OOD.
All prevalence figures and other projections cited in the CSNA are estimates and are intended to represent the magnitude of prevalence of specific disabilities in specific counties in Ohio. It is appropriate to use such figures and comparisons across counties and categories of disabilities in conjunction with other information to support planning and policy development. However, prevalence and other projections are not representative of the precise number of individuals with specific disabilities.

2015 Vocational Rehabilitation Comprehensive Statewide Needs Assessment
15
Needs Assessment Questions As OOD has re-focused efforts on achieving outcomes through business engagement as well as planning to meet Workforce and Innovation Opportunity Act (WIOA) expectations, this CSNA is focused on addressing the following questions: 1. What is the projected number of individuals that will experience each category of disability in
Ohio? 2. How many individuals with disabilities are projected to be seeking employment, who currently
are not working? 3. How do prevalence estimates differ for individuals by race/ethnicity and age groups? 4. How many individuals with disabilities received services from OOD? 5. With the new Workforce innovation and Opportunity Act (WIOA), how can OOD better
coordinate with other state agencies in serving individuals with disabilities? 6. What are the gaps in serving disability populations and how should gaps be prioritized? Questions specific to youth with disabilities: 7. What are the characteristics of youth with disabilities receiving various categories of
rehabilitation services? 8. Which are the characteristics of youth with disabilities experiencing employment outcomes?
9. What are the characteristics of youth with disabilities experiencing postsecondary education outcomes?
10. What services predicted employment outcomes after controlling for other factors? 11. What services predicted participation in postsecondary education after controlling for other
factors?
12. What services predicted supported employment outcomes after controlling for other factors?
Focus Areas and Data Collection Strategies
The 2015 CSNA focuses on six critical tasks: 1. Evaluation of the recommendations made in 2012 CSNA the 2014 Workforce Integration
Taskforce Report; 2. Utilization of federal, state, and local data resources; 3. Analyzing service delivery needs for individuals with disabilities based on disability categories
and geographic locations; 4. Identifying proportionately underserved and un-served populations; 5. Analysis of working-age population and students/youth with disabilities; 6. Make data informed recommendations to improve helping individuals with disabilities achieve
competitive employment outcomes. Building upon the foundation set from the 2012 CSNA methodology, OOD developed 2016 projections of the number of individuals with disabilities by category and county of residence in Ohio. Similarly, service data from OOD’s VR case management system and employment statistics were utilized to develop estimates of the number of individuals likely to need VR services by disability category and by county. This provided a basis for developing estimates of the number of individuals actively participating in the labor force that need services to assist them in finding a job and could benefit from OOD VR services. As a follow-up to the 2012 CSNA recommendations, OOD has aggressively gathered and analyzed data through the Workforce Integration Taskforce, focused

2015 Vocational Rehabilitation Comprehensive Statewide Needs Assessment
16
on services for the deaf and blind, as well as service delivery capacity available through Ohio’s network of Community Rehabilitation Programs (CRPs). Data collection strategies, including surveys of individuals with disabilities and employers, are described in detail in later sections of this report. OOD contracted with Kent State University, as a compliment to the Ohio Longitudinal Transition Study, to specifically address the six questions regarding youth and students with disabilities. Finally, Mathematica conducted a Survey of Disability and Employment (SDE), of over 1,000 OOD VR applicants, that will assist OOD to better understand the needs of individuals with disabilities. Projections were made in the number of Ohioans with disabilities in need of vocational rehabilitation (VR) services by category of disability and by county of residence in Ohio were utilized using American Community Survey (ACS) population projections and Bureau of Labor Statistics labor force participation and employment statistics. Similarly, service data from Ohio’s VR case management system and employment statistics were utilized to develop estimates of the number of individuals likely to need VR services. Information was used from other agencies that serve individuals with disabilities through the analysis of a variety of reports, documents, and service data.
Content of the Needs Assessment Report
The remainder of this report is divided into several sections corresponding to data collection strategies and other phases of the needs assessment project. Section II summarizes background information (secondary data) and other contextual factors. Information summarizing VR services provided by OOD and annual funding for OOD are summarized in this section. This information is viewed as a critical foundation for the needs assessment data summarized in this report. Section III provides a progress report on OOD’s efforts to address recommendations made in the 2012 CSNA. Section IV reviews race, ethnicity, age, and disabilities in Ohio. Sections V and VI provide information related to the amount of service provided in Ohio counties. Section VII summarizes the findings and recommendations related to youth with disabilities produced by Kent State University, titled “Comprehensive Statewide Needs Assessment (CSNA) For Transition-age Youth and Young Adults”; the full report is contained in Appendix A. Section VIII provides a synopsis of the Workforce Integration Task Force analysis and recommendations specifically designed to address opportunities for individuals with hearing impairments and visual impairments, as well as an evaluation of OOD’s use of OhioMeansJobs.com. Section IX provides a summary and analysis of consumer and employer surveys and focus groups commissioned by OOD and Mathematica. Information provided by other state agencies in Ohio related to the need for VR services is contained in Section X. Section XI of this report addresses formal recommendations. The final two sections (section XII and XIII) include a Bibliography and Appendices, which provide detailed background information and data collection instruments.
2015 Vocational Rehabilitation Comprehensive Statewide Needs Assessment
17
II. Background Information and Methodology Definition of Disability
The definition of disability is based on a conceptualization developed by Nagi (Nagi, 1991), and also served as the foundation of the Americans with Disabilities Act (ADA). Nagi’s approach defines a disability as a situation where a functional limitation leads to the inability to perform socially expected roles and activities, such as paid employment and stresses the interaction between physical and mental conditions and the environment as a precursor to disability. Adaptations such as “vocational rehabilitation” provide individuals with disabilities an opportunity to address functional limitations so that individuals can perform job related duties.
Current System for Delivering Vocational Rehabilitation Services in Ohio
Opportunities for Ohioans with Disabilities (OOD) is a state agency that provides support to increase employment and independent living outcomes for Ohioans with disabilities through partnerships with business, education, and non-profit organizations throughout Ohio. Approximately 290 OOD counselors deliver VR services via 14 field offices located across Ohio, as well as from embedded locations, such as schools and OhioMeansJobs Centers. OOD also provides VR services through established case management and service delivery contracts with local and state agencies. During FFY 2015, 27 contracts provided a basis for delivering VR services. In addition to employment and independent living support programs, OOD is responsible for making disability determinations for the Social Security Disability Insurance (SSDI) and Supplemental Security Income (SSI) programs in Ohio.
OOD receives funding from the Rehabilitation Services Administration (RSA) for the following four programs: Basic vocational rehabilitation (VR) services (including supported employment), independent living initiatives for older individuals who are blind, and statewide independent living programs. VR services include activities designed to assist individuals with disabilities to engage in competitive employment capitalizing on their strengths, resources and abilities.
Elimination of the VR Wait List. Federal regulations require that when a State does not have sufficient resources to serve all VR eligible individuals in the State, it must implement an order of selection (OOS) that gives priority for services to individuals with the most significant disabilities (MSD). Individuals are determined to have an MSD if they are expected to need multiple VR services over an extended period of time and their disability seriously limits three or more functional capacities in terms of an employment outcome. Functional capacity areas include communication, interpersonal skills, mobility, self-care, self-direction, work skills, and work tolerance. “Over an extended period of time” means that services are likely to be needed for six months or more. Individuals are determined to have a Significant Disability (SD) if they are expected to need multiple VR services over an extended period of time and their disability seriously limits one or two functional capacities in terms of an employment outcome. Individuals are determined to have a Disability (D) if they are not expected to need multiple services over an extended period of time, or if their disability does not seriously limit any functional capacities in terms of an employment outcome.
2015 Vocational Rehabilitation Comprehensive Statewide Needs Assessment
18
OOD has been operating under an order of selection (OOS) policy since 1991 and had been operating a statewide waiting list since December of 2008. OOD eliminated the waiting list for individuals with SD in June of 2014. After eliminating this waiting list, OOD began providing services to individuals with D for the first time since 1991. In February 2015, the waiting list for all priority levels (MSD, SD and D) was eliminated. Business as a Customer. OOD implemented a dual customer model with an emphasis on serving business as a customer. In 2013, OOD hired a business relations manager and regionally based business sourcing analysts to promote employment opportunities for individuals served by OOD’s VR program through business focused engagement and education activities. From 2012 to 2015, the number of Ohio Business Leadership Network (BLN) member businesses increased from 19 to 75. In 2014, the Ohio BLN was recognized as the affiliate of the year by the United States Business Leadership Network. (Ohio Business Leadership Network (OHBLN), 2015) Implications of the Workforce Innovation and Opportunity Act (WIOA). Although final regulations for implementing the provisions of WIOA will not be available until 2016, the law is focused on ensuring the VR program is aligned with workforce development and employment strategies, which are funded through the U.S. Departments of Labor and Education. The three primary focus areas that OOD must be prepared to address are: 1) A Unified State Workforce Plan; 2) Common Workforce Performance Measures; which include outcomes for individuals served related to job retention, earnings, credential/skills gains, as well as employer satisfaction; and 3) Youth and Students with Disabilities.

2015 Vocational Rehabilitation Comprehensive Statewide Needs Assessment
19
Needs Assessment Methods
Needs assessment is defined as a systematic and ongoing process of providing usable and useful
information about the needs of a target population in order to make judgments about policy and
programs (Shell, 2009) (Steinmetz, 2006). OOD is committed to using the data from the current
needs assessment to inform future state plans and policy. As with any service delivered to a
population in need, OOD acknowledges that there are gaps between the current reality of the VR
system in Ohio and ideal conditions. The goal of current needs assessment activities is to assess the
progress made since 2012 and continue to strategically identify gaps through the use of data and
ultimately, expand services to unserved and underserved populations in Ohio. Many of the
projection statistics referenced in this report are estimates of existing and/or future conditions.
The existing sources used for generating estimates were vetted by individuals with expert
knowledge through the 2012 CSNA process, and new sources were also vetted through experts.
The Needs Assessment Process. This needs assessment utilizes each of the strategies identified in
the most current available VR Needs Assessment Guide (Shell, 2009) and the innovative methods
designed in the 2012 CSNA that further meets the unique needs of Ohioans that could benefit from
OOD VR services. The six basic steps described by Shell (2009) guided project activities:
Step 1: Defining and Establishing CSNA Goals Step 2: Developing CSNA Plan for Information and Dissemination Step 3: Gathering the information Step 4: Analyzing the Results and Developing Findings Step 5: Develop the Conclusions: Potential Action Strategies Step 6: Informing State Plan, Goals, Priorities, and Strategies
The strategies for gathering and analyzing information and data in steps 3 and 4 included: 1) using
existing disability population statistics; 2) creating disability population estimates from available
data; 3) creating population projections; 4) Utilizing federal and state labor force statistics; 5)
utilizing existing VR data; 6) incorporating state county level statistics; and 7) soliciting feedback
from stakeholder groups.
Specifically, the stakeholder groups, such as the Consumer Advisory Committee, Workforce
Integration Taskforce, Ohio Business Leadership Network, and OOD Commission contributed to
needs assessment activities.

2015 Vocational Rehabilitation Comprehensive Statewide Needs Assessment
20
Environmental Scan
The information in this section provides the foundation for the needs assessment activities described in this report. American Community Survey (ACS) data was used from the US Census Bureau, as well cited from the 2014 Disability Statistics Compendium and the 2012 Cornell Report Ohio Disability Statistics (Institute on Disability) (Erickson, Lee, & von Schrader, 2014). Other data sources include the Bureau of Labor Statistics, the Ohio Longitudinal Transition Study, and other administrative records of government programs (such as Social Security Disability Insurance, Supplemental Security Income and federal/state vocational rehabilitation programs). Highlights from these and other sources such as ACS and the 2010 Census follow.
Population of Ohio Counties. 2015 estimates suggest Ohio’s total population is at 11,549,140 (U.S. Census - Ohio Developmental Services Agency Projections). Sixty (60) of Ohio’s 88 counties have total populations of less than 100,000 residents. Vinton County, with 13,570 residents in the southeast part of Ohio has the smallest total population. Nineteen (19) Ohio counties have populations between 100,000 and 250,000 residents and the remaining nine (9) counties all have populations that exceed 300,000.
As shown in Table 1 below, the nine (9) counties with populations exceeding 300,000 are: Cuyahoga, Franklin, Hamilton, Summit, Montgomery, Lucas, Butler, Stark, and Lorain. Cuyahoga is Ohio’s largest county with 1,242,390 residents. These counties account for 50 percent of the state’s total population.
Table 1 - Counties with Largest Populations in Ohio: 2015 Estimate
County Age 0-14 Age 15-64 Age 65+ Total
Population
Percent of Total
Population
Cuyahoga 216,450 817,050 208,890 1,242,390 10.8%
Franklin 248,880 815,150 134,350 1,198,380 10.4%
Hamilton 154,220 525,190 114,550 793,960 6.9%
Summit 93,880 355,990 87,360 537,230 4.7%
Montgomery 96,890 339,380 88,110 524,380 4.5%
Lucas 84,470 287,380 63,440 435,290 3.8%
Butler 76,230 252,960 49,190 378,380 3.3%
Stark 65,750 238,860 67,060 371,670 3.2%
Lorain 55,240 202,000 49,140 306,380 2.7%
9-County Subtotal 1,092,010 3,833,960 862,090 5,788,060 50.1%
Ohio 2,161,720 7,592,560 1,794,860 11,549,140 100.0%

2015 Vocational Rehabilitation Comprehensive Statewide Needs Assessment
21
Prevalence of Disabilities. The following data represent disability prevalence statistics reported in the American Community Survey (ACS) (Institute on Disability). The ACS is conducted by the U.S. Census Bureau and provides annual community profiles. The information is collected through a questionnaire mailed to a random sample of addresses. The data specific to disability are based on six questions. If individuals answer “yes” to any one of these six questions they are classified as having a disability. The disability categories identified in the ACS are ambulatory disability, cognitive disability, hearing disability, independent living disability, self-care disability and vision disability.
Definitions and descriptions of methodology are available at http://www.factfinder.census.gov.
According to the ACS, in 2013 Ohio had the 6th largest population of individuals with disabilities in the United States. Approximately 13.6 percent of the total population in the state was identified as having a disability (1,555,348 individuals). Table 2 illustrates the prevalence of disability by age groups and specific disability categories. Table 2 - Age of O hioans with Disabilities: 2013
Age Range
Number with Disabilities
Percent of Total Population by Age
Under 5 5,435 0.8 %
5-17 118,908 6.1 %
18-64 838,715 11.9 %
65+ 592,290 35.2%
All Ages 1,555,348 13.6%
Table 3 provides the percent of Ohioans experiencing specific categories of disabilities as a
percent of the total population and total number of disabilities.
Table 3 - Disability Categories and Employment Status of Ohioans: 2013 (Age 18-64)
Disability Category
Prevalence of
Population by Category
Total
Employed
Percent
Employment
Ambulatory Disability 6.0% 427,090 100,853 23.6%
Cognitive Disability 5.2% 368,834 89,668 24.3%
Independent Living Disability
4.2% 296,075 47,559 16.1%
Hearing Disability 2.3% 159,576 79,440 49.8%
Self-Care Disability 2.1% 147,915 23.903 16.2%
Vision Disability 2.1% 145,907 53,942 37.0%

2015 Vocational Rehabilitation Comprehensive Statewide Needs Assessment
22
U.S. Employment Statistics and Labor Force Participation
Table 4 and Table 5 illustrate the U.S. labor force participation and unemployment rates for working age (16-64) individuals with disabilities compared to individuals without disabilities, as reported by the Bureau of Labor Statistics. In 2014, the U.S. unemployment rate for working age (16-64) individuals with disabilities was 13.9 percent. Although unemployment has trended lower, so has the labor force participation of individuals with disabilities; meaning fewer individuals with disabilities are working and/or actively seeking work.
Table 4 - Annual U.S. Unemployment of Civilians Ages 16 to 64 by Disability Status – 2012-2014
Bureau of Labor Statistics (Table A-6) – Household Data (Not Seasonally Adjusted)
In 2014 the U.S. Labor Force Participation Rate for individuals with a disability age 16-64 was 30.2
percent, down from 31.6 percent in 2012. (Bureau of Labor Statistics, 2013-2015)
Annual Annual Annual Annual Annual Annual
2012 2013 2014 2012 2013 2014
Total Men & Women, 16 to 64 years
Total Civil ian labor force 4,854 4,858 4,718 142,393 142,415 142,847
Total Participation rate 31.6% 31.4% 30.2% 76.5% 76.2% 76.2%
Total Employed 4,146 4,146 4,061 131,078 132,102 134,272
Total Employment population ratio 27.0% 26.8% 26.0% 70.4% 70.7% 71.7%
Total Unemployed 708 713 655 11,316 10,313 8,574
Total Unemployment Rate 14.6% 14.7% 13.9% 7.9% 7.2% 6.0%
Total Not in labor force 10,484 10,593 10,895 43,683 44,402 44,528
Total Working Age Population 15,338 15,451 15,613 186,076 186,817 187,375
[Numbers in thousands]
Persons with no disabilityPersons with a disability
Employment status - Age 16-64

2015 Vocational Rehabilitation Comprehensive Statewide Needs Assessment
23
Table 5 - Persons not in the labor force by disability status, age, and sex, 2014 annual averages
Bureau of Labor Statistics (Table A-5) (numbers in thousands)
Category
Total 16 years &
Over
16 to 64 years Total 65 years &
Over Total Men Women
PERSONS WITH A DISABILITY
Total not in the labor force 23,520 10,895 5,201 5,694 12,625
Persons who currently want a job 717 510 258 252 207
Marginally attached to the labor force(1) 225 184 99 85 41
Discouraged workers(2) 68 52 34 18 16
Other persons marginally attached to the labor force(3)
157 132 65 66 25
PERSONS WITH NO DISABILITY
Total not in the labor force 68,505 44,528 16,284 28,244 23,977
Persons who currently want a job 5,606 5,008 2,293 2,715 598
Marginally attached to the labor force(1) 1,983 1,828 936 891 155
Discouraged workers(2) 671 604 362 242 67
Other persons marginally attached to the labor force(3)
1,312 1,224 575 649 88
Footnotes
(1) Data refer to persons who want a job, have searched for work during the prior 12 months, and were available to take a job during the reference week, but had not looked for work in the past 4 weeks.
(2) Includes those who did not actively look for work in the prior 4 weeks for reasons such as thinks no work available, could not find work, lacks schooling or training, employer thinks too young or old, and other types of discrimination.
(3) Includes those who did not actively look for work in the prior 4 weeks for such reasons as school or family responsibilities, ill health, and transportation problems, as well as a number for whom reason for nonparticipation was not determined.
(U.S. Department of Labor - Bureau of Labor Statistics, 2015)
http://www.bls.gov/news.release/pdf/disabl.pdf
Ohio’s Labor Force Participation and Employment The discrepancy between the employment rate for individuals with and without disabilities in the U.S. is mirrored at the state level in Ohio. According to the ACS, in 2013, 33.5 percent of individuals with disabilities, age 18-64, in Ohio are employed compared to 75.9 percent of individuals without disabilities. These data reveal an employment gap of 42.4 percent between the two groups. Furthermore, only 19.0 percent of the total population of individuals with disabilities ages 16 and older were employed full time and year round, whereas 51.6 percent of the population 16 and over without disabilities were employed full time and year round in Ohio. This represents a gap of 32.5 percent. (Institute on Disability)

2015 Vocational Rehabilitation Comprehensive Statewide Needs Assessment
24
ACS 2013 data indicate that 24.3 percent of working age Ohioans with a cognitive disability were employed, compared to 23.7 percent nationally. Similarly, 10.9 percent of working age Ohioans with a cognitive disability who were receiving Social Security benefits were employed, as compared to 9 percent nationally. In April 2015, the Ohio Department of Developmental Disabilities reported that 17,241 persons were employed in facility based workshops while 8,405 were employed in integrated employment settings. During that same time, OOD was actively engaged with about 1,500 individuals through the Employment First partnership, as well as additional DD eligible individuals served by OOD outside of the partnership. Poverty and Earnings. Data regarding poverty are also collected through the ACS. A set of 14 standards are used to calculate poverty. Thresholds are based on family size and composition. In 2013, it is estimated that 31.8 percent of Ohioans with disabilities ages 18 to 64 are living in poverty as compared to 13.0 percent of individuals without disabilities (a gap of 18.8 percentage points. The average median earnings for individuals with disabilities in Ohio is approximately $18,960, whereas individuals with no disability earn $30,271 annually (a difference of $11,311).
Veterans. 2013 ACS data indicate that there are 774,205 veterans residing in Ohio. Veterans with disabilities receive compensation or pensions at varying percentages. The ACS designates service connected disability rating status for individuals in the Reserves or National Guard or active duty military who have a disability as a result of a disease or injury incurred or aggravated during active military service. Detailed definitions regarding data collection for veterans are provided in the ACS.
Furthermore, 76,595 Ohio veterans age 18 to 64 are living with disabilities; of which 13,996 or 18.3 percent are living in poverty as compared to the 26,392 or 8.1 percent of the 326,512 Ohio veteran population without disabilities. This is a poverty gap of 10.2 percentage points between veterans without disabilities and veterans with disabilities. Insurance and Health. According to the 2013 ACS, approximately 83.4 percent of Ohioans with disabilities ages 18 to 64 have health insurance, nationally this rate is 84.0 percent. Conversely, 84.5 percent of Ohioans with no disability have health insurance; which represents a one percentage point gap.

2015 Vocational Rehabilitation Comprehensive Statewide Needs Assessment
25
Social Security Administration Programs. The following information describes Ohio statistics regarding the number of beneficiaries and the amount spent on disability benefits by the Social Security Administration. Supplemental Security Income (SSI) pays benefits to adults and children with disabilities who have limited income or are 65 years of age or older who meet financial limits. Social Security Disability Insurance (SSDI) is paid to individuals and family members if they worked for a specific amount of time and paid taxes. Table 6 and Table 7 (Social Security Administration, 2013) provides the number of Ohioans who received federally administered SSDI and SSI payments, respectively, in 2010 and 2013. Table 6 - Ohio SSI - Number, Average Monthly Benefit Payments (in thousands of dollars), and Category of Disability Beneficiary: 2010 vs. 2013
Classification 2010 2013
Change (2013 v 2010)
Number Payments Number Payments Number Payments
Aged 14,769 $56,623 14,924 $62,120 1.0% 9.7%
Blind 1,732 $9,441 1,810 $10,597 4.5% 12.2%
Disabled 269,069 $1,718,025 294,287 $1,958,557 9.4% 14.0%
Total 285,570 $1,784,089 311,021 $2,031,274 8.9% 13.9%
Table 7 - Ohio SSDI - Number, Average Monthly Benefit Payments (in thousands of dollars), and Category of Disability Beneficiary: 2010 v 2013
Disability Benefit
Classification
2010 2013 Change
(2013 v 2010)
Number Payments Number Payments Number Payments Workers 313,105 $1,037 353,033 $1,109 12.8% 7.0%
Adult Children 42,394 $708 45,144 $744 6.5% 5.0%
Widowers 10,525 $717 11,184 $758 6.3% 5.7%
Total 366,024 $989 409,361 $1,061 11.8% 7.2%
Workers with disabilities accounted for the group with the largest percent change for beneficiaries receiving SSDI during 2010 and 2013. There has been a 12.8 percent increase in the number of workers with a disability who are classified as beneficiaries, as compared to the total population receiving federally administered payments. The number of applications for benefits for workers with disabilities per month from 1995 through 2015 in the U.S. is displayed in Chart 1 on the following page. There has been a steady upward trend in the number of monthly applications for SSDI by workers with disabilities for the past two decades, with the number of applications slightly decreasing over the past two years. SSI applications have followed a similar pattern.

2015 Vocational Rehabilitation Comprehensive Statewide Needs Assessment
26
Chart 1 - SSDI – U.S. Disabled Worker Beneficiary Trend Disabled Worker Data (in thousands)
http://www.ssa.gov/OACT/STATS/dibGraphs.html
Chart 2 - SSDI – U.S. Number in Current Payment Status at End of Month (in thousands)
http://www.ssa.gov/OACT/STATS/dibGraphs.html
Chart 1 above represents the 20-year U.S. trend of SSDI applications and awards made as a twelve month moving average. Though the trend of these applications has declined between 2013 and 2015, Chart 2 shows the number of SSDI recipients currently receiving payments continues to steadily rise. (Social Security Administration, SSA, 2015). Table 8 on the following page shows the trends of Ohio’s SSI beneficiaries between 2000 and 2012, the percentage of SSI recipients working has continued to trend down from 7.7 percent in 2000 to 5.9 percent in 2012.

2015 Vocational Rehabilitation Comprehensive Statewide Needs Assessment
27
Table 8 - Ohio: Number and Employment of SSI Beneficiaries: 2002-2012 (Social Security Administration, SSA, 2015)
2002 2004 2006 2008 2010 2012 # of SSI Recipients with Disabilities
228,836
233,052
242,316
254,015
273,627
292,153
# of SSI Recipients with Disabilities Working
17,579 16,741 17,170 17,366 16,573 17,415
% of SSI Recipients with Disabilities Working
7.7%
7.2%
7.0%
6.8%
6.1%
5.9%
SSI Recipients with Disabilities as a % of population
2.0% 2.0% 2.1% 2.2% 2.4% 2.5%
Populationᵃ 11,421,267 11,459,011 11,478,006 11,485,910 11,532,111 11,544,225
SSI Applications 67,260 80,180 93,024 97,242 107,724 94,548
a. Population estimates for the United States as of July 1, for each corresponding year as reported by the Census Bureau.
As part of the Disability Program, SSA completes Continuing Disability Reviews (CDR) each year to ensure that only those beneficiaries who are still disabled continue to receive monthly benefits. These reviews can result in cessation of benefits, mostly due to medical improvement and the ability to work. Based on the Social Security Administration Annual Performance Plan for 2014, the target number of CDRs nationally was significantly increased from 650,000 in 2013 to 1,047,000 in 2014. Specifically, for the Ohio Disability Determination Services (DDS), Chart 3 below shows Ohio’s CDR targets and actual CDR’s completed from 2010 through week 29 of 2015. Ohio’s CDR target for 2015 has been increased 22.5 percent from 2014. Chart 3 - Ohio: Continuing Disability Reviews Goals and Actual Determinations 2010-2015
14,961 15,135
20,708 20,288
25,459
18,213*
14.950 15,239
20,631 19,914
25,369
31,079
0
5,000
10,000
15,000
20,000
25,000
30,000
35,000
FFY 10 FFY 11 FFY 12 FFY 13 FFY 14 FFY 15
CLEARED
GOAL
*Based on week 29 of FFY 2015

2015 Vocational Rehabilitation Comprehensive Statewide Needs Assessment
28
Special Education. According to the federal U.S. Department of Education’s Office of Special Education, in the 2012-2013 school year, more than 220,000 of Ohio’s student population ages 6 to 21 was served under the Individuals with Disabilities Education Act (IDEA). Students between the ages of 12 and 21, account for 53 percent or 136,713 served under IDEA. Table 9 below illustrates the number of Ohio students served by disability category in 2012. (U.S. DOE - IDEA Data Center, 2012-2013) Table 9 - Ohio: Number of Students Age 6-21
Served under IDEA, Part B by Disability Category in 2012
Disability Category
Number Served
Specific Learning Disability 97,440
Speech or Language Impairment 37,117
Other Health Impairments 34,131
Intellectual Disability 22,928
Autism 18,726
Emotional Disturbance 15,754
Multiple Disabilities 13,819
Hearing Impairment 2,428
Orthopedic Impairments 1,795
Traumatic Brain Injury 1,466
Visual Impairments 996
Deaf-Blindness 48 Table 10 - Ages of Students Served Under IDEA: 2012
Ages
Number Served
Percent of Total
Special Education
3-5 23,401 9%
6-11 95,839 38%
12-17 118,476 46%
18-21 18,237
7%
2015 Vocational Rehabilitation Comprehensive Statewide Needs Assessment
29
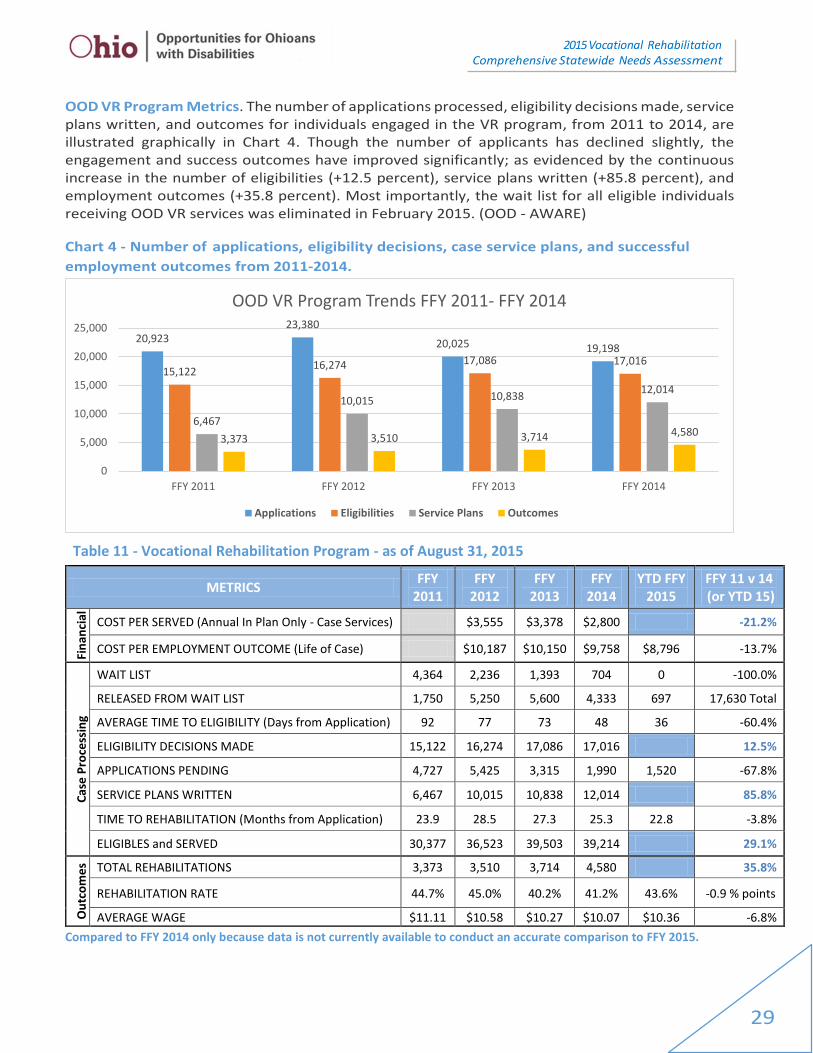
OOD VR Program Metrics. The number of applications processed, eligibility decisions made, service plans written, and outcomes for individuals engaged in the VR program, from 2011 to 2014, are illustrated graphically in Chart 4. Though the number of applicants has declined slightly, the engagement and success outcomes have improved significantly; as evidenced by the continuous increase in the number of eligibilities (+12.5 percent), service plans written (+85.8 percent), and employment outcomes (+35.8 percent). Most importantly, the wait list for all eligible individuals receiving OOD VR services was eliminated in February 2015. (OOD - AWARE)
Chart 4 - Number of applications, eligibility decisions, case service plans, and successful
employment outcomes from 2011-2014.
Table 11 - Vocational Rehabilitation Program - as of August 31, 2015
METRICS FFY
2011 FFY
2012 FFY
2013 FFY
2014 YTD FFY
2015 FFY 11 v 14 (or YTD 15)
Fin
anci
al
COST PER SERVED (Annual In Plan Only - Case Services) $3,555 $3,378 $2,800 $2,393 -21.2%
COST PER EMPLOYMENT OUTCOME (Life of Case) $10,187 $10,150 $9,758 $8,796 -13.7%
Cas
e P
roce
ssin
g
WAIT LIST 4,364 2,236 1,393 704 0 -100.0%
RELEASED FROM WAIT LIST 1,750 5,250 5,600 4,333 697 17,630 Total
AVERAGE TIME TO ELIGIBILITY (Days from Application) 92 77 73 48 36 -60.4%
ELIGIBILITY DECISIONS MADE 15,122 16,274 17,086 17,016 11,836 12.5%
APPLICATIONS PENDING 4,727 5,425 3,315 1,990 1,520 -67.8%
SERVICE PLANS WRITTEN 6,467 10,015 10,838 12,014 8,267 85.8%
TIME TO REHABILITATION (Months from Application) 23.9 28.5 27.3 25.3 22.8 -3.8%
ELIGIBLES and SERVED 30,377 36,523 39,503 39,214 32,758 29.1%
Ou
tco
me
s TOTAL REHABILITATIONS 3,373 3,510 3,714 4,580 3,447 35.8%
REHABILITATION RATE 44.7% 45.0% 40.2% 41.2% 43.6% -0.9 % points
AVERAGE WAGE $11.11 $10.58 $10.27 $10.07 $10.36 -6.8%
Compared to FFY 2014 only because data is not currently available to conduct an accurate comparison to FFY 2015.
20,92323,380
20,025 19,198
15,12216,274 17,086 17,016
6,467
10,015 10,83812,014
3,373 3,510 3,714 4,580
0
5,000
10,000
15,000
20,000
25,000
FFY 2011 FFY 2012 FFY 2013 FFY 2014
OOD VR Program Trends FFY 2011- FFY 2014
Applications Eligibilities Service Plans Outcomes

2015 Vocational Rehabilitation Comprehensive Statewide Needs Assessment
30
Recent Funding for OOD. For every dollar in state/local match funds provided, OOD is able to bring down an additional $3.69 in federal VR funds. Over the past four federal fiscal years (FFYs), 2011 to 2014, match ranged from $25.7 million in 2012 to a high of $29.6 million in 2014. The most significant changes in match over this period were in General Revenue Funds (GRF) and in Third Party Match which includes Vocational Rehabilitation Contracts. GRF increased from $12.7 million, or 46% of all match in FFY 2011 to $15.4 million, or approximately 52%, of all match in FFY 2014. Partnership match fluctuated a bit during this period. In FFY 2012, OOD implemented a new provision in its partnership contracts with local entities that capped the amount of time-limited funds (carry-over) that could be included in the contract the following year. This change resulted in less matching funds from partners that year. As a result of these changes in match, total VR federal funds drawn ranged from a low of $95.1 million FFY 2012 to $109.5 million in FFY 2014. OOD continues to identify opportunities to maximize the use of available federal funds. Funding information is illustrated graphically in Chart 5 below. (OOD - Fiscal) Chart 5 - OOD VR Funding Trends: 2011-2014
$12,706,680$12,912,426 $13,494,330 $15,365,605
$10,606,378 $8,144,922 $12,008,198 $10,612,751
$27,386,539 $25,745,802$29,419,874 $29,635,959
$101,188,761$95,126,508
$108,701,600 $109,500,000
$0
$20,000,000
$40,000,000
$60,000,000
$80,000,000
$100,000,000
$120,000,000
2011 2012 2013 2014
Federal Fiscal Year
VR Match and Federal Grant Comparison
GRF Match
Partnership Match
Total Match
Total Federal VR Grant

2015 Vocational Rehabilitation Comprehensive Statewide Needs Assessment
31
Findings
The secondary data summarized in this section of the CSNA provides a variety of important findings. Findings indicate that Ohio is a large state with a number of urban areas. About half of the population resides in nine Ohio counties. Ohio ranks 6th among states/territories in the number of residents with disabilities and 20th in the percentage of individuals with disabilities of total population. (Institute on Disability) National data suggests that there are significant gaps between employment rates for individuals with disabilities and individuals without disabilities, while the labor force participation rate for working age population (age 16 – 64) for individuals with disabilities has declined annually from 2012 to 2014. Furthermore, the poverty rate for individuals with disabilities is significantly higher than the poverty rate for individuals without disabilities. This also holds true for veterans with disabilities. Other more specific findings are indicated as follows:
1. Ohio is a large state with a population of 11,549,140. Half (50.1 percent) of the population resides in the following nine, of Ohio’s 88, counties: Cuyahoga, Franklin, Hamilton, Summit, Montgomery, Lucas, Butler, Stark, and Lorain. Cuyahoga is Ohio’s largest county with 1,242,390 residents.
2. Ohio is ranked 6th among the states in the number of residents with disabilities, while more
than 1.55 million individuals (13.6 percent of the total population) experience disabilities; of which 838,715 or 11.9 percent of Ohioans with disabilities were between the ages of 18 and 64.
3. Individuals with ambulatory and cognitive disabilities have the highest prevalence rates of disability, as well as the lowest employment rates amongst Ohioans with disabilities.
4. It is estimated that 31.8 percent of Ohioans with disabilities ages 18 to 64 are living in poverty, as compared to 13.0 percent of individuals without disabilities. The average annual median earnings for individuals with disabilities in Ohio is approximately $18,960, whereas individuals with no disability earn $30,271.
5. The number of workers with disabilities receiving social security disability insurance benefits has increased steadily in the last ten years, while the labor force participation rate of working age individuals with disabilities has declined annually since 2012.
6. More than 220,000 Ohio students ages 6 to 21, are served through the Individuals with Disabilities Education Act (IDEA).
7. As OOD’s budget increased from 2011 through 2014, the wait list for OOD eligible individuals was eliminated, while 4,580 individuals with disabilities served by OOD achieved an employment outcome in 2014 (+35.8 percent since 2011).

2015 Vocational Rehabilitation Comprehensive Statewide Needs Assessment
32
III. Progress and Follow-Up to 2012 CSNA Recommendations As cited in Table 12, OOD has implemented six of the 2012 CSNA recommendations, and is currently working to address the five other recommendations. Activities planned for 2015 and 2016, include expanding state and business/provider partnerships statewide to improve services to youth, and individuals with cognitive, hearing, and visual disabilities. Table 12 – OOD Progress from 2012 CSNA Recommendations
2012 CSNA Recommendations Progress Made as of 2015 Status
Focus efforts to access available federal funding to provide services to individuals with disabilities.
OOD received two consecutive General Revenue Fund (GRF) increases, as well as GRF from the Department of Developmental Disabilities (DODD) for Employment First, and from the Ohio Department of Education (ODE) for Transition Youth Services. OOD secured private foundation grant funding targeting direct placement of served individuals to a network of Business Leadership Network employers.
Formalize efforts in counties that demonstrate effective methods for conducting outreach and addressing the employment needs of individuals with disabilities.
The Employment First initiative with the Ohio Department of Developmental Disabilities (DODD) is focused on localized efforts in serving individuals that work with DD boards. This model approach is continuing through the Workforce Integration Taskforce and the Ohio Education agreement.
Direct efforts toward establishing better alignment of the distribution of resources across counties in Ohio.
Through the Employment First Initiative, OOD counselors were strategically aligned to meet needs across counties. Realignment of ODD staff is now evaluated via a Healthy Caseload Dashboard.
Expand VR services to transition age youth through a partnership agreement with ODE and by directing VR counselors to work closely with local education agencies.
A partnership with ODE, focused on serving students with disabilities, has been included as part of Ohio's State Fiscal Year 2016-2017 Budget. In FFY 2014, transition age youth represented 44 percent of individuals served by OOD.
Explore the utilization of a resource investment system in which outcome achievement data is utilized to make decisions about resources.
A market based fee schedule was standardized in October 2012. An evaluation of a cost rate fee schedule is taking place in 2015.

2015 Vocational Rehabilitation Comprehensive Statewide Needs Assessment
33
2012 CSNA Recommendations Progress Made as of 2015 Status
Expand VR services to older adults through a partnership with the Ohio Department of Aging (ODA).
An interagency agreement with ODA is in place.
Develop a formal plan to share current methods for collecting and disseminating data with stakeholder groups.
OOD is now part of a Unified State Workforce Plan, as required by the Workforce Innovation and Opportunity Act (WIOA) of 2014. OOD is a member of the Ohio Longitudinal Data Archive, which includes the following partner agencies: Job and Family Services, Board of Regents, and Education.
Examine the need to capture additional data related to the use of state supported services at intake and for case management services.
Revisions to Rehabilitation Services Administration reporting requirements for the VR program have added requirements to track involvement with other systems at the time of application for services. These requirements were added in the AWARE case management system during FFY 2014. WIOA related activities with other state agencies will also support us to advance the capture of additional data.
Evaluate the strategic use of “supported employment” services as a method of reducing recidivism.
OOD and the Ohio Department of Developmental Disabilities have implemented the Employment First partnership agreement that provides supported employment services to individuals with the developmental disabilities to assist them in moving from sheltered workshops and other segregated settings into community employment. In addition, OOD and the Ohio Department of Mental Health and Addiction Services have co-facilitated a Statewide Employment Committee that has drafted an Individualized Placement and Support procedure to implement this evidenced based supported employment model in Ohio.
Direct efforts to use labor market information to assist individuals with disabilities and BVR/BSVI counselors in developing valid employment goals.
OOD hired a Business Relations Manager (BRM) and regionally based Business Sourcing Analysts (BSAs). The BRM and BSAs have been trained on the Wanted Analytics tool. This data will be automated against OOD data in 2015, and made available to staff.
Offer information and referral to individuals with disabilities waiting for services as efforts continue to eliminate the waiting list.
OOD eliminated the wait list for VR services.

2015 Vocational Rehabilitation Comprehensive Statewide Needs Assessment
34
Section IV. Disability Demographics and Employment Status The information presented in the following section focuses on race, ethnicity and age. A review of a variety of data suggests that, for both age and race, OOD proportionately serves African Americans and youth at a higher rate than the demographic makeup of the state. As Ohio’s largest minority race and ethnic populations are African Americans and Hispanic/Latino, respectively, this analysis will first focus on statistics regarding the African American population and then a summary of needs data for Hispanics/Latinos residing in Ohio is presented. Finally, data and analysis related to age and disabilities are summarized.
Need for Vocational Rehabilitation Services among Minorities
Race. ACS 2012 data indicate that the estimated prevalence of disability for working age Ohioans (age 21-64) was: 11.7 percent among whites, estimated 647,300 individuals 17.0 percent among Black/African Americans, estimated 131,800 individuals 4.3 percent among Asians, estimated 5,600 individuals 29.1 percent among Native Americans, estimated 4,400 individuals 15.9 percent other race(s), estimated 23,400
Chart 6
White 1,119,623
82.6%
Black or African American 164,13912.1%
Asian8,6600.6%
American Indian and Alaska Native
6,0260.4% Other Races
56,4704.2%
Ohio Disability Population by Race - 2013 Estimates(n= 11,549,590)
White Black or African AmericanAsian American Indian and Alaska NativeOther Races

2015 Vocational Rehabilitation Comprehensive Statewide Needs Assessment
35
Chart 7
African American Population. The total African American population in Ohio is 1,402,897 or 12.1 percent of the state’s total population; of which 941,437 are of working age (age 15-64). Seven (7) of Ohio’s counties have African American working age populations of 20,000 or more, which combine to make up 80% of the state’s African American working age population (U.S. Census - ACS, 2013). The prevalence of disability for working age African Americans is 17 percent (Erickson, Lee, & von Schrader, 2014)
The total number of working age African Americans with disabilities in Ohio is estimated to be 160,044. Bureau of Labor Statistics further cites that 30.2 percent of individuals are actively engaged in the labor force. The unemployment rate for African Americans tends to be almost 2.3 times greater than that of the overall unemployment rate. Applying this to the unemployment rate of individuals with disabilities, we can estimate that 31 percent or almost 15,000, of the estimated 30 percent subset of African Americans engaged in the labor force, are seeking employment. (Bureau of Labor Statistics, 2013-2015) (U.S. Census - ACS, 2013)
American Indian or Alaskan Native
2311%
Asian2231%
Black or African American
6,94125%
White20,160
73%
OOD Served by Race - 2014(n= 27,555)
American Indian or Alaskan Native Asian Black or African American White

2015 Vocational Rehabilitation Comprehensive Statewide Needs Assessment
36
Table 13 – Seven (7) Counties with African American Working Age Population of 20,000+
Counties with African American Working Age Population of 20,000+ (7)
Total African
American Population
African American
Population Age 15-64
African American Disability
Prevalence Estimate
Estimated Seeking
Employment
OOD 2014
Served Penetration
Rate
Cuyahoga County 377,415 249,453 42,407 3,970 1,825 46.0%
Franklin County 250,334 167,349 28,449 2,663 1,061 39.8%
Hamilton County 205,533 136,220 23,157 2,168 926 42.7%
Montgomery County 111,046 73,188 12,442 1,165 634 54.4%
Lucas County 83,604 55,988 9,518 891 341 38.3%
Summit County 77,402 51,363 8,732 817 476 58.2%
Mahoning County 37,132 23,963 4,074 381 262 68.7%
Total 1,142,466 757,524 128,779 12,056 5,525 45.8%
Ohio Total 1,402,897 941,437 160,044 14,983 6,937 46.3%
Percent of Ohio Total 81.4% 80.5% 80.5% 80.5% 79.6%
Table 14 – Eight (8*) Counties with African American Working Age Population of 7,500 - 20,000
Counties with African American Working Age Population of 7,500 - 20,000 (8)*
Total African
American Population
African American
Population Age 15-64
African American Disability
Prevalence Est. of 17%
Estimated Seeking
Employment
OOD 2014
Served Penetration
Rate
Total 144,149 97,709 16,611 1,555 895 57.6%
Ohio Total 1,402,897 941,437 160,044 14,983 6,937 46.3%
Percent of Ohio Total 10.3% 10.4% 10.4% 10.4% 12.9%
Table 14 provides a summary of Butler, Stark, Lorain, Trumbull, Greene, Allen, Richland, and Clark counties*, that have African American working age populations between 7,500 and 20,000. These counties combined make up 10.4 percent of this demographic for the state. The remaining 73 counties are represented by 9.2 percent or 86,000 working age African Americans, as summarized in Table 15 below. Table 15 – Seventy–three (73) Counties with African American Working Age Population of less than 7,500
Total African
American Population
African American
Population Age 15-64
African American Disability
Prevalence Est. of 17%
Estimated Seeking
Employment
OOD 2014
Served Penetration
Rate
Total 116,282 86,204 14,655 1,372 517 37.7%
Ohio Total 1,402,897 941,437 160,044 14,983 6,941 46.3%
Percent of Ohio Total 8.3% 9.2% 9.2% 9.2% 7.5%
Of the more than 27,000 individuals served by OOD in 2014, 25.2 percent or 6,941 were African Americans. Penetration rate refers to the number of individuals with a specific disability likely to be served as a percentage of the total number who could potentially be served. It is estimated that OOD’s penetration rate for serving African Americans with disabilities who may be seeking employment was 46.3 percent, which is more than 11 percentage points higher than the estimated service rate for the Hispanic / Latino population.

2015 Vocational Rehabilitation Comprehensive Statewide Needs Assessment
37
Ethnicity. The prevalence of disability for the working age Hispanic/Latino population is 11 percent. The total number of working age Hispanic/Latinos with disabilities in Ohio is estimated to be 25,382, with 1,610 actively seeking employment. (Institute on Disability)
Table 16 – Eight (8) Counties with Hispanic/Latino Working Age Population of 7,500+
Total Pop. Hispanic /
Latino
Hispanic/Latino Population Age 15-64
Hispanic/Latino 11% Disability
Prevalence
Estimated Seeking
Employment OOD 2014
Served Penetration
Rate
Cuyahoga 62,778 40,742 4,482 284 129 45.4%
Franklin 57,223 36,676 4,034 256 43 16.8%
Lucas 27,534 16,755 1,843 117 34 29.1%
Lorain 25,890 15,970 1,757 111 55 49.4%
Hamilton 21,239 13,490 1,484 94 15 15.9%
Butler 15,046 9,340 1,027 65 15 23.0%
Montgomery 12,730 7,998 880 56 13 23.3%
Mahoning 11,482 7,519 827 52 20 38.1%
Total 233,922 148,490 16,334 1,036 324 31.3%
Ohio Total 367,394 230,742 25,382 1,610 558 34.7%
Percent of Ohio Total 63.7% 64.4% 64.4% 64.4% 58.1%
Table 17 – Seven (7) Counties with Hispanic/Latino Working Age Population of 2,500 - 6,000
Total Pop. Hispanic /
Latino
Hispanic/Latino Population
Age 15-64
Hispanic/Latino 11% Disability
Prevalence
Estimated Seeking
Employment
OOD 2014
Served Penetration
Rate
Total 43,983 27,506 3,026 192 84 43.8%
Ohio Total 367,394 230,742 25,382 1,610 558 34.7%
Percent of Ohio Total 12.0% 11.9% 11.9% 11.9% 15.1%
Table 18 – Seventy-three (73) counties with Hispanic/Latino Working Age Population < 2,500 (OOD served 43 counties)
Total Pop. Hispanic /
Latino
Hispanic/Latino Population
Age 15-64
Hispanic/ Latino 11% Disability
Prevalence
Estimated Seeking
Employment OOD 2014
Served Penetration
Rate
Total 89,489 54,746 6,022 382 150 39.3%
Ohio Total 367,394 230,742 25,382 1,610 558 34.7%
Percent of Ohio Total 24.4% 23.7% 23.7% 23.7% 26.9%
Table 16 shows the total Hispanic/Latino population in Ohio is 367,394 or 3.2 percent of the state’s total population, 230,742 are working age (15-64). Table 17 provides a summary of the eight (8) Ohio counties with Hispanic/Latino working age populations of 7,500 or more. Bureau of Labor Statistics further cites that 30.2 percent of individuals are actively engaged in the labor force. The unemployment rate for Hispanic/Latinos tends to be almost 0.5 times greater than that of the overall unemployment rate. Applying this to the unemployment rate of individuals with disabilities, we can estimate that 20 percent, or approximately 1,600, of the estimated 30 percent engaged in the labor force are seeking employment. In 2014, OOD provided vocational rehabilitation services to 558 Hispanic/Latinos with disabilities in 62 of 88 counties. This represents two percent of those served by OOD with a service penetration rate of 34.7 percent of Hispanic/Latino Ohioans that could benefit from OOD VR services. (U.S. Census - ACS, 2013)

2015 Vocational Rehabilitation Comprehensive Statewide Needs Assessment
38
Age and Disabilities in Ohio
In 2013, Ohio’s population of youth ages 15-24 was 1,583,227. Estimates indicate that 6.3 percent of these individuals experience a disability (U.S. Census, 2012), which represents 99,743 individuals. Furthermore ODE has identified that there are over 50,000 youth with Individualized education programs (IEPs) with disabilities that could meet OOD eligible criteria. According to OOD, 44 percent or 11,959 individuals age 14-24 were served in 2014. Penetration rate refers to the number of individuals from a specific population likely to be served as a percentage of the total number who could potentially be served. (Note: Section VII and Appendix A – ‘Transition-age Youth and Young Adults’, Kent State University’s analysis report, provides a more in-depth analysis and approach to address for serving youth and students with disabilities). Census data indicate that there were 1,681,232 (14.4 percent) individuals in Ohio age 65 and over with a disability; it is estimated that this population represents 585,030 individuals in 2015. According to OOD, less than one percent (303) of the individuals served in 2014 were 65 or older, which can be explained by the fact, as cited in Table 5, that less than two percent of individuals with disabilities age 65 and older currently not in the labor force are actively seeking employment or marginally attached to the workforce. (U.S. Census - ACS, 2013) (OOD - AWARE).
Chart 8 Chart 9
14-2499,743
7%
25-64747,708
52%
65 and over
585,03041%
Ohio Population by Age - 2013(n= 1,432,481)
14-24 25-64 65 and over
14-2411,959
44%25-64
14,91455%
65 and over303, 1%
OOD Served by Age - 2014(n= 27,176)
14-24 25-64 65 and over

2015 Vocational Rehabilitation Comprehensive Statewide Needs Assessment
39
Findings
1. In 2014, OOD provided VR services to approximately 27,000 individuals; 6,941 or 25 percent
were African Americans and 558 or two percent were Hispanics/Latinos.
2. Estimates indicate that 17.0 percent of working age African Americans (American Community
Survey, 2012) experience disabilities. This translates into 160,044 Ohioans. Other estimates indicate that of the more than 30 percent or 54,000 African American with disabilities almost 31 percent, or 15,000, may be seeking employment at any particular point in time. Thus, OOD is serving approximately 46.3 percent of African Americans who could benefit from services.
3. More than eight (8) out of 10 working age African Americans (80.5 percent) reside in the following seven Ohio counties: Cuyahoga, Franklin, Hamilton, Montgomery, Lucas, Summit, and Mahoning.
4. Estimates indicate that 11 percent of Hispanic/Latino working age individuals experience disabilities. This translates into 25,382 individuals. Other estimates indicate that 21 percent (or 1,610) of Hispanics/Latinos not in the labor force may be seeking employment at any specific point in time. Thus, OOD is serving approximately 34.7 percent of Hispanics who could benefit from services. There would appear to be strategic value in enhancing services to the Hispanic population in Ohio.
5. Almost two-thirds of Ohio’s Hispanic population with disabilities reside in the following
counties: Butler, Cuyahoga, Franklin, Hamilton, Lorain, Lucas, Mahoning, and Montgomery. 6. In 2013, there were 1,583,227 youth in Ohio between the ages of 14 and 24. Estimates suggest
that approximately 100,000 of this population may experience disabilities. 7. In 2014, OOD served 11,959 youth between 14 and 24 years of age. 8. There are 1,681,232 individuals in Ohio over age 65. Estimates suggest that 585,030 may
experience disabilities. 9. OOD served 303 individuals over age 65 in 2014. It is important to note that less than two
percent of individuals age 65 and older with a disability, who are not in the labor force, are actually seeking work. So although the vocational rehabilitation outcomes tied to competitive employment may not be a focus of older Ohioans with disabilities, the expanded partnership the Department of Aging, as well as OOD’s strategy focused on the Independent Living and Older Blind program, may be helpful in meeting the needs of this population.

2015 Vocational Rehabilitation Comprehensive Statewide Needs Assessment
40
V. Prevalence & Penetration Rate Projections of Unmet Need
Projecting the number of Ohioans experiencing various categories of disability is a key tool for addressing the needs assessment questions. The purpose of developing such projections is to determine with as much accuracy as possible, the estimated number of individuals in each county is likely to experience a disability consistent with the categories of disability served by OOD. These projections assist planners to make resource allocation decisions based on reasonable estimates of the need for services.
Limitations of the Data
The findings summarized in this section of the CSNA are intended as estimates of the magnitude of need in any individual county in Ohio. The precision of these estimates is not sufficient to address questions about the actual numbers of individuals likely to experience specific disabilities. Rather, the estimates are used to categorize counties into one of four categories: highest need; high need; moderately high need; and lower need. It is important to point out that data reviewed in this section of the CSNA indicate that there are unmet needs in all counties in Ohio.
Methods for Developing Prevalence Estimates
As was utilized from the 2012 CSNA (Julian, 2012), OOD estimated county level prevalence rates based on multiplying population figures by a coefficient derived from a national or other reputable source. Estimates of prevalence from the ACS were considered when there was a close match with OOD categories of disability. Several categories of data were reviewed to identify appropriate prevalence estimates. The RSA CSNA manual (Shell, 2009) contained references to a number of reputable sources for prevalence estimates. When appropriate, these estimates were adopted. Secondary sources included research published in a variety of academic journals (i.e., Journal of the American Medical Association) (D.A. Reiger, 1990), as well as reports produced by national agencies (i.e., Center for Disease Control, National Institute of Mental Health).

2015 Vocational Rehabilitation Comprehensive Statewide Needs Assessment
41
Prevalence of Disabilities
Table 19 - Estimated Prevalence for Specific Categories of Disabilities in Ohio
Disability Category
Prevalence
Estimate
Source
Visual Impairment
2.1% U.S. Census Bureau – 2013 American Community Survey
(Institute on Disability)
Hearing Impairment
2.3% U.S. Census Bureau – 2013 American Community Survey
(as cited in 2014 Annual Disability Statistics Compendium) Communicative
Impairment
1.2% Survey of I n come and Program Participation
(Steinmetz, 2006)
Physical Impairment
6.0% U.S. Census Bureau – 2013 American Community Survey
(Institute on Disability) Psychosocial
Impairment
4.6% Substance Abuse and Mental Health Services
Administration, (SAMHSA, 2014)
Cognitive Impairment
5.2% U.S. Census Bureau – 2013 American Community Survey
(Institute on Disability)
Visual Impairment. The 2013 ACS indicates that of the population ages 18-64, 2.1 percent in the U.S. and 2.3 percent in Ohio experience a vision impairment. Individuals were classified as having a vision disability if they answered yes when asked if they had serious difficulty seeing even when wearing glasses. Hearing Impairment. The 2013 ACS indicates that of the population ages 18-64, 2.1 percent in the U.S. and 2.3 percent in Ohio experience hearing difficulties. Individuals were classified as having a hearing disability if they answered yes when asked if they were deaf or had serious difficulty hearing.
Communicative Impairment. Steinmetz (2006) indicates that 1.2 percent of the population ages 15 and older have a speech disability. This includes .09 percent with a non-severe disability and .03 percent with a severe disability.
Physical Impairment. The 2013 ACS indicates that of the population ages 18-64, 5.3 percent in the U.S. and 6.0 percent in Ohio experience ambulatory disabilities. Individuals were classified as having an ambulatory disability if they answered yes when asked if they had serious difficulty walking or climbing steps.
Psychosocial Impairment. According to the Substance Abuse and Mental Health Services Administration, as cited by Behavioral Health Barometer – Ohio 2014, 4.6 percent of the population 18 and older experienced severe mental illness per 2012-2013 estimates; the national prevalence rate was 4.1 percent.
Cognitive Impairment. The 2013 ACS indicated that 4.2 percent of the population in the U.S. and 5.2 percent of the population in Ohio experienced a cognitive disability. Individuals were classified as having a cognitive disability if they answered yes when asked if they had serious difficulty concentrating, remembering or making decisions due to a physical, mental or emotional condition.

2015 Vocational Rehabilitation Comprehensive Statewide Needs Assessment
42
Conditions of Individuals with Disabilities
As noted in the “Introduction,” information about a variety of other conditions of individuals with disabilities was reviewed, including, but not limited to, developmental disabilities, autism, traumatic brain injury (TBI), and alcohol and drug use. The CSNA focuses on this subset of conditions of individuals with disabilities because these are the ones most often addressed by providers in the OOD service system. Table 20 below summarizes the literature that was consulted to develop prevalence estimates for conditions of individuals with disabilities.
Table 20 - Estimated Prevalence for Conditions of Individuals with Disabilities
Conditions of People with Disabilities
Prevalence Estimate
Source
Traumatic Brain
Injury
Between 0.65% - 0.81%
Centers for Disease Control and Prevention – (Centers for Disease Control and Prevention, 2014)
Developmental
Disability
1.8%
RSA Needs Assessment Manual (Shell, 2009)
Autism
1.5%
Centers for Disease Control - (CDC - Autism & Developmental Disabilities Monitoring (ADDM) Network, 2014) (The Autism Society of Ohio)
Illicit Drug Abuse and Dependency
2.9%
Substance Abuse and Mental Health Services Administration, (SAMHSA, 2014)
Heavy Drinkers
7.7%
Substance Abuse and Mental Health Services Administration, (SAMHSA, 2014)
Methods and Procedures The prevalence rates regarding conditions of individuals with disabilities were researched using the most current accurate estimates; and where available specific to Ohio estimates. The detail below also reviews the trend information regarding the conditions of disability, most notably that the rate of youth with autism diagnosis has more than doubled in the last ten years and that although the trend in illicit drug abuse and dependency and heavy alcohol abuse has remained steady in Ohio, it trends slightly above the national average.

2015 Vocational Rehabilitation Comprehensive Statewide Needs Assessment
43
Traumatic Brain Injury (TBI). TBI is damage to the brain caused by some category of trauma. It can cause mild to severe impacts and, in some cases, significant disability. As illustrated in Chart 10, The Centers for Disease Control has tabulated the number and frequency of TBIs in the U.S. The total combined rates of TBI-related hospitalizations, emergency department (ED) visits, and deaths climbed slowly from a rate of 521.0 per 100,000 in 2001 to 615.7 per 100,000 in 2005. After dipping in 2007, the rates then spiked sharply in 2008 and continued to climb through 2010 to a rate of 823.7 per 100,000. (Centers for Disease Control and Prevention, 2014)
Table 21 - TBI-related Emergency Department Visits by Age Group and Injury Mechanism —
United States, 2006–2010
Table 22 -Rates (per 100,000) of TBI-related Hospitalizations by Age Group (per 100,000) – United States 2001-2010
Chart 10 -

2015 Vocational Rehabilitation Comprehensive Statewide Needs Assessment
44
Developmental Disability. Estimates suggest that two (2) individuals per 1,000 population, 18 years and older, experience intellectual disabilities (Larson, Lakin, Anderson, Kwak & Anderson, 2001 cited in Shell, 2009). Larson et al. (2001) indicate that the number of individuals with intellectual and developmental disabilities is seven (7) per 1,000 population. Shell (2009) suggests that many Developmental Disabilities Councils use the prevalence rate of 1.8 percent of the non-institutionalized population to estimate the rate of developmental disabilities. This estimate includes individuals younger than 18.
Autism. The Autism Society of Ohio estimates there are 60,000 individuals living with autism in Ohio. Table 23 shows that the prevalence of autism in U.S. children increased by 119.4 percent from 1 in 150 in 2000, to 1 in 68 in 2010. This 1.5 percent prevalence estimate is reflective of children who are currently 13 years of age (CDC - Autism & Developmental Disabilities Monitoring (ADDM) Network, 2014). Thus, in the next three years, OOD may see an increase in individuals served with autism. Autism is the fastest-growing developmental disability. Thirty-five percent of young adults (ages 19-23) with autism have not had a job or received postgraduate education after leaving high school. (Shattuck, 2006)
Table 23 -
Additional information related to autism can be found here:
http://www.autismohio.org/index.php/information/statistics-facts
http://www.cdc.gov/ncbddd/autism/data.html

2015 Vocational Rehabilitation Comprehensive Statewide Needs Assessment
45
Behavioral Health The Substance Abuse and Mental Health Services Administration (SAMHSA) publishes an annual Behavioral Health Barometer Report for each state. The information below cites Ohio’s 2014 report. (SAMHSA, 2014)
Use of Illicit Drugs. Chart 11 shows that 2.9 percent of Ohioans age 12 or older in 2012-2013 were dependent on or abused illicit drugs within the year prior to being surveyed.
Chart 11 -
Heavy Drinking. Chart 12 shows that 631,000 of Ohioans age 21 or older (7.7 percent of all adults in this age group) per year, from 2009–2013, reported heavy alcohol use within the month prior to being surveyed. The rate was 6.8 percent nationally.

2015 Vocational Rehabilitation Comprehensive Statewide Needs Assessment
46
Chart 12 -
For more information about the Ohio 2014 Behavioral Health Barometer, click here:
http://www.samhsa.gov/data/sites/default/files/State_BHBarometers_2014_2/BHBarometer-OH.pdf
Findings
Findings Related to Conditions of Individuals with Disabilities. A review was conducted of several other conditions of individuals with disabilities including developmental disabilities, autism, traumatic brain injury and/or alcohol and other drug use. This CSNA focuses on this subset of conditions of individuals with disabilities because these are the ones most often addressed by providers in the OOD service system. Additional findings include: 1. The Estimated prevalence of disabilities in the general population in Ohio ranges from 1.2
percent for communicative impairments to 6.0 percent for physical disabilities. 2. The total combined rates of TBI-related hospitalizations, emergency department (ED) visits, and
deaths climbed slowly from a rate of 521.0 per 100,000 in 2001 to 615.7 per 100,000 in 2005. After dipping in 2007, the rates then spiked sharply in 2008 and continued to climb through 2010 to a rate of 823.7 per 100,000.
3. There have been significant increases in the number of individuals impacted by autism over the
last decade. The Autism Society of Ohio estimates there are 60,000 individuals living with autism in Ohio. Prevalence of autism in U.S. children increased by 119.4 percent from 1 in 150 in 2000, to 1 in 68 in 2010.
4. There remains significant potential for alcohol and drug use to impact individuals with disabilities, thus OOD’s partnerships with the Department of Mental Health and Addiction Services and local boards will continue to play a vital role in meeting their vocational rehabilitation needs.

2015 Vocational Rehabilitation Comprehensive Statewide Needs Assessment
47
Penetration Rate of Primary Disability Categories
“Penetration rate” refers to the number of individuals with a specific disability served as a percentage of the total number who could potentially be served. The total number who could potentially be served refers to estimates of working age (16-64) population individuals with disabilities looking for work. In order to accurately reflect the VR needs of individuals by disability that are actively seeking work, the working age population was utilized in these estimates because Bureau of Labor Statistics indicate that less than two percent of the population of individuals with disabilities ages 65 and older are actively seeking work, or even marginally attached to the labor force. The number of individuals that are looking for work is impacted by many factors. The formula for calculating penetration rate is: (U.S. Department of Labor - Bureau of Labor Statistics, 2015)
• A x B = C A = Estimated population. Projected population 15 and older was obtained from the Ohio
Development Services Agency and based on 2015 to 2020 census data estimates. (Ohio
Development Services Agency, 2015)
B = Prevalence rate for a specific disability.
C = Estimated number of individuals who potentially experience a particular disability.
• C x D = E D = Estimated % of individuals of working age population with disabilities not working.
Estimated % of individuals with disabilities not working was obtained by subtracting the estimated employment rate by disability from 100%.
E = Estimated number of working age (individuals with disabilities not working).
• E x F = G F = Estimated % seeking employment that could benefit from OOD VR services. (U.S. Bureau of Labor Statistics estimates suggest that 13.6 percent of working age (16-64) individuals with disabilities who are not working are seeking employment at any particular point in time).
G = Estimated number of working age individuals with disabilities seeking employment that could benefit from OOD VR services.
• Number served by OOD/G x 100 = Penetration rate

2015 Vocational Rehabilitation Comprehensive Statewide Needs Assessment
48
Findings
Findings Related to Penetration Rates. Maps 1 through 6, and supporting Table 27, provide 2016 estimated penetration rates, for the six major OOD categories of disability, by county. Counties are classified in one of four categories: highest need; high need; moderately high need; and lower need. The blue shading on the maps represents better alignment of resources in meeting needs of a particular disability by county, whereas, the green represents the next level of meeting service needs, orange and red represent higher implied need/where greater opportunity exists for OOD. So that the data and impact of OOD VR services, based on estimated needs, can be evaluated equally across the six primary disability categories, the categories were represented in these maps. In this report, the identified break function assures prevalence rates for counties in a particular category are similar across all disability categories to assess how OOD is meeting needs by primary disability category. The ranges do not overlap. A review of penetration rate data suggest that although significant progress has been made in serving individuals with psychosocial and cognitive disabilities, there is continued need for OOD VR services for all categories of disability in the coming years. (OOD - AWARE) (Ohio Development Services Agency , 2015 )

2015 Vocational Rehabilitation Comprehensive Statewide Needs Assessment
49
Map 1
Cognitive Impairments - OOD Service Penetration Rate - 2016 Projection

2015 Vocational Rehabilitation Comprehensive Statewide Needs Assessment
50
Map 2
Communicative Impairments - OOD Service Penetration Rate - 2016 Projection
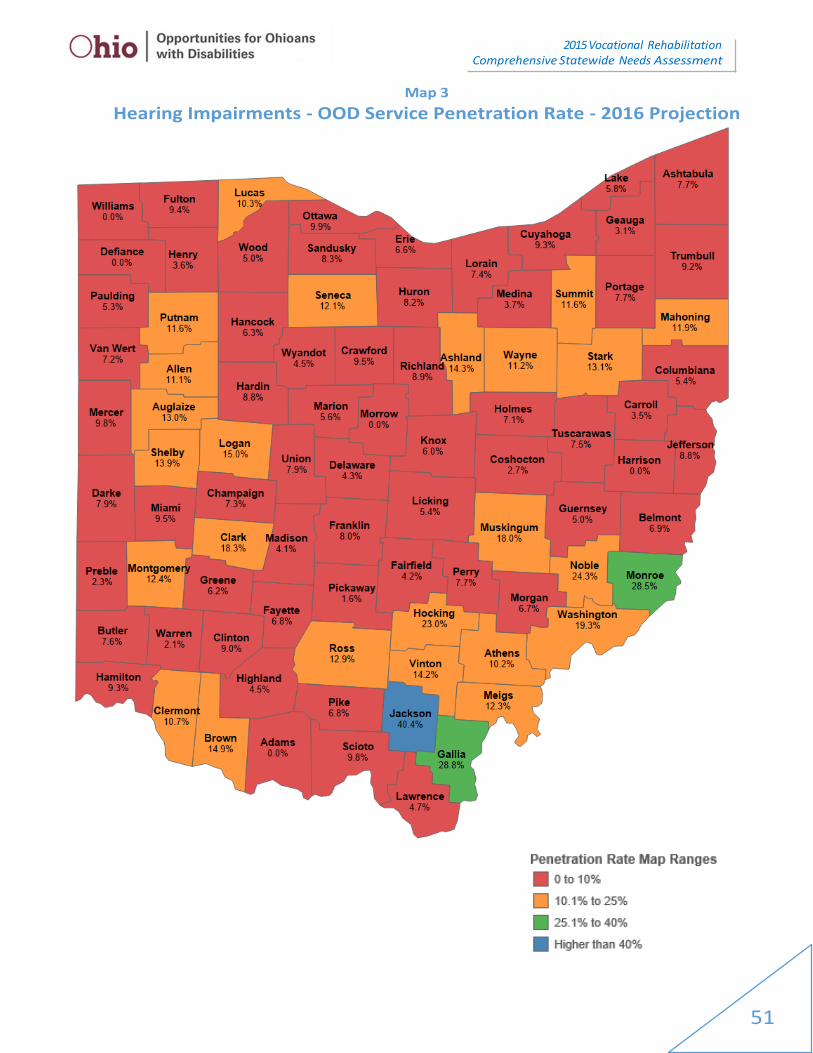
2015 Vocational Rehabilitation Comprehensive Statewide Needs Assessment
51
Map 3
Hearing Impairments - OOD Service Penetration Rate - 2016 Projection

2015 Vocational Rehabilitation Comprehensive Statewide Needs Assessment
52
Map 4
Physical Impairments - OOD Service Penetration - 2016 Projection

2015 Vocational Rehabilitation Comprehensive Statewide Needs Assessment
53
Map 5
Psychosocial Impairments - OOD Service Penetration - 2016 Projection

2015 Vocational Rehabilitation Comprehensive Statewide Needs Assessment
54
Map 6
Visual Impairments - OOD Service Penetration - 2016 Projection

2015 Vocational Rehabilitation Comprehensive Statewide Needs Assessment
55
Findings Related to OOD Service Provision by Disability. The 2012 CSNA explored the relationship between location and volume of services and employment outcomes. Correlational analyses for each category of disability was based on the hypothesis that volume of service would be associated with higher penetration rates. However, results indicated no relationship between volume of services available and penetration rates. “Penetration rate” reflects the number of individuals served as a percentage of the total number who could benefit from OOD VR services. (Julian, 2012)
Other more specific findings are indicated below. 1. Table 24 below summarizes that statewide, in the vast majority of counties, OOD is currently
serving a very small number, 0 to 10 percent, of individuals with communicative and hearing disabilities, as compared to the estimated need. In addition, the majority of counties with individuals with physical and visual service needs, have penetration rates from 10.1 to 25 percent.
2. OOD’s service provision is higher for individuals with psychosocial and cognitive impairments. This is most likely explained by the fact that OOD in the past four years has concentrated efforts through focused contracts with local Mental Health and Drug Addiction boards, local Developmental Disabilities boards, and most recently through the Ohio Department Developmental Disabilities funding for Employment First. Each of these populations has an organized representative presence through established county public agencies across the state.
Table 24 - Number of Counties by Disability Category and OOD Service Penetration Rate Range – 2016 projection
Range Cognitive Communicative Hearing Physical Psycho- Social Visual
0 to 10% 3 68 61 8 2 17
10.1% to 25% 38 17 24 51 17 57
25.1% to 40% 29 3 2 17 26 13
Higher than 40% 18 0 1 12 43 1
3. Fifteen (15) counties had penetration rates at or below 10 percent for three or more disability categories. These counties included: Adams, Clinton, Delaware, Geauga, Greene, Henry, Holmes, Lake, Lorain, Madison, Morgan, Morrow, Paulding, Sandusky, and Wood.
4. Belmont, Clinton, Hardin, Holmes, Lake, Lorain, and Noble were the only counties that did not have an OOD service penetration rate of more than 25 percent for any of the six primary disability impairment categories.

2015 Vocational Rehabilitation Comprehensive Statewide Needs Assessment
56
Table 25 - OOD Service Penetration Rate Ranges – Counts by County – 2016 Projection
County 0 to 10%
10.1% to 25%
25.1% to 40%
Higher than 40% County 0 to 10%
10.1% to 25%
25.1% to 40%
Higher than 40%
Adams 3 2 1 0 Logan 2 1 0 3
Allen 0 2 1 3 Lorain 3 3 0 0
Ashland 2 3 1 0 Lucas 1 4 0 1
Ashtabula 2 3 0 1 Madison 3 1 2 0
Athens 0 2 2 2 Mahoning 1 3 1 1
Auglaize 0 2 1 3 Marion 2 2 1 1
Belmont 2 4 0 0 Medina 2 3 1 0
Brown 0 4 2 0 Meigs 1 4 1 0
Butler 2 3 1 0 Mercer 1 2 2 1
Carroll 2 2 2 0 Miami 2 1 3 0
Champaign 1 3 1 1 Monroe 2 3 1 0
Clark 1 3 1 1 Montgomery 1 3 1 1
Clermont 1 4 0 1 Morgan 3 2 0 1
Clinton 3 3 0 0 Morrow 3 2 1 0
Columbiana 2 2 1 1 Muskingum 1 2 3 0
Coshocton 1 4 0 1 Noble 2 4 0 0
Crawford 1 1 1 3 Ottawa 2 1 2 1
Cuyahoga 2 3 0 1 Paulding 3 1 2 0
Darke 2 0 1 3 Perry 2 2 2 0
Defiance 1 3 1 1 Pickaway 2 3 1 0
Delaware 4 1 0 1 Pike 2 3 0 1
Erie 2 1 2 1 Portage 1 4 0 1
Fairfield 2 2 2 0 Preble 2 2 2 0
Fayette 2 2 2 0 Putnam 0 3 2 1
Franklin 2 3 0 1 Richland 1 2 1 2
Fulton 2 3 1 0 Ross 1 1 3 1
Gallia 1 2 2 1 Sandusky 3 0 0 3
Geauga 4 1 1 0 Scioto 2 1 2 1
Greene 3 2 0 1 Seneca 1 2 1 2
Guernsey 2 3 1 0 Shelby 0 2 4 0
Hamilton 2 1 3 0 Stark 1 1 2 2
Hancock 2 3 1 0 Summit 1 4 0 1
Hardin 2 4 0 0 Trumbull 2 3 0 1
Harrison 2 2 2 0 Tuscarawas 2 2 1 1
Henry 3 2 1 0 Union 2 2 1 1
Highland 2 3 1 0 Van Wert 2 1 1 2
Hocking 1 2 1 2 Vinton 1 4 0 1
Holmes 5 1 0 0 Warren 2 3 1 0
Huron 1 2 0 3 Washington 1 2 1 2
Jackson 1 2 0 3 Wayne 1 3 2 0
Jefferson 2 2 2 0 Williams 2 3 0 1
Knox 2 3 0 1 Wood 3 2 0 1
Lake 4 2 0 0 Wyandot 2 1 2 1
Lawrence 2 1 0 3 Ohio 2 2 1 1
Licking 2 3 1 0

2015 Vocational Rehabilitation Comprehensive Statewide Needs Assessment
57
5. Allen and Auglaize counties stand out positively, in the fact that the rate of individuals with disabilities served by OOD were higher for three disability categories (cognitive, physical, and psychosocial), and was not below 10 percent for communicative, hearing or visual.
6. Table 26 below provides a list of counties with highest and lowest penetration rates for each disability category.
Table 26 - Counties with Highest and Lowest Penetration Rates by Disability Category- 2016
Disability
Highest Penetration Rates Lowest Penetration Rates
Cognitive Morgan, Logan, Lawrence, and Allen Morrow, Holmes, Geauga, and
Monroe
Communicative Harrison, Crawford, Union, and Allen There are 22 counties at 0%
Hearing
Jackson, Gallia, Monroe, Noble,
Hocking, and Washington Adams, Defiance, Harrison,
Morrow, and Williams (each at 0%)
Physical Sandusky, Mercer, Lawrence, Jackson,
Allen, and Putnam Clinton, Geauga, Holmes, Monroe,
Delaware, and Lake
Psychosocial Ottawa, Wood, Crawford, Logan,
Huron, and Richland Morgan, Holmes, Preble, Monroe,
and Coshocton
Visual Darke, Allen, Meigs, Auglaize,
Hamilton, and Montgomery Harrison, Delaware, Madison,
Union, Paulding, and Ashland
Findings Related to County by County Analysis. Table 27 on the following page color codes the range and provides the estimated penetration rates by county for each category of disability. This represents the number of individuals who receive services out of the total number who could be served by OOD. It is important to remember that penetration rates are projections for 2016. These data are also represented on the maps presented previously.
Other more specific findings include: 1. Based on the progress made in the past three years through targeted engagements, which
resulted in significant increases in OOD VR services to individuals with psychosocial and cognitive impairments, OOD should evaluate policy initiatives directed to address providing similar focus to the other four disability categories. In particular, OOD should build upon the Workforce Integration Taskforce report that specifically evaluate serving individuals with visual and hearing impairments; to be discussed further in Section VIII of this report.
2. OOD should further examine through interviews with staff, who serve Allen and Auglaize counties, to determine what outreach or partnership strategies they utilize in providing services across all disability categories.

2015 Vocational Rehabilitation Comprehensive Statewide Needs Assessment
58
Table 27 - County Service Penetration Rates by Disability - 2016
County Cognitive Commun-
icative Hearing Physical Psycho-social Visual County Cognitive
Commun-icative Hearing Physical
Psycho-social Visual
Adams 20.2% 7.0% 0.0% 12.1% 31.2% 8.0% Logan 72.6% 0.0% 15.0% 46.2% 86.5% 9.9%
Allen 64.3% 20.7% 11.1% 49.5% 52.9% 39.5% Lorain 13.9% 2.5% 7.4% 12.3% 24.8% 7.8%
Ashland 14.6% 3.6% 14.3% 20.6% 25.6% 6.2% Lucas 21.5% 4.9% 10.3% 21.4% 49.9% 17.4%
Ashtabula 16.9% 2.0% 7.7% 22.2% 52.2% 14.5% Madison 27.6% 0.0% 4.1% 11.2% 25.8% 4.7%
Athens 40.1% 10.4% 10.2% 32.5% 59.5% 28.0% Mahoning 21.7% 0.0% 11.9% 30.5% 72.2% 21.7%
Auglaize 50.6% 17.6% 13.0% 43.4% 79.4% 32.6% Marion 31.8% 5.7% 5.6% 21.2% 68.8% 16.3%
Belmont 19.9% 5.6% 6.9% 15.2% 19.8% 12.8% Medina 26.6% 1.1% 3.7% 11.9% 21.3% 12.8%
Brown 29.8% 17.3% 14.9% 23.4% 31.6% 17.2% Meigs 15.9% 0.0% 12.3% 24.6% 19.6% 33.2%
Butler 21.0% 2.0% 7.6% 10.5% 26.2% 18.5% Mercer 38.0% 14.9% 9.8% 57.5% 35.0% 22.6%
Carroll 31.0% 7.0% 3.5% 26.0% 18.4% 16.0% Miami 38.1% 3.9% 9.5% 21.4% 34.8% 27.5%
Champaign 34.8% 14.7% 7.3% 21.8% 43.6% 14.0% Monroe 11.1% 0.0% 28.5% 7.1% 11.3% 16.5%
Clark 33.8% 7.4% 18.3% 18.3% 52.4% 21.1% Montgomery 18.9% 2.3% 12.4% 19.4% 55.4% 32.1%
Clermont 22.2% 9.4% 10.7% 20.5% 47.3% 16.1% Morgan 86.0% 13.6% 6.7% 10.1% 7.1% 7.8%
Clinton 12.3% 0.0% 9.0% 4.5% 15.5% 10.4% Morrow 7.2% 0.0% 0.0% 18.6% 39.5% 21.5%
Columbiana 26.4% 3.7% 5.4% 22.2% 42.3% 14.7% Muskingum 32.4% 6.9% 18.0% 16.9% 32.8% 27.3%
Coshocton 63.9% 16.4% 2.7% 10.8% 14.3% 18.7% Noble 23.6% 12.3% 24.3% 9.1% 16.1% 7.0%
Crawford 61.8% 29.0% 9.5% 45.2% 88.1% 19.2% Ottawa 37.3% 5.0% 9.9% 28.4% 100.6% 17.1%
Cuyahoga 24.1% 3.4% 9.3% 22.5% 51.5% 24.0% Paulding 34.8% 0.0% 5.3% 10.5% 39.1% 6.1%
Darke 49.9% 8.0% 7.9% 28.7% 48.2% 43.4% Perry 37.9% 0.0% 7.7% 11.6% 25.9% 11.9%
Defiance 24.2% 10.5% 0.0% 28.6% 49.5% 15.0% Pickaway 40.0% 3.3% 1.6% 22.9% 20.0% 11.3%
Delaware 21.1% 4.8% 4.3% 8.1% 41.9% 3.3% Pike 55.2% 0.0% 6.8% 23.7% 16.1% 23.5%
Erie 30.8% 5.4% 6.6% 25.8% 70.8% 12.2% Portage 16.7% 11.2% 7.7% 16.0% 49.5% 19.8%
Fairfield 26.1% 3.7% 4.2% 16.2% 32.1% 20.1% Preble 29.8% 4.7% 2.3% 22.1% 11.1% 29.5%
Fayette 37.0% 0.0% 6.8% 15.3% 36.1% 19.7% Putnam 28.1% 17.6% 11.6% 49.1% 39.8% 13.4%
Franklin 23.0% 3.1% 8.0% 17.8% 42.0% 16.9% Richland 49.5% 13.1% 8.9% 27.8% 80.8% 14.9%
Fulton 12.7% 4.8% 9.4% 21.1% 32.2% 10.8% Ross 28.6% 0.0% 12.9% 28.1% 50.8% 28.4%
Gallia 13.7% 6.5% 28.8% 11.2% 42.4% 25.9% Sandusky 59.7% 0.0% 8.3% 57.9% 73.7% 7.6%
Geauga 9.6% 4.2% 3.1% 5.7% 33.3% 11.9% Scioto 35.2% 9.9% 9.8% 29.4% 49.3% 19.8%
Greene 19.7% 2.3% 6.2% 16.6% 43.0% 9.1% Seneca 41.5% 7.0% 12.1% 25.9% 78.5% 15.9%
Guernsey 18.5% 0.0% 5.0% 13.8% 31.8% 14.5% Shelby 32.3% 12.1% 13.9% 31.7% 39.9% 25.2%
Hamilton 28.0% 5.3% 9.3% 15.1% 37.8% 32.2% Stark 48.3% 9.1% 13.1% 28.9% 67.8% 26.7%
Hancock 20.0% 0.0% 6.3% 20.1% 33.9% 17.4% Summit 21.7% 2.9% 11.6% 21.4% 57.0% 17.7%
Hardin 19.4% 6.0% 8.8% 19.1% 15.6% 10.2% Trumbull 16.3% 2.0% 9.2% 16.4% 46.1% 12.8%
Harrison 37.2% 39.0% 0.0% 16.0% 20.3% 0.0% Tuscarawas 20.1% 2.2% 7.5% 31.8% 47.4% 15.0%
Henry 12.5% 0.0% 3.6% 16.1% 26.6% 8.3% Union 24.4% 28.7% 7.9% 20.4% 65.8% 5.4%
Highland 26.0% 0.0% 4.5% 13.4% 19.0% 20.7% Van Wert 47.7% 0.0% 7.2% 41.5% 38.3% 16.7%
Hocking 34.5% 0.0% 23.0% 47.8% 55.8% 15.2% Vinton 19.2% 0.0% 14.2% 14.2% 41.3% 16.4%
Holmes 9.2% 4.8% 7.1% 7.1% 10.0% 13.7% Warren 27.6% 14.4% 2.1% 9.8% 15.5% 10.1%
Huron 43.4% 13.4% 8.2% 46.0% 83.6% 17.1% Washington 48.2% 6.5% 19.3% 39.5% 41.0% 24.2%
Jackson 22.4% 0.0% 40.4% 51.9% 73.4% 23.3% Wayne 12.4% 1.8% 11.2% 25.5% 32.5% 21.0%
Jefferson 33.5% 5.9% 8.8% 19.0% 34.1% 13.5% Williams 19.9% 0.0% 0.0% 24.3% 40.1% 15.6%
Knox 15.3% 12.3% 6.0% 19.7% 78.5% 7.0% Wood 19.6% 2.9% 5.0% 17.3% 94.6% 8.3%
Lake 12.9% 0.8% 5.8% 8.3% 20.2% 7.2% Wyandot 46.7% 9.1% 4.5% 26.8% 33.1% 10.3%
Lawrence 67.2% 9.5% 4.7% 53.8% 70.3% 10.8% Ohio 26.2% 4.9% 8.9% 20.4% 45.3% 19.0%
Licking 25.0% 2.2% 5.4% 11.6% 36.4% 13.1%
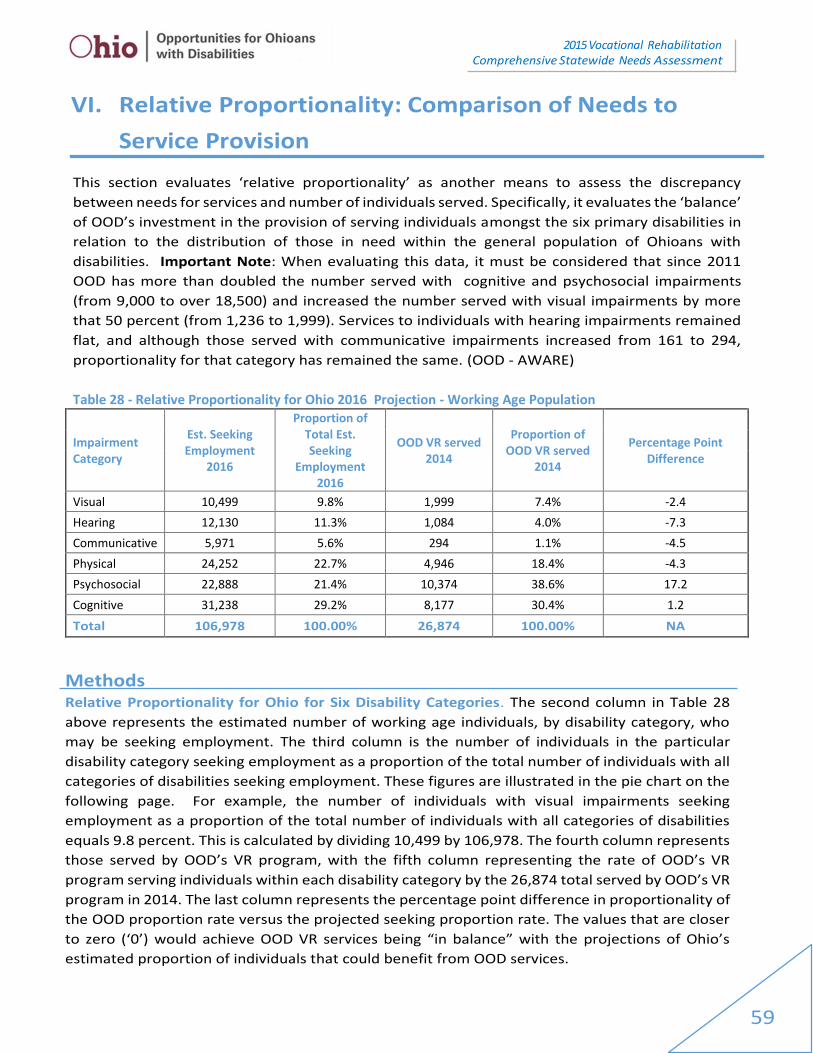
2015 Vocational Rehabilitation Comprehensive Statewide Needs Assessment
59
Methods
Relative Proportionality for Ohio for Six Disability Categories. The second column in Table 28
above represents the estimated number of working age individuals, by disability category, who
may be seeking employment. The third column is the number of individuals in the particular
disability category seeking employment as a proportion of the total number of individuals with all
categories of disabilities seeking employment. These figures are illustrated in the pie chart on the
following page. For example, the number of individuals with visual impairments seeking
employment as a proportion of the total number of individuals with all categories of disabilities
equals 9.8 percent. This is calculated by dividing 10,499 by 106,978. The fourth column represents
those served by OOD’s VR program, with the fifth column representing the rate of OOD’s VR
program serving individuals within each disability category by the 26,874 total served by OOD’s VR
program in 2014. The last column represents the percentage point difference in proportionality of
the OOD proportion rate versus the projected seeking proportion rate. The values that are closer
to zero (‘0’) would achieve OOD VR services being “in balance” with the projections of Ohio’s
estimated proportion of individuals that could benefit from OOD services.
VI. Relative Proportionality: Comparison of Needs to
Service Provision This section evaluates ‘relative proportionality’ as another means to assess the discrepancy
between needs for services and number of individuals served. Specifically, it evaluates the ‘balance’
of OOD’s investment in the provision of serving individuals amongst the six primary disabilities in
relation to the distribution of those in need within the general population of Ohioans with
disabilities. Important Note: When evaluating this data, it must be considered that since 2011
OOD has more than doubled the number served with cognitive and psychosocial impairments
(from 9,000 to over 18,500) and increased the number served with visual impairments by more
that 50 percent (from 1,236 to 1,999). Services to individuals with hearing impairments remained
flat, and although those served with communicative impairments increased from 161 to 294,
proportionality for that category has remained the same. (OOD - AWARE)
Table 28 - Relative Proportionality for Ohio 2016 Projection - Working Age Population
Impairment Category
Est. Seeking Employment
2016
Proportion of Total Est. Seeking
Employment 2016
OOD VR served 2014
Proportion of OOD VR served
2014
Percentage Point Difference
Visual 10,499 9.8% 1,999 7.4% -2.4
Hearing 12,130 11.3% 1,084 4.0% -7.3
Communicative 5,971 5.6% 294 1.1% -4.5
Physical 24,252 22.7% 4,946 18.4% -4.3
Psychosocial 22,888 21.4% 10,374 38.6% 17.2
Cognitive 31,238 29.2% 8,177 30.4% 1.2
Total 106,978 100.00% 26,874 100.00% NA

2015 Vocational Rehabilitation Comprehensive Statewide Needs Assessment
60
Chart 13 –
Proportion of Ohioans with Disabilities Seeking Employment - 2016 Estimate (N = 106,978)
Chart 14 –
Proportion served by Opportunities for Ohioans with Disabilities (OOD) FFY 2014 (N = 26,874)
Visual 9.8%
Hearing , 11.3%
Communicative5.6%
Physical, 22.7%
Psychosocial21.4%
Cognitive, 29.2%
Proportion of Total Est. Seeking Employment 2016
Visual Hearing Communicative Physical Psychosocial Cognitive
Visual , 7.4% Hearing ,
4.0%
Communicative, 1.1%
Physical, 18.4%
Psychosocial, 38.6%
Cognitive, 30.4%
Proportion of OOD Served - 2014
Visual Hearing Communicative Physical Psychosocial Cognitive

2015 Vocational Rehabilitation Comprehensive Statewide Needs Assessment
61
Relative Proportionality for Ohio’s Counties of the Six Disability Categories. The calculations summarized in Chart 13 and 14, on the previous page, were performed for each of Ohio’s 88 counties, yielding relative proportionality data for each category of disability at the county level. These procedures enabled categorization of service delivery for each category of disability in a particular county into one of four groupings. Maps 7 through 12, and supporting data in Table 31, illustrate county classification groupings for each of the six disability categories. The two middle groupings, orange and green, that range from -5 to +5 percent difference on the maps can be collapsed to form one grouping. If the difference in proportion seeking employment to proportion served at the county level was between -5 and +5 (orange and green), service delivery in that county was considered to be “in balance.” If this difference was less than -5 (red), the volume of services delivered was considered to be out of balance in a negative direction. If this difference was more than +5 (blue), the volume of services delivered at the county level was considered to be out of balance in a positive direction. There are two primary implications of relative proportionality data. OOD might choose to enhance resources available to counties where differences in the proportion served to the proportion seeking employment in the county is negative. OOD could also choose to maintain resources available to counties where differences in the proportion seeking employment to the proportion served at the county is between -5 and +5 and in situations where relative proportionality exceeds +5. There are a variety of scenarios that might result in more balance in the system. (OOD - AWARE) (Institute on Disability)
Difference in proportionality, especially for counties with extreme rates and in outliers, should prompt additional evaluation, including but not limited to looking at the penetration rates or whether outreach activities or local partnerships (or lack thereof) are influencing those differences.

2015 Vocational Rehabilitation Comprehensive Statewide Needs Assessment
62
Map 7
Cognitive Impairments - OOD Proportionality - 2016 Projection

2015 Vocational Rehabilitation Comprehensive Statewide Needs Assessment
63
Map 8
Communicative Impairments - OOD Proportionality - 2016 Projection

2015 Vocational Rehabilitation Comprehensive Statewide Needs Assessment
64
Map 9
Hearing Impairments - OOD Proportionality - 2016 Projection

2015 Vocational Rehabilitation Comprehensive Statewide Needs Assessment
65
Map 10
Physical Impairments - OOD Proportionality - 2016 Projection

2015 Vocational Rehabilitation Comprehensive Statewide Needs Assessment
66
Map 11
Psychosocial Impairments - OOD Proportionality - 2016 Projection

2015 Vocational Rehabilitation Comprehensive Statewide Needs Assessment
67
Map 12
Visual Impairments - OOD Proportionality - 2016 Projection

2015 Vocational Rehabilitation Comprehensive Statewide Needs Assessment
68
Findings
1. Counties with the largest negative and positive differences, as indicated by proportionality
rates, are summarized in Table 29 below.
Table 29 - Counties with the Largest Negative and Positive Differences
Disability
Counties with the Largest
Negative Difference
Counties with the Largest
Positive Difference Cognitive
Morrow, Jackson, Knox, Wood, Gallia,
Wayne, and Mahoning
Morgan, Coshocton, Pike, Perry,
Harrison, Pickaway, and Warren
Communicative 22 counties at negative 5.6% Harrison Hearing
Adams, Defiance, Harrison, Morrow,
and Williams
Monroe, Noble, and Gallia
Physical
Morgan, Coshocton, Geauga,
Delaware, and Clinton
Mercer, Putnam, Meigs, Hocking,
and Wayne Psychosocial
Morgan, Coshocton, Preble, and Pike Wood, Knox, Geauga, Ottawa,
Morrow, and Delaware Visual
Harrison, Sandusky, Delaware,
Logan, and Union
Meigs, Holmes, Preble, Monroe,
and Hamilton
Table 30 - Number of Counties by Disability Category and OOD Proportionality Difference Range - 2016
Range Cognitive Communicative Hearing Physical Psychosocial Visual
Less than -5% 15 30 73 34 4 24
-5% to -0.1% 20 56 12 29 8 49
0% to 5% 15 2 1 17 8 12
Greater than 5% 38 0 2 8 68 3
2. The distribution and proportionality differences suggests that OOD has been able to make
significant progress in identifying and serving individuals with psychosocial and cognitive impairments, which has created a greater gap for the other four disability categories, in particular those with hearing impairments. This can be explained by the fact that OOD has engaged in direct working relationships with local Alcohol and Drug Addiction Mental Health Boards and the state and local Developmental Disabilities agencies, which have representation in every county.
3. While maintaining the momentum in serving those with cognitive and psychosocial
impairments, it is recommended that OOD focus on overall agency strategies, building on recommendations from the Workforce Integration Task Force, to address services to individuals with hearing and visual impairments.
4. The data suggests that OOD should also consider how it can better address outreach to increase
services to individuals with physical impairments. Also, considering that approximately 60 percent of OOD VR served individuals with communicative impairments in 2014 were ages 14 to 25, working with youth could present opportunities to serve more individuals with this disability.

2015 Vocational Rehabilitation Comprehensive Statewide Needs Assessment
69
Table 31 - County Proportionality Rates by Disability - 2016
County Cognitive Commun-
icative Hearing Physical Psycho-social Visual County Cognitive
Commun-icative Hearing Physical
Psycho-social Visual
Adams 6.50% -3.20% -11.30% -6.00% 19.10% -5.10% Logan 10.90% -5.60% -8.10% -2.90% 13.60% -8.00%
Allen 10.20% -3.20% -8.70% 0.90% 2.40% -1.70% Lorain -0.10% -4.60% -5.30% -2.60% 16.80% -4.30%
Ashland -3.90% -4.40% -1.70% 5.00% 11.10% -6.20% Lucas -4.10% -4.50% -6.70% -3.20% 21.40% -3.00%
Ashtabula -8.30% -5.10% -7.60% -1.30% 26.00% -3.80% Madison 18.10% -5.60% -8.60% -7.80% 11.00% -7.10%
Athens 3.10% -4.00% -8.20% -2.40% 13.70% -2.20% Mahoning -9.50% -5.60% -7.10% -1.20% 26.70% -3.20%
Auglaize 2.00% -3.50% -8.20% -1.80% 14.50% -3.00% Marion 0.40% -4.60% -9.30% -7.40% 25.50% -4.70%
Belmont 7.40% -3.60% -6.40% -0.90% 5.30% -1.90% Medina 17.20% -5.20% -8.80% -6.60% 5.70% -2.30%
Brown 5.40% -1.70% -4.60% -1.50% 5.50% -3.10% Meigs -4.80% -5.60% -4.00% 6.60% 0.60% 7.30%
Butler 7.10% -4.90% -6.20% -8.60% 11.80% 0.90% Mercer 1.80% -3.30% -8.20% 13.80% -0.50% -3.60%
Carroll 13.40% -3.70% -9.50% 5.10% -2.90% -2.40% Miami 11.40% -4.80% -7.40% -5.00% 5.80% 0.00%
Champaign 7.80% -2.60% -8.30% -4.70% 12.60% -4.80% Monroe -2.50% -5.60% 15.30% -9.30% -1.40% 3.50%
Clark 3.90% -4.20% -4.40% -8.70% 16.20% -2.90% Montgomery -8.30% -5.10% -6.00% -6.10% 23.40% 2.10%
Clermont -2.80% -3.40% -6.40% -3.80% 19.80% -3.40% Morgan 51.30% -3.10% -8.90% -15.40% -16.50% -7.40%
Clinton 6.70% -5.60% -1.10% -12.40% 11.90% 0.40% Morrow -16.70% -5.60% -11.30% 2.30% 28.60% 2.70%
Columbiana 2.90% -4.70% -8.80% -1.70% 16.20% -3.80% Muskingum 8.00% -4.10% -3.30% -7.60% 6.20% 0.70%
Coshocton 39.30% -2.20% -10.20% -13.70% -10.20% -3.10% Noble 12.50% -1.40% 5.30% -10.20% -0.60% -5.60%
Crawford 5.70% -2.50% -9.30% -2.90% 15.10% -6.20% Ottawa -3.20% -4.90% -8.70% -7.30% 29.90% -5.80%
Cuyahoga -2.90% -4.90% -7.40% -3.60% 19.80% -1.00% Paulding 16.70% -5.60% -8.60% -11.90% 16.40% -7.10%
Darke 10.20% -4.40% -8.90% -5.10% 6.50% 1.70% Perry 22.90% -5.60% -7.20% -10.30% 4.60% -4.30%
Defiance -2.20% -3.30% -11.30% 2.00% 19.10% -4.20% Pickaway 22.40% -4.80% -10.50% 0.30% -2.50% -4.90%
Delaware 4.90% -4.10% -8.60% -12.50% 28.30% -8.00% Pike 28.30% -5.60% -8.60% -3.50% -9.10% -1.60%
Erie -1.30% -4.70% -9.00% -4.50% 25.60% -6.10% Portage -7.50% -2.80% -7.40% -6.60% 25.50% -1.20%
Fairfield 7.40% -4.60% -9.10% -5.00% 11.60% -0.30% Preble 15.40% -4.20% -10.00% 3.00% -9.20% 5.10%
Fayette 14.50% -5.60% -8.20% -8.60% 9.90% -2.00% Putnam -3.20% -2.50% -7.20% 12.70% 5.70% -5.60%
Franklin 0.70% -4.80% -7.30% -4.70% 18.60% -2.50% Richland 5.80% -3.80% -8.90% -7.40% 20.50% -6.30%
Fulton -8.30% -4.10% -5.40% 4.20% 17.40% -3.80% Ross -1.20% -5.60% -6.40% -1.30% 15.00% -0.50%
Gallia -10.90% -3.90% 3.70% -11.00% 20.30% 1.90% Sandusky 7.10% -5.60% -9.40% 4.70% 11.40% -8.30%
Geauga -7.60% -3.80% -8.60% -12.80% 33.60% -0.80% Scioto 3.80% -3.80% -7.80% -1.20% 12.50% -3.60%
Greene -1.10% -5.00% -7.90% -4.20% 23.60% -5.40% Seneca 2.60% -4.60% -7.70% -7.30% 22.70% -5.70%
Guernsey 1.90% -5.60% -8.10% -4.60% 17.90% -1.60% Shelby 2.40% -3.30% -6.10% 1.40% 7.20% -1.50%
Hamilton 4.60% -4.30% -7.00% -8.50% 12.00% 3.20% Stark 6.20% -4.30% -7.60% -6.20% 15.10% -3.20%
Hancock -0.10% -5.60% -7.80% 0.00% 14.80% -1.30% Summit -5.40% -5.00% -6.40% -4.40% 24.40% -3.30%
Hardin 7.00% -3.50% -5.00% 5.00% -0.10% -3.40% Trumbull -6.20% -5.10% -6.30% -4.70% 26.10% -3.70%
Harrison 22.50% 4.80% -11.30% -5.40% -0.70% -9.80% Tuscarawas -6.30% -5.10% -8.00% 5.40% 18.10% -4.10%
Henry -3.50% -5.60% -8.50% 3.00% 18.60% -4.10% Union -4.50% 0.00% -8.30% -6.60% 27.40% -8.00%
Highland 14.90% -5.60% -8.40% -5.00% 2.10% 2.00% Van Wert 11.80% -5.60% -8.90% 5.00% 2.70% -5.00%
Hocking -1.90% -5.60% -4.30% 6.60% 10.90% -5.80% Vinton -2.30% -5.60% -3.60% -7.30% 20.90% -2.10%
Holmes 1.10% -2.60% -2.20% -4.50% 2.80% 5.30% Warren 22.30% -0.40% -9.80% -8.40% -0.20% -3.50%
Huron -0.60% -3.90% -9.20% 0.90% 18.90% -6.00% Washington 9.10% -4.60% -5.40% 1.70% 2.50% -3.30%
Jackson -13.20% -5.60% -0.10% 6.10% 17.00% -4.20% Wayne -10.90% -5.10% -4.90% 6.50% 13.80% 0.60%
Jefferson 11.50% -4.20% -7.20% -4.70% 8.90% -4.30% Williams -2.10% -5.60% -11.30% 3.00% 18.60% -2.70%
Knox -13.20% -3.10% -8.90% -6.60% 39.10% -7.30% Wood -11.00% -5.10% -9.50% -10.20% 43.00% -7.20%
Lake 3.90% -5.20% -5.60% -6.10% 16.60% -3.60% Wyandot 18.20% -3.80% -9.60% -1.60% 3.20% -6.30%
Lawrence 10.90% -4.50% -10.30% 2.20% 9.30% -7.60% Ohio 1.20% -4.50% -7.30% -4.30% 17.20% -2.30%
Licking 7.80% -5.00% -8.20% -9.30% 18.00% -3.30%

2015 Vocational Rehabilitation Comprehensive Statewide Needs Assessment
70
VII. Youth and Students with Disabilities With a focus on youth and students with disabilities as required by the 2014 Workforce Innovation and Opportunity Act (WIOA), OOD contracted with Kent State University, as a compliment to the Ohio Longitudinal Transition Study (OLTS), to specifically address the following six questions regarding youth and students with disabilities (R. Baer, 2015):
1. What were the characteristics of youth with disabilities receiving various types of rehabilitation services?
2. What were the characteristics of youth with disabilities experiencing employment outcomes?
3. What were the characteristics of youth experiencing postsecondary education outcomes?
4. What services predicted employment outcomes after controlling for other factors? 5. What services predicted postsecondary education after controlling for other factors? 6. What services predicted supported employment outcomes after controlling for other
factors? The “Comprehensive Statewide Needs Assessment (CSNA) For Transition-age Youth and Young Adults” full report produced by Kent State University is attached as Appendix A. A summary, including findings and answers to the questions cited from the report, are summarized as follows: Data Sources. This research was conducted through a secondary analysis of two databases: (a) OOD VR case closures (N = 10,316) and (b) OLTS youth reporting receiving VR services in the year following high school exit (N = 642). This first source of data for this evaluation was OOD case records for transition age youth with disabilities who applied at ages 14-24, received a purchased service, and whose cases were closed during federal fiscal years 2012 and 2013. The second source of data was OLTS surveys of services of high school special education students at graduation and then again one year after exiting high school in the years 2006-2013.
Method A sample was drawn from each of two secondary databases: (a) OLTS exit and follow-up interviews and (b) OOD VR case closure records. The OLTS data was drawn each year from one-fifth of the schools in Ohio for the period of 2006-2013. The OOD VR data included cases that were opened when students were transition age (14-24 inclusive) and exited (closed) during federal fiscal years 2012 and 2013. The researchers conducted three types of analyses: (a) descriptive statistics of the samples, (b) cross-tabulations to disaggregate descriptive statistics, and (c) logistic regression (or Chi-Square analysis, where appropriate). The researchers used descriptive statistics and cross-tabulations to provide a detailed description of the study samples in terms of their disability category, services received, and outcome variables. Bivariate correlations were used on the OLTS data to identify potentially confounding independent variables and to determine the relationships among variables used in later analyses.

2015 Vocational Rehabilitation Comprehensive Statewide Needs Assessment
71
Findings and Recommendations
1. What were the characteristics of youth with disabilities receiving various types of rehabilitation services?
While the OLTS-VR and OOD VR databases showed no significant differences in gender or ethnicity, marked differences were observed in the number of OLTS-VR recipients who were categorized as having emotional disabilities and receiving an Individualized Education Program (IEP) in high school compared with the higher number of OOD youth with disabilities who fell in the similar category of psychosocial/emotional disabilities in the OOD database, but were not recipients of an IEP in high school. The primary purchased services for OOD youth with disabilities were Assessment and Training. However, national research on evidence-based practices suggests that the more significant disabilities of OOD youth may call for more emphasis on job development and on-site training. Research indicates individuals with these kinds of disabilities have trouble generalizing from training programs to performance in the actual settings. One identified issue is a greater overlap between high school and post-school transition services for individuals with psychosocial disabilities (OOD) and emotional disabilities (OLTS). Psychosocial needs appear to be arising following the transition from high school to adulthood, possibly due to the fact that many mental illnesses are manifested after age 18. Recommendation: High school transition coordinators and VR counselors need to work together to identify psychosocial needs earlier to ensure seamless transition between child and adult mental health services. A second issue that arose from an examination of the characteristics of VR youth with disabilities was the limited access African American youth have to mainstream programs, such as career-technical and general education that prepare them for careers and postsecondary education. This implies the need for additional VR services targeted to urban areas where high school services and employment opportunities are limited. Additionally, African American transition-age youth may have difficulty finding employment opportunities in their community and may need involvement in WIA and summer programs to make up for these disadvantages. Recommendation: To address this barrier to employment, VR counselors need to work with high school transition coordinators to ensure that early IEP transition planning (age 14) includes strategies for obtaining career-technical education for African American students who plan to enter employment or a two-year college program after graduation and general education participation for those entering postsecondary education.

2015 Vocational Rehabilitation Comprehensive Statewide Needs Assessment
72
1. What were the characteristics of youth with disabilities who achieved employment
outcomes?
Characteristics of OOD youth with disabilities who entered full-time employment tended to be disproportionately (a) male, (b) categorized as having a cognitive disability, and (c) White. The characteristics of OOD youth with disabilities who entered part-time or any work engagement tended to be disproportionately individuals with cognitive disabilities. One possible area of intervention is for VR counselors to help females deal with gender-specific issues (such as child care) that stand in the way of employment. African American youth with disabilities will need additional supports to find jobs in urban areas where unemployment is high, possibly through collaboration between OOD and Workforce Investment Act programs. Recommendation: To deal with the disparity of employment outcomes for individuals with the most significant disabilities, African Americans, and females, VR counselors need to be involved in the early stages of IEP transition planning to ensure that students desiring employment after high school are engaged in general or career-technical education classes. 2. What are the characteristics of youth with disabilities who achieved postsecondary education
outcomes? According to OOD records, individuals receiving any of the purchased services of Assessment, Training, Job Development, and Personal Services were significantly less likely to pursue postsecondary education. The OOD data indicated that college and university training was only about five percent of the services received by OOD youth with disabilities and that these services were disproportionately focused on individuals with physical and sensory disabilities, and to a lesser degree on students with cognitive disabilities. Individuals with psychosocial disabilities were much less likely to receive college or university training. The OLTS-VR recipient data and the OOD data both showed that males and African American youth with disabilities lagged in this area as well. Recommendation: VR counselors and high school transition coordinators should work together on these issues during IEP transition planning when the student’s post-school goals and course of study are determined. 3. What services predicted employment outcomes after controlling for other factors? The OLTS data showed that career-technical education, general education, and work study programs were strong predictors of post-school full-time employment outcomes for OLTS-VR recipients. For OOD youth with disabilities, Vocational Rehabilitation Counseling and Guidance, Assessment, Training, and Job Development were all significant predictors of at least part-time work. Recommendation: VR counselors and high school transition coordinators need to ensure the availability of career-technical education and work study programs for students who plan to work following high school. For individuals with the most significant disabilities (i.e., multiple disabilities), school supervised community work programs need to be developed so that these individuals develop soft work skills (e.g., attendance, promptness, social skills) and occupational specific skills in the actual environments in which they will be expected to perform. After high school exit, VR counselors need to focus OOD services on the areas of counseling, training, and job development for youth with disabilities seeking employment outcomes.

2015 Vocational Rehabilitation Comprehensive Statewide Needs Assessment
73
4. What services predicted postsecondary education outcomes after controlling for other factors?
The OLTS-VR recipient data indicated that four-year college outcomes were highly unlikely for youth with disabilities who did not participate in general education classes more than 80% of the day. Two-year college outcomes were more broadly predicted by both career-technical education and general education participation. This placed African American youth with disabilities at a particular disadvantage due to their lower rates of participation in both of these high school courses of study. Recommendation: VR counselors and high school transition coordinators can more positively improve outcomes by distinguishing between youth with disabilities planning to enter four- and two-year college programs. It is critical that VR counselors and high school transition coordinators ensure an alignment in the IEP transition plan between courses of study and postsecondary education goals to help improve outcomes. IEP transition goals need to be specific as to what type of postsecondary education (two vs. four-year) is desired by the student. 6. What services predicted supported employment or any post-school engagement after
controlling for other factors? Initially, this question focused on supported employment outcomes, but the two databases did not include enough participants to analyze these outcomes statistically. The researchers decided to expand this outcome to include any work under 20 hours per week and/or any enrollment in any postsecondary education. For OLTS-VR recipients, participation in general education classes was the only predictor of employment or post-school engagement. For OOD youth with disabilities, career counseling, training, and job development were predictors. Personal Services was the only service category that did not enhance the likelihood of obtaining the desirable outcomes under investigation in any instance. Overall engagement was more likely to be achieved when individuals were provided Vocational Rehabilitation Counseling and Guidance, Training, and Job Development. Individuals receiving Personal Services and status as an African American were significantly less likely to be engaged, with the exception of African Americans who had received Training services. African Americans were found to benefit the most from purchased training services. Recommendation: VR Counselors need to ensure that youth with disabilities remain linked and engaged. This implies the need for VR counselors to establish linkages with youth with disabilities who lack personal or family supports before they exit school. The VR counselor needs to develop a relationship with students before they graduate to improve follow-through with OOD referrals.

2015 Vocational Rehabilitation Comprehensive Statewide Needs Assessment
74
Conclusion The results suggest purchased services offer some predictive utility when examining the outcome variables.
Receiving Vocational Rehabilitation Counseling and Guidance was strongly predictive of any level of employment at closing.
Assessment was predictive of work as well, as long as employment included less than full-time.
Training and Job Development services were also predictive of a favorable employment outcome of work engagement or at least part-time employment.
Individuals who identified as African Americans were significantly less likely to achieve the employment outcomes unless they were provided Training services, which enhanced their outcomes substantially.
Individuals receiving any purchased services were much less likely to participate in postsecondary education, as were African Americans and males.
Overall, the results provide a useful picture in determining which services and characteristics are associated with each of the outcomes.
There is a need to develop comprehensive and seamless career paths that are aligned with students’ postsecondary goals.
In the early stages of IEP transition planning, the VR counselor should ensure that students’ courses of study align with their post-school goals and that students with more significant disabilities are included in general education and career-technical education to the greatest extent possible.
The students’ post-school goals should drive the transition planning to allow them access to higher education or employment to the greatest extent possible with the help of the VR counselor and high school transition coordinator.
Prior to students exiting high school, the VR counselor should ensure that students with employment goals after high school have explored, experienced, and received training in real environments that are related to their career goals.
Additionally, VR counselors need to work with high school transition coordinators in ensuring that disability benefits counseling and support in utilizing work incentives are provided to students who are SSI eligible and that financial aid counseling and supports are provided to students with postsecondary education goals.
Ultimately, the VR counselor and high school transition coordinator should work together to help the student set post-school goals and to develop a comprehensive plan to achieve those goals, whether they are employment or post-secondary education.
OOD Future Planning and Engagement with the Ohio Department of Education. Map 13 on the following page represents youth (age 14-24) served as a percentage of more than 50,000 youth statewide with an individualized education program (IEP) who also have identified disabilities that could meet OOD eligibility criteria for VR services. Fifteen counties, 12 of which are located in the North Central and North West, have service rates higher than 40 percent. Three counties (Holmes, Monroe, and Clinton) have services rates below 10 percent. The remaining 70 counties have service rates between 10 and 40 percent. As OOD partners with the Ohio Department of Education and local education agencies, this information can be used to prioritize outreach efforts based on geographic areas. (OOD - AWARE) (ODE - EMIS, 2012-2013)
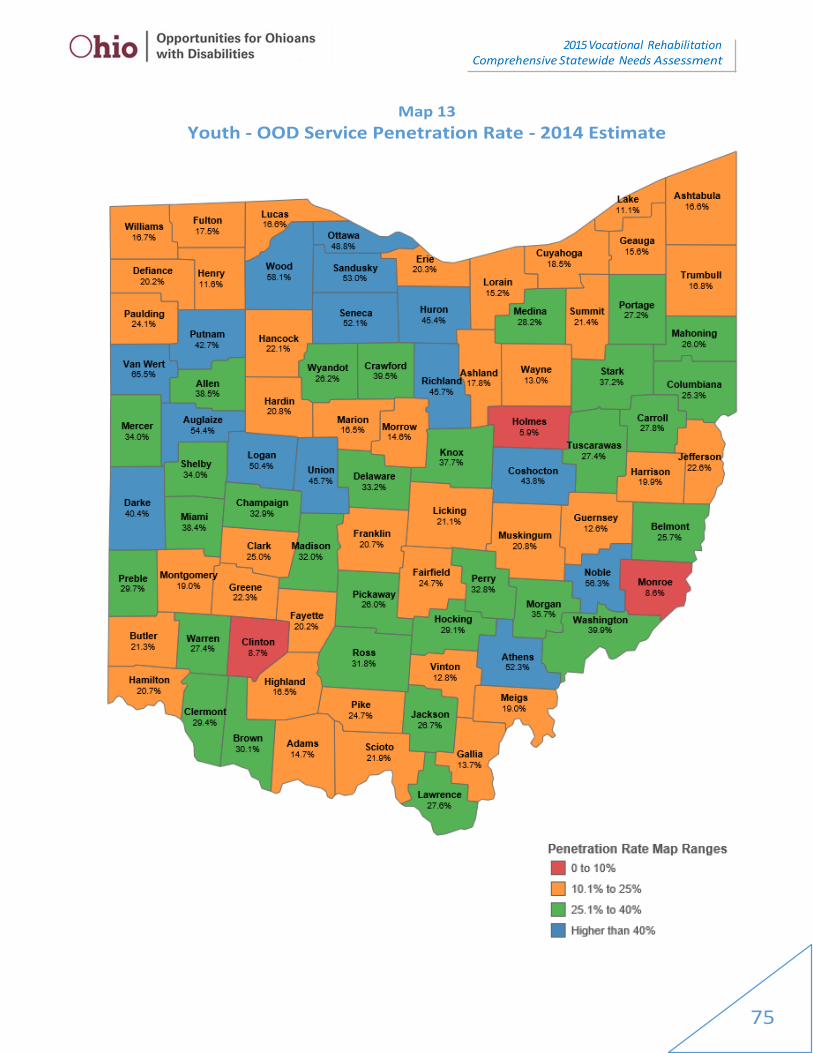
2015 Vocational Rehabilitation Comprehensive Statewide Needs Assessment
75
Map 13
Youth - OOD Service Penetration Rate - 2014 Estimate

2015 Vocational Rehabilitation Comprehensive Statewide Needs Assessment
76
VIII. Workforce Integration and OhioMeansJobs.com
Workforce Integration Task Force: Focus on Individuals with Hearing and Visual Impairments
Background In September 2014, Governor John R. Kasich charged the Workforce Integration Task Force (WIT) with gathering data and in making recommendations regarding the employment challenges for individuals who are deaf, blind, or deaf/blind. A cross-section of individuals with disabilities, advocates, and employer representatives, and state policy makers comprised this workgroup. This workgroup’s charge feeds directly into the prior findings of this needs assessment specific to meeting the needs of individuals with hearing and visual impairments. (Workforce Integration Task Force (WIT), 2014)
Methodology
In preparation for the work of the task force, staff at OOD and the Ohio Department of Job and Family Services (ODJFS) collected relevant data and information, as outlined in the enabling legislation, through a review of available literature, the development and deployment of a set of questionnaires/surveys, and by conducting focus groups throughout the state.
Surveys such as the Current Population Survey and the American Community Survey, conducted by the U.S. Census Bureau, provided high-quality relevant data. Agency staff also developed informal surveys targeted for three groups: members of the blind and deaf communities; employers; service providers, advocates and parents. Staff conducted 17 focus groups, in six different regions of the state, with Ohioans who are blind, deaf, or deaf/blind and working (or seeking work) to talk about barriers to employment and recommendations. (Further details available in Section IX and Appendix B). Task force members used this data, along with their own knowledge and experience, to identify the major barriers to employment and income parity for people who are deaf, blind, or deaf/blind.
Findings
1. WIT determined that the barriers to employment and income parity among blind, deaf, and deaf/blind Ohioans are symptoms of a larger issue: a fundamental lack of awareness and knowledge about individuals with disabilities, their culture, their strengths and weaknesses, the challenges they face, and the opportunities they can provide. This in turn fuels a lack of knowledge about the benefits of integrating these individuals into the workforce. Additionally, many blind, deaf, and deaf-blind Ohioans lack the necessary skills for developing a successful career path in today’s economy and access to the training opportunities needed to acquire them.
2. WIT identified a clear need for increased education and training targeted towards employers on the benefits, available incentives, services, and successful practices involved in recruiting, hiring and retaining Ohioans who are blind, deaf, or deaf/blind. Currently, too many employers lack even basic knowledge about how to recruit, hire and promote people with disabilities.

2015 Vocational Rehabilitation Comprehensive Statewide Needs Assessment
77
3. Data from Opportunities for Ohioans with Disabilities shows that among those using OOD’s services, average hourly wages upon employment averaged $13.62 for those with a vision impairment and $13.57 for those with a hearing impairment, both significantly below the average hourly wage of $20.76 for all occupations in Ohio.1
4. According to the 2012 Cornell Report (ACS), income disparity for Ohio’s full-time workers with a visual disability is more significant than for Ohioans with a hearing disability.
o Median earnings for Ohioans with visual impairments are almost 25 percent lower than for individuals without a disability.
o Median earnings for individuals with a hearing disability are almost equivalent to those without a disability. [Note: most people categorized as having a hearing disability developed hearing loss later in life, after already establishing careers prior to the onset of their disability.]
5. Not only do employers have much to learn about workers with disabilities and how to effectively integrate them into Ohio’s workforce, but Ohio’s deaf and blind communities need greater access to career training and development. Perhaps the most encouraging finding, however, was that although barriers to employment exist, many of them can be reduced through increased awareness and engagement on the part of employers. This means we are in a position to make a significant difference in the lives of Ohioans who are blind, deaf, or deaf/blind.
Recommendations
1. OOD and ODJFS should work collaboratively to create, collect and communicate clear, uniform and comprehensive information to employers about integrating blind, deaf, and deaf/blind Ohioans into the workforce.
2. OOD and ODJFS should develop strategies to more effectively engage business leadership organizations and networks to facilitate business-to-business and peer-to-peer conversations on how best to address and reduce barriers to employment and income parity for blind, deaf, and deaf/blind Ohioans.
3. The state of Ohio should seek out ways to more effectively build a culture of inclusion and accessibility by including disability awareness in any required diversity and inclusion training programs; and through the development of mentoring and relationship-building opportunities.
4. Ohio should encourage and facilitate opportunities to connect blind, deaf, and deaf/blind Ohioans with employers and to connect employers interested in integrating individuals with disabilities into their workforce with those who have successfully implemented such integration.
5. All Ohio employers should commit themselves to developing standards and benchmarks for effectively serving individuals with disabilities in key areas including: communication and education; access and accommodation; and hiring and employment.
6. OOD should work with the Governor’s Office of Workforce Transformation (OWT) to coordinate a working group of related agencies and programs to develop a unified plan to more effectively
1 OOD wage data on successful job outcomes from October 2010 to May 2014. Ohio 2013 average hourly wage from the Occupation Employment Statistics program of the U.S. Bureau of Labor Statistics.

2015 Vocational Rehabilitation Comprehensive Statewide Needs Assessment
78
align state of Ohio employment and workforce programs and services for Ohioans with disabilities.
7. State and federal governments should explore ways to remove disincentives to work that result from income and asset limits for blind, deaf, and deaf/blind Ohioans.
8. The state of Ohio should ensure that pre-vocational and vocational training is available and accessible for blind, deaf, and deaf/blind Ohioans throughout the state.
9. Ohio should explore ways to better leverage the facilities, programs, and services available in order to create immersive and hands on training opportunities for blind, deaf and deaf/blind communities across the state.
10. Ohio should continue to pursue a more integrated and wider-ranging system of transportation for individuals with disabilities in both urban and rural areas and to explore options to reduce transportation as a barrier to employment for blind, deaf, and deaf/blind Ohioans.

2015 Vocational Rehabilitation Comprehensive Statewide Needs Assessment
79
OhioMeansJobs.com and In-Demand Occupations: A Focused Outcome Strategy for OOD With a dual customer focus on business engagement and meeting the needs of employers, OOD has successfully been able to increase the annual number of employment outcomes for individuals it served by more than 35%, from 2011 to 2014. Increasing employment outcomes for Ohioans has been a statewide strategy through efforts of the Governor’s Office of Workforce Transformation (OWT). OWT has also been charged to coordinate Ohio’s workforce programs, including vocational rehabilitation, to implement the new Workforce Innovation Opportunity Act (WIOA) requirements, which include the Unified State Workforce Plan and new common performance measures. This past year OOD has been intensely partnering with ODJFS, not only on the Workforce Integration Task Force and WIOA planning, but how OOD can better leverage the OhioMeansJobs.com website as a strategy to promote employment outcomes for individuals with disabilities. OhioMeansJobs.com is Ohio’s online career center for jobseekers and employers. Specifically students, adults, and veterans, including those with disabilities, can use the website to explore careers, take free practice GED and college entrance exams, write a resume and, most importantly, find a job. Employers can post jobs, search resumes and find the talent they need. Additional information about OhioMeansJobs.com can be found here: https://jobseeker.ohiomeansjobs.monster.com/home.aspx Map 14 on the following page shows the number of OOD participants who received services, from October 2013 through April 2015, and were actively registered in OhioMeansJobs.com. Map 15 shows the subset that got a job. (Ohio Department of Job and Family Services (ODJFS), 2014-2015) (OOD - AWARE)
Ohio’s In-Demand Occupations. OOD has emphasized employers as a dual customer and a critical component for the success of individuals with disabilities that are seeking employment. OOD has developed targeted employer relationships, specifically:
Expanding the Ohio Business Leadership Network (OHBLN) from 19 to 70 employers in just two years, and being recognized as the USBLN affiliate of the year in 2014.
Recognized as a national model for a workplace initiative, funded by a foundation grant, which directly sources OOD jobseekers to a participating network of employers.
The Governor’s Office of Workforce Transformation has diligently worked to strategically align Ohio’s workforce programs to focus efforts in meeting employers’ workforce needs. One strategy is through the identification and monthly monitoring of Ohio’s in-demand occupations. As of July 2015, there were 196 in-demand occupations, covering a variety of skills and education levels. This information is updated through the Ohio Department of Job and Family Services Labor Market Information section and can be found at:
http://jfs.ohio.gov/owd/OMJResources/State-AllOpenings.stm
It is recommended that VR counselors, as part of informed choice, review the in-demand occupations, and where appropriate focus job goals and training around those. It is recommended that OOD utilize Wanted Analytics and Ohio Means Jobs.com to facilitate this activity.

2015 Vocational Rehabilitation Comprehensive Statewide Needs Assessment
80
Map 14
OOD Participants* Registered in OhioMeansJobs.com
April 2015
*The number of participants are from OOD service or closed status, who applied for OOD VR services from
October 2012 – April 2015

2015 Vocational Rehabilitation Comprehensive Statewide Needs Assessment
81
Map 15
OOD Participants* Registered in OhioMeansJobs.com Who Got a Job
April 2015
*The number of OOD Participants - Employed or Closed -Rehab Status, who applied for OOD VR services
from October 2012 – April 2015

2015 Vocational Rehabilitation Comprehensive Statewide Needs Assessment
82
Summary
Findings 1. Tier 1 counties, which represents six (6) counties that are estimated to have 25 percent or more
of OOD individuals with disabilities registered in OMJ, have a combined successful employment rate of 56.4 percent. OOD VR served individuals that reside in Lawrence County are not only most frequently (53.7 percent) registered in OMJ, but their rehabilitation rate for the first six months of FFY 2015 was also 58.5 percent, or 15.1 percentage points above the overall OOD rehabilitation rate.
Table 32 - OOD Served and Rehab Compared to OMJ Registrants as of April 2015 OOD VR served Cohort is from 1st Half of FFY 2015 (October 2014 - March 2015)
Tier Comparison Quick Table Served Closed-Rehab
Rehab Rate
OMJ OOD Participants Registered
OMJ Registered as Percent of
OOD VR served
Combined Tier 1 753 102 56.4% 310 41.2%
Combined Tier 2 2,320 328 45.7% 420 18.1%
Combined Tier 3 2,398 302 43.8% 292 12.2%
Combined Tier 4 14,086 1,731 41.7% 1,086 7.7%
Combined Tier 5 1,791 241 49.9% 65 3.6%
Grand Total ALL TIERS COMBINED 21,348 2,704 43.4% 2,173 10.2% Note: A 10 percent margin of error exists based on availability and accuary of data matching fields in OMJ.
2. Moving through the first four tiers, the data in Table 32 shows that as the rates of OOD VR served
individuals that are registered in OMJ increase, the rehabilitation rate for individuals served in those counties increases as well. Specifically, as the average rate of OMJ registrants rose from 7.7 percent in Tier 4 to 41.2 percent in Tier 1, the rehabilitation rate ticked up from 41.7 percent to 56.4 percent. The only exception was in Tier 5, specifically Butler County, which had a 57. 9 percent rehab rate, and also made up 25 percent of the cases in that Tier; thus driving up the average rehab rate for that group of counties.
3. A conservative estimate is that 25 percent (5,337) of the 21,348 individuals served by OOD, during the first six months of FFY 2015, had attained a ‘job ready’ status. Thus, the 2,173 who were registered in OMJ would only represent, at best (including a 10 percentage point margin of error for data integrity match), about half of the total who could be registered in OMJ.
4. Many factors contribute to an individual achieving employment and OOD should always be
evaluating those factors; such as “What may be contributing to the rehab rate of Butler County residents?”. The data also does not show how much faster individuals utilizing the tools in OMJ are able to match up with an employer versus those who are not using OMJ. However, as evidenced by Lawrence County, data suggests a positive relationship of greater success in outcomes with the utilization of OMJ. Thus, OOD should reinforce, with its counseling staff and providers, getting OOD VR served individuals registered in OMJ as a job seeking strategy to promote the achivement of their employment goals.

2015 Vocational Rehabilitation Comprehensive Statewide Needs Assessment
83
Table 33 - OOD VR Served and Rehab Compared to OMJ Registrants as of April 2015 OOD Served Cohort is from 1st Half of FFY 2015 (October 2014 - March 2015)
6 Counties Tier 1 - OMJ 25% +
OOD VR
Served Closed-Rehab Rehab Rate
OMJ OOD Participants Registered
OMJ Registered as Percent of
OOD VR Served
Lawrence 270 38 58.5% 145 53.7%
Clinton 35 5 55.6% 14 40.0%
Erie 175 30 60.0% 69 39.4%
Henry 33 2 22.2% 13 39.4%
Huron 216 24 57.1% 63 29.2%
Noble 24 3 50.0% 6 25.0%
Combined Tier 1 753 102 56.4% 310 41.2%
Note: Tiers 2 through 5 Below Only Show Counties in which OOD VR Served 200+ Individuals
13 Counties Tier 2 Combined - OMJ 15 to 24.9%
OOD VR
Served Closed-Rehab Rehab Rate
OMJ OOD Participants Registered
OMJ Registered as Percent of
OOD VR Served
Lucas 807 114 47.1% 159 19.7%
Mahoning 466 73 42.4% 81 17.4%
Combined Tier 2 2,320 328 45.7% 420 18.1%
15 Counties Tier 3 Combined - OMJ 10 to 14.9%
OOD VR
Served Closed-Rehab Rehab Rate
OMJ OOD Participants Registered
OMJ Registered as Percent of
OOD VR Served
Greene 222 42 52.5% 28 12.6%
Scioto 225 36 53.7% 27 12.0%
Trumbull 268 37 37.0% 31 11.6%
Allen 352 34 37.4% 39 11.1%
Clark 250 30 42.9% 27 10.8%
Combined Tier 3 2,398 302 43.8% 292 12.2%
------------------------------------TABLE CONTINUED NEXT PAGE--------------------------------------

2015 Vocational Rehabilitation Comprehensive Statewide Needs Assessment
84
OOD VR Served and Rehab Compared to OMJ Registrants as of April 2015 OOD Served Cohort is from 1st Half of FFY 2015 (October 2014 - March 2015)
39 Counties Tier 4 Combined - OMJ 5 to 9.9%
OOD VR
Served Closed-Rehab Rehab Rate
OMJ OOD Participants Registered
OMJ Registered as Percent of
OOD VR Served
Summit 991 129 44.3% 97 9.8%
Wood 328 47 51.6% 32 9.8%
Portage 300 29 36.3% 28 9.3%
Licking 252 30 37.5% 23 9.1%
Richland 375 27 30.3% 33 8.8%
Lorain 332 47 39.5% 29 8.7%
Montgomery 918 143 46.6% 80 8.7%
Cuyahoga 2,634 271 37.4% 223 8.5%
Fairfield 255 34 47.9% 21 8.2%
Stark 924 121 34.5% 73 7.9%
Clermont 318 50 53.2% 23 7.2%
Hamilton 1,455 200 48.9% 95 6.5%
Medina 261 20 36.4% 17 6.5%
Franklin 2,081 244 40.7% 127 6.1%
Combined Tier 4 14,086 1,731 41.7% 1,086 7.7%
15 Counties Tier 5 Combined - OMJ 0 to 4.9%
OOD VR
Served Closed-Rehab Rehab Rate
OMJ OOD Participants Registered
OMJ Registered as Percent of
OOD VR Served
Butler 466 81 57.9% 17 3.6%
Combined Tier 5 1,791 241 49.9% 65 3.6%
Grand Total ALL TIERS 21,348 2,704 43.4% 2,173 10.2%
2015 Vocational Rehabilitation Comprehensive Statewide Needs Assessment
85
IX. Survey Results (OOD, WIT, and Mathematica)
Background This section focuses on three sets of surveys that were conducted between August 2014 and May 2015. Survey instruments and results are attached in Appendix B. Mathematica – Survey of Disability and Employment (PENDING FINAL REPORT) Ohio was selected as one of a few states to participate in a Survey of Disability and Employment (SDE). The Kessler Foundation, in partnership with Mathematica Policy Research, an independent research company, conducted the SDE to learn about the barriers and facilitators to employment experienced by applicants of state vocational rehabilitation agencies. The Ohio cohort of over 1,000 applicants was selected from individuals who applied for OOD’s VR services from August through December 2014. The SDE is sponsored by the National Institute on Disability and Rehabilitation Research (NIDRR) in the U.S. Department of Education (ED). The study’s findings will assist policy makers, agencies, and providers in better understanding the needs of individuals with disabilities and the factors that lead to successful employment outcomes. Workforce Integration Task Force Surveys Opportunities for Ohioans with Disabilities and the Ohio Department of Job and Family Services conducted three surveys for the Workforce Integration Task Force for three groups: members of the blind and deaf communities; employers; and service providers, advocates and parents. Staff conducted 17 focus groups, in six different regions of the state, with Ohioans who are blind or deaf and working (or seeking work) to talk about barriers to employment and recommendations. The constituent survey was aimed at individuals who are blind, vision impaired, deaf or hearing impaired. The second online survey, called the provider survey, was aimed at service providers, advocates, parents and other family members. The third survey was of employers. We received 427 useable responses to the constituents’ survey. This survey was open to anyone on the internet; it was not based on random samples of the blind and deaf communities in Ohio. Having received feedback while in the field with the constituent survey, we developed a separate questionnaire. We received 84 responses from the service provider, advocate, and family survey; and 162 responses to the employer survey. (Workforce Integration Task Force (WIT), 2014) Opportunities for Ohioans with Disabilities (OOD) Participant Survey In May 2015, with support of the Consumer Advisory Committee and OOD Commissioners, OOD administered a survey to assess the needs of individuals actively being served by OOD’s VR program. OOD’s goal for this survey was to identify ways to better meet the needs of individuals receiving vocational rehabilitation services. This anonymous survey contained 12 questions which examined issues of how often individuals with disabilities would like contact from their counselor, the type of communication they preferred, and barriers in meeting with their counselor. An additional focus of the survey was the use of technology as a means of providing services to our individuals with disabilities. The survey was distributed online to about 9,900 OOD VR participants with an email address. It was administered to a sample of the remaining 12,863 individuals with only phone numbers. In total, OOD received 1,031 responses, or a 10.4 percent response rate, for the emailed survey. For the phone survey over 602 calls were attempted, or a 14.5 percent response rate. Surveyed participants who had hearing or visuals impairments received over a 21 percent response rate.
2015 Vocational Rehabilitation Comprehensive Statewide Needs Assessment
86
Findings - OOD Participant and Mathematica SDE Surveys 1. The assistance that OOD provides to individuals with disabilities to become employed is highly
valued by the people we serve (and their families).
Mathematica Survey: 80 percent of applicants surveyed indicated it is very important or extremely important for them to work.
2. Individuals want to go to work as soon as possible.
OOD Survey: 91.4 percent of individuals surveyed said that getting a job as quickly as possible is important to them. 62.1 percent say it is very important to them.
3. It is important for OOD to properly assess as part of the intake process whether or not
individuals who apply for services really want to work.
Mathematica Survey: 31.5 percent of applicants surveyed indicated that they did not apply for VR services in order to get a job.
4. Historically speaking, individuals with disabilities have tended to experience institutionalization
or have been provided community-based services in segregated settings. Still today, individuals with disabilities often are isolated and lack social networks.
Mathematica Survey: Half of VR applicants surveyed have three or less people (family or friends) that they could call on for help or advice if they needed it; three quarters have less than five.
5. The VR program has a lot to offer individuals with disabilities to assist them in going to
work. Individuals served by the program want regular ongoing contact with their counselor.
OOD Survey: 51.4 percent of individuals surveyed want to have contact with their counselor every week or every other week. 28.3 percent would like weekly contact.
OOD Survey: 38.3 percent of individuals surveyed have a first preference of face to face contact with their counselor, 25.4 percent have a first choice of phone calls.
6. Increased engagement should include the use of technology.
OOD Survey: 75 percent of individuals surveyed indicated that they would be interested in working with their counselor online.
In addition, Wright State University is piloting a study for remote counseling.
7. Unfortunately, some people who have recently applied for OOD VR services do not understand that they are working with OOD. This may be a symptom of the need for increased engagement with individuals receiving services and better branding of VR services.
Mathematica Survey: Only 35.9 percent of VR applicants surveyed indicated that they have taken advantage of OOD for help with employment.

2015 Vocational Rehabilitation Comprehensive Statewide Needs Assessment
87
Findings - Workforce Integration Task Force Constituent Responses 1. About 20 percent of the respondents said they had turned down work or extra hours to keep
their SSI or SSDI benefits. About 25 percent of those not currently working said they had turned down work or hours to keep SSI/SSDI benefits compared to 15 percent for those currently working.
2. In general, respondents reported less difficulty doing a job than they did finding a job. About 47 percent said their disability made it somewhat or very difficult to do a job, and about 18 percent said they had no difficulty or trouble doing a job. There could be a couple of reasons for the difference between the perceptions of difficulty in finding a job and doing a job. First, it could be that respondents found jobs for which they were well- or even over- qualified. In general, this is a well-educated group of respondents. Another possibility is that finding a job is a different skill set than doing a job, and the respondents’ work skills may be better than their job searching skills.
3. The commonly mentioned barrier was employer attitudes toward the disability (about 65
percent). Getting needed accommodations was mentioned by 31 percent. Reliable transportation was mentioned by about 39 percent. Problems with the application process, usually because of technology issues, was mentioned by 26 percent. All of these barriers were mentioned in the focus groups. About 58 percent mentioned the availability of jobs.
Provider Responses 1. Some of the providers reported higher percentages had turned down work to keep benefits.
About 45 percent said that between 25 and 74 percent of their clients, associates or family had turned down work for benefits. Considering that the providers could have multiple clients over many years, we might expect the percentage to be higher than reported by constituents.
2. The most common occupational challenge the business community sees is safety and liability issues – about 73 percent reported this. The next most common was the belief that the work had hearing or vision requirements – about 62 percent reported this. The third most (56 percent) commonly mentioned belief was a skills gap; or lack of skills to do the job.
3. The providers thought that the most common non-occupational challenge was the cost of
accommodations—about 73 percent mentioned this. A distant second was transportation cost mentioned by 40 percent. This was followed by health care costs, which was mentioned by 32 percent.
Employer Responses 1. About 66 percent of companies said they had experience hiring persons with disabilities.
2. About 30 percent of jobs currently hiring were in production jobs; 25 percent were in
management, business, and financial operations; 22 percent were in sales; 20 percent in transportation and materials moving; and 26 percent in one of the health care occupations.
3. Seventy-three percent of the employers said the hearing or vision requirements of the jobs
would pose challenges for those with hearing or vision impairments. Thirty-five percent said the physical demands of the work.

2015 Vocational Rehabilitation Comprehensive Statewide Needs Assessment
88
4. The most commonly mentioned non-occupational challenge was ‘lack of applicants,’ with about
37 percent saying this. There are two points to consider here. First, from the focus groups we know that some people have problems with online applications. Second, many, if not most, employers probably don’t know if an applicant has a disability unless the applicant discloses the need for reasonable accommodation when applying. Transportation was mentioned by about a third of the employers. Accommodation costs were mentioned by about 22 percent of employers.

2015 Vocational Rehabilitation Comprehensive Statewide Needs Assessment
89
X. Information from Other State Agencies
Ohio Department of Aging (ODA) Agency Background. The mission of the Ohio Department of Aging (ODA) is “Ohio is on the leading edge of innovation and is responsive to the growing and changing aging population.” ODA continues to work with the Office of Workforce Transformation, the Ohio Department of Job and Family Services (ODJFS), the Ohio Board of Regents, OOD, and local partners to support and engage older workers in meeting Ohio’s workforce needs. Senior Community Service Employment Program (SCSEP) is a key component of Ohio’s Integrated Workforce Plan. It is a paid community service and work-based program for income eligible job seekers age 55 and older. The program provides service-based training at local non-profit organizations in positions tailored to prepare participants for in-demand occupations such as health care and customer service.
SCSEP is the only federally-sponsored employment and training program targeted specifically to low-income older individuals who want to enter or re-enter the workforce. SCSEP provides priority for services to those most in need. These individuals: are veterans (or eligible spouses of veterans); are age 65 or older; have a disability; have limited English proficiency; have low literacy skills; reside in a rural area; have low employment prospects; have failed to find employment after using services provided through the OhioMeansJobs Centers; or are homeless or are at risk of homelessness.
The dual goals of the program are to promote useful opportunities in community service job training and to move SCSEP participants into unsubsidized employment where appropriate. An individual is eligible for SCSEP if he or she is not employed at the time of enrollment, is age 55 or older and has an income of no more than 125 percent of the federal poverty guidelines. Program participants receive work experience at local public or non-profit agencies and are paid the higher of the federal, state or local minimum wage or the prevailing wage for similar employment for approximately 20 hours per week while in community service, and other job training.
Grantees and sub-recipients must assess each SCSEP participant to determine his or her skills and employment-related needs and must develop an individual employment plan (IEP) to improve the participant’s employability. The initial IEP must include an appropriate employment goal as well. The grantee or sub-recipient must then provide or arrange for training and other supportive services identified in participants’ IEPs that are consistent with unsubsidized employment. Grantees must monitor the participant’s IEP progress regularly and are required to do a reassessment for each participant at least twice during a 12-month period. More information on SCSEP can be found at: http://aging.ohio.gov/services/seniorcommunityserviceemploymentprogram/

2015 Vocational Rehabilitation Comprehensive Statewide Needs Assessment
90
Current Partnerships with OOD. OOD and ODA engaged in a partnership to promote the
achievement of employment outcomes and independence of older adults with disabilities, as well
as facilitate cross-training for regional adult service providers and local OOD VR staff regarding
program requirement of each system. The data in Table 33 below provides a breakdown of Ohioans
age 50 and older who were receiving services from OOD as of March 31, 2015. Almost 20 percent
of all OOD participants were age 50 and older.
Table 33 - Individuals with Disabilities age 50 and Older Engaged with OOD – March 31, 2015
OOD Case Status YTD FFY 2015 (3/31/2015)
Age 50-54
Age 55-59
Age 60-64
Age 65-69
Age 70+
OOD Total
50 and Over % of OOD
Participants
Current Open Cases 1,814 1,458 678 261 111 22,175 19.5%
Rehab Rate of Closed Cases 46% 43% 50% 45% 60% 44%
Avg. Employment Hourly Wage $11.37 $10.67 $11.81 $13.40 $11.99 $10.14
Avg. Hours Work Per Week 25 26 26 23 17 26
Ohio Department of Aging (ODA) Data.
ODA data in Table 34 indicates that 2,691 individuals were served by the Senior Community
Services Employment Program (SCSEP) throughout Ohio in 2013. Only 13.8 percent, or 372, of
individuals served by the SCSEP program were identified as having a disability. The 2014 SCSEP
county data table is provided in Appendix C.
Table 34 - SCSEP Population Served in PY 13 (July 1, 2013 -June 30, 2014)
Provider Total
Participants
Individuals with
Disabilities Pct.
Individuals with Severe Disabilities
Pct. Individuals
who are Frail
Pct.
National SCSEP 67,814 10,598 15.6% 1,387 2.0% 371 0.5%
Ohio 2,691 372 13.8% 23 0.9% 5 0.2%
Ohio Department of Aging 506 66 13.0% 0 0.0% 0 0.0%
AARP 489 32 6.5% 0 0.0% 1 0.2%
Easter Seals 181 79 43.6% 18 9.9% 2 1.1%
Experience Works 483 79 16.4% 0 0.0% 0 0.0%
Mature Services 636 78 12.3% 0 0.0% 0 0.0%
National Caucus and Center on Black Aged 232 14 6.0% 1 0.4% 0 0.0%
Senior Service America 164 24 14.6% 4 2.4% 2 1.2%

2015 Vocational Rehabilitation Comprehensive Statewide Needs Assessment
91
Ohio Department of Developmental Disabilities (DODD)
Background. DODD is responsible for overseeing a statewide system of supports and services for
individuals with developmental disabilities and their families. Some of the general services that
DODD provides include: residential support; Medicaid waivers and services; and reporting systems
to ensure the health and safety of individuals with developmental disabilities.
Programs and Services and Current Partnerships with OOD. Bridges to Transition is a partnership between County Boards of Developmental Disabilities (CBDD)
and OOD. Bridges focuses on transition aged youth ages 14 to 22, eligible for CBDD and OOD
services. The goal of the project is to enhance career exploration options and increase employment
outcomes by developing a collaborative network of services to assist students in achieving their
employment goals. During Federal Fiscal Year (FFY) 2014, more than 130 youth served through
Bridges achieved successful employment outcomes, 500 were newly served, and over 1,700 were
on counselor caseloads.
DODD is the lead agency for Ohio’s Employment First initiative that promotes community
employment within its system. Through Employment First funding, OOD and DODD have an
interagency agreement to provide vocational rehabilitation counseling and to expand community
employment by helping working-age adults, primarily those who are receiving services in facility-
based work and non-work settings, to transition to competitive, integrated employment. Through
this agreement, DODD’s state general revenue funds and resulting federal VR dollars, OOD is able
to hire vocational rehabilitation counselors and benefits planners to achieve these objectives. A
dual certification process for DODD-certified providers and existing OOD providers was also
established. This dual certification ensures a continuity of service provision from career planning
through job retention services, increases the qualified provider pool, allows for increased choices
in providers, and reduces the frustration associated with changing providers. Just in the first year
(FFY 2014) of this program, more than 1,000 individuals were determined eligible, 600 person-
centered plans were written, and 85 integrated community employment placements were made.
Table 35 -
Ohio Department of Developmental Disabilities (DODD) Data. The data provided by DODD in
Appendix C includes the average daily membership by county for developmental disabilities (DD)
services. As DODD works with OOD and the local boards to set targets for Employment First, the
main focus is to increase the number of individuals with integrated employment outcomes. The
cognitive estimates used in this report, including the projected number of individuals seeking
employment, were vetted and adjusted to account for the annual Employment First goals.

2015 Vocational Rehabilitation Comprehensive Statewide Needs Assessment
92
Ohio Department of Education (ODE)
Mission/Orientation (Office for Exceptional Children). The Office for Exceptional Children provides
leadership, assistance and oversight to school districts and other entities that provide
differentiated instruction for students with disabilities and gifted students.
Among its responsibilities, the office administers state and federal funds; coordinates and
administers programs to improve outcomes for students with disabilities and gifted students;
implements a statewide monitoring and complaint-resolution system designed to assess
district/educational agency compliance with applicable federal and state laws and regulations; and
provides technical assistance to districts and educational agencies around issues of compliance
with the Individuals with Disabilities Education Improvement Act (IDEA).
Partnership with OOD. The Ohio Department of Education (ODE) and OOD are partnering to expand
access to meaningful transition planning and career preparation services and supports for students
with disabilities, beginning at age 14. Through this initiative, 26 OOD counselors located throughout
the state will actively participate in IEP team meetings for OOD-eligible youth, and collaboratively
plan with educators for seamless coordination and delivery of transition supports across multiple
agencies. This greater access to person-centered career focused planning and increased
participation in typical work experiences will better prepare students with disabilities for
graduation and post-school success.
Ohio Department of Education Data. Ohio school year 2013-2014 data identified 50,839 youth age
14 and older with an IEP and identified disabilities that could who could be potentially eligible for
OOD VR services. The disabilities considered for potential OOD VR eligibility are: cognitive, visual
(including blindness), deafness, deaf/blindness, orthopedic, multiple disabilities, emotional
disturbance, autism, hearing impairments, other health impairments, and traumatic brain injury
(TBI), and some students with learning disabilities. The ODE county and disability information
breakdown is provided in Appendix C.

2015 Vocational Rehabilitation Comprehensive Statewide Needs Assessment
93
Ohio Department of Job and Family Services (ODJFS)
Mission. ODJFS offers a variety of programs and services under the broad categories of job training, unemployment, Medicaid, food assistance, cash assistance, child support, protective services, foster care, adoption, and childcare. For the purposes of this needs assessment, the discussion regarding ODJFS services, programs and resources focuses on Wagner-Peyser (Labor Exchange Services through OhioMeansJobs.com), OhioMeansJobs Centers (formerly One-Stop Centers), and Bureau of Labor Market Information. Programs and Services. Wagner-Peyser is a federally funded program to provide labor exchange
services to employers and job seekers statewide. The goal of labor exchange services is to help job
seekers obtain meaningful employment opportunities and to assist employers in obtaining skilled
and productive employees. Services for job seekers include job placement, resume preparation,
testing, job-seeking skills workshops, computer based job matching and labor market information.
Services for employers include assistance in listing and filling job vacancies including basic screening
and referral of qualified job seekers. Job seekers and employers may find services through
OhioMeansJobs.com or the statewide network of local OhioMeansJobs (OMJ) Centers.
OMJ Centers provide services to local businesses and employed or unemployed job seekers in all
88 of Ohio’s counties. OMJ Centers work with county agencies and other partners to deliver a
variety of employment and training services to meet the needs of local customers. Business
customers can expect services such as job posting, pre-screening, employee assessments,
opportunities for job fairs, various training options, layoff aversion, rapid response, and mass
recruitment. Job seeking customers can expect services such as access to resource rooms, job-
related workshops, supportive services, individual training accounts and other activities that match
job seekers to employment. Specific services available in OMJ Centers are designed to meet local
needs.
The map on the following page details the counties that comprise the Local Workforce Investment
Areas, are served by the various OMJ Centers, and where OOD VR staff are embedded that support
and promote local labor exchange.
Current Partnerships with OOD. OOD’s utilization of the Wage Record Data Sharing Agreement
with ODJFS allows OOD to generate program revenue through the Social Security Ticket-to-Work
Program. It also supports the VR program in conducting Wage Record employment verification
requests which assist in identifying and verifying successful employment outcomes of individuals
receiving OOD VR services. ODJFS staff, who support OhioMeansJobs.com (OMJ), have trained
counselors on how to obtain labor market information for their region of the state, as well as having
assisted OOD job seekers at OOD-sponsored job fairs, in registering with OMJ. Finally, with the
Workforce Innovation and Opportunity Act, JFS and OOD have been collaboratively working to
ensure alignment of labor exchange and common performance measure requirements.

2015 Vocational Rehabilitation Comprehensive Statewide Needs Assessment
94
Map 16
Ohio Workforce Investment Areas and Local OhioMeansJobs Centers with OOD Embedded Staff

2015 Vocational Rehabilitation Comprehensive Statewide Needs Assessment
95
Ohio Department of Mental Health and Addiction Services (ODMHAS)
Current Partnership with OOD. ODMHAS and OOD have engaged in an expanded partnership
through a state level agreement, to develop and implement improved coordination of supported
employment initiatives for dual eligible individuals with disabilities with severe and persistent mental
illness (SPMI). This includes both traditional supported employment services, as well as Evidenced-
Based Practice in Supported Employment (also known as Individual Placement and Support—IPS).
Through a statewide employment committee, the agencies will collaborate to identify and remove
systematic barriers to promote a dual system approach toward achievement of recovery,
rehabilitation, and self-sufficiency for individuals with SPMI.
In addition, this partnership will:
Provide consultation and technical assistance to local mental health service agencies and
vocational rehabilitation staff with enhanced emphasis on recovery, rehabilitation, and
vocational successes.
Provide consultation and technical assistance to local mental health service agencies and
vocational rehabilitation staff on policies and procedures regarding the vocational
rehabilitation process and community mental health engagement and rehabilitation
programming.
Collaborate to develop and implement innovative funding and community support
opportunities to produce a statewide increase in the availability of services.
Support continued collaboration in the identification of mutually served individuals with
disabilities to track outcomes and impact future trends through policy development,
consultation, and technical assistance in an effort to enhance rehabilitation success.
Local Partnership and Statewide Data. In federal fiscal year (FFY) 2014, OOD was fully engaged in
partnerships with 19 local county boards that provide alcohol and drug addiction recovery, as well
as mental health services in their communities. Through these partnerships in FFY 2014, more than
650 individuals achieved successful employment outcomes and over 1,850 received services. In
addition, with county breakdowns cited in Appendix C, there were over 212,000 adults, ages 18 to
64, who were receiving ODMHAS services for mental health and/or addiction conditions.

2015 Vocational Rehabilitation Comprehensive Statewide Needs Assessment
96
Ohio Department of Veterans’ Services (ODVS)
Programs and Services. ODVS is the state agency that provides support to veterans and their
families. Specifically, ODVS is responsible for operational oversight of the 88 County Veterans
Services Offices. The ODVS also monitors federal money that comes to Ohio from the U.S.
Department of Veterans Affairs. Some of the services that the U.S. Department of Veterans Affairs
provides include health care and benefits. Health care services include: hospitals, community
clinics, community living centers, domiciliary support, readjustment counseling centers, and
various other facilities. Major benefits that are provided through ODVS/VA include veterans’
compensation, veterans’ pension, survivors’ benefits, rehabilitation and employment assistance,
education assistance, home loan guaranties, and life insurance coverage.
Chalmers P. Wylie Ambulatory Care Center’s Compensated Work Therapy (CWT) is the Veterans
Administration’s (VA’s) VR program and is designed to assist veterans experiencing homelessness
and/or severe mental illness in obtaining and maintaining employment. Services offered through
this program include vocational counseling, transitional work experiences (temporary job
placements that normally do not exceed six months), and Supported Employment (an intensive
program to help veterans with severe employment barriers to keep employment). The services
provided within the CWT program are highly aligned with the services provided by OOD. The
primary audience for the CWT program includes Veterans who are experiencing homelessness
and/or severe mental illness.
Ohio Department of Veterans’ Services (ODVS) Data. The ability to identify veterans with
disabilities in Ohio is largely dependent on the Veterans’ Administration’s (VA’s) ability to connect
them to compensation and is awarded to veterans who are under a certain income threshold and
are disabled due to a non-military or non-service related condition. In 2014, there were 118,534
disability compensation recipients, 15,262 disability pension recipients for a total of 133,796 Ohio
veterans with disabilities receiving benefits.
Summary of State Agency Data
Findings and Impact of Other State Agency Programs and Data
The Ohio Department of Education has identified over 50,000 youth, age 14 and older, with an
individualized education program (IEP) and identified disabilities, who could be eligible for OOD VR
services. In 2014, 1,907 individuals could be served statewide via the Senior Community Service
Employment Program (SCSEP), which is a 40 percent decrease from the 2,691 served in 2013. In
state fiscal year 2014, the Ohio Department of Mental Health and Addiction Services reported that
212,808 Ohioans with severe mental illnesses and/or drug addiction were served, a subset of which
might also benefit from OOD services. The Ohio Department of Developmental Disabilities (DODD),
through local county boards, serves over 32,000 individuals with developmental disabilities, age
14-64, who are engaged in facility-based work, facility-based non-work, or integrated employment.
Many would be considered individuals with cognitive impairments in the OOD classification system.
According to the Veteran’s Benefits Administration, a total of 133,796 Veterans with disabilities
received disability benefits in 2014.

2015 Vocational Rehabilitation Comprehensive Statewide Needs Assessment
97
XI. Recommendations
The following Vocational Rehabilitation 2015 Comprehensive Statewide Needs Assessment
recommendations are supported by the analysis and findings presented in this report.
1. Actively engage OOD VR counselors in the early stages of a student’s Individualized Education
Program (IEP) development and utilize the VR services that have yielded positive outcomes.
OOD outcome data and the Ohio Longitudinal Transition Study results identify specific
strategies that contribute to successful service delivery and outcomes for youth and students
with disabilities. Ohio’s State Fiscal Year 2016/17 Budget provides the Ohio Department of
Education (ODE) with funding that will allow OOD counselors to work with local education
agencies to serve students with disabilities through partnership with local career technical
planning districts. The number of youth who have an IEP, as well as a qualifying disability for
OOD services, provide OOD and ODE a strategic foundation to identify immediate areas of need.
Sources:
Section VII – Youth and Students with Disabilities - Comprehensive Statewide Needs
Assessment (CSNA) For Transition-age Youth and Young Adults (R. Baer, 2015)
2. Formalize efforts to increase services to individuals with visual and hearing disabilities;
specifically evaluate and prioritize identified recommendations cited in the Workforce
Integration Task Force (WIT). The penetration rate and proportionality rate data tables and maps
suggest that additional opportunity and emphasis for individuals with hearing and visual
impairments should be a priority. OOD should evaluate and prioritize the recommendations of
the WIT as a roadmap for planning and implementation.
Sources:
Section IV. Prevalence & Penetration Rate Projections of Unmet Need
Map 3 Hearing Impairments - OOD Service Penetration Rate - 2016 Projection
Map 6 Visual Impairments - OOD Service Penetration Rate - 2016 Projection
Table 24 - Number of Counties by Disability Category and OOD Service Penetration Rate
Range – 2016 projection
Table 25 - OOD Service Penetration Rate Ranges – Counts by County – 2016 Projection
Section VIII. Workforce Integration Workforce Integration Task Force
Final Report to Governor John R. Kasich (Workforce Integration Task Force (WIT), 2014)
3. Expand and leverage new employer and state agency partnerships to achieve Workforce
Innovation and Opportunity Act common performance measure outcomes. OOD should build
upon the existing business engagement activities, as well as state partnerships facilitated by the
Governor’s Office of Workforce Transformation, to promote labor exchange between OOD
participants and employers seeking talent; with an emphasis on in-demand occupations.
Sources:
Section VIII. OhioMeansJobs.com and In-Demand Occupations:
A Focused Outcome Strategy for OOD
Section IX. Survey Results – Workforce Integration Task Force

2015 Vocational Rehabilitation Comprehensive Statewide Needs Assessment
98
4. Meet the workforce needs of employers by evaluating in-demand occupations as a standard approach of VR counselors’ work in developing job goals and service plans for OOD job seekers. OOD has emphasized employers as a dual customer and a critical component for the success of individuals with disabilities that are seeking employment. The Governor’s Office of Workforce Transformation has diligently worked to strategically align Ohio’s workforce programs to focus efforts in meeting employers’ workforce needs. One strategy is through the identification and monthly monitoring of Ohio’s in-demand occupations. It is recommended that VR counselors, as part of informed choice, review the in-demand occupations, and where appropriate, focus job goals and training around those. It is recommended that OOD utilize labor market information, Wanted Analytics, and OhioMeansJobs.com to facilitate this activity.
Sources:
Section VIII. OhioMeansJobs.com and In-Demand Occupations
Appendix C – OhioMeansJobs.com – All In-Demand Occupations
http://jfs.ohio.gov/owd/OMJResources/State-AllOpenings.stm
5. Work with the Social Security Administration to identify strategies for referring disability
claimants to the Vocational Rehabilitation program. As the trend of Social Security Disability
Insurance (SSDI) and Supplemental Security Income (SSI) recipients is continuing to rise, the
trend for individuals with disabilities participating in the labor force is on the decline for working
age (16-64) individuals with disabilities compared to individuals without disabilities. OOD and
SSA should identify ways to stem and reverse this trend though collaborative efforts.
Sources:
Section IV. Disability Demographics and Employment Status:
Tables 4 - Annual U.S. Unemployment of Civilians Ages 16 to 64 by Disability Status – 2012-
2014 Bureau of Labor Statistics (Table A-6):
Table 8 - Ohio: Number and Employment of SSI Beneficiaries: 2002-2012
Chart 1 - SSDI – U.S. Disabled Worker Beneficiary Trend Disabled Worker Data
Chart 2 - SSDI – U.S. Number in Current Payment Status at End of Month
6. Concentrate efforts to bring awareness and assist OOD VR served individuals to register with
OhioMeansJobs.com (OMJ) as means to achieving their employment goals. Data from ODJFS
labor exchange registration in the OhioMeansJobs.com (OMJ) system suggests that more
individuals that are served by OOD could be registered and take advantage of the tools in OMJ.
Sources:
Section VIII. OhioMeansJobs.com and In-Demand Occupations: A Focused Outcome Strategy
for OOD
Map 14 OOD Participants* Registered in OhioMeansJobs.com
Tables 32 and 33 - OOD Served and Rehab Compared to OMJ Registrants as of April 2015

2015 Vocational Rehabilitation Comprehensive Statewide Needs Assessment
99
7. Utilize technology to increase access to OOD services and improve operational efficiencies. A
survey of OOD participants supports the need for OOD to enhance its technological
infrastructure as means for promoting access to VR services, as well as facilitating their
interaction with their VR counselor. This will also promote efficiency and quality of service
delivery.
Source: Section IX and Appendix B – Survey Results Opportunities for Ohioans with
Disabilities (OOD) Participant Survey
8. Design a formal business plan model that allows for agile deployment of human and financial
resources across Ohio counties when new opportunities to expand VR services arise. With the
elimination of the wait list for VR services, new WIOA regulations, and focus on WIT
recommendations to meet the needs of hearing and visually impaired individuals, OOD needs to
be prepared to deploy counseling staff and resources that correspond to changes designed to
promote more balance across the system. When addressing significant discrepancies in the
“balance” (proportionality) of services provided across counties in Ohio, it will require a
methodical approach to achieve success, including efforts to access available federal funding
which may be required to support the provision of expanded services.
Source: Section VI. Relative Proportionality: Comparison of Needs to Service Provision
9. Re-evaluate the partnership with the Ohio Department of Aging, leveraging both Vocational
Rehabilitation and the Independent Living and Older Blind programs. More than 19.5 percent
of individuals engaged with OOD were 55 and older, and 17.8 percent were between the ages
of 50 and 64. Only two percent of individuals age 65 and older with a disability, who are not in
the labor force, are actually seeking work. Thus, OOD could also leverage the Independent Living
and Older Blind program in meeting the needs of the 65+ population.
Sources:
Table 5 - Persons not in the labor force by disability status, age, and sex, 2014 annual averages
Bureau of Labor Statistics (Table A-5)
Section X. Information from Other State Agencies Ohio
Appendix A - Department of Aging (ODA) Program Year 2014 Senior Community Service Employment
Program (SCSEP)

2015 Vocational Rehabilitation Comprehensive Statewide Needs Assessment
100
Bibliography
Bureau of Labor Statistics. (2013-2015). Tables 5 and A-6.
CDC - Autism & Developmental Disabilities Monitoring (ADDM) Network. (2014). Centers for
Disease Control and Prevention. Retrieved from http://www.cdc.gov/ncbddd/autism/data.html
Centers for Disease Control and Prevention. (2014). CDC Traumatic Brain Injury. Retrieved from
Data and Statistics: http://www.cdc.gov/traumaticbraininjury/data/index.html
D.A. Reiger, M. F. (1990). Comorbidity of Mental Disorders with Alcohol and Drug Use. Journal of
the American Medical Association, 2511-2518.
Erickson, W., Lee, C., & von Schrader, S. (2014). 2012 Disability Status Report: Ohio. Employment
and Disability Institute (EDI), Cornell University. Ithaca, NY: Cornell University. Retrieved from
http://disabilitystatistics.org/
Green & Kreuter. (1991). Health Promotion Planning: An Educational and Environmental
Approach. Mayfield, CA: Mayfield Publishing Company.
Institute on Disability. (n.d.). 2014 Disability Statistics Annual Report. University of New
Hampshire. Retrieved April 2014, from http://disabilitycompendium.org/
Julian, D. R. (2012). Vocational Rehabilitation Comprehensive Statewide Needs Assessment. The
Center for Learning and Excellence and The Nisonger Center. Columbus: The Ohio State
University.
Mathematica. (2014). Survey of Disability and Employment (Ohio).
Nagi, S. (1991). Disability concepts revised: Implications for preventions. In C. M. Rita-Petretto,
Models of Disability.
ODE - EMIS, O. D. (2012-2013). Students with disabilities by category of disability who are age 14
or older. EMIS. Columbus, Ohio. Retrieved 2015
Ohio Business Leadership Network (OHBLN). (2015, August). OHBLN Roster. OHBLN.
Ohio Department of Aging . (2014). Senior Community Service Employment Program (SCSEP) .
Ohio Department of Job and Family Services (ODJFS). (2014-2015). Ohio Workforce Case
Management System (OWCMS). Wagner-Peyer and WIA data.
Ohio Development Services Agency . (2015 ).
Ohio Development Services Agency. (2015). 2015-2040 Projected Populations. (D. J. He, Compiler)
Office of Strategic Research.
OOD - AWARE. (n.d.). AWARE VR Case Management System Reporting Data. Program Trend Data.
Columbus, Ohio: Opportunities for Ohioans with Disabilities.

2015 Vocational Rehabilitation Comprehensive Statewide Needs Assessment
101
OOD - Fiscal. (n.d.). Opportunities for Ohiaons with Disabilities - Budget Trend Data. Columbus,
Ohio. Retrieved 2015
R. Baer, D. S.-K. (2015). Comprehensive Statewide Needs Assessment (CSNA) for Transition Age
Youth and Young Adults. The Research and Evaluation Bureau and the Center for Innovation and
Tranisition in Employment.
SAMHSA. (2014). Behavioral Health Barometer: Ohio. U.S. Depratment of Health and Human
Services - Substance Abuse and Mental Health Services Administration. Retrieved from
www.samhsa.gov
Shattuck, P. (2006). The contrtibutions of diagnostic substitution to the growing administrative
prevalence of autism in U.S. special education. Pediatrics, 1028-1037.
Shell, J. (2009). Developing a Model Comprehensive Statewide Needs Assessment with
Corresponding Training Materials for State VR Agency Staff and SRC Members: Vols. I and II.
Washington, D.C.: Rehabilitation Services Administration, U.S. Department of Special Education.
Social Security Administration. (2013). Congressional Statistics - Ohio. SSA Publication, Office of
Research, Evaluation, and Statistics, Office of Retirement and Disability Policy, Washington, D.C.
Retrieved 2015, from www.socialsecurity.gov/policy
Social Security Administration, SSA. (2015, August). Graphs of Disabled Worker Data. Retrieved
from SSA.gov: http://www.ssa.gov/OACT/STATS/dibGraphs.html
Steinmetz, E. (2006). Americans with Disabilities: 2002. Current Populations Reports as cited in J.
Shell, Developing a Model Comprehensive Statewide Needs Assessment with Corresponding
Training Materials for State VR Agency Staff and SRC Members: Vols. I. Rehabilitation Services
Administration, U.S. Department of Special Education and Rehabilitation Services, U.S.
Department of Education.
The Autism Society of Ohio. (n.d.). Retrieved from
http://www.autismohio.org/index.php/information/statistics-facts
U.S. Census - ACS. (2013). 3-YR Ohio County Population C18120; 5-YR Ohio County Ethnicity; 5-YR
Race; 3-YR Age Gender. Retrieved from https://www.census.gov/programs-surveys/acs/
U.S. Department of Labor - Bureau of Labor Statistics. (2015). Persons with a Disability: Labor
Force Characteristics 2014 - News Release. http://www.bls.gov/news.release/pdf/disabl.pdf.
U.S. DOE - IDEA Data Center. (2012-2013). IDEA - Data Center Provided Part B 618 Data - All
States. Office of Special Education .
Workforce Integration Task Force (WIT). (2014). Workforce Integration Task Force Final Report to
Governor John R. Kasich.