(this page intentionally left blank)eng2.lacity.org/projects/lariver.../lar...text.pdf ·...
TRANSCRIPT


(THIS PAGE INTENTIONALLY LEFT BLANK)

Los Angeles District
Hydrology and Hydraulics Branch
HYDRAULICS REPORT
Floodplain Analysis Los Angeles River: Barham Boulevard to First Street Flood Plain Management Services Special Study Los Angeles, California
OCTOBER 2016


Hydraulics Report Flood Plain Management Services Special Study, Los Angeles River
Report Prepared By:
U.S. Army Corps of Engineers Los Angeles District, Engineering Division Hydrology and Hydraulics Branch 915 Wilshire Blvd, Suite 1260 Los Angeles, CA 90017 Name: Adam J. Bier, P.E. Name: Robert D. Mrse, P.E. Title: Senior Hydraulic Engineer Title: Chief, Hydraulics Section District: Los Angeles District: Los Angeles Name: Victor J. Andreas, P.E. Name: Deanna D. Wilson Title: Hydraulic Engineer Title: GIS Analyst District: Los Angeles District: Los Angeles Report Reviewed By: Name: Rene A. Vermeeren, P.E., D.WRE Title: Chief, Hydrology and Hydraulics Branch District: Los Angeles Role: District Quality Reviewer Name: David L. Silvertooth, P.E., CFM Title: Senior Hydraulic Engineer District: Los Angeles Role: District Quality Reviewer Name: Thomas R. Gambucci, P.E., CFM, D. WRE Title: Hydraulic Engineer, Regional Technical Specialist District/Section: Rock Island, Hydrologic Engineering Role: Agency Technical Reviewer Report Prepared for: City of Los Angeles Department of Public Works, Bureau of Engineering Street Improvement and Stormwater Division POC: Susan Shu, Senior Civil Engineer 1149 S Broadway Los Angeles, CA 90015

(THIS PAGE INTENTIONALLY LEFT BLANK)

(THIS PAGE INTENTIONALLY LEFT BLANK)


(THIS PAGE INTENTIONALLY LEFT BLANK)

Hydraulics Report Flood Plain Management Services Special Study, Los Angeles River
i
TABLE OF CONTENTS
1.0 GENERAL DESCRIPTION OF STUDY ........................................................................... 1 1.1 Overview and Study Authority ..................................................................................... 1 1.2 Project Location and Description of the FPMS Reach ................................................. 2 1.3 General Description of the Los Angeles County Drainage Area ................................. 2 1.4 Survey and Mapping ..................................................................................................... 3 1.5 Special Notice ............................................................................................................... 4
2.0 HYDRAULIC MODEL DEVELOPMENT ........................................................................ 5 2.1 Hydrology Overview .................................................................................................... 5 2.2 Previous Hydraulic Models .......................................................................................... 6 2.3 Hydraulic Model Overview .......................................................................................... 6
2.3.1 Current Condition ..................................................................................................... 6 2.3.2 Combined One-Dimensional and Two Dimensional Hydraulic Model ................... 7
2.4 Reach Assignments....................................................................................................... 8 2.5 River Stationing ............................................................................................................ 9 2.6 Two-Dimensional Computational Mesh Extents ......................................................... 9 2.7 Grid Cell Size ............................................................................................................. 10 2.8 Lateral Structures ........................................................................................................ 10 2.9 Break Lines ................................................................................................................. 10 2.10 Roughness Coefficients .............................................................................................. 10 2.11 Bridges ........................................................................................................................ 12
2.11.1 Bridge Piers ............................................................................................................. 13 2.11.2 Bridge Modeling Approach .................................................................................... 13 2.11.3 Changes from Previous Hydraulic Models ............................................................. 13
2.12 Flow Data ................................................................................................................... 14 2.13 Boundary Conditions .................................................................................................. 15 2.14 Flow Regime............................................................................................................... 15 2.15 Ineffective Flow Areas ............................................................................................... 15
3.0 FLOODPLAIN ANALYSES............................................................................................. 25 3.1 1% ACE (100-year) Flood Overview ......................................................................... 25 3.2 1% ACE (100-year) Floodplain Analysis ................................................................... 27
3.2.1 Right (South) Bank – Headworks Reservoir .......................................................... 27 3.2.2 Right (South) and Left (North) Bank - Riverside Drive / Victory Boulevard ........ 27 3.2.3 Left (East) Bank – Downstream of Verdugo Wash Confluence............................. 27 3.2.4 Right (West) Bank – Griffith Park Area ................................................................. 28 3.2.5 Left (East) Bank – North of Glendale Boulevard ................................................... 28 3.2.6 Left (East) Bank – Glendale Boulevard to State Route 2 Freeway ........................ 28 3.2.7 Right (West) Bank – State Route 2 Freeway .......................................................... 28
3.3 0.2% ACE (500-year) Flood Overview ...................................................................... 29 3.4 0.2% ACE (500-year) Floodplain Analysis ................................................................ 29

Hydraulics Report Flood Plain Management Services Special Study, Los Angeles River
ii
3.4.1 Right (South) Bank – Headworks Reservoir .......................................................... 29 3.4.2 Right (South) and Left (North) Bank - Riverside Drive ......................................... 29 3.4.3 Between Verdugo Wash and Arroyo Seco Confluences ........................................ 30
3.5 Comparison to Previous Floodplains .......................................................................... 30 3.6 Conclusion .................................................................................................................. 30
3.6.1 1% ACE (100-year) Flood ...................................................................................... 31 3.6.2 0.2% ACE (500-year) Flood ................................................................................... 31
4.0 REFERENCES .................................................................................................................. 33
LIST OF TABLES
Table 1. Los Angeles River Design Peak Discharges ..................................................................... 5 Table 2. Study Reach Descriptions ................................................................................................. 8 Table 3. Los Angeles River Design Discharge and Freeboard ....................................................... 9 Table 4. Bridges in Study Area ..................................................................................................... 12 Table 5. Concentration Points near Study Area ............................................................................ 14 Table 6. Hydraulic Model External Boundary Conditions ........................................................... 15 Table 7. Points of Interest along the Study Reach ........................................................................ 25
LIST OF FIGURES
Figure 1. Los Angeles River below Tujunga Wash – CP 12 ........................................................ 17 Figure 2. Los Angeles River below Verdugo Wash – CP 17 ....................................................... 18 Figure 3. Los Angeles River below Arroyo Seco – CP 21 ........................................................... 19 Figure 4. Los Angeles River Upstream Boundary Condition upstream of Barham Boulevard ... 20 Figure 5. Lateral Inflow Downstream of Burbank Western Confluence ...................................... 21 Figure 6. Lateral Inflow Downstream of Verdugo Wash ............................................................. 22 Figure 7. Lateral Inflow Downstream of Arroyo Seco Confluence .............................................. 23 Figure 8. Los Angeles River 1% ACE (100-year) Flood: Overtopping Locations ...................... 26
LIST OF PLATES
Plate 1: Los Angeles River FPMS Reach Location Map Plate 2: Los Angeles County Drainage Area (LACDA) Plate 3: LACDA and LAR FPMS Study Area Plate 4: Los Angeles River Survey Sources Plate 5: Los Angeles River Grid Index Overview Plate 6: Los Angeles River Points of Interest Index Grid A Plate 7: Los Angeles River Points of Interest Index Grid B Plate 8: Los Angeles River Points of Interest Index Grid C

Hydraulics Report Flood Plain Management Services Special Study, Los Angeles River
iii
Plate 9: Los Angeles River Hydraulic Modeling Elements Index Grid A Plate 10: Los Angeles River Hydraulic Modeling Elements Index Grid B Plate 11: Los Angeles River Hydraulic Modeling Elements Index Grid C Plate 12: Los Angeles River 1% ACE Floodplain – Grid Index Overview Plate 13: Los Angeles River 1% ACE Floodplain – Grid Index 1 Plate 14: Los Angeles River 1% ACE Floodplain – Grid Index 2 Plate 15: Los Angeles River 1% ACE Floodplain – Grid Index 3 Plate 16: Los Angeles River 1% ACE Floodplain – Grid Index 4 Plate 17: Los Angeles River 1% ACE Floodplain – Grid Index 5 Plate 18: Los Angeles River 1% ACE Floodplain – Grid Index 6 Plate 19: Los Angeles River 1% ACE Floodplain – Grid Index 7 Plate 20: Los Angeles River 1% ACE Floodplain – Grid Index 8 Plate 21: Los Angeles River 1% ACE Floodplain – Grid Index 9 Plate 22: Los Angeles River 1% ACE Floodplain – Grid Index 10 Plate 23: Los Angeles River 1% ACE Floodplain – Grid Index 11 Plate 24: Los Angeles River 1% ACE Floodplain – Grid Index 12 Plate 25: Los Angeles River 1% ACE Floodplain – Grid Index 13 Plate 26: Los Angeles River 0.2% ACE Floodplain – Grid Index Overview Plate 27: Los Angeles River 0.2% ACE Floodplain – Grid Index 1 Plate 28: Los Angeles River 0.2% ACE Floodplain – Grid Index 2 Plate 29: Los Angeles River 0.2% ACE Floodplain – Grid Index 3 Plate 30: Los Angeles River 0.2% ACE Floodplain – Grid Index 4 Plate 31: Los Angeles River 0.2% ACE Floodplain – Grid Index 5 Plate 32: Los Angeles River 0.2% ACE Floodplain – Grid Index 6 Plate 33: Los Angeles River 0.2% ACE Floodplain – Grid Index 7 Plate 34: Los Angeles River 0.2% ACE Floodplain – Grid Index 8 Plate 35: Los Angeles River 0.2% ACE Floodplain – Grid Index 9 Plate 36: Los Angeles River 0.2% ACE Floodplain – Grid Index 10 Plate 37: Los Angeles River 0.2% ACE Floodplain – Grid Index 11 Plate 38: Los Angeles River 0.2% ACE Floodplain – Grid Index 12 Plate 39: Los Angeles River 0.2% ACE Floodplain – Grid Index 13 Plate 40: Los Angeles River 1991 Base Condition Floodplains – Index Grid A Plate 41: Los Angeles River 1991 Base Condition Floodplains – Index Grid B Plate 42: Los Angeles River 1991 Base Condition Floodplains – Index Grid C

Hydraulics Report Flood Plain Management Services Special Study, Los Angeles River
iv
LIST OF ACRONYMS
1D One-Dimensional 2D Two-Dimensional ACE Annual Chance Exceedance CP Concentration Point CWMS Corps Water Management System DTM Digital Terrain Model FEMA Federal Emergency Management Agency FPMS Flood Plain Management Services GIS Geographic Information System HEC-RAS Hydrologic Engineering Center - River Analysis System I-5 Interstate 5 Freeway LACDA Los Angeles County Drainage Area LACDPW Los Angeles County Department of Public Works LAR Los Angeles River LARIAC Los Angeles Region Imagery Acquisition Consortium LiDAR Light Detection and Ranging LOMR Letter of Map Revision NAD North American Datum NAVD North American Vertical Datum NFIP National Flood Insurance Program RAS River Analysis System RS River Station SR State Route SWMP Stormwater Management Plan TIN Triangulated Irregular Networks US United States USACE United States Army Corps of Engineers, Los Angeles District WRC Water Resources Council

Hydraulics Report Flood Plain Management Services Special Study, Los Angeles River
1
1.0 GENERAL DESCRIPTION OF STUDY
1.1 Overview and Study Authority
The U.S. Army Corps of Engineers, Los Angeles District (USACE) prepared hydraulic models and floodplain maps for the Los Angeles River (LAR) from Barham Boulevard in Burbank, California to First Street in Los Angeles, California. The study was conducted for the City of Los Angeles Bureau of Engineering Department of Public Works under the Flood Plain Management Services (FPMS) Program. The purpose of this study is to present results from hydraulic modeling efforts and floodplain analysis for the FPMS Reach (Barham Boulevard to First Street) of the LAR. Plate 1 displays the project location.
The analysis was conducted as part of the USACE FPMS program, which was established to implement Section 206 of the Flood Control Act of 1960 as amended. The objective of FPMS is to foster public understanding of the options for dealing with flood hazards. The FPMS program serves to promote the prudent use of floodplains and provides a range of technical assistance and planning guidance necessary to support effective floodplain management. The program offers general technical services to develop or interpret site-specific data regarding flood flows, flood stages, flood duration, flood depths, floodwater velocities, and the extent and frequency of flooding. The program also provides information on natural and cultural floodplain resources and flood loss potential. The program has an annual fiscal ceiling of $15 million and is 100% federally funded. Typical FPMS studies include floodplain delineations, dam break analyses, flood warning and preparedness, and nonstructural evaluations. It is not intended for detailed design and construction.
The hydraulic analysis includes documentation of methods, assumptions, and results from the modeling efforts. The hydraulic model utilizes two-dimensional (2D) modeling of the overbank areas to provide a better overflow delineation in the floodplain. The hydraulic modeling presented in this document is referred to as the 2016 LAR FPMS 1D/2D (one-dimensional / two-dimensional) hydraulic model and is based on existing conditions, accounting for the significant vegetation currently in the natural soft bottom reaches of the river.
The City of Los Angeles intends to use the hydraulic modeling for delineating the 1% annual chance exceedance (ACE) or 100-year floodplain for the Federal Emergency Management Agency (FEMA) National Flood Insurance Program (NFIP). The current FEMA flood maps by contrast, show that all flow for the 1% ACE (100-year) flood stays within the channel through the project reach. Portions of the FEMA maps have not been updated since the early 1980’s and were determined to not represent current existing conditions.
Inundation maps are presented for the 1% ACE (100-year) and 0.2% ACE (500-year) floods for the existing condition, which includes vegetation in the natural soft bottom channel reaches. Flood mitigation options are not addressed in this report.

Hydraulics Report Flood Plain Management Services Special Study, Los Angeles River
2
1.2 Project Location and Description of the FPMS Reach
The FPMS Reach of the LAR covers approximately 13 miles, extending from Barham Boulevard in Burbank, California to First Street in Los Angeles, California. The hydraulic model extends from Barham Boulevard to approximately 1,000 feet downstream from First Street. The FPMS Reach includes four tributary channels, including: Burbank Western Channel, Burbank Eastern Channel, Verdugo Wash, and Arroyo Seco. Plate 1 displays the project location.
The drainage area of the LAR FPMS Reach is approximately 465 square miles at the upstream end and approximately 580 square miles at the downstream end. Three upstream dams (Sepulveda, Hansen, and Lopez) operated by the USACE have a controlled drainage area of approximately 304 square miles. The controlled drainage area includes Los Angeles County dams upstream from the project location (Devil’s Gate, Pacoima, and Big Tujunga). Plates 2 and 3 show the location of the dams in relation to the project location. Therefore, there is approximately 276 square miles of uncontrolled area contributing flow to the project location (approximately 48%). Surface runoff from uncontrolled area enters the local drainage system and flows at relatively high velocities towards the LAR. The local storm drain system is operated and maintained primarily by Los Angeles County Department of Public Works (LACDPW) and city municipalities.
1.3 General Description of the Los Angeles County Drainage Area
The LAR is a primary river within the Los Angeles County Drainage Area (LACDA) watershed, which lies mostly in Los Angeles County, California, although portions lie in San Bernardino and Orange Counties. Plate 2 displays the location of the FPMS Reach in relation to the LACDA watershed. The watershed is abutted on the east by the Santa Ana River Watershed, on the north by the Antelope Valley and Santa Clara River Watersheds, and on the west by the Calleguas Creek Watershed. The project area is located along the main stem of LAR within the Burbank, Glendale, and Los Angeles city limits.
Elevations in the San Gabriel and Santa Susana Mountains, which form the northern boundary of the watershed, vary from 3,000 feet in the west to over 9,000 feet in the east. The Santa Monica Mountains and Puente Hills separate the San Fernando and San Gabriel valleys from the coastal plain, and range from 500 to 1,500 feet in height.
The LAR is a principal stream in the LACDA watershed. The LAR has a drainage area of 824 square miles at the downstream end (Pacific Ocean), and the drainage area includes the Rio Hondo above Whittier Narrows Dam and its tributaries. The San Gabriel River has a drainage area of 635 square miles at the downstream end (Pacific Ocean). The Rio Hondo Diversion Channel brings water from the San Gabriel River system to the lower LAR by way of Whittier Narrows Dam and may effectively increase the drainage area of the LAR during periods of high runoff.

Hydraulics Report Flood Plain Management Services Special Study, Los Angeles River
3
The principal tributaries of the LAR include: Pacoima and Tujunga Washes, both of which drain portions of the Santa Susana Mountains and the San Fernando Valley, Verdugo Wash, which drains portions of the Verdugo Hills; and the Arroyo Seco, which starts in the San Gabriel Mountains and then heads south to the LAR (Plate 3). The main channel of the LAR is approximately 51 miles long and its tributaries have an aggregate length of about 225 miles. Operations and maintenance for specific channel reaches is divided between the USACE and LACDPW.
1.4 Survey and Mapping
In total, three surveys were used to develop the geometry data for the 2016 LAR FPMS 1D/2D hydraulic model. The channel portion of the hydraulic model is a combination of As-Built construction plans for the concrete reaches and aerial mapping, completed in 2008, for the natural soft bottom channel reaches. The overbank area uses topographic mapping provided by the City of Los Angeles. Plate 4 displays the areas within the LAR FPMS area that use each survey source. The survey data described below was re-projected to North American Datum (NAD) 1983 Lambert Conformal Conic horizontal projection.
The USACE prepared geo-referenced hydraulic models for the Upper LAR as part of the Stormwater Management Plan (SWMP) in 2005 (Reference A). As-Built construction plans were used to develop the hydraulic model geometry for the LACDA Upper LAR hydraulic models. The as-built construction plans were used for the concrete reaches within the study reach.
The USACE developed survey and mapping products including digital terrain models (DTMs), triangulate irregular networks (TINs), and orthographic photographs for the project area based on a 2008 aerial survey flight. The 2008 survey was completed using North American Datum (NAD) 1983 California State Plane 5 with units in feet. Elevations are also in feet and based on the 1988 North American Vertical Datum (NAVD). The scale of the survey data is 1 inch equals 200 feet with 2-foot contour intervals (Reference B). The 2008 survey data was used for the vegetated reaches within the study reach.
The overbank area within the hydraulic model uses Los Angeles Region Imagery Acquisition Consortium (LARIAC) survey data completed in 2006 (Reference C). The LARIAC topographic data was provided by the City of Los Angeles using a horizontal projection in NAD 1983 California State Plane 5 with units in feet. The elevations are in feet with a 4-foot contour interval. The data is based on NAVD 1988 vertical datum.
Hydrologic Engineering Center - River Analysis System (HEC-RAS) was used to model the channel geometry for the natural soft bottom reaches and concrete reaches. The channel geometry within HEC-RAS was converted to a channel terrain dataset using the HEC-RAS Mapper software program. The channel terrain dataset was then merged with (burned into) the LARIAC terrain dataset to get a final terrain dataset that was used for the floodplain mapping.

Hydraulics Report Flood Plain Management Services Special Study, Los Angeles River
4
1.5 Special Notice
This Special Study was conducted under the guidelines of Section 206 of the Flood Control Act of 1960, as amended. Under the 206 Authority, reports and studies of this type provide a variety of floodplain information to local governments. However, local, state, and Federal environmental documentation and associated permits are not part of the authorized program. Section 206 studies and reports are not authorized to duplicate other regulatory Authorities or programs, for example, Flood Insurance Studies or their revisions under the National Flood Insurance Program. Section 206 studies may not be used to perform detailed engineering design, nor construct flood control projects. It is intended that this study be used for planning purposes only, as a guide to assist communities in formulating floodplain management decisions. The conclusions presented in this report have not been developed for purposes of determining the feasibility of a Federal Interest in constructing a Flood Risk Management Project along any of the watercourses investigated. Federal interest in the construction of a flood control project is an involved process, which is conducted under one or more different Authorities (other than Section 206), in accordance with a specific set planning guidelines.

Hydraulics Report Flood Plain Management Services Special Study, Los Angeles River
5
2.0 HYDRAULIC MODEL DEVELOPMENT
2.1 Hydrology Overview
The hydrology that determined the flow rates used in this analysis is based on the 1991 Los Angeles County Drainage Area Final Feasibility Interim Report (References D, E, and F). The discharge-frequency analysis for undisturbed, uncontrolled, gaged mountain watersheds were the foundation for all subsequent hydrologic investigations. Discharge-frequency analyses for gaged natural mountain basins conformed to the procedures described in Water Resources Council (WRC) Bulletin 17B “Guidelines for determining Flood Flow Frequency.” The annual series of peak flows were fitted to the Log-Pearson Type III probability distribution, using the station skew in each case. No specific guidelines are provided in WRC Bulletin 17B for controlled or urban watershed discharge-frequency analyses. Table 1 provides the design discharges. Table 3 provides peak discharges for the 1% ACE (100-year) and 0.2 % ACE (500-year) floods for the FPMS Reaches which are defined in Section 2.4.
Table 1. Los Angeles River Design Discharges
FPMS Reach ID
Upstream Extent Downstream Extent Design
Discharge (cfs)1
Reach 1 1,000 Feet Upstream of
Barham Boulevard Burbank Western
Channel Confluence 40,000
Reach 2 Burbank Western Channel
Confluence 1,000 Feet Downstream of I-5 Bridge (Burbank)
40,000
Reach 3 1,000 Feet Downstream of
I-5 Bridge (Burbank)
Brazil Street (Downstream of Verdugo Wash
40,000 to 78,000
Reach 4 Brazil Street (Downstream
of Verdugo Wash Los Feliz Boulevard 78,000
Reach 5 Los Feliz Boulevard State Route 2 Freeway 78,000
Reach 6 State Route 2 Freeway I-5 Freeway 78,000 to
83,700
Reach 7 I-5 Freeway North Main Street 83,700 to 104,000
Reach 8 North Main Street 1,000 Feet Downstream
of First Street 104,000
1. Design Discharge in cfs from Hydrology Appendix to 1991 LACDA Feasibility Report

Hydraulics Report Flood Plain Management Services Special Study, Los Angeles River
6
2.2 Previous Hydraulic Models
The hydrology is based on the 1991 Los Angeles County Drainage Area Final Feasibility Interim Report (References D, E, and F). Previous hydraulic models for the study reach include hydraulic models completed in 2005 and 2012 for the SWMP and Ecosystem Restoration Study, respectively.
The USACE generated design models using HEC-RAS and prepared a SWMP report in 2005 to present the updated hydraulic analyses. The 2005 LACDA Upper LAR hydraulic models (Reference G) used as-built construction plans to develop the HEC-RAS model geometry. The geometries for these models only covered the channel cross-sectional area. The purpose was to create HEC-RAS models for the channels and determine the water surface elevations for the design discharges. The 2005 SWMP models include the LAR FPMS Reach.
As part of an initial phase of the ecosystem restoration study, the USACE used updated geospatial techniques and re-georeferenced a portion of the 2005 LAR SWMP hydraulic model (Reference H) within the City of Los Angeles limits. The cross-sections were extended to cover a portion of the overbank area which ultimately covered the 0.2% ACE event (500-yr) floodplain. This model was used to develop the 2012 Ecosystem Restoration Study hydraulic model (Reference I).
2.3 Hydraulic Model Overview
The hydraulic model was developed using HEC-RAS version 5.0.1. RAS Mapper was used to determine floodplain delineations for the 1% ACE (100-year) and 0.2% ACE (500-year) floods along with flow depth grids. ArcGIS was used to view the floodplains and HEC-GeoRAS was used to determine downstream reach lengths for the hydraulic model.
2.3.1 Current Condition
For this study, the USACE created an existing condition hydraulic model that includes current vegetation in the channel reaches. The hydraulic model is a combined 1D/2D model that incorporates the concrete channel geometry based on the 2005 LACDA Upper LAR hydraulic models (Reference G) and topographic mapping from 2008 developed by USACE for the vegetated channel reaches. This hydraulic model was updated to include overbank areas based on the 2006 LARIAC topographic data provided by the City of Los Angeles. The 2016 LAR FPMS 1D/2D hydraulic model encompasses the LAR from Barham Boulevard to First Street as well as the downstream reaches of Burbank Western Channel, Verdugo Wash, and the Arroyo Seco. Changes were made from the 2005 hydraulic model in order to delineate 1% ACE (100-year) and 0.2% ACE (500-year) floodplain maps.
In December 2016, temporary flood protection barriers were placed along the Los Angeles River within the study reach. Based on the National Weather Service Climate Prediction Center

Hydraulics Report Flood Plain Management Services Special Study, Los Angeles River
7
forecasting larger rainfall amounts during the El Nino Winter 2016 flood season, the USACE conducted a review of the current channel conditions to assess the existing capacity and overall condition of the channel. As part of an emergency response, the USACE installed approximately 17,000 linear feet of temporary flood protection barriers and removed approximately 3.7 acres of native and non-native vegetation near Riverside Drive / Victory Boulevard. The Los Angeles River Channel Assessment Engineering Report (Reference J) documents the emergency response and the engineering evaluation for the placement of the flood protection barriers.
The hydraulic model developed for this study does not include the flood protection barriers as these were considered a temporary flood protection measure. The barriers are not considered a permanent solution for increasing the conveyance capacity within the study reach and are not included in the analysis. The model does account for the removal of vegetation around the Riverside Drive / Victory Boulevard Bridge that was completed in January 2016.
2.3.2 Combined One-Dimensional and Two Dimensional Hydraulic Model
In the hydraulic model, the flow is a combined 1D/2D unsteady-state analysis whereby the channel cross-section is 1D and the overbanks are 2D flow areas. The combined 1D/2D assumption is applicable for current conditions since flows inside the channel can be analyzed in one direction and the flows in the overbank can be analyzed in two directions. The unsteady flow model uses a two-day hydrograph that has a varying discharge with respect to time, whereas a steady flow model uses a peak discharge value and does not have a time factor.
One-dimensional models, while generally efficient, are unable to simulate flow in multiple directions since they represent the topography as cross-sections rather than as a surface. One-dimensional models are best suited for in-channel flows and when floodplain flows are minor and in the direction of main channel flow. Hydraulic jumps in the 1D channel can cause drastic changes in water surface in the overbanks, which may not be representative of the overland flow. To overcome the 1D disadvantages, a combined 1D channel and 2D overbank area (unsteady flow) model was developed and is referred to as the 2016 LAR FPMS 1D/2D hydraulic model.
In 2D hydraulic modeling, flow is allowed to move in multiple directions based on geometric features and is not confined to the direction perpendicular to the main channel as with 1D modeling. Two-dimensional modeling is accomplished by adding computational grid (mesh) elements into the model. Two-dimensional hydraulic modeling with HEC-RAS is based on a computational grid that preprocesses hydraulic property tables from the underlying terrain. This retains the detail of the terrain instead of averaging the terrain into one data point per cell. Selecting the grid cell size for a 2D flow area is an iterative process that depends on the underlying terrain, velocity of flow, and the overall size of the model.

Hydraulics Report Flood Plain Management Services Special Study, Los Angeles River
8
2.4 Reach Assignments
The FPMS Reach includes eight designated reaches based on the channel invert material, covering 13 miles along the LAR. The LAR channel consists primarily of trapezoidal or rectangular prismatic reaches with concrete side slopes and a concrete invert. Some reaches within the study area are trapezoidal channels with grouted riprap side slopes and an earthen invert, or natural soft bottom, with vegetation. The first soft bottom reach extends approximately 0.9 miles from about 500 feet downstream of the Burbank Western Channel Confluence to approximately 1,000 feet downstream of the Interstate 5 (I-5) Freeway Bridge (Reach 2). The second soft bottom reach extends approximately 5.9 miles from approximately 2,000 feet downstream of the Verdugo Wash Confluence to the second I-5 Bridge near the Arroyo Seco Confluence (Reaches 4, 5, and 6). Plate 4 shows the location of the natural soft bottom and concrete reaches. Reaches 4 and 5 mostly consist of a natural soft bottom channel invert aside from two sections of concrete lined channel invert under the Los Feliz Boulevard and Glendale Boulevard Bridges. The Burbank Western Channel Confluence occurs between Reach 1 and Reach 2. The Verdugo Wash Confluence occurs in Reach 3, and the Arroyo Seco Confluence occurs in Reach 7. The 2016 LAR FPMS 1D/2D hydraulic model reaches are displayed on Plates 6 to 8 along with the points of interest along the study reach. Table 2 presents the reaches within the study area.
Table 2. Study Reach Descriptions
FPMS Reach ID
Upstream Extent Downstream Extent Channel Invert
Type
Reach 1 1,000 Feet Upstream of
Barham Boulevard Burbank Western Channel
Confluence Concrete
Reach 2 Burbank Western Channel
Confluence 1,000 Feet Downstream of
I-5 Bridge (Burbank) Soft Bottom /
Dense Vegetation
Reach 3 1,000 Feet Downstream of
I-5 Bridge (Burbank) Brazil Street (Downstream
of Verdugo Wash Concrete
Reach 4 Brazil Street (Downstream
of Verdugo Wash Los Feliz Boulevard
Soft Bottom / Dense Vegetation
Reach 5 Los Feliz Boulevard State Route 2 Freeway Soft Bottom /
Dense Vegetation
Reach 6 State Route 2 Freeway I-5 Freeway Soft Bottom /
Dense Vegetation
Reach 7 I-5 Freeway North Main Street Concrete
Reach 8 North Main Street 1,000 Feet Downstream of
First Street Concrete

Hydraulics Report Flood Plain Management Services Special Study, Los Angeles River
9
2.5 River Stationing
The 2016 LAR FPMS 1D/2D hydraulic model includes LAR river stations (RS) 1+00 to 692+94. River station 692+94 is the upstream extent of the model and is located approximately 1,000 feet upstream of Barham Boulevard. River station 1+00 is the downstream extent, terminus, of the model and is located approximately 1,000 feet downstream of First Street.
Detailed maps for the point of interest along the study reach are displayed in Plates 5 to 8. Reach flow characteristics, design discharges and design freeboard, are presented on Table 3. The letters “a” and “b” in the FPMS Reach ID in Table 3 indicate a change in design discharge within a study reach. The design discharges were developed with consideration for freeboard in the channel ranging from 1 to 17 feet along the study reach.
Table 3. Los Angeles River Design Discharge and Freeboard
FPMS Reach ID1
Upstream River Station
Downstream River Station
Design Discharge
(cfs)
1% ACE Peak
Discharge (cfs)
0.2% ACE Peak
Discharge (cfs)
Reach 1a 694+77 625+77 40,000 76,800 103,000 Reach 1b 625+77 547+45 40,000 81,000 109,000 Reach 2 546+45 510+05 40,000 88,900 118,000 Reach 3a 504+93 477+85 40,000 88,900 118,000 Reach 3b 475+68 452+58 78,000 94,600 125,000 Reach 4 432+16 359+75 78,000 94,600 125,000 Reach 5 358+63 271+89 78,000 94,600 125,000 Reach 6a 270+28 262+73 78,000 94,600 125,000 Reach 6b 257+85 144+23 83,700 93,800 118,000 Reach 7a 142+91 131+22 83,700 93,800 118,000
Reach 7b 128+71 86+61 104,000 109,000 141,000
Reach 8 86+07 0+00 104,000 109,000 141,000 1. Letters "a" and "b" denote a break in the reach due to a confluence or flow change
2.6 Two-Dimensional Computational Mesh Extents
The 2016 LAR FPMS 1D/2D model consists of 2D flow areas covering the left and right overbanks. The 2D flow areas on the right and left banks extend from the upstream cross-section (upstream of Barham Boulevard) to the downstream cross-section (downstream of First Street). The 2D computational mesh connects to the 1D channel and varies in width and total extent. The mesh extends across the floodplain from the top of the river banks to high ground on both sides of the channel. Plates 9 to 11 display the 2D computational mesh extents and other hydraulic modeling components.

Hydraulics Report Flood Plain Management Services Special Study, Los Angeles River
10
2.7 Grid Cell Size
Two-dimensional hydraulic modeling with HEC-RAS is based on a computational mesh that preprocesses hydraulic property tables from the underlying terrain. This retains the detail of the terrain instead of averaging the terrain into one elevation value per cell. Selecting the grid cell size for a 2D flow area is an iterative process that depends on the underlying terrain, velocity of flow, and the overall size of the model. For the 2016 LAR FPMS 1D/2D hydraulic model, 250-foot grids were developed and a computational time step of 2 seconds is used to meet the Courant conditions for model stability. There are approximately ninety-two hundred grid cells in the computational mesh. While the grid cell size was set to 250 feet x 250 feet (structured square grids), some grid cells are unstructured (not square) and have less than 250-foot grid cell size.
2.8 Lateral Structures
Lateral structures were used to connect channel cross-sections with the overbank area. Lateral structures can represent the top of a levee. Lateral structures use the standard weir equation to calculate the amount of flow that overtops the channel bank and enters the overbank area.
2.9 Break Lines
Break lines are added to a 2D computational mesh in order to align the cell edges with high ground. Aligning the cell edges with high ground ensures that barriers to flow such as berms, levees, and roadway embankments are correctly represented in the computational mesh. Without break lines flow may cross a high ground barrier prematurely, thus inaccurately representing the flood inundation extents. ArcGIS was used to develop a shapefile of the break lines to add to the HEC-RAS model. Over fifty break lines were added in order to refine the computational mesh. These locations include, but are not limited to, major roads and embankments. Plates 9 to 11 displays the locations of all break lines added to the computational mesh.
2.10 Roughness Coefficients
The selection process for the Manning’s roughness coefficients (“n” value) varies based on many parameters such as vegetation type and density and soil surface conditions. Manning’s “n” values are used to estimate the friction between the water and the ground surface, and a higher value indicates more surface roughness. Determining Manning’s “n” values can be accomplished through various levels of analysis including the use of a single value for the entire watershed 2D computational mesh or manually digitizing regions of different terrain classifications and assigning Manning’s “n” values.
The hydraulic model uses horizontally varying Manning’s “n” values across the main channel for the reaches that have natural soft bottom inverts in the channel cross-sections (1D portion). The natural bottom reaches, which include areas of dense vegetation and sediment deposition, have Manning’s “n” values based on Chow’s Open Channel Hydraulics (Reference K) as follows:

Hydraulics Report Flood Plain Management Services Special Study, Los Angeles River
11
0.035 – Clean Straight, Full, no rifts or deep pools, more stones and weeds
0.06 – Light brush and trees
0.11 – Heavy stands of timber, few down trees, little undergrowth, and flow into branches.
Manning’s “n” values were selected using site visit and aerial photos. The concrete lined sections of the hydraulic model were assigned a Manning’s “n” value of 0.014 (concrete-lined, smooth) based on As-Built construction drawings and pertinent data tables for the LAR. For the 2D mesh, a Manning's “n” value of 0.12 was used for the overbank areas based on the HEC-RAS 2D Modeling User Manual (Reference L) and is consistent with the previous study USACE Corps Water Management System (CWMS) model for the LACDA Watershed (Reference M).

Hydraulics Report Flood Plain Management Services Special Study, Los Angeles River
12
2.11 Bridges
Twenty-five bridges cross the LAR within the study area. The bridge parameters were determined from plan and profile drawings, field measurements, and previous hydraulic models. Table 4 presents a list of the bridges that cross the LAR within the study area.
Table 4. Bridges in Study Area
River Station
Bridge Number of Piers
Bridge Method
682+24 Barham Boulevard 4 X 661+97 Warner Brothers Studio Gate #7 0 X 596+22 State Route 134 Freeway 1 X 529+43 Riverside Drive / Victory Boulevard 4 Y 515+90 Interstate 5 Freeway 2 Y 476+00 State Route 134 Freeway 1 X 431+85 Colorado Boulevard 2 Y 359+31 Los Feliz Boulevard 5 X 336+95 Sunnynook Drive (Pedestrian Bridge) 6 Y 326+00 Glendale Boulevard - Hyperion Avenue 5 X 283+78 Fletcher Drive 6 Y 271+11 State Route 2 Freeway 4 Y 143+64 Interstate 5 Freeway 1 X 136+76 Riverside Drive 1 X 134+04 Union Pacific Railroad 1 X 131+38 State Route 110 Freeway 0 X 110+96 MTA Railroad 2 X 10²+52 North Broadway 2 X 97+78 North Spring Street 1 X 86+42 North Main Street 2 X 65+75 Union Pacific Railroad 2 X 63+38 Union Pacific Railroad 2 X 38+15 Cesar Chavez Avenue 0 X 30+13 United States Route 101 0 X 10+69 First Street 1 X
Bridge Method X. Modeled as a lidded cross-section with blocked obstructions for piers and debris on piers.
Bridge Method Y. Modeled as bridge and used floating debris feature at piers.

Hydraulics Report Flood Plain Management Services Special Study, Los Angeles River
13
2.11.1 Bridge Piers
Table 4 presents the list of bridges and the number of piers for each. Based on Los Angeles District Hydrology & Hydraulics Policy Memorandum No. 4 (Reference N), 2 feet of floating debris was added to each side of all piers that measure 6 feet or less in width (transverse direction). For piers with sloping noses, the debris depth was set to 6 feet below the water surface elevation. Floating debris was not added to piers greater than 6 feet in width.
The policy memorandum is based on experience from past floods and physical model studies that indicate sloping pier extensions in high velocity flows are quite effective in moving debris up the slope out of the water and thereby preventing significant debris accumulation. Plates 9 to 11 display the locations of the bridges that cross the LAR within the study area.
2.11.2 Bridge Modeling Approach
For low flow conditions, the bridge modeling approach for bridges without piers was set to the Energy Only (Standard Step) computational method. For bridges with piers, the highest energy solution between: (1) Energy Only (Standard Step), (2) Momentum, and (3) Yarnell (Class A only) was selected.
For high flow conditions, the Energy Only (Standard Step) method was used for bridges that have sufficient freeboard between the bridge soffit and the water surface and the pressure and/or weir method was used for bridges that are likely to experience pressurized flow and/or weir flow during a high flow event.
2.11.3 Changes from Previous Hydraulic Models
The 2016 LAR FPMS 1D/2D hydraulic model includes three changes in how bridges are modeled compared to previous hydraulic models for the LAR. Riverside Drive was updated based on USACE 408 permit number EE2009-036 drawings (Reference O) and is currently under construction as of October 2016.
All upstream and downstream cross-sections were moved away from the bridge faces. Cross-sections spaced/located too closely together can overestimate energy loss, precipitate errors, and may eventually lead to numerical instability. The cross-section elevations were adjusted appropriately based on changes in the invert slopes. By moving the cross-sections further than 1 foot from the bridge face (as previously modeled), water surface elevations are calculated more efficiently within HEC-RAS, which improves the hydraulic calculations at the bridges.
The third change included converting all bridge data within the concrete invert sections to lidded cross-sections with piers modeled as blocked obstructions. Pier debris was modeled as a blocked obstruction as required based on Los Angeles District Hydrology & Hydraulics Policy Memorandum No. 4 (Reference N). This method of modeling bridges allows for improved model stability for unsteady analysis in concrete reaches.

Hydraulics Report Flood Plain Management Services Special Study, Los Angeles River
14
2.12 Flow Data
The 2016 LAR FPMS 1D/2D hydraulic model was set up to include hydrographs for the 1% ACE (100-year) and 0.2% ACE (500-year) events as requested by the City of Los Angeles for the purposes of floodplain mapping. The hydrographs used in the 2D hydraulic analysis are based on the 1% ACE (100-year) two-day baseline condition hydrographs at concentration points (CPs) along the LAR. Concentration points are based on the 1991 Los Angeles County Drainage Area Final Feasibility Interim Report (Reference E). Table 5 presents the CPs for the study area.
Table 5. Concentration Points near Study Area
Concentration Point
Description
12 Los Angeles River below Tujunga Wash 125 Los Angeles River at Barham Boulevard
BW Los Angeles River below Burbank
Western 17 Los Angeles River below Verdugo Wash 201 Los Angeles River at Sycamore Wash
21 Los Angeles River below Arroyo Seco
Hydrographs for Los Angeles River below Tujunga Wash (CP 12), Los Angeles River below Verdugo Wash (CP 17), and Los Angeles River below Arroyo Seco (CP 21) were used in the hydraulic analysis. Flow hydrographs for CP 12, CP 17, and CP 21 are presented in Figures 1, 2, and 3, respectively. These three 1% ACE (100-year) flood hydrographs were used to ratio up the peak discharges (both 1% ACE (100-year) and 0.2% ACE (500-year) events) presented in Table 1 and were used to generate the hydrographs for the 2016 LAR FPMS 1D/2D model.
The Los Angeles River below Tujunga Wash hydrograph was interpolated (based on peak discharge) for the inflow hydrograph at the upstream extent of the hydraulic model. Since the upstream boundary for the hydraulic model is downstream from the concentration point, the flood hydrographs were interpolated based on the increase in peak discharge from the concentration point to the upstream boundary above Barham Boulevard. Barham Boulevard is nearly 3 miles downstream from the concentration point. Figure 4 displays the 1% ACE (100-year) and 0.2% ACE (500-year) flood hydrographs.
The tributaries along the study reach (Burbank Western Channel, Verdugo Wash, and Arroyo Seco) are modeled as lateral inflows. Tributary backwater flows are not captured in the model for these reaches as all flooding is due to flow from the LAR. The hydrographs for these lateral inflows were created by taking the difference discharge from the upstream hydrograph and the lateral inflow location hydrograph. Lateral inflows are assumed to be the coincident inflow of all tributaries and include local drainage at the respective concentration point. The lateral inflow

Hydraulics Report Flood Plain Management Services Special Study, Los Angeles River
15
hydrographs are displayed in Figures 5 to 7. Table 6 presents the hydraulic model external boundary conditions.
Table 6. Hydraulic Model External Boundary Conditions
Reach Description River
Station
1% ACE Coincident Peak Discharge (cfs)
0.2% ACE Coincident Peak Discharge (cfs)
Reach 1 Upstream Boundary Condition
Inflow Hydrograph 692+94 76,800 103,000
Reach 2 Lateral Inflow Downstream of Burbank-Western Confluence
548+45 12,100 15,000
Reach 3 Lateral Inflow Downstream of
Verdugo Wash Confluence 475+68 24,550 32,050
Reach 7 Lateral Inflow Downstream of
Arroyo Seco Confluence 128+71 25,000 30,250
Discharges in cfs from Hydrology Appendix to 1991 LACDA Feasibility Study
2.13 Boundary Conditions
Boundary conditions are necessary to establish the starting water surface at the ends of the river system (upstream and downstream). In order to keep the peak flow and volumes of the flooding events, scaled 1% ACE (100-year) and 0.2% ACE (500-year) flood hydrographs (See Figure 4) were calculated for the upstream boundary condition using the 1% ACE (100-year) flood hydrograph for the Los Angeles River below Tujunga Wash (CP 12) flood hydrograph. The downstream boundary condition was set to normal depth. Table 6 presents the peak discharges for the 1% ACE (100-year) and 0.2% ACE (500-year) for the upstream boundary condition and lateral inflows. Numerous side drains enter the LAR within the study area. These smaller inflows from the side drains are accounted for in the main channel flow and are not accounted for individually. Water surface elevations in the LAR may impact storm drain hydraulics.
2.14 Flow Regime
Mixed flow regime was used because concrete lined channel segments tend to flow supercritical and natural channel segments tend to flow subcritical. The hydraulic model output, which was used to define the flood profiles and the overflow boundaries, reflects a mixed flow regime with both supercritical and subcritical flow.
2.15 Ineffective Flow Areas
Ineffective flow areas were used in the 1D channel cross-sections portion of the model to account for non-conveying flow areas near bridges and tributaries and in locations that experienced sudden contraction or expansion of flow. Such areas were determined using aerial photography, contours, topographic survey data, and engineering judgment.

Hydraulics Report Flood Plain Management Services Special Study, Los Angeles River
16
(THIS PAGE INTENTIONALLY LEFT BLANK)

Hydraulics Report Flood Plain Management Services Special Study, Los Angeles River
17
Notes: Los Angeles County Drainage Area Final Feasibility Final Report, Appendix A Part I & II Hydrology, December 1991
FLOOD PLAIN MANAGEMENT SERVICES SPECIAL STUDY LOS ANGELES RIVER FPMS REACH
FLOODPLAIN ANALYSIS Base Condition 1% ACE Hydrographs
U.S. ARMY CORPS OF ENGINEERS LOS ANGELES DISTRICT
Figure 1. Los Angeles River below Tujunga Wash – CP 12
0
10,000
20,000
30,000
40,000
50,000
60,000
70,000
0 6 12 18 24 30 36 42 48
Flow (cfs)
Time (Hours)
1% ACE (100‐year)
Max 1% ACE: 64,500 cfs

Hydraulics Report Flood Plain Management Services Special Study, Los Angeles River
18
Notes: Los Angeles County Drainage Area Final Feasibility Final Report, Appendix A Part I & II Hydrology, December 1991
FLOOD PLAIN MANAGEMENT SERVICES SPECIAL STUDY LOS ANGELES RIVER FPMS REACH
FLOODPLAIN ANALYSIS Base Condition 1% ACE Hydrographs
U.S. ARMY CORPS OF ENGINEERS LOS ANGELES DISTRICT
Figure 2. Los Angeles River below Verdugo Wash – CP 17
0
10,000
20,000
30,000
40,000
50,000
60,000
70,000
80,000
90,000
100,000
0 6 12 18 24 30 36 42 48
Flow (cfs)
Time (Hours)
1% ACE (100‐Year)
Max 1% ACE: 94,600 cfs

Hydraulics Report Flood Plain Management Services Special Study, Los Angeles River
19
Notes: Los Angeles County Drainage Area Final Feasibility Final Report, Appendix A Part I & II Hydrology, December 1991
FLOOD PLAIN MANAGEMENT SERVICES SPECIAL STUDY LOS ANGELES RIVER FPMS REACH
FLOODPLAIN ANALYSIS Base Condition 1% ACE Hydrographs
U.S. ARMY CORPS OF ENGINEERS LOS ANGELES DISTRICT
Figure 3. Los Angeles River below Arroyo Seco – CP 21
0
10,000
20,000
30,000
40,000
50,000
60,000
70,000
80,000
90,000
100,000
110,000
120,000
0 6 12 18 24 30 36 42 48
Flow (cfs)
Time (Hours)
1% ACE (100‐year)Max 1% ACE: 109,000 cfs

Hydraulics Report Flood Plain Management Services Special Study, Los Angeles River
20
Notes: Barham Blvd 1% and 0.2% ACE hydrographs interpolated from the Los Angeles River below Tujunga Wash 1% ACE (100-year) hydrograph
FLOOD PLAIN MANAGEMENT SERVICES SPECIAL STUDY LOS ANGELES RIVER FPMS REACH
FLOODPLAIN ANALYSIS 1% and 0.2% ACE Hydrographs
U.S. ARMY CORPS OF ENGINEERS LOS ANGELES DISTRICT
Figure 4. Los Angeles River Upstream Boundary Condition upstream of Barham Boulevard
0
10,000
20,000
30,000
40,000
50,000
60,000
70,000
80,000
90,000
100,000
110,000
0 6 12 18 24 30 36 42 48
Flow (cfs)
Time (Hour)
1% ACE (100‐year)
0.2% ACE (500‐year)
Max 1% ACE: 76,800 cfsMax 0.2% ACE: 103,000 cfs

Hydraulics Report Flood Plain Management Services Special Study, Los Angeles River
21
Notes: Difference between Barham Blvd and Burbank Western 1% ACE (100-year) and 0.2% ACE (500-year) hydrographs
FLOOD PLAIN MANAGEMENT SERVICES SPECIAL STUDY LOS ANGELES RIVER FPMS REACH
FLOODPLAIN ANALYSIS Lateral Inflow 1% and 0.2% ACE Hydrographs
U.S. ARMY CORPS OF ENGINEERS LOS ANGELES DISTRICT
Figure 5. Lateral Inflow Downstream of Burbank Western Confluence
0
2,000
4,000
6,000
8,000
10,000
12,000
14,000
16,000
0 6 12 18 24 30 36 42 48
Flow (cfs)
Time (Hours)
1% ACE (100‐year)
0.2% ACE (500‐year)
Max 500-year: 15,000 cfs
Max 100-year: 12,100 cfs

Hydraulics Report Flood Plain Management Services Special Study, Los Angeles River
22
Notes: Difference between Burbank-Western and Verdugo Wash 1% ACE (100-year) and 0.2% ACE (500-year) hydrographs
FLOOD PLAIN MANAGEMENT SERVICES SPECIAL STUDY LOS ANGELES RIVER FPMS REACH
FLOODPLAIN ANALYSIS Lateral Inflow 1% and 0.2% ACE Hydrographs
U.S. ARMY CORPS OF ENGINEERS LOS ANGELES DISTRICT
Figure 6. Lateral Inflow Downstream of Verdugo Wash
0
5,000
10,000
15,000
20,000
25,000
30,000
35,000
0 6 12 18 24 30 36 42 48
Flow (cfs)
Time (Hours)
1% ACE (100‐year)
0.2% ACE (500‐year)
Max 100-year: 24,550 cfsMax 500-year: 32,050 cfs

Hydraulics Report Flood Plain Management Services Special Study, Los Angeles River
23
Notes: Difference between Verdugo Wash and Arroyo Seco 1% ACE (100-year) and 0.2% ACE (500-year) hydrographs
FLOOD PLAIN MANAGEMENT SERVICES SPECIAL STUDY LOS ANGELES RIVER FPMS REACH
FLOODPLAIN ANALYSIS Lateral Inflow 1% and 0.2% ACE Hydrographs
U.S. ARMY CORPS OF ENGINEERS LOS ANGELES DISTRICT
Figure 7. Lateral Inflow Downstream of Arroyo Seco Confluence
0
5,000
10,000
15,000
20,000
25,000
30,000
35,000
0 6 12 18 24 30 36 42 48
Flow (cfs)
Time (Hours)
1% ACE (100‐year)
0.2% ACE (500‐year)
Max 100 yr: 25,000 cfsMax 500 yr: 30,250 cfs

Hydraulics Report Flood Plain Management Services Special Study, Los Angeles River
24
(THIS PAGE INTENTIONALLY LEFT BLANK)
Hydraulics Report Flood Plain Management Services Special Study, Los Angeles River
25
3.0 FLOODPLAIN ANALYSES
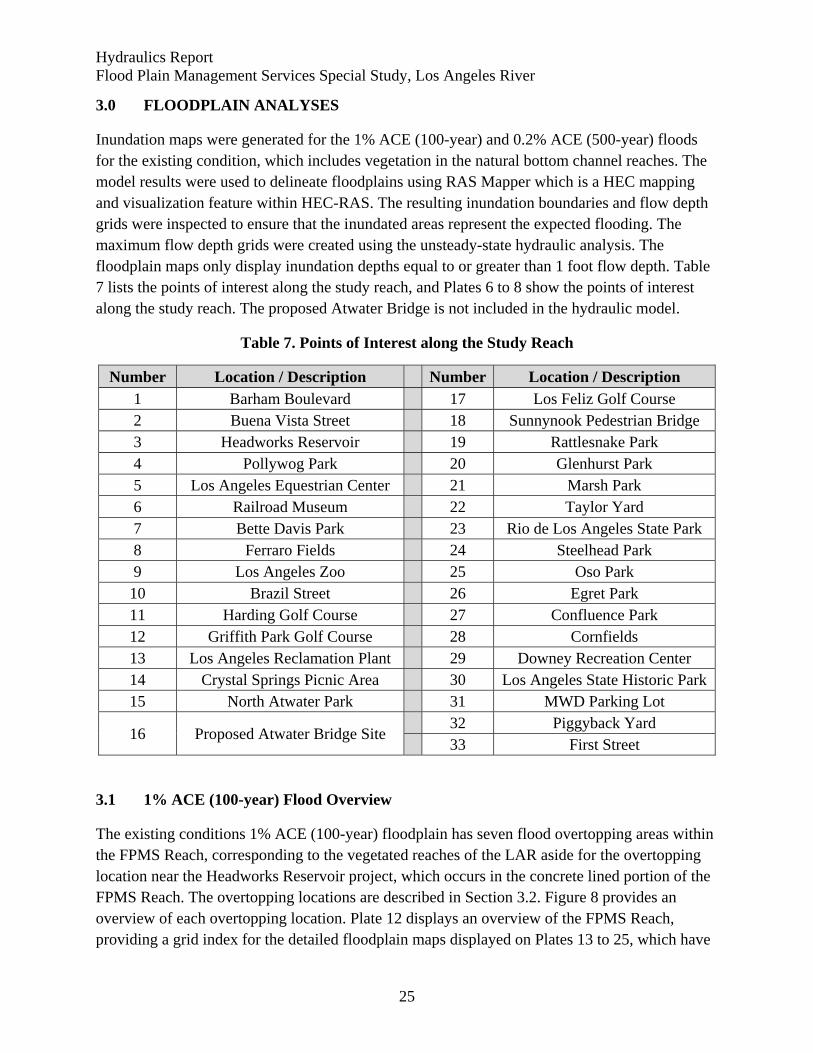
Inundation maps were generated for the 1% ACE (100-year) and 0.2% ACE (500-year) floods for the existing condition, which includes vegetation in the natural bottom channel reaches. The model results were used to delineate floodplains using RAS Mapper which is a HEC mapping and visualization feature within HEC-RAS. The resulting inundation boundaries and flow depth grids were inspected to ensure that the inundated areas represent the expected flooding. The maximum flow depth grids were created using the unsteady-state hydraulic analysis. The floodplain maps only display inundation depths equal to or greater than 1 foot flow depth. Table 7 lists the points of interest along the study reach, and Plates 6 to 8 show the points of interest along the study reach. The proposed Atwater Bridge is not included in the hydraulic model.
Table 7. Points of Interest along the Study Reach
Number Location / Description Number Location / Description 1 Barham Boulevard 17 Los Feliz Golf Course 2 Buena Vista Street 18 Sunnynook Pedestrian Bridge 3 Headworks Reservoir 19 Rattlesnake Park 4 Pollywog Park 20 Glenhurst Park 5 Los Angeles Equestrian Center 21 Marsh Park 6 Railroad Museum 22 Taylor Yard 7 Bette Davis Park 23 Rio de Los Angeles State Park 8 Ferraro Fields 24 Steelhead Park 9 Los Angeles Zoo 25 Oso Park 10 Brazil Street 26 Egret Park 11 Harding Golf Course 27 Confluence Park 12 Griffith Park Golf Course 28 Cornfields 13 Los Angeles Reclamation Plant 29 Downey Recreation Center 14 Crystal Springs Picnic Area 30 Los Angeles State Historic Park 15 North Atwater Park 31 MWD Parking Lot
16 Proposed Atwater Bridge Site 32 Piggyback Yard 33 First Street
3.1 1% ACE (100-year) Flood Overview
The existing conditions 1% ACE (100-year) floodplain has seven flood overtopping areas within the FPMS Reach, corresponding to the vegetated reaches of the LAR aside for the overtopping location near the Headworks Reservoir project, which occurs in the concrete lined portion of the FPMS Reach. The overtopping locations are described in Section 3.2. Figure 8 provides an overview of each overtopping location. Plate 12 displays an overview of the FPMS Reach, providing a grid index for the detailed floodplain maps displayed on Plates 13 to 25, which have

Hydraulics Report Flood Plain Management Services Special Study, Los Angeles River
26
1 inch = 500 feet mapping scale. The floodplain maps only display inundation depths equal to or greater than 1 foot based on FEMA requirements for floodplain mapping.
Figure 8. Los Angeles River 1% ACE (100-year) Flood: Overtopping Locations

Hydraulics Report Flood Plain Management Services Special Study, Los Angeles River
27
3.2 1% ACE (100-year) Floodplain Analysis
3.2.1 Right (South) Bank – Headworks Reservoir
From Barham Boulevard to the Burbank Western Channel Confluence (including Reach 1), the LAR is overtopped at multiple locations with flooding occurring along the channel banks. The flooding in this area mostly re-enter the main channel without inundating structures.
The first overtopping location occurs just upstream from the Headworks Reservoir project as overflow enters the excavated area with flow depths up to 15 feet along the right (south) bank. The Headworks Reservoir is an active construction project as of October 2016, and the LARIAC terrain provided by the City of Los Angeles shows the project area as an excavated pit (which is not the final project condition). The volume of overtopping flow for the 1% ACE (100-year) flood at this location is insignificant. The site conditions (excavated pit versus construction completed) at the Headworks Reservoir would not likely impact the floodplain for the 1% ACE (100-year) flood. Flooding along the left (north) bank inundates a vegetated area between the channel and the California State Route 134 Freeway (SR-134) with flow depths up to 3 feet. Plates 13 and 14 display the 1% ACE (100-year) floodplain for this area.
3.2.2 Right (South) and Left (North) Bank - Riverside Drive / Victory Boulevard
The second overtopping location occurs between the Burbank Western Channel Confluence and the Verdugo Wash Confluence (Reach 2), which has flow depths up to 20 feet in the overbank areas on the north and south sides of the channel. Reach 2 of the LAR has dense vegetation in the channel and includes the Riverside Drive / Victory Boulevard and I-5 bridge crossings.
The flooded area includes the residential community along the north bank between the Burbank Western Channel and the I-5 Bridge, including Bette Davis Park. Along the south bank (right bank looking downstream), the floodplain shows inundation of the SR-134 Freeway and Zoo Drive in Griffith Park, including the Railroad Museum (Plate 15). The overbank flow also impacts Ferraro Fields with flow depths up to 5 feet (Plate 16).
The overbank flooding along the right (south bank) that began near Riverside Drive bridge crossing continues to flow along Zoo Drive in Griffith Park, inundating parking areas for the Los Angeles Zoo and stretches of I-5 and SR-134 (Plate 16). The overbank flooding continues along the right (west) bank for approximately 2.5 miles before the flows re-enter the LAR. Interstate 5 would be impacted with flood waters during a 1% ACE (100-year) flood. Griffith Park including the golf course has flood depths up to 20 feet in this area (Plates 16 and 17).
3.2.3 Left (East) Bank – Downstream of Verdugo Wash Confluence
The third overtopping location occurs along the left (east) bank (looking downstream) in Reach 4 approximately 0.5 miles downstream from the Verdugo Wash Confluence when the channel transitions from concrete lined in Reach 3 to soft bottom (with dense vegetation) in Reach 4 near

Hydraulics Report Flood Plain Management Services Special Study, Los Angeles River
28
Brazil Street. The overbank flooding extends downstream to Los Feliz Boulevard with flow depths up to 15 feet. The impacted area includes residential houses, commercial buildings, Atwater Park, the Los Angeles Reclamation Plant, and Los Feliz Golf Course. The overbank flooding inundates a large section of Los Feliz Boulevard before re-entering the channel shortly downstream (Plates 16 to 18).
3.2.4 Right (West) Bank – Griffith Park Area
A fourth overtopping location occurs on the right (west) bank approximately 2,000 feet upstream from Los Feliz Boulevard, inundating Griffith Park and I-5 with flow depths up to 15 feet (Reach 4). The overbank flooding extends approximately 1.5 miles downstream before re-entering the channel downstream from the Glendale Boulevard Bridge crossing (Plates 18 and 19). Interstate 5 would be inundated with flood depths up to 15 feet from the stretch that begins upstream of Los Feliz Boulevard southward past Glendale Boulevard.
3.2.5 Left (East) Bank – North of Glendale Boulevard
A fifth overtopping location occurs north of the Glendale Boulevard Bridge crossing along the left (east) bank with flow depths up to 15 feet. The impacted area (Reach 5) includes residential houses. The inundated area extends approximately 2,000 feet and ponds alongside the channel (Plate 19). The overbank flooding from the fifth overtopping location would likely connect with the overbank flooding from the third overtopping location for flood events less frequent than the 1% ACE (100-year) flood. The overbank flooding ponds at the southern end at Glendale Boulevard.
3.2.6 Left (East) Bank – Glendale Boulevard to State Route 2 Freeway
A sixth overtopping location occurs in Reach 5 (vegetated channel reach) along the left (east) bank between Glendale Boulevard and Silver Lake Boulevard, inundating residential homes. The overbank flooding ponds in this area behind the levee with flow depths up to 15 feet, extending downstream past Fletcher Drive to the SR-2 Freeway (Plates 19 and 20).
3.2.7 Right (West) Bank – State Route 2 Freeway
A seventh overtopping location occurs in Reach 6 (vegetated channel reach) along the right (west) bank between Fletcher Drive and SR-2 with flow depths up to 5 feet in the residential community. The overbank flooding occurs downstream of the SR-2 Freeway Bridge and inundates residential and commercial areas with flow depths up to 15 feet. The flooding extends approximately 2.5 miles along the right (west) bank downstream from SR-2 to the I-5 Bridge crossing. The inundated area impacts several streets and houses along the right (west) bank and extends westward to I-5 (Plates 20 to 22).

Hydraulics Report Flood Plain Management Services Special Study, Los Angeles River
29
Downstream from the I-5 Bridge near the Arroyo Seco Confluence, the flows stay in the channel through Reaches 7 and 8 (concrete-lined) downstream to the end of the study area at First Street (Plates 22 to 25).
3.3 0.2% ACE (500-year) Flood Overview
Floodplain delineations for the 0.2% ACE (500-year) flood are displayed on Plates 26 to 39. Plate 26 displays an overview of the FPMS Reach, providing a grid index for the detailed floodplain maps displayed on Plates 27 to 39, which display floodplains with 1 inch = 500 feet mapping scale. The existing conditions 0.2% ACE (500-year) floodplain has seven overtopping locations within the FPMS Reach. These correspond to concrete-lined and vegetated reaches of the LAR.
3.4 0.2% ACE (500-year) Floodplain Analysis
The overtopping locations are similar to those from the 1% ACE (100-year) flood shown in Figure 8. The 0.2% ACE (500-year) floodplains have similar overtopping locations as the seven overtopping locations discussed in the 1% ACE (100-year) floodplain analysis and have larger inundated areas with increased flow depths compared to the 1% ACE (100-year) floodplains.
3.4.1 Right (South) Bank – Headworks Reservoir
Minor overtopping flow along the channel banks occurs from Barham Boulevard to Buena Vista Street (upstream from Reach 1). The first overtopping location for the 0.2% ACE (500-year) flood occurs at the Headworks Reservoir construction project (Reach 1) along the south (right) bank. The volume of overtopping flow for the 0.2% ACE (500-year) flood at this location is significant compared to the 1% ACE (100-year) flood. The site condition (excavated pit versus construction completed) at the Headworks Reservoir could impact the floodplain since the LARIAC terrain provided by the City of Los Angeles shows the project area as an excavated pit, which could misrepresent floodplain storage. The flow depths reach up to 20 feet in the project area and inundate a portion of Forest Lawn Drive. Overbank flooding along the left (north) bank in the same area inundates a vegetated area between the channel and the SR-134 Freeway with flow depths up to 5 feet. Plates 27 and 28 display the 0.2% ACE (500-year) floodplain for this area.
3.4.2 Right (South) and Left (North) Bank - Riverside Drive
The second overtopping location occurs along the left (north) bank in Reach 1 just upstream from the Burbank Western Channel Confluence with flow depths up to 10 feet in the Los Angeles Equestrian Center. The channel in this reach is concrete lined. The inundated area extends east to I-5, inundating residential areas and Bette Davis Park with flow depths up to 20 feet. The natural bottom channel with dense vegetation begins just downstream from the

Hydraulics Report Flood Plain Management Services Special Study, Los Angeles River
30
confluence. The floodplain in Reach 2 is similar to the 1% ACE (100-year) flood along the right (south) bank (Plates 28 and 29) with a larger inundation extent.
3.4.3 Between Verdugo Wash and Arroyo Seco Confluences
The overtopping locations along Reaches 4, 5 and 6 from Brazil Street to I-5 (Between Verdugo Wash and Arroyo Seco Confluences) are similar to the flooding described in the 1% ACE (100-year) floodplain analysis. The flow depths in these area are up to 20 feet, impacting commercial and residential areas, freeways, major roads, and public park areas. Plates 30 to 36 display the floodplains for Reaches 4, 5, and 6.
The 0.2% ACE (500-year) flood does not overtop the channel bank in Reaches 7 and 8 from Arroyo Seco to the downstream study area limits near First Street (Plates 36 to 39). The channel in this area is concrete lined and near channel capacity. The flow is within the freeboard zone, but does not break out of the channel. Freeboard is the residual bank height above the calculated water surface elevation and freeboard requirements are presented in Table 2.
3.5 Comparison to Previous Floodplains
The most noticeable difference between the floodplains presented along with this document and those produced in 1991 (References D, E, and F) is the large inundation area that has been removed in the current 1% ACE event (100-yr) and the 0.2% ACE (500-yr) in the downtown area from North Broadway to First Street. The hydraulic model results were closely scrutinized, and it was determined the volume and duration for flow exceeding the channel capacity was not sufficient to generate the relatively large inundation areas. The flow exceeding channel capacity was determined to cause street flooding close to the channel and be non-damaging. The flooding is a result of the dense vegetation in the channel. Plates 40 to 42 display the base condition 1% ACE (100-year) and 0.2% ACE (500-year) floodplains from the 1991 Los Angeles County Drainage Area Final Feasibility Interim Report (References D, E, and F). The current FEMA flood maps by contrast, show that all flow for the 100-year event stays within the channel throughout the project reach. Portions of the FEMA maps have not been updated since the early 1980’s and were determined to not represent current conditions.
3.6 Conclusion
The FPMS study floodplain analysis for the 1% ACE (100-year) and 0.2 % ACE (500-year) floods shows significant flooding in the overbanks of the LAR at multiple locations from Barham Boulevard upstream to the Arroyo Seco Confluence downstream. The floodplain results were a result of 1D/2D hydraulic analysis using HEC-RAS 5.0.1. Flow does not break out of the LAR downstream from the Arroyo Seco Confluence for either the 1% ACE (100-year) or 0.2% ACE (500-year) floods, which is different from the 1991 base condition floodplains displayed on Plates 40 to 42. Flood mitigation options are not addressed in this report.

Hydraulics Report Flood Plain Management Services Special Study, Los Angeles River
31
The City of Los Angeles intends to prepare a Letter of Map Revision (LOMR) application to FEMA with the technical data for floodplain analysis that is provided in this report. FEMA may require levee owner(s) to certify the existing levee and/or explain in detail the technical data used in the study. The purpose of the LOMR is for re-delineation of the 1% ACE (100-year) floodplain for the LAR within the study reach.
3.6.1 1% ACE (100-year) Flood
The City of Los Angeles estimates that nearly 4,000 parcels are impacted by the 1% ACE (100-year) floodplain. The average flood depths in the overbank areas are between 5 to 10 feet, with a maximum of 18 feet in Griffith Park. The approximate area of inundation is 1,100 acres.
3.6.2 0.2% ACE (500-year) Flood
The City of Los Angeles estimates that more than 4,000 parcels are impacted by the 0.2% ACE (500-year) floodplain. The average flood depths in the overbank areas are between 5 to 15 feet, with a maximum of 22 feet in Griffith Park. The approximate area of inundation is 1,400 acres.

Hydraulics Report Flood Plain Management Services Special Study, Los Angeles River
32
(THIS PAGE INTENTIONALLY LEFT BLANK)

Hydraulics Report Flood Plain Management Services Special Study, Los Angeles River
33
4.0 REFERENCES
A. U.S. Army Corps of Engineers, Los Angeles District, Upper Los Angeles River, Los Angeles County Drainage Area, Stormwater Management Plan, July 2005.
B. U.S. Army Corps of Engineers, Los Angeles District, Topographic Survey – Los Angeles River, 2008.
C. Los Angeles Region Imagery Acquisition Consortium, LiDAR Topographic Survey – Los Angeles River, 2005.
D. U.S. Army Corps of Engineers, Los Angeles District, Los Angeles County Drainage Area Final Feasibility Final Report, December 1991.
E. U.S. Army Corps of Engineers, Los Angeles District, Los Angeles County Drainage Area Final Feasibility Final Report, Appendix A Part I & II Hydrology, December 1991.
F. U.S. Army Corps of Engineers, Los Angeles District, Los Angeles County Drainage Area Final Feasibility Final Report, Appendix B Hydraulics, December 1991.
G. U.S. Army Corps of Engineers, Los Angeles District, Upper Los Angeles River – Reach 2 hydraulic models, Los Angeles County Drainage Area, 2005.
H. U.S. Army Corps of Engineers, Los Angeles District, Los Angeles River Stormwater Management Plan hydraulic model, Upper Los Angeles River – Reach 2, 2008.
I. U.S. Army Corps of Engineers, Los Angeles District, Los Angeles River Ecosystem Restoration Study hydraulic model, 2012.
J. U.S. Army Corps of Engineers, Los Angeles District, Los Angeles River Channel Assessment Engineering Report, 2016.
K. Chow, V. T., Open Channel Hydraulics, McGraw-Hill, New York, 1959. L. U.S. Army Corps of Engineers, Hydrologic Engineering Center, HEC-RAS, River
Analysis System Hydraulic Reference Manual, February 2016. M. U.S. Army Corps of Engineers, Los Angeles District, Los Angeles County Drainage Area
(LACDA) Corps Water Management System (CWMS) hydraulic model, 2015. N. U.S. Army Corps of Engineers, Los Angeles District, Hydrology & Hydraulics Policy
Memorandum No. 4, August 2004. O. U.S. Army Corps of Engineers, Los Angeles District, 408 Permit # EE2009-036, April
2009. P. U.S. Army Corps of Engineers, Los Angeles District, Memorandum - Vegetation
Clearing in Los Angeles River – Burbank Western Channel to Arroyo Seco, for USACE Operations Branch, dated 17 March 2004.

Hydraulics Report Flood Plain Management Services Special Study, Los Angeles River
34
(THIS PAGE INTENTIONALLY LEFT BLANK)