(this is a sample cover image for this issue. the actual...
TRANSCRIPT

(This is a sample cover image for this issue. The actual cover is not yet available at this time.)
This article appeared in a journal published by Elsevier. The attachedcopy is furnished to the author for internal non-commercial researchand education use, including for instruction at the authors institution
and sharing with colleagues.
Other uses, including reproduction and distribution, or selling orlicensing copies, or posting to personal, institutional or third party
websites are prohibited.
In most cases authors are permitted to post their version of thearticle (e.g. in Word or Tex form) to their personal website orinstitutional repository. Authors requiring further information
regarding Elsevier’s archiving and manuscript policies areencouraged to visit:
http://www.elsevier.com/copyright

Author's personal copy
Remote sensing of canopy light use efficiency in temperate and boreal forests ofNorth America using MODIS imagery
Chaoyang Wu a,b,⁎, Jing M. Chen a, Ankur R. Desai c, David Y. Hollinger d, M. Altaf Arain e, Hank A. Margolis f,Christopher M. Gough g, Ralf M. Staebler h
a Department of Geography and Program in Planning, University of Toronto, 100 St. George St., Toronto, ON, Canada M5S 3G3b The State Key Laboratory of Remote Sensing Science, Institute of Remote Sensing Applications, Chinese Academy of Sciences, Beijing, 100101, Chinac Department of Atmospheric & Oceanic Sciences, University of Wisconsin-Madison, Madison, WI, USAd USDA Forest Service, Northern Research Station, 271 Mast Rd., Durham, NH, USAe School of Geography and Earth Sciences, McMaster University, Hamilton, Ontario, Canada L8S 4K1f Center d'Études de la Forêt, Faculté de Foresterie, de Géographie et de Géomatique, Université Laval, Québec, QC, Canadag Department of Evolution, Ecology, and Organismal Biology, Ohio State University, Columbus, OH 43210, USAh Science & Technology Branch, Environment Canada, Toronto, ON, Canada
a b s t r a c ta r t i c l e i n f o
Article history:Received 19 July 2011Received in revised form 18 November 2011Accepted 21 November 2011Available online xxxx
Keywords:Light use efficiencyClimate changeCarbon cycleEddy covarianceForestsRemote sensing
Light use efficiency (LUE) is an important variable characterizing plant eco-physiological functions and refersto the efficiency at which absorbed solar radiation is converted into photosynthates. The estimation of LUE atregional to global scales would be a significant advantage for global carbon cycle research. Traditionalmethods for canopy level LUE determination require meteorological inputs which cannot be easily obtainedby remote sensing. Here we propose a new algorithm that incorporates the enhanced vegetation index (EVI)and a modified form of land surface temperature (Tm) for the estimation of monthly forest LUE based onModerate Resolution Imaging Spectroradiometer (MODIS) imagery. Results demonstrate that a modelbased on EVI×Tm parameterized from ten forest sites can provide reasonable estimates of monthly LUE fortemperate and boreal forest ecosystems in North America with an R2 of 0.51 (pb0.001) for the overalldataset. The regression coefficients (a, b) of the LUE–EVI×Tm correlation for these ten sites have beenfound to be closely correlated with the average EVI (EVI_ave, R2=0.68, p=0.003) and the minimum landsurface temperature (LST_min, R2=0.81, p=0.009), providing a possible approach for model calibration.The calibrated model shows comparably good estimates of LUE for another ten independent forest ecosystemswith an overall rootmean square error (RMSE) of 0.055 g C permol photosynthetically active radiation. These re-sults are especially important for the evergreen species due to their limited variability in canopy greenness. Theusefulness of this new LUE algorithm is further validated for the estimation of gross primary production (GPP)at these sites with an RMSE of 37.6 g Cm−2 month−1 for all observations, which reflects a 28% improvementover the standardMODISGPPproducts. These analyses shouldbe helpful in the furtherdevelopment of ecosystemremote sensing methods and improving our understanding of the responses of various ecosystems to climatechange.
© 2011 Elsevier Inc. All rights reserved.
1. Introduction
Forest ecosystems play an important role in global carbon seques-tration (Beer et al., 2010; Zhao & Running, 2010). Annual global car-bon uptake by vegetation, also referred to as gross primaryproduction (GPP), is around 123±8 petagrams of carbon per year(Beer et al., 2010). However, substantial variations in GPP areobserved among different models and ecoregions, both at plant and
stand levels, and these discrepancies illustrate the limits to our fullunderstanding of the global carbon cycle.
Light use efficiency (LUE), defined as the amount of carbon fixedin photosynthesis per unit of absorbed solar radiation, is an importantvariable for the estimation of GPP from satellite inputs when usingthe Monteith equation (Monteith, 1972):
GPP ¼ LUE � APAR ð1Þ
where APAR is the absorbed photosynthetically active radiationcalculated as the product of an absorbed fraction (fAPAR) and theamount of incident photosynthetically active radiation (PAR).
Remote Sensing of Environment 118 (2012) 60–72
⁎ Corresponding author at: Department of Geography and Program in Planning,University of Toronto, 100 St. George St., Toronto, ON, Canada M5S 3G3. Tel.: +1 647524 0310.
E-mail address: [email protected] (C. Wu).
0034-4257/$ – see front matter © 2011 Elsevier Inc. All rights reserved.doi:10.1016/j.rse.2011.11.012
Contents lists available at SciVerse ScienceDirect
Remote Sensing of Environment
j ourna l homepage: www.e lsev ie r .com/ locate / rse

Author's personal copy
Typical methods for the simulation of LUE require prior specificationof a maximum LUE (ε0) for a specific land cover type and additionalinput of climate variables (e.g., temperature, water stress) representingcanopy stresses that modulate this maximum LUE (Running et al.,2004). This method has been useful in productivity models, such asthe Moderate Resolution Imaging Spectroradiometer (MODIS) GPPproduct (Running et al., 2004) and the Vegetation PhotosynthesisModel (Xiao et al., 2004). However, the dependence on input climatevariables and biome-scale maximum LUE can cause significantdeviation from observed GPP (Heinsch et al., 2006; Mu et al., 2011;Zhao et al., 2006).
With ongoing improvements in our ability to remotely sense theland surface, there has been an increase in efforts to directly inferLUE using these observations. For example, the photochemical reflec-tance index (PRI), defined as a normalized difference index using re-flectance at 531 and 570 nm, is suggested to have potential intracking LUE both at the leaf scale based on ground spectral measure-ments (Filella et al., 2009; Gamon et al., 1997) and satellite observa-tions (Drolet et al., 2005, 2008; Goerner et al., 2009; Hall et al.,2008; Hall et al., 2011; Hilker et al., 2009). However, PRI shows highsensitivity to various extraneous effects such as canopy structureand the view observer geometry, which prevents its use at landscapeand global scales and requires the appropriate upscaling algorithmsto account for structural differences in vegetation (Hilker et al.,2010). Hilker et al. (2008) shows that while isotropic PRI scatteringis correlated to LUE variation, geometric scattering can be attributedto canopy level shading. Therefore, remote sensing of forest LUE fromspace would be achieved by measuring PRI as a function of shadowfraction using multi-angle observations (Hall et al., 2008), which isfurther confirmed by the relationship between spaceborne PRI andcanopy shadow fractions (Hilker et al., 2009). A theoretical conceptusing a canopy reflectance model proposed by Hall et al. (2011)recently further validates that using PRI alone to predict canopy LUE isconfounded by the shadow fraction viewed by the sensor.
A thorough analysis of PRI is shown in Garbulsky et al. (2011),indicating that calibration of the PRI-LUE relation across biomes anda careful attention to potentially confounding factors are both neededfor future improvement. Apart from PRI, Inoue et al. (2008)demonstrate that a number of bands centered at the red edge andnear-infrared ranges also have potential in deriving indicators ofLUE for a wheat canopy. Correlations are reported between LUE anda number of vegetation indices, including the normalized differencevegetation index (NDVI, Rouse et al., 1974) and the enhance vegeta-tion index (EVI, Huete et al., 2002) in crop (Wu et al., 2010, 2009)and peatland ecosystems (Schubert et al., 2010). However, thepotential of a certain vegetation index as a proxy of LUE across biomesand the underlying mechanism are still unknown (Huemmrich et al.,2010; Zhang et al., 2009), probably due to a number of influencingfactors, including temperature, soil moisture, vapor pressure deficit(VPD) and light quality (Coops et al., 2010).
Two specific aspects of knownvariations in LUEneed to be consideredfor use in operational algorithms related to the use of vegetation indices.First, environmental effects of temperature andwater stress considerablymodify LUE and cannot be interpreted by a single vegetation index. Theseenvironmental controls likely limit the competency of productivitymodels that incorporate vegetation indices under drought conditions(Mu et al., 2011; Sims et al., 2008, 2006). A second uncertainty is theapplication of only a single vegetation index in evergreen biomes thatshow low dynamic ranges in greenness but potentially large variationsin LUE (Garbulsky et al., 2008; Nakaji et al., 2008). Hence, environmentalvariables are potentially helpful in resolving these present limitations inremotely sensed LUE. A possible candidate among those climate variablesis air temperature (Ta) because of its importance in influencing themagnitude and timing of plant growth (Chen et al., 2003), ecosystemrespiration (Tang et al., 2008), LUE (Schwalm et al., 2006), and its corre-lation with other environmental variables, such as vapor pressure deficit
(VPD) and PAR (Sims et al., 2008). This potential has been demonstratedin previous studies, such as the MODIS GPP product which uses temper-ature and VPD to reduce LUE under unfavorable conditions (Running etal., 2004; Zhao et al., 2006). However, the dependence on the require-ments of meteorological inputs at desired temporal and spatial scalesgenerally limits its global application (Mu et al., 2011).
With the availability of global carbon flux data that can be used tocalculate canopy level LUE for multiple ecosystems (Baldocchi, 2008),it is possible to validate and compare the candidate LUE models andtheir impacts on GPP for a broad array of forest types. Here wepresent a methodology for estimating monthly LUE using MODISobservations and compare simulated values against LUE derivedfrom flux measurements obtained from multiple temperate and borealforest sites within North America. MODIS-derived EVI and land surfacetemperature (LST) are examined for their potential in estimatingmonthly LUE across biomes. The objectives of this study are: (1) toanalyze the potential of EVI in evaluatingmonthly LUE for both decidu-ous forests and evergreen forests, (2) to derive a new model that canprovide better estimates of monthly LUE using the MODIS EVI and LSTobservations, and (3) to show the usefulness of the new LUE algorithmin the estimation of forest GPP. This effort could result in an improvedalgorithm for remote sensing of GPP and aid in understanding of terres-trial carbon cycle-climate feedbacks in forested ecosystems.
2. Materials and methods
2.1. Study sites
We focused on twenty forest sites in the North American fluxnetworks, including twelve deciduous forests (DF) and eightevergreen forests (EF) (Fig. 1). Half of these sites, composed of fiveDF and five EF, were used to derive the LUE model and the remainingsites were used for validation. Detailed descriptions of these sites areshown in Table 1.
2.2. Flux and meteorological measurements
Flux data for the nine Canadian sites were downloaded from theFluxnet-Canada Data Information System (http://www.fluxnet-canada.ca) while data for the other eleven AmeriFlux sites wereacquired from http://public.ornl.gov/ameriflux/dataproducts.shtml.For all sites, months with modeled total GPP equal to or below zero orthemean Ta below zerowere not used. To runmodels at amonthly tem-poral scale, sums ofmonthly precipitation and PARwere also generated.
For the Canadian sites, a standard procedure was used to estimateannual net ecosystem production (NEP) and to partition NEP intocomponents of GPP and ecosystem respiration (Re) from gap-filledhalf-hourly measurements (Barr et al., 2004). Empirical regressionsof nighttime NEE to temperature and daytime GPP to PAR wereused to estimate GPP and Re and fill gaps as discussed in more detailin Barr et al. (2004).
For the AmeriFlux sites, level-4 monthly products were used for themonthly GPP, air temperature (Ta) and radiation measurements. Thesedata were gap-filled with the Artificial Neural Network (ANN) method(Papale & Valentini, 2003) and/or the Marginal Distribution Sampling(MDS) method (Reichstein et al., 2005). Flags with informationregarding the quality of the original and gap-filled datawere also added.
Desai et al. (2008) show that while partitioning methods can causeGPP or Re estimates to vary widely (~20%), using consistentmethodology across sites allows for robust characterization ofdifferences in GPP and Re across space and time. This is because fluxtower NEE generally constrains GPP and Re to a range of magnitudesthat do not strongly depend on partitioning technique, but care mustbe taken in this process, as discussed in more detail in Desai et al.(2008).
61C. Wu et al. / Remote Sensing of Environment 118 (2012) 60–72

Author's personal copy
2.3. MODIS products
Three derived MODIS land surface products were used in thisstudy. These data for each site were acquired at the Oak Ridge Nation-al Laboratory's Distributed Active Archive Center (DAAC) website(http://www.modis.ornl.gov/modis/index.cfm). The first is the 16-day Terra MODIS vegetation index product (MOD13Q1, 250 m,collection 5) that provides both NDVI and EVI computed fromatmospherically corrected bi-directional surface reflectance whichhave been masked for water, clouds, heavy aerosols, and cloudshadows. For each site, both NDVI and EVI were extracted from3×3 MODIS pixels centered on the flux tower similar to the approachused by Sims et al. (2008). The 3×3 MODIS pixels method was alsochecked at each site with respect to both footprints (~1 km) andland cover (Chen et al., 2011).
The second product is the MODIS GPP product (MOD17A2, 1 km,collection 5.1), which is included in this study for model comparison.MODIS GPP is driven by daily MODIS landcover, fAPAR/LAI and
interpolated surface meteorology at 1 km for the global vegetatedland surface (Zhao et al., 2006). This product is calculated using LUEas:
GPP ¼ εmax �m T minð Þ �m VPDð Þ � FPAR� SWrad� 0:45 ð2Þ
where εmax is themaximumLUEobtained from lookup tables on the basisof vegetation type. The scalers m(Tmin) and m(VPD) reduce εmaxunderunfavorable conditions of low temperature and high VPD. Tmin, VPDand SWrad are obtained from large spatial-scale meteorological datasets that are available from the NASA Global Modeling and AssimilationOffice (GMAO) (http://gmao.gsfc.nasa.gov/).
The most recent update to the 8-day GPP products also correctsprevious issues arising from cloud contamination (Zhao et al., 2006).Since it is not straightforward to determine which pixel the tower foot-print primarily falls in, we have applied both the central and meanvalues of 3×3 pixels. Preliminary results indicated that the latterprovided better correlation with GPP from flux measurements, and
Fig. 1. Spatial distribution of the twenty sites in this study, DF and EF represent deciduous forest and evergreen forest sites, respectively.
62 C. Wu et al. / Remote Sensing of Environment 118 (2012) 60–72

Author's personal copy
therefore we subsequently relied on that value to estimate MODIS-derived tower GPP.
We also extracted MODIS 8-day Land Surface Temperature (LST)and Emissivity product (MOD11A2, 1 km) derived by applying thegeneralized split-window algorithm. In the split-window algorithm,emissivity in bands 31 and 32 are estimated from land cover types,and atmospheric column water vapor and lower boundary air surfacetemperature are separated into tractable sub-ranges for optimalretrieval (Wan, 2008).
2.4. Calculation of LUE
One important step in calculating canopy level LUE is the determi-nation of fAPAR, which is a parameter indicating the green biomasswithin a canopy that absorbs radiation. Given the well establishedcorrelation between NDVI and fAPAR (Fensholt et al., 2004;Huemmrich et al., 2010; Viña & Gitelson, 2005), we used the empiri-cal relationship validated for many AmeriFlux ecosystems (Sims et al.,2006),
f APAR ¼ 1:24NDVI � 0:168 ð3Þ
where the NDVI is extracted from the MODIS vegetation indexproduct.
We use these coefficients because they have been validatedpreviously by Sims et al. (2006) in five of our study sites (US-NR1,US-HO1, US-HA1, US-MMS and CA-MAN), which give moreconfidence in the use of this relationship.
Two other methods of fAPAR calculation were adopted for twospecific sites, providing an opportunity to compare various methodsin LUE calculation. In site US-WCR, radiation at different heightswas measured and therefore the fAPAR can be directly calculated by:
f APAR ¼ PAR30−PAR2
PAR30ð4Þ
where PAR30 and PAR2 represent for the PAR at 30 m and 2 m, whichspan above canopy and below canopy, respectively. The calculation offAPAR has been validated in this site because the relative difference inabove canopy and bottom of canopy PAR is a good measure of trueAPAR (Cook et al., 2008, 2009).
For site US-MMS, where temporal in situ LAI data were available,the fAPAR was calculated using the mean in situ LAI, light extinctioncoefficient (k=0.5) and the following equation (Xiao et al., 2004):
f APAR ¼ 0:95 1� e�kLAI��
ð5Þ
After the calculation of fAPAR, the LUE was determined as,
LUE ¼ GPPf APAR � PAR
ð6Þ
2.5. Structure of this analysis
To give a clear description of the structure of our analysis, weprovided a section about the methods and procedures in the derivingand validation of our model. We first explored the potential of the EVIas an indicator of canopy LUE across all sites as well as the factors thatcan influence this correlation. Then, we used half of all sites, five DFand five EF sites, respectively, to derive a new model that canestimate the canopy LUE with a combination of MODIS EVI and LST.The calibration process was also conducted for these ten sites inorder to determine the coefficients of the predicting model. Thecalibrated model was then validated for the estimation of LUE in theremaining ten independent sites to show the robustness of ouralgorithm. Finally, we further applied this new LUE algorithm forthe estimation of GPP and compared with the standard MODIS GPPfor all sites. Some in-depth discussions on both the perspectives andlimitations of our model were also included.
3. Results
3.1. Relationship between LUE and EVI
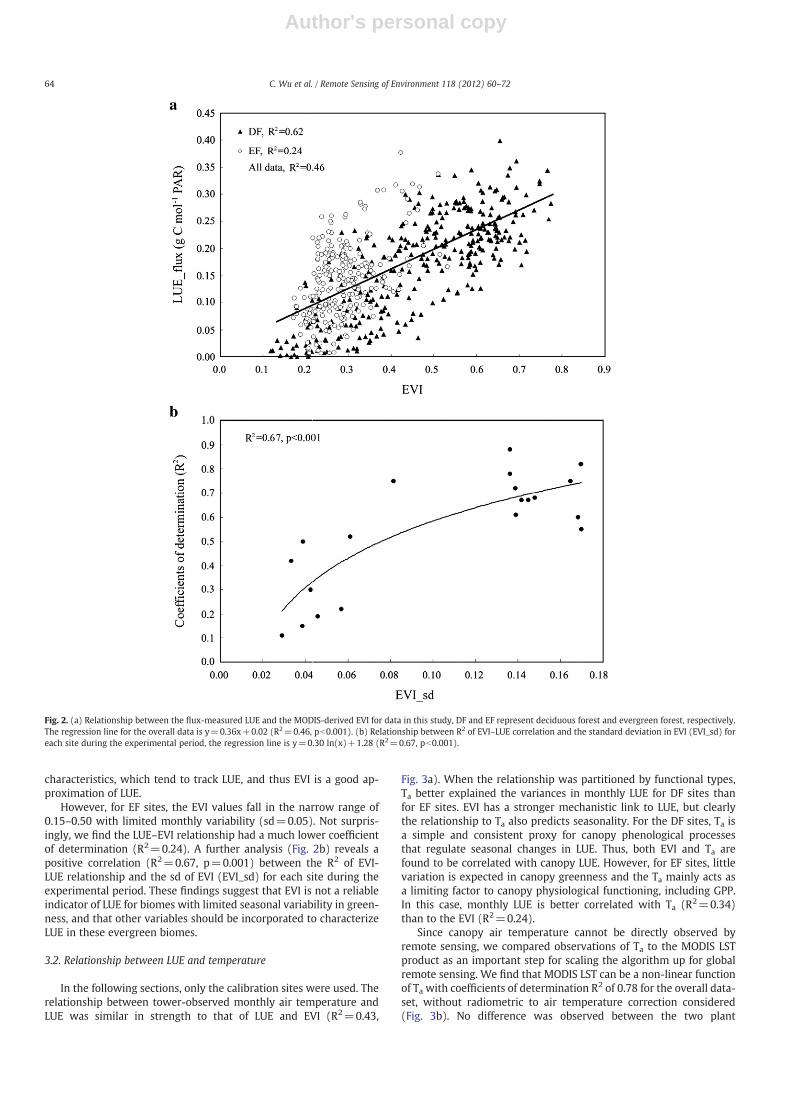
The relationship between all tower-derived monthly LUE andremotely sensed EVI reveals a relationship with a coefficient ofdetermination (R2) equal to 0.46 (Fig. 2a) with evident differencesamong forest functional types. An R2 of 0.62 was found for deciduousforest (DF) sites, suggesting that EVI can better simulate the dynamicsof LUE for ecosystems with wider dynamical ranges in EVI. Forexample, EVI values for DF sites generally fluctuated between 0.15and 0.75 with a mean standard deviation (sd) of among monthsaround 0.15. The LUE in DF sites was closely related to phenological
Table 1Description of flux sites in this study (DF and EF represent deciduous and evergreen forests, respectively).
Code Site name Land cover Latitude Longitude Data range References Note
US-MMS Morgan Monroe State Forest DF 39.3231 −86.4131 2002–2006 Dragoni et al. (2007) Calibration sitesUS-HA1 Harvard Forest DF 42.5378 −72.1715 2003–2006 Urbanski et al. (2007)US-UMB Univ. of Mich. Biological Station DF 45.5598 −84.7138 2002–2006 Curtis et al. (2002)US-WCR Willow Creek DF 45.8059 −90.0799 2002–2006 Cook et al. (2004)US-SYV Sylvania Wilderness DF 46.2420 −89.3477 2002–2006 Desai et al. (2005)US-NR1 Niwot Ridge EF 40.0329 −105.5460 2004–2007 Monson et al. (2005)US-HO1 Main Howland Forest EF 45.2041 −68.7402 2002–2004 Hollinger et al. (2004)CA-OJP Old Jack Pine EF 53.9163 −104.6920 2003–2007 Coursolle et al. (2006)CA-OBS Southern Old Black Spruce EF 53.9871 −105.1177 2003–2007 Barr et al. (2004)CA-QCU Harvested Black Spruce/Jack Pine EF 49.2671 −74.0365 2005–2009 Giasson et al. (2006)US-BAR Bartlett Experimental Forest DF 44.0646 −71.2881 2004–2006 Jenkins et al. (2007) Validation sitesUS-LPH Little Prospect Hill DF 42.5419 −72.1850 2002–2004 Hadley et al. (2008)US-LOS Lost Creek DF 46.0827 −89.9792 2003, 2005 Denning et al. (2003)US-MOZ Missouri Ozark DF 38.7441 −92.2000 2006–2007 Gu et al. (2007)CA-OAS Old Aspen DF 53.6288 −106.1977 2004–2008 Barr et al. (2004)CA-CBO Borden Mixedwood DF 44.3185 −79.9342 2004–2006 Teklemariam et al. (2009)CA-TP4 Turkey Point White Pine 1939 DF 42.7097 −80.3574 2004–2007 Arain et al. (2006)CA-SJ3 Jack Pine 1975 EF 53.8758 −104.6452 2004–2007 Amiro et al. (2006)CA-SJ1 Jack Pine 1994 EF 53.9084 −104.6559 2003–2005 Amiro et al. (2006)CA-MAN Northern Old Black Spruce EF 55.8800 −98.4810 2004–2007 Dunn et al. (2007)
63C. Wu et al. / Remote Sensing of Environment 118 (2012) 60–72
Author's personal copy
characteristics, which tend to track LUE, and thus EVI is a good ap-proximation of LUE.
However, for EF sites, the EVI values fall in the narrow range of0.15–0.50 with limited monthly variability (sd=0.05). Not surpris-ingly, we find the LUE–EVI relationship had a much lower coefficientof determination (R2=0.24). A further analysis (Fig. 2b) reveals apositive correlation (R2=0.67, p=0.001) between the R2 of EVI-LUE relationship and the sd of EVI (EVI_sd) for each site during theexperimental period. These findings suggest that EVI is not a reliableindicator of LUE for biomes with limited seasonal variability in green-ness, and that other variables should be incorporated to characterizeLUE in these evergreen biomes.
3.2. Relationship between LUE and temperature
In the following sections, only the calibration sites were used. Therelationship between tower-observed monthly air temperature andLUE was similar in strength to that of LUE and EVI (R2=0.43,
Fig. 3a). When the relationship was partitioned by functional types,Ta better explained the variances in monthly LUE for DF sites thanfor EF sites. EVI has a stronger mechanistic link to LUE, but clearlythe relationship to Ta also predicts seasonality. For the DF sites, Ta isa simple and consistent proxy for canopy phenological processesthat regulate seasonal changes in LUE. Thus, both EVI and Ta arefound to be correlated with canopy LUE. However, for EF sites, littlevariation is expected in canopy greenness and the Ta mainly acts asa limiting factor to canopy physiological functioning, including GPP.In this case, monthly LUE is better correlated with Ta (R2=0.34)than to the EVI (R2=0.24).
Since canopy air temperature cannot be directly observed byremote sensing, we compared observations of Ta to the MODIS LSTproduct as an important step for scaling the algorithm up for globalremote sensing. We find that MODIS LST can be a non-linear functionof Ta with coefficients of determination R2 of 0.78 for the overall data-set, without radiometric to air temperature correction considered(Fig. 3b). No difference was observed between the two plant
Fig. 2. (a) Relationship between the flux-measured LUE and the MODIS-derived EVI for data in this study, DF and EF represent deciduous forest and evergreen forest, respectively.The regression line for the overall data is y=0.36x+0.02 (R2=0.46, pb0.001). (b) Relationship between R2 of EVI–LUE correlation and the standard deviation in EVI (EVI_sd) foreach site during the experimental period, the regression line is y=0.30 ln(x)+1.28 (R2=0.67, pb0.001).
64 C. Wu et al. / Remote Sensing of Environment 118 (2012) 60–72

Author's personal copy
functional types as comparable correlations were acquired with R2 of0.74 and 0.78 for DF and EF sites, respectively. However, the MODISLST tends to overestimate Ta below 25 °C. The 1 km LST signalmeasures a combination of the radiant temperature of the landsurface and the intervening atmosphere (Goetz et al., 2000). Therole of cloud contamination may be the largest uncertainty in thesedata because of the inherent limitation of the thermal infrared remotesensing, including the failure to remove cloud-contaminated LST, aswell as the different degrees of influence of cloud contaminationbetween estimation of LST and emissivity (Wan, 2008).
A problem with using temperature as an indicator of LUE (Fig. 3c)is the decreasing sensitivity of LUE at high temperature values. Conse-quently, we find logarithmic regressions give the best fit between LUEand Ta or LST. This suggests a declining response to temperature forLUE, probably because Ta is only a good predictor when phenologyis dynamic. Once temperatures reach high values during the growingseason, LUE will show less sensitivity to Ta since phenology has stabi-lized. Therefore, here we provide a modified form of LST (Tm) asbelow:
Tm;i ¼ exp LSTi=LST maxð Þ ð7Þ
where LSTi is the mean ith month temperature and LSTmax is themaximum monthly temperature of the site for experimental years.The exponential transform can improve the LUE sensitivity at hightemperatures. We suspect that incorporating a multi-year maximumtemperature may be potentially helpful for capturing the effects ofboth seasonal and interannual variations of temperature on LUE.
The usefulness of Tm is shown in Fig. 3d where the log transformallows us to produce a linear correlation between LUE and Tm withcoefficient of determination R2 of 0.31 for the overall data. For the
EF sites, no evident effect was observed with the Tm, probablyowing to the low temperature ranges (mean Ta=15.3 °C for all EFsites). However, in contrast, we find R2 of 0.35 for the DF siteswhich have higher monthly temperatures (mean Ta=18.6 °C for allDF sites) and these results highlight the suitability of Tm instead ofLST for LUE remote sensing in DF.
3.3. Estimating LUE using EVI×Tm
Given the relationships between LUE and both EVI and Tm,especially in DF, we developed a new model that incorporates bothEVI and Tm, EVI×Tm, to estimate monthly LUE (Fig. 4). A stronger
Fig. 3. Relationship between the flux-measured LUE (LUE_flux) and temperature at the calibration sites, DF and EF represent deciduous forests and evergreen forests, respectively.(a) Correlation between LUE_flux and Ta, the regression line for overall data is y=0.07ln(x)−0.01 (R2=0.43, pb0.001); (b) Correlation between MODIS LST and Ta from flux mea-surements, the regression line for overall data is y=7.19ln(x)+0.24 (R2=0.78, pb0.001); (c) Correlation between LUE_flux and LST, the regression line for overall data isy=0.07ln(x)−0.03 (R2=0.21, pb0.001); (d) Correlation between LUE_flux and the modified LST (Tm), the regression line for overall data is y=0.11x−0.05 (R2=0.31, pb0.001).
Fig. 4. Relationship between the flux-measured LUE and EVI×Tm for data in this study,DF and EF represent deciduous forests and evergreen forests, respectively. The regres-sion line for the overall data is y=0.11ln(x)+0.20 (R2=0.51, pb0.001).
65C. Wu et al. / Remote Sensing of Environment 118 (2012) 60–72

Author's personal copy
relationship (R2=0.51, pb0.001) is found between LUE and EVI×Tmthan for either variable alone. Improvements are shown for both DF(R2=0.64) and EF (R2=0.40) sites with this newmodel, as indicatedby higher coefficients of determination when compared with eitherEVI or Tm.
The new model is able to replicate the temporal evolution andmagnitude of LUE, but with a range of performance among sites(Table 2). For the DF sites, the highest coefficients R2 of 0.85 areobserved for US-HA1 and the lowest precision is acquired in US-SYVwith R2 of 0.58. The other three DF sites (US-MMS, US-UMB and US-WCR) generally show a similar range of R2 between 0.61 and 0.71.For EF sites, the model generally gives moderate accuracy with R2
ranges from 0.51 for US-NR1 to the largest of 0.64 for CA-QCU.These results indicate that the EVI×Tm can be a potential candidateof LUE for different plant functional types, improving on existingmodels that only use EVI to predict LUE.
With results for these ten sites, the monthly LUE can be estimatedas:
LUE ¼ a ln EVI � Tmð Þ þ b ð8Þ
Significant correlation is observed between the coefficient a andthe average EVI (EVI_ave) of the experimental period with an R2
equals to 0.68 (p=0.003, Fig. 5a). The coefficient b, meanwhile, hasbeen found to be correlated with the minimum monthly LST(LST_min, R2=0.81, p=0.009, Fig. 5b). Therefore, the coefficientsfor the calibrated LUE algorithm can be written as:
a ¼ 0:21EVIPaveþ 0:04b ¼ −0:04 ln LSTPminð Þ þ 0:25 ð9Þ
Fig. 6 shows the comparison between the modeled LUE andmeasured LUE for each site. The use of this model for estimatingLUE in each site shows good agreement, with the largest root meansquare error (RMSE) of 0.068 g Cmol−1 PAR in US-UMB to the lowestof 0.026 g Cmol−1 PAR in US-NR1.
We further used the calibrated model to predict LUE for the tenvalidation sites (Fig. 7). Good estimates of LUE are observed forboth the DF and EF sites with respective R2 of 0.68 and 0.48 and anoverall monthly RMSE of 0.055 g Cmol−1 PAR. The proposed modelgives large improvements for the EF sites indicating the newalgorithm is still suitable for the evergreen forests, even with theprevious caveats raised about weaker relationships among EVI, Tm,and LUE.
3.4. Evaluation of EVI×Tm model performance
As themodel is derived by incorporation of both effects of greennessand temperature on LUE, it is useful to investigate model performanceas a function of variables indicating the regional and biophysical proper-ties of a site. As shown in Fig. 8a, the model performance, indicated bythe R2 of LUE–EVI×Tm relationship, is related to the maximum EVI
(EVI_max, R2=0.56, pb0.001) which implies that the proposedmodel will give better estimates of monthly LUE for ecosystems thathave high EVI values. Interestingly, meanmonthly precipitation (Preci-p_ave) also shows a positive impact on the estimation of LUE usingEVI×Tm (Fig. 8b, R2=0.50, pb0.001, US-LPH, CA-SJ1, CA-SJ3 and CA-MAN were excluded due to unavailable of precipitation data).
4. Discussions
4.1. Application of this LUE algorithm to estimate GPP
When thenewmodelwas applied to estimate GPP,we also observeda better performance than the standard MODIS GPP products. An R2 of0.73 (pb0.001) and an overall RMSE of 52.7 g Cm−2 month−1 areobtained between the flux-measured GPP and theMODIS GPP productsfor all sites (Fig. 9a). Similar to our findings, MODIS GPP also shows bet-ter suitability for DF sites (R2=0.71, RMSE=60.7 g Cm−2 month−1)than for EF sites (R2=0.67, RMSE=35.7 g C m−2 month−1). For allobservations, there is a clear pattern for MODIS GPP to be higher thanflux GPP at the low end of the range while lower than flux GPP at theupper end of the GPP range. Similar results were also reported inprevious studies both at plots and continental scales (Sjöström et al.,2011; Wu et al., 2011; Xiao et al., 2010). We suggest that the impropercharacterization of shaded leaves in dense canopies is the main reasonfor the underestimation of high GPP. This hypothesis is supported byrecent study of Cheng et al. (2009) which reports the correlationbetween flux-measured LUE and the reflectance difference betweenshaded and sunlit leaves in a canopy. These observations also agreewith the improvements on reflectance simulations from radiativetransfer models incorporation of a lower canopy layer comprised of
Table 2Correlation between LUE and EVI×Tm for each calibration sites.
Site code Coefficient a Coefficient b R2 p value
US-MMS 0.1512 0.1498 0.61 b0.001US-HA1 0.1791 0.1391 0.85 b0.001US-UMB 0.1399 0.2101 0.65 b0.001US-WCR 0.1500 0.2089 0.71 b0.001US-SYV 0.1154 0.2003 0.58 b0.001US-NR1 0.0971 0.1908 0.51 b0.001US-HO1 0.1245 0.2954 0.51 b0.001CA-OJP 0.1125 0.2437 0.51 b0.001CA-OBS 0.1031 0.2376 0.52 b0.001CA-QCU 0.0938 0.1555 0.64 b0.001
Fig. 5. The relationships between the regression coefficients of LUE–EVI×Tmand (a) averageEVI (EVI_ave), (b) the minimummonthly LST (LST_min) for each calibration site.
66 C. Wu et al. / Remote Sensing of Environment 118 (2012) 60–72

Author's personal copy
Fig. 6. Relationship between the flux-measured LUE and model outputs for each modeling site in this study, DF and EF represent deciduous forests and evergreen forests, respectively.
67C. Wu et al. / Remote Sensing of Environment 118 (2012) 60–72

Author's personal copy
shaded leaves beneath the upper sunlit leaf layer (Cheng et al., 2010).To balance this limitation, overestimations are observed for low GPPranges as regression model commonly gives the average situation ofvariables. A direct impact of these misinterpretations is the limitedpotential in characterizing LUE that a relatively low correlation betweenMODIS-derived LUE and flux measurements that was observed withour dataset (R2=0.32, Fig. 9b).
When the new LUE using our method is introduced, largeimprovements are observed for both the overall dataset
(R2=0.86, RMSE=37.6 g Cm−2 month−1), DF sites (R2=0.88,RMSE=42.5 g Cm−2 month−1), and EF sites (R2=0.74,RMSE=29.4 g Cm−2 month−1) (Fig. 9c). No significant bias existsfor these observations and the issue of overestimation at high GPPvalues is largely reduced, indicating the high sensitivity of themodel for regional application with a wider dynamical range inGPP. This application of GPP estimation in multi-ecoregions alsoindicates that the new LUE algorithm can be of potential use for
Fig. 7. Relationship between the flux-measured LUE and modeled LUE for the valida-tion sites, DF and EF represent deciduous forests and evergreen forests, respectively.The regression for the overall dataset is y=0.570x+0.065 (R2=0.61, pb0.001).
Fig. 8. Relationship between the determination coefficients R2 of LUE–EVI×Tm and themaximum EVI (EVI_max), average precipitation (Preci_ave) for all sites.
Fig. 9. Comparison between the (a) flux-measured GPP and MODIS GPP, (b) flux-measured LUE and the GPP LUE, (c) the flux-measured GPP and GPP using the pro-posed LUE algorithm (solid and dash lines represent regressions DF and EF, respective-ly, the red indicates the 1:1 line). For interpretation of the references to color in thisfigure legend, the reader is referred to the web version of this article.
68 C. Wu et al. / Remote Sensing of Environment 118 (2012) 60–72

Author's personal copy
carbon cycle analysis in various ecosystems that have diverse canopystructures and climate characteristics. Moreover, a significant advantageof this algorithm is the lack of a requirement for interpolatedmeteorological inputs, which have been shown to add significant biasto estimating site-level GPP (Heinsch et al., 2006).
4.2. A comparison of fAPAR techniques
Canopy-level LUE can be considered as an integral of the leaf-levelLUE of all leaves (both shaded and sunlit) within the canopy weightedby the strength of the reflected radiation from each leaf to the sensor.Consequently, canopy LUE is influenced by canopy structuralcharacteristics, for example, LAI and the leaf angle distribution. Fluxtower observations provide a robust method for the calculation ofcanopy LUE (Baldocchi, 2008). However, this process requires anindependent estimate of fAPAR to determine APAR. Three methodswere used in this analysis and a comparison is required for use in theoperational application of EVI×Tm.
The importance of fAPAR is its relationship with vegetation canopyfunctioning and energy absorption capacity. The first method,measuring PAR at different layers within the canopy, gives directobservations of fAPAR. For the other two methods, the calculation offAPAR using in situ LAI measurements is more appropriate from theradiative transfer perspective because LAI is a canopy structuralparameter that can be remotely sensed.With available data, calculationof fAPAR between in situ LAI (fAPAR_LAI) and NDVI (fAPAR_NDVI) wascompared at the US-MMS site and calculation of fAPAR betweenmeteorological PAR (fAPAR_met) and NDVI (fAPAR_NDVI) was comparedat US-WCR.
As shown in Fig. 10, significant correlations are observed bothbetween fAPAR_NDVI and fAPAR_LAI in US-MMS (R2=0.63, pb0.001),and between fAPAR_NDVI and fAPAR_met in US-WCR (R2=0.75,pb0.001). It can be inferred that the main difference among thethree methods is the mean values of generated fAPAR. Using meteoro-logical PAR measurements appears to give the highest fAPAR, followedby the fAPAR_NDVI and fAPAR_LAI. Therefore, the LUE calculated by the
Fig. 10. An analysis of the effect of three fAPAR calculation methods on LUE estimation.
69C. Wu et al. / Remote Sensing of Environment 118 (2012) 60–72

Author's personal copy
three respective methods will fall in an inverted order (Fig. 10c andd). In general, correlations among the three LUEs are very high(R2>0.95), indicating that the use of a more general, scalable fAPARcalculation method should not affect estimation of variation in LUEsubstantially. However, attention should be considered in operationalapplications as differences of 12% and 14% in average LUE areobserved between different methods at US-MMS and US-WCR,respectively. The effects are further compared for how coefficientschange for our derived algorithm using EVI×Tm (Fig. 10e and f).
The results first demonstrate that the use of NDVI to estimate fAPARcan be a possible method for LUE calculation and this is a reasonablesolution due to difficulties in LAI acquisition in forests and unavailabilityof meteorological PAR profile observations. One issue is that the use ofNDVI to calculate fAPAR and thus LUE from flux tower GPP could producean autocorrelation between EVI×Tm and LUE (i.e., LUE=GPP/[f(NDVI)×PAR]). However, it would be a negative autocorrelation, sincean increase in NDVI would increase fAPAR and thus decrease LUE,assuming constant GPP and PAR. Secondly, if in situ LAI data or PARwere available, the model EVI×Tm will give better LUE estimates thanthe use of NDVI as indicated by the higher coefficients of determinationR2 (0.67 versus 0.61 for US-MMSand 0.82 versus 0.71 for US-WCR). Thisconclusion also agrees with the above analysis that finds LUE to bedependent on canopy structure, i.e., LAI.
4.3. Limitations of the model
Wederived a remote sensing based LUEmodel using entirelyMODISobservations in temperate and boreal forests in North America.However, a number of limitations should be stated in the future applica-tion of the algorithm.
First, the model proposed is validated for the estimation of monthlyLUE, whereas the feasibility of the model at finer temporal scales isunknown. For example, weekly canopy LUE would be a challenge dueto differences in weather conditions. The variability of LUE in suchshorter timescales will offer an opportunity to examine the modelperformance and would be useful to explore the impacts of environ-mental stresses (e.g., temperature) on the canopy LUE.
We only validated themodel in forest landscapes, and its usefulnessfor other plant functional types (e.g., grassland, woody savannas) needsto be analyzed in future. We suspect the exponential transform oftemperature would be more appropriate for ecosystems with highertemperatures. However, the degree of such improvement is still difficultto determine due to the uncertainty of temperature range where it willaccelerate or decrease the photosynthesis. Further experimental dataare needed to assess the model for high temperate controlledecosystems.
Theoretical analyses on a more physiologically-based interpretationof the model performances are needed, which would enhance therobustness of model with different ecosystems located at diverseecoregions. In particular, the model calibration using average EVI andminimum LST for each site lacks a fundamental connection betweenphotosynthesis and its drivers, resulting in unexplained modelperformances across sites and regions. For example, we found positivecorrelations between the model performance and the maximum EVIand the average precipitation. However, reasons for such correlationsare not well understood as siteswith high EVI values are not necessarilyexperiencing higher precipitations (R2=0.24, p=0.069 for all sites,data not shown here). Therefore, it would be a great advantage toexplain the model coefficients with physiological or mechanisticterms in future.
5. Conclusions
Light use efficiency is an important variable characterizing planteco-physiological function and has been widely used to estimateforest productivity from remotely sensed data. By incorporation of
both canopy greenness and temperature, here we propose a newalgorithm of EVI×Tm that shows reasonably good estimates ofmonthly LUE in various forest ecosystems in North America. Wealso find that a simple metric based on the average of EVI and Tmin
allows for calibration of model coefficients. After calibration, themodeled LUE is shown to reasonably correlate to the flux-measuredLUE with an overall RMSE of 0.055 g Cmol PAR−1 for ten independentsites. The usefulness of the calibrated model is further evaluated in theestimation of GPP and an RMSE of around 37.6 g Cm−2 month−1 hasbeen acquired for all observations, an improvement of 28% over thatof theMODISGPP products, andwith an algorithm that does not requireadditional meteorological inputs.
We have developed a novel model to estimate canopy LUE solelyfrom remote sensing inputs of the formLUE=(0.21EVI _ave+0.04)ln(EVI×exp(LST/LSTmax))−0.04 ln(LST _min)+0.25. It should benoted that the calibrated model shows a comparable accuracy inLUE estimation between the evergreen and deciduous forests, whichis a substantial improvement from models including only EVI. Thisis especially meaningful for GPP modeling when applied to evergreenspecies because temporal variability of LUE can be revealed by theseasonal vegetation cycle for deciduous species, while models thatcan improve estimates in evergreen forests would be of greaterimportance due to the limited variability in canopy greenness(Garbulsky et al., 2008). The positive impacts of average precipitationquantity on the model performance may imply that other climatevariables (e.g., soil water content, vapor pressure deficit) should beintegrated to better characterize ecosystem responses to climatechange. However, such a process would require more input data atboth appropriate spatial and temporal resolutions, requiring atrade-off between the model complexity and accuracy.
Acknowledgements
We like to thank Dr. Andrew Richardson for the suggestions to theinitial manuscript. Though comments from both reviewers are also ap-preciated. This work used data from flux sites from both the AmeriFluxand Fluxnet-Canada and we appreciate the flux PIs providing thesevaluable data and helpful explanations. This work was funded by anNSERC Strategic Grant (381474-09), the National Natural ScienceFoundation (Grant No. 41001210), the Knowledge Innovation Programof CAS (KZCX2-EW-QN302), and the Special Foundation for YoungScientists of SLRSS (Grant 10QN-01).
References
Amiro, B. D., Barr, A. G., Black, T. A., Iwashita, H., Kljun, N., McCaughey, J. H., Morgenstern,K., Murayama, S., Nesic, Z., Orchansky, A. L., & Saigusa, N. (2006). Carbon, energy andwater fluxes at mature and disturbed forest sites, Saskatchewan, Canada. Agriculturaland Forest Meteorology, 136, 237–251.
Arain, M. A., Yaun, F., & Black, T. A. (2006). Soil-plant nitrogen cycling modulated carbonexchanges in a western temperate conifer forest in Canada. Agricultural and ForestMeteorology, 140, 171–192.
Baldocchi, D. D. (2008). Breathing of the terrestrial biosphere: Lessons learned from aglobal network of carbon dioxide flux measurement systems. Australian Journalof Botany, 56, 1–26.
Barr, A. G., Black, T. A., Hogg, E. H., Kljun, N., Morgenstern, K., & Nesic, Z. (2004). Inter-annual variability in the leaf area index of a boreal aspen-hazelnut forest in rela-tion to net ecosystem production. Agricultural and Forest Meteorology, 126,237–255.
Beer, C., Reichstein, M., Tomelleri, E., Ciais, P., Jung, M., Carvalhais, N., Rödenbeck, C., Arain,M. A., Baldocchi, D., Bonan, G. B., Bondeau, A., Cescatti, A., Lasslop, G., Lindroth, A.,Lomas, M., Luyssaert, S., Margolis, H., Oleson, K. W., Roupsard, O., Veenendaal, E.,Viovy, N.,Williams, C., IanWoodward, F., & Papale, D. (2010). Terrestrial gross carbondioxide uptake: Global distribution and covariation with climate. Science, 329,834–838.
Chen, B., Coops, N. C., Fu, D., Margolis, H. A., Amiro, B. D., Barr, A. G., Black, T. A., Arain,M. A.,Bourque, C. P. A., Flanagan, L. B., Lafleur, P. M., McCaughey, J. H., &Wofsy, S. C. (2011).Assessing eddy-covariance flux tower location bias across the Fluxnet-CanadaResearch Network based on remote sensing and footprint modelling. Agriculturaland Forest Meteorology, 151, 87–100.
70 C. Wu et al. / Remote Sensing of Environment 118 (2012) 60–72

Author's personal copy
Chen, J. M., Ju, W. M., Cihlar, J., Price, D., Liu, J., Chen, W. J., Pan, J. J., Black, A., & Barr, A.(2003). Spatial distribution of carbon sources and sinks in Canada's forests. Tellus,B55, 622–641.
Cheng, Y. B., Middleton, E. M., Hilker, T., Coops, N. C., Black, T. A., & Krishnan, P. (2009).Dynamics of spectral bio-indicators and their correlations with light use efficiencyusing directional observations at a Douglas-fir forest. Measurement Science andTechnology, 20, 1–15.
Cheng, Y. B., Middleton, E. M., Huemmrich, K. F., Zhang, Q., Campbell, P. K. E., Corp, L. A.,Russ, A. L., & Kustas, W. P. (2010). Utilizing in situ directional hyperspectralmeasurements to validate bio-indicator simulations for a corn crop canopy. EcologicalInformatics, 5, 330–338.
Cook, B. D., Bolstad, P. V., Martin, J. G., Heinsch, F. A., Davis, K. J., Wang, W., Desai, A. R., &Teclaw, R. M. (2008). Using light-use and production efficiency models to predictforest production and carbon exchange during canopy disturbance events. Ecosystems,11, 26–44.
Cook, B. D., Bolstad, P. V., Næsset, E., Anderson, R. S., Garrigues, S., Morisette, J. T., Nickeson, J.,& Davis, K. J. (2009). Using LiDAR and quickbird data to model plant production andquantify uncertainties associatedwithwetlanddetection and land cover generalizations.Remote Sensing of Environment, 113, 2366–2379.
Cook, B. D., Davis, K. J.,Wang,W., Desai, A., Berger, B.W., Teclaw, R.M.,Martin, J. G., Bolstad,P. V., Bakwin, P. S., Yi, C., & Heilman, W. (2004). Carbon exchange and ventinganomalies in an upland deciduous forest in northern Wisconsin, USA. Agriculturaland Forest Meteorology, 126, 271–295.
Coops, N. C., Hilker, T., Hall, F. G., Nichol, C. J., & Drolet, G. G. (2010). Estimation of light-useefficiency of terrestrial ecosystems from space: A status report. BioScience, 60,788–797.
Coursolle, C.,Margolis, H. A., Barr, A. G., Black, T. A., Amiro, B. D.,McCaughey, J. H., Flanagan,L. B., Lafleur, P. M., Roulet, N. T., Bourque, C. P. A., Arain, M. A., Wofsy, S. C., Dunn, A.,Morgenstern, K., Orchansky, A. L., Bernier, P. Y., Chen, J. M., Kidston, J., Saigusa, N., &Hedstrom, N. (2006). Late-summer carbon fluxes from Canadian forests andpeatlands along an east–west continental transect. Canadian Journal of Forest Research,36, 783–800.
Curtis, P. S., Hanson, P. J., Bolstad, P., Barford, C., Randolph, J. C., Schmid, H. P., & Wilson,K. B. (2002). Biometric and eddy-covariance based estimates of annual carbonstorage in five eastern North American deciduous forests. Agricultural and ForestMeteorology, 113, 3–19.
Denning, A. S., Nicholls, M., Prihodko, L., Baker, I., Vidale, P. L., Davis, K., & Bakwin, P.(2003). Simulated variations in atmospheric CO2 over a Wisconsin forest using acoupled ecosystem-atmosphere model. Global Change Biology, 9, 1241–1250.
Desai, A. R., Bolstad, P. V., Cook, B. D., Davis, K. J., & Carey, E. V. (2005). Comparing netecosystem exchange of carbon dioxide between an old-growth and mature forestin the upper Midwest, USA. Agricultural and Forest Meteorology, 128, 33–55.
Desai, A. R., Richardson, A. D., Moffat, A. M., Kattge, J., Hollinger, D. Y., Barr, A., Falge, E.,Noormets, A., Papale, D., Reichstein, M., & Stauch, V. J. (2008). Cross site evaluationof eddy covariance GPP and RE decomposition techniques. Agricultural and ForestMeteorology, 148, 821–838.
Dragoni, D., Schmid, H. P., Grimmond, C. S. B., & Loescher, H.W. (2007). Uncertainty of annualnet ecosystemproductivity estimated using eddy covariancefluxmeasurements. Journalof Geophysical Research, 112, D17102, doi:10.1029/2006JD008149.
Drolet, G. G., Huemmrich, K. F., Hall, F. G., Middleton, E. M., Black, T. A., Barr, A. G., &Margolis,H. A. (2005). A MODIS-derived photochemical reflectance index to detect inter-annualvariations in the photosynthetic light-use efficiency of a boreal deciduous forest. RemoteSensing of Environment, 98, 212–224.
Drolet, G. G., Middleton, E. M., Huemmrich, K. F., Hall, F. G., Amiro, B. D., Barr, A. G.,Black, T. A., McCaughey, J. H., & Margolis, H. A. (2008). Regional mapping of grosslight-use efficiency using MODIS spectral indices. Remote Sensing of Environment,112, 3064–3078.
Dunn, A. L., Barford, C. C., Wofsy, S. C., Goulden, M. L., & Daube, B. C. (2007). A long-termrecord of carbon exchange in a boreal black spruce forest: Means, responses tointerannual variability, and decadal trends. Global Change Biology, 13, 577–590.
Fensholt, R., Sandholt, I., & Rasmussen, M. S. (2004). Evaluation of MODIS LAI, fAPAR andthe relation between fAPAR and NDVI in a semi-arid environment using in situmeasurements. Remote Sensing of Environment, 91, 490–507.
Filella, I., Porcar-Castell, A., Munne-Bosch, S., Back, J., Garbulsky, M. F., & Peñuelas, J.(2009). PRI assessment of long-term changes in carotenoids/chlorophyll ratioand short-term changes in de-epoxidation of the xanthophyll cycle. InternationalJournal of Remote Sensing, 30, 4443–4455.
Gamon, J. A., Serrano, L., & Surfus, J. S. (1997). The photochemical reflectance index: Anoptical indicator of photosynthesis radiation use efficiency across species, functionaltypes, and nutrient levels. Oecologia, 112, 492–501.
Garbulsky, M. F., Peñuelas, J., Gamon, J., Inoue, Y., & Filella, I. (2011). The photochemicalreflectance index (PRI) and the remote sensing of leaf, canopy and ecosystemradiation use efficiencies. A review andmeta-analysis. Remote Sensing of Environment,15, 281–297.
Garbulsky, M. F., Peñuelas, J., Papale, D., & Filella, I. (2008). Remote estimation of carbondioxide uptake by a Mediterranean forest. Global Change Biology, 14, 2860–2867.
Giasson, M. A., Coursolle, C., & Margolis, H. A. (2006). Ecosystem-level CO2 fluxes froma boreal cutover in eastern Canada before and after scarification. Agricultural andForest Meteorology, 140, 23–40.
Goerner, A., Reichstein, M., & Rambal, S. (2009). Tracking seasonal drought effects onecosystem light use efficiency with satellite-based PRI in a Mediterranean forest.Remote Sensing of Environment, 113, 1101–1111.
Goetz, S. J., Prince, S. D., & Small, J. (2000). Advances in satellite remote sensing of environ-mental variables for epidemiological applications. Advances in Parasitology, 47, 289–307.
Gu, L., Meyers, T., Pallardy, S. G., Hanson, P. J., Yang, B., Heuer, M., Hosman, K. P., Liu, Q.,Riggs, J. S., Sluss, D., & Wullschleger, S. D. (2007). Influences of biomass heat and
biochemical energy storages on the land surface fluxes and diurnal temperaturerange. Journal of Geophysical Research, 112, D02107, doi:10.1029/2006JD007425.
Hadley, J. L., Kuzeja, P. S., Daley, M. J., Phillips, N. G., Mulcahy, T., & Singh, S. (2008).Water use and carbon exchange of red oak- and eastern hemlock-dominatedforests in the northeastern USA: Implications for ecosystem-level effects ofhemlock woolly adelgid. Tree Physiology, 28, 615–627.
Hall, F. G., Hilker, T., & Coops, N. C. (2011). PHOTOSYNSAT, photosynthesis from space:Theoretical foundationsof a satellite concept and validation from tower and spacebornedata. Remote Sensing of Environment, 115, 1918–1925.
Hall, F. G., Hilker, T., Coops, N. C., Lyapustin, A., Huemmrich, K. F., Middleton, E., Margolis,H., Drolet, G., & Black, T. A. (2008). Multi-angle remote sensing of forest light useefficiency by observing PRI variationwith shadow fraction. Remote Sensing of Environ-ment, 112, 3201–3211.
Heinsch, F., Zhao, M., Running, S., Kimball, J., Nemani, R., Davis, K., Bolstad, P., Cook, B.D., Desai, A. R., Ricciuto, D. M., Law, B. E., Oechel, W. C., Kwon, H., Luo, H., Wofsy, S.C., Dunn, A. L., Munger, J. W., Baldocchi, D. D., Xu, L., Hollinger, D. Y., Richardson, A.D., Stoy, P. C., Siqueira, M. B. S., Monson, R. K., Burns, S. P., & Flanagan, L. B. (2006).Evaluation of remote sensing based terrestrial productivity from MODIS usingregional tower eddy flux network observations. IEEE Transactions on Geoscienceand Remote Sensing, 44, 1908–1925.
Hilker, T., Coops, N. C., Hall, F. G., Black, T. A., Wulder, M. A., Nesic, Z., & Krishnan, P.(2008). Separating physiologically and directionally induced changes in PRI usingBRDF models. Remote Sensing of Environment, 112, 2777–2788.
Hilker, T., Hall, F. G., Coops, N. C., Lyapustin, A., Wang, Y., Nesic, Z., Grant, N., Black, T. A.,Wulder, M. A., Kljun, N., Hopkinson, C., & Chasmer, L. (2010). Remote sensing ofphotosynthetic light-use efficiency across two forested biomes: Spatial scaling.Remote Sensing of Environment, 114, 2863–2874.
Hilker, T., Lyapustin, A., Hall, F. G., Wang, Y., Coops, N. C., Drolet, G., & Black, T. A.(2009). An assessment of photosynthetic light use efficiency from space: Modelingthe atmospheric and directional impacts on PRI reflectance. Remote Sensing ofEnvironment, 113, 2463–2475.
Hollinger, D. Y., Aber, J., Dail, B., Davidson, E. A., Goltz, S. M., Hughes, H., Leclerc, M., Lee,J. T., Richardson, A. D., Rodrigues, C., Scott, N. A., Varier, D., & Walsh, J. (2004).Spatial and temporal variability in forest-atmosphere CO2 exchange. Global ChangeBiology, 10, 1689–1706.
Huemmrich, K. F., Gamon, J. A., Tweedie, C. E., Oberbauer, S. F., Kinoshita, G., Houston,S., Kuchy, A., Hollister, R. D., Kwon, H., Mano, M., Harazono, Y., Webber, P. J., &Oechel, W. C. (2010). Remote sensing of tundra gross ecosystem productivityand light use efficiency under varying temperature and moisture conditions.Remote Sensing of Environment, 114, 481–489.
Huete, A., Didan, K., Miura, T., Rodriguez, E. P., Gao, X., & Ferreira, L. G. (2002). Overviewof the radiometric and biophysical performance of the MODIS vegetation indices.Remote Sensing of Environment, 83, 195–213.
Inoue, Y., Peñuelas, J., Miyata, A., & Mano, M. (2008). Normalized difference spectralindices for estimating photosynthetic efficiency and capacity at a canopy scalederived from hyperspectral and CO2 flux measurements in rice. Remote Sensing ofEnvironment, 112, 156–172.
Jenkins, J. P., Richardson, A. D., Braswell, B. H., Ollinger, S. V., Hollinger, D. Y., & Smith, M. L.(2007). Refining light-use efficiency calculations for a deciduous forest canopy usingsimultaneous tower-based carbon flux and radiometric measurements. Agriculturaland Forest Meteorology, 143, 64–79.
Monson, R. K., Sparks, J. P., Rosenstiel, T. N., Scott-Denton, L. E., Huxman, T. E., Harley, P.C., Turnipseed, A. A., Burns, S. P., Backlund, B., & Hu, J. (2005). Climatic influenceson net ecosystem CO2 exchange during the transition from wintertime carbonsource to springtime carbon sink in a high-elevation, subalpine forest. Oecologia,146, 130–147.
Monteith, J. L. (1972). Solar radiation and production in tropical ecosystems. Journal ofApplied Ecology, 9, 747–766.
Mu, Q., Zhao, M., & Running, S. W. (2011). Improvements to a MODIS global terrestrialevapotranspiration algorithm. Remote Sensing of Environment, 115, 1781–1800.
Nakaji, T., Ide, R., Takagi, K., Kosugi, Y., Ohkubo, S., Nasahara, K. N., Saigusa, N., & Oguma, H.(2008). Utility of spectral vegetation indices for estimation of light conversionefficiency in coniferous forests in Japan. Agricultural and Forest Meteorology, 148,776–787.
Papale, D., & Valentini, A. (2003). A new assessment of European forests carbonexchange by eddy fluxes and artificial neural network spatialization. Global ChangeBiology, 9, 525–535.
Reichstein, M., Falge, E., Baldocchi, D., Papale, D., Aubinet, M., Berbigier, P., Bernhofer, C.,Buchmann, N., Gilmanov, T., Granier, A., Grunwald, T., Havrankova, K., Ilvesniemi, H.,Janous, D., Knohl, A., Laurila, T., Lohila, A., Loustau, D.,Matteucci, G.,Meyers, T.,Miglietta,F., Ourcival, J. M., Pumpanen, J., Rambal, S., Rotenberg, E., Sanz, M., Tenhunen, J., Seufert,G., Vaccari, F., Vesala, T., Yakir, D., & Valentini, R. (2005). On the separation of netecosystem exchange into assimilation and ecosystem respiration: Review andimproved algorithm. Global Change Biology, 11, 1424–1439.
Rouse, J. W., Haas, R. H., Schell, J. A., Deering, D. W., & Harlan, J. C. (1974). Monitoringthe vernal advancements and retrogradation of natural vegetation. NASA/GSFC,Final Report, Greenbelt, MD, USA (pp. 1–137).
Running, S. W., Nemani, R. R., Heinsch, F. A., Zhao, M., Reeves, M., & Hashimoto, H.(2004). A continuous satellite-derived measure of global terrestrial primaryproduction. Bioscience, 54, 547–560.
Schubert, P., Lund, M., Ström, L., & Eklundh, L. (2010). Impact of nutrients on peatlandGPP estimations using MODIS time series data. Remote Sensing of Environment, 114,2137–2145.
Schwalm, C. R., Black, T. A., Amiro, B. D., Arain, M. A., Barr, A. G., Bourque, C. P. A., Dunn,A. L., Flanagan, L. B., Giasson, M., Lafleur, P. M., Margolis, H. A., McCaughey, J. H.,Orchansky, A. L., & Wofsy, S. C. (2006). Photosynthetic light use efficiency of
71C. Wu et al. / Remote Sensing of Environment 118 (2012) 60–72

Author's personal copy
three biomes across an east–west continental-scale transect in Canada. Agriculturaland Forest Meteorology, 140, 269–286.
Sims, D. A., Rahman, A. F., Cordova, V. D., El-Masri, B. Z., Baldocchi, D. D., Bolstad, P. V.,Flanagan, L. B., Goldstein, A. H., Hollinger, D. Y., Misson, L., Monson, R. K., Oechel, W.C., Schmid, H. P., Wofsy, S. C., & Xu, L. (2008). A new model of gross primary produc-tivity for North American ecosystems based solely on the enhanced vegetation indexand land surface temperature from MODIS. Remote Sensing of Environment, 112,1633–1646.
Sims, D. A., Rahman, A. F., Cordova, V. D., El-Masri, B. Z., Baldocchi, D. D., Flanagan, L. B.,Goldstein, A. H., Hollinger, D. Y., Misson, L., Monson, R. K., Oechel, W. C., Schmid, H.P., Wofsy, S. C., & Xu, L. (2006). On the use of MODIS EVI to assess gross primaryproductivity of North American ecosystems. Journal of Geophysical Research, 111,G04015, doi:10.1029/2006JG000162.
Sjöström, M., Ardo, J., Arneth, A., Boulain, N., Cappelaere, B., Eklundh, L., De Grandcourt,A., Kutsch, W. L., Merbold, L., Nouvellon, Y., Scholes, R. J., Schubert, P., Seaquist, J., &Veenendaal, E. M. (2011). Exploring the potential of MODIS EVI for modeling grossprimary production across African ecosystems. Remote sensing of environment, 115,1081–1089.
Tang, J., Bolstad, P. V., Desai, A. R., Martin, J. G., Cook, B. D., Davis, K. J., & Carey, E. V. (2008).Ecosystem respiration and its components in an old-growth forest in the Great Lakesregion of the United States. Agricultural and Forest Meteorology, 148, 171–185.
Teklemariam, T., Staebler, R. M., & Barr, A. G. (2009). Eight years of carbon dioxideexchange above amixed forest at Borden, Ontario. Agricultural and ForestMeteorology,149, 2040–2053.
Urbanski, S., Barford, C., Wofsy, S., Kucharik, C., Pyle, E., Budney, J., McKain, K., Fitzjarrald, D.,Czikowsky, M., & Munger, J. W. (2007). Factors controlling CO2 exchange on timescalesfrom hourly to decadal at Harvard Forest. Journal of Geophysical Research, 112, G02020,doi:10.1029/2006JG000293.
Viña, A., & Gitelson, A. A. (2005). New developments in the remote estimation of thefraction of absorbed photosynthetically active radiation in crops. Geophysical ResearchLetter, 32, L17403, doi:10.1029/2005GL023647.
Wan, Z. (2008). New refinements and validation of theMODIS land-surface temperature/-emissivity products. Remote Sensing of Environment, 112, 59–74.
Wu, C., Chen, J. M., & Huang, N. (2011). Predicting gross primary production from theenhanced vegetation index and photosynthetically active radiation: Evaluationand calibration. Remote Sensing of Environment, 115, 3424–3435.
Wu, C., Munger, J. W., Niu, Z., & Kuang, D. (2010). Comparison of multiple models forestimating gross primary production using MODIS and eddy covariance data inHarvard Forest. Remote Sensing of Environment, 114, 2925–2939.
Wu, C., Niu, Z., Tang, Q., Huang, W., Rivard, B., & Feng, J. (2009). Remote estimation ofgross primary production in wheat using chlorophyll-related vegetation indices.Agricultural and Forest Meteorology, 149, 1015–1021.
Xiao, X., Zhang, Q., Braswell, B., Urbanski, S., Boles, S., Wofsy, S., Moore, B., III, & Ojima,D. (2004). Modeling gross primary production of temperate deciduous broadleafforest using satellite images and climate data. Remote Sensing of Environment, 91,256–270.
Xiao, J., Zhuang,Q., Law, B. E., Chen, J., Baldocchi, D. D., Cook, D. R., Oren, R., Richardson, A. D.,Sonia Wharton, S., Ma, S., Martin, T. A., Verma, S. B., Suyker, A. E., Scott, Russell L.,Monson, R. L., Litvak, R. K., Hollinger, M., Sun, D. Y., Davis, G., Bolstad, K. J., Burns, P.V., Curtis, S. P., Drake, P. S., Falk, B. G., Fischer, M., Foster, M. L., Gu, D. R., Hadley, L.,Katul, J. L., Matamala, G. G., McNulty, R., Meyers, S., Munger, T. P., Noormets, J. W.,Oechel, A., Paw U, W. C., Schmid, K. T., Starr, H. P., Torn, G., M. S., & Wofsy, S. C.(2010). A continuousmeasure of gross primary production for the conterminous UnitedStates derived from MODIS and AmeriFlux data. Remote Sensing of Environment, 114,576–591.
Zhang, Q., Middleton, E. M., Margolis, H. A., Drolet, G. G., Barr, A. G., & Black, T. A. (2009).Can a satellite-derived estimate of the fraction of PAR absorbed by chlorophyll(FAPARchl) improve predictions of light-use efficiency and ecosystemphotosynthesisfor a boreal aspen forest? Remote Sensing of Environment, 113, 880–888.
Zhao, M., & Running, S. W. (2010). Drought-induced reduction in global terrestrial netprimary production from 2000 through 2009. Science, 329, 940–943.
Zhao, M., Running, S. W., & Nemani, R. R. (2006). Sensitivity of Moderate ResolutionImaging Spectroradiometer (MODIS) terrestrial primary production to the accuracyof meteorological reanalyses. Journal of Geophysical Research, 111, G01002, doi:10.1029/2004JG000004.
72 C. Wu et al. / Remote Sensing of Environment 118 (2012) 60–72