this document is classified in confidence and not for
TRANSCRIPT

1
SITREP 039
Coronavirus disease 2019 (COVID-19)
Issued: 1030 hours 1 September 2020
Information current at: 1000 hours
This report provides a daily update on the COVID-19 health system response. New information is denoted by red text.
Please use the single point of contact email [email protected] for help/support. Your email will be
logged and promptly passed to the appropriate team.
This document is classified IN CONFIDENCE and not for further distribution.
Need to know
COMMUNITY CASES
NEW LAST 24 hrs
5
MIQ CASES
NEW LAST 24 hrs
9
COMMUNITY CASES
TOTAL RECOVERED
49
97
COMMUNITY CASES
ACTIVE
99 TOTAL CASES SINCE 11 AUG
148
33
TOTAL CASES SINCE 9 JUN
130
TOTAL ACTIVE CASES IN NZ (COMMUNITY & MIQ): 132
MIQ CASES
TOTAL RECOVERED
MIQ CASES
ACTIVE
LABORATORY TESTS
31 August
8599
LABORATORY TESTS
25 to 31 August
65,122
LABORATORY TESTS
TOTAL
766,626

IN CONFIDENCE – NOT FOR DISTRIBUTION
2
Total COVID-19 cases
Table 1: Total number of COVID-19 cases as at 0900 01 September 2020
Case Status Active Recovered Deceased Total
Confirmed 132 (+2) 1252 (+12) 17 1401 (+14)
Probable 0 (-1) 346 (+1) 5 351
Total 132 (+1) 1598 (+13) 22 1752 (+14)*
*Net increase of 14 cases with 13 cases classified as recovered.
Total community cases since 11 August
Table 2: Community cases by DHB and case status as at 0900 01 September 2020
New community cases since 0900 31 August 2020
1. Five new confirmed community cases have been reported. Of these all five have
epidemiological links, summarised as follows:
o One case is a household contact of the Botany case (reported on 28 August with no
epidemiological link to the cluster, genomically linked on 31 August).
o Three cases are in the second household linked to the Botany case.
o One case is a household contact of a known confirmed case linked to the public
exposure event.
Community cases linked to the Auckland Community Cluster August 2020
2. 146 of the 148 community cases have been linked to the Auckland Community Cluster
August 2020, as at 0900 1 September. Of the two cases not linked to the cluster one
case, the Rydges employee, has been closed and an epidemiological and genomic link
to the community cluster is still under investigation for one case.
Community cases under investigation to determine a link to the community cluster
3. Case under investigation is summarised as follows:
o One case (reported 21 August) came through the border on 18 June. The case tested
negative at Day 3 and Day 12 of quarantine. Subsequently the case tested positive on
21 August after being swabbed at a mobile testing clinic in Auckland. A partial
genome has been obtained from sequencing and this case has been provisionally
Case
Status
Counties Manukau Waitematā Auckland Waikato Total
Confirmed 67 (+5) 35 (+1) 41 (+3) 4 147 (+5)
Probable 0 (-1) 0 0 0 0 (-1)
Total 67 (+4) 35 (+1) 41 (+3) 4 147 (+4)
s 9(2)(a)

IN CONFIDENCE – NOT FOR DISTRIBUTION
3
.
genomically linked to the community cluster. Further whole genome sequencing is in
progress.1
Community cases and household contacts at Jet Park
4. As at 0800 1 September there are 123 people isolating in Jet Park from the community.
79 are confirmed cases, the remaining 44 are household contacts. This number will
fluctuate as people finish their isolation and depart from the facility.
MIQ cases
5. As at 0900 1 September there have been nine new cases detected at the border since
0900 31 August. In total there are 130 cases that have been detected at the border
since the establishment of MIFs/MIQs.
o Five cases are in Canterbury: all arrived from Delhi, India on 27 August (Flight
number: NZ1301), via Fiji (Flight number: GA7280).
o Three cases are in Auckland: two arrived from Delhi, India on 23 August (Flight
number: AI1320). One arrived on 26 August from Doha, Qatar and tested positive on
routine day 3 testing (Flight number: QR453).
o One case is in Wellington: arrived from Los Angeles, USA on 18 August (Flight
number: NZ1), tested positive on routine day 12 testing.
Cases in hospital
6. 10 cases are in hospital with COVID-19.
Table 3: Number of cases in hospital with COVID-19 by DHB as at 0800 1 September 2020
*Note: One case was discharged to Jet Park yesterday and a separate case was admitted yesterday. The total number of
patients is unchanged at three.
1 ARPHS Strategic Report 28 August 2020
DHB Hospital Number in a general
ward Number in ICU/HDU
Auckland Auckland City 2 0
Counties Manukau Middlemore 2 1
Waitematā North Shore 3* 0
Waikato Waikato 1 1
Total - 8 2

IN CONFIDENCE – NOT FOR DISTRIBUTION
4
Health system response
Overall approach
7. Our investigation has two main focus areas that run in parallel:
o Source attribution – a focus on investigating the case with the earliest symptom
onset date to gather details actions of movements 14 days prior. This will help to
understand the possible source of the new outbreak.
o Containment – rigorous case investigation, identification of close contacts and
isolation and testing to ensure that chain of transmission is broken.
Overview
The cluster is currently continuing to grow within the parameters of the DHB’s modelling. The
impact of intensive case follow-up appears to be working. However, there are two cases with no
apparent links to the cluster, that raises the possibility of undetected further clusters that is a
priority for the investigation. There is one ‘mini-cluster’ related to Mt Roskill Evangelical Church and
it is likely that we will see more cases arise in this cluster.
Current outbreak investigation priorities2
o Contact tracing and containment around church sub cluster
o Seek to identify an epidemiological link for the case to the main cluster
o Clarify whether the case that is a returnee from June is a new infection, and clarify strain
o Contact trace and isolate close contacts exposed on Auckland bus journeys
o Seek to identify epidemiological link to the cluster for cases that have been genomically
linked but not epidemiologically linked.
8. Mt Roskill Evangelical Church is a priority for ARPHS. This is due to ongoing
transmission occurring and concerns that not all contacts have been identified. Several
events are being scoped. The DHB is working closely with Church leaders to:
o Maintain relationships with and support for Church leaders.
o Understand the total number of people that need to be tested.
o Push testing coverage.
o Develop welfare support arrangements for those requiring quarantine.
9. There is a sports club associated with the Mt Roskill Evangelical Church.
The sports club has been
closed for the past two weeks, therefore none of the club members are being
considered close contacts. ARPHS sent comms to members regarding testing and to
date no positive cases have been reported.3
2 ARPHS Strategic Report 1 September 2020
3 ARPHS, Waikato DHB and MoH teleconference 3pm 31 August 2020
s 9(2)(a)
s 9(2)(a)
s 9(2)(a)

IN CONFIDENCE – NOT FOR DISTRIBUTION
5
10. Four cases that have been genomically linked to the cluster are still being investigated
by ARPHS to identify their epidemiological link.
o source of infection is still under investigation. is no
longer being considered as the possible source because analysis of the test result
shows had a recent more infection. have
tested negative.4
o GP.
o The second Mount Albert Grammar student.
o Botany case: and lives in a household with
close links to a second household. Members of the second household are testing
positive.
4 ARPHS, Waikato DHB and MoH teleconference 3pm 31 August 2020
s 9(2)(a) s 9(2)(a)
s 9(2)(a) s 9(2)(a)
s 9(2)(a) s 9(2)(a)
s 9(2)(a)

6
s 9(2)(a)
s 9(2)(a)

IN CONFIDENCE – NOT FOR DISTRIBUTION
7
s 9(2)(a)

8
Waikato Investigation Updates
11. Waikato DHB is leading the contact tracing for the church services and event
associated with the Mount Roskill Evangelical Church sub-cluster.
12. A new case was reported in Tokoroa on the evening of 29 August5. The case is a contact
of an existing case from Tokoroa who is currently in hospital and associated with the
Auckland cluster. The new case works at a medical centre in Tokoroa and it is believed
they had contact with the existing case . The centre is
undergoing a terminal clean and has been closed pending completion of contact
tracing. Contact tracing is underway to contact all staff and patients of the medical
centre.
. Two testing sites were stood up yesterday for testing
staff and patients, these will be available for the rest of the week.
ESR and wider testing7 13. A further 23 community cases are genomically linked with the Auckland cluster. These
cases are from the following known subclusters; Church 1 (3 cases), Church 2 (4 cases),
Finance Now (2 case), Finance Now HH (2 cases), Americold (1 case), Americold HH (4
cases), Household 1 (5 cases), Household 2 (1 case), NZ Courier post (1 case). These
cases are also epidemiologically linked to the cluster.
14.
5 Waikato PHU, email and phone conversation 29-30 August 2020
6 Deputy Director Public Health Email 0913 31 August 2020
7 ESR Update email, 0902 01 September 2020
Table 5: Waikato contact tracing and initial/day 12 testing by site as at 0700 01 September 20206
*These numbers will likely change throughout the day as the investigation continues.
s 9(2)(a)
s 9(2)(a)
s 9(2)(a)
s 9(2)(a)
s 9(2)(g)(i)

IN CONFIDENCE – NOT FOR DISTRIBUTION
9
15. Work is underway to analyse how the whole genome sequencing can be used to tell us
how COVID-19 has been transmitted through the community cluster and to further
inform its management.
16. No direct links have been found between the community outbreak genome
sequencing, with the 35 full and 13 partial (checked for the community mutation, and
confirmed not to show it) genomes currently available from cases in managed isolation
facilities (MIFs).
17.
Contact tracing 18. Between 23 and 29 August 85% (455 of 534)8 of close contacts have been contacted
within 48 hours of being determined to be a contact. KPI for this metric is 80% of close
contacts within 48 hours.
o Notes: This metric reports all cases during the specified period, including those in Managed Isolation and Quarantine, and does not include casual contacts.
Table 6: Close contact tracing recorded in the National Contact Tracing Solution since 11 August as at
0900 01 September 2020
29/08/2020 30/08/2020 31/08/2020 01/09/2020
Number of close contacts
identified1 2489 2587 2621 2743
Number of close contacts
successfully contacted (and are
self-isolating)
2425 2475 2505 2676
Number of close contacts
referred to "finding services"2 12 6 7 5
Number of close contacts
awaiting contact 52 106 109 62
1. Contacts loaded into the National Contact Tracing Solution, and managed by either the National Investigation and Tracing
Unit or the Public Health Units. Contacts from MIQ and overseas cases are not included in this report.
2. "Finding services" refers to the mechanism the National Close Contact Service uses to find valid contact details for close
contacts we do not have the correct contact details for. These services utilise internal Ministry of Health databases along with
Police, Customs and Airlines where relevant.
3. The total number and number successfully contacted can decrease due to duplicates and invalid records being removed from
the system.
8 Contact Tracing Data, COVID-19 NCCS Analytics and Reporting received 0906 01 September 2020
s 9(2)(g)(i)
s 9(2)(g)(i)

IN CONFIDENCE – NOT FOR DISTRIBUTION
10
COVID-19 Tracer App usage Figure 1: COVID-19 Tracer App9 cumulative registered users and daily scans/manual entries as at 1615
31 August 2020
1. The number of scans and manual entries on any given date is subject to change for up to 31 days. This is because there can be
a delay before anonymised analytic information is received (e.g. device not connected to internet when scan carried out).
2. The number of App registrations and QR codes for any given date is subject to change for up to 1 day. This is because due to
reporting timeframes these numbers may be extracted before the 12pm cut-off for the reporting period.
Testing
Swabs collected10 Table 7: Number of swabs collected nationally by stream as at 1800 31 August 2020
1. This data will change over time due to variation in the way DHBs report swab numbers (i.e. at different stages in the
testing process).
9 Response Analyst – Digital Channels, 1621 31 August 2020
10 Senior Advisor – COVID-19 Health Systems Response, 1803 31 August 2020
0
200,000
400,000
600,000
800,000
1,000,000
1,200,000
1,400,000
1,600,000
1,800,000
2,000,000
0
500,000
1,000,000
1,500,000
2,000,000
2,500,000
20
/05
/20
20
23
/05
/20
20
26
/05
/20
20
29
/05
/20
20
1/0
6/2
02
04
/06
/20
20
7/0
6/2
02
01
0/0
6/2
02
01
3/0
6/2
02
01
6/0
6/2
02
01
9/0
6/2
02
02
2/0
6/2
02
02
5/0
6/2
02
02
8/0
6/2
02
01
/07
/20
20
4/0
7/2
02
07
/07
/20
20
10
/07
/20
20
13
/07
/20
20
16
/07
/20
20
19
/07
/20
20
22
/07
/20
20
25
/07
/20
20
28
/07
/20
20
31
/07
/20
20
3/0
8/2
02
06
/08
/20
20
9/0
8/2
02
01
2/0
8/2
02
01
5/0
8/2
02
01
8/0
8/2
02
02
1/0
8/2
02
02
4/0
8/2
02
02
7/0
8/2
02
03
0/0
8/2
02
0 Dai
ly s
can
s an
d m
anu
al e
ntr
ies
Cu
mu
lati
ve A
pp
reg
istr
atio
ns
COVID Tracer App usage Cumulative App registrations
Scans and manual entries
Swab Stream 31 August 25–31 August
Community 4560 67,110
MIF Staff 169 1666
MIF Guests 440 4181
Airport Staff 201 1444
Maritime Staff 120 420
Total 5490 74,821

IN CONFIDENCE – NOT FOR DISTRIBUTION
11
Laboratory testing numbers Table 8: Number of laboratory tests processed nationally as at 0900 31 August11 2020
Testing supply update12
19. There are approximately 270,000 complete tests in NZ. Resupply continues to largely
match usage, and additional swab deliveries are expected to arrive this week.
Testing activity by region
Focus areas
20. There are 39 designated community testing centres in the wider Auckland region. Of
these, 20 testing sites are in Auckland city and 19 are community centres outside of the
Auckland city.
Healthline updates13 21. On 31 August there were 3,679 contacts in Healthline. Of those calls, 1,768 were to the
COVID-19 Info line. Demand on 1737 Need to talk? and other mental health services
was 715 contacts (22% higher than forecast).
22. The introduction of self-service text and digital channels on their IVR systems saw 89
people self-serve on 30 August. Healthline have put a live revised testing referral
process to support the testing strategy and will continue to quality assure this over the
weekend.
23. The main themes yesterday/today:
o Compared to other level changes there is quite a bit of mis-understanding by the
public (Alert Level 2, 2.5 vs 3), anti-South / West Auckland sentiment and towards
Aucklanders in general – examples from yesterday:
▪ Examples of people “reporting” west and south Aucklanders not staying at
Alert Level 3 and going into other parts of Auckland.
11 Daily Lab Report, 0936 01 September 2020
12 Health Supply Chain email, 0907 30 August 2020
13 National Telehealth Service Coronavirus Update, 0935 01 September 2020
Time period Number of laboratory tests
31 August 8599
Last 7 days (25 to 31 August) 65,122
Total 766,626

IN CONFIDENCE – NOT FOR DISTRIBUTION
12
▪ Employers calling to see if they can hold meeting in their workplaces for more
than 10 people.
▪ People down country reporting Aucklander’s visiting them and attending
groups of more than 10.
▪ Schools and businesses calling to clarify the rules around the Alert Levels.
▪ Facemask requirements.
o Significant numbers of calls relating to communications around South and West
Aucklander’s needing to get tested. Healthline continued to advise service users with
the Healthline agreed interpretation of the testing strategy.
o Continued delay in access to care with our referral rates to Ambulance/ED/urgent
care, this needs reinforcing in communications.
o Symptomatic and asymptomatic Service User’s wanting to be tested.
o Questions relating to the new levels and what they mean.
o People having welfare needs associated with the lock down.
Logistics
Health Workforce14
24. Health Workforce have identified a small group of people on the surge workforce who
have indicated they would be willing to work in an ARC facility in the event of an
outbreak – this week we will work on whether this pool can be expanded and actions to
keep the group “warm” in the event ARC employers require them.
25. Upskilling of alternative workforces for testing continues to progress, including plans
for a training package and scoping of micro-credentialing, in addition to understanding
where this workforce would be obtained from. It is anticipated this training package will
be available within four weeks (estimated).
26. Health Workforce continue to work with TAS and all 20 GMsHR on workforce needs and
issues – regular workforce intelligence information will be provided to Health
Workforce, which will be incorporated into frequent dashboard reports.
14 Health Workforce Directorate, 0832 01 September 2020

IN CONFIDENCE – NOT FOR DISTRIBUTION
13
Hospital capacity15 Table 9: Number and occupancy of hospital beds by type as at 0800 01 September 2020
Type Number of units Number (%) occupied/in use
ICU and HDU beds 353 240 (68.0%)
Ventilators 306 54 (17.6%)
Ward beds 7339 5882 (80.1%)
15 COVID-19 Hospital Summary, 0912 01 September 2020

14
Appendix 1: Case summary Table 10: All community cases reported between 0900 31 August and 0900 01 September
s 9(2)(a)

15
s 9(2)(a)

16
Appendix 3: COVID-19 Provisional Disease Indicators, by date
of case notification Indicator (as
per Table 9832) Refined Indicator description Target 24 August 25 August** 26 August 27 August 28 August** 29 August** 30 August**
1 - (S001) Time from exposure to contact isolation / quarantine 80% within 96 hours 43% - 18% 50% - - -
2 – (S002) Time from case first symptom to contact isolation / quarantine 80% within 96 hours 27% - 11% 83% - - -
3 – (S003) Time from test sample taken to
close contact isolation / quarantine
80% within 72 hours 81% - 63% 100% 94% - -
4 – (C001) Time from first symptom to test sample taken for positive cases 80% within 48 hours
0% *
(0/5) 0% *
(0/2) 0% *
(0/8) 40% 71% 50% -
5 – (L001) Time from test sample taken to notification of positive result 80% within 24 hours 100% 100% 30% 100% 56% 50% 100%
6 – (P002) Time from case notification to isolation / quarantine of contact 80% within 48 hours 83% - 63% 100% 94% 100% -
7 – (P001) Time from notification to case interview 80% within 24 hours 100% 100% 100% 100% 100% 100% 100%
8 – (P003) Time from close contact identification to isolated /
quarantined 80% within 24 hours 78% - 92% 100% 95% 100% 100%
10 – (P004) Proportion of contacts traced in 48 hours 80% within 48 hours 83% - 63% 100% 95% 100% -
C – (S005) Proportion of close contacts with confirmed or suspected
COVID-19 at the time of tracing <20% 0% - 8%
17% *
(1/6) 0% 0% 0%
• * The numerator and denominator are provided in some instances to provide context for low percentages.
• **Data is not available for metrics where there is no data that meets the definition, or where the time/days to reach target has not fully elapsed
• The value of P002 can drop due to the addition of new close contacts to exposure events after the 48-hour period since case notification had elapsed. This can happen for a
number of reasons, including a case recalling further details following the original case interview.
• These metrics report all cases during the specified period, including those in Managed Isolation and Quarantine, and do not include casual contacts.
• There are three additional indicators under development requiring both technical and clinical input to define data requirements. These are due to be completed by end October
2020.

17
APPENDIX: 4
NRHCC Testing Report
Novel Coronavirus (COVID-19)
Issued: 1700 31 August 2020
Table 1. Metro Auckland Summary Total of Testing for 31 August 2020
Community MIQ
staff
MIQ
guests
Airport Maritime port TOTAL
5:00pm 2690 152 418 199 99 3558
Table 2. Totals tests receipted from 12 August 2020, by ethnicity (as at 5pm)
Ethnicity Last 24 Hours %
Total since
12/8* %
Asian 861 18.8% 25482 16.9%
Maori 604 13.2% 22908 15.2%
Other 2033 44.5% 63163 42.0%
Pacific 916 20.0% 36178 24.1%
Unknown 157 3.4% 2659 1.8%
Total 4571 150390
Tests Last 24-hours
Ethnicity CTC Non-CTC Total %
Asian 748 113 861 18.8%
Maori 528 76 604 13.2%
Other 1702 331 2033 44.5%
Pacific 832 84 916 20.0%
Unknown 121 36 157 3.4%
Total 3931 640 4571
*Swab taken in last 24 hours taken between midnight and midnight, may have been receipted and
reported later than this; tests only included if coded and received and acknowledged by lab, result
not required
*Includes GP clinics, Urgent Care Centres, Designated practices

IN CONFIDENCE – NOT FOR DISTRIBUTION
18
Table 4. Estimated tests taken 12-31 August 2020, based on manual site reports at 5pm
Site 12/08-16/08 17/08-23/08 24/08 – 30/08 31/08*
MIQ Staff 2132 659 1488 152
Guests 2972 3767 3600 418
Border Airport 2129 933 1349 199
Port 1588 678 161 99
* 31/8 day still in progress
Table 5: Estimated tests taken at Metro Auckland CTCs, 12-31 August 2020, based on manual
site reports at 4pm
Site 12/08-16/08 (days
open)
17/08-23/08 (days
open)
24/08 – 30/08
(days open)
31/08*
Airport Oaks 1148 (4) 515 (7) 366 (7) 61
Auckland Netball
Centre
192 (1) 1065 (7) 884 (7) 148
Botany CTC 1151 (5) 948 (7) 905 (7) 174
Coast to Coast
Warkworth
334 (5) 109 (7) 70 (7) 12
Coast to Coast
Wellsford
203 (5) 114 (7) 116 (7) 23
Eventfinda Stadium 1800 (5) 527 (7) 517 (7) N/A
Health New Lynn 2603 (5) 1258 (7) 1703 (7) 159
Henderson 940 (4) 645 (7) 634 (7) 94
Mangere Town Centre 1748 (3) 1684 (7) 1599 (7) 76
Manurewa Marae N/A 124 (4) 268 (6) 70
Northcare A&M 253 (2) 463 (7) 527 (7) 187
Otara CTC 3221 (5) 1712 (7) 1429 (7) 223
Pukekohe CTC N/A 131 (4) 226 (6) 78
St Lukes 1368 (5) 1045 (7) 1414 (7) 178
Takanini Urgent Care 1886 (5) 1216 (7) 1153 (7) 204
Waiheke Medical
Centre
312 (5) 145 (7) 220 (7) 24
Whanau House 2502 (5) 1371 (7) 1442 (7) 232
Whanau Ora - Central 1957 (5) 964 (7) 1583 (7) 187

IN CONFIDENCE – NOT FOR DISTRIBUTION
19
Whanau Ora - North 1442 (5) 669 (7) 637 (7) 190
Whanau Ora - South 2945 (5) 1250 (7) 718 (7) 175
Point England Pop Up N/A N/A 88 (3) N/A
Randwick Park Pop Up N/A N/A 303 (5) N/A
Ranui Pop Up N/A N/A 409 (5) N/A
Mt Smart Stadium Pop
Up
N/A N/A 219 (3) N/A
Massey Pop Up N/A N/A 787 (5) N/A
South Kaipara Pop Up N/A N/A 170 (4) N/A
Clendon Pop Up N/A N/A 368 (3) N/A
Mangere Pop Up N/A N/A 472 (2) N/A
Mangere East Pop Up N/A N/A 82 (2) N/A
Otara Pop Up N/A N/A 59 (2) N/A
Otahuhu Pop Up N/A N/A 201 (2) N/A
Mt Roskill Pop Up (330
start)
N/A N/A 217 (2) 108
Sandringham Pop Up N/A N/A N/A 72
Ranui League Club Pop
Up
N/A N/A N/A No data
Waipuna Targeted Site 143 (2) 549 (7) 376 (7) 16
Blockhouse Bay
Targeted Site
N/A 277 (7) 921 (7) 71
Total 26,148 16,781 21,133 2,680 * 29/8 day still in progress N/A = not open as a CTC

IN CONFIDENCE – NOT FOR DISTRIBUTION
20
Appendix 5: Testing by DHB and ethnicity The tables that follow are the number of people tested. The numbers in the laboratory testing
section are the number of laboratory tests processed.
Table 11: Number of people tested for COVID-19 from 12 August to 01 September
Prioritised Ethnicity MPAO
DHB of Domicile Māori Pacific Asian Other Unknown Total
Auckland 2784 5852 7715 16014 354 32719
Bay of Plenty 2360 288 468 5726 76 8918
Canterbury 1344 528 1369 11266 209 14716
Capital and Coast 1149 879 1022 7075 194 10319
Counties Manukau 5918 16629 7387 10216 436 40586
Hawkes Bay 1164 233 175 2978 56 4606
Hutt Valley 613 311 414 2330 41 3709
Lakes 1979 277 448 2572 101 5377
MidCentral 776 206 288 3044 64 4378
Nelson Marlborough 493 133 187 3561 63 4437
Northland 2570 186 209 3349 46 6360
South Canterbury 113 27 67 1211 24 1442
Southern 841 263 510 7188 95 8897
Tairāwhiti 729 49 43 656 20 1497
Taranaki 548 52 138 2072 41 2851
Waikato 3510 828 1102 7875 211 13526
Wairarapa 159 27 29 724 7 946
Waitematā 3604 3698 5750 19361 306 32719
West Coast 45 7 10 269 4 335
Whanganui 526 59 49 1155 20 1809
Unknown 1286 645 586 3467 1628 7612
Total 32511 31177 27966 112110 3996 207760

21
Table 12: Rate per 1000 people tested for COVID-19 from 12 August to 01 September
Prioritised Ethnicity MPAO
DHB of Domicile Māori Pacific Asian Other Total
Auckland 64 104.4 41.2 61.26 59.7
Bay of Plenty 39.5 64.8 23.9 36.39 37
Canterbury 25.6 37.2 22.5 25.25 25.7
Capital and Coast 31.5 39.6 20.4 33.25 32.1
Counties Manukau 66.5 138.5 48.9 48.82 71.3
Hawkes Bay 26.9 36.3 19.1 27.56 27.6
Hutt Valley 23.5 26.6 22.1 24.72 24.6
Lakes 51.4 108.4 46.1 42.88 48.6
MidCentral 21.3 37.1 18.6 24.6 24.2
Nelson Marlborough 30.7 53.8 25.2 28.3 29.2
Northland 42.2 49.5 25.3 30.72 35
South Canterbury 21.3 55.3 28.3 23.44 24.1
Southern 25.1 38.2 19.8 26.87 26.7
Tairāwhiti 29.4 43.8 36.8 29.67 30.4
Taranaki 23.5 37.3 22.2 23.05 23.6
Waikato 36.4 62.1 25 29.26 32
Wairarapa 19.9 32.5 23.3 20.29 20.7
Waitematā 57.6 82.9 40 50.63 51.7
West Coast 11.6 27.7 10.8 9.97 10.5
Whanganui 30.3 38.8 16.7 26.84 27.9
Total 41.8 97.5 36.5 36.2 41.9

1
SITREP 040
Coronavirus disease 2019 (COVID-19)
Issued: 1030 hours 02 September 2020
Information current at: 1000 hours
This report provides a daily update on the COVID-19 health system response. New information is denoted by red text.
Please use the single point of contact email [email protected] for help/support. Your email will be
logged and promptly passed to the appropriate team.
This document is classified IN CONFIDENCE and not for further distribution.
Need to know
COMMUNITY CASES
NEW LAST 24 hrs
3
MIQ CASES
NEW LAST 24 hrs
2
COMMUNITY CASES
TOTAL RECOVERED
57
97
COMMUNITY CASES
ACTIVE
94 TOTAL CASES SINCE 11 AUG
151
35
TOTAL CASES SINCE 9 JUN
132
TOTAL ACTIVE CASES IN NZ (COMMUNITY & MIQ): 129
MIQ CASES
TOTAL RECOVERED
MIQ CASES
ACTIVE
LABORATORY TESTS
01 September
10,934
LABORATORY TESTS
26 Aug to 01 Sep
67,497
LABORATORY TESTS
TOTAL
777,560

IN CONFIDENCE – NOT FOR DISTRIBUTION
2
Total COVID-19 cases
Table 1: Total number of COVID-19 cases as at 0900 02 September 2020
Case Status Active Recovered Deceased Total
Confirmed 129 (-3) 1260 (+8) 17 1406 (+5)
Probable 0 346 5 351
Total 129 (-3) 1606 (+8) 22 1757 (+5)*
*Net increase of 5 cases with 8 cases classified as recovered.
Total community cases since 11 August
Table 2: Community cases by DHB and case status as at 0900 02 September 2020
New community cases since 0900 1 September 2020
1. Three new confirmed community cases have been reported. Of these all three have
epidemiological links to the Mt Roskill Evangelical Church sub-cluster.
Community cases linked to the Auckland Community Cluster August 2020
2. 149 of the 151 community cases have been linked to the Auckland Community Cluster
August 2020, as at 0900 02 September. One of the unlinked cases is the Rydges
employee (this investigation has been closed) and the other unlinked case is still under
investigation for an epidemiological and genomic link to the community cluster (see 3).
Community cases under investigation to determine a link to the community cluster
3. Case under investigation is summarised as follows:
o One case (reported 21 August) came through the border on 18 June. The case tested
negative at Day 3 and Day 12 of quarantine. Subsequently the case tested positive on
21 August after being swabbed at a mobile testing clinic in Auckland. A partial
genome has been obtained from sequencing and this case has been provisionally
genomically linked to the community cluster. Further whole genome sequencing is in
progress.1
1 ARPHS Strategic Report 28 August 2020
Case
Status
Counties Manukau Waitematā Auckland Waikato Total
Confirmed 68 36 (+1) 43 (+2) 4 151 (+3)
Probable 0 0 0 0 0
Total 68 36 (+1) 43 (+2) 4 151 (+3)

IN CONFIDENCE – NOT FOR DISTRIBUTION
3
.
Community cases and household contacts at Jet Park
4. As at 0800 2 September there are 104 people isolating in Jet Park from the community.
75 are confirmed cases, the remaining 29 are household contacts. This number will
fluctuate as people finish their isolation and depart from the facility.
MIQ cases
5. As at 0900 2 September there have been two new cases detected at the border since
0900 1 September. In total there are 132 cases that have been detected at the border
since the establishment of MIFs/MIQs.
o The two cases were detected in Rotorua via day 3 testing: one arrived from Dubai,
United Arab Emirates on 28 August (Flight number: EK448). The other one arrived
from Tashkent, Uzbekistan (via Dubai, UAE) on 28 August (Flight number: EK448).
Both cases have been transferred to Jet Park in Auckland for quarantine.
Cases in hospital
6. Seven cases are in hospital with COVID-19.
Table 3: Number of cases in hospital with COVID-19 by DHB as at 0800 2 September 2020
Health system response
Overall approach
7. Our investigation has two main focus areas that run in parallel:
o Source attribution – a focus on investigating the case with the earliest symptom
onset date to gather details actions of movements 14 days prior. This will help to
understand the possible source of the new outbreak.
o Containment – rigorous case investigation, identification of close contacts and
isolation and testing to ensure that chain of transmission is broken.
Overview
There is now a clear increase in cases as a result of the new Mt Roskill Evangelical Church sub-
cluster. Some of these cases have recent symptoms. While the impact of intensive case follow-up
DHB Hospital Number in a general
ward Number in ICU/HDU
Auckland Auckland City 1 0
Counties Manukau Middlemore 1 1
Waitematā North Shore 2 0
Waikato Waikato 1 1
Total - 5 2

IN CONFIDENCE – NOT FOR DISTRIBUTION
4
appears to be working overall, the number of cases associated with the Mt Roskill Evangelical
Church sub-cluster has continued to increase and it is likely that more cases will arise.
Current outbreak investigation priorities2
o Contact tracing and containment around Mt Roskill church sub-cluster
o Seek to identify an epidemiological link for the case to the main cluster
o Clarify whether the case that is a returnee from June is a new infection, and clarify strain
o Contact trace and isolate close contacts exposed on Auckland bus journeys
o Seek to identify epidemiological link to the cluster for cases that have been genomically
linked but not epidemiologically linked.
8. Mt Roskill Evangelical Church is a priority for ARPHS. This is due to ongoing
transmission occurring and concerns that not all contacts have been identified. Several
events are being scoped. The DHB is working closely with Church leaders to:
o Maintain relationships with and support for Church leaders.
o Understand the total number of people that need to be tested.
o Push testing coverage.
o Develop welfare support arrangements for those requiring quarantine.
9. The two family members were isolating at home from 22 August after the
case moved to hospital on 21 August. These family members moved to Jet Park
on 28 August. Contact tracing has not identified any further cases. Investigation to
identify the epidemiological link to the cluster is ongoing.
10. Contact tracing investigation and testing is ongoing for the Botany sub-cluster. This
sub-cluster includes the Botany case reported 28 August and four other cases reported
recently (one on 31 August and three on 1 September). More information to come
when available.
11. There is a sports club associated with the Mt Roskill Evangelical Church. It is being
investigated as both an exposure event and a possible source of the Mt Roskill
Evangelical Church sub-cluster3.
The sports club has been closed for the past two weeks,
therefore none of the club members are being considered close contacts. ARPHS sent
comms to members regarding testing and to date no positive cases have been
reported.4
12. There are new settings of interest being investigated for the Botany sub-cluster,
including casual work places. More information to come when available.
13. Possible Americold links to a previously reported event are being investigated.
More information to come when available.
2 ARPHS Strategic Report 31 August 2020
3 NRHCC Morning Report 2 September 2020
4 ARPHS, Waikato DHB and MoH teleconference 3pm 31 August 2020
s 9(2)(a)
s 9(2)(a)
s 9(2)(a)
s 9(2)(a)
s 9(2)(a)

IN CONFIDENCE – NOT FOR DISTRIBUTION
5
14. Four cases that have been genomically linked to the cluster are still being investigated
by ARPHS to identify their epidemiological link.
o The source of infection is still under investigation. is no
longer being considered as the possible source because analysis of the test result
shows had a more recent infection. have
tested negative.5
o GP.
o The second Mount Albert Grammar student.
o Botany case: and lives in a household with
close links to a second household. Members of the second household are testing
positive.
5 ARPHS, Waikato DHB and MoH teleconference 3pm 31 August 2020
s 9(2)(a) s 9(2)(a)
s 9(2)(a) s 9(2)(a)
s 9(2)(a) s 9(2)(a)
s 9(2)(a)

6
s 9(2)(a)
s 9(2)(a)

IN CONFIDENCE – NOT FOR DISTRIBUTION
7
s 9(2)(a)

8
Waikato Investigation Updates
15. Waikato DHB is leading the contact tracing for the church services and event
associated with the Mount Roskill Evangelical Church sub-cluster.
16. A new case was reported in Tokoroa on the evening of 29 August6. The case is a contact
of an existing case from Tokoroa who is currently in hospital and associated with the
Auckland cluster. The new case works at a medical centre in Tokoroa and it is believed
they had contact with the existing case . The centre is
undergoing a terminal clean and has been closed pending completion of contact
tracing. Contact tracing was originally focused on contacting all staff and patients of
the medical centre back to 25 August, following standard procedures. Contact tracing is
now being extended prior to 25 August. This is a precautionary approach that is being
taken due to the case’s long incubation period and while the onset of symptoms was
27 August, the radiological findings suggest more advanced disease.
Two testing sites were stood up yesterday for testing staff and patients,
these will be available for the rest of the week.
ESR and wider testing8 17. A further 23 community cases are genomically linked with the Auckland cluster. These
cases are from the following known subclusters; Church 1 (3 cases), Church 2 (4 cases),
Finance Now (2 case), Finance Now HH (2 cases), Americold (1 case), Americold HH (4
cases), Household 1 (5 cases), Household 2 (1 case), NZ Courier post (1 case). These
cases are also epidemiologically linked to the cluster.
18.
6 Waikato PHU, email and phone conversation 29-30 August 2020
7 Waikato DHB SITREP 0945 02 September 2020
8 ESR Update email, 0902 01 September 2020
Table 5: Waikato contact tracing and initial/day 12 testing by site as at 0700 02 September 20207
s 9(2)(a)
s 9(2)(a)
s 9(2)(a)
s 9(2)(a)
s 9(2)(g)(i)

IN CONFIDENCE – NOT FOR DISTRIBUTION
9
19. Work is underway to analyse how the whole genome sequencing can be used to tell us
how COVID-19 has been transmitted through the community cluster and to further
inform its management.
20. No direct links have been found between the community outbreak genome
sequencing, with the 35 full and 13 partial (checked for the community mutation, and
confirmed not to show it) genomes currently available from cases in managed isolation
facilities (MIFs).
21.
Contact tracing 22. Between 24 August and 30 August 64% (637 of 993)9 of close contacts have been
contacted within 48 hours of being determined to be a contact. KPI for this metric is
80% of close contacts within 48 hours.
o Note: This is low mainly due to an exposure event and resulting sub-cluster during this period. Around 400 people were identified as close contacts through exposure to a case that was identified via a source attribution investigation. In this instance, the Case was not identified until more than 14 days after the exposure event. After 14 days from an exposure, the need to isolate close contacts has passed as this is the full incubation period, therefore close contacts were not isolated. Despite impacting metrics this delayed case identification and subsequent delayed close contact communication demonstrates that an effective trace back process occurred, leading to successful source identification.
o Notes: This metric reports all cases during the specified period, including those in Managed Isolation and Quarantine, and does not include casual contacts.
Table 6: Close contact tracing recorded in the National Contact Tracing Solution since 11 August as at
0900 02 September 2020
30/08/2020 31/08/2020 01/09/2020 02/09/2020
Number of close contacts
identified1 2587 2621 2743 3192
Number of close contacts
successfully contacted (and are
self-isolating)
2475 2505 2676 2992
Number of close contacts
referred to "finding services"2 6 7 5 4
Number of close contacts
awaiting contact 106 109 62 196
1. Contacts loaded into the National Contact Tracing Solution, and managed by either the National Investigation and Tracing
Unit or the Public Health Units. Contacts from MIQ and overseas cases are not included in this report.
9 Contact Tracing Data, COVID-19 NCCS Analytics and Reporting received 0937 02 September 2020
s 9(2)(g)(i)
s 9(2)(g)(i)

IN CONFIDENCE – NOT FOR DISTRIBUTION
10
2. "Finding services" refers to the mechanism the National Close Contact Service uses to find valid contact details for close
contacts we do not have the correct contact details for. These services utilise internal Ministry of Health databases along with
Police, Customs and Airlines where relevant.
3. The total number and number successfully contacted can decrease due to duplicates and invalid records being removed from
the system.
COVID-19 Tracer App usage Figure 1: COVID-19 Tracer App10 cumulative registered users and daily scans/manual entries as at
1615 01 September 2020
1. The number of scans and manual entries on any given date is subject to change for up to 31 days. This is because there can be
a delay before anonymised analytic information is received (e.g. device not connected to internet when scan carried out).
2. The number of App registrations and QR codes for any given date is subject to change for up to 1 day. This is because due to
reporting timeframes these numbers may be extracted before the 12pm cut-off for the reporting period.
23. Key Numbers:
o 2,022,800 - Total registered users
o 2,077,426 - QR code scans between 1200 31 August and 1200 01 September
10 Response Analyst – Digital Channels, 1621 01 September 2020
0
500,000
1,000,000
1,500,000
2,000,000
2,500,000
0
500,000
1,000,000
1,500,000
2,000,000
2,500,000
20
/05
/20
20
23
/05
/20
20
26
/05
/20
20
29
/05
/20
20
1/0
6/2
02
04
/06
/20
20
7/0
6/2
02
01
0/0
6/2
02
01
3/0
6/2
02
01
6/0
6/2
02
01
9/0
6/2
02
02
2/0
6/2
02
02
5/0
6/2
02
02
8/0
6/2
02
01
/07
/20
20
4/0
7/2
02
07
/07
/20
20
10
/07
/20
20
13
/07
/20
20
16
/07
/20
20
19
/07
/20
20
22
/07
/20
20
25
/07
/20
20
28
/07
/20
20
31
/07
/20
20
3/0
8/2
02
06
/08
/20
20
9/0
8/2
02
01
2/0
8/2
02
01
5/0
8/2
02
01
8/0
8/2
02
02
1/0
8/2
02
02
4/0
8/2
02
02
7/0
8/2
02
03
0/0
8/2
02
0
Dai
ly s
can
s an
d m
anu
al e
ntr
ies
Cu
mu
lati
ve A
pp
reg
istr
atio
ns
COVID Tracer App usage Cumulative App registrations
Scans and manual entries

IN CONFIDENCE – NOT FOR DISTRIBUTION
11
Testing Table 8: Testing by functional groups, as at 0900 02 September 202011
Laboratory testing numbers Table 9: Number of laboratory tests processed nationally as at 0900 01 September12 2020
11 ÉCLAIR/MoH Public Health Intelligence, 1000 02 September 2020
12 Daily Lab Report, 0921 02 September 2020
Reason for test 01 September 26 August – 01 September
GPs and other primary health 3852 28,531
CBACs and pop-ups 2972 34,015
Border workers - air crew 19 214
Border workers - airport staff 107 1372
Border workers - maritime crew 2 44
Border workers - port staff 8 98
Border workers - MIF 71 903
Border workers - MIQ 60 164
Travellers - Staying at MIF 199 2102
Travellers - Staying at MIQ 0 165
Total 7290 67,608
Time period Number of laboratory tests
31 August 10,934
Last 7 days (26 Aug to 01
Sep)
67,497
Total 777,560
IN CONFIDENCE – NOT FOR DISTRIBUTION
12
Testing supply update13
24. There are approximately 270,000 complete tests in NZ. Resupply continues to largely
match usage, and additional swab deliveries are expected to arrive this week.
Testing activity by region
Focus areas
25. There are 39 designated community testing centres in the wider Auckland region. Of
these, 20 testing sites are in Auckland city and 19 are community centres outside of the
Auckland city.
Healthline updates14 26. There are incorrect media reports by Radio New Zealand that Healthline had issued
instructions to its staff telling them to instruct South and West Aucklander’s to get
tested. There is no email as reported, nor were our staff or scripts ever changed to
reflect this. Our clinical advice to staff was inline with the Ministry’s intent and agreed
with the Ministry late last week. Once media started reporting the incorrect information,
we advised our staff that this information was not correct and adherence to our scripts
was paramount as always. Our comms team is working with MOH comms to have this
potentially retracted.
27. On 01 September there were 3,334 contacts in Healthline. Of those calls, 1,618 were to
the COVID-19 Info line. Demand on 1737 Need to talk? and other mental health services
was 648 contacts (in line with forecast).
28. The introduction of self-service text and digital channels on their IVR systems saw 89
people self-serve on 30 August. Healthline have put a live revised testing referral
process to support the testing strategy and will continue to quality assure this over the
weekend.
29. The main themes yesterday/today:
o On 01 September Healthline continued to have people call regarding confusion on
South and West Aucklander’s needing to get tested. Healthline continued to advise
callers inline with the Healthline agreed interpretation of the testing strategy and
how they support this.
o Healthline reported that certain communities are feeling particularly vulnerable with
the most recent change in Alert Levels. Their concern is particularly around returning
to work. The pressure they are feeling is regarding two areas:
13 Health Supply Chain email, 0907 30 August 2020
14 National Telehealth Service Coronavirus Update, 0932 02 September 2020
IN CONFIDENCE – NOT FOR DISTRIBUTION
13
▪ Unlike previously, communications have not singled out certain communities
and how their risk is different/increased.
▪ Due to the duration of COVID, the heightened pressure from employers to
have them back in the workplace regardless of the risk posed to their
community (COVID-19)
o Symptomatic and asymptomatic Service User’s wanting to be tested.
o People having welfare needs associated with the lock down.
Logistics
Health Workforce15
30. Health Workforce have identified a small group of people on the surge workforce who
have indicated they would be willing to work in an ARC facility in the event of an
outbreak – this week we will work on whether this pool can be expanded and actions to
keep the group “warm” in the event ARC employers require them.
31. Upskilling of alternative workforces for testing continues to progress, including plans
for a training package and scoping of micro-credentialing, in addition to understanding
where this workforce would be obtained from. It is anticipated this training package will
be available within four weeks (estimated).
32. Health Workforce continue to work with TAS and all 20 GMsHR on workforce needs and
issues – regular workforce intelligence information will be provided to Health
Workforce, which will be incorporated into frequent dashboard reports.
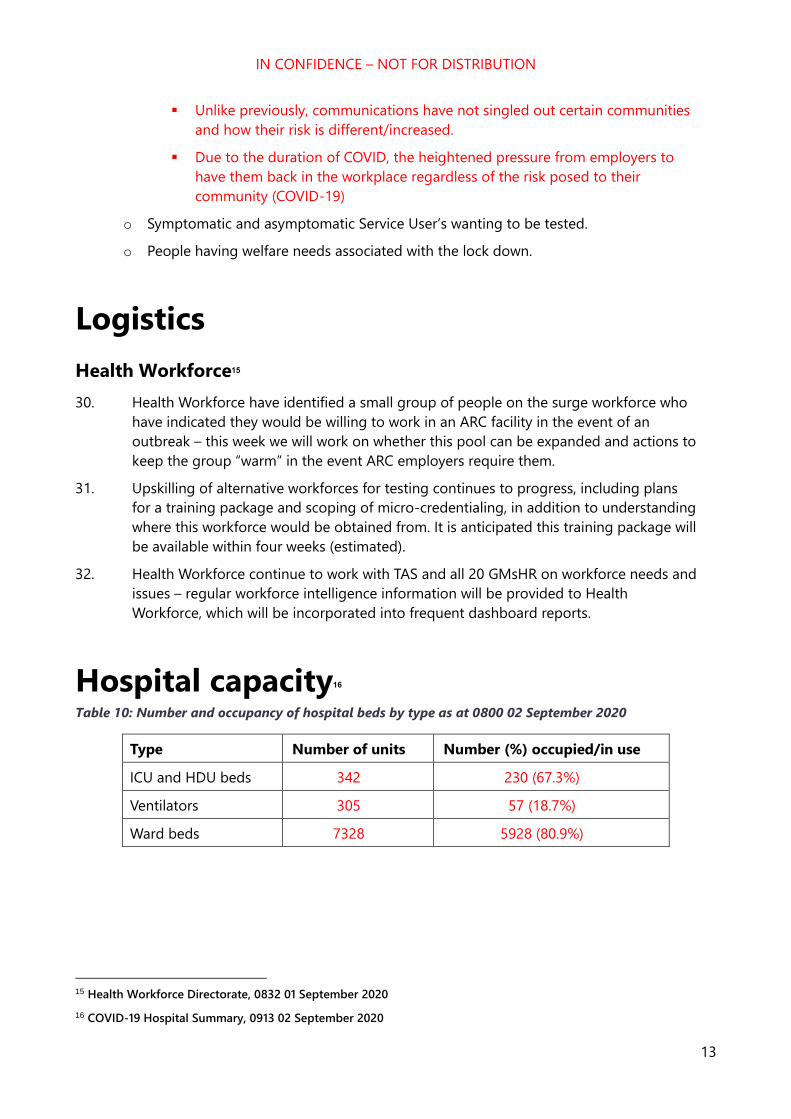
Hospital capacity16 Table 10: Number and occupancy of hospital beds by type as at 0800 02 September 2020
Type Number of units Number (%) occupied/in use
ICU and HDU beds 342 230 (67.3%)
Ventilators 305 57 (18.7%)
Ward beds 7328 5928 (80.9%)
15 Health Workforce Directorate, 0832 01 September 2020
16 COVID-19 Hospital Summary, 0913 02 September 2020

14
Appendix 1: Case summary Table 11: All community cases reported between 0900 01 September and 0900 02 September
s 9(2)(a)

15
s 9(2)(a)

16
Appendix 3: COVID-19 Provisional Disease Indicators, by date
of case notification Indicator (as
per Table 9832) Refined Indicator description Target 25 August** 26 August*** 27 August 28 August 29 August** 30 August** 31 August**
1 - (S001) Time from exposure to contact isolation / quarantine 80% within 96 hours - 5% 50% 76% - - -
2 – (S002) Time from case first symptom to contact isolation / quarantine 80% within 96 hours - 3% 83% 67% - - -
3 – (S003) Time from test sample taken to
close contact isolation / quarantine
80% within 72 hours - 44% 100% 95% 86% - -
4 – (C001) Time from first symptom to test sample taken for positive cases 80% within 48 hours
0% *
(0/2) 0% *
(0/8) 40% 71% 33% 100% -
5 – (L001) Time from test sample taken to notification of positive result 80% within 24 hours 100% 30% 100% 56% 50% 100% 36%
6 – (P002) Time from case notification to isolation / quarantine of contact 80% within 48 hours - 44% 100% 94% 86% 100% -
7 – (P001) Time from notification to case interview 80% within 24 hours 100% 100% 100% 100% 100% 100% 100%
8 – (P003) Time from close contact identification to isolated /
quarantined 80% within 24 hours - 55% 100% 95% 100% 100% 81%
10 – (P004) Proportion of contacts traced in 48 hours 80% within 48 hours - 63% 100% 95% 86% 100% -
C – (S005) Proportion of close contacts with confirmed or suspected
COVID-19 at the time of tracing <20% - 4% 17% 0% 0% 0% 2%
• * The numerator and denominator are provided in some instances to provide context for low percentages.
• **Data is not available for metrics where there is no data that meets the definition, or where the time/days to reach target has not fully elapsed
• *** The metrics for Indicators S001, S002, S003, P002 on the 25 August are low mainly due to an exposure event and resulting sub-cluster during this period. Around 400 people were identified as close contacts through exposure to a case that was identified via a
source attribution investigation. In this instance, the Case was not identified until more than 14 days after the exposure event. After 14 days from an exposure, the need to isolate close contacts has passed as this is the full incubation period, therefore close contacts
were not isolated. Despite impacting metrics this delayed case identification and subsequent delayed close contact communication demonstrates that an effective trace back process occurred, leading to successful source identification.
• The value of P002 can drop due to the addition of new close contacts to exposure events after the 48-hour period since case notification had elapsed. This can happen for a number of reasons, including a case recalling further details following the original case
interview.
• These metrics report all cases during the specified period, including those in Managed Isolation and Quarantine, and do not include casual contacts.
• There are three additional indicators under development requiring both technical and clinical input to define data requirements. These are due to be completed by end October 2020.

17
APPENDIX: 4
NRHCC Testing Report
Novel Coronavirus (COVID-19)
Issued: 1700 01 September 2020
Table 1. Metro Auckland Summary Total of Testing for 01 September 2020
Community MIQ
staff
MIQ
guests
Airport Maritime port TOTAL
5:00pm 2202 10 399 205 18 2834
Table 2. Totals tests receipted from 12 August 2020, by ethnicity (as at 5pm)
*Swab taken in last 24 hours taken between midnight and midnight, may have been receipted and
reported later than this; tests only included if coded and received and acknowledged by lab, result
not required
*Includes GP clinics, Urgent Care Centres, Designated practices
Table 4. Estimated tests taken since 12 August 2020, based on manual site reports at 5pm
Site 12/08-16/08 17/08-23/08 24/08 – 30/08 31/08* 01/09*
MIQ Staff 2132 659 1488 152 10
Guests 2972 3767 3600 418 399
Border Airport 2129 933 1349 199 205
Tests Last 24 hours Total since 12/8*
Ethnicity CTC
Non-
CTC
Total
% Tests %
Asian 529 342 871 16.0% 26447 16.9%
Maori 546 306 852 15.7% 23756 15.2%
Other 1239 960 2199 40.4% 65473 42.0%
Pacific 914 468 1382 25.4% 37626 24.1%
Unknown 38 97 135 2.5% 2735 1.8%
Total 3266 2173 5439 156037

IN CONFIDENCE – NOT FOR DISTRIBUTION
18
Port 1588 678 161 99 18
(started
at 1pm)
* 01/09 day still in progress
Table 5: Estimated tests taken at Metro Auckland CTCs, since 12 August 2020, based on
manual site reports at 4pm
Site 12/08-
16/08
(days
open)
17/08-23/08
(days open)
24/08 – 30/08
(days open)
31/08 01/09*
Airport Oaks 1148 (4) 515 (7) 366 (7) 61 39
Auckland Netball Centre 192 (1) 1065 (7) 884 (7) 148 107
Botany CTC 1151 (5) 948 (7) 905 (7) 180 120
Coast to Coast Warkworth 334 (5) 109 (7) 70 (7) 12 9
Coast to Coast Wellsford 203 (5) 114 (7) 116 (7) 23 16
Eventfinda Stadium 1800 (5) 527 (7) 517 (7) N/A N/A
Health New Lynn 2603 (5) 1258 (7) 1703 (7) 159 145
Henderson 940 (4) 645 (7) 634 (7) 94 80
Mangere Town Centre 1748 (3) 1684 (7) 1599 (7) 76 190
Manurewa Marae N/A 124 (4) 268 (6) 70 40
Northcare A&M 253 (2) 463 (7) 527 (7) 63 240
Otara CTC 3221 (5) 1712 (7) 1429 (7) 249 170
Pukekohe CTC N/A 131 (4) 226 (6) 78 65
St Lukes 1368 (5) 1045 (7) 1414 (7) 178 131
Takanini Urgent Care 1886 (5) 1216 (7) 1153 (7) 204 124
Waiheke Medical Centre 312 (5) 145 (7) 220 (7) 24 23
Whanau House 2502 (5) 1371 (7) 1442 (7) 232 172
Whanau Ora - Central 1957 (5) 964 (7) 1583 (7) 187 137
Whanau Ora - North 1442 (5) 669 (7) 637 (7) 207 212
Whanau Ora - South 2945 (5) 1250 (7) 718 (7) 175 91
Point England Pop Up N/A N/A 88 (3) N/A
Randwick Park Pop Up N/A N/A 303 (5) N/A
Ranui Pop Up N/A N/A 409 (5) N/A

IN CONFIDENCE – NOT FOR DISTRIBUTION
19
Mt Smart Stadium Pop Up N/A N/A 219 (3) N/A N/A
Massey Pop Up N/A N/A 787 (5) N/A N/A
South Kaipara Pop Up N/A N/A 170 (4) N/A N/A
Clendon Pop Up N/A N/A 368 (3) N/A N/A
Mangere Pop Up N/A N/A 472 (2) N/A N/A
Mangere East Pop Up N/A N/A 109 (2) N/A No data
Otara Pop Up N/A N/A 59 (2) N/A N/A
Otahuhu Pop Up N/A N/A 201 (2) N/A N/A
Mt Roskill Pop Up (330 start) N/A N/A 217 (2) 108 N/A
Sandringham Pop Up N/A N/A N/A 72 69
Ranui League Club Pop Up N/A N/A N/A 34 No data
Glen Eden Pop Up N/A N/A N/A N/A No data
Southmall Pop Up N/A N/A N/A N/A No data
Waipuna Targeted Site 143 (2) 549 (7) 376 (7) 16 22
Blockhouse Bay Targeted Site N/A 277 (7) 921 (7) 71 No data
Total 26,148 16,781 21,215 2,722 2,202 * 01/09 day still in progress N/A = not open as a CTC

IN CONFIDENCE – NOT FOR DISTRIBUTION
20
Appendix 5: Testing by DHB and ethnicity The tables that follow are the number of people tested. The numbers in the laboratory testing
section are the number of laboratory tests processed.
Table 12: Number of people tested for COVID-19 from 12 August to 02 September
Prioritised Ethnicity MPAO
DHB of Domicile Māori Pacific Asian Other Unknown Total
Auckland 2818 5914 7801 16199 356 33088
Bay of Plenty 2392 292 476 5835 76 9071
Canterbury 1364 533 1384 11470 212 14963
Capital and Coast 1182 907 1052 7288 202 10631
Counties Manukau 5968 16733 7432 10305 436 40874
Hawkes Bay 1189 243 177 3024 57 4690
Hutt Valley 629 328 428 2401 41 3827
Lakes 2046 281 467 2703 101 5598
MidCentral 781 207 290 3050 64 4392
Nelson Marlborough 497 133 188 3616 63 4497
Northland 2603 189 211 3406 46 6455
South Canterbury 119 27 67 1289 24 1526
Southern 859 266 528 7387 97 9137
Tairāwhiti 730 49 43 658 20 1500
Taranaki 563 54 140 2116 41 2914
Waikato 3596 849 1120 8095 215 13875
Wairarapa 160 27 29 728 7 951
Waitematā 3653 3746 5827 19509 307 33042
West Coast 45 7 12 269 4 337
Whanganui 526 59 50 1155 20 1810
Unknown 1301 661 608 3547 1669 7786
Total 33021 31505 28330 114051 4058 210965

21
Table 12: Rate per 1000 people tested for COVID-19 from 12 August to 02 September
Prioritised Ethnicity MPAO
DHB of Domicile Māori Pacific Asian Other Total
Auckland 64.8 105.5 41.7 61.97 60.4
Bay of Plenty 40 65.7 24.3 37.09 37.6
Canterbury 26 37.6 22.8 25.71 26.1
Capital and Coast 32.4 40.9 21 34.25 33.1
Counties Manukau 67 139.3 49.2 49.25 71.8
Hawkes Bay 27.5 37.9 19.3 27.99 28.1
Hutt Valley 24.1 28.1 22.8 25.47 25.4
Lakes 53.2 110 48 45.07 50.6
MidCentral 21.5 37.3 18.7 24.64 24.2
Nelson Marlborough 31 53.8 25.3 28.73 29.6
Northland 42.8 50.3 25.5 31.25 35.5
South Canterbury 22.4 55.3 28.3 24.95 25.5
Southern 25.6 38.6 20.5 27.61 27.4
Tairāwhiti 29.5 43.8 36.8 29.76 30.5
Taranaki 24.1 38.8 22.5 23.54 24.1
Waikato 37.3 63.7 25.4 30.07 32.8
Wairarapa 20.1 32.5 23.3 20.41 20.8
Waitematā 58.4 84 40.5 51.02 52.2
West Coast 11.6 27.7 13 9.97 10.5
Whanganui 30.3 38.8 17.1 26.84 27.9
Total 42.5 98.5 37 36.8 42.5

1
IN CONFIDENCE – NOT FOR DISTRIBUTION
SITREP 041
Coronavirus disease 2019 (COVID-19)
Issued: 1030 hours 03 September 2020
Information current at: 1000 hours
This report provides a daily update on the COVID-19 health system response. New information is denoted by red text.
Please use the single point of contact email [email protected] for help/support. Your email will be
logged and promptly passed to the appropriate team.
This document is classified IN CONFIDENCE and not for further distribution.
Need to know
COMMUNITY CASES
NEW LAST 24 hrs
1
MIQ CASES
NEW LAST 24 hrs
1
COMMUNITY CASES
TOTAL RECOVERED
73
97
COMMUNITY CASES
ACTIVE
79 TOTAL CASES SINCE 11 AUG
152
36
TOTAL CASES SINCE 9 JUN
133
TOTAL ACTIVE CASES IN NZ (COMMUNITY & MIQ): 115
MIQ CASES
TOTAL RECOVERED
MIQ CASES
ACTIVE
LABORATORY TESTS
02 September
10,521
LABORATORY TESTS
27 Aug to 02 Sep
68,761
LABORATORY TESTS
TOTAL
788,081

IN CONFIDENCE – NOT FOR DISTRIBUTION
2
Total COVID-19 cases
Table 1: Total number of COVID-19 cases as at 0900 03 September 2020
Case Status Active Recovered Deceased Total
Confirmed 115 (-14) 1276 (+16) 17 1408 (+2)
Probable 0 346 5 351
Total 115 (-14) 1622(+16) 22 1759 (+2)*
*Net increase of 2 cases with 16 cases classified as recovered.
Total community cases since 11 August
Table 2: Community cases by DHB and case status as at 0900 03 September 20201
*Please note a decrease in two cases at Waikato DHB due to previous movement of two cases already reported from Waikato
DHB to Counties Manukau DHB. The totals in the table only reflect the one new case being reported today due to these changes
occurring previously.
New community cases since 0900 02 September 2020
1. One new confirmed community case has been reported. The case has an
epidemiological link with cases associated with the Americold household sub-cluster.
Community cases linked to the Auckland Community Cluster August 2020
2. 150 of the 152 community cases have been linked to the Auckland Community Cluster
August 2020, as at 0900 03 September. One of the unlinked cases is the Rydges
employee (this investigation has been closed) and the other unlinked case is still under
investigation for an epidemiological and genomic link to the community cluster (see 3).
Community cases under investigation to determine a link to the community cluster
3. Case under investigation is summarised as follows:
o One case (reported 21 August) came through the border on 18 June. The case tested
negative at Day 3 and Day 12 of quarantine. Subsequently the case tested positive on
21 August after being swabbed at a mobile testing clinic in Auckland. A partial
1 EpiSurv
Case
Status
Counties Manukau Waitematā Auckland Waikato Total
Confirmed 71 (+1) 36 43 2 152 (+1)
Probable 0 0 0 0 0
Total 71 (+1) 36 43 2* 152 (+1)

IN CONFIDENCE – NOT FOR DISTRIBUTION
3
.
genome has been obtained from sequencing and this case has been provisionally
genomically linked to the community cluster. Further whole genome sequencing is in
progress.2
Community cases and household contacts at Jet Park
4. As at 0800 3 September there are 92 people isolating in Jet Park from the community.
67 are confirmed cases, the remaining 25 are household contacts. This number will
fluctuate as people finish their isolation and depart from the facility.3
MIQ cases
5. As at 0900 3 September there has been one new case detected at the border since
0900 2 September. In total there are 133 cases that have been detected at the border
since the establishment of MIFs/MIQs.
o The case was detected in Christchurch via day 3 testing. They arrived in New Zealand
on 29 August from Philippines via Hong Kong and have been in managed isolation at
upon arrival.4
Cases in hospital
6. As at 0800 3 September there are seven cases in hospital with COVID-19.5
Table 3: Number of cases in hospital with COVID-19 by DHB as at 0800 3 September 2020
*Please note within the last 24 hours a patient from Waitematā, North Shorth Hospital was discharged to Jet Park and one new
patient was admitted.
2 ARPHS Strategic Report 28 August 2020
3 NRHCC Morning Report 3 September 2020
4 EpiSurv
5 NRHCC Morning Report 3 September 2020 and Waikato DHB Morning Report 3 September 2020
DHB Hospital Number in a general
ward Number in ICU/HDU
Auckland Auckland City 1 0
Counties Manukau Middlemore 1 1
Waitematā North Shore 2* 0
Waikato Waikato 1 1
Total - 5 2
s 9(2)(a)

IN CONFIDENCE – NOT FOR DISTRIBUTION
4
Health system response
Overall approach
7. Our investigation has two main focus areas that run in parallel:
o Source attribution – a focus on investigating the case with the earliest symptom
onset date to gather details actions of movements 14 days prior. This will help to
understand the possible source of the new outbreak.
o Containment – rigorous case investigation, identification of close contacts and
isolation and testing to ensure that chain of transmission is broken.
Overview6
There is now a clear increase in cases as a result of the new Mt Roskill Evangelical Church sub-
cluster. Some of these cases have recent symptoms. While the impact of intensive case follow-up
appears to be working overall, the number of cases associated with the Mt Roskill Evangelical
Church sub-cluster has continued to increase and it is likely that more cases will arise.
Current outbreak investigation priorities7
o Contact tracing and containment around Mt Roskill church sub-cluster
o Seek to identify an epidemiological link for the case to the main cluster
o Clarify whether the case that is a returnee from June is a new infection, and clarify strain
o Contact trace and isolate close contacts exposed on Auckland bus journeys
o Seek to identify epidemiological link to the cluster for cases that have been genomically
linked but not epidemiologically linked.
8. Mt Roskill Evangelical Church is a priority for ARPHS due to ongoing transmission
occurring and concerns that not all contacts have been identified. Several events
including church services and a wedding are being scoped. This is a joint effort with
ARPHS completing contact tracing for the events and Waikato focusing on source
attribution.8 The DHBs are working closely with Church leaders to:
o Maintain relationships with and support for Church leaders.
o Understand the total number of people that need to be tested.
o Push testing coverage.
o Develop welfare support arrangements for those requiring quarantine.
Sub-clusters and settings of interest
9. The two family members of the were isolating at home from 22 August after the
case moved to hospital on 21 August. These family members moved to Jet Park
6 ARPHS Strategic Report 31 August 2020
7 ARPHS Strategic Report 31 August 2020
8 ARPHS, Waikato DHB and MoH teleconference 3pm 3 September 2020
s 9(2)(a)
s 9(2)(a)
s 9(2)(a)

IN CONFIDENCE – NOT FOR DISTRIBUTION
5
on 28 August. Contact tracing has not identified any further cases. Investigation to
identify the epidemiological link to the cluster is ongoing.
10. Contact tracing investigation and testing is ongoing for the Botany sub-cluster. This
sub-cluster includes the Botany case reported 28 August and four other cases reported
recently (one on 31 August and three on 1 September). More information to come
when available.
11. There are new settings of interest being investigated for the Botany sub-cluster,
including casual work places. More information to come when available.
12. There is a sports club associated with the Mt Roskill Evangelical Church. To date there
are no known exposures confirmed at the sports club.9 It is being investigated as both a
possible exposure event and a possible source of the Mt Roskill Evangelical Church
sub-cluster10.
ARPHS advised on 31 August the sports club had been closed for the two weeks prior,
therefore none of the club members are being considered close contacts. ARPHS sent
comms to members regarding testing and to date no positive cases have been
reported.11 Surveillance testing is underway.12
13. Further investigation of the event mentioned in the 2 September SitRep as a
setting of interest has been explored. Possible links between the event and
Americold associated cases were explored as a possible source of transmission of the
cases infection. The investigation found the onset date and infectious period
dates of the cases do not align. As a result, APRHS have has ruled out this possibility of
transmission source and link of the case to the Americold associated cases.
Further investigation for an epidemiological link for the case is underway.
Case investigation
14. Four cases that have been genomically linked to the cluster are still being investigated
by ARPHS to identify their epidemiological link.
o The source of infection is still under investigation. is no
longer being considered as the possible source because analysis of the test result
shows had a more recent infection. have
tested negative.13
o GP.
o The second Mount Albert Grammar student.
o Botany case: and lives in a household with
close links to a second household. Members of the second household are testing
positive.
9 NRHCC Morning Report 3 September 2020
10 NRHCC Morning Report 2 September 2020
11 ARPHS, Waikato DHB and MoH teleconference 3pm 31 August 2020
12 NRHCC Morning Report 3 September 2020
13 ARPHS, Waikato DHB and MoH teleconference 3pm 31 August 2020
s 9(2)(a)
s 9(2)(a)
s 9(2)(a)
s 9(2)(a)
s 9(2)(a)
s 9(2)(a)
s 9(2)(a) s 9(2)(a)
s 9(2)(a) s 9(2)(a)
s 9(2)(a) s 9(2)(a)
s 9(2)(a)

IN CONFIDENCE – NOT FOR DISTRIBUTION
6
15. The case in Tokoroa reported on 29 August is a contact of an existing case from
Tokoroa who is linked to the Auckland cluster. The case works at a medical centre in
Tokoroa and it is believed they had contact with the existing case
The centre has had a final deep clean and has reopened with reduced
staff. The centre is completing most consultations virtually. Contact tracing is being
completed back to 20 August. This is a precautionary timeframe that is being taken due
to the case’s long incubation period radiological findings suggest more advanced
disease despite 27 August symptom onset date.
. No contacts
have been identified at the . Two testing sites were stood up 30 August for
testing staff and patients, these will be available for the rest of the week.
s 9(2)(a)
s 9(2)(a)
s 9(2)(a)

7
IN CONFIDENCE – NOT FOR DISTRIBUTION
1.
s 9(2)(a)
s 9(2)(a)

IN CONFIDENCE – NOT FOR DISTRIBUTION
8
s 9(2)(a)

9
IN CONFIDENCE – NOT FOR DISTRIBUTION
ESR and wider testing14 16. A total of 104 cases (69%) from the main cluster have been sequenced, 93 (62% of total
confirmed cases) yielded a high-quality genome sequence. Three cases yielded partial
genomes but had sufficient data to indicate that these cases are part of the outbreak
cluster. The remaining eight cases did not have sufficient genetic material to be
sequenced.
17.
18. Work is underway to analyse how the whole genome sequencing can be used to tell us
how COVID-19 has been transmitted through the community cluster and to further
inform its management.
19. No direct links have been found between the community outbreak genome
sequencing, with the 49 full genomes currently available from cases in managed
isolation facilities (MIFs).
20.
Contact tracing 21. Between 25 August and 31 August 70% (722 of 1029)15 of close contacts have been
contacted within 48 hours of being determined to be a contact. KPI for this metric is
80% of close contacts within 48 hours.
o Note: This is low mainly due to an exposure event and resulting sub-cluster during this period. Around 400 people were identified as close contacts through exposure to a case that was identified via a source attribution investigation. In this instance, the Case was not identified until more than 14 days after the exposure event. After 14 days from an exposure, the need to isolate close contacts has passed as this is the full incubation period, therefore close contacts were not isolated. Despite impacting metrics this delayed case identification and subsequent delayed close contact communication demonstrates that an effective trace back process occurred, leading to successful source identification.
o Notes: This metric reports all cases during the specified period, including those in Managed Isolation and Quarantine, and does not include casual contacts.
14 ESR Whole Genome Sequencing Report 02 September 2020
15 Contact Tracing Data, COVID-19 NCCS Analytics and Reporting received 0929 03 September 2020
s 9(2)(g)(i)
s 9(2)(g)(i)

IN CONFIDENCE – NOT FOR DISTRIBUTION
10
Table 6: Close contact tracing recorded in the National Contact Tracing Solution since 11 August as at
0900 03 September 2020
31/08/2020 01/09/2020 02/09/2020 03/09/2020
Number of close contacts
identified1 2621 2743 3192 3162
Number of close contacts
successfully contacted (and are
self-isolating)
2505 2676 2992 2984
Number of close contacts
referred to "finding services"2 7 5 4 4
Number of close contacts
awaiting contact 109 62 196 174
1. Contacts loaded into the National Contact Tracing Solution, and managed by either the National Investigation and Tracing
Unit or the Public Health Units. Contacts from MIQ and overseas cases are not included in this report.
2. "Finding services" refers to the mechanism the National Close Contact Service uses to find valid contact details for close
contacts we do not have the correct contact details for. These services utilise internal Ministry of Health databases along with
Police, Customs and Airlines where relevant.
3. The total number and number successfully contacted can decrease due to duplicates and invalid records being removed from
the system.
COVID-19 Tracer App usage Figure 1: COVID-19 Tracer App16 cumulative registered users and daily scans/manual entries as at
1615 02 September 2020
1. The number of scans and manual entries on any given date is subject to change for up to 31 days. This is because there can be
a delay before anonymised analytic information is received (e.g. device not connected to internet when scan carried out).
16 Response Analyst – Digital Channels, 1625 02 September 2020
0
500,000
1,000,000
1,500,000
2,000,000
2,500,000
0
500,000
1,000,000
1,500,000
2,000,000
2,500,000
20
/05
/20
20
23
/05
/20
20
26
/05
/20
20
29
/05
/20
20
1/0
6/2
02
04
/06
/20
20
7/0
6/2
02
01
0/0
6/2
02
01
3/0
6/2
02
01
6/0
6/2
02
01
9/0
6/2
02
02
2/0
6/2
02
02
5/0
6/2
02
02
8/0
6/2
02
01
/07
/20
20
4/0
7/2
02
07
/07
/20
20
10
/07
/20
20
13
/07
/20
20
16
/07
/20
20
19
/07
/20
20
22
/07
/20
20
25
/07
/20
20
28
/07
/20
20
31
/07
/20
20
3/0
8/2
02
06
/08
/20
20
9/0
8/2
02
01
2/0
8/2
02
01
5/0
8/2
02
01
8/0
8/2
02
02
1/0
8/2
02
02
4/0
8/2
02
02
7/0
8/2
02
03
0/0
8/2
02
02
/09
/20
20 D
aily
sca
ns
and
man
ual
en
trie
s
Cu
mu
lati
ve A
pp
reg
istr
atio
ns
COVID Tracer App usage Cumulative App registrations
Scans and manual entries

IN CONFIDENCE – NOT FOR DISTRIBUTION
11
2. The number of App registrations and QR codes for any given date is subject to change for up to 1 day. This is because due to
reporting timeframes these numbers may be extracted before the 12pm cut-off for the reporting period.
22. Key Numbers:
o 2,050,200 - Total registered users
o 2,123,391 - QR code scans between 1200 01 and 1200 02 September
Testing Table 8: Testing by functional groups, as at 0900 03 September 202017
Laboratory testing numbers Table 9: Number of laboratory tests processed nationally as at 0900 02 September18 2020
17 ÉCLAIR/MoH Public Health Intelligence, 1000 03 September 2020
18 Daily Lab Report, 0928 03 September 2020
Reason for test 02 September 27 August – 02 September
GPs and other primary health 5683 29715
CBACs and pop-ups 3624 33742
Border workers - air crew 40 225
Border workers - airport staff 271 1590
Border workers - maritime crew 2 47
Border workers - port staff 194 285
Border workers - MIF 212 927
Border workers - MIQ 31 186
Travellers - Staying at MIF 392 2152
Travellers - Staying at MIQ 72 155
Total 10521 69024
Time period Number of laboratory tests
02 September 10,521
Last 7 days (27 Aug to 02
Sep)
68,761
Total 788,081

IN CONFIDENCE – NOT FOR DISTRIBUTION
12
Testing supply update19
23. There are approximately 270,000 complete tests in NZ. Resupply continues to largely
match usage, and additional swab deliveries are expected to arrive this week.
Testing activity by region
Focus areas
24. There are 39 designated community testing centres in the wider Auckland region. Of
these, 20 testing sites are in Auckland city and 19 are community centres outside of the
Auckland city.
Healthline updates20 25. After following up with Radio New Zealand, the online items are being updated to
clarify the situation relating to Healthline’s position on instructing South and West
Aucklander’s to get tested. Work is underway to implement the equity improvements
for Pacific peoples that have been identified in the last week.
26. On 02 September there were 2,864 contacts in Healthline. Of those calls, 1,292 were to
the COVID-19 Info line. Demand on 1737 Need to talk? and other mental health services
was 624 contacts (in line with forecast).
27. The main themes yesterday/today:
o On 02 September Healthline reported that certain communities are feeling
particularly vulnerable with the most recent change in Alert Levels. Their concern is
particularly around returning to work. The pressure they are feeling is regarding two
areas:
▪ Unlike previously, communications have not singled out certain communities
and how their risk is different/increased.
▪ Due to the duration of COVID, the heightened pressure from employers to
have them back in the workplace regardless of the risk posed to their
community (COVID-19).
o Symptomatic and asymptomatic Service User’s wanting to be tested.
o People having welfare needs associated with the lock down.
19 Health Supply Chain email, 0907 30 August 2020
20 National Telehealth Service Coronavirus Update, 0938 03 September 2020

IN CONFIDENCE – NOT FOR DISTRIBUTION
13
Logistics
Health Workforce21
28. Health Workforce have identified a small group of people on the surge workforce who
have indicated they would be willing to work in an ARC facility in the event of an
outbreak – this week we will work on whether this pool can be expanded and actions to
keep the group “warm” in the event ARC employers require them.
29. Upskilling of alternative workforces for testing continues to progress, including plans
for a training package and scoping of micro-credentialing, in addition to understanding
where this workforce would be obtained from. It is anticipated this training package will
be available within four weeks (estimated).
30. Health Workforce continue to work with TAS and all 20 GMsHR on workforce needs and
issues – regular workforce intelligence information will be provided to Health
Workforce, which will be incorporated into frequent dashboard reports.
Hospital capacity22 Table 10: Number and occupancy of hospital beds by type as at 0800 03 September 2020
Type Number of units Number (%) occupied/in use
ICU and HDU beds 342 220 (64.3%)
Ventilators 305 52 (17.0%)
Ward beds 7271 5841 (80.3%)
21 Health Workforce Directorate, 0832 01 September 2020
22 COVID-19 Hospital Summary, 0918 03 September 2020

14
IN CONFIDENCE – NOT FOR DISTRIBUTION
Appendix 1: Case summary Table 11: All community cases reported between 0900 02 September and 0900 03 September
s 9(2)(a)

15
IN CONFIDENCE – NOT FOR DISTRIBUTION
Appendix 2: International case
investigations
s 9(2)(a)

16
IN CONFIDENCE – NOT FOR DISTRIBUTION
Appendix 3: COVID-19 Provisional Disease Indicators, by date
of case notification Indicator (as
per Table 9832) Refined Indicator description Target 26 August*** 27 August 28 August 29 August 30 August** 31 August** 01
September**
1 - (S001) Time from exposure to contact isolation / quarantine 80% within 96 hours 5% 50% 76% 51% - - -
2 – (S002) Time from case first symptom to contact isolation / quarantine 80% within 96 hours 3% 83% 67% 79% - - -
3 – (S003) Time from test sample taken to
close contact isolation / quarantine
80% within 72 hours 53% 100% 95% 84% 100% - -
4 – (C001) Time from first symptom to test sample taken for positive cases 80% within 48 hours
0%*
(0/8) 40% 71% 33% 100% 67% -
5 – (L001) Time from test sample taken to notification of positive result 80% within 24 hours 30% 100% 56% 50% 100% 36% 80%
6 – (P002) Time from case notification to isolation / quarantine of contact 80% within 48 hours 53% 100% 94% 84% 100% 93% -
7 – (P001) Time from notification to case interview 80% within 24 hours 100% 100% 100% 100% 100% 100% 86%
8 – (P003) Time from close contact identification to isolated /
quarantined 80% within 24 hours 64% 100% 95% 100% 100% 93% 70%
10 – (P004) Proportion of contacts traced in 48 hours 80% within 48 hours 63% 100% 95% 84% 100% 93% -
C – (S005) Proportion of close contacts with confirmed or suspected
COVID-19 at the time of tracing <20% 4% 17% 0% 0% 0% 5% 0%
• * The numerator and denominator are provided in some instances to provide context for low percentages.
• **Data is not available for metrics where there is no data that meets the definition, or where the time/days to reach target has not fully elapsed
• *** The metrics for Indicators S001, S002, S003, P002 on the 26 August are low mainly due to an exposure event and resulting sub-cluster during this period. Around 400 people were identified as close contacts through exposure to a case that was identified via a source attribution investigation. In this instance, the
Case was not identified until more than 14 days after the exposure event. After 14 days from an exposure, the need to isolate close contacts has passed as this is the full incubation period, therefore close contacts were not isolated. Despite impacting metrics this delayed case identification and subsequent delayed
close contact communication demonstrates that an effective trace back process occurred, leading to successful source identification.
• The value of P002 can drop due to the addition of new close contacts to exposure events after the 48-hour period since case notification had elapsed. This can happen for a number of reasons, including a case recalling further details following the original case interview.
• These metrics report all cases during the specified period, including those in Managed Isolation and Quarantine, and do not include casual contacts.
• There are three additional indicators under development requiring both technical and clinical input to define data requirements. These are due to be completed by end October 2020.

17
IN CONFIDENCE – NOT FOR DISTRIBUTION
APPENDIX: 4
NRHCC Testing Report
Novel Coronavirus (COVID-19)
Issued: 1700 02 September 2020
Table 1. Metro Auckland Summary Total of Testing for 01 September 2020
Community MIQ
staff
MIQ
guests
Airport Maritime port TOTAL
5:00pm 1733 163 468 252 52 2668
Table 2. Totals tests receipted from 12 August 2020, by ethnicity (as at 5pm)
*Swab taken in last 24 hours taken between midnight and midnight, may have been receipted and
reported later than this; tests only included if coded and received and acknowledged by lab, result
not required
*Includes GP clinics, Urgent Care Centres, Designated practices
Table 3. Estimated tests taken since 12 August 2020, based on manual site reports at 5pm
Site 12/08-16/08 17/08-23/08 24/08 – 30/08 31/08 01/09 02/09*
MIQ Staff 2132 659 1488 152 100 163
Guests 2972 3767 3600 418 399 468
Border Airport 2129 933 1349 199 205 252
Port 1588 678 161 99 19 52
* 02/09 day still in progress
Tests Last 24 hours Total since 12/8*
Ethnicity CTC
Non-
CTC
Total
% Tests %
Asian 465 333 798 17.1% 27,469 17.0%
Maori 468 251 719 15.4% 24,656 15.2%
Other 1004 867 1871 40.2% 68,000 42.0%
Pacific 716 378 1094 23.5% 38,985 24.1%
Unknown 76 100 176 3.8% 2865 1.8%
Total 2729 1929 4658 161,975

IN CONFIDENCE – NOT FOR DISTRIBUTION
18
Table 4: Estimated tests taken at Metro Auckland CTCs, since 12 August 2020, based on
manual site reports at 4pm
Site 12/08-
16/08
(days
open)
17/08-
23/08
(days
open)
24/08 –
30/08 (days
open)
31/08 01/09 02/09*
Airport Oaks 1148 (4) 515 (7) 366 (7) 61 39 24
Auckland Netball Centre 192 (1) 1065 (7) 884 (7) 148 107 107
Botany CTC 1151 (5) 948 (7) 905 (7) 180 125 85
Coast to Coast Warkworth 334 (5) 109 (7) 70 (7) 12 9 4
Coast to Coast Wellsford 203 (5) 114 (7) 116 (7) 23 16 17
Eventfinda Stadium 1800 (5) 527 (7) 517 (7) N/A N/A N/A
Health New Lynn 2603 (5) 1258 (7) 1703 (7) 159 150 107
Henderson 940 (4) 645 (7) 634 (7) 94 80 58
Mangere Town Centre 1748 (3) 1684 (7) 1599 (7) 76 190 160
Manurewa Marae N/A 124 (4) 268 (6) 70 40 N/A
Northcare A&M 253 (2) 463 (7) 527 (7) 63 260 124
Otara CTC 3221 (5) 1712 (7) 1429 (7) 249 187 116
Pukekohe CTC N/A 131 (4) 226 (6) 78 65 39
St Lukes 1368 (5) 1045 (7) 1414 (7) 178 131 118
Takanini Urgent Care 1886 (5) 1216 (7) 1153 (7) 204 124 89
Waiheke Medical Centre 312 (5) 145 (7) 220 (7) 24 23 12
Whanau House 2502 (5) 1371 (7) 1442 (7) 232 172 104
Whanau Ora - Central 1957 (5) 964 (7) 1583 (7) 187 141 112
Whanau Ora - North 1442 (5) 669 (7) 637 (7) 207 230 160
Whanau Ora - South 2945 (5) 1250 (7) 718 (7) 175 110 94
Point England Pop Up N/A N/A 88 (3) N/A N/A N/A
Randwick Park Pop Up N/A N/A 303 (5) N/A N/A N/A
Ranui Pop Up N/A N/A 409 (5) N/A N/A N/A
Mt Smart Stadium Pop Up N/A N/A 219 (3) N/A N/A N/A
Massey Pop Up N/A N/A 787 (5) N/A N/A N/A
South Kaipara Pop Up N/A N/A 170 (4) N/A N/A N/A

IN CONFIDENCE – NOT FOR DISTRIBUTION
19
Clendon Pop Up N/A N/A 368 (3) N/A N/A N/A
Mangere Pop Up N/A N/A 472 (2) N/A N/A N/A
Mangere East Pop Up N/A N/A 109 (2) N/A No
data
N/A
Otara Pop Up N/A N/A 59 (2) N/A N/A N/A
Otahuhu Pop Up N/A N/A 201 (2) N/A N/A N/A
Mt Roskill Pop Up (330 start) N/A N/A 217 (2) 108 N/A N/A
Sandringham Pop Up N/A N/A N/A 87 74 19
Ranui League Club Pop Up N/A N/A N/A 32 101 No
Data
Glen Eden Pop Up N/A N/A N/A N/A 29 24
Southmall Pop Up N/A N/A N/A N/A 108 105
Waipuna Targeted Site 143 (2) 549 (7) 376 (7) 16 25 58
Blockhouse Bay Targeted Site N/A 277 (7) 921 (7) 71 16 No
Data
Total 26,148 16,781 21,215 2735 2552 1733 * 02/09 day still in progress N/A = not open as a CTC

IN CONFIDENCE – NOT FOR DISTRIBUTION
20
Appendix 5: Testing by DHB and ethnicity The tables that follow are the number of people tested. The numbers in the laboratory testing
section are the number of laboratory tests processed.
Table 12: Number of people tested for COVID-19 from 12 August to 03 September
Prioritised Ethnicity MPAO
DHB of Domicile Māori Pacific Asian Other Unknown Total
Auckland 2846 5914 7415 16210 255 32640
Bay of Plenty 2081 236 441 5245 52 8055
Canterbury 1337 521 1271 11038 152 14319
Capital and Coast 1170 893 1026 7295 153 10537
Counties Manukau 6017 16689 7042 10192 359 40299
Hawkes Bay 1134 230 173 2946 38 4521
Hutt Valley 637 332 412 2407 31 3819
Lakes 2008 267 411 2679 74 5439
MidCentral 841 224 296 3366 59 4786
Nelson Marlborough 490 131 194 3539 45 4399
Northland 2603 181 208 3417 31 6440
South Canterbury 120 31 66 1315 13 1545
Southern 848 269 524 7474 67 9182
Tairāwhiti 727 44 47 677 13 1508
Taranaki 575 57 132 2137 31 2932
Waikato 3634 848 1071 8133 168 13854
Wairarapa 173 29 27 791 5 1025
Waitematā 3738 3847 5810 19796 227 33418
West Coast 41 7 12 270 6 336
Whanganui 562 63 51 1232 14 1922
Unknown 1201 593 531 3323 1065 6713
Total 32783 31406 27160 113483 2858 207690

21
IN CONFIDENCE – NOT FOR DISTRIBUTION
Table 12: Rate per 1000 people tested for COVID-19 from 12 August to 03 September
Prioritised Ethnicity MPAO
DHB of Domicile Māori Pacific Asian Other Total
Auckland 65.4 105.5 39.6 62 59.5
Bay of Plenty 34.8 53.1 22.5 33.3 33.4
Canterbury 25.5 36.7 20.9 24.7 25
Capital and Coast 32 40.3 20.4 34.3 32.8
Counties Manukau 67.6 139 46.6 48.7 70.8
Hawkes Bay 26.2 35.8 18.9 27.3 27.1
Hutt Valley 24.4 28.4 22 25.5 25.3
Lakes 52.2 104.5 42.2 44.7 49.1
MidCentral 23.1 40.4 19.1 27.2 26.4
Nelson Marlborough 30.5 53 26.1 28.1 29
Northland 42.8 48.2 25.1 31.3 35.4
South Canterbury 22.6 63.5 27.9 25.5 25.8
Southern 25.3 39.1 20.3 27.9 27.5
Tairāwhiti 29.3 39.4 40.3 30.6 30.7
Taranaki 24.6 40.9 21.2 23.8 24.3
Waikato 37.7 63.6 24.3 30.2 32.7
Wairarapa 21.7 34.9 21.7 22.2 22.4
Waitematā 59.7 86.3 40.4 51.8 52.8
West Coast 10.6 27.7 13 10 10.5
Whanganui 32.4 41.4 17.4 28.6 29.6
Total 42.2 98.2 35.4 36.7 41.9

1
IN CONFIDENCE – NOT FOR DISTRIBUTION
SITREP 042
Coronavirus disease 2019 (COVID-19)
Issued: 1030 hours 04 September 2020
Information current at: 1000 hours
This report provides a daily update on the COVID-19 health system response. New information is denoted by red text.
Please use the single point of contact email [email protected] for help/support. Your email will be
logged and promptly passed to the appropriate team.
This document is classified IN CONFIDENCE and not for further distribution.
Need to know
COMMUNITY CASES
NEW LAST 24 hrs
3
MIQ CASES
NEW LAST 24 hrs
2
COMMUNITY CASES
TOTAL RECOVERED
80
98
COMMUNITY CASES
ACTIVE
75 TOTAL CASES SINCE 11 AUG
155
37
TOTAL CASES SINCE 9 JUN
135
TOTAL ACTIVE CASES IN NZ (COMMUNITY & MIQ): 112
MIQ CASES
TOTAL RECOVERED
MIQ CASES
ACTIVE
LABORATORY TESTS
03 September
9,909
LABORATORY TESTS
28 Aug to 03 Sep
67,660
LABORATORY TESTS
TOTAL
797,990

IN CONFIDENCE – NOT FOR DISTRIBUTION
2
Total COVID-19 cases
Table 1: Total number of COVID-19 cases as at 0900 04 September 2020
Case Status Active Recovered Deceased Total
Confirmed 112 (-3) 1284 (+8) 17 1413 (+5)
Probable 0 346 5 351
Total 112 (-3) 1630 (+8) 22 1764 (+5)*
*Net increase of 5 cases with 8 cases classified as recovered.
Total community cases since 11 August
Table 2: Community cases by DHB and case status as at 0900 04 September 20201
New community cases since 0900 03 September 2020
1. Three new confirmed community case has been reported.
o Two cases are from one household and are epidemiologically linked with cases
associated with the Mt Roskill Evangelical Church sub-cluster.
o One case has very recently been reported in EpiSurv and no information currently
exists about relationships to other cases.
Community cases linked to the Auckland Community Cluster August 2020
2. 152 of the 155 community cases have been linked to the Auckland Community Cluster
August 2020, as at 0900 04 September.
o One of the unlinked cases is the Rydges employee (this investigation has been
closed).
o One case is still under investigation for an epidemiological link to the community
cluster and there is insufficient data to confirm a genomic link to the community
cluster (see 3).
o A new case reported 04 September currently has no information available about
relationships to other cases. The case will be scoped today.
1 EpiSurv
Case
Status
Counties Manukau Waitematā Auckland Waikato Total
Confirmed 73 (+2) 37 (+1) 43 2 155 (+3)
Probable 0 0 0 0 0
Total 73 (+2) 37 (+1) 43 2 155 (+3)

IN CONFIDENCE – NOT FOR DISTRIBUTION
3
Community cases under investigation to determine a link to the community cluster
3. Case under investigation is summarised as follows:
o One case (reported 21 August) came through the border on 18 June. The case tested
negative at Day 3 and Day 12 of quarantine. Subsequently the case tested positive on
21 August after being swabbed at a mobile testing clinic in Auckland. Despite using
two different whole genome sequencing protocols only a partial genome was
obtained. There is insufficient data to confirm the case is genomically linked to the
community cluster.2
Community cases and household contacts at Jet Park
4. As at 0800 4 September there are 82 people isolating in Jet Park from the community.
59 are confirmed cases, the remaining 23 are household contacts. This number will
fluctuate as people finish their isolation and depart from the facility.3
MIQ cases
5. As at 0900 4 September there has been two new cases detected at the border since
0900 3 September. In total there are 135 cases that have been detected at the border
since the establishment of MIFs/MIQs.
o Both cases were detected in Auckland, and are part of a family group that arrived
from India on 23 August. The family was transferred from managed isolation to Jet
Park Quarantine on 28 August after one family member tested positive at Day 3
testing. Subsequently three other family members have tested positive.4
Cases in hospital
6. As at 0800 4 September there are six cases in hospital with COVID-19.5
Table 3: Number of cases in hospital with COVID-19 by DHB as at 0800 4 September 2020
2 ESR WGS report 3 September 2020
3 NRHCC Morning Report 4 September 2020
4 EpiSurv
5 NRHCC Morning Report 4 September 2020 and Waikato DHB Morning Report 4 September 2020
DHB Hospital Number in a general
ward Number in ICU/HDU
Auckland Auckland City 1 0
Counties Manukau Middlemore 0 1
Waitematā North Shore 2 0
Waikato Waikato 1 1
Total - 4 2

IN CONFIDENCE – NOT FOR DISTRIBUTION
4
Health system response
Overall approach
7. Our investigation has two main focus areas that run in parallel:
o Source attribution – a focus on investigating the case with the earliest symptom
onset date to gather details actions of movements 14 days prior. This will help to
understand the possible source of the new outbreak.
o Containment – rigorous case investigation, identification of close contacts and
isolation and testing to ensure that chain of transmission is broken.
Overview6
There is now a clear increase in cases as a result of the new Mt Roskill Evangelical Church sub-
cluster. Some of these cases have recent symptoms. While the impact of intensive case follow-up
appears to be working overall, the number of cases associated with the Mt Roskill Evangelical
Church sub-cluster has continued to increase and it is likely that more cases will arise.
Current outbreak investigation priorities7
o Contact tracing and containment around Mt Roskill church sub-cluster
o Seek to identify an epidemiological link for the case to the main cluster
o Clarify whether the case that is a returnee from June is a new infection, and clarify strain
o Contact trace and isolate close contacts exposed on Auckland bus journeys
o Seek to identify epidemiological link to the cluster for cases that have been genomically
linked but not epidemiologically linked.
8. Mt Roskill Evangelical Church is a priority for ARPHS due to ongoing transmission
occurring and concerns that not all contacts have been identified. Several events
including church services and a are being scoped. This is a joint effort with
ARPHS completing contact tracing for the events and Waikato focusing on source
attribution.8 The DHBs are working closely with Church leaders to:
o Maintain relationships with and support for Church leaders.
o Understand the total number of people that need to be tested.
o Push testing coverage.
o Develop welfare support arrangements for those requiring quarantine.
Sub-clusters and settings of interest
6 ARPHS Strategic Report 31 August 2020
7 ARPHS Strategic Report 31 August 2020
8 ARPHS, Waikato DHB and MoH teleconference 3pm 3 September 2020
s 9(2)(a)
s 9(2)(a)

IN CONFIDENCE – NOT FOR DISTRIBUTION
5
9. Contact tracing investigation and testing is ongoing for the Botany sub-cluster. This
sub-cluster includes the Botany case reported 28 August and four other cases reported
recently (one on 31 August and three on 1 September).
10. Settings of interest are being investigated for the Botany sub-cluster, including casual
work places. More information to come when available.
11. There is a sports club associated with the Mt Roskill Evangelical Church. To date there
are no known exposures confirmed at the sports club.9 It is being investigated as both a
possible exposure event and a possible source of the Mt Roskill Evangelical Church
sub-cluster.10
ARPHS advised on 31 August the sports club had been closed for the two weeks prior,
therefore none of the club members are being considered close contacts. ARPHS sent
comms to members regarding testing and to date no positive cases have been
reported.11 Surveillance testing is underway.12
Case investigation
12. Four cases that have been genomically linked to the cluster are still being investigated
by ARPHS to identify their epidemiological link.
o The source of infection is still under investigation.
o GP.
o The second Mount Albert Grammar student.
o Botany case: and lives in a household with
close links to a second household. Members of the second household are testing
positive.
13. Investigation into source attribution of the Botany cases infection is continuing. A
possible epidemiological link is being explored between the Botany case and previously
reported cases within another household. The symptom onset dates of the possible
epidemiological linked household are prior to the Botany cases’ symptom onset dates.
Further investigation is underway.
14. The case in Tokoroa reported on 29 August is a contact of an existing case from
Tokoroa who is linked to the Auckland cluster. The case works at a medical centre in
Tokoroa and it is believed they had contact with the existing case
The centre has had a final deep clean and has reopened with reduced
staff. The centre is completing most consultations virtually. Contact tracing is being
completed back to 20 August. This is a precautionary timeframe that is being taken due
to the case’s long incubation period radiological findings suggest more advanced
disease despite 27 August symptom onset date.
. Two testing sites were stood up
30 August for testing staff and patients, these will be available for the rest of the week.
9 NRHCC Morning Report 3 September 2020
10 NRHCC Morning Report 2 September 2020
11 ARPHS, Waikato DHB and MoH teleconference 3pm 31 August 2020
12 NRHCC Morning Report 3 September 2020
s 9(2)(a)
s 9(2)(a)
s 9(2)(a)
s 9(2)(a)
s 9(2)(a)
s 9(2)(a)
s 9(2)(a)

6
IN CONFIDENCE – NOT FOR DISTRIBUTION
1.
s 9(2)(a)
s 9(2)(a)

IN CONFIDENCE – NOT FOR DISTRIBUTION
7
s 9(2)(a)

8
IN CONFIDENCE – NOT FOR DISTRIBUTION
ESR and wider testing13 15. A total of 104 cases (69%) from the main cluster have been sequenced, 93 (62% of total
confirmed cases) yielded a high-quality genome sequence. Three cases yielded partial
genomes but had sufficient data to indicate that these cases are part of the outbreak
cluster. The remaining eight cases did not have sufficient genetic material to be
sequenced.
16.
17. Work is underway to analyse how the whole genome sequencing can be used to tell us
how COVID-19 has been transmitted through the community cluster and to further
inform its management.
18. No direct links have been found between the community outbreak genome
sequencing, with the 49 full genomes currently available from cases in managed
isolation facilities (MIFs).
19.
Contact tracing14 20. Between 26 August and 01 September 71% (747 of 1057) of close contacts have been
contacted within 48 hours of being determined to be a contact. KPI for this metric is
80% of close contacts within 48 hours.
o Note: This is low mainly due to an exposure event and resulting sub-cluster during this period. Around 400 people were identified as close contacts through exposure to a case that was identified via a source attribution investigation. In this instance, the Case was not identified until more than 14 days after the exposure event. After 14 days from an exposure, the need to isolate close contacts has passed as this is the full incubation period, therefore close contacts were not isolated. Despite impacting metrics this delayed case identification and subsequent delayed close contact communication demonstrates that an effective trace back process occurred, leading to successful source identification.
o Notes: This metric reports all cases during the specified period, including those in Managed Isolation and Quarantine, and does not include casual contacts.
13 ESR Whole Genome Sequencing Report 02 September 2020
14 COVID-19 NCCS Analytics and Reporting 0904 04 September 2020
s 9(2)(g)(i)
s 9(2)(g)(i)

IN CONFIDENCE – NOT FOR DISTRIBUTION
9
Table 5: Close contact tracing recorded in the National Contact Tracing Solution since 11 August as at
0900 04 September 2020
01/09/2020 02/09/2020 03/09/2020 04/09/2020
Number of close contacts
identified1 2743 3192 3162 3191
Number of close contacts
successfully contacted (and are
self-isolating)
2676 2992 2984 3136
Number of close contacts
referred to "finding services"2 5 4 4 4
Number of close contacts
awaiting contact 62 196 174 51
1. Contacts loaded into the National Contact Tracing Solution, and managed by either the National Investigation and Tracing
Unit or the Public Health Units. Contacts from MIQ and overseas cases are not included in this report.
2. "Finding services" refers to the mechanism the National Close Contact Service uses to find valid contact details for close
contacts we do not have the correct contact details for. These services utilise internal Ministry of Health databases along with
Police, Customs and Airlines where relevant.
3. The total number and number successfully contacted can decrease due to duplicates and invalid records being removed from
the system.
COVID-19 Tracer App usage15 Figure 1: COVID-19 Tracer App cumulative registered users and daily scans/manual entries as at 1615
03 September 2020
1. The number of scans and manual entries on any given date is subject to change for up to 31 days. This is because there can be
a delay before anonymised analytic information is received (e.g. device not connected to internet when scan carried out).
15 Response Analyst – Digital Channels, 1625 03 September 2020
0
500,000
1,000,000
1,500,000
2,000,000
2,500,000
0
500,000
1,000,000
1,500,000
2,000,000
2,500,000
20
/05
/20
20
23
/05
/20
20
26
/05
/20
20
29
/05
/20
20
1/0
6/2
02
04
/06
/20
20
7/0
6/2
02
01
0/0
6/2
02
01
3/0
6/2
02
01
6/0
6/2
02
01
9/0
6/2
02
02
2/0
6/2
02
02
5/0
6/2
02
02
8/0
6/2
02
01
/07
/20
20
4/0
7/2
02
07
/07
/20
20
10
/07
/20
20
13
/07
/20
20
16
/07
/20
20
19
/07
/20
20
22
/07
/20
20
25
/07
/20
20
28
/07
/20
20
31
/07
/20
20
3/0
8/2
02
06
/08
/20
20
9/0
8/2
02
01
2/0
8/2
02
01
5/0
8/2
02
01
8/0
8/2
02
02
1/0
8/2
02
02
4/0
8/2
02
02
7/0
8/2
02
03
0/0
8/2
02
02
/09
/20
20 D
aily
sca
ns
and
man
ual
en
trie
s
Cu
mu
lati
ve A
pp
reg
istr
atio
ns
COVID Tracer App usage Cumulative App registrations
Scans and manual entries

IN CONFIDENCE – NOT FOR DISTRIBUTION
10
2. The number of App registrations and QR codes for any given date is subject to change for up to 1 day. This is because due to
reporting timeframes these numbers may be extracted before the 12pm cut-off for the reporting period.
21. Key Numbers:
o 2,073,900 - Total registered users
o 2,253,122 - QR code scans between 1200 02 and 1200 03 September
Testing16 Table 6: Testing by functional groups, as at 0900 03 September 2020
*Numbers have been sourced from different data extracts in comparison to Table 7.
Laboratory testing numbers17 Table 7: Number of laboratory tests processed nationally as at 0900 03 September 2020
16 ÉCLAIR/MoH Public Health Intelligence, 1000 03 September 2020
17 Daily Lab Report, 0930 04 September 2020
Reason for test 03 September 28 August – 03 September
GPs and other primary health 4728 26,841
CBACs and pop-ups 4238 35,501
Border workers - air crew 41 223
Border workers - airport staff 289 1705
Border workers - maritime crew 0 39
Border workers – Port of Tauranga staff 130 269
Border workers – Remaining Port staff 19 221
Border workers - MIF 210 928
Border workers - MIQ 26 202
Travellers - Staying at MIF 228 2082
Travellers - Staying at MIQ 0 131
Total 9909 68142*
Time period Number of laboratory tests
03 September 9909
Last 7 days (28 Aug to 03 Sep) 67,660
Total 797,990

IN CONFIDENCE – NOT FOR DISTRIBUTION
11
Testing supply update18
22. There are approximately 270,000 complete tests in NZ. Resupply continues to largely
match usage, and additional swab deliveries are expected to arrive this week.
Testing activity by region
Focus areas
23. As at 1700 03 September there are 24 Community testing Centres in the Metro
Auckland area. Two of these are closed CTC's for close contacts only.19
Healthline updates20 24. Overnight Healthline had a water main burst in one of their Auckland sites. The floor
has been closed and staff relocated to other sites. This is NOT impacting service
delivery.
25. After following up with Radio New Zealand, the online items are being updated to
clarify the situation relating to Healthline’s position on instructing South and West
Aucklander’s to get tested. Work is underway to implement the equity improvements
for Pacific peoples that have been identified in the last week.
26. On 03 September there were 2,769 contacts in Healthline. Of those calls, 1,132 were to
the COVID-19 Info line. Demand on 1737 Need to talk? and other mental health services
was 639 contacts (in line with forecast).
27. The main themes yesterday/today:
o On 02 September Healthline reported that certain communities are feeling
particularly vulnerable with the most recent change in Alert Levels. Their concern is
particularly around returning to work. The pressure they are feeling is regarding two
areas:
▪ Unlike previously, communications have not singled out certain communities
and how their risk is different/increased.
▪ Due to the duration of COVID, the heightened pressure from employers to
have them back in the workplace regardless of the risk posed to their
community (COVID-19).
o Symptomatic and asymptomatic Service User’s wanting to be tested.
o People having welfare needs associated with the lock down.
18 Health Supply Chain email, 0907 30 August 2020
19 Community Testing Centres report, 1809 03 September 2020
20 National Telehealth Service Coronavirus Update, 0944 04 September 2020

IN CONFIDENCE – NOT FOR DISTRIBUTION
12
Logistics
Health Workforce21
28. Health Workforce have identified a small group of people on the surge workforce who
have indicated they would be willing to work in an ARC facility in the event of an
outbreak – this week we will work on whether this pool can be expanded and actions to
keep the group “warm” in the event ARC employers require them.
29. Upskilling of alternative workforces for testing continues to progress, including plans
for a training package and scoping of micro-credentialing, in addition to understanding
where this workforce would be obtained from. It is anticipated this training package will
be available within four weeks (estimated).
30. Health Workforce continue to work with TAS and all 20 GMsHR on workforce needs and
issues – regular workforce intelligence information will be provided to Health
Workforce, which will be incorporated into frequent dashboard reports.
Hospital capacity22 Table 8: Number and occupancy of hospital beds by type as at 0800 04 September 2020
Type Number of units Number (%) occupied/in use
ICU and HDU beds 342 218 (63.7%)
Ventilators 305 56 (18.4%)
Ward beds 7273 5829 (80.1%)
21 Health Workforce Directorate, 0832 01 September 2020
22 COVID-19 Hospital Summary, 0855 04 September 2020

13
IN CONFIDENCE – NOT FOR DISTRIBUTION
Appendix 1: Case summaryError! Bookmark not defined. Table 9: All community cases reported between 0900 03 September and 0900 04 September
s 9(2)(a)

14
IN CONFIDENCE – NOT FOR DISTRIBUTION
Appendix 2: International case
investigations
s 9(2)(a)

15
IN CONFIDENCE – NOT FOR DISTRIBUTION
Appendix 3: COVID-19 Provisional Disease Indicators, by date
of case notification14 Indicator (as
per Table 9832) Refined Indicator description Target 27 August 28 August 29 August 30 August 31 August** 1 September**
2 September**
1 - (S001) Time from exposure to contact isolation / quarantine 80% within 96 hours 50% 76% 51% 100% - - -
2 – (S002) Time from case first symptom to contact isolation / quarantine 80% within 96 hours 83% 67% 79% 100% - - -
3 – (S003) Time from test sample taken to
close contact isolation / quarantine
80% within 72 hours 100% 95% 84% 100% 100% - -
4 – (C001) Time from first symptom to test sample taken for positive cases 80% within 48 hours 40% 71% 33% 50% 57%
0% *
(0/3) -
5 – (L001) Time from test sample taken to notification of positive result 80% within 24 hours 100% 56% 50% 100% 36% 80% 100%
6 – (P002) Time from case notification to isolation / quarantine of contact 80% within 48 hours 100% 94% 84% 100% 94% 100% -
7 – (P001) Time from notification to case interview 80% within 24 hours 100% 100% 100% 100% 100% 100% 100%
8 – (P003) Time from close contact identification to isolated /
quarantined 80% within 24 hours 100% 95% 100% 100% 94% 71% 55%
10 – (P004) Proportion of contacts traced in 48 hours 80% within 48 hours 100% 95% 84% 100% 94% 100% -
C – (S005) Proportion of close contacts with confirmed or suspected
COVID-19 at the time of tracing <20% 17% 0% 0% 0% 5% 0% 0%
• * The numerator and denominator are provided in some instances to provide context for low percentages.
• **Data is not available for metrics where there is no data that meets the definition, or where the time/days to reach target has not fully elapsed
• *** The metrics for Indicators S001, S002, S003, P002 on the 26 August are low mainly due to an exposure event and resulting sub-cluster during this period. Around 400 people were identified as close contacts through exposure to a case that was identified via a source attribution investigation. In this instance, the
Case was not identified until more than 14 days after the exposure event. After 14 days from an exposure, the need to isolate close contacts has passed as this is the full incubation period, therefore close contacts were not isolated. Despite impacting metrics this delayed case identification and subsequent delayed
close contact communication demonstrates that an effective trace back process occurred, leading to successful source identification.
• The value of P002 can drop due to the addition of new close contacts to exposure events after the 48-hour period since case notification had elapsed. This can happen for a number of reasons, including a case recalling further details following the original case interview.
• These metrics report all cases during the specified period, including those in Managed Isolation and Quarantine, and do not include casual contacts.
• There are three additional indicators under development requiring both technical and clinical input to define data requirements. These are due to be completed by end October 2020.

16
IN CONFIDENCE – NOT FOR DISTRIBUTION
APPENDIX: 4
NRHCC Testing Report
Novel Coronavirus (COVID-19)
Issued: 1700 03 September 2020
Table 1. Metro Auckland Summary Total of Testing for 03 September 2020
Community MIQ
staff
MIQ
guests
Airport Maritime port TOTAL
5:00pm 1623 120 492 167 74 2476
Table 2. Totals tests receipted from 12 August 2020, by ethnicity (as at 5pm)
*Swab taken in last 24 hours taken between midnight and midnight, may have been receipted and
reported later than this; tests only included if coded and received and acknowledged by lab, result
not required
*Includes GP clinics, Urgent Care Centres, Designated practices
Table 3. Estimated tests taken since 12 August 2020, based on manual site reports at 5pm
Site 12/08-
16/08
17/08-
23/08
24/08 –
30/08
31/08 01/09 02/09 03/09*
MIQ Staff 2132 659 1488 152 100 265 120
Guests 2972 3767 3600 418 399 468 492
Border Airport 2129 933 1349 199 205 252 167
Port 1588 678 161 99 19 52 74
* 03/09 day still in progress
Tests Last 24 hours Total since 12/8*
Ethnicity CTC
Non-
CTC
Total
% Tests %
Asian 430 402 832 22.3% 28,804 17.2%
Maori 319 202 521 14.0% 24,865 14.8%
Other 727 725 1452 38.9% 70,863 42.3%
Pacific 499 323 822 22.0% 39,983 23.8%
Unknown 30 71 101 2.7% 3163 1.9%
Total 2005 1723 3728 167,678

IN CONFIDENCE – NOT FOR DISTRIBUTION
17
Table 4: Estimated tests taken at Metro Auckland CTCs, since 12 August 2020, based on
manual site reports at 4pm
Site 12/08-
16/08
(days
open)
17/08-
23/08
(days
open)
24/08 –
30/08
(days
open)
31/08 01/09 02/09 03/09*
Airport Oaks 1148
(4)
515 (7) 366 (7) 61 39 24 45
Auckland Netball Centre 192 (1) 1065 (7) 884 (7) 148 107 107 86
Botany CTC 1151
(5)
948 (7) 905 (7) 180 125 85 91
Coast to Coast Warkworth 334 (5) 109 (7) 70 (7) 12 9 4 0
Coast to Coast Wellsford 203 (5) 114 (7) 116 (7) 23 16 17 11
Eventfinda Stadium 1800
(5)
527 (7) 517 (7) N/A N/A N/A N/A
Health New Lynn 2603
(5)
1258 (7) 1703 (7) 159 150 126 111
Henderson 940 (4) 645 (7) 634 (7) 94 80 58 76
Mangere Town Centre 1748
(3)
1684 (7) 1599 (7) 76 190 160 152
Manurewa Marae N/A 124 (4) 268 (6) 70 40 N/A N/A
Northcare A&M 253 (2) 463 (7) 527 (7) 63 260 152 107
Otara CTC 3221
(5)
1712 (7) 1429 (7) 249 187 116 77
Pukekohe CTC N/A 131 (4) 226 (6) 78 65 39 41
St Lukes 1368
(5)
1045 (7) 1414 (7) 178 131 118 101
Takanini Urgent Care 1886
(5)
1216 (7) 1153 (7) 204 124 89 80
Waiheke Medical Centre 312 (5) 145 (7) 220 (7) 24 23 12 12
Whanau House 2502
(5)
1371 (7) 1442 (7) 232 172 104 103
Whanau Ora - Central 1957
(5)
964 (7) 1583 (7) 187 141 125 125
Whanau Ora - North 1442
(5)
669 (7) 637 (7) 207 230 171 108

IN CONFIDENCE – NOT FOR DISTRIBUTION
18
Whanau Ora - South 2945
(5)
1250 (7) 718 (7) 175 110 98 84
Point England Pop Up N/A N/A 88 (3) N/A N/A N/A N/A
Randwick Park Pop Up N/A N/A 303 (5) N/A N/A N/A N/A
Ranui Pop Up N/A N/A 409 (5) N/A N/A N/A N/A
Mt Smart Stadium Pop Up N/A N/A 219 (3) N/A N/A N/A N/A
Massey Pop Up N/A N/A 787 (5) N/A N/A N/A N/A
South Kaipara Pop Up N/A N/A 170 (4) N/A N/A N/A N/A
Clendon Pop Up N/A N/A 368 (3) N/A N/A N/A N/A
Mangere Pop Up N/A N/A 472 (2) N/A N/A N/A N/A
Mangere East Pop Up N/A N/A 109 (2) N/A No
data
N/A No
Data
Otara Pop Up N/A N/A 59 (2) N/A N/A N/A N/A
Otahuhu Pop Up N/A N/A 201 (2) N/A N/A N/A N/A
Mt Roskill Pop Up (330 start) N/A N/A 217 (2) 108 N/A N/A N/A
Sandringham Pop Up N/A N/A N/A 87 74 19 N/A
Ranui League Club Pop Up N/A N/A N/A 32 101 No
Data
N/A
Glen Eden Pop Up N/A N/A N/A N/A 29 24 43
Southmall Pop Up N/A N/A N/A N/A 108 105 78
Orakei Pop Up N/A N/A N/A N/A N/A N/A No
Data
Papatoetoe Pop Up N/A N/A N/A N/A N/A N/A 30
Waipuna Targeted Site 143 (2) 549 (7) 376 (7) 16 25 58 45
Blockhouse Bay Targeted Site N/A 277 (7) 921 (7) 71 16 No
Data
17
Total 26,148 16,781 21,215 2735 2552 1733 1623 * 03/09 day still in progress N/A = not open as a CTC

IN CONFIDENCE – NOT FOR DISTRIBUTION
19
Appendix 5: Testing by DHB and ethnicity The tables that follow are the number of people tested. The numbers in the laboratory testing
section are the number of laboratory tests processed.
Table 10: Number of people tested for COVID-19 from 12 August to 04 September
Prioritised Ethnicity MPAO
DHB of Domicile Māori Pacific Asian Other Unknown Total
Auckland 2921 6073 7666 16681 264 33605
Bay of Plenty 2157 245 459 5437 53 8351
Canterbury 1358 530 1303 11280 160 14631
Capital and Coast 1218 925 1064 7571 158 10936
Counties Manukau 6222 17083 7280 10512 366 41463
Hawkes Bay 1177 233 176 3047 41 4674
Hutt Valley 658 350 435 2522 33 3998
Lakes 2063 268 416 2749 75 5571
MidCentral 866 229 299 3444 64 4902
Nelson Marlborough 505 136 199 3645 47 4532
Northland 2659 185 217 3493 31 6585
South Canterbury 124 31 66 1405 12 1638
Southern 890 281 549 7824 66 9610
Tairāwhiti 749 44 49 688 15 1545
Taranaki 583 57 133 2189 33 2995
Waikato 3736 873 1124 8429 166 14328
Wairarapa 179 31 27 830 5 1072
Waitematā 3839 3931 6026 20338 237 34371
West Coast 41 7 12 272 5 337
Whanganui 571 66 52 1248 14 1951
Unknown 1231 606 556 3422 1115 6930
Total 33747 32184 28108 117027 2960 214026

20
IN CONFIDENCE – NOT FOR DISTRIBUTION
Table 11: Rate per 1000 people tested for COVID-19 from 12 August to 04 September
Prioritised Ethnicity MPAO
DHB of Domicile Māori Pacific Asian Other Total
Auckland 67.2 108.3 41 63.8 61.3
Bay of Plenty 36.1 55.1 23.4 34.6 34.6
Canterbury 25.9 37.4 21.4 25.3 25.5
Capital and Coast 33.3 41.7 21.2 35.6 34
Counties Manukau 69.9 142.3 48.2 50.2 72.8
Hawkes Bay 27.2 36.3 19.2 28.2 28
Hutt Valley 25.2 30 23.2 26.8 26.5
Lakes 53.6 104.9 42.8 45.8 50.3
MidCentral 23.8 41.3 19.3 27.8 27.1
Nelson Marlborough 31.5 55 26.8 29 29.9
Northland 43.7 49.2 26.2 32 36.2
South Canterbury 23.3 63.5 27.9 27.2 27.4
Southern 26.5 40.8 21.3 29.2 28.8
Tairāwhiti 30.2 39.4 42 31.1 31.4
Taranaki 25 40.9 21.4 24.3 24.8
Waikato 38.8 65.5 25.5 31.3 33.9
Wairarapa 22.4 37.3 21.7 23.3 23.4
Waitematā 61.3 88.2 41.9 53.2 54.3
West Coast 10.6 27.7 13 10.1 10.5
Whanganui 32.9 43.4 17.8 29 30.1
Total 43.4 100.6 36.7 37.8 43.2

1
IN CONFIDENCE – NOT FOR DISTRIBUTION
SITREP 043
Coronavirus disease 2019 (COVID-19)
Issued: 1030 hours 05 September 2020
Information current at: 1000 hours
This report provides a daily update on the COVID-19 health system response. New information is denoted by red text.
Please use the single point of contact email [email protected] for help/support. Your email will be
logged and promptly passed to the appropriate team.
This document is classified IN CONFIDENCE and not for further distribution.
Need to know
COMMUNITY CASES
NEW LAST 24 hrs
2
MIQ CASES
NEW LAST 24 hrs
1
COMMUNITY CASES
TOTAL RECOVERED
81
98
COMMUNITY CASES
ACTIVE
74 TOTAL CASES SINCE 11 AUG
157
38
TOTAL CASES SINCE 9 JUN
136
TOTAL ACTIVE CASES IN NZ (COMMUNITY & MIQ): 112
MIQ CASES
TOTAL RECOVERED
MIQ CASES
ACTIVE
LABORATORY TESTS
04 September
9,470
LABORATORY TESTS
29 Aug to 04 Sep
67,139
LABORATORY TESTS
TOTAL
807,460

IN CONFIDENCE – NOT FOR DISTRIBUTION
2
Total COVID-19 cases
Table 1: Total number of COVID-19 cases as at 0900 05 September 2020
Case Status Active Recovered Deceased Total
Confirmed 112 1285 (+1) 19 (+2) 1416 (+3)
Probable 0 346 5 351
Total 112 1631 (+1) 24 (+2) 1767 (+3)*
*Net increase of 3 cases, with 1 case classified as recovered and 2 deaths reported.
Total community cases since 11 August
Table 2: Community cases by DHB and case status as at 0900 05 September 20201
New community cases since 0900 04 September 2020
1. Two new community cases have been reported, as at 0900 05 September.
o One case is a close contact of a confirmed case and is linked to the Americold
household sub-cluster. The case has been in isolation at Jet Park from 18 August.
o One case is a close contact of a confirmed case that is linked to the Mt Roskill
Evangelical Church sub-cluster.
Community cases linked to the Auckland Community Cluster August 2020
2. 155 of the 157 community cases have been linked to the Auckland Community Cluster
August 2020, as at 0900 05 September. The unlinked cases are summarised as follows:
o The Rydges employee (this investigation has been closed).
o A case (reported 21 August) is still under investigation for an epidemiological link to
the community cluster and there is insufficient data to confirm a genomic link to the
community cluster (see 3).
1 EpiSurv
Case
Status
Counties Manukau Waitematā Auckland Waikato Total
Confirmed 74 (+1) 38 (+1) 43 2 157 (+2)
Probable 0 0 0 0 0
Total 74 (+1) 38 (+1) 43 2 157 (+2)

IN CONFIDENCE – NOT FOR DISTRIBUTION
3
o
Community cases under investigation to determine a link to the Auckland community
cluster
3. Case under investigation is summarised as follows:
o One case (reported 21 August) came through the border on 18 June. The case tested
negative at Day 3 and Day 12 of quarantine. Subsequently the case tested positive on
21 August after being swabbed at a mobile testing clinic in Auckland. Despite using
two different whole genome sequencing protocols only a partial genome was
obtained. There is insufficient data to confirm the case is genomically linked to the
community cluster. 2 Their epidemiological link to the community cluster is still
under investigation.
Community cases and household contacts at Jet Park
4. As at 0800 05 September there are 77 people isolating in Jet Park from the community.
60 are confirmed cases, the remaining 17 are household contacts. This number will
fluctuate as people finish their isolation and depart from the facility.3
MIQ cases since 0900 04 September 2020
5. One new case4 detected at the border, as at 0900 05 September. In total 136 cases have
been detected at the border since the establishment of MIFs/MIQs.
o The case arrived from India on 23 August and was identified as a close contact of an
existing confirmed case.
Cases in hospital
6. As at 0800 05 September there are two cases in hospital with COVID-19.5
o Two deaths have been reported; one case6 on 04 September was in ICU at
Middlemore Hospital and one case3 on 05 September at Auckland Hospital.
o Two cases were discharged; one case6 on 04 September from Waikato Hospital and
one case on 04 September from North Shore Hospital.
Table 3: Number of cases in hospital with COVID-19 by DHB as at 0800 05 September 2020
2 ESR WGS report 3 September 2020
3 NRHCC Morning Report 5 September 2020
4 EpiSurv
5 NRHCC Morning Report 5 September 2020 and Waikato DHB Morning Report 5 September 2020
6 ARPHS, Waikato DHB and MoH teleconference 3pm 4 September 2020
DHB Hospital Number in a general ward Number in ICU/HDU
Auckland Auckland City 0 0
Counties Manukau Middlemore 0 0
Waitematā North Shore 1 0
Waikato Waikato 0 1
Total - 1 1

IN CONFIDENCE – NOT FOR DISTRIBUTION
4
Health system response
Overall approach
7. Our investigation has two main focus areas that run in parallel:
o Source attribution – a focus on investigating the case with the earliest symptom
onset date to gather details actions of movements 14 days prior. This will help to
understand the possible source of the new outbreak.
o Containment – rigorous case investigation, identification of close contacts and
isolation and testing to ensure that chain of transmission is broken.
Overview7
There is now a clear increase in cases as a result of the new Mt Roskill Evangelical Church sub-
cluster. Some of these cases have recent symptoms. While the impact of intensive case follow-up
appears to be working overall, the number of cases associated with the Mt Roskill Evangelical
Church sub-cluster has continued to increase and it is likely that more cases will arise.
Current outbreak investigation priorities8
o Contact tracing and containment around Mt Roskill church sub-cluster.
o Seek to identify an epidemiological link for the case to the main cluster.
o Clarify whether the case that is a returnee from June is a new infection and clarify strain.
o Contact trace and isolate close contacts exposed on Auckland bus journeys.
o Seek to identify epidemiological link to the cluster for cases that have been genomically
linked but not epidemiologically linked.
8. Mt Roskill Evangelical Church is a priority for ARPHS due to ongoing transmission
occurring and concerns that not all contacts have been identified. Several events
including church services and a wedding are being scoped. This is a joint effort with
ARPHS completing contact tracing for the events and Waikato focusing on source
attribution.9 The DHBs are working closely with Church leaders to:
o Maintain relationships with and support for Church leaders.
o Understand the total number of people that need to be tested.
o Push testing coverage.
o Develop welfare support arrangements for those requiring quarantine.
Sub-clusters and settings of interest
7 ARPHS Strategic Report 31 August 2020
8 ARPHS Strategic Report 31 August 2020
9 ARPHS, Waikato DHB and MoH teleconference 3pm 3 September 2020
s 9(2)(a)

IN CONFIDENCE – NOT FOR DISTRIBUTION
5
9. Contact tracing investigation and testing is ongoing for the Botany sub-cluster. This
sub-cluster includes the Botany case reported 28 August and four other cases reported
recently (one on 31 August and three on 1 September).
10. Settings of interest for the Botany sub-cluster are being investigated, including casual
work places. More information to come when available.
11. There is a sports club associated with the Mt Roskill Evangelical Church. To date there
are no known exposures confirmed at the sports club.10 It is being investigated as both
a possible exposure event and a possible source of the Mt Roskill Evangelical Church
sub-cluster.11
ARPHS advised on 31 August the sports club had been closed for the two weeks prior,
therefore none of the club members are being considered close contacts. ARPHS sent
comms to members regarding testing and to date no positive cases have been
reported.12 Surveillance testing is ongoing.13
Case investigation
12. Four cases that have been genomically linked to the cluster are still being investigated
by ARPHS to identify their epidemiological link.
o The source of infection is still under investigation.
o GP.
o The second Mount Albert Grammar student.
o Botany case: and lives in a household with
close links to a second household. Members of the second household are testing
positive.
13. The community case reported in SITREP 043 04 September, that had no information
available on their relationship to other cases, has now been confirmed to have an
epidemiological link to other confirmed cases and is linked to the Mt Roskill Evangelical
Church sub-cluster.14
14. Investigation into source attribution of the Botany cases infection is continuing. A
possible epidemiological link is being explored between the Botany case and previously
reported cases within another household. The symptom onset dates of the possible
epidemiological linked household are prior to the Botany cases’ symptom onset dates.
Further investigation is underway.
15. The case in Tokoroa reported on 29 August is a contact of an existing case from
Tokoroa who is linked to the Auckland cluster. The case works at a medical centre in
Tokoroa and it is believed they had contact with the existing case
The centre has had a final deep clean and has reopened with reduced
10 NRHCC Morning Report 3 September 2020
11 NRHCC Morning Report 2 September 2020
12 ARPHS, Waikato DHB and MoH teleconference 3pm 31 August 2020
13 NRHCC Morning Report 3 September 2020
14 EpiSurv
s 9(2)(a)
s 9(2)(a)
s 9(2)(a) s 9(2)(a)
s 9(2)(a)
s 9(2)(a)

IN CONFIDENCE – NOT FOR DISTRIBUTION
6
staff. The centre is completing most consultations virtually. Contact tracing is being
completed back to 20 August. This is a precautionary timeframe that is being taken due
to the case’s long incubation period radiological findings suggest more advanced
disease despite 27 August symptom onset date.
On 30 August two testing sites
were stood up for testing staff and patients, these will be available for the rest of the
week.
s 9(2)(a)

7
IN CONFIDENCE – NOT FOR DISTRIBUTION
s 9(2)(a)
s 9(2)(a)

IN CONFIDENCE – NOT FOR DISTRIBUTION
8
s 9(2)(a)

9
IN CONFIDENCE – NOT FOR DISTRIBUTION
ESR and wider testing15 16. A total of 104 cases (69%) from the main cluster have been sequenced, 93 (62% of total
confirmed cases) yielded a high-quality genome sequence. Three cases yielded partial
genomes but had sufficient data to indicate that these cases are part of the outbreak
cluster. The remaining eight cases did not have sufficient genetic material to be
sequenced.
17.
18. Work is underway to analyse how the whole genome sequencing can be used to tell us
how COVID-19 has been transmitted through the community cluster and to further
inform its management.
19. No direct links have been found between the community outbreak genome
sequencing, with the 49 full genomes currently available from cases in managed
isolation facilities (MIFs).
20.
Contact tracing16 21. Between 27 August and 02 September 93% (439 of 472) of close contacts have been
contacted within 48 hours of being determined to be a contact. KPI for this metric is
80% of close contacts within 48 hours.
o Notes: This metric reports all cases during the specified period, including those in Managed Isolation and Quarantine, and does not include casual contacts.
Table 5: Close contact tracing recorded in the National Contact Tracing Solution since 11 August as at
0900 05 September 2020
02/09/2020 03/09/2020 04/09/2020 05/09/2020
Number of close contacts
identified1 3192 3162 3191 3222
Number of close contacts
successfully contacted (and are
self-isolating)
2992 2984 3136 3177
15 ESR Whole Genome Sequencing Report 02 September 2020
16 COVID-19 NCCS Analytics and Reporting 0918 05 September 2020
s 9(2)(g)(i)
s 9(2)(g)(i)

IN CONFIDENCE – NOT FOR DISTRIBUTION
10
Number of close contacts
referred to "finding services"2 4 4 4 4
Number of close contacts
awaiting contact 196 174 51 41
1. Contacts loaded into the National Contact Tracing Solution, and managed by either the National Investigation and Tracing
Unit or the Public Health Units. Contacts from MIQ and overseas cases are not included in this report.
2. "Finding services" refers to the mechanism the National Close Contact Service uses to find valid contact details for close
contacts we do not have the correct contact details for. These services utilise internal Ministry of Health databases along with
Police, Customs and Airlines where relevant.
3. The total number and number successfully contacted can decrease due to duplicates and invalid records being removed from
the system.
COVID-19 Tracer App usage17 Figure 1: COVID-19 Tracer App cumulative registered users and daily scans/manual entries as at 1615
04 September 2020
1. The number of scans and manual entries on any given date is subject to change for up to 31 days. This is because there can be
a delay before anonymised analytic information is received (e.g. device not connected to internet when scan carried out).
2. The number of App registrations and QR codes for any given date is subject to change for up to 1 day. This is because due to
reporting timeframes these numbers may be extracted before the 12pm cut-off for the reporting period.
22. Key Numbers:
o 2,093,900 - Total registered users
o 2,347,579 - QR code scans between 1200 03 and 1200 04 September
17 Response Analyst – Digital Channels, 1628 04 September 2020
0
500,000
1,000,000
1,500,000
2,000,000
2,500,000
3,000,000
0
500,000
1,000,000
1,500,000
2,000,000
2,500,000
20
/05
/20
20
23
/05
/20
20
26
/05
/20
20
29
/05
/20
20
1/0
6/2
02
04
/06
/20
20
7/0
6/2
02
01
0/0
6/2
02
01
3/0
6/2
02
01
6/0
6/2
02
01
9/0
6/2
02
02
2/0
6/2
02
02
5/0
6/2
02
02
8/0
6/2
02
01
/07
/20
20
4/0
7/2
02
07
/07
/20
20
10
/07
/20
20
13
/07
/20
20
16
/07
/20
20
19
/07
/20
20
22
/07
/20
20
25
/07
/20
20
28
/07
/20
20
31
/07
/20
20
3/0
8/2
02
06
/08
/20
20
9/0
8/2
02
01
2/0
8/2
02
01
5/0
8/2
02
01
8/0
8/2
02
02
1/0
8/2
02
02
4/0
8/2
02
02
7/0
8/2
02
03
0/0
8/2
02
02
/09
/20
20 D
aily
sca
ns
and
man
ual
en
trie
s
Cu
mu
lati
ve A
pp
reg
istr
atio
ns
COVID Tracer App usage Cumulative App registrations
Scans and manual entries

IN CONFIDENCE – NOT FOR DISTRIBUTION
11
Testing18 Table 6: Testing by functional groups, as at 0900 03 September 2020
*Numbers have been sourced from different data extracts in comparison to Table 7.
Laboratory testing numbers19 Table 7: Number of laboratory tests processed nationally as at 0900 04 September 2020
Testing supply update20
23. There are approximately 270,000 complete tests in NZ. Resupply continues to largely
match usage, and additional swab deliveries are expected to arrive this week.
18 ÉCLAIR/MoH Public Health Intelligence, 1000 03 September 2020
19 Daily Lab Report, 0859 05 September 2020
20 Health Supply Chain email, 0907 30 August 2020
Reason for test 03 September 28 August – 03 September
GPs and other primary health 4728 26,841
CBACs and pop-ups 4238 35,501
Border workers - air crew 41 223
Border workers - airport staff 289 1705
Border workers - maritime crew 0 39
Border workers – Port of Tauranga staff 130 269
Border workers – Remaining Port staff 19 221
Border workers - MIF 210 928
Border workers - MIQ 26 202
Travellers - Staying at MIF 228 2082
Travellers - Staying at MIQ 0 131
Total 9909 68142*
Time period Number of laboratory tests
04 September 9470
Last 7 days (29 Aug to 04 Sep) 67,139
Total 807,460

IN CONFIDENCE – NOT FOR DISTRIBUTION
12
Testing activity by region
Focus areas
24. As at 1700 03 September there are 24 Community testing Centres in the Metro
Auckland area. Two of these are closed CTC's for close contacts only.21
Healthline updates22 25. On 04 September there were 2,525 contacts in Healthline. Of those calls, 970 were to
the COVID-19 Info line. Demand on 1737 Need to talk? and other mental health services
was 639 contacts (in line with forecast).
26. The main themes yesterday/today:
o Clarification of level announcements made during 04 September.
o Community concern following the announcement of the death late 04 September.
o Symptomatic and asymptomatic Service User’s wanting to be tested.
o People having welfare needs associated with the lock down.
Logistics
Health Workforce23
27. Health Workforce have identified a small group of people on the surge workforce who
have indicated they would be willing to work in an ARC facility in the event of an
outbreak – this week we will work on whether this pool can be expanded and actions to
keep the group “warm” in the event ARC employers require them.
28. Upskilling of alternative workforces for testing continues to progress, including plans
for a training package and scoping of micro-credentialing, in addition to understanding
where this workforce would be obtained from. It is anticipated this training package will
be available within four weeks (estimated).
29. Health Workforce continue to work with TAS and all 20 GMsHR on workforce needs and
issues – regular workforce intelligence information will be provided to Health
Workforce, which will be incorporated into frequent dashboard reports.
21 Community Testing Centres report, 1809 03 September 2020
22 National Telehealth Service Coronavirus Update, 0920 05 September 2020
23 Health Workforce Directorate, 0832 01 September 2020

IN CONFIDENCE – NOT FOR DISTRIBUTION
13
Hospital capacity24 Table 8: Number and occupancy of hospital beds by type as at 0800 05 September 2020
Type Number of units Number (%) occupied/in use
ICU and HDU beds 342 212 (62.0%)
Ventilators 305 46 (15.1%)
Ward beds 7267 5443 (74.9%)
24 COVID-19 Hospital Summary, 0910 05 September 2020

14
IN CONFIDENCE – NOT FOR DISTRIBUTION
Appendix 1: Case summary
Table 9: All community cases reported between 0900 04 September and 0900 05 September
s 9(2)(a)

15
IN CONFIDENCE – NOT FOR DISTRIBUTION
Appendix 2: International case
investigations
s 9(2)(a)

16
IN CONFIDENCE – NOT FOR DISTRIBUTION
Appendix 3: COVID-19 Provisional Disease Indicators, by date
of case notification16 Indicator (as
per Table 9832) Refined Indicator description Target 28 August 29 August 30 August 31 August 1 September**
2 September**
3 September**
1 - (S001) Time from exposure to contact isolation / quarantine 80% within 96 hours 68% 50% 100% - - - -
2 – (S002) Time from case first symptom to contact isolation / quarantine 80% within 96 hours 60% 79% 100% - - - -
3 – (S003) Time from test sample taken to
close contact isolation / quarantine
80% within 72 hours 93% 85% 100% 100% - - -
4 – (C001) Time from first symptom to test sample taken for positive cases 80% within 48 hours 71% 33% 50% 63% 0%
(0/3) - -
5 – (L001) Time from test sample taken to notification of positive result 80% within 24 hours 56% 50% 100% 36% 80% 100% -
6 – (P002) Time from case notification to isolation / quarantine of contact 80% within 48 hours 93% 85% 97% 99% 100% - -
7 – (P001) Time from notification to case interview 80% within 24 hours 100% 100% 100% 100% 100% 100% -
8 – (P003) Time from close contact identification to isolated /
quarantined 80% within 24 hours 95% 100% 97% 99% 71% 55% -
10 – (P004) Proportion of contacts traced in 48 hours 80% within 48 hours 95% 85% 100% 99% 100% - -
C – (S005) Proportion of close contacts with confirmed or suspected
COVID-19 at the time of tracing <20% 0% 0% 0% 4% 0% 0% 0%
• * The numerator and denominator are provided in some instances to provide context for low percentages.
• **Data is not available for metrics where there is no data that meets the definition, or where the time/days to reach target has not fully elapsed
• The value of P002 can drop due to the addition of new close contacts to exposure events after the 48-hour period since case notification had elapsed. This can happen for a number of reasons,
including a case recalling further details following the original case interview.
• These metrics report all cases during the specified period, including those in Managed Isolation and Quarantine, and do not include casual contacts.
• There are three additional indicators under development requiring both technical and clinical input to define data requirements. These are due to be completed by end October 2020.

17
IN CONFIDENCE – NOT FOR DISTRIBUTION
APPENDIX: 4
NRHCC Testing Report
Novel Coronavirus (COVID-19)
Issued: 1700 04 September 2020
Table 1. Metro Auckland Summary Total of Testing for 04 September 2020
Community MIQ
staff
MIQ
guests
Airport Maritime port TOTAL
5:00pm 1227 148 505 156 104 2140
Table 2. Totals tests receipted from 12 August 2020, by ethnicity (as at 5pm)
*Swab taken in last 24 hours taken between midnight and midnight, may have been receipted and
reported later than this; tests only included if coded and received and acknowledged by lab, result
not required
*Includes GP clinics, Urgent Care Centres, Designated practices
Table 3. Estimated tests taken since 12 August 2020, based on manual site reports at 5pm
Site 12/08-
16/08
17/08-
23/08
24/08 –
30/08
31/08 01/09 02/09 03/09 04/09*
MIQ Staff 2132 659 1488 152 100 265 120 148
Guests 2972 3767 3600 418 399 468 492 505
Border Airport 2129 933 1349 199 205 252 167 156
Port 1588 678 161 99 19 52 74 104
* 04/09 day still in progress
Tests Last 24 hours Total since 12/8*
Ethnicity CTC
Non-
CTC
Total
% Tests %
Asian 520 447 967 23.4% 30,090 17.4%
Maori 307 245 552 13.4% 25,473 14.7%
Other 754 782 1536 37.2% 73,222 42.3%
Pacific 551 373 924 22.4% 41,121 23.7%
Unknown 40 112 152 3.7% 3337 1.9%
Total 2172 1959 4131 173,243

IN CONFIDENCE – NOT FOR DISTRIBUTION
18
Table 4: Estimated tests taken at Metro Auckland CTCs, since 12 August 2020, based on
manual site reports at 4pm
Site 12/08-
16/08
(days
open)
17/08-
23/08
(days
open)
24/08 –
30/08
(days
open)
31/08 01/0
9
02/0
9
03/09 04/09*
Airport Oaks 1148 (4) 515 (7) 366 (7) 61 39 24 45 28
Auckland Netball
Centre
192 (1) 1065 (7) 884 (7) 148 107 115 96 56
Botany CTC 1151 (5) 948 (7) 905 (7) 180 125 85 96 86
Coast to Coast
Warkworth
334 (5) 109 (7) 70 (7) 12 9 4 0 4
Coast to Coast
Wellsford
203 (5) 114 (7) 116 (7) 23 16 17 12 3
Eventfinda
Stadium
1800 (5) 527 (7) 517 (7) N/A N/A N/A N/A N/A
Health New Lynn 2603 (5) 1258 (7) 1703 (7) 159 150 126 115 75
Henderson 940 (4) 645 (7) 634 (7) 94 80 58 76 43
Mangere Town
Centre
1748 (3) 1684 (7) 1599 (7) 76 190 160 152 98
Manurewa Marae N/A 124 (4) 268 (6) 70 40 N/A N/A N/A
Northcare A&M 253 (2) 463 (7) 527 (7) 63 260 152 107
Otara CTC 3221 (5) 1712 (7) 1429 (7) 249 187 116 95 102
Pukekohe CTC N/A 131 (4) 226 (6) 78 65 39 41 41
St Lukes 1368 (5) 1045 (7) 1414 (7) 178 131 118 101 91
Takanini Urgent
Care
1886 (5) 1216 (7) 1153 (7) 204 124 89 80 71
Waiheke Medical
Centre
312 (5) 145 (7) 220 (7) 24 23 12 12 12
Whanau House 2502 (5) 1371 (7) 1442 (7) 232 172 104 103 106
Whanau Ora -
Central
1957 (5) 964 (7) 1583 (7) 187 141 125 139 95
Whanau Ora -
North
1442 (5) 669 (7) 637 (7) 207 230 171 111 93
Whanau Ora -
South
2945 (5) 1250 (7) 718 (7) 175 110 98 90 84

IN CONFIDENCE – NOT FOR DISTRIBUTION
19
Point England
Pop Up
N/A N/A 88 (3) N/A N/A N/A N/A N/A
Randwick Park
Pop Up
N/A N/A 303 (5) N/A N/A N/A N/A N/A
Ranui Pop Up N/A N/A 409 (5) N/A N/A N/A N/A N/A
Mt Smart
Stadium Pop Up
N/A N/A 219 (3) N/A N/A N/A N/A N/A
Massey Pop Up N/A N/A 787 (5) N/A N/A N/A N/A N/A
South Kaipara
Pop Up
N/A N/A 170 (4) N/A N/A N/A N/A N/A
Clendon Pop Up N/A N/A 368 (3) N/A N/A N/A N/A N/A
Mangere Pop Up N/A N/A 472 (2) N/A N/A N/A N/A N/A
Mangere East
Pop Up
N/A N/A 109 (2) N/A No
data
N/A No
Data
N/A
Otara Pop Up N/A N/A 59 (2) N/A N/A N/A N/A N/A
Otahuhu Pop Up N/A N/A 201 (2) N/A N/A N/A N/A N/A
Mt Roskill Pop
Up (330 start)
N/A N/A 217 (2) 108 N/A N/A N/A N/A
Sandringham
Pop Up
N/A N/A N/A 87 74 28 N/A N/A
Ranui League
Club Pop Up
N/A N/A N/A 32 101 39 N/A N/A
Glen Eden Pop
Up
N/A N/A N/A N/A 29 24 43 34
Southmall Pop
Up
N/A N/A N/A N/A 108 105 78 N/A
Orakei Pop Up N/A N/A N/A N/A N/A N/A 33 No
data
Papatoetoe Pop
Up
N/A N/A N/A N/A N/A N/A 35 28
Te Atatu Pop Up N/A N/A N/A N/A N/A 39 18 8
Mangere East
Marae Pop Up
N/A N/A N/A N/A N/A N/A N/A No
data
Waipuna
Targeted Site
143 (2) 549 (7) 376 (7) 16 25 58 45 34
Blockhouse Bay
Targeted Site
N/A 277 (7) 921 (7) 71 16 22 17 35
Total 26,148 16,781 21,215 2735 2552 1925 1740 1227 * 04/09 day still in progress N/A = not open as a CTC

IN CONFIDENCE – NOT FOR DISTRIBUTION
20
Appendix 5: Testing by DHB and ethnicity The tables that follow are the number of people tested. The numbers in the laboratory testing
section are the number of laboratory tests processed.
Table 10: Number of people tested for COVID-19 from 12 August to 04 September
Prioritised Ethnicity MPAO
DHB of Domicile Māori Pacific Asian Other Unknown Total
Auckland 2921 6073 7666 16681 264 33605
Bay of Plenty 2157 245 459 5437 53 8351
Canterbury 1358 530 1303 11280 160 14631
Capital and Coast 1218 925 1064 7571 158 10936
Counties Manukau 6222 17083 7280 10512 366 41463
Hawkes Bay 1177 233 176 3047 41 4674
Hutt Valley 658 350 435 2522 33 3998
Lakes 2063 268 416 2749 75 5571
MidCentral 866 229 299 3444 64 4902
Nelson Marlborough 505 136 199 3645 47 4532
Northland 2659 185 217 3493 31 6585
South Canterbury 124 31 66 1405 12 1638
Southern 890 281 549 7824 66 9610
Tairāwhiti 749 44 49 688 15 1545
Taranaki 583 57 133 2189 33 2995
Waikato 3736 873 1124 8429 166 14328
Wairarapa 179 31 27 830 5 1072
Waitematā 3839 3931 6026 20338 237 34371
West Coast 41 7 12 272 5 337
Whanganui 571 66 52 1248 14 1951
Unknown 1231 606 556 3422 1115 6930
Total 33747 32184 28108 117027 2960 214026

21
IN CONFIDENCE – NOT FOR DISTRIBUTION
Table 11: Rate per 1000 people tested for COVID-19 from 12 August to 04 September
Prioritised Ethnicity MPAO
DHB of Domicile Māori Pacific Asian Other Total
Auckland 67.2 108.3 41 63.8 61.3
Bay of Plenty 36.1 55.1 23.4 34.6 34.6
Canterbury 25.9 37.4 21.4 25.3 25.5
Capital and Coast 33.3 41.7 21.2 35.6 34
Counties Manukau 69.9 142.3 48.2 50.2 72.8
Hawkes Bay 27.2 36.3 19.2 28.2 28
Hutt Valley 25.2 30 23.2 26.8 26.5
Lakes 53.6 104.9 42.8 45.8 50.3
MidCentral 23.8 41.3 19.3 27.8 27.1
Nelson Marlborough 31.5 55 26.8 29 29.9
Northland 43.7 49.2 26.2 32 36.2
South Canterbury 23.3 63.5 27.9 27.2 27.4
Southern 26.5 40.8 21.3 29.2 28.8
Tairāwhiti 30.2 39.4 42 31.1 31.4
Taranaki 25 40.9 21.4 24.3 24.8
Waikato 38.8 65.5 25.5 31.3 33.9
Wairarapa 22.4 37.3 21.7 23.3 23.4
Waitematā 61.3 88.2 41.9 53.2 54.3
West Coast 10.6 27.7 13 10.1 10.5
Whanganui 32.9 43.4 17.8 29 30.1
Total 43.4 100.6 36.7 37.8 43.2

1
IN CONFIDENCE – NOT FOR DISTRIBUTION
SITREP 044
Coronavirus disease 2019 (COVID-19)
Issued: 1030 hours 06 September 2020
Information current at: 1000 hours
This report provides a daily update on the COVID-19 health system response. New information is denoted by red text.
Please use the single point of contact email [email protected] for help/support. Your email will be
logged and promptly passed to the appropriate team.
This document is classified IN CONFIDENCE and not for further distribution.
Need to know
COMMUNITY CASES
NEW LAST 24 hrs
4
MIQ CASES
NEW LAST 24 hrs
1
COMMUNITY CASES
TOTAL RECOVERED
82
98
COMMUNITY CASES
ACTIVE
77 TOTAL CASES SINCE 11 AUG
161
39
TOTAL CASES SINCE 9 JUN
137
TOTAL ACTIVE CASES IN NZ (COMMUNITY & MIQ): 116
MIQ CASES
TOTAL RECOVERED
MIQ CASES
ACTIVE
LABORATORY TESTS
05 September
7,178
LABORATORY TESTS
30 Aug to 05 Sep
63,830
LABORATORY TESTS
TOTAL
814,638

IN CONFIDENCE – NOT FOR DISTRIBUTION
2
Total COVID-19 cases
Table 1: Total number of COVID-19 cases as at 0900 06 September 2020
Case Status Active Recovered Deceased Total
Confirmed 116 (+4)* 1286 (+1) 19 1421 (+5)
Probable 0 346 5 351
Total 116 (+4)* 1632 (+1) 24 1772 (+5)
*Net increase of 5 cases, with 1 case classified as recovered.
Total community cases since 11 August
Table 2: Community cases by DHB and case status as at 0900 06 September 20201
New community cases since 0900 05 September 2020
1. Four new community cases have been reported, as at 0900 06 September.
o All four cases are close contacts confirmed cases linked to the Mt Roskill Evangelical
Church sub-cluster. Three of the cases are from one household.
Community cases linked to the Auckland Community Cluster August 2020
2. 159 of the 161 community cases have been linked to the Auckland Community Cluster
August 2020, as at 0900 06 September. The unlinked cases are summarised as follows:
o The Rydges employee (this investigation has been closed).
o A case (reported 21 August) is still under investigation for an epidemiological link to
the community cluster and there is insufficient data to confirm a genomic link to the
community cluster (see 3).
Community cases under investigation to determine a link to the Auckland community
cluster
3. The case under investigation is summarised as follows:
o One case (reported 21 August) came through the border on 18 June. The case tested
negative at Day 3 and Day 12 of quarantine. Subsequently the case tested positive on
21 August after being swabbed at a mobile testing clinic in Auckland. Despite using
two different whole genome sequencing protocols only a partial genome was
1 EpiSurv
Case
Status
Counties Manukau Waitematā Auckland Waikato Total
Confirmed 74 42 (+4) 43 2 161 (+4)
Probable 0 0 0 0 0
Total 74 42 (+4) 43 2 161 (+4)

IN CONFIDENCE – NOT FOR DISTRIBUTION
3
o
obtained. There is insufficient data to confirm the case is genomically linked to the
community cluster.2 Their epidemiological link to the community cluster is still under
investigation.
Community cases and household contacts at Jet Park
4. As at 0800 06 September there are 75 people isolating in Jet Park from the community.
58 are confirmed cases, the remaining 17 are household contacts. This number will
fluctuate as people finish their isolation and depart from the facility.3
MIQ cases since 0900 05 September 2020
5. One new case4 detected at the border, as at 0900 06 September. In total 137 cases have
been detected at the border since the establishment of MIFs/MIQs.
o The case arrived from India on 23 August and is a close contact of an existing
confirmed case. The case tested positive on day 11.
Cases in hospital
6. As at 0800 06 September there are four cases in hospital with COVID-19.5
Table 3: Number of cases in hospital with COVID-19 by DHB as at 0800 05 September 2020
2 ESR WGS report 3 September 2020
3 NRHCC Morning Report 6 September 2020
4 EpiSurv
5 NRHCC Morning Report 6 September 2020 and Waikato DHB phone call 6 September 2020
DHB Hospital Number in a general ward Number in ICU/HDU
Auckland Auckland City 0 0
Counties Manukau Middlemore 1 0
Waitematā North Shore 2 0
Waikato Waikato 0 1
Total - 3 1

IN CONFIDENCE – NOT FOR DISTRIBUTION
4
Health system response
Overall approach
7. Our investigation has two main focus areas that run in parallel:
o Source attribution – a focus on investigating the case with the earliest symptom
onset date to gather details actions of movements 14 days prior. This will help to
understand the possible source of the new outbreak.
o Containment – rigorous case investigation, identification of close contacts and
isolation and testing to ensure that chain of transmission is broken.
Overview6
There is now a clear increase in cases as a result of the new Mt Roskill Evangelical Church sub-
cluster. Some of these cases have recent symptoms. While the impact of intensive case follow-up
appears to be working overall, the number of cases associated with the Mt Roskill Evangelical
Church sub-cluster has continued to increase and it is likely that more cases will arise.
Current outbreak investigation priorities7
o Contact tracing and containment around Mt Roskill Evangelical Church sub-cluster.
o Seek to identify an epidemiological link to the main cluster for the case.
o Clarify whether the case that is a returnee from June is a new infection and clarify strain.
o Contact trace and isolate close contacts exposed on Auckland bus journeys.
o Seek to identify an epidemiological link to the main cluster for cases that have been
genomically linked but not epidemiologically linked.
8. Mt Roskill Evangelical Church is a priority for ARPHS due to ongoing transmission
occurring and concerns that not all contacts have been identified. Several events
including church services and a are being scoped. This is a joint effort with
ARPHS completing contact tracing for the events and Waikato focusing on source
attribution.8 The DHBs are working closely with Church leaders to:
o Maintain relationships with and support for Church leaders.
o Understand the total number of people that need to be tested.
o Push testing coverage.
o Develop welfare support arrangements for those requiring quarantine.
Sub-clusters and settings of interest
6 ARPHS Strategic Report 31 August 2020
7 ARPHS Strategic Report 31 August 2020
8 ARPHS, Waikato DHB and MoH teleconference 3pm 3 September 2020
s 9(2)(a)
s 9(2)(a)

IN CONFIDENCE – NOT FOR DISTRIBUTION
5
9. Contact tracing investigation and testing is ongoing for the Botany sub-cluster. This
sub-cluster includes the Botany case reported 28 August and four other cases reported
recently (one on 31 August and three on 1 September).
10. Settings of interest for the Botany sub-cluster are being investigated, including casual
work places. More information to come when available.
11. There is a sports club associated with the Mt Roskill Evangelical Church. To date there
are no known exposures confirmed at the sports club.9 It is being investigated as both a
possible exposure event and a possible source of the Mt Roskill Evangelical Church
sub-cluster.10
ARPHS advised on 31 August the sports club had been closed for the two weeks prior,
therefore none of the club members are being considered close contacts. ARPHS sent
comms to members regarding testing and to date no positive cases have been
reported.11 Surveillance testing is ongoing.12
Case investigation
12. Four cases that have been genomically linked to the main cluster are still being
investigated by ARPHS to identify their epidemiological link to the main cluster.
o The
o GP
o The second Mount Albert Grammar student
o The Botany case
13. Investigation into source attribution of the Botany cases infection is continuing. A
possible epidemiological link is being explored between the Botany case and previously
reported cases within another household. The symptom onset dates of the possible
epidemiological linked household are prior to the Botany cases’ symptom onset dates.
Further investigation is underway.
14. The case in Tokoroa reported on 29 August is a contact of an existing case from
Tokoroa who is linked to the Auckland cluster. The case works at a medical centre in
Tokoroa and it is believed they had contact with the existing case
. The centre has had a final deep clean and has reopened with reduced
staff. The centre is completing most consultations virtually. Contact tracing is being
completed back to 20 August. This is a precautionary timeframe due to the case’s long
incubation period and radiological findings suggesting more advanced disease despite
the 27 August symptom onset date.
On 30 August two testing sites were stood
up for testing staff and patients, these will be available for the rest of the week.
9 NRHCC Morning Report 3 September 2020
10 NRHCC Morning Report 2 September 2020
11 ARPHS, Waikato DHB and MoH teleconference 3pm 31 August 2020
12 NRHCC Morning Report 3 September 2020
s 9(2)(a)
s 9(2)(a)
s 9(2)(a)
s 9(2)(a)
s 9(2)(a)
6
IN CONFIDENCE – NOT FOR DISTRIBUTION
s 9(2)(a)
s 9(2)(a)

IN CONFIDENCE – NOT FOR DISTRIBUTION
7
s 9(2)(a)

8
IN CONFIDENCE – NOT FOR DISTRIBUTION
ESR and wider testing13 15. A total of 104 cases (69%) from the main cluster have been sequenced, 93 (62% of total
confirmed cases) yielded a high-quality genome sequence. Three cases yielded partial
genomes but had sufficient data to indicate that these cases are part of the outbreak
cluster. The remaining eight cases did not have sufficient genetic material to be
sequenced.
16.
17. Work is underway to analyse how the whole genome sequencing can be used to tell us
how COVID-19 has been transmitted through the community cluster and to further
inform its management.
18. No direct links have been found between the community outbreak genome
sequencing, with the 49 full genomes currently available from cases in managed
isolation facilities (MIFs).
19.
Contact tracing14 20. Between 27 August and 02 September 93% (439 of 472) of close contacts have been
contacted within 48 hours of being determined to be a contact. KPI for this metric is
80% of close contacts within 48 hours.
o Notes: This metric reports all cases during the specified period, including those in Managed Isolation and Quarantine, and does not include casual contacts.
o Notes: The close contact numbers for today have fallen slightly due to the reclassification of some older cases from community to border cases.
Table 5: Close contact tracing recorded in the National Contact Tracing Solution since 11 August as at
0900 05 September 2020
03/09/2020 04/09/2020 05/09/2020 06/09/2020
Number of close contacts
identified1 3162 3191 3222 3217
13 ESR Whole Genome Sequencing Report 02 September 2020
14 COVID-19 NCCS Analytics and Reporting 1008 06 September 2020
s 9(2)(g)(i)
s 9(2)(g)(i)

IN CONFIDENCE – NOT FOR DISTRIBUTION
9
Number of close contacts
successfully contacted (and are
self-isolating)
2984 3136 3177 3187
Number of close contacts
referred to "finding services"2 4 4 4 4
Number of close contacts
awaiting contact 174 51 41 26
1. Contacts loaded into the National Contact Tracing Solution, and managed by either the National Investigation and Tracing
Unit or the Public Health Units. Contacts from MIQ and overseas cases are not included in this report.
2. "Finding services" refers to the mechanism the National Close Contact Service uses to find valid contact details for close
contacts we do not have the correct contact details for. These services utilise internal Ministry of Health databases along with
Police, Customs and Airlines where relevant.
3. The total number and number successfully contacted can decrease due to duplicates and invalid records being removed from
the system.
COVID-19 Tracer App usage15 Figure 1: COVID-19 Tracer App cumulative registered users and daily scans/manual entries as at 1015
05 September 2020
1. The number of scans and manual entries on any given date is subject to change for up to 31 days. This is because there can be
a delay before anonymised analytic information is received (e.g. device not connected to internet when scan carried out).
2. The number of App registrations and QR codes for any given date is subject to change for up to 1 day. This is because due to
reporting timeframes these numbers may be extracted before the 12pm cut-off for the reporting period.
21. Key Numbers:
o 2,106,700 - Total registered users
o 1,823,959 - QR code scans between 1200 04 and 1000 05 September
15 Response Analyst – Digital Channels, 1628 04 September 2020

IN CONFIDENCE – NOT FOR DISTRIBUTION
10
Testing16 Table 6: Testing by functional groups, as at 0900 04 September 2020
*Numbers have been sourced from different data extracts in comparison to Table 7.
Laboratory testing numbers17 Table 7: Number of laboratory tests processed nationally as at 0900 05 September 2020
Testing supply update18
22. There are approximately 270,000 complete tests in NZ. Resupply continues to largely
match usage, and additional swab deliveries are expected to arrive this week.
16 ÉCLAIR/MoH Public Health Intelligence, 1000 05 September 2020
17 Daily Lab Report, 0826 06 September 2020
18 Health Supply Chain email, 0907 30 August 2020
Reason for test 04 September 29 August – 04 September
GPs and other primary health 1291 23634
CBACs and pop-ups 1287 31,439
Border workers - air crew 5 196
Border workers - airport staff 117 1564
Border workers - maritime crew 1 40
Border workers – Port of Tauranga staff 72 340
Border workers – Remaining Port staff 87 232
Border workers - MIF 30 789
Border workers - MIQ 34 177
Travellers - Staying at MIF 71 2000
Travellers - Staying at MIQ 2 128
Total 2997 60,539*
Time period Number of laboratory tests
05 September 7178
Last 7 days (30 Aug to 05 Sep) 63,830
Total 814,638

IN CONFIDENCE – NOT FOR DISTRIBUTION
11
Testing activity by region
Focus areas
23. As at 1700 03 September there are 24 Community testing Centres in the Metro
Auckland area. Two of these are closed CTC's for close contacts only.19
Healthline updates20 24. On 05 September there were 2,890 contacts in Healthline. Of those calls, 1,106 were to
the COVID-19 Info line. Demand on 1737 Need to talk? and other mental health services
was 605 contacts (in line with forecast).
25. The main themes yesterday/today:
o Community concern and general anxiety following the announcement of the deaths
over 04 – 05 September.
o Clarification of level announcements made during 04 September.
o Symptomatic and asymptomatic Service User’s wanting to be tested.
o People having welfare needs associated with the lock down.
Logistics
Health Workforce21
26. Health Workforce have identified a small group of people on the surge workforce who
have indicated they would be willing to work in an ARC facility in the event of an
outbreak – this week we will work on whether this pool can be expanded and actions to
keep the group “warm” in the event ARC employers require them.
27. Upskilling of alternative workforces for testing continues to progress, including plans
for a training package and scoping of micro-credentialing, in addition to understanding
where this workforce would be obtained from. It is anticipated this training package will
be available within four weeks (estimated).
28. Health Workforce continue to work with TAS and all 20 GMsHR on workforce needs and
issues – regular workforce intelligence information will be provided to Health
Workforce, which will be incorporated into frequent dashboard reports.
19 Community Testing Centres report, 1809 03 September 2020
20 National Telehealth Service Coronavirus Update, 0847 06 September 2020
21 Health Workforce Directorate, 0832 01 September 2020

IN CONFIDENCE – NOT FOR DISTRIBUTION
12
Hospital capacity22 Table 8: Number and occupancy of hospital beds by type as at 0800 06 September 2020
Type Number of units Number (%) occupied/in use
ICU and HDU beds 247 146 (59.1%)
Ventilators 201 40 (19.9%)
Ward beds 5161 3773 (73.1%)
22 COVID-19 Hospital Summary, 0905 06 September 2020

13
IN CONFIDENCE – NOT FOR DISTRIBUTION
Appendix 1: Case summary
Table 9: All community cases reported between 0900 05 September and 0900 06 September
s 9(2)(a)

14
IN CONFIDENCE – NOT FOR DISTRIBUTION
Appendix 2: International case
investigations
s 9(2)(a)

15
IN CONFIDENCE – NOT FOR DISTRIBUTION
Appendix 3: COVID-19 Provisional Disease Indicators, by date
of case notification14 Indicator (as
per Table 9832) Refined Indicator description Target 29 August 30 August 31 August 1 Sept** 2 Sept** 3 Sept 4 Sept#
1 - (S001) Time from exposure to contact isolation / quarantine 80% within 96 hours 50% 100% - - - - -
2 – (S002) Time from case first symptom to contact isolation / quarantine 80% within 96 hours 79% 100% - - - - -
3 – (S003) Time from test sample taken to
close contact isolation / quarantine
80% within 72 hours 85% 100% 100% - - - -
4 – (C001) Time from first symptom to test sample taken for positive cases 80% within 48 hours 33% 50% 63% 0%
(0/3) - - -
5 – (L001) Time from test sample taken to notification of positive result 80% within 24 hours 50% 100% 36% 80% 100% - -
6 – (P002) Time from case notification to isolation / quarantine of contact 80% within 48 hours 85% 97% 99% 100% - - -
7 – (P001) Time from notification to case interview 80% within 24 hours 100% 100% 100% 100% 100% - -
8 – (P003) Time from close contact identification to isolated /
quarantined 80% within 24 hours 100% 97% 99% 71% 55% - -
10 – (P004) Proportion of contacts traced in 48 hours 80% within 48 hours 85% 100% 99% 100% - - -
C – (S005) Proportion of close contacts with confirmed or suspected
COVID-19 at the time of tracing <20% 0% 0% 4% 0% 0% 0% -
• # Figures not available due to database outage. Work is currently underway to resolve.
• * The numerator and denominator are provided in some instances to provide context for low percentages.
• **Data is not available for metrics where there is no data that meets the definition, or where the time/days to reach target has not fully elapsed
• The value of P002 can drop due to the addition of new close contacts to exposure events after the 48-hour period since case notification had elapsed. This can happen for a number of reasons, including a case recalling further details following the original case
interview.
• These metrics report all cases during the specified period, including those in Managed Isolation and Quarantine, and do not include casual contacts.
• There are three additional indicators under development requiring both technical and clinical input to define data requirements. These are due to be completed by end October 2020.

16
IN CONFIDENCE – NOT FOR DISTRIBUTION
APPENDIX: 4
NRHCC Testing Report
Novel Coronavirus (COVID-19)
Issued: 1700 04 September 2020
Table 1. Metro Auckland Summary Total of Testing for 04 September 2020
Community MIQ
staff
MIQ
guests
Airport Maritime port TOTAL
5:00pm 1227 148 505 156 104 2140
Table 2. Totals tests receipted from 12 August 2020, by ethnicity (as at 5pm)
*Swab taken in last 24 hours taken between midnight and midnight, may have been receipted and
reported later than this; tests only included if coded and received and acknowledged by lab, result
not required
*Includes GP clinics, Urgent Care Centres, Designated practices
Table 3. Estimated tests taken since 12 August 2020, based on manual site reports at 5pm
Site 12/08-
16/08
17/08-
23/08
24/08 –
30/08
31/08 01/09 02/09 03/09 04/09*
MIQ Staff 2132 659 1488 152 100 265 120 148
Guests 2972 3767 3600 418 399 468 492 505
Border Airport 2129 933 1349 199 205 252 167 156
Port 1588 678 161 99 19 52 74 104
* 04/09 day still in progress
Tests Last 24 hours Total since 12/8*
Ethnicity CTC
Non-
CTC
Total
% Tests %
Asian 520 447 967 23.4% 30,090 17.4%
Maori 307 245 552 13.4% 25,473 14.7%
Other 754 782 1536 37.2% 73,222 42.3%
Pacific 551 373 924 22.4% 41,121 23.7%
Unknown 40 112 152 3.7% 3337 1.9%
Total 2172 1959 4131 173,243

IN CONFIDENCE – NOT FOR DISTRIBUTION
17
Table 4: Estimated tests taken at Metro Auckland CTCs, since 12 August 2020, based on
manual site reports at 4pm
Site 12/08-
16/08
(days
open)
17/08-
23/08
(days
open)
24/08 –
30/08
(days
open)
31/08 01/0
9
02/0
9
03/09 04/09*
Airport Oaks 1148 (4) 515 (7) 366 (7) 61 39 24 45 28
Auckland Netball
Centre
192 (1) 1065 (7) 884 (7) 148 107 115 96 56
Botany CTC 1151 (5) 948 (7) 905 (7) 180 125 85 96 86
Coast to Coast
Warkworth
334 (5) 109 (7) 70 (7) 12 9 4 0 4
Coast to Coast
Wellsford
203 (5) 114 (7) 116 (7) 23 16 17 12 3
Eventfinda
Stadium
1800 (5) 527 (7) 517 (7) N/A N/A N/A N/A N/A
Health New Lynn 2603 (5) 1258 (7) 1703 (7) 159 150 126 115 75
Henderson 940 (4) 645 (7) 634 (7) 94 80 58 76 43
Mangere Town
Centre
1748 (3) 1684 (7) 1599 (7) 76 190 160 152 98
Manurewa Marae N/A 124 (4) 268 (6) 70 40 N/A N/A N/A
Northcare A&M 253 (2) 463 (7) 527 (7) 63 260 152 107
Otara CTC 3221 (5) 1712 (7) 1429 (7) 249 187 116 95 102
Pukekohe CTC N/A 131 (4) 226 (6) 78 65 39 41 41
St Lukes 1368 (5) 1045 (7) 1414 (7) 178 131 118 101 91
Takanini Urgent
Care
1886 (5) 1216 (7) 1153 (7) 204 124 89 80 71
Waiheke Medical
Centre
312 (5) 145 (7) 220 (7) 24 23 12 12 12
Whanau House 2502 (5) 1371 (7) 1442 (7) 232 172 104 103 106
Whanau Ora -
Central
1957 (5) 964 (7) 1583 (7) 187 141 125 139 95
Whanau Ora -
North
1442 (5) 669 (7) 637 (7) 207 230 171 111 93
Whanau Ora -
South
2945 (5) 1250 (7) 718 (7) 175 110 98 90 84

IN CONFIDENCE – NOT FOR DISTRIBUTION
18
Point England
Pop Up
N/A N/A 88 (3) N/A N/A N/A N/A N/A
Randwick Park
Pop Up
N/A N/A 303 (5) N/A N/A N/A N/A N/A
Ranui Pop Up N/A N/A 409 (5) N/A N/A N/A N/A N/A
Mt Smart
Stadium Pop Up
N/A N/A 219 (3) N/A N/A N/A N/A N/A
Massey Pop Up N/A N/A 787 (5) N/A N/A N/A N/A N/A
South Kaipara
Pop Up
N/A N/A 170 (4) N/A N/A N/A N/A N/A
Clendon Pop Up N/A N/A 368 (3) N/A N/A N/A N/A N/A
Mangere Pop Up N/A N/A 472 (2) N/A N/A N/A N/A N/A
Mangere East
Pop Up
N/A N/A 109 (2) N/A No
data
N/A No
Data
N/A
Otara Pop Up N/A N/A 59 (2) N/A N/A N/A N/A N/A
Otahuhu Pop Up N/A N/A 201 (2) N/A N/A N/A N/A N/A
Mt Roskill Pop
Up (330 start)
N/A N/A 217 (2) 108 N/A N/A N/A N/A
Sandringham
Pop Up
N/A N/A N/A 87 74 28 N/A N/A
Ranui League
Club Pop Up
N/A N/A N/A 32 101 39 N/A N/A
Glen Eden Pop
Up
N/A N/A N/A N/A 29 24 43 34
Southmall Pop
Up
N/A N/A N/A N/A 108 105 78 N/A
Orakei Pop Up N/A N/A N/A N/A N/A N/A 33 No
data
Papatoetoe Pop
Up
N/A N/A N/A N/A N/A N/A 35 28
Te Atatu Pop Up N/A N/A N/A N/A N/A 39 18 8
Mangere East
Marae Pop Up
N/A N/A N/A N/A N/A N/A N/A No
data
Waipuna
Targeted Site
143 (2) 549 (7) 376 (7) 16 25 58 45 34
Blockhouse Bay
Targeted Site
N/A 277 (7) 921 (7) 71 16 22 17 35
Total 26,148 16,781 21,215 2735 2552 1925 1740 1227 * 04/09 day still in progress N/A = not open as a CTC

IN CONFIDENCE – NOT FOR DISTRIBUTION
19
Appendix 5: Testing by DHB and ethnicity The tables that follow are the number of people tested. The numbers in the laboratory testing
section are the number of laboratory tests processed.
Table 10: Number of people tested for COVID-19 from 12 August to 06 September
Prioritised Ethnicity MPAO
DHB of Domicile Māori Pacific Asian Other Unknown Total
Auckland 2955 6112 7736 16821 267 33891
Bay of Plenty 2184 246 471 5521 53 8475
Canterbury 1367 532 1326 11419 160 14804
Capital and Coast 1219 927 1065 7582 158 10951
Counties Manukau 6261 17198 7341 10596 369 41765
Hawkes Bay 1179 233 176 3047 41 4676
Hutt Valley 659 350 437 2529 33 4008
Lakes 2065 268 416 2749 75 5573
MidCentral 866 229 299 3447 65 4906
Nelson Marlborough 505 136 199 3649 47 4536
Northland 2665 185 219 3517 31 6617
South Canterbury 124 31 66 1405 12 1638
Southern 890 282 549 7826 66 9613
Tairāwhiti 749 44 49 688 15 1545
Taranaki 590 57 134 2221 33 3035
Waikato 3742 873 1124 8436 167 14342
Wairarapa 181 31 27 833 5 1077
Waitematā 3863 3967 6083 20503 238 34654
West Coast 41 8 12 277 5 343
Whanganui 572 66 52 1250 14 1954
Unknown 1237 608 577 3453 1122 6997
Total 33914 32383 28358 117770 2976 215401
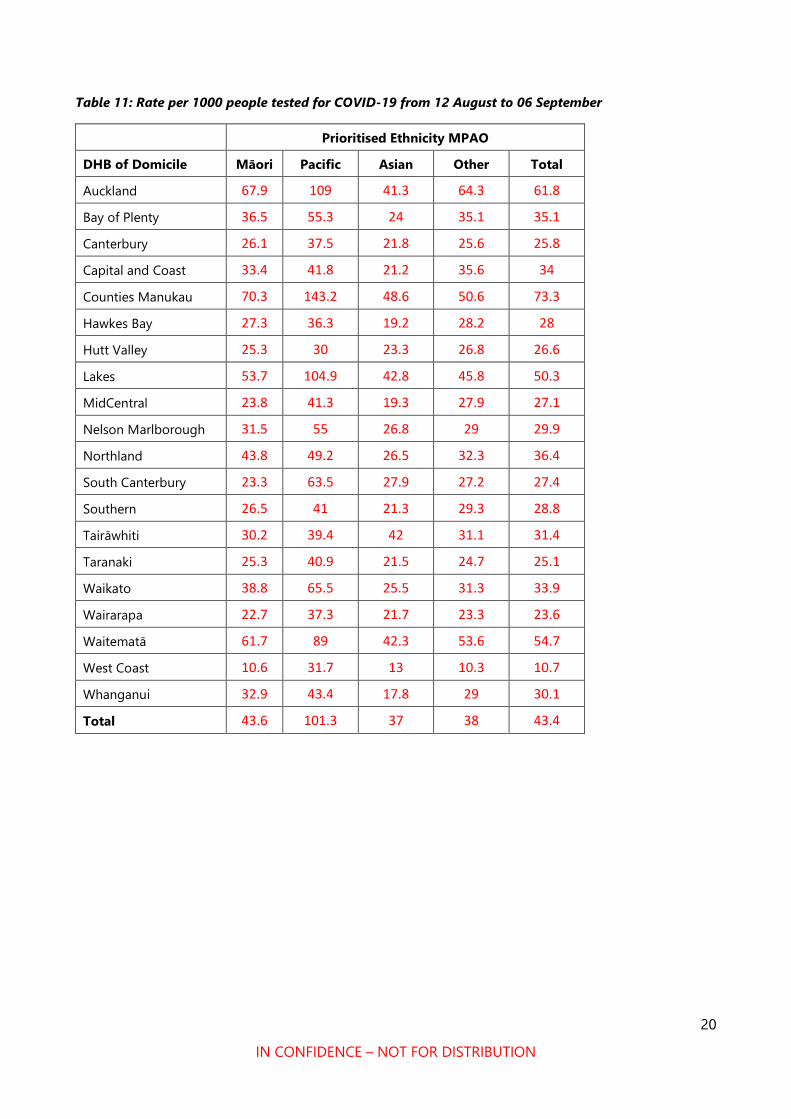
20
IN CONFIDENCE – NOT FOR DISTRIBUTION
Table 11: Rate per 1000 people tested for COVID-19 from 12 August to 06 September
Prioritised Ethnicity MPAO
DHB of Domicile Māori Pacific Asian Other Total
Auckland 67.9 109 41.3 64.3 61.8
Bay of Plenty 36.5 55.3 24 35.1 35.1
Canterbury 26.1 37.5 21.8 25.6 25.8
Capital and Coast 33.4 41.8 21.2 35.6 34
Counties Manukau 70.3 143.2 48.6 50.6 73.3
Hawkes Bay 27.3 36.3 19.2 28.2 28
Hutt Valley 25.3 30 23.3 26.8 26.6
Lakes 53.7 104.9 42.8 45.8 50.3
MidCentral 23.8 41.3 19.3 27.9 27.1
Nelson Marlborough 31.5 55 26.8 29 29.9
Northland 43.8 49.2 26.5 32.3 36.4
South Canterbury 23.3 63.5 27.9 27.2 27.4
Southern 26.5 41 21.3 29.3 28.8
Tairāwhiti 30.2 39.4 42 31.1 31.4
Taranaki 25.3 40.9 21.5 24.7 25.1
Waikato 38.8 65.5 25.5 31.3 33.9
Wairarapa 22.7 37.3 21.7 23.3 23.6
Waitematā 61.7 89 42.3 53.6 54.7
West Coast 10.6 31.7 13 10.3 10.7
Whanganui 32.9 43.4 17.8 29 30.1
Total 43.6 101.3 37 38 43.4

1
IN CONFIDENCE – NOT FOR DISTRIBUTION
SITREP 045
Coronavirus disease 2019 (COVID-19)
Issued: 1030 hours 07 September 2020
Information current at: 1000 hours
This report provides a daily update on the COVID-19 health system response. New information is denoted by red text.
Please use the single point of contact email [email protected] for help/support. Your email will be
logged and promptly passed to the appropriate team.
This document is classified IN CONFIDENCE and not for further distribution.
Need to know
COMMUNITY CASES
NEW LAST 24 hrs
2
MIQ CASES
NEW LAST 24 hrs
2
COMMUNITY CASES
TOTAL RECOVERED
84
98
COMMUNITY CASES
ACTIVE
77 TOTAL CASES SINCE 11 AUG
163
41
TOTAL CASES SINCE 9 JUN
139
TOTAL ACTIVE CASES IN NZ (COMMUNITY & MIQ): 118
MIQ CASES
TOTAL RECOVERED
MIQ CASES
ACTIVE
LABORATORY TESTS
06 September
3,991
LABORATORY TESTS
31 Aug to 06 Sep
60,602
LABORATORY TESTS
TOTAL
818,629
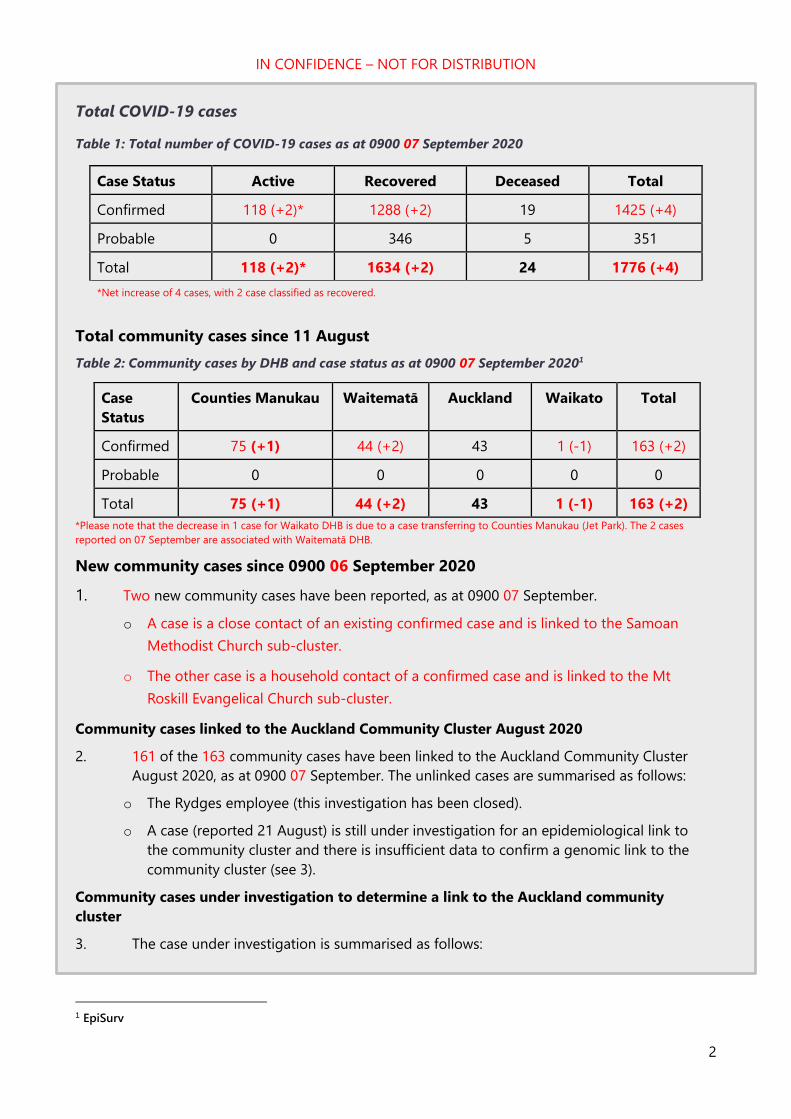
IN CONFIDENCE – NOT FOR DISTRIBUTION
2
Total COVID-19 cases
Table 1: Total number of COVID-19 cases as at 0900 07 September 2020
Case Status Active Recovered Deceased Total
Confirmed 118 (+2)* 1288 (+2) 19 1425 (+4)
Probable 0 346 5 351
Total 118 (+2)* 1634 (+2) 24 1776 (+4)
*Net increase of 4 cases, with 2 case classified as recovered.
Total community cases since 11 August
Table 2: Community cases by DHB and case status as at 0900 07 September 20201
*Please note that the decrease in 1 case for Waikato DHB is due to a case transferring to Counties Manukau (Jet Park). The 2 cases
reported on 07 September are associated with Waitematā DHB.
New community cases since 0900 06 September 2020
1. Two new community cases have been reported, as at 0900 07 September.
o A case is a close contact of an existing confirmed case and is linked to the Samoan
Methodist Church sub-cluster.
o The other case is a household contact of a confirmed case and is linked to the Mt
Roskill Evangelical Church sub-cluster.
Community cases linked to the Auckland Community Cluster August 2020
2. 161 of the 163 community cases have been linked to the Auckland Community Cluster
August 2020, as at 0900 07 September. The unlinked cases are summarised as follows:
o The Rydges employee (this investigation has been closed).
o A case (reported 21 August) is still under investigation for an epidemiological link to
the community cluster and there is insufficient data to confirm a genomic link to the
community cluster (see 3).
Community cases under investigation to determine a link to the Auckland community
cluster
3. The case under investigation is summarised as follows:
1 EpiSurv
Case
Status
Counties Manukau Waitematā Auckland Waikato Total
Confirmed 75 (+1) 44 (+2) 43 1 (-1) 163 (+2)
Probable 0 0 0 0 0
Total 75 (+1) 44 (+2) 43 1 (-1) 163 (+2)

IN CONFIDENCE – NOT FOR DISTRIBUTION
3
o
o One case (reported 21 August) came through the border on 18 June. The case tested
negative at Day 3 and Day 12 of quarantine. Subsequently the case tested positive on
21 August after being swabbed at a mobile testing clinic in Auckland. Despite using
two different whole genome sequencing protocols only a partial genome was
obtained. There is insufficient data to confirm the case is genomically linked to the
community cluster.2 Their epidemiological link to the community cluster is still under
investigation.
Community cases and household contacts at Jet Park
4. As at 0800 07 September there are 70 people isolating in Jet Park from the community.
52 are confirmed cases, the remaining 18 are household contacts. This number will
fluctuate as people finish their isolation and depart from the facility.3
MIQ cases since 0900 06 September 2020
5. Two new cases4 detected at the border, as at 0900 07 September. In total 139 cases
have been detected at the border since the establishment of MIFs/MIQs.
o Both cases arrived from India on 23 August and are close contacts of an existing
confirmed case. One case tested positive on day 8 and the other on day 11.
Cases in hospital
6. As at 0800 07 September there are four cases in hospital with COVID-19.5
Table 3: Number of cases in hospital with COVID-19 by DHB as at 0800 07 September 2020
2 ESR WGS report 3 September 2020
3 NRHCC Morning Report 6 September 2020
4 EpiSurv
5 NRHCC Morning Report 7 September 2020 and COVID-19 Hospital Summary, 0900 07 September 2020
DHB Hospital Number in a general ward Number in ICU/HDU
Auckland Auckland City 0 0
Counties Manukau Middlemore 1 0
Waitematā North Shore 2 0
Waikato Waikato 0 1
Total - 3 1

IN CONFIDENCE – NOT FOR DISTRIBUTION
4
Health system response
Overall approach
7. Our investigation has two main focus areas that run in parallel:
o Source attribution – a focus on investigating the case with the earliest symptom
onset date to gather details actions of movements 14 days prior. This will help to
understand the possible source of the new outbreak.
o Containment – rigorous case investigation, identification of close contacts and
isolation and testing to ensure that chain of transmission is broken.
Overview6
There is now a clear increase in cases as a result of the new Mt Roskill Evangelical Church sub-
cluster. Some of these cases have recent symptoms. While the impact of intensive case follow-up
appears to be working overall, the number of cases associated with the Mt Roskill Evangelical
Church sub-cluster has continued to increase and it is likely that more cases will arise.
Current outbreak investigation priorities7
o Contact tracing and containment around Mt Roskill Evangelical Church sub-cluster.
o Seek to identify an epidemiological link to the main cluster for the case.
o Clarify whether the case that is a returnee from June is a new infection and clarify strain.
o Contact trace and isolate close contacts exposed on Auckland bus journeys.
o Seek to identify an epidemiological link to the main cluster for cases that have been
genomically linked but not epidemiologically linked.
8. Mt Roskill Evangelical Church is a priority for ARPHS due to ongoing transmission
occurring and concerns that not all contacts have been identified. Several events
including church services and a wedding are being scoped. This is a joint effort with
ARPHS completing contact tracing for the events and Waikato focusing on source
attribution.8
Sub-clusters and settings of interest
9. Contact tracing investigation and testing is ongoing for the Botany sub-cluster. This
sub-cluster includes the Botany case reported 28 August and four other cases reported
recently (one on 31 August and three on 1 September).9
10. Settings of interest for the Botany sub-cluster are being investigated, including casual
work places. More information to come when available.9
6 ARPHS Strategic Report 31 August 2020
7 ARPHS Strategic Report 31 August 2020
8 ARPHS, Waikato DHB and MoH teleconference 1500 3 September 2020
9 NRHCC Morning Report 7 September 2020
s 9(2)(a)

IN CONFIDENCE – NOT FOR DISTRIBUTION
5
11. There is a sports club associated with the Mt Roskill Evangelical Church. To date there
are no known exposures confirmed at the sports club.10 It is being investigated as both
a possible exposure event and a possible source of the Mt Roskill Evangelical Church
sub-cluster.11
ARPHS advised on 31 August the sports club had been closed for the two weeks prior,
therefore none of the club members are being considered close contacts. ARPHS sent
comms to members regarding testing and to date no positive cases have been
reported.12 Surveillance testing is ongoing.10
Case investigation
12. Four cases that have been genomically linked to the main cluster are still being
investigated by ARPHS to identify their epidemiological link to the main cluster.
o The
o GP
o The second Mount Albert Grammar student
o The Botany case
13. Investigation into source attribution of the Botany cases infection is continuing. A
possible epidemiological link is being explored between the Botany case and previously
reported cases within another household. The symptom onset dates of the possible
epidemiological linked household are prior to the Botany cases’ symptom onset dates.
Further investigation is underway.9
The case in Tokoroa reported on 29 August is a contact of an existing case from Tokoroa who is
linked to the Auckland cluster. The case works at a medical centre in Tokoroa and it is believed
they had contact with the existing case The centre has had a
final deep clean and has reopened with reduced staff and are completing most consultations
virtually. Contact tracing is being completed back to 20 August. This is a precautionary
timeframe due to the case’s long incubation period and radiological findings suggesting more
advanced disease despite the 27 August symptom onset date. To date, all contacts tested have
received negative results (See table 4).13
10 NRHCC Morning Report 3 September 2020
11 NRHCC Morning Report 2 September 2020
12 ARPHS, Waikato DHB and MoH teleconference 1500 31 August 2020
13 Waikato DHB Morning Report 7 September 2020
s 9(2)(a)
s 9(2)(a)
s 9(2)(a)
s 9(2)(a)
s 9(2)(a)

6
IN CONFIDENCE – NOT FOR DISTRIBUTION
1.
s 9(2)(a)
s 9(2)(a)s 9(2)(a)

IN CONFIDENCE – NOT FOR DISTRIBUTION
7
s 9(2)(a)

8
IN CONFIDENCE – NOT FOR DISTRIBUTION
ESR and wider testing14 14. A total of 104 cases (69%) from the main cluster have been sequenced, 93 (62% of total
confirmed cases) yielded a high-quality genome sequence. Three cases yielded partial
genomes but had sufficient data to indicate that these cases are part of the outbreak
cluster. The remaining eight cases did not have sufficient genetic material to be
sequenced.
15.
16. Work is underway to analyse how the whole genome sequencing can be used to tell us
how COVID-19 has been transmitted through the community cluster and to further
inform its management.
17. No direct links have been found between the community outbreak genome
sequencing, with the 49 full genomes currently available from cases in managed
isolation facilities (MIFs).
18.
Contact tracing15 19. New data was unavailable at time of publication, this will be updated for the 08
September SitRep. Between 27 August and 02 September 93% (439 of 472) of close
contacts have been contacted within 48 hours of being determined to be a contact. KPI
for this metric is 80% of close contacts within 48 hours.
o Notes: This metric reports all cases during the specified period, including those in Managed Isolation and Quarantine, and does not include casual contacts.
o Notes: The close contact numbers for today have fallen slightly due to the reclassification of some older cases from community to border cases.
Table 5: Close contact tracing recorded in the National Contact Tracing Solution since 11 August as at
0900 07 September 2020
04/09/2020 05/09/2020 06/09/2020 07/09/2020
Number of close contacts
identified1 3191 3222 3217 3224
14 ESR Whole Genome Sequencing Report 02 September 2020
15 COVID-19 NCCS Analytics and Reporting 1008 06 September 2020
s 9(2)(g)(i)
s 9(2)(g)(i)

IN CONFIDENCE – NOT FOR DISTRIBUTION
9
Number of close contacts
successfully contacted (and are
self-isolating)
3136 3177 3187 3199
Number of close contacts
referred to "finding services"2 4 4 4 0
Number of close contacts
awaiting contact 51 41 26 25
1. Contacts loaded into the National Contact Tracing Solution, and managed by either the National Investigation and Tracing
Unit or the Public Health Units. Contacts from MIQ and overseas cases are not included in this report.
2. "Finding services" refers to the mechanism the National Close Contact Service uses to find valid contact details for close
contacts we do not have the correct contact details for. These services utilise internal Ministry of Health databases along with
Police, Customs and Airlines where relevant.
3. The total number and number successfully contacted can decrease due to duplicates and invalid records being removed from
the system.
COVID-19 Tracer App usage16 Figure 1: COVID-19 Tracer App cumulative registered users and daily scans/manual entries as at 1100
06 September 2020
1. The number of scans and manual entries on any given date is subject to change for up to 31 days. This is because there can be
a delay before anonymised analytic information is received (e.g. device not connected to internet when scan carried out).
2. The number of App registrations and QR codes for any given date is subject to change for up to 1 day. This is because due to
reporting timeframes these numbers may be extracted before the 12pm cut-off for the reporting period.
20. Key Numbers:
o 2,125,300 - Total registered users
o 2,453,787 - QR code scans between 1200 04 and 1000 05 September
16 Response Analyst – Digital Channels, 1628 04 September 2020
0
500,000
1,000,000
1,500,000
2,000,000
2,500,000
3,000,000
0
500,000
1,000,000
1,500,000
2,000,000
2,500,000
20
/05
/20
20
23
/05
/20
20
26
/05
/20
20
29
/05
/20
20
1/0
6/2
02
04
/06
/20
20
7/0
6/2
02
01
0/0
6/2
02
01
3/0
6/2
02
01
6/0
6/2
02
01
9/0
6/2
02
02
2/0
6/2
02
02
5/0
6/2
02
02
8/0
6/2
02
01
/07
/20
20
4/0
7/2
02
07
/07
/20
20
10
/07
/20
20
13
/07
/20
20
16
/07
/20
20
19
/07
/20
20
22
/07
/20
20
25
/07
/20
20
28
/07
/20
20
31
/07
/20
20
3/0
8/2
02
06
/08
/20
20
9/0
8/2
02
01
2/0
8/2
02
01
5/0
8/2
02
01
8/0
8/2
02
02
1/0
8/2
02
02
4/0
8/2
02
02
7/0
8/2
02
03
0/0
8/2
02
02
/09
/20
20
5/0
9/2
02
0 Dai
ly s
can
s an
d m
anu
al e
ntr
ies
Cu
mu
lati
ve A
pp
reg
istr
atio
ns
COVID Tracer App usage Cumulative App registrations
Scans and manual entries

IN CONFIDENCE – NOT FOR DISTRIBUTION
10
Testing17 Table 6: Testing by functional groups, as at 0900 07 September 2020
*Numbers have been sourced from different data extracts in comparison to Table 7.
Laboratory testing numbers18 Table 7: Number of laboratory tests processed nationally as at 0900 07 September 2020
Testing supply update19
21. There are approximately 280,000 complete tests in NZ. Resupply continues to largely
match usage, and additional swab deliveries are expected to arrive this week.
17 ÉCLAIR/MoH Public Health Intelligence, 1000 07 September 2020
18 Daily Lab Report, 0830 07 September 2020
19 Daily Lab Report, 0830 07 September 2020
Reason for test 06 September 31 August – 06 September
GPs and other primary health 1666 23,726
CBACs and pop-ups 1926 31,206
Border workers - air crew 5 227
Border workers - airport staff 86 1500
Border workers - maritime crew 1 41
Border workers – Port of Tauranga staff 77 459
Border workers – Remaining Port staff 69 363
Border workers - MIF 51 1043
Border workers - MIQ 23 209
Travellers - Staying at MIF 84 1994
Travellers - Staying at MIQ 3 198
Total 3991 60,966*
Time period Number of laboratory tests
06 September 3,991
Last 7 days (31 Aug to 06 Sep) 60,602
Total 818,629

IN CONFIDENCE – NOT FOR DISTRIBUTION
11
Testing activity by region
Focus areas
22. As at 0900 07 September there are 19 Community testing Centres in the Metro
Auckland area. Two of these are closed CTC's for close contacts only.20
Healthline updates21 23. On 06 September there were 2,875 contacts in Healthline. Of those calls, 1,130 were to
the COVID-19 Info line. Demand on 1737 Need to talk? and other mental health services
was 596 contacts (in line with forecast).
24. The main themes yesterday/today:
o Community concern and general anxiety following the announcement of the deaths
over 04 – 05 September.
o Symptomatic Service User’s wanting to be tested.
Logistics
Health Workforce22
25. Health Workforce have identified a small group of people on the surge workforce who
have indicated they would be willing to work in an ARC facility in the event of an
outbreak – this week we will work on whether this pool can be expanded and actions to
keep the group “warm” in the event ARC employers require them.
26. Upskilling of alternative workforces for testing continues to progress, including plans
for a training package and scoping of micro-credentialing, in addition to understanding
where this workforce would be obtained from. It is anticipated this training package will
be available within four weeks (estimated).
27. Health Workforce continue to work with TAS and all 20 GMsHR on workforce needs and
issues – regular workforce intelligence information will be provided to Health
Workforce, which will be incorporated into frequent dashboard reports.
20 Community Testing Centres report, 0858 07 September 2020
21 National Telehealth Service Coronavirus Update, 0919 07 September 2020
22 Health Workforce Directorate, 0832 01 September 2020

IN CONFIDENCE – NOT FOR DISTRIBUTION
12
Hospital capacity23 Table 8: Number and occupancy of hospital beds by type as at 0800 07 September 2020
Type Number of units Number (%) occupied/in use
ICU and HDU beds 389 146 (37.5%)
Ventilators 272 40 (14.7%)
Ward beds 6620 5079 (76.7%)
23 COVID-19 Hospital Summary, 0905 07 September 2020

13
IN CONFIDENCE – NOT FOR DISTRIBUTION
Appendix 1: Case summary
Table 9: All community cases reported between 0900 06 September and 0900 07 September
s 9(2)(a)

14
IN CONFIDENCE – NOT FOR DISTRIBUTION
Appendix 2: International case
investigations
s 9(2)(a)

15
IN CONFIDENCE – NOT FOR DISTRIBUTION
Appendix 3: COVID-19 Provisional Disease Indicators, by date
of case notification15
The COVID-19 Provisional Disease Indicators table was unavailable due to technical issues and will be reported in the 08 September SitRep.

16
IN CONFIDENCE – NOT FOR DISTRIBUTION
APPENDIX: 4 The next NRHCC Testing report will be issued at 1700 07 September 2020 and will be reported in
the 08 September SitRep.
Appendix 5: Testing by DHB and ethnicity The tables that follow are the number of people tested. The numbers in the laboratory testing
section are the number of laboratory tests processed.
Table 10: Number of people tested for COVID-19 from 12 August to 07 September
Prioritised Ethnicity MPAO
DHB of Domicile Māori Pacific Asian Other Unknown Total
Auckland 3,101 6,383 8,170 17,660 308 35,622
Bay of Plenty 2,281 259 489 5,735 55 8,819
Canterbury 1,436 566 1,445 12,021 170 15,638
Capital and Coast 1,289 972 1,129 7,973 167 11,530
Counties Manukau 6,514 18,028 7,842 11,198 391 43,973
Hawkes Bay 1,213 244 184 3,137 45 4,823
Hutt Valley 690 377 461 2,675 35 4,238
Lakes 2,152 278 430 2,911 81 5,852
MidCentral 874 231 306 3,491 67 4,969
Nelson Marlborough 537 140 233 3,817 50 4,777
Northland 2,780 190 233 3,679 37 6,919
South Canterbury 130 31 72 1,552 12 1,797
Southern 941 293 597 8,424 70 10,325
Tairāwhiti 750 47 49 691 17 1,554
Taranaki 618 58 138 2,338 37 3,189
Waikato 3,900 916 1,202 8,890 179 15,087
Wairarapa 201 34 31 906 7 1,179
Waitematā 4,017 4,203 6,517 21,549 266 36,552
West Coast 44 8 13 296 6 367
Whanganui 572 67 53 1,256 14 1,962
Unknown 1,298 627 605 3,610 1,286 7,426
Total 35,338 33,952 30,199 123,810 3,300 226,599

17
IN CONFIDENCE – NOT FOR DISTRIBUTION
Table 11: Rate per 1000 people tested for COVID-19 from 12 August to 07 September
Prioritised Ethnicity MPAO
DHB of Domicile Māori Pacific Asian Other Total
Auckland 71.3 113.8 43.7 67.6 65.0
Bay of Plenty 38.1 58.3 25.0 36.5 36.6
Canterbury 27.4 39.9 23.8 26.9 27.3
Capital and Coast 35.3 43.8 22.5 37.5 35.8
Counties Manukau 73.2 150.1 51.9 53.5 77.2
Hawkes Bay 28.0 38.0 20.1 29.0 28.9
Hutt Valley 26.5 32.3 24.6 28.4 28.1
Lakes 55.9 108.8 44.2 48.5 52.8
MidCentral 24.0 41.6 19.7 28.2 27.4
Nelson Marlborough 33.5 56.6 31.4 30.3 31.5
Northland 45.7 50.5 28.2 33.8 38.0
South Canterbury 24.5 63.5 30.4 30.0 30.0
Southern 28.0 42.5 23.1 31.5 30.9
Tairāwhiti 30.3 42.1 42.0 31.3 31.6
Taranaki 26.5 41.6 22.2 26.0 26.4
Waikato 40.5 68.7 27.2 33.0 35.7
Wairarapa 25.2 40.9 24.9 25.4 25.8
Waitematā 64.2 94.3 45.3 56.4 57.7
West Coast 11.3 31.7 14.1 11.0 11.5
Whanganui 32.9 44.0 18.1 29.2 30.3
Total 45.4 106.2 39.4 40.0 45.7

1
IN CONFIDENCE – NOT FOR DISTRIBUTION
SITREP 046
Coronavirus disease 2019 (COVID-19)
Issued: 1030 hours 08 September 2020
Information current at: 1000 hours
This report provides a daily update on the COVID-19 health system response. New information is denoted by red text.
Please use the single point of contact email [email protected] for help/support. Your email will be
logged and promptly passed to the appropriate team.
This document is classified IN CONFIDENCE and not for further distribution.
Need to know
COMMUNITY CASES
NEW LAST 24 hrs
4
MIQ CASES
NEW LAST 24 hrs
2
COMMUNITY CASES
TOTAL RECOVERED
85
98
COMMUNITY CASES
ACTIVE
80 TOTAL CASES SINCE 11 AUG
167
43
TOTAL CASES SINCE 9 JUN
141
TOTAL ACTIVE CASES IN NZ (COMMUNITY & MIQ): 123
MIQ CASES
TOTAL RECOVERED
MIQ CASES
ACTIVE
LABORATORY TESTS
07 September
4,525
LABORATORY TESTS
01 to 07 Sep
56,528
LABORATORY TESTS
TOTAL
823,154
CASES DECEASED
2

IN CONFIDENCE – NOT FOR DISTRIBUTION
2
Total COVID-19 cases
Table 1: Total number of COVID-19 cases as at 0900 08 September 2020
Case Status Active Recovered Deceased Total
Confirmed 123* (+5) 1289 (+1) 19 1431 (+6)
Probable 0 346 5 351
Total 123* (+5) 1635 (+1) 24 1782 (+6)
*Net increase of 6 cases, with 1 case classified as recovered.
Total community cases since 11 August
Table 2: Community cases by DHB and case status as at 0900 08 September 20201
New community cases since 0900 07 September 2020
1. Four new community cases have been reported, as at 0900 08 September.
o All four cases have epidemiological links to existing cases and are associated with
the Mt Roskill Evangelical Church sub-cluster. See details in Para 7.
Community cases linked to the Auckland Community Cluster August 2020
1. 165 of the 167 community cases have been linked to the Auckland Community Cluster
August 2020, as at 0900 08 September. The unlinked cases are summarised as follows:
o The Rydges employee (this investigation has been closed).
o A case (reported 21 August) is still under investigation for an epidemiological link to
the community cluster and there is insufficient data to confirm a genomic link to the
community cluster (see 3).
Community cases under investigation to determine a link to the Auckland community
cluster
2. The case under investigation is summarised as follows:
o One case (reported 21 August) came through the border on 18 June. The case tested
negative at Day 3 and Day 12 of quarantine. Subsequently the case tested positive on
21 August after being swabbed at a mobile testing clinic in Auckland. Despite using
two different whole genome sequencing protocols only a partial genome was
1 EpiSurv
Case
Status
Counties Manukau Waitematā Auckland Waikato Total
Confirmed 75 48 (+4) 43 1 167 (+4)
Probable 0 0 0 0 0
Total 75 48 (+4) 43 1 167 (+4)

IN CONFIDENCE – NOT FOR DISTRIBUTION
3
o
obtained. There is insufficient data to confirm the case is genomically linked to the
community cluster.2 Their epidemiological link to the community cluster is still under
investigation.
Community cases and household contacts at Jet Park
3. As at 0800 08 September there are 69 people isolating in Jet Park from the community.
52 are confirmed cases, the remaining 17 are household contacts. This number will
fluctuate as people finish their isolation and depart from the facility.3
MIQ cases since 0900 07 September 2020
4. Two new cases4 detected at the border, as at 0900 08 September. In total 141 cases
have been detected at the border since the establishment of MIFs/MIQs.
o Both cases arrived in New Zealand on 3 September from the Philippines and have
been in managed isolation since arrival. Tested positive as part of day 3 surveillance
testing.
Cases in hospital
5. As at 0800 08 September there are four cases in hospital with COVID-19.5
Table 3: Number of cases in hospital with COVID-19 by DHB as at 0800 08 September 2020
• One case in North Shore Hospital that was on a general ward 07 September has been transferred
to ICU as a precautionary measure.
2 ESR WGS report 03 September 2020
3 NRHCC Morning Report 08 September 2020
4 EpiSurv
5 NRHCC Morning Report 08 September 2020 and COVID-19 Hospital Summary, 0900 08 September 2020
DHB Hospital Number in a general ward Number in ICU/HDU
Auckland Auckland City 0 0
Counties Manukau Middlemore 1 0
Waitematā North Shore 1 1
Waikato Waikato 0 1
Total - 2 2

IN CONFIDENCE – NOT FOR DISTRIBUTION
4
Health system response
Overall approach
6. Our investigation has two main focus areas that run in parallel:
o Source attribution – a focus on investigating the case with the earliest symptom
onset date to gather details actions of movements 14 days prior. This will help to
understand the possible source of the new outbreak.
o Containment – rigorous case investigation, identification of close contacts and
isolation and testing to ensure that chain of transmission is broken.
Overview6
There is now a clear increase in cases as a result of the new Mt Roskill Evangelical Church sub-
cluster. Some of these cases have recent symptoms. While the impact of intensive case follow-up
appears to be working overall, the number of cases associated with the Mt Roskill Evangelical
Church sub-cluster has continued to increase and it is likely that more cases will arise.
Current outbreak investigation priorities7
o Contact tracing and containment around Mt Roskill Evangelical Church sub-cluster.
o Seek to identify an epidemiological link to the main cluster for the case.
o Clarify whether the case that is a returnee from June is a new infection and clarify strain.
o Contact trace and isolate close contacts exposed on Auckland bus journeys.
o Seek to identify an epidemiological link to the main cluster for cases that have been
genomically linked but not epidemiologically linked.
Sub-clusters and settings of interest
7. As at 2000 07 September, a new potential sub-cluster and exposure event was
identified within Mt Roskill, with an epidemiological link to Mt Roskill evangelical
church.
A death (not COVID related) occurred Between 24th August and 2nd September,
there were multiple gatherings associated with the bereavement. Funeral at a
funeral home, approximately 50 attendees. Good records kept, including sign in. An extended
family member of the deceased became a confirmed case on 07 September. Contact tracing from
this case identified the funeral and mourning events as exposure settings.
There are three confirmed cases linked to this initial case. All are extended family and include four
separate households. One case was confirmed on 06 September and has been isolating since then.
The other three cases have been isolating since 07 September. All four new cases presented
themselves for testing.
6 ARPHS Strategic Report 31 August 2020
7 ARPHS Strategic Report 31 August 2020
s 9(2)(a)
s 9(2)(a)
s 9(2)(a)
s 9(2)(a)

IN CONFIDENCE – NOT FOR DISTRIBUTION
5
One of the new cases is in a Managed Quarantine and Isolation (MIQ) facility. Two additional cases,
plus household members, are moving to MIQ today (08 September).
All have been stood down and will be tested today (08 September).
There are four close contacts from these cases.
ARPHS actions8:
o Scoping new cases.
o Gathering lists of attendees at the bereavement gatherings which occurred
between 24 August and 02 September. ARPHS are working with Māori and Pacific
liaison, and through Mt Roskill Evangelical Church, to identify attendees. All close
contacts will be tested and isolated.
o There are comprehensive records from the funeral on . All attendees will
be tested, and work is underway to move these contacts into isolation.
o Quarantine and testing of household contacts of the new cases. Testing is underway for
household contacts, including repeat testing as needed for people previously tested
from the Mt Roskill church.
o They are being tested today (08
September), and are in isolation.
8. Contact tracing investigation and testing is ongoing for the Botany sub-cluster. This
sub-cluster includes the Botany case reported 28 August and four other cases reported
recently (one on 31 August and three on 01 September).9
9. Settings of interest for the Botany sub-cluster are being investigated, including casual
work places. More information to come when available.9
10. There is a sports club associated with the Mt Roskill Evangelical Church. To date there
are no known exposures confirmed at the sports club.10 It is being investigated as both
a possible exposure event and a possible source of the Mt Roskill Evangelical Church
sub-cluster.11
ARPHS advised on 31 August the sports club had been closed for the two weeks prior,
therefore none of the club members are being considered close contacts. ARPHS sent
comms to members regarding testing and to date no positive cases have been
reported.12 Surveillance testing is ongoing.10
8 ARPHS Phone Call, 0930 08 September 2020
9 NRHCC Morning Report 07 September 2020
10 NRHCC Morning Report 03 September 2020
11 NRHCC Morning Report 02 September 2020
12 ARPHS, Waikato DHB and MoH teleconference 1500 31 August 2020
s 9(2)(a)
s 9(2)(a)
s 9(2)(a)
s 9(2)(a)
s 9(2)(a)
s 9(2)(a)
s 9(2)(a) s 9(2)(a)
s 9(2)(a)

IN CONFIDENCE – NOT FOR DISTRIBUTION
6
Case investigation
11. Four cases that have been genomically linked to the main cluster are still being
investigated by ARPHS to identify their epidemiological link to the main cluster.
o The
o GP
o The second Mount Albert Grammar student
o The Botany case
12. Investigation into source attribution of the Botany cases infection is continuing. A
possible epidemiological link is being explored between the Botany case and previously
reported cases within another household. The symptom onset dates of the possible
epidemiological linked household are prior to the Botany cases’ symptom onset dates.
Further investigation is underway.9
13. The case in Tokoroa reported on 29 August is a contact of an existing case from
Tokoroa who is linked to the Auckland cluster. The case works at a medical centre in
Tokoroa and it is believed they had contact with the existing case
The centre has had a final deep clean and has reopened with reduced
staff and are completing most consultations virtually. Contact tracing is being
completed back to 20 August. This is a precautionary timeframe due to the case’s long
incubation period and radiological findings suggesting more advanced disease despite
the 27 August symptom onset date. To date, all contacts tested have received negative
results (See table 4).13
13 Waikato DHB Morning Report 07 September 2020
s 9(2)(a)
s 9(2)(a)
s 9(2)(a)
s 9(2)(a)
7
IN CONFIDENCE – NOT FOR DISTRIBUTION
1.
s 9(2)(a)
s 9(2)(a)

IN CONFIDENCE – NOT FOR DISTRIBUTION
8
s 9(2)(a)

9
IN CONFIDENCE – NOT FOR DISTRIBUTION
ESR and wider testing14 14. A further 34 community cases are genomically linked with the Auckland cluster. These
cases are from the following known sub-clusters; Church 1 (6 cases), Church 2 (4 cases),
Church 3 (9 cases), Finance Now HH (1 case), Americold HH (3 cases), Botany (4 cases),
(4 cases) (3 cases).15
15.
16. Work is underway to analyse how the whole genome sequencing can be used to tell us
how COVID-19 has been transmitted through the community cluster and to further
inform its management.
17. No direct links have been found between the community outbreak genome
sequencing, with the 67 genomes currently available from cases in managed isolation
facilities (MIFs).
18.
Contact tracing16 19. Between 30 August and 05 September 98% (61/62) of Community close contacts and
95% (100/105) MIQ close contacts have been contacted within 48 hours of being
determined to be a contact. KPI for this metric is 80% of close contacts within 48 hours.
o Notes: This metric reports all cases during the specified period, including those in Managed Isolation and Quarantine, and does not include casual contacts.
o Notes: The close contact numbers for today have fallen slightly due to the reclassification of some older cases from community to border cases.
Table 5: Close contact tracing recorded in the National Contact Tracing Solution since 11 August as at
0900 08 September 2020
05/09/2020 06/09/2020 07/09/2020 08/09/2020
Number of close contacts
identified1 3222 3217 3224 3274
14 ESR Whole Genome Sequencing Report 02 September 2020
15 ESR email update 0900 08 September 2020
16 COVID-19 NCCS Analytics and Reporting 0938 08 September 2020
s 9(2)(a) s 9(2)(a)
s 9(2)(g)(i)
s 9(2)(g)(i)

IN CONFIDENCE – NOT FOR DISTRIBUTION
10
Number of close contacts
successfully contacted (and are
self-isolating)
3177 3187 3199 3228
Number of close contacts
referred to "finding services"2 4 4 0 0
Number of close contacts
awaiting contact 41 26 25 46
1. Contacts loaded into the National Contact Tracing Solution, and managed by either the National Investigation and Tracing
Unit or the Public Health Units. Contacts from MIQ and overseas cases are not included in this report.
2. "Finding services" refers to the mechanism the National Close Contact Service uses to find valid contact details for close
contacts we do not have the correct contact details for. These services utilise internal Ministry of Health databases along with
Police, Customs and Airlines where relevant.
3. The total number and number successfully contacted can decrease due to duplicates and invalid records being removed from
the system.
COVID-19 Tracer App usage17 Figure 1: COVID-19 Tracer App cumulative registered users and daily scans/manual entries as at 1615
07 September 2020
1. The number of scans and manual entries on any given date is subject to change for up to 31 days. This is because there can be
a delay before anonymised analytic information is received (e.g. device not connected to internet when scan carried out).
2. The number of App registrations and QR codes for any given date is subject to change for up to 1 day. This is because due to
reporting timeframes these numbers may be extracted before the 12pm cut-off for the reporting period.
20. Key Numbers:
o 2,145,500 - Total registered users
o 2,192,953 - QR code scans between 1200 05 and 1200 06 September
17 Response Analyst – Digital Channels, 1620 07 September 2020
0
500,000
1,000,000
1,500,000
2,000,000
2,500,000
3,000,000
0
500,000
1,000,000
1,500,000
2,000,000
2,500,000
20
/05
/20
20
23
/05
/20
20
26
/05
/20
20
29
/05
/20
20
1/0
6/2
02
04
/06
/20
20
7/0
6/2
02
01
0/0
6/2
02
01
3/0
6/2
02
01
6/0
6/2
02
01
9/0
6/2
02
02
2/0
6/2
02
02
5/0
6/2
02
02
8/0
6/2
02
01
/07
/20
20
4/0
7/2
02
07
/07
/20
20
10
/07
/20
20
13
/07
/20
20
16
/07
/20
20
19
/07
/20
20
22
/07
/20
20
25
/07
/20
20
28
/07
/20
20
31
/07
/20
20
3/0
8/2
02
06
/08
/20
20
9/0
8/2
02
01
2/0
8/2
02
01
5/0
8/2
02
01
8/0
8/2
02
02
1/0
8/2
02
02
4/0
8/2
02
02
7/0
8/2
02
03
0/0
8/2
02
02
/09
/20
20
5/0
9/2
02
0 Dai
ly s
can
s an
d m
anu
al e
ntr
ies
Cu
mu
lati
ve A
pp
reg
istr
atio
ns
COVID Tracer App usage Cumulative App registrations
Scans and manual entries

IN CONFIDENCE – NOT FOR DISTRIBUTION
11
Testing18 Table 6: Testing by functional groups, as at 0900 08 September 2020
*Numbers have been sourced from different data extracts in comparison to Table 7.
Laboratory testing numbers19 Table 7: Number of laboratory tests processed nationally as at 0900 08 September 2020
Testing supply update20
21. There are approximately 280,000 complete tests in NZ. Resupply continues to largely
match usage, and additional swab deliveries are expected to arrive this week.
18 ÉCLAIR/MoH Public Health Intelligence, 1000 07 September 2020
19 Daily Lab Report, 0855 08 September 2020
20 Daily Lab Report, 0855 08 September 2020
Reason for test 07 September 01 – 07 September
GPs and other primary health 179 21,146
CBACs and pop-ups 361 25,957
Border workers - air crew 3 177
Border workers - airport staff 53 1307
Border workers - maritime crew 0 7
Border workers – Port of Tauranga staff 0 456
Border workers – Remaining Port staff 4 336
Border workers - MIF 5 994
Border workers - MIQ 3 209
Travellers - Staying at MIF 92 1607
Travellers - Staying at MIQ 3 192
Total 703 52,388*
Time period Number of laboratory tests
07 September 4,525
Last 7 days (01 Sep to 07 Sep) 56,528
Total 823,154

IN CONFIDENCE – NOT FOR DISTRIBUTION
12
Testing activity by region
Focus areas
22. As at 1700 07 September there are 16 Community testing Centres in the Metro
Auckland area. Two of these are closed CTC's for close contacts only.21
Healthline updates22 23. On 07 September there were 3,176 contacts in Healthline. Of those calls, 1,349 were to
the COVID-19 Info line. Demand on 1737 Need to talk? and other mental health services
was 596 contacts (in line with forecast).
24. Work continues to implement the revised testing strategy and how it relates to our
public facing advice – particularly the role we may play in supporting DHB’s around
local asymptomatic testing plans.
25. The main themes yesterday/today:
o Community concern and general anxiety following the announcement of the deaths
over 04 – 05 September.
o Symptomatic Service User’s wanting to be tested.
Logistics
Health Workforce23
26. Health Workforce have identified a small group of people on the surge workforce who
have indicated they would be willing to work in an ARC facility in the event of an
outbreak – this week we will work on whether this pool can be expanded and actions to
keep the group “warm” in the event ARC employers require them.
27. Upskilling of alternative workforces for testing continues to progress, including plans
for a training package and scoping of micro-credentialing, in addition to understanding
where this workforce would be obtained from. It is anticipated this training package will
be available within four weeks (estimated).
28. Health Workforce continue to work with TAS and all 20 GMsHR on workforce needs and
issues – regular workforce intelligence information will be provided to Health
Workforce, which will be incorporated into frequent dashboard reports.
21 Community Testing Centres report, 1659 07 September 2020
22 National Telehealth Service Coronavirus Update, 1014 08 September 2020
23 Health Workforce Directorate, 0832 01 September 2020
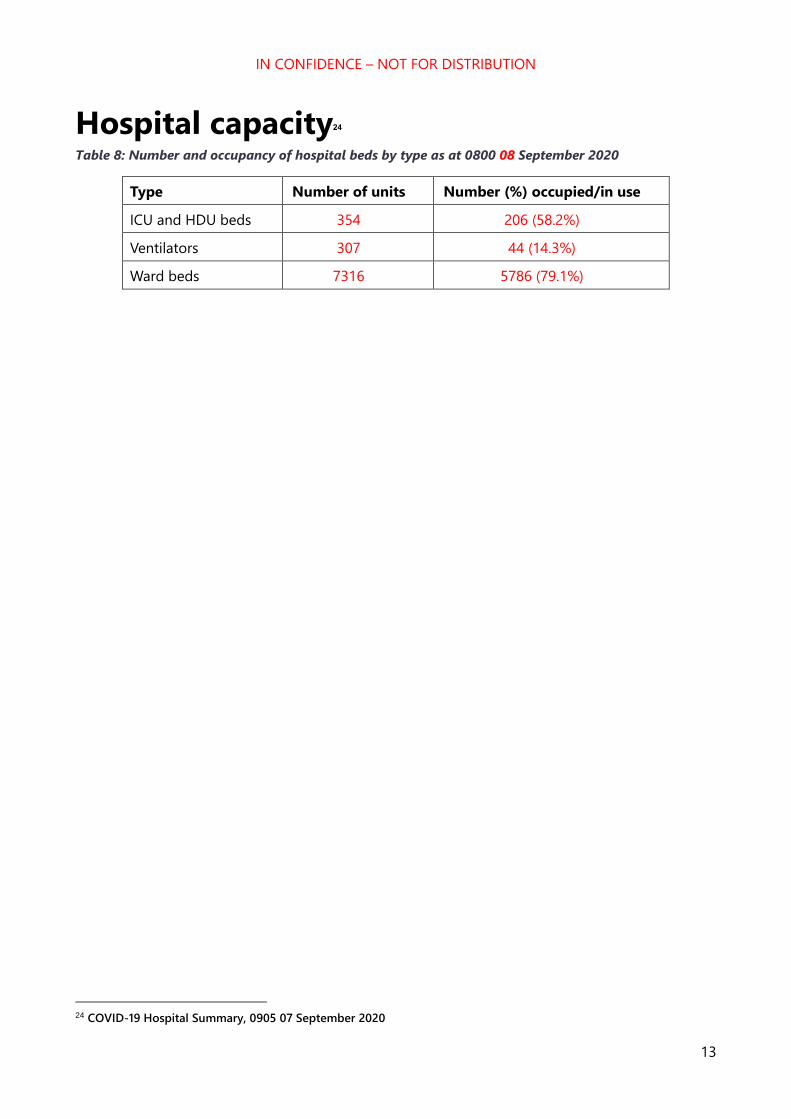
IN CONFIDENCE – NOT FOR DISTRIBUTION
13
Hospital capacity24 Table 8: Number and occupancy of hospital beds by type as at 0800 08 September 2020
Type Number of units Number (%) occupied/in use
ICU and HDU beds 354 206 (58.2%)
Ventilators 307 44 (14.3%)
Ward beds 7316 5786 (79.1%)
24 COVID-19 Hospital Summary, 0905 07 September 2020

14
IN CONFIDENCE – NOT FOR DISTRIBUTION
Appendix 1: Case summary
Table 9: All community cases reported between 0900 07 September and 0900 08 September
s 9(2)(a)

15
IN CONFIDENCE – NOT FOR DISTRIBUTION
Appendix 2: International case
investigations
s 9(2)(a)

16
IN CONFIDENCE – NOT FOR DISTRIBUTION
Appendix 3: COVID-19 Provisional Disease Indicators, by date
of case notification16 Data for cases in the community
Indicator (as per Table 9832) Refined Indicator description Target 31-Aug 1-Sep 2-Sep 3 Sept ** 4 Sept ** 5 Sept ** 6 Sept **
1 - (S001) Time from exposure to contact isolation / quarantine
80% within 96 hours
92% 0% *
(0/8) 100% - - - -
2 – (S002) Time from case first symptom to contact isolation / quarantine
80% within 96 hours
92% 0% *
(0/8) 86% - - - -
3 – (S003) Time from test sample taken to close contact isolation / quarantine
80% within 72 hours
100% 100% 100% 100% 100% - -
4 – (C001) Time from first symptom to test sample taken for positive cases
80% within 48 hours
67% 0% *
(0/1)
0% *
(0/2) - 33% 100% -
5 – (L001) Time from test sample taken to notification of positive result
80% within 24 hours
67% 100% 100% 0% *
(0/1) 25%
0% *
(0/1) 20%
6 – (P002) Time from case notification to isolation / quarantine of contact
80% within 48 hours
100% 100% 100% 100% 100% - -
7 – (P001) Time from notification to case interview 80% within 24 hours
100% 100% 100% 100% 100% 100% 100%
8 – (P003) Time from close contact identification to isolated / quarantined
80% within 24 hours
100% 22% 100% 100% 100% - 100%
10 – (P004) Proportion of contacts traced in 48 hours 80% within 48 hours
100% 100% 100% 100% 100% - -
C – (S005) Proportion of close contacts with confirmed or suspected COVID-19 at the time of tracing <20% 8% 0% 0% 0% 0% - 0%
Note:
• * The numerator and denominator are provided in some instances to provide context for low percentages.
• **Data is not available for metrics where there is no data that meets the definition, or where the time/days to reach target has not fully elapsed
• The value of P002 can drop due to the addition of new close contacts to exposure events after the 48-hour period since case notification had elapsed. This can happen for a number of reasons, including a case recalling further details following the original case
interview.
• These metrics report all cases during the specified period, including those in Managed Isolation and Quarantine, and do not include casual contacts.
• There are three additional indicators under development requiring both technical and clinical input to define data requirements. These are due to be completed by end October 2020.

IN CONFIDENCE – NOT FOR DISTRIBUTION
17
Data for cases in Managed Isolation and Quarantine, International, and Unknown
Indicator (as per Table 9832) Refined Indicator description Target 31-Aug 1-Sep 2 Sept ** 3-Sep 4 Sept ** 5 Sept ** 6 Sept **
1 - (S001) Time from exposure to contact isolation / quarantine
80% within 96 hours
0% * (0/15)
0% * (0/2)
- 100% - - -
2 – (S002) Time from case first symptom to contact isolation / quarantine
80% within 96 hours
100% 100% - 0% * (0/3)
- - -
3 – (S003) Time from test sample taken to close contact isolation / quarantine
80% within 72 hours
100% 100% 71% 100% 40% - -
4 – (C001) Time from first symptom to test sample taken for positive cases
80% within 48 hours
50% 0% * (0/2)
- 0% * (0/1)
- - -
5 – (L001) Time from test sample taken to notification of positive result
80% within 24 hours
25% 0% * (0/1)
100% 100% 100% - 0%
6 – (P002) Time from case notification to isolation / quarantine of contact
80% within 48 hours
100% 100% 71% 100% 40% - -
7 – (P001) Time from notification to case interview 80% within 24 hours
100% 100% 100% 100% 100% - 100%
8 – (P003) Time from close contact identification to isolated / quarantined
80% within 24 hours
100% 100% 71% 100% 40% - 100%
10 – (P004) Proportion of contacts traced in 48 hours 80% within 48 hours
100% 100% 71% 100% 40% - -
C – (S005) Proportion of close contacts with confirmed or suspected COVID-19 at the time of tracing <20% 4% 0% 0% 67% 0% - 0%
Note:
• * The numerator and denominator are provided in some instances to provide context for low percentages.
• **Data is not available for metrics where there is no data that meets the definition, or where the time/days to reach target has not fully elapsed
• The value of P002 can drop due to the addition of new close contacts to exposure events after the 48-hour period since case notification had elapsed. This can happen for a number of reasons, including a case recalling further details following the original case interview.
• These metrics report all cases during the specified period, including those in Managed Isolation and Quarantine, and do not include casual contacts.
• There are three additional indicators under development requiring both technical and clinical input to define data requirements. These are due to be completed by end October 2020.

18
IN CONFIDENCE – NOT FOR DISTRIBUTION
APPENDIX: 4
NRHCC Testing Report
Novel Coronavirus (COVID-19)
Issued: 1700 07 September 2020
Table 1. Metro Auckland Summary Total of Testing for 07 September 2020
Community MIQ
staff
MIQ
guests
Airport Maritime port TOTAL
5:00pm 1631 86 483 153 19 2372
Table 2. Totals tests receipted from 12 August 2020, by ethnicity (as at 5pm)
*Swab taken in last 24 hours taken between midnight and midnight, may have been receipted and
reported later than this; tests only included if coded and received and acknowledged by lab, result
not required
*Includes GP clinics, Urgent Care Centres, Designated practices
Table 3. Estimated tests taken since 12 August 2020, based on manual site reports at 5pm
Site 12/08-16/08 17/08-23/08 24/08 – 30/08 31/08 – 06/09 07/09*
MIQ Staff 2132 659 1488 912 86
Guests 2972 3767 3600 3406 468
Border Airport 2129 933 1349 1158 153
Port 1588 678 161 392 19
* 07/09 day still in progress
Tests Last 24 hours Total since 12/8*
Ethnicity CTC
Non-
CTC
Total
% Tests %
Asian 200 229 429 19.7% 32,406 17.6%
Maori 158 78 236 10.9% 26,582 14.5%
Other 391 399 790 36.3% 77,649 42.2%
Pacific 435 96 531 24.4% 43,357 23.6%
Unknown 15 174 189 8.7% 3846 2.1%
Total 1199 976 2175 183,840

IN CONFIDENCE – NOT FOR DISTRIBUTION
19
Table 4: Estimated tests taken at Metro Auckland CTCs, since 12 August 2020, based on
manual site reports at 4pm
Site 12/08-16/08
(days open)
17/08-
23/08
(days
open)
24/08 –
30/08
(days
open)
31/08 –
06/09
07/09*
Airport Oaks 1148 (4) 515 (7) 366 (7) 265 (7) 39
Auckland Netball Centre 192 (1) 1065 (7) 884 (7) 640 (7) 134
Botany CTC 1151 (5) 948 (7) 905 (7) 749 (7) 135
Coast to Coast
Warkworth
334 (5) 109 (7) 70 (7) 35 (7) 17
Coast to Coast
Wellsford
203 (5) 114 (7) 116 (7) 81 (7) 15
Eventfinda Stadium 1800 (5) 527 (7) 517 (7) N/A N/A
Health New Lynn 2603 (5) 1258 (7) 1703 (7) 732 (7) 129
Henderson 940 (4) 645 (7) 634 (7) 351 (5) N/A
Mangere Town Centre 1748 (3) 1684 (7) 1599 (7) 860 (7) 144
Manurewa Marae N/A 124 (4) 268 (6) 110 (2) N/A
Northcare A&M 253 (2) 463 (7) 527 (7) 741 (7) 57
Otara CTC 3221 (5) 1712 (7) 1429 (7) 930 (7) 108
Pukekohe CTC N/A 131 (4) 226 (6) 298 (6) N/A
St Lukes 1368 (5) 1045 (7) 1414 (7) 797 (7) 99
Takanini Urgent Care 1886 (5) 1216 (7) 1153 (7) 684 (7) 13
Waiheke Medical Centre 312 (5) 145 (7) 220 (7) 98 (7) 92
Whanau House 2502 (5) 1371 (7) 1442 (7) 928 (7) 261
Whanau Ora - Central 1957 (5) 964 (7) 1583 (7) 937 (7) 80
Whanau Ora - North 1442 (5) 669 (7) 637 (7) 982 (7) 105
Whanau Ora - South 2945 (5) 1250 (7) 718 (7) 677 (7) 108
Point England Pop Up N/A N/A 88 (3) N/A N/A
Randwick Park Pop Up N/A N/A 303 (5) N/A N/A
Ranui Pop Up N/A N/A 409 (5) N/A N/A
Mt Smart Stadium Pop
Up
N/A N/A 219 (3) N/A N/A

IN CONFIDENCE – NOT FOR DISTRIBUTION
20
Massey Pop Up N/A N/A 787 (5) N/A N/A
South Kaipara Pop Up N/A N/A 170 (4) N/A N/A
Clendon Pop Up N/A N/A 368 (3) N/A N/A
Mangere Pop Up N/A N/A 472 (2) N/A N/A
Mangere East Pop Up N/A N/A 109 (2) N/A N/A
Otara Pop Up N/A N/A 59 (2) N/A N/A
Otahuhu Pop Up N/A N/A 201 (2) N/A N/A
Mt Roskill Pop Up (330
start)
N/A N/A 217 (2) 164 (3) N/A
Sandringham Pop Up N/A N/A N/A 189 (3) N/A
Ranui League Club Pop
Up
N/A N/A N/A 172 (3) N/A
Glen Eden Pop Up N/A N/A N/A 127 (4) N/A
Southmall Pop Up N/A N/A N/A 291 (3) N/A
Orakei Pop Up N/A N/A N/A 118 (3) N/A
Papatoetoe Pop Up N/A N/A N/A 74 (3) N/A
Te Atatu Pop Up N/A N/A N/A 65 (3) N/A
Mangere East Marae
Pop Up
N/A N/A N/A No Data N/A
Mangere Leagues Club N/A N/A N/A No Data N/A
Tamaki College Pop Up N/A N/A N/A 109 (2) N/A
Papatoetoe EFKS Pop
Up
N/A N/A N/A 74 (1) N/A
Botany Town Centre
Pop Up
N/A N/A N/A 121 (2) N/A
Sylvia Park Pop Up N/A N/A N/A 21 (2) N/A
East Tamaki Pop Up N/A N/A N/A 161 (1) N/A
Rowandale Pop Up N/A N/A N/A 41 (1) N/A
Henderson EFKS Pop Up N/A N/A N/A N/A 43
Waipuna Targeted Site 143 (2) 549 (7) 376 (7) 219 (7) 42
Blockhouse Bay
Targeted Site
N/A 277 (7) 921 (7) 161 (5) N/A
Henderson Targeted
Site
N/A N/A N/A N/A 6
Total 26,148 16,781 21,215 13,002 1631 * 07/09 day still in progress N/A = not open as a CTC

IN CONFIDENCE – NOT FOR DISTRIBUTION
21
Appendix 5: Testing by DHB and ethnicity The tables that follow are the number of people tested. The numbers in the laboratory testing
section are the number of laboratory tests processed.
Table 10: Number of people tested for COVID-19 from 12 August to 07 September
Prioritised Ethnicity MPAO
DHB of Domicile Māori Pacific Asian Other Unknown Total
Auckland 3128 6436 8262 17845 314 35985
Bay of Plenty 2298 261 501 5792 55 8907
Canterbury 1446 572 1478 12131 174 15801
Capital and Coast 1303 978 1142 8085 173 11681
Counties Manukau 6556 18241 7938 11301 395 44431
Hawkes Bay 1244 255 186 3218 48 4951
Hutt Valley 692 380 469 2716 36 4293
Lakes 2156 278 431 2923 81 5869
MidCentral 923 240 320 3666 72 5221
Nelson Marlborough 542 140 240 3876 50 4848
Northland 2791 193 234 3693 38 6949
South Canterbury 131 31 72 1555 13 1802
Southern 944 298 603 8500 73 10418
Tairāwhiti 783 51 54 711 17 1616
Taranaki 626 59 141 2364 39 3229
Waikato 3922 935 1234 8973 188 15252
Wairarapa 202 34 31 915 7 1189
Waitematā 4042 4228 6584 21675 270 36799
West Coast 44 8 13 297 6 368
Whanganui 597 68 57 1334 14 2070
Unknown 1306 639 616 3675 1344 7580
Total 35676 34325 30606 125246 3407 229260

22
IN CONFIDENCE – NOT FOR DISTRIBUTION
Table 11: Rate per 1000 people tested for COVID-19 from 12 August to 07 September
Prioritised Ethnicity MPAO
DHB of Domicile Māori Pacific Asian Other Total
Auckland 71.9 114.8 44.1 68.3 65.6
Bay of Plenty 38.4 58.7 25.6 36.8 36.9
Canterbury 27.6 40.3 24.3 27.2 27.5
Capital and Coast 35.7 44.1 22.8 38 36.3
Counties Manukau 73.6 151.9 52.5 54 78
Hawkes Bay 28.8 39.7 20.3 29.8 29.7
Hutt Valley 26.6 32.5 25 28.8 28.5
Lakes 56 108.8 44.3 48.7 53
MidCentral 25.4 43.3 20.6 29.6 28.8
Nelson Marlborough 33.8 56.6 32.3 30.8 31.9
Northland 45.9 51.3 28.3 33.9 38.2
South Canterbury 24.7 63.5 30.4 30.1 30.1
Southern 28.1 43.3 23.4 31.8 31.2
Tairāwhiti 31.6 45.6 46.3 32.2 32.9
Taranaki 26.8 42.4 22.6 26.3 26.7
Waikato 40.7 70.1 28 33.3 36.1
Wairarapa 25.3 40.9 24.9 25.6 26
Waitematā 64.6 94.8 45.8 56.7 58.1
West Coast 11.3 31.7 14.1 11 11.5
Whanganui 34.4 44.7 19.5 31 31.9
Total 45.9 107.3 39.9 40.5 46.2

1
IN CONFIDENCE – NOT FOR DISTRIBUTION
SITREP 047
Coronavirus disease 2019 (COVID-19)
Issued: 1030 hours 09 September 2020
Information current at: 1000 hours
This report provides a daily update on the COVID-19 health system response. New information is denoted by red text.
Please use the single point of contact email [email protected] for help/support. Your email will be
logged and promptly passed to the appropriate team.
This document is classified IN CONFIDENCE and not for further distribution.
Need to know
COMMUNITY CASES
NEW LAST 24 hrs
6
MIQ CASES
NEW LAST 24 hrs
0
COMMUNITY CASES
TOTAL RECOVERED
89
98
COMMUNITY CASES
ACTIVE
82 TOTAL CASES SINCE 11 AUG
173
43
TOTAL CASES SINCE 9 JUN
141
TOTAL ACTIVE CASES IN NZ (COMMUNITY & MIQ): 125
MIQ CASES
TOTAL RECOVERED
MIQ CASES
ACTIVE
LABORATORY TESTS
08 September
8,363
LABORATORY TESTS
02 to 08 Sep
53,957
LABORATORY TESTS
TOTAL
831,517
CASES DECEASED
2

IN CONFIDENCE – NOT FOR DISTRIBUTION
2
Total COVID-19 cases
Table 1: Total number of COVID-19 cases as at 0900 09 September 2020
Case Status Active Recovered Deceased Total
Confirmed 125* (+2) 1293 (+4) 19 1437 (+6)
Probable 0 346 5 351
Total 125* (+2) 1639 (+4) 24 1788 (+6)
*Net increase of 6 cases, with 4 cases classified as recovered.
Total community cases since 11 August
Table 2: Community cases by DHB and case status as at 0900 09 September 20201
New community cases since 0900 08 September 2020
1. Six new community cases have been reported, as at 0900 09 September.
o All six cases have epidemiological links to existing cases and are associated with the
Mt Roskill Evangelical Church sub-cluster. (See 8). Of these, four cases are associated
with bereavement events. The other two cases require further investigation to
determine if they are associated with bereavement events or with the wider Mt
Roskill Evangelical Church sub-cluster.
Community cases linked to the Auckland Community Cluster August 2020
2. 171 of the 173 community cases have been linked to the Auckland Community Cluster
August 2020, as at 0900 09 September. The unlinked cases are summarised as follows:
o The Rydges employee (this investigation has been closed).
o A case (reported 21 August) is still under investigation for an epidemiological link to
the community cluster and there is insufficient data to confirm a genomic link to the
community cluster (see 3).
Community cases under investigation to determine a link to the Auckland community
cluster
3. The case under investigation is summarised as follows:
1 EpiSurv Database, 0900 09 September 2020
Case
Status
Counties Manukau Waitematā Auckland Waikato Total
Confirmed 75 51 (+3) 45 (+2) 1 172 (+5)
Probable 1 (+1) 0 0 0 1 (+1)
Total 76 (+1) 51 (+3) 45 (+2) 1 173 (+6)

IN CONFIDENCE – NOT FOR DISTRIBUTION
3
o One case (reported 21 August) came through the border on 18 June. The case tested
negative at Day 3 and Day 12 of quarantine. Subsequently the case tested positive on
21 August after being swabbed at a mobile testing clinic in Auckland. Despite using
two different whole genome sequencing protocols only a partial genome was
obtained. There is insufficient data to confirm the case is genomically linked to the
community cluster.2 Their epidemiological link to the community cluster is still under
investigation.
Community cases and household contacts at Jet Park
4. As at 0800 09 September there are 74 people isolating in Jet Park from the community.
58 are confirmed cases, the remaining 16 are household contacts. This number will
fluctuate as people finish their isolation and depart from the facility.3
MIQ cases since 0900 08 September 2020
5. There are no new cases4 detected at the border, as at 0900 09 September. In total 141
cases have been detected at the border since the establishment of MIFs/MIQs.
Cases in hospital
6. As at 0800 09 September there are four cases in hospital with COVID-19.5
o One patient on general ward in Counties Manukau was discharged to Jet Park
yesterday.
o .
o One new case admitted to North Shore Hospital (reported today).
Table 3: Number of cases in hospital with COVID-19 by DHB as at 0800 09 September 2020
2 ESR WGS report 03 September 2020
3 NRHCC Morning Report 08 September 2020
4 EpiSurv
5 NRHCC Morning Report 08 September 2020 and COVID-19 Hospital Summary, 0900 08 September 2020
DHB Hospital Number in a general ward Number in ICU/HDU
Counties Manukau Middlemore 0 0
Waitematā North Shore 2 1
Waikato Waikato 0 1
Total - 2 2
s 9(2)(a)

IN CONFIDENCE – NOT FOR DISTRIBUTION
4
Health system response
Overall approach
7. Our investigation has two main focus areas that run in parallel:
o Source attribution – a focus on investigating the case with the earliest symptom
onset date to gather details actions of movements 14 days prior. This will help to
understand the possible source of the new outbreak.
o Containment – rigorous case investigation, identification of close contacts and
isolation and testing to ensure that chain of transmission is broken.
Overview6
8. There is now a clear increase in cases as a result of the new Mt Roskill Evangelical
Church sub-cluster. Some of these cases have recent symptoms. While the impact of
intensive case follow-up appears to be working overall, the number of cases associated
with the Mt Roskill Evangelical Church sub-cluster has continued to increase and it is
likely that more cases will arise.
Current outbreak investigation priorities7
o Contact tracing and containment around Mt Roskill Evangelical Church sub-cluster
o Clarify whether the case that is a returnee from June is a new infection and clarify strain.
o Seek to identify an epidemiological link to the main cluster for cases that have been
genomically linked but not epidemiologically linked.
Sub-clusters and settings of interest
9. On 7 September, a new potential sub-cluster and exposure event was identified within
Mt Roskill, with an epidemiological link to Mt Roskill Evangelical Church.8 There are
clear links between the Church and the new sub-cluster.9 ARPHS have being working to
develop rapport, trust and cooperation with the Mt Roskill Evangelical Church leaders,
which is critical for further scoping and investigation. The following events described
below were not disclosed to ARPHS until 7 September, when ARPHS were doing
contact tracing work around a newly identified case identified who attended the
bereavement events.10
A death (not COVID related) Between 24 August and 2
September, there were multiple gatherings associated with the bereavement. A funeral
occurred on at a funeral home with approximately 50 attendees. Good
records of attendees were kept by the funeral home, including sign in. An extended
6 ARPHS Strategic Report 31 August 2020
7 ARPHS Strategic Report 31 August 2020
8 ARPHS, Waikato DHB and MoH teleconference 0830 08 September 2020
9 NRHCC Morning Report 09 September 2020
10 ARPHS, Waikato DHB and MoH teleconference 1500 08 September 2020
s 9(2)(a)
s 9(2)(a)

IN CONFIDENCE – NOT FOR DISTRIBUTION
5
family member of the deceased was confirmed as a case on 7 September. Contact
tracing from this case identified the funeral and mourning events as exposure settings.
Some of the attendees of the bereavement events are linked to the Mt Roskill
Evangelical Church sub-cluster.
All funeral attendees are considered close contacts and will self-isolate and be tested.
All other contacts at Mt Roskill Evangelical Church (who did not attend the funeral) are
considered to be casual contacts unless symptomatic - unless they have symptoms they
are not required to self-isolate.10 ARPHS are working with the church today (9
September) to determine a strategy for testing casual contacts at the church.9
There were three confirmed cases linked to the case identified on 7 September. They
are members of an extended family and include four separate households. One case
was confirmed on 06 September and has been isolating since then. One case became
on 5th September and began isolating then. The other two cases have
been isolating since 07 September. All four cases presented themselves for testing. Of
the four cases,
One of the initial cases is in a Managed Quarantine and Isolation (MIQ) facility. Two
additional cases, plus household members moved to MIQ 8 September.
There are four close contacts from these cases. All
close contacts have been stood down and were tested 8 September.
A new setting of interest is St Dominic’s College in Henderson, Auckland. A confirmed
case attended the school.9
The school has been informed and communications
have been sent. The case is linked to new sub-cluster associated with the bereavement
events.
ARPHS actions:
o Maintain and strengthen relationships with Church leaders and liaise with Church
members about their need for financial and welfare support if asked to isolate.10
o Scoping new cases.
o Gathering lists of attendees at the daily bereavement gatherings which occurred
between 24 August and 02 September. ARPHS are working with Māori and Pacific
liaison, and through Mt Roskill Evangelical Church, to identify attendees. All close
contacts will be tested and isolated.8
o There are comprehensive records from the funeral on . All attendees will
be tested, and work is underway to move these contacts into isolation.8
o Quarantine and testing of household contacts of the new cases. Testing is underway
for household contacts, including repeat testing as needed for people previously
tested from the Mt Roskill church.8
s 9(2)(a)
s 9(2)(a)
s 9(2)(a)
s 9(2)(a)
s 9(2)(a)
s 9(2)(a)
s 9(2)(a)
s 9(2)(a) s 9(2)(a)

IN CONFIDENCE – NOT FOR DISTRIBUTION
6
o All contacts have been stood down. They are being tested 08 September
and are in isolation.8
o Developing and implementing a testing strategy which includes communication with
church leaders around the reason for testing and who should be tested.10
10. Contact tracing investigation and testing is ongoing for the Botany sub-cluster. This
sub-cluster includes the Botany case reported 28 August and four other cases reported
recently (one on 31 August and three on 01 September).11
11. Settings of interest for the Botany sub-cluster are being investigated, including casual
work places. More information to come when available.11
12. There is a sports club associated with the Mt Roskill Evangelical Church. To date there
are no known exposures confirmed at the sports club.12 It is being investigated as both
a possible exposure event and a possible source of the Mt Roskill Evangelical Church
sub-cluster.13 .
ARPHS advised on 31 August the sports club had been closed for the two weeks prior,
therefore none of the club members are being considered close contacts. ARPHS sent
comms to members regarding testing and to date no positive cases have been
reported.14 Surveillance testing is ongoing.12
Case investigation
13. Four cases that have been genomically linked to the main cluster are still being
investigated by ARPHS to identify their epidemiological link to the main cluster.
o The
o GP
o The second Mount Albert Grammar student
o The Botany case
14. Investigation into source attribution of the Botany cases infection is continuing. A
possible epidemiological link is being explored between the Botany case and previously
reported cases within another household. The symptom onset dates of the possible
epidemiological linked household are prior to the Botany cases’ symptom onset dates.
Further investigation is underway.11
15. The case in Tokoroa reported on 29 August is a contact of an existing case from
Tokoroa who is linked to the Auckland cluster.
and it is believed they had contact with the existing case
The centre has had a final deep clean and has reopened with reduced
staff and are completing most consultations virtually. Contact tracing is being
completed back to 20 August. This is a precautionary timeframe due to the case’s long
incubation period and radiological findings suggesting more advanced disease despite
11 NRHCC Morning Report 07 September 2020
12 NRHCC Morning Report 03 September 2020
13 NRHCC Morning Report 02 September 2020
14 ARPHS, Waikato DHB and MoH teleconference 1500 31 August 2020
s 9(2)(a)
s 9(2)(a)
s 9(2)(a)
s 9(2)(a)
s 9(2)(a)
s 9(2)(a)

IN CONFIDENCE – NOT FOR DISTRIBUTION
7
the 27 August symptom onset date. To date, all contacts tested have received negative
results. Day 12 testing so far have also all returned negative results (See table 4).

8
IN CONFIDENCE – NOT FOR DISTRIBUTION
1.
s 9(2)(a)
s 9(2)(a)

IN CONFIDENCE – NOT FOR DISTRIBUTION
9
15 NRHCC Email, 0900 09 September 2020
s 9(2)(a)

10
IN CONFIDENCE – NOT FOR DISTRIBUTION
ESR and wider testing16 16. A further 34 community cases are genomically linked with the Auckland cluster. These
cases are from the following known sub-clusters; Church 1 (6 cases), Church 2 (4 cases),
Church 3 (9 cases), Finance Now HH (1 case), Americold HH (3 cases), Botany (4 cases),
(4 cases) and (3 cases).17
17.
18. Work is underway to analyse how the whole genome sequencing can be used to tell us
how COVID-19 has been transmitted through the community cluster and to further
inform its management.
19. No direct links have been found between the community outbreak genome
sequencing, with the 67 genomes currently available from cases in managed isolation
facilities (MIFs).
20.
Contact tracing18 21. Between 31 August and 06 September 100% (45/45) of Community close contacts and
94% (85/90) MIQ close contacts have been contacted within 48 hours of being
determined to be a contact. KPI for this metric is 80% of close contacts within 48 hours.
o Notes: This metric does not include casual contacts.
Table 5: Close contact tracing recorded in the National Contact Tracing Solution since 11 August as at
0900 09 September 2020
06/09/2020 07/09/2020 08/09/2020 09/09/2020
Number of close contacts
identified1 3217 3224 3274 3346
16 ESR Whole Genome Sequencing Report 02 September 2020
17 ESR email update 0900 08 September 2020
18 COVID-19 NCCS Analytics and Reporting 0856 09 September 2020
s 9(2)(a) s 9(2)(a)
s 9(2)(g)(i)
s 9(2)(g)(i)

IN CONFIDENCE – NOT FOR DISTRIBUTION
11
Number of close contacts
successfully contacted (and are
self-isolating)
3187 3199 3228 3305
Number of close contacts
referred to "finding services"2 4 0 0 0
Number of close contacts
awaiting contact 26 25 46 41
1. Contacts loaded into the National Contact Tracing Solution, and managed by either the National Investigation and Tracing
Unit or the Public Health Units. Contacts from MIQ and overseas cases are not included in this report.
2. "Finding services" refers to the mechanism the National Close Contact Service uses to find valid contact details for close
contacts we do not have the correct contact details for. These services utilise internal Ministry of Health databases along with
Police, Customs and Airlines where relevant.
3. The total number and number successfully contacted can decrease due to duplicates and invalid records being removed from
the system.
COVID-19 Tracer App usage19 Figure 1: COVID-19 Tracer App cumulative registered users and daily scans/manual entries as at 1615
08 September 2020
1. The number of scans and manual entries on any given date is subject to change for up to 31 days. This is because there can be
a delay before anonymised analytic information is received (e.g. device not connected to internet when scan carried out).
2. The number of App registrations and QR codes for any given date is subject to change for up to 1 day. This is because due to
reporting timeframes these numbers may be extracted before the 12pm cut-off for the reporting period.
22. Key Numbers:
o 2,156,400 - Total registered users
o 1,997,361 - QR code scans between 1200 06 and 1200 07 September
19 Response Analyst – Digital Channels, 1617 08 September 2020
0
500,000
1,000,000
1,500,000
2,000,000
2,500,000
3,000,000
20
/05
23
/05
26
/05
29
/05
01
/06
04
/06
07
/06
10
/06
13
/06
16
/06
19
/06
22
/06
25
/06
28
/06
01
/07
04
/07
07
/07
10
/07
13
/07
16
/07
19
/07
22
/07
25
/07
28
/07
31
/07
03
/08
06
/08
09
/08
12
/08
15
/08
18
/08
21
/08
24
/08
27
/08
30
/08
02
/09
05
/09
08
/09
COVID TRACER APP USAGE
Cumulative App registrations Scans and manual entries

IN CONFIDENCE – NOT FOR DISTRIBUTION
12
Testing20 Table 6: Testing by functional groups, as at 0900 09 September 2020
*Numbers have been sourced from different data extracts in comparison to Table 7.
Laboratory testing numbers21 Table 7: Number of laboratory tests processed nationally as at 0900 08 September 2020
Testing supply update22
23. There are no issues with regent supplies, and hologic supplies are now in labs around
the country. There are 43 days of reagent stocks on hand nationally.
20 ÉCLAIR/MoH Public Health Intelligence, 1015 09 September 2020
21 Daily Lab Report, 0928 09 September 2020
22 Testing supply email, 1001 09 September 2020
Reason for test 08 September 02 – 08 September
GPs and other primary health 2342 20,255
CBACs and pop-ups 2918 25,344
Border workers - air crew 22 205
Border workers - airport staff 94 1267
Border workers - maritime crew 0 4
Border workers – Port of Tauranga staff 3 497
Border workers – Remaining Port staff 9 358
Border workers - MIF 56 1027
Border workers - MIQ 41 203
Travellers - Staying at MIF 363 1966
Travellers - Staying at MIQ 0 194
Total 5848 51,320*
Time period Number of laboratory tests
08 September 8,363
Last 7 days (02 Sep to 08 Sep) 53,957
Total 831,517

IN CONFIDENCE – NOT FOR DISTRIBUTION
13
Testing activity by region
Focus areas
24. As at 1700 08 September there are 28 Community testing Centres in the Metro
Auckland area. Three of these are closed CTC's for close contacts only.23
Healthline updates24 25. On 07 September there were 3,176 contacts in Healthline. Of those calls, 1,349 were to
the COVID-19 Info line. Demand on 1737 Need to talk? and other mental health services
was 596 contacts (in line with forecast).
26. Work continues to implement the revised testing strategy and how it relates to our
public facing advice – particularly the role we may play in supporting DHB’s around
local asymptomatic testing plans.
27. The main themes yesterday/today:
o Community concern and general anxiety following the announcement of the deaths
over 04 – 05 September.
o Symptomatic Service User’s wanting to be tested.
Logistics
Health Workforce25
28. Health Workforce have identified a small group of people on the surge workforce who
have indicated they would be willing to work in an ARC facility in the event of an
outbreak – this week we will work on whether this pool can be expanded and actions to
keep the group “warm” in the event ARC employers require them.
29. Upskilling of alternative workforces for testing continues to progress, including plans
for a training package and scoping of micro-credentialing, in addition to understanding
where this workforce would be obtained from. It is anticipated this training package will
be available within four weeks (estimated).
30. Health Workforce continue to work with TAS and all 20 GMsHR on workforce needs and
issues – regular workforce intelligence information will be provided to Health
Workforce, which will be incorporated into frequent dashboard reports.
23 Community Testing Centres report, 1800 08 September 2020
24 National Telehealth Service Coronavirus Update, 1014 08 September 2020
25 Health Workforce Directorate, 0832 01 September 2020

IN CONFIDENCE – NOT FOR DISTRIBUTION
14
Hospital capacity26 Table 8: Number and occupancy of hospital beds by type as at 0800 09 September 2020
Type Number of units Number (%) occupied/in use
ICU and HDU beds 354 214 (60.5%)
Ventilators 307 58 (18.9%)
Ward beds 7317 5862 (80.1%)
26 COVID-19 Hospital Summary, 0906 08 September 2020

15
IN CONFIDENCE – NOT FOR DISTRIBUTION
Appendix 1: Case summary
Table 9: All community cases reported between 0900 08 September and 0900 09 September
s 9(2)(a)

16
IN CONFIDENCE – NOT FOR DISTRIBUTION
Appendix 2: COVID-19 Provisional Disease Indicators, by date
of case notification18 Data for cases in the community
Indicator (as per Table 9832) Refined Indicator description Target 1-Sep 2-Sep 3 Sept ** 4-Sep 5 Sept ** 6 Sept ** 7 Sept **
1 - (S001) Time from exposure to contact isolation / quarantine
80% within 96 hours
0% *
(0/8) 100% - 100% - - -
2 – (S002) Time from case first symptom to contact isolation / quarantine
80% within 96 hours
0% *
(0/8) 86% - 100% - - -
3 – (S003) Time from test sample taken to close contact isolation / quarantine
80% within 72 hours
100% 100% 100% 100% - - -
4 – (C001) Time from first symptom to test sample taken for positive cases
80% within 48 hours
0% *
(0/1)
0% *
(0/2) - 33% 100% 50% -
5 – (L001) Time from test sample taken to notification of positive result
80% within 24 hours
100% 100% 0% *
(0/1) 25%
0% *
(0/1) 20% 75%
6 – (P002) Time from case notification to isolation / quarantine of contact
80% within 48 hours
100% 100% 100% 100% - 100% -
7 – (P001) Time from notification to case interview 80% within 24 hours
100% 100% 100% 100% 100% 100% 100%
8 – (P003) Time from close contact identification to isolated / quarantined
80% within 24 hours
22% 100% 100% 100% - 100% 71%
10 – (P004) Proportion of contacts traced in 48 hours 80% within 48 hours
100% 100% 100% 100% - 100% -
C – (S005) Proportion of close contacts with confirmed or suspected COVID-19 at the time of tracing <20% 0% 0% 0% 0% - 0% 15%
Note: • * The numerator and denominator are provided in some instances to provide context for low percentages.
• **Data is not available for metrics where there is no data that meets the definition, or where the time/days to reach target has not fully elapsed
• The value of P002 can drop due to the addition of new close contacts to exposure events after the 48-hour period since case notification had elapsed. This can happen for a number of reasons, including a case recalling further details following the original case interview.
• These metrics report all cases during the specified period, including those in Managed Isolation and Quarantine, and do not include casual contacts.
• There are three additional indicators under development requiring both technical and clinical input to define data requirements. These are due to be completed by end October 2020.

IN CONFIDENCE – NOT FOR DISTRIBUTION
17
Data for cases in Managed Isolation and Quarantine, International, and Unknown
Indicator (as per Table 9832) Refined Indicator description Target 1-Sep 2-Sep** 3 Sept 4-Sep** 5 Sept ** 6 Sept ** 7 Sept **
1 - (S001) Time from exposure to contact isolation / quarantine
80% within 96 hours
0% * (0/2)
- 100% - - - -
2 – (S002) Time from case first symptom to contact isolation / quarantine
80% within 96 hours
100% - 0% * (0/3)
- - - -
3 – (S003) Time from test sample taken to close contact isolation / quarantine
80% within 72 hours
100% 71% 100% 40% - - -
4 – (C001) Time from first symptom to test sample taken for positive cases
80% within 48 hours
0% * (0/2)
- 0% * (0/1)
- - - -
5 – (L001) Time from test sample taken to notification of positive result
80% within 24 hours
0% * (0/1)
100% 100% 100% - 0% * (0/2)
100%
6 – (P002) Time from case notification to isolation / quarantine of contact
80% within 48 hours
100% 71% 100% 40% - 100% -
7 – (P001) Time from notification to case interview 80% within 24 hours
100% 100% 100% 100% - 100% 100%
8 – (P003) Time from close contact identification to isolated / quarantined
80% within 24 hours
100% 71% 100% 40% - 100% -
10 – (P004) Proportion of contacts traced in 48 hours 80% within 48 hours
100% 71% 100% 40% - 100% -
C – (S005) Proportion of close contacts with confirmed or suspected COVID-19 at the time of tracing
<20% 0% 0% 67% 0% - 0% -
Note:
• * The numerator and denominator are provided in some instances to provide context for low percentages.
• **Data is not available for metrics where there is no data that meets the definition, or where the time/days to reach target has not fully elapsed
• The value of P002 can drop due to the addition of new close contacts to exposure events after the 48-hour period since case notification had elapsed. This can happen for a number of reasons, including a case recalling further details following the original case interview.
• These metrics report all cases during the specified period, including those in Managed Isolation and Quarantine, and do not include casual contacts.
• There are three additional indicators under development requiring both technical and clinical input to define data requirements. These are due to be completed by end October 2020.

18
IN CONFIDENCE – NOT FOR DISTRIBUTION
APPENDIX: 3
NRHCC Testing Report
Novel Coronavirus (COVID-19)
Issued: 1700 08 September 2020
Table 1. Metro Auckland Summary Total of Testing for 08 September 2020
Community MIQ
staff
MIQ
guests
Airport Maritime port TOTAL
5:00pm 1016 75 608 68 10 1777
Table 2. Totals tests receipted from 12 August 2020, by ethnicity (as at 5pm)
*Swab taken in last 24 hours taken between midnight and midnight, may have been receipted and
reported later than this; tests only included if coded and received and acknowledged by lab, result
not required
*Includes GP clinics, Urgent Care Centres, Designated practices
Table 3. Estimated tests taken since 12 August 2020, based on manual site reports at 5pm
Site 12/08-16/08 17/08-
23/08
24/08 –
30/08
31/08 –
06/09
07/09 08/09*
MIQ Staff 2132 659 1488 912 88 75
Guests 2972 3767 3600 3406 483 608
Border Airport 2129 933 1349 1158 153 68
Port 1588 678 161 392 19 10
* 08/09 day still in progress
Tests Last 24 hours Total since 12/8*
Ethnicity CTC
Non-
CTC
Total
% Tests %
Asian 245 317 562 15.9% 33,057 17.6%
Maori 228 295 523 14.8% 27,135 14.4%
Other 581 840 1421 40.2% 79,484 42.3%
Pacific 459 432 891 25.2% 44,325 23.6%
Unknown 13 129 142 4.0% 4005 2.1%
Total 1526 2013 3539 188,006

IN CONFIDENCE – NOT FOR DISTRIBUTION
19
Table 4: Estimated tests taken at Metro Auckland CTCs, since 12 August 2020, based on
manual site reports at 4pm
Site 12/08-
16/08 (days
open)
17/08-
23/08
(days
open)
24/08 –
30/08
(days
open)
31/08 –
06/09
07/09 08/09*
Airport Oaks 1148 (4) 515 (7) 366 (7) 265 (7) 39 27
Auckland Netball
Centre
192 (1) 1065 (7) 884 (7) 640 (7) 134 N/A
Botany CTC 1151 (5) 948 (7) 905 (7) 749 (7) 145 113
Coast to Coast
Warkworth
334 (5) 109 (7) 70 (7) 35 (7) 17 N/A
Coast to Coast
Wellsford
203 (5) 114 (7) 116 (7) 81 (7) 15 N/A
Eventfinda Stadium 1800 (5) 527 (7) 517 (7) N/A N/A N/A
Health New Lynn 2603 (5) 1258 (7) 1703 (7) 732 (7) 129 58
Henderson 940 (4) 645 (7) 634 (7) 351 (5) N/A N/A
Mangere Town
Centre
1748 (3) 1684 (7) 1599 (7) 860 (7) 144 76
Manurewa Marae N/A 124 (4) 268 (6) 110 (2) N/A N/A
Northcare A&M 253 (2) 463 (7) 527 (7) 741 (7) 57 N/A
Otara CTC 3221 (5) 1712 (7) 1429 (7) 930 (7) 126 100
Pukekohe CTC N/A 131 (4) 226 (6) 298 (6) N/A N/A
St Lukes 1368 (5) 1045 (7) 1414 (7) 797 (7) 99 95
Takanini Urgent Care 1886 (5) 1216 (7) 1153 (7) 684 (7) 92 73
Waiheke Medical
Centre
312 (5) 145 (7) 220 (7) 98 (7) 13 N/A
Whanau House 2502 (5) 1371 (7) 1442 (7) 928 (7) 261 117
Whanau Ora - Central 1957 (5) 964 (7) 1583 (7) 937 (7) 142 104
Whanau Ora - North 1442 (5) 669 (7) 637 (7) 982 (7) 139 101
Whanau Ora - South 2945 (5) 1250 (7) 718 (7) 677 (7) 103 60
Point England Pop
Up
N/A N/A 88 (3) N/A N/A N/A
Randwick Park Pop
Up
N/A N/A 303 (5) N/A N/A N/A

IN CONFIDENCE – NOT FOR DISTRIBUTION
20
Ranui Pop Up N/A N/A 409 (5) N/A N/A N/A
Mt Smart Stadium
Pop Up
N/A N/A 219 (3) N/A N/A N/A
Massey Pop Up N/A N/A 787 (5) N/A N/A N/A
South Kaipara Pop
Up
N/A N/A 170 (4) N/A N/A N/A
Clendon Pop Up N/A N/A 368 (3) N/A N/A No data
Mangere Pop Up N/A N/A 472 (2) N/A N/A N/A
Mangere East Pop Up N/A N/A 109 (2) N/A N/A N/A
Otara Pop Up N/A N/A 59 (2) N/A N/A N/A
Otahuhu Pop Up N/A N/A 201 (2) N/A N/A N/A
Mt Roskill Pop Up
(330 start)
N/A N/A 217 (2) 164 (3) N/A N/A
Sandringham Pop Up N/A N/A N/A 189 (3) N/A N/A
Ranui League Club
Pop Up
N/A N/A N/A 172 (3) N/A N/A
Glen Eden Pop Up N/A N/A N/A 127 (4) N/A N/A
Southmall Pop Up N/A N/A N/A 291 (3) N/A N/A
Orakei Pop Up N/A N/A N/A 118 (3) N/A N/A
Papatoetoe Pop Up N/A N/A N/A 74 (3) N/A N/A
Te Atatu Pop Up N/A N/A N/A 65 (3) N/A N/A
Mangere East Marae
Pop Up
N/A N/A N/A No Data N/A N/A
Mangere Leagues
Club
N/A N/A N/A No Data N/A N/A
Tamaki College Pop
Up
N/A N/A N/A 109 (2) N/A N/A
Papatoetoe EFKS Pop
Up
N/A N/A N/A 74 (1) N/A N/A
Botany Town Centre
Pop Up
N/A N/A N/A 121 (2) N/A N/A
Sylvia Park Pop Up N/A N/A N/A 21 (2) N/A N/A
East Tamaki Pop Up N/A N/A N/A 161 (1) N/A N/A
Rowandale Pop Up N/A N/A N/A 41 (1) N/A N/A
Henderson EFKS Pop
Up
N/A N/A N/A N/A 43 40

IN CONFIDENCE – NOT FOR DISTRIBUTION
21
Mangere Central
Community Hall Pop
Up
N/A N/A N/A N/A N/A 12
Waipuna Targeted
Site
143 (2) 549 (7) 376 (7) 219 (7) 44 34
Blockhouse Bay
Targeted Site
N/A 277 (7) 921 (7) 161 (5) N/A N/A
Henderson Targeted
Site
N/A N/A N/A N/A 6 6
Total 26,148 16,781 21,215 13,002 1631 1016 * 08/09 day still in progress N/A = not open as a CTC

IN CONFIDENCE – NOT FOR DISTRIBUTION
22
Appendix 4: Testing by DHB and ethnicity The tables that follow are the number of people tested. The numbers in the laboratory testing
section are the number of laboratory tests processed.
Table 10: Number of people tested for COVID-19 from 12 August to 09 September
Prioritised Ethnicity MPAO
DHB of Domicile Māori Pacific Asian Other Unknown Total
Auckland 3168 6522 8358 18139 319 36506
Bay of Plenty 2351 262 508 5892 55 9068
Canterbury 1480 582 1504 12406 180 16152
Capital and Coast 1321 992 1157 8216 175 11861
Counties Manukau 6658 18481 8072 11516 397 45124
Hawkes Bay 1250 257 189 3237 48 4981
Hutt Valley 697 395 477 2769 37 4375
Lakes 2187 283 436 2981 82 5969
MidCentral 924 240 321 3675 74 5234
Nelson Marlborough 543 141 240 3884 50 4858
Northland 2808 193 235 3728 38 7002
South Canterbury 132 32 72 1568 14 1818
Southern 974 308 611 8734 73 10700
Tairāwhiti 783 51 54 714 17 1619
Taranaki 637 59 142 2392 41 3271
Waikato 4000 947 1273 9177 194 15591
Wairarapa 205 35 32 926 7 1205
Waitematā 4102 4301 6676 22007 274 37360
West Coast 44 8 13 298 6 369
Whanganui 598 68 58 1336 14 2074
Unknown 1315 639 613 3734 1404 7705
Total 36177 34796 31041 127330 3499 232843

23
IN CONFIDENCE – NOT FOR DISTRIBUTION
Table 11: Rate per 1000 people tested for COVID-19 from 12 August to 09 September
Prioritised Ethnicity MPAO
DHB of Domicile Māori Pacific Asian Other Total
Auckland 72.8 116.3 44.7 69.4 66.6
Bay of Plenty 39.3 58.9 25.9 37.4 37.6
Canterbury 28.2 41 24.7 27.8 28.2
Capital and Coast 36.2 44.7 23 38.6 36.9
Counties Manukau 74.8 153.9 53.4 55 79.2
Hawkes Bay 28.9 40 20.6 30 29.8
Hutt Valley 26.7 33.8 25.4 29.4 29
Lakes 56.8 110.8 44.8 49.7 53.9
MidCentral 25.4 43.3 20.7 29.7 28.9
Nelson Marlborough 33.8 57.1 32.3 30.9 32
Northland 46.1 51.3 28.4 34.2 38.5
South Canterbury 24.9 65.5 30.4 30.4 30.4
Southern 29 44.7 23.7 32.6 32.1
Tairāwhiti 31.6 45.6 46.3 32.3 32.9
Taranaki 27.3 42.4 22.8 26.6 27.1
Waikato 41.5 71 28.8 34.1 36.9
Wairarapa 25.7 42.1 25.7 26 26.3
Waitematā 65.5 96.4 46.4 57.6 59
West Coast 11.3 31.7 14.1 11 11.5
Whanganui 34.4 44.7 19.8 31 32
Total 46.5 108.8 40.5 41.1 46.9

1
IN CONFIDENCE – NOT FOR DISTRIBUTION
SITREP 048
Coronavirus disease 2019 (COVID-19)
Issued: 1030 hours 10 September 2020
Information current at: 1000 hours
This report provides a daily update on the COVID-19 health system response. New information is denoted by red text.
Please use the single point of contact email [email protected] for help/support. Your email will be
logged and promptly passed to the appropriate team.
This document is classified IN CONFIDENCE and not for further distribution.
Need to know
COMMUNITY CASES
NEW LAST 24 hrs
2
MIQ CASES
NEW LAST 24 hrs
2
COMMUNITY CASES
TOTAL RECOVERED
92
104
COMMUNITY CASES
ACTIVE
81 TOTAL CASES SINCE 11 AUG
175
39
TOTAL CASES SINCE 9 JUN
143
TOTAL ACTIVE CASES IN NZ (COMMUNITY & MIQ): 120
MIQ CASES
TOTAL RECOVERED
MIQ CASES
ACTIVE
LABORATORY TESTS
09 September
7,950
LABORATORY TESTS
03 to 09 Sep
51,386
LABORATORY TESTS
TOTAL
839,467
CASES DECEASED
2

IN CONFIDENCE – NOT FOR DISTRIBUTION
2
Total COVID-19 cases
Table 1: Total number of COVID-19 cases as at 0900 10 September 2020
Case Status Active Recovered Deceased Total
Confirmed 120* (-5) 1302 (+9) 19 1441 (+4)
Probable 0 346 5 351
Total 120* (-5) 1648 (+9) 24 1792 (+4)
*Net increase of 4 cases, with 9 cases classified as recovered.
Total community cases since 11 August
Table 2: Community cases by DHB and case status as at 0900 10 September 20201
New community cases since 0900 09 September 2020
1. Two new community cases have been reported, as at 0900 10 September.
o Both cases have epidemiological links to existing cases and are associated with the
Mt Roskill Evangelical Church sub-cluster. (See 8). Both cases are associated with the
bereavement events.
Community cases linked to the Auckland Community Cluster August 2020
2. 173 of the 175 community cases have been linked to the Auckland Community Cluster
August 2020, as at 0900 10 September. The unlinked cases are summarised as follows:
o The Rydges employee (this investigation has been closed).
o A case (reported 21 August) is still under investigation for an epidemiological link to
the community cluster and there is insufficient data to confirm a genomic link to the
community cluster (see 3).
Community cases under investigation to determine a link to the Auckland community
cluster
3. The case under investigation is summarised as follows:
o One case (reported 21 August) came through the border on 18 June. The case tested
negative at Day 3 and Day 12 of quarantine. Subsequently the case tested positive on
21 August after being swabbed at a mobile testing clinic in Auckland. Despite using
1 EpiSurv Database, 0900 10 September 2020
Case
Status
Counties Manukau Waitematā Auckland Waikato Total
Confirmed 76 (+1) 52 (+1) 45 1 174 (+2)
Probable 1 0 0 0 1
Total 77 (+1) 52 (+1) 45 1 175 (+2)

IN CONFIDENCE – NOT FOR DISTRIBUTION
3
two different whole genome sequencing protocols only a partial genome was
obtained. There is insufficient data to confirm the case is genomically linked to the
community cluster.2 Their epidemiological link to the community cluster is still under
investigation.
Community cases and household contacts at Jet Park
4. As at 0800 10 September there are 72 people isolating in Jet Park from the community.
56 are confirmed cases, the remaining 16 are household contacts. This number will
fluctuate as people finish their isolation and depart from the facility.3
MIQ cases since 0900 09 September 2020
5. There have been two new cases4 detected at the border, as at 0900 10 September. In
total 143 cases have been detected at the border since the establishment of
MIFs/MIQs.
o One case returned from India via Fiji on 27 August 2020.
o One case still awaiting further information.
Cases in hospital
6. As at 0800 10 September there are three cases in hospital with COVID-19.5
o One patient on ward at North Shore Hospital.
o
o One patient in Waikato Hospital in ICU.
Table 3: Number of cases in hospital with COVID-19 by DHB as at 0800 10 September 2020
2 ESR WGS report 03 September 2020
3 NRHCC Morning Report, 0900 10 September 2020
4 EpiSurv database, 0900 10 September 2020
5 NRHCC Morning Report 08 September 2020 and COVID-19 Hospital Summary, 0900 08 September 2020
DHB Hospital Number in a general ward Number in ICU/HDU
Counties Manukau Middlemore 0 0
Waitematā North Shore 1 1
Waikato Waikato 0 1
Total - 1 2
s 9(2)(a)

IN CONFIDENCE – NOT FOR DISTRIBUTION
4
Health system response
Overall approach
7. Our investigation has two main focus areas that run in parallel:
o Source attribution – a focus on investigating the case with the earliest symptom
onset date to gather details actions of movements 14 days prior. This will help to
understand the possible source of the new outbreak.
o Containment – rigorous case investigation, identification of close contacts and
isolation and testing to ensure that chain of transmission is broken.
Overview6
o The recent rate of increase in new cases observed during the last report has stabilised.
There are currently two sub-clusters in which most new community cases are linked to
(Mount Roskill Evangelical Church and Botany sub-cluster). There are currently 43
confirmed cases in the Mount Roskill Evangelical Church sub-cluster and 5 confirmed
cases in the Botany sub-cluster.
Current outbreak investigation priorities7
o Contact tracing and containment around Mount Roskill Evangelical Church sub-cluster
and more recent bereavement events.
o Contact tracing and containment around Botany sub-cluster.
o Clarify whether June border case is a new infection and clarify strain.
o Seek to identify epidemiological link for index case in Mount Roskill Evangelical Church
sub-cluster.
Sub-clusters and settings of interest
8. On 07 September, a new sub-cluster and exposure event was identified within Mt
Roskill, with an epidemiological link to Mt Roskill Evangelical Church.8 A death (not
COVID-19 related) Between 24 August and 02 September, there
were multiple gatherings associated with the bereavement, the investigation is
ongoing. There is good engagement with the church leadership who are assisting with
the investigation.9
48 people attended the funeral on . All 48 close contacts from the funeral
have been identified, with 43 tested. Eight have tested positive, 27 have tested negative
and eight are pending.
6 ARPHS Strategic Report 09 September 2020
7 ARPHS Strategic Report 31 August 2020
8 ARPHS, Waikato DHB and MoH teleconference 0830 08 September 2020
9 NRHCC Morning report, 0900 10 September 2020
s 9(2)(a)
s 9(2)(a)

IN CONFIDENCE – NOT FOR DISTRIBUTION
5
A new setting of interest is St Dominic’s College in Henderson, Auckland. A confirmed
case attended the school.10
The school has been informed and communications
have been sent. The case is linked to new sub-cluster associated with the bereavement
events. A list of all contacts has been gathered by the school. Testing of all school
students and staff is being completed.
ARPHS actions:10
o Maintain positive relationships with Church leaders and liaise with Church members
about their need for financial and welfare support if asked to isolate.
o Scoping new cases.
o Quarantine and testing of household contacts of the new cases. Testing is underway
for household contacts, including repeat testing as needed for people previously
tested from the Mt Roskill church.
o All contacts have been stood down. They are being tested 08 September
and are in isolation.
o Developing and implementing a testing strategy which includes communication with
church leaders around the reason for testing and who should be tested.
9. Contact tracing investigation and testing is ongoing for the Botany sub-cluster.
10. Investigation of settings of interest for the Botany sub-cluster, including casual work
places. More information to come when available.
Case investigation
11. Four cases that have been genomically linked to the main cluster are still being
investigated by ARPHS to identify their epidemiological link to the main cluster.
o The
o GP
o The second Mount Albert Grammar student
o The Botany case
12. Investigation into source attribution of the Botany cases infection is continuing. A
possible epidemiological link is being explored between the Botany case and previously
reported cases within another household. The symptom onset dates of the possible
epidemiological linked household are prior to the Botany cases’ symptom onset dates.
Further investigation is underway.10
13. The case in Tokoroa reported on 29 August is a contact of an existing case from
Tokoroa who is linked to the Auckland cluster. The case works at a medical centre in
Tokoroa and it is believed they had contact with the existing case
The centre has had a final deep clean and has reopened with reduced
staff and are completing most consultations virtually. Contact tracing is being
completed back to 20 August. This is a precautionary timeframe due to the case’s long
10 ARPHS, Waikato DHB and MoH teleconference 0830 08 September 2020
s 9(2)(a)
s 9(2)(a)
s 9(2)(a)
s 9(2)(a)
s 9(2)(a)

IN CONFIDENCE – NOT FOR DISTRIBUTION
6
incubation period and radiological findings suggesting more advanced disease despite
the 27 August symptom onset date. To date, all contacts tested have received negative
results. Day 12 testing so far have also all returned negative results (See table 4)

1
IN CONFIDENCE – NOT FOR DISTRIBUTION
s 9(2)(a)
s 9(2)(a)
s 9(2)(a)
s 9(2)(a)

2
IN CONFIDENCE – NOT FOR DISTRIBUTION
ESR and wider testing11 14. A further 34 community cases are genomically linked with the Auckland cluster. These
cases are from the following known sub-clusters; Church 1 (6 cases), Church 2 (4 cases),
Church 3 (9 cases), Finance Now HH (1 case), Americold HH (3 cases), Botany (4 cases),
(4 cases) and (3 cases).12
15.
16. Work is underway to analyse how the whole genome sequencing can be used to tell us
how COVID-19 has been transmitted through the community cluster and to further
inform its management.
17. No direct links have been found between the community outbreak genome
sequencing, with the 67 genomes currently available from cases in managed isolation
facilities (MIFs).
18.
11 ESR Whole Genome Sequencing Report 02 September 2020
12 ESR email update 0900 08 September 2020
s 9(2)(a) s 9(2)(a)
s 9(2)(g)(i)
s 9(2)(g)(i)

IN CONFIDENCE – NOT FOR DISTRIBUTION
3
Contact tracing13 19. Between 01 and 07 September 100% (136/136) of Community close contacts and 87%
(33/38) MIQ close contacts have been contacted within 48 hours of being determined
to be a contact. KPI for this metric is 80% of close contacts within 48 hours.
o Notes: This metric does not include casual contacts.
Table 5: Close contact tracing recorded in the National Contact Tracing Solution since 11 August as at
0900 10 September 2020
07/09/2020 08/09/2020 09/09/2020 10/09/2020
Number of close contacts
identified1 3224 3274 3346 3372
Number of close contacts
successfully contacted (and are
self-isolating)
3199 3228 3305 3354
Number of close contacts
referred to "finding services"2 0 0 0 0
Number of close contacts
awaiting contact 25 46 41 18
1. Contacts loaded into the National Contact Tracing Solution, and managed by either the National Investigation and Tracing
Unit or the Public Health Units. Contacts from MIQ and overseas cases are not included in this report.
2. "Finding services" refers to the mechanism the National Close Contact Service uses to find valid contact details for close
contacts we do not have the correct contact details for. These services utilise internal Ministry of Health databases along with
Police, Customs and Airlines where relevant.
3. The total number and number successfully contacted can decrease due to duplicates and invalid records being removed from
the system.
13 COVID-19 NCCS Analytics and Reporting 0956 10 September 2020

IN CONFIDENCE – NOT FOR DISTRIBUTION
4
COVID-19 Tracer App usage14 Figure 1: COVID-19 Tracer App cumulative registered users and daily scans/manual entries as at 1615
09 September 2020
1. The number of scans and manual entries on any given date is subject to change for up to 31 days. This is because there can be
a delay before anonymised analytic information is received (e.g. device not connected to internet when scan carried out).
2. The number of App registrations and QR codes for any given date is subject to change for up to 1 day. This is because due to
reporting timeframes these numbers may be extracted before the 12pm cut-off for the reporting period.
20. Key Numbers:
o 2,166,800 - Total registered users
o 2,036,940 - QR code scans between 1200 07 and 1200 08 September
Testing15 Table 6: Testing by functional groups, as at 0900 10 September 2020
14 Response Analyst – Digital Channels, 1617 08 September 2020
15 ÉCLAIR/MoH Public Health Intelligence, 1015 09 September 2020
0
500,000
1,000,000
1,500,000
2,000,000
2,500,000
3,000,000
20
/05
23
/05
26
/05
29
/05
01
/06
04
/06
07
/06
10
/06
13
/06
16
/06
19
/06
22
/06
25
/06
28
/06
01
/07
04
/07
07
/07
10
/07
13
/07
16
/07
19
/07
22
/07
25
/07
28
/07
31
/07
03
/08
06
/08
09
/08
12
/08
15
/08
18
/08
21
/08
24
/08
27
/08
30
/08
02
/09
05
/09
08
/09
COVID TRACER APP USAGE
Cumulative App registrations Scans and manual entries
Reason for test 09 September 03 – 09 September
GPs and other primary health 3768 20842
CBACs and pop-ups 3191 24779
Border workers - air crew 54 237
Border workers - airport staff 140 1259

IN CONFIDENCE – NOT FOR DISTRIBUTION
5
*Numbers have been sourced from different data extracts in comparison to Table 7.
Laboratory testing numbers16 Table 7: Number of laboratory tests processed nationally as at 0900 10 September 2020
Testing supply update17
21. There are no issues with regent supplies, and hologic supplies are now in labs around
the country. There are 43 days of reagent stocks on hand nationally.
Testing activity by region
Focus areas
22. As at 1700 08 September there are 28 Community testing Centres in the Metro
Auckland area. Three of these are closed CTC's for close contacts only.18
Healthline updates19 23. On 09 September there were 2529 contacts in Healthline. Of those calls, 1421 were to
the COVID-19 Info line. Demand on 1737 Need to talk? and other mental health services
was 719 contacts (slightly above forecast).
16 Daily Lab Report, 0928 09 September 2020
17 Testing supply email, 1001 09 September 2020
18 Community Testing Centres report, 1800 08 September 2020
19 National Telehealth Service Coronavirus Update, 0929 10 September 2020
Border workers - maritime crew 0 39
Border workers – Port of Tauranga staff 0 364
Border workers – Remaining Port staff 30 329
Border workers - MIF 132 1290
Border workers - MIQ 47 301
Travellers - Staying at MIF 587 2174
Travellers - Staying at MIQ 1 123
Total 7950 51737*
Time period Number of laboratory tests
09 September 7,950
Last 7 days (03 Sep to 09 Sep) 51,386
Total 839,467

IN CONFIDENCE – NOT FOR DISTRIBUTION
6
24. Work continues to implement the revised testing strategy and how it relates to our
public facing advice – particularly the role we may play in supporting DHB’s around
local asymptomatic testing plans.
25. The main themes yesterday/today:
o Most of the callers are calling because they are symptomatic and want to get a test,
o Calls relating to the latest exposure events,
o Confusion around Alert Level rules (i.e. crowd sizes in Auckland, around the rest of
the country etc) it is recommended to reemphasise this given recent media
confusion.
Logistics
Health Workforce20
26. Health Workforce have identified a small group of people on the surge workforce who
have indicated they would be willing to work in an ARC facility in the event of an
outbreak – this week we will work on whether this pool can be expanded and actions to
keep the group “warm” in the event ARC employers require them.
27. Upskilling of alternative workforces for testing continues to progress, including plans
for a training package and scoping of micro-credentialing, in addition to understanding
where this workforce would be obtained from. It is anticipated this training package will
be available within four weeks (estimated).
28. Health Workforce continue to work with TAS and all 20 GMsHR on workforce needs and
issues – regular workforce intelligence information will be provided to Health
Workforce, which will be incorporated into frequent dashboard reports.
Hospital capacity21 Table 8: Number and occupancy of hospital beds by type as at 0800 10 September 2020
Type Number of units Number (%) occupied/in use
ICU and HDU beds 347 218 (62.8%)
Ventilators 302 54 (17.9%)
Ward beds 7109 5711 (80.3%)
20 Health Workforce Directorate, 0832 01 September 2020
21 COVID-19 Hospital Summary, 0909 10 September 2020

7
IN CONFIDENCE – NOT FOR DISTRIBUTION
Appendix 1: Case summary
Table 9: All community cases reported between 0900 09 September and 0900 10 September
s 9(2)(a)

8
IN CONFIDENCE – NOT FOR DISTRIBUTION
Appendix 2: COVID-19 Provisional Disease Indicators, by date
of case notification13 Data for cases in the community
Indicator (as per Table 9832) Refined Indicator description Target 2-Sep 3-Sep 4-Sep 5 Sept ** 6 Sept ** 7 Sept ** 8 Sept **
1 - (S001) Time from exposure to contact isolation / quarantine
80% within 96 hours
100% 100% 100% - - - -
2 – (S002) Time from case first symptom to contact isolation / quarantine
80% within 96 hours
86% 100% 100% - - - -
3 – (S003) Time from test sample taken to close contact isolation / quarantine
80% within 72 hours
100% 100% 100% - 100% - -
4 – (C001) Time from first symptom to test sample taken for positive cases
80% within 48 hours
0% *
(0/2) 100% 33% 100% 50% 50% -
5 – (L001) Time from test sample taken to notification of positive result
80% within 24 hours
100% 0% *
(0/1) 25%
0% *
(0/1) 20% 75% 80%
6 – (P002) Time from case notification to isolation / quarantine of contact
80% within 48 hours
100% 100% 100% - 100% 100% -
7 – (P001) Time from notification to case interview 80% within 24 hours
100% 100% 100% 100% 100% 100% 100%
8 – (P003) Time from close contact identification to isolated / quarantined
80% within 24 hours
100% 100% 100% - 100% 97% 100%
10 – (P004) Proportion of contacts traced in 48 hours 80% within 48 hours
100% 100% 100% - 100% 100% -
C – (S005) Proportion of close contacts with confirmed or suspected COVID-19 at the time of tracing
<20% 0% 0% 0% - 0% 5% 0%
Note: • * The numerator and denominator are provided in some instances to provide context for low percentages.
• **Data is not available for metrics where there is no data that meets the definition, or where the time/days to reach target has not fully elapsed

IN CONFIDENCE – NOT FOR DISTRIBUTION
9
• The value of P002 can drop due to the addition of new close contacts to exposure events after the 48-hour period since case notification had elapsed. This can happen for a number of reasons, including a case recalling further details following the original case interview.
• These metrics report all cases during the specified period, including those in Managed Isolation and Quarantine, and do not include casual contacts.
• There are three additional indicators under development requiring both technical and clinical input to define data requirements. These are due to be completed by end October 2020.
Data for cases in Managed Isolation and Quarantine, International, and Unknown
Indicator (as per Table 9832) Refined Indicator description Target 2-Sep ** 3-Sep 4-Sep ** 5 Sept ** 6 Sept ** 7 Sept ** 8 Sept **
1 - (S001) Time from exposure to contact isolation / quarantine
80% within 96 hours
- 100% - - - - -
2 – (S002) Time from case first symptom to contact isolation / quarantine
80% within 96 hours
- 0% - - - - -
3 – (S003) Time from test sample taken to close contact isolation / quarantine
80% within 72 hours
71% 100% 40% - 100% - -
4 – (C001) Time from first symptom to test sample taken for positive cases
80% within 48 hours
- 0% * (0/1)
- - - - -
5 – (L001) Time from test sample taken to notification of positive result
80% within 24 hours
100% 100% 100% - 0% * (0/2)
100% -
6 – (P002) Time from case notification to isolation / quarantine of contact
80% within 48 hours
71% 100% 40% - 100% 100% -
7 – (P001) Time from notification to case interview 80% within 24 hours
100% 100% 100% 0% * (0/1)
100% 100% -
8 – (P003) Time from close contact identification to isolated / quarantined
80% within 24 hours
71% 100% 40% - 100% 100% -
10 – (P004) Proportion of contacts traced in 48 hours 80% within 48 hours
71% 100% 40% - 100% 100% -
C – (S005) Proportion of close contacts with confirmed or suspected COVID-19 at the time of tracing
<20% 0% 67% 0% - 0% 0% -
Note:
• * The numerator and denominator are provided in some instances to provide context for low percentages.
• **Data is not available for metrics where there is no data that meets the definition, or where the time/days to reach target has not fully elapsed
• The value of P002 can drop due to the addition of new close contacts to exposure events after the 48-hour period since case notification had elapsed. This can happen for a number of reasons, including a case recalling further details following the original case interview.
• These metrics report all cases during the specified period, including those in Managed Isolation and Quarantine, and do not include casual contacts.
• There are three additional indicators under development requiring both technical and clinical input to define data requirements. These are due to be completed by end October 2020.

10
IN CONFIDENCE – NOT FOR DISTRIBUTION
APPENDIX: 3
NRHCC Testing Report
Novel Coronavirus (COVID-19)
Issued: 1700 09 September 2020
Table 1. Metro Auckland Summary Total of Testing for 09 September 2020
Community MIQ
staff
MIQ
guests
Airport Maritime port TOTAL
5:00pm 1939 173 345 154 39 2650
Table 2. Totals tests receipted from 12 August 2020, by ethnicity (as at 5pm)
*Swab taken in last 24 hours taken between midnight and midnight, may have been receipted and
reported later than this; tests only included if coded and received and acknowledged by lab, result
not required
*Includes GP clinics, Urgent Care Centres, Designated practices
Table 3. Estimated tests taken since 12 August 2020, based on manual site reports at 5pm
Site 12/08-
16/08
17/08-
23/08
24/08 –
30/08
31/08 –
06/09
07/09 08/09 09/09*
MIQ Staff 2132 659 1488 912 88 75 173
Guests 2972 3767 3600 3406 483 609 345
Border Airport 2129 933 1349 1158 153 68 154
Port 1588 678 161 392 19 15 39
* 09/09 day still in progress
Tests Last 24 hours Total since 12/8*
Ethnicity CTC
Non-
CTC
Total
% Tests %
Asian 81 448 529 17.2% 33,847 17.6%
Maori 111 361 472 15.4% 27,757 14.4%
Other 270 939 1209 39.3% 81,439 42.3%
Pacific 108 538 646 21.0% 45,187 23.5%
Unknown 19 198 217 7.1% 4231 2.2%
Total 589 2484 3073 192,461

IN CONFIDENCE – NOT FOR DISTRIBUTION
11
Table 4: Estimated tests taken at Metro Auckland CTCs, since 12 August 2020, based on
manual site reports at 4pm
Site 12/08-
16/08
(days
open)
17/08-
23/08
(days
open)
24/08 –
30/08
(days
open)
31/08 –
06/09
07/09 08/09 09/09*
Airport Oaks 1148 (4) 515 (7) 366 (7) 265 (7) 39 27 39
Auckland Netball
Centre
192 (1) 1065 (7) 884 (7) 640 (7) 134 N/A N/A
Botany CTC 1151 (5) 948 (7) 905 (7) 749 (7) 145 113 107
Coast to Coast
Warkworth
334 (5) 109 (7) 70 (7) 35 (7) 17 N/A N/A
Coast to Coast
Wellsford
203 (5) 114 (7) 116 (7) 81 (7) 15 N/A N/A
Eventfinda
Stadium
1800 (5) 527 (7) 517 (7) N/A N/A N/A N/A
Health New Lynn 2603 (5) 1258 (7) 1703 (7) 732 (7) 129 58 196
Henderson 940 (4) 645 (7) 634 (7) 351 (5) N/A N/A N/A
Mangere Town
Centre
1748 (3) 1684 (7) 1599 (7) 860 (7) 144 76 107
Manurewa Marae N/A 124 (4) 268 (6) 110 (2) N/A N/A N/A
Northcare A&M 253 (2) 463 (7) 527 (7) 741 (7) 57 N/A N/A
Otara CTC 3221 (5) 1712 (7) 1429 (7) 930 (7) 126 100 93
Pukekohe CTC N/A 131 (4) 226 (6) 298 (6) N/A N/A N/A
St Lukes 1368 (5) 1045 (7) 1414 (7) 797 (7) 99 95 117
Takanini Urgent
Care
1886 (5) 1216 (7) 1153 (7) 684 (7) 92 73 63
Waiheke Medical
Centre
312 (5) 145 (7) 220 (7) 98 (7) 13 N/A N/A
Whanau House 2502 (5) 1371 (7) 1442 (7) 928 (7) 261 117 442
Whanau Ora -
Central
1957 (5) 964 (7) 1583 (7) 937 (7) 142 104 139
Whanau Ora -
North
1442 (5) 669 (7) 637 (7) 982 (7) 139 101 174
Whanau Ora -
South
2945 (5) 1250 (7) 718 (7) 677 (7) 103 60 83

IN CONFIDENCE – NOT FOR DISTRIBUTION
12
Point England Pop
Up
N/A N/A 88 (3) N/A N/A N/A N/A
Randwick Park Pop
Up
N/A N/A 303 (5) N/A N/A N/A N/A
Ranui Pop Up N/A N/A 409 (5) N/A N/A N/A N/A
Mt Smart Stadium
Pop Up
N/A N/A 219 (3) N/A N/A N/A N/A
Massey Pop Up N/A N/A 787 (5) N/A N/A N/A N/A
South Kaipara Pop
Up
N/A N/A 170 (4) N/A N/A N/A N/A
Clendon Pop Up N/A N/A 368 (3) N/A N/A N/A N/A
Mangere Pop Up N/A N/A 472 (2) N/A N/A N/A N/A
Mangere East Pop
Up
N/A N/A 109 (2) N/A N/A N/A N/A
Otara Pop Up N/A N/A 59 (2) N/A N/A N/A N/A
Otahuhu Pop Up N/A N/A 201 (2) N/A N/A N/A N/A
Mt Roskill Pop Up N/A N/A 217 (2) 164 (3) N/A N/A 138
Sandringham Pop
Up
N/A N/A N/A 189 (3) N/A N/A N/A
Ranui League Club
Pop Up
N/A N/A N/A 172 (3) N/A N/A N/A
Glen Eden Pop Up N/A N/A N/A 127 (4) N/A N/A N/A
Southmall Pop Up N/A N/A N/A 291 (3) N/A N/A N/A
Orakei Pop Up N/A N/A N/A 118 (3) N/A N/A N/A
Papatoetoe Pop
Up
N/A N/A N/A 74 (3) N/A N/A N/A
Te Atatu Pop Up N/A N/A N/A 65 (3) N/A N/A N/A
Mangere East
Marae Pop Up
N/A N/A N/A No
Data
N/A N/A N/A
Mangere Leagues
Club
N/A N/A N/A No
Data
N/A N/A N/A
Tamaki College
Pop Up
N/A N/A N/A 109 (2) N/A N/A N/A
Papatoetoe EFKS
Pop Up
N/A N/A N/A 74 (1) N/A N/A N/A
Botany Town
Centre Pop Up
N/A N/A N/A 121 (2) N/A N/A N/A

IN CONFIDENCE – NOT FOR DISTRIBUTION
13
Sylvia Park Pop Up N/A N/A N/A 21 (2) N/A N/A N/A
East Tamaki Pop
Up
N/A N/A N/A 161 (1) N/A N/A N/A
Rowandale Pop Up N/A N/A N/A 41 (1) N/A N/A N/A
Henderson EFKS
Pop Up
N/A N/A N/A N/A 43 40 No
Data
Mangere Central
Community Hall
Pop Up
N/A N/A N/A N/A N/A 12 30
Waipuna Targeted
Site
143 (2) 549 (7) 376 (7) 219 (7) 44 34 41
Blockhouse Bay
Targeted Site
N/A 277 (7) 921 (7) 161 (5) N/A N/A N/A
Henderson
Targeted Site
N/A N/A N/A N/A 6 6 170
Total 26,148 16,781 21,215 13,002 1748 1102 1939 * 09/09 day still in progress N/A = not open as a CTC () = Days open as a CTC

IN CONFIDENCE – NOT FOR DISTRIBUTION
14
Appendix 4: Testing by DHB and ethnicity The tables that follow are the number of people tested. The numbers in the laboratory testing
section are the number of laboratory tests processed.
Table 10: Number of people tested for COVID-19 from 12 August to 10 September
Prioritised Ethnicity MPAO
DHB of Domicile Māori Pacific Asian Other Unknown Total
Auckland 3239 6680 8570 18618 326 37,433
Bay of Plenty 2417 271 525 6063 56 9332
Canterbury 1520 592 1570 12724 190 16,596
Capital and Coast 1359 1034 1215 8530 182 12,320
Counties Manukau 6836 18847 8343 11783 407 46,216
Hawkes Bay 1305 271 197 3354 49 5176
Hutt Valley 728 417 505 2883 38 4571
Lakes 2213 287 442 3033 84 6059
MidCentral 979 247 344 3973 78 5621
Nelson Marlborough 546 142 246 3909 49 4892
Northland 2906 196 241 3829 41 7213
South Canterbury 137 33 75 1597 13 1855
Southern 998 313 629 8975 78 10,993
Tairāwhiti 822 52 56 754 19 1703
Taranaki 650 63 154 2464 41 3372
Waikato 4074 957 1312 9423 200 15,966
Wairarapa 215 35 36 993 7 1286
Waitematā 4243 4476 6905 22644 289 38,557
West Coast 46 8 13 307 6 380
Whanganui 614 72 62 1374 14 2136
Unknown 1334 672 722 3855 1512 8095
Total 37,181 35,665 32,162 131,086 3679 239,773

15
IN CONFIDENCE – NOT FOR DISTRIBUTION
Table 11: Rate per 1000 people tested for COVID-19 from 12 August to 10 September
Prioritised Ethnicity MPAO
DHB of Domicile Māori Pacific Asian Other Total
Auckland 74.5 119.1 45.8 71.2 68.3
Bay of Plenty 40.4 61 26.8 38.5 38.7
Canterbury 29 41.7 25.8 28.5 28.9
Capital and Coast 37.2 46.6 24.2 40.1 38.3
Counties Manukau 76.8 156.9 55.2 56.3 81.2
Hawkes Bay 30.2 42.2 21.5 31 31
Hutt Valley 27.9 35.7 26.9 30.6 30.3
Lakes 57.5 112.3 45.4 50.6 54.7
MidCentral 26.9 44.5 22.2 32.1 31
Nelson Marlborough 34 57.5 33.1 31.1 32.2
Northland 47.8 52.1 29.1 35.1 39.7
South Canterbury 25.8 67.6 31.7 30.9 31
Southern 29.7 45.5 24.4 33.6 32.9
Tairāwhiti 33.2 46.5 48 34.1 34.6
Taranaki 27.8 45.2 24.7 27.4 27.9
Waikato 42.3 71.8 29.7 35 37.7
Wairarapa 27 42.1 28.9 27.8 28.1
Waitematā 67.8 100.4 48 59.2 60.9
West Coast 11.9 31.7 14.1 11.4 11.9
Whanganui 35.4 47.3 21.2 31.9 32.9
Total 47.8 111.5 42 42.3 48.3

1
IN CONFIDENCE – NOT FOR DISTRIBUTION
SITREP 049
Coronavirus disease 2019 (COVID-19)
Issued: 1030 hours 11 September 2020
Information current at: 1000 hours
This report provides a daily update on the COVID-19 health system response. New information is denoted by red text.
Please use the single point of contact email [email protected] for help/support. Your email will be
logged and promptly passed to the appropriate team.
This document is classified IN CONFIDENCE and not for further distribution.
Need to know
COMMUNITY CASES
NEW LAST 24 hrs
1
MIQ CASES
NEW LAST 24 hrs
0
COMMUNITY CASES
TOTAL RECOVERED
99
104
COMMUNITY CASES
ACTIVE
75 TOTAL CASES SINCE 11 AUG
176
39
TOTAL CASES SINCE 9 JUN
143
TOTAL ACTIVE CASES IN NZ (COMMUNITY & MIQ): 114
MIQ CASES
TOTAL RECOVERED
MIQ CASES
ACTIVE
LABORATORY TESTS
10 September
8,953
LABORATORY TESTS
04 to 10 Sep
50,430
LABORATORY TESTS
TOTAL
848,420
CASES DECEASED
2

IN CONFIDENCE – NOT FOR DISTRIBUTION
2
Total COVID-19 cases
Table 1: Total number of COVID-19 cases as at 0900 11 September 2020
Case Status Active Recovered Deceased Total
Confirmed 114* (-6) 1309 (+7) 19 1442 (+1)
Probable 0 346 5 351
Total 114* (-6) 1655 (+7) 24 1793 (+1)
*1 new case identified, 7 cases classified as recovered.
Total community cases since 11 August
Table 2: Community cases by DHB and case status as at 0900 11 September 20201
New community cases since 0900 10 September 20202
1. One new community case has been reported, as at 0900 11 September.
o The case has an epidemiological link to an existing case and is associated with the Mt
Roskill Evangelical Church bereavement sub-cluster.
Community cases linked to the Auckland Community Cluster August 20203
2. 174 of the 176 community cases have been linked to the Auckland Community Cluster
August 2020, as at 0900 11 September. The unlinked cases are summarised as follows:
o The Rydges employee (this investigation has been closed).
o A case (reported 21 August) is still under investigation for an epidemiological link to
the community cluster and there is insufficient data to confirm a genomic link to the
community cluster (see 3).
Community cases under investigation to determine a link to the Auckland community
cluster
3. The case under investigation is summarised as follows:
1 EpiSurv Database, 0900 10 September 2020
2 EpiSurv Database, 0900 11 September 2020
3 EpiSurv Database, 0900 11 September 2020
Case
Status
Counties Manukau Waitematā Auckland Waikato Total
Confirmed 76 52 46 (+1) 1 175 (+1)
Probable 1 0 0 0 1
Total 77 52 46 (+1) 1 176 (+1)

IN CONFIDENCE – NOT FOR DISTRIBUTION
3
o One case (reported 21 August) came through the border on 18 June. The case tested
negative at Day 3 and Day 12 of quarantine. Subsequently the case tested positive on
21 August after being swabbed at a mobile testing clinic in Auckland. Despite using
two different whole genome sequencing protocols only a partial genome was
obtained. There is insufficient data to confirm the case is genomically linked to the
community cluster.4 Their epidemiological link to the community cluster is still under
investigation.
Community cases and household contacts at Jet Park
4. As at 0800 11 September there are 70 people isolating in Jet Park from the community.
55 are confirmed cases, the remaining 15 are household contacts. This number will
fluctuate as people finish their isolation and depart from the facility.5
MIQ cases since 0900 10 September 20206
5. There have been no new cases detected at the border, as at 0900 11 September. In
total 143 cases have been detected at the border since the establishment of
MIFs/MIQs.
Cases in hospital
6. As at 0800 11 September there are three cases in hospital with COVID-19.7
o New case reported today was admitted to Auckland City Hospital 10 September.
Table 3: Number of cases in hospital with COVID-19 by DHB as at 0800 11 September 2020
4 ESR WGS report 03 September 2020
5 NRHCC Morning Report, 0900 11 September 2020
6 EpiSurv Database, 0900 11 September 2020
7 NRHCC Morning Report 08 September 2020 and COVID-19 Hospital Summary, 0900 08 September 2020
DHB Hospital Number in a general ward Number in ICU/HDU
Auckland Auckland City 1 0
Waitematā North Shore 0 1
Waikato Waikato 0 1
Total - 1 2

IN CONFIDENCE – NOT FOR DISTRIBUTION
4
Health system response
Overall approach
7. Our investigation has two main focus areas that run in parallel:
o Source attribution – a focus on investigating the case with the earliest symptom
onset date to gather details actions of movements 14 days prior. This will help to
understand the possible source of the new outbreak.
o Containment – rigorous case investigation, identification of close contacts and
isolation and testing to ensure that chain of transmission is broken.
Figure 1: Daily number of confirmed and probable cases of COVID-19 as at 0900 11 September
Source: NZ COVID-19 Dashboard
Current outbreak overview8
o The recent rate of increase in new cases observed during the last report has stabilised.
There are currently two sub-clusters which most new community cases are linked to
(Mount Roskill Evangelical Church and Botany sub-clusters). There are currently 43
confirmed cases in the Mount Roskill Evangelical Church sub-cluster and 5 confirmed
cases in the Botany sub-cluster.
Current outbreak investigation priorities9
o Contact tracing and containment around Mount Roskill Evangelical Church sub-cluster
and more recent bereavement events.
o Contact tracing and containment around Botany sub-cluster.
o Clarify whether June border case is a new infection and clarify strain.
8 ARPHS Strategic Report 09 September 2020
9 ARPHS Strategic Report 09 September 2020

IN CONFIDENCE – NOT FOR DISTRIBUTION
5
o Seek to identify epidemiological link for index case in Mount Roskill Evangelical Church
sub-cluster.
Sub-clusters and settings of interest
A new sub-cluster and exposure events were identified (on 7 September) within Mt
Roskill with epidemiological links to Mt Roskill Evangelical Church sub-cluster.10 A death
(not COVID-19 related) . Between 24 August and 2 September,
there were multiple gatherings associated with the bereavement including the funeral
on . There were multiple other exposure events associated with the
bereavement. The investigation is ongoing. There is good engagement with the church
leadership who are assisting with the investigation.11
48 people attended the funeral on . All 48 close contacts from the funeral
have been identified, with 4612 tested. A mobile testing service has been arranged to
test the remaining two contacts.12 10 have tested positive, 35 have tested negative and
one is pending.5 As of 0800 11 September, of 332 Mt Roskill Evangelical Church
members 273 have been tested. Five have tested positive, 245 have tested negative and
23 are pending.5
A new sub-cluster has been created for cases associated with the bereavement events
to include cases whose source of infection occurred at the bereavement events. Within
this sub-cluster there are 13 cases and 33 cases remain in the Mt Roskill Evangelical
Church sub-cluster.5
8. A new setting of interest, St Dominic’s College in Henderson, Auckland, was identified
on 8 September. A confirmed case attended the school.13
. The school has
been informed and communications have been sent. The case is linked to the new sub-
cluster associated with the bereavement events. A list of all contacts has been gathered
by the school. Testing of all school students and staff is in progress with approximately
500 tested as at 1500 10 September.14 There are also 87 students and 11 teachers
identified as close contacts. As of 0800 11 September, of these 98 people, 63 have been
tested with 47 returning negative results so far.5
ARPHS actions:13
o Maintain positive relationships with Church leaders and liaise with Church members
about their need for financial and welfare support if asked to isolate.
o Scope new cases.
o Quarantine and test household contacts of the new cases. Testing is underway for
household contacts, including repeat testing as needed for people previously tested
from the Mt Roskill church.
10 ARPHS, Waikato DHB and MoH teleconference 0830 08 September 2020
11 NRHCC Morning report, 0900 10 September 2020
12 NRHCC Morning report, 0900 11 September 2020
13 ARPHS, Waikato DHB and MoH teleconference 0830 08 September 2020
14 ARPHS, Waikato DHB and MoH teleconference 1500 10 September 2020
s 9(2)(a)
s 9(2)(a)
s 9(2)(a)
s 9(2)(a)

IN CONFIDENCE – NOT FOR DISTRIBUTION
6
o All contacts have been stood down. They were being tested on 8
September and are in isolation.
o Develop and implement a testing strategy which includes communication with
church leaders around the reason for testing and who should be tested.
9. The Botany sub-cluster is still being investigated to determine the index case. As at 9
September no clear epidemiological link had been identified. The first case detected is
not the index case in this community. Source investigation is ongoing but there are
indications that the earliest symptom onset is around 3 August (based on a family
member with positive serology and earlier influenza-like-illness). Whole genome
sequencing results from 30 August showed a link back to the Americold sequences.15
Case investigation
10. Source investigation for the epidemiological link to the main cluster for four cases that
have been genomically linked to the main cluster is ongoing.
o The
o GP
o The second Mount Albert Grammar student
o The Botany case
11. The case in Tokoroa reported on 29 August is a contact of an existing case from
Tokoroa who is linked to the Auckland cluster. The case works at a medical centre in
Tokoroa and it is believed they had contact with the existing case
The centre has had a final deep clean and has reopened with reduced
staff and are completing most consultations virtually. Contact tracing is being
completed back to 20 August. This is a precautionary timeframe due to the case’s long
incubation period and radiological findings suggesting more advanced disease despite
the 27 August symptom onset date. To date, all contacts tested have received negative
results. Day 12 testing so far have also all returned negative results.
15 COVID-19 Auckland Outbreak II Strategic report 09 September 2020
s 9(2)(a)
s 9(2)(a)
s 9(2)(a)
s 9(2)(a)

7
IN CONFIDENCE – NOT FOR DISTRIBUTION
s 9(2)(a)
s 9(2)(a)
s 9(2)(a)

8
IN CONFIDENCE – NOT FOR DISTRIBUTION
ESR and wider testing16 12. A further 34 community cases are genomically linked with the Auckland cluster. These
cases are from the following known sub-clusters; Church 1 (6 cases), Church 2 (4 cases),
Church 3 (9 cases), Finance Now HH (1 case), Americold HH (3 cases), Botany (4 cases),
(4 cases) and (3 cases).17
13.
14. Work is underway to analyse how the whole genome sequencing can be used to tell us
how COVID-19 has been transmitted through the community cluster and to further
inform its management.
15. No direct links have been found between the community outbreak genome
sequencing, with the 67 genomes currently available from cases in managed isolation
facilities (MIFs).
16.
Contact tracing18 17. Since the 11 August, 3623 community close contacts have been identified and recorded
in the National Contact Tracing Solution, 3608 of these have been contacted and are
self-isolating, and we are in the process of contacting the rest. Please note that the
total number and number successfully contacted can decrease due to records being
marked as invalid in the system.
Table 5: Close contact tracing recorded in the National Contact Tracing Solution since 11 August as at
0900 11 September 2020
08/09/2020 09/09/2020 10/09/2020 11/09/2020
Number of close contacts
identified1 3274 3346 3372 3623
Number of close contacts
successfully contacted (and are
self-isolating)
3228 3305 3354 3608
16 ESR Whole Genome Sequencing Report 02 September 2020
17 ESR email update 0900 08 September 2020
18 COVID-19 NCCS Analytics and Reporting 0956 10 September 2020
s 9(2)(a) s 9(2)(a)
s 9(2)(g)(i)
s 9(2)(g)(i)

IN CONFIDENCE – NOT FOR DISTRIBUTION
9
Number of close contacts
referred to "finding services"2 0 0 0 3
Number of close contacts
awaiting contact 46 41 18 12
1. Contacts loaded into the National Contact Tracing Solution, and managed by either the National Investigation and Tracing Unit or the Public Health Units. Contacts from MIQ and overseas cases are not
included in this report.
2. "Finding services" refers to the mechanism the National Close Contact Service uses to find valid contact details for close contacts we do not have the correct contact details for. These services utilise
internal Ministry of Health databases along with Police, Customs and Airlines where relevant.
3. The total number and number successfully contacted can decrease due to duplicates and invalid records being removed from the system.
COVID-19 Tracer App usage19 Figure 2: COVID-19 Tracer App cumulative registered users and daily scans/manual entries as at 1615
10 September 2020
1. The number of scans and manual entries on any given date is subject to change for up to 31 days. This is because there can be
a delay before anonymised analytic information is received (e.g. device not connected to internet when scan carried out).
2. The number of App registrations and QR codes for any given date is subject to change for up to 1 day. This is because due to
reporting timeframes these numbers may be extracted before the 12pm cut-off for the reporting period.
19 Response Analyst – Digital Channels, 1617 08 September 2020

IN CONFIDENCE – NOT FOR DISTRIBUTION
10
Testing20 Table 6: Testing by functional groups, as at 0900 10 September 2020
*Numbers have been sourced from different data extracts in comparison to Table 7.
Laboratory testing numbers21 Table 7: Number of laboratory tests processed nationally as at 0900 11 September 2020
Testing supply update22
18. There are no issues with regent supplies, and hologic supplies are now in labs around
the country. There are 43 days of reagent stocks on hand nationally.
20 ÉCLAIR/MoH Public Health Intelligence, 1015 09 September 2020
21 Daily Lab Report, 0932 10 September 2020
22 Testing supply email, 1001 09 September 2020
Reason for test 09 September 03 – 09 September
GPs and other primary health 3768 20842
CBACs and pop-ups 3191 24779
Border workers - air crew 54 237
Border workers - airport staff 140 1259
Border workers - maritime crew 0 39
Border workers – Port of Tauranga staff 0 364
Border workers – Remaining Port staff 30 329
Border workers - MIF 132 1290
Border workers - MIQ 47 301
Travellers - Staying at MIF 587 2174
Travellers - Staying at MIQ 1 123
Total 7950 51737*
Time period Number of laboratory tests
10 September 8953
Last 7 days (04 Sep to 10 Sep) 50,430
Total 848,420
IN CONFIDENCE – NOT FOR DISTRIBUTION
11
Testing activity by region
Focus areas
19. As at 1700 08 September there are 28 Community testing Centres in the Metro
Auckland area. Three of these are closed CTC's for close contacts only.23
Healthline updates24 20. On 10 September there were 2520 contacts in Healthline. Of those calls, 1246 were to
the COVID-19 Info line. Demand on 1737 Need to talk? and other mental health services
was 719 contacts (16% higher than forecast).
21. On 10 September the new scripts to support the testing strategy went live with staff
being briefed on them. This followed clarification and consultation with the Ministry of
Health over 07 – 09 September on how a phone-based service should support the new
strategy.
22. The main themes yesterday/today:
o Most of the callers are calling because they are symptomatic and want to get a test,
o Calls relating to the latest exposure events,
o Confusion around Alert Level rules (i.e. crowd sizes in Auckland, around the rest of
the country etc) it is recommended to reemphasise this given recent media
confusion.
Logistics
Health Workforce25
23. Health Workforce have identified a small group of people on the surge workforce who
have indicated they would be willing to work in an ARC facility in the event of an
outbreak – this week we will work on whether this pool can be expanded and actions to
keep the group “warm” in the event ARC employers require them.
24. Upskilling of alternative workforces for testing continues to progress, including plans
for a training package and scoping of micro-credentialing, in addition to understanding
where this workforce would be obtained from. It is anticipated this training package will
be available within four weeks (estimated).
25. Health Workforce continue to work with TAS and all 20 GMsHR on workforce needs and
issues – regular workforce intelligence information will be provided to Health
Workforce, which will be incorporated into frequent dashboard reports.
23 Community Testing Centres report, 1800 08 September 2020
24 National Telehealth Service Coronavirus Update, 0914 11 September 2020
25 Health Workforce Directorate, 0832 01 September 2020

IN CONFIDENCE – NOT FOR DISTRIBUTION
12
Hospital capacity26 Table 8: Number and occupancy of hospital beds by type as at 0800 11 September 2020
Type Number of units Number (%) occupied/in use
ICU and HDU beds 343 219 (63.8%)
Ventilators 305 61 (20.0%)
Ward beds 6968 5567 (79.9%)
26 COVID-19 Hospital Summary, 0927 11 September 2020

13
IN CONFIDENCE – NOT FOR DISTRIBUTION
Appendix 1: Case summary
Table 9: All community cases reported between 0900 10 September and 0900 11 September
s 9(2)(a)

14
IN CONFIDENCE – NOT FOR DISTRIBUTION
Appendix 2: COVID-19 Provisional Disease Indicators, by date
of case notification18 Data for cases in the community
Indicator (as per Table 9832) Refined Indicator description Target 2-Sep 3-Sep 4-Sep 5 Sept ** 6 Sept ** 7 Sept ** 8 Sept **
1 - (S001) Time from exposure to contact isolation / quarantine
80% within 96 hours
100% 100% 100% - - - -
2 – (S002) Time from case first symptom to contact isolation / quarantine
80% within 96 hours
86% 100% 100% - - - -
3 – (S003) Time from test sample taken to close contact isolation / quarantine
80% within 72 hours
100% 100% 100% - 100% - -
4 – (C001) Time from first symptom to test sample taken for positive cases
80% within 48 hours
0% *
(0/2) 100% 33% 100% 50% 50% -
5 – (L001) Time from test sample taken to notification of positive result
80% within 24 hours
100% 0% *
(0/1) 25%
0% *
(0/1) 20% 75% 80%
6 – (P002) Time from case notification to isolation / quarantine of contact
80% within 48 hours
100% 100% 100% - 100% 100% -
7 – (P001) Time from notification to case interview 80% within 24 hours
100% 100% 100% 100% 100% 100% 100%
8 – (P003) Time from close contact identification to isolated / quarantined
80% within 24 hours
100% 100% 100% - 100% 97% 100%
10 – (P004) Proportion of contacts traced in 48 hours 80% within 48 hours
100% 100% 100% - 100% 100% -
C – (S005) Proportion of close contacts with confirmed or suspected COVID-19 at the time of tracing
<20% 0% 0% 0% - 0% 5% 0%
Note: • * The numerator and denominator are provided in some instances to provide context for low percentages.

IN CONFIDENCE – NOT FOR DISTRIBUTION
15
• **Data is not available for metrics where there is no data that meets the definition, or where the time/days to reach target has not fully elapsed
• The value of P002 can drop due to the addition of new close contacts to exposure events after the 48-hour period since case notification had elapsed. This can happen for a number of reasons, including a case recalling further details following the original case interview.
• These metrics report all cases during the specified period, including those in Managed Isolation and Quarantine, and do not include casual contacts.
• There are three additional indicators under development requiring both technical and clinical input to define data requirements. These are due to be completed by end October 2020.
Data for cases in Managed Isolation and Quarantine, International, and Unknown
Indicator (as per Table 9832) Refined Indicator description Target 2-Sep ** 3-Sep 4-Sep ** 5 Sept ** 6 Sept ** 7 Sept ** 8 Sept **
1 - (S001) Time from exposure to contact isolation / quarantine
80% within 96 hours
- 100% - - - - -
2 – (S002) Time from case first symptom to contact isolation / quarantine
80% within 96 hours
- 0% - - - - -
3 – (S003) Time from test sample taken to close contact isolation / quarantine
80% within 72 hours
71% 100% 40% - 100% - -
4 – (C001) Time from first symptom to test sample taken for positive cases
80% within 48 hours
- 0% * (0/1)
- - - - -
5 – (L001) Time from test sample taken to notification of positive result
80% within 24 hours
100% 100% 100% - 0% * (0/2)
100% -
6 – (P002) Time from case notification to isolation / quarantine of contact
80% within 48 hours
71% 100% 40% - 100% 100% -
7 – (P001) Time from notification to case interview 80% within 24 hours
100% 100% 100% 0% * (0/1)
100% 100% -
8 – (P003) Time from close contact identification to isolated / quarantined
80% within 24 hours
71% 100% 40% - 100% 100% -
10 – (P004) Proportion of contacts traced in 48 hours 80% within 48 hours
71% 100% 40% - 100% 100% -
C – (S005) Proportion of close contacts with confirmed or suspected COVID-19 at the time of tracing
<20% 0% 67% 0% - 0% 0% -
Note:
• * The numerator and denominator are provided in some instances to provide context for low percentages.
• **Data is not available for metrics where there is no data that meets the definition, or where the time/days to reach target has not fully elapsed
• The value of P002 can drop due to the addition of new close contacts to exposure events after the 48-hour period since case notification had elapsed. This can happen for a number of reasons, including a case recalling further details following the original case interview.
• These metrics report all cases during the specified period, including those in Managed Isolation and Quarantine, and do not include casual contacts.
• There are three additional indicators under development requiring both technical and clinical input to define data requirements. These are due to be completed by end October 2020.

16
IN CONFIDENCE – NOT FOR DISTRIBUTION
Appendix 3: NRHCC Testing Report
Novel Coronavirus (COVID-19)
Issued: 1700 10 September 2020
Table 1. Metro Auckland Summary Total of Testing for 09 September 2020
Community MIQ
staff
MIQ
guests
Airport Maritime port TOTAL
5:00pm 2217 195 534 138 23 3107
Table 2. Totals tests receipted from 12 August 2020, by ethnicity (as at 5pm)
*Swab taken in last 24 hours taken between midnight and midnight, may have been receipted and reported later than
this; tests only included if coded and received and acknowledged by lab, result not required
*Includes GP clinics, Urgent Care Centres, Designated practices
Table 3. Estimated tests taken since 12 August 2020, based on manual site reports at 5pm
Site 12/08-
16/08
17/08-
23/08
24/08 –
30/08
31/08 –
06/09
07/09 08/09 09/09 10/09*
MIQ Staff 2132 659 1488 912 88 75 251 195
Guests 2972 3767 3600 3406 483 609 345 534
Border Airport 2129 933 1349 1158 153 68 154 138
Port 1588 678 161 392 19 15 39 23
* 10/09 day still in progress
Estimated tests taken at Metro Auckland CTCs, since 12 August 2020, based on manual site
reports at 4pm
The number of mobile testing sites change frequently please see
https://www.arphs.health.nz/public-health-topics/covid-19/where-to-get-tested for the most up-
to-date information.
Tests Last 24 hours Total since 12/8*
Ethnicity CTC
Non-
CTC
Total
% Tests %
Asian 335 268 603 19.8% 35,034 17.7%
Maori 282 166 448 14.7% 28,506 14.4%
Other 621 517 1138 37.5% 83,569 42.2%
Pacific 471 246 687 22.6% 46,420 23.4%
Unknown 38 124 162 5.3% 4425 2.2%
Total 1747 1291 3038 197,954

IN CONFIDENCE – NOT FOR DISTRIBUTION
17
Appendix 4: Testing by DHB and ethnicity The tables that follow are the number of people tested. The numbers in the laboratory testing
section are the number of laboratory tests processed.
Table 10: Number of people tested for COVID-19 from 12 August to 10 September
Prioritised Ethnicity MPAO
DHB of Domicile Māori Pacific Asian Other Unknown Total
Auckland 3239 6680 8570 18618 326 37,433
Bay of Plenty 2417 271 525 6063 56 9332
Canterbury 1520 592 1570 12724 190 16,596
Capital and Coast 1359 1034 1215 8530 182 12,320
Counties Manukau 6836 18847 8343 11783 407 46,216
Hawkes Bay 1305 271 197 3354 49 5176
Hutt Valley 728 417 505 2883 38 4571
Lakes 2213 287 442 3033 84 6059
MidCentral 979 247 344 3973 78 5621
Nelson Marlborough 546 142 246 3909 49 4892
Northland 2906 196 241 3829 41 7213
South Canterbury 137 33 75 1597 13 1855
Southern 998 313 629 8975 78 10,993
Tairāwhiti 822 52 56 754 19 1703
Taranaki 650 63 154 2464 41 3372
Waikato 4074 957 1312 9423 200 15,966
Wairarapa 215 35 36 993 7 1286
Waitematā 4243 4476 6905 22644 289 38,557
West Coast 46 8 13 307 6 380
Whanganui 614 72 62 1374 14 2136
Unknown 1334 672 722 3855 1512 8095
Total 37,181 35,665 32,162 131,086 3679 239,773

18
IN CONFIDENCE – NOT FOR DISTRIBUTION
Table 11: Rate per 1000 people tested for COVID-19 from 12 August to 10 September
Prioritised Ethnicity MPAO
DHB of Domicile Māori Pacific Asian Other Total
Auckland 74.5 119.1 45.8 71.2 68.3
Bay of Plenty 40.4 61 26.8 38.5 38.7
Canterbury 29 41.7 25.8 28.5 28.9
Capital and Coast 37.2 46.6 24.2 40.1 38.3
Counties Manukau 76.8 156.9 55.2 56.3 81.2
Hawkes Bay 30.2 42.2 21.5 31 31
Hutt Valley 27.9 35.7 26.9 30.6 30.3
Lakes 57.5 112.3 45.4 50.6 54.7
MidCentral 26.9 44.5 22.2 32.1 31
Nelson Marlborough 34 57.5 33.1 31.1 32.2
Northland 47.8 52.1 29.1 35.1 39.7
South Canterbury 25.8 67.6 31.7 30.9 31
Southern 29.7 45.5 24.4 33.6 32.9
Tairāwhiti 33.2 46.5 48 34.1 34.6
Taranaki 27.8 45.2 24.7 27.4 27.9
Waikato 42.3 71.8 29.7 35 37.7
Wairarapa 27 42.1 28.9 27.8 28.1
Waitematā 67.8 100.4 48 59.2 60.9
West Coast 11.9 31.7 14.1 11.4 11.9
Whanganui 35.4 47.3 21.2 31.9 32.9
Total 47.8 111.5 42 42.3 48.3

IN CONFIDENCE – NOT FOR DISTRIBUTION
1
SITREP 050
Coronavirus disease 2019 (COVID-19)
Issued: 1030 hours 12 September 2020
Information current at: 1000 hours
This report provides a daily update on the COVID-19 health system response. New information is denoted by red text.
Please use the single point of contact email [email protected] for help/support. Your email will be
logged and promptly passed to the appropriate team.
This document is classified IN CONFIDENCE and not for further distribution.
Need to know
COMMUNITY CASES
NEW LAST 24 hrs
2
MIQ CASES
NEW LAST 24 hrs
0
COMMUNITY CASES
TOTAL RECOVERED
106
105
COMMUNITY CASES
ACTIVE
70 TOTAL CASES SINCE 11 AUG
178
38
TOTAL CASES SINCE 9 JUN
143
TOTAL ACTIVE CASES IN NZ (COMMUNITY & MIQ): 108
MIQ CASES
TOTAL RECOVERED
MIQ CASES
ACTIVE
LABORATORY TESTS
11 September
8,838
LABORATORY TESTS
05 to 11 Sep
49,789
LABORATORY TESTS
TOTAL
857,258
CASES DECEASED
2

IN CONFIDENCE – NOT FOR DISTRIBUTION
2
Total COVID-19 cases
Table 1: Total number of COVID-19 cases as at 0900 12 September 2020
Case Status Active Recovered Deceased Total
Confirmed 108* (-6) 1317 (+8) 19 1444 (+2)
Probable 0 346 5 351
Total 108* (-6) 1663 (+8) 24 1795 (+2)
*2 new case identified, 8 cases classified as recovered.
Total community cases since 11 August
Table 2: Community cases by DHB and case status as at 0900 12 September 20201
New community cases since 0900 11 September 20202
1. Two new community case has been reported, as at 0900 12 September.
o Both cases have an epidemiological link to an existing case and are associated with
the Mt Roskill Evangelical Church bereavement sub-cluster.
Community cases linked to the Auckland Community Cluster August 20203
2. 176 of the 178 community cases have been linked to the Auckland Community Cluster
August 2020, as at 0900 12 September. The unlinked cases are summarised as follows:
o The Rydges employee (this investigation has been closed).
o A case (reported 21 August) is still under investigation for an epidemiological link to
the community cluster and there is insufficient data to confirm a genomic link to the
community cluster (see 3).
Community cases under investigation to determine a link to the Auckland community
cluster
3. The case under investigation is summarised as follows:
1 EpiSurv Database, 0900 10 September 2020
2 EpiSurv Database, 0900 11 September 2020
3 EpiSurv Database, 0900 11 September 2020
Case
Status
Counties Manukau Waitematā Auckland Waikato Total
Confirmed 76 54 (+2) 46 1 177 (+2)
Probable 1 0 0 0 1
Total 77 54 (+2) 46 1 178 (+2)

IN CONFIDENCE – NOT FOR DISTRIBUTION
3
o One case (reported 21 August) came through the border on 18 June. The case tested
negative at Day 3 and Day 12 of quarantine. Subsequently the case tested positive on
21 August after being swabbed at a mobile testing clinic in Auckland. Despite using
two different whole genome sequencing protocols only a partial genome was
obtained. There is insufficient data to confirm the case is genomically linked to the
community cluster.4 Their epidemiological link to the community cluster is still under
investigation.
Community cases and household contacts at Jet Park
4. As at 0800 12 September there are 63 people isolating in Jet Park from the community.
47 are confirmed cases, the remaining 16 are household contacts. This number will
fluctuate as people finish their isolation and depart from the facility.5
MIQ cases since 0900 12 September 20206
5. There have been no new cases detected at the border, as at 0900 12 September. In
total 143 cases have been detected at the border since the establishment of
MIFs/MIQs.
Cases in hospital
6. As at 0800 11 September there are three cases in hospital with COVID-19.7
Table 3: Number of cases in hospital with COVID-19 by DHB as at 0800 12 September 2020
4 ESR WGS report 03 September 2020
5 NRHCC Morning Report, 0900 12 September 2020
6 EpiSurv Database, 0900 12 September 2020
7 NRHCC Morning Report 12 September 2020 and COVID-19 Hospital Summary, 0900 12 September 2020
DHB Hospital Number in a general ward Number in ICU/HDU
Auckland Auckland City 1 0
Waitematā North Shore 0 1
Waikato Waikato 0 1
Total - 1 2

IN CONFIDENCE – NOT FOR DISTRIBUTION
4
Health system response
Overall approach
7. Our investigation has two main focus areas that run in parallel:
o Source attribution – a focus on investigating the case with the earliest symptom
onset date to gather details actions of movements 14 days prior. This will help to
understand the possible source of the new outbreak.
o Containment – rigorous case investigation, identification of close contacts and
isolation and testing to ensure that chain of transmission is broken.
Current outbreak overview8
o The recent rate of increase in new cases observed during the last report has stabilised.
There are currently two sub-clusters which most new community cases are linked to
(Mount Roskill Evangelical Church and Botany sub-clusters). There are currently 43
confirmed cases in the Mount Roskill Evangelical Church sub-cluster and 5 confirmed
cases in the Botany sub-cluster.
Current outbreak investigation priorities
o Contact tracing and containment around Mount Roskill Evangelical Church sub-cluster
and more recent bereavement events.
o Contact tracing and containment around Botany sub-cluster.
o Clarify whether June border case is a new infection and clarify strain.
o Seek to identify epidemiological link for index case in Mount Roskill Evangelical Church
sub-cluster.
Sub-clusters and settings of interest9
8. New exposure events were identified (on 7 September) within Mt Roskill with
epidemiological links to Mt Roskill Evangelical Church sub-cluster. Between 24 August
and 2 September there were multiple gatherings associated with bereavement of a
(non COVID-19 related) death, including a funeral on
9. A new sub-cluster has been created to include cases whose source of infection
occurred at the bereavement events. There are 15 cases in the bereavement sub-cluster
and 33 cases remain in the Mt Roskill Evangelical Church sub-cluster.
10. 47 people attended the funeral on . Everyone who visited the households
during bereavement events are also on the funeral list. 46 of the 47 have been tested.
10 have tested positive, 32 have tested negative and four are pending. 10
8 ARPHS Strategic Report 08 September 2020
9 ARPHS Strategic Report 08 September 2020
10 NRHCC Morning Report 12 September 2020
s 9(2)(a)
s 9(2)(a)

IN CONFIDENCE – NOT FOR DISTRIBUTION
5
11. St Dominic’s College in Henderson, Auckland, was identified as a setting of interest on 8
September. A confirmed case linked to the bereavement sub-cluster
The school has
been informed and communications have been sent. A list of contacts has been
gathered by the school and includes 87 students and 11 teachers. As of 0800 12
September, 80 of the students have been tested with 1 positive result, 62 negative, and
17 results pending. All 11 of the teachers have tested negative.11 Testing of the wider
school community is ongoing with 1,399 people tested so far. 1,371 results are negative
and 28 results pending as at 1800 11 September.12
12. One of the cases that attended the funeral worked as a bus driver for two days while
infectious but pre-symptomatic. wore a facemask and had 2m distance from
passengers due to AT policy. A contact tracing exercise based on HOP card data is
ongoing.
o There were 293 individuals who rode these routes on 03/09 and 04/09, all of whom
are casual contacts. No individual rode the bus for more than two hours cumulatively
over these two days.
o There are two close contacts, they are in self-isolation.
13. As of 0800 12 September, of the 311 Mt Roskill Evangelical Church members 304 have
been tested. 4 have tested positive, 270 have tested negative and 30 are pending.
14. All five of the confirmed cases in the Botany sub-cluster were in Jet Park but have been
released. Two workplaces associated with the cases have been identified and close
contacts have been scoped. Three at one of the of a case
are close contacts and have been stood down, self-isolated, and tested negative. All
three have been released from isolation. One case is a and no close
contacts were identified at the second workplace. Four members of one of the families
in the sub-cluster has had serology testing on 11 September, results are pending.
15. ARPHS actions:13
o Maintain positive relationships with Church leaders and liaise with Church members
about their need for financial and welfare support if asked to isolate.
o Scope new cases.
o Quarantine and test household contacts of the new cases. Testing is underway for
household contacts, including repeat testing as needed for people previously tested
from the Mt Roskill church.
o Develop and implement a testing strategy which includes communication with
church leaders around the reason for testing and who should be tested.
o MoH have signed off on two medical officers of health to support ARPHS.
Case investigation
11 RHCC Morning Report 12 September 2020
12 ARPHS email 1800 11 September 2020
13 ARPHS Strategic Report 08 September 2020
s 9(2)(a)
s 9(2)(a)
s 9(2)(a)
s 9(2)(a)
s 9(2)(a)
s 9(2)(a)

IN CONFIDENCE – NOT FOR DISTRIBUTION
6
16. Source investigation for the epidemiological link to the main cluster for four cases that
have been genomically linked to the main cluster is ongoing.
o The
o GP
o The second Mount Albert Grammar student
o The Botany case
Self-isolation compliance14
17. Discussions with a key representative from Ngaa Amokura have confirmed that the
option below will reinforce the trust/relationship between the health sector and the
fellowship whanau for supporting compliance with self-isolation requirements (to be
used if standard contact tracing cannot be established within 48 hrs).
o Engagement of the kaimanaaki workforce (community champions employed by our
Maaori providers in the community). Kaimanaaki have access to clinical
support/advice. Development of an implementation plan in progress. The aim of
kaimanaaki is to support and enable whaanau wellbeing through the pandemic. They
have specific skills to help whaanau cope with isolation. They are also trained in the
use of PPE so would be able to do house visits and/or contact whaanau by phone for
the duration of their isolation. Daily contact would be anticipated and kaimanaaki
would report back to the DHB/public health officials on a daily basis
14 ADHB Email, 100 11 September 2020
s 9(2)(a)
s 9(2)(a)

7
IN CONFIDENCE – NOT FOR DISTRIBUTION
s 9(2)(a)s 9(2)(a)

IN CONFIDENCE – NOT FOR DISTRIBUTION
8
s 9(2)(a)
s 9(2)(a)
s 9(2)(a)

9
IN CONFIDENCE – NOT FOR DISTRIBUTION
ESR and wider testing15 18. ESR now has an arrangement in place with Massey University for genome sequencing.
ESR will still validate all results, however this arrangement is predicted to speed up
genome testing.
19. A further 34 community cases are genomically linked with the Auckland cluster. These
cases are from the following known sub-clusters; Church 1 (6 cases), Church 2 (4 cases),
Church 3 (9 cases), Finance Now HH (1 case), Americold HH (3 cases), Botany (4 cases),
(4 cases) and (3 cases).16
20.
21. Work is underway to analyse how the whole genome sequencing can be used to tell us
how COVID-19 has been transmitted through the community cluster and to further
inform its management.
22. No direct links have been found between the community outbreak genome
sequencing, with the 67 genomes currently available from cases in managed isolation
facilities (MIFs).
23.
Contact tracing17 24. Between 03 and 09 September 89% (352/394) of Community close contacts and 82%
(14/17) MIQ close contacts have been contacted within 48 hours of being determined
to be a contact. KPI for this metric is 80% of close contacts within 48 hours.
Table 5: Close contact tracing recorded in the National Contact Tracing Solution since 11 August as at
0900 11 September 2020
09/09/2020 10/09/2020 11/09/2020 12/09/2020
Number of close contacts
identified1 3346 3372 3623 3647
15 ESR Whole Genome Sequencing Report 02 September 2020, Email 1859 11 September 2020
16 ESR email update 0900 08 September 2020
17 COVID-19 NCCS Analytics and Reporting 0906 12 September 2020
s 9(2)(a) s 9(2)(a)
s 9(2)(g)(i)
s 9(2)(g)(i)

IN CONFIDENCE – NOT FOR DISTRIBUTION
10
Number of close contacts
successfully contacted (and are
self-isolating)
3305 3354 3608 3640
Number of close contacts
referred to "finding services"2 0 0 3 0
Number of close contacts
awaiting contact 41 18 12 7
1. Contacts loaded into the National Contact Tracing Solution, and managed by either the National Investigation
and Tracing Unit or the Public Health Units. Contacts from MIQ and overseas cases are not included in this
report.
2. "Finding services" refers to the mechanism the National Close Contact Service uses to find valid contact details
for close contacts we do not have the correct contact details for. These services utilise internal Ministry of Health
databases along with Police, Customs and Airlines where relevant.
3. The total number and number successfully contacted can decrease due to duplicates and invalid records being
removed from the system.
COVID-19 Tracer App usage18 Figure 1: COVID-19 Tracer App cumulative registered users and daily scans/manual entries as at 1615
11 September 2020
1. The number of scans and manual entries on any given date is subject to change for up to 31 days. This is because there can be
a delay before anonymised analytic information is received (e.g. device not connected to internet when scan carried out).
2. The number of App registrations and QR codes for any given date is subject to change for up to 1 day. This is because due to
reporting timeframes these numbers may be extracted before the 12pm cut-off for the reporting period.
18 Response Analyst – Digital Channels, 1621 11 September 2020
0
500,000
1,000,000
1,500,000
2,000,000
2,500,000
3,000,000
20/
05
23/
05
26/
05
29/
05
01/
06
04/
06
07/
06
10/
06
13/
06
16/
06
19/
06
22/
06
25/
06
28/
06
01/
07
04/
07
07/
07
10/
07
13/
07
16/
07
19/
07
22/
07
25/
07
28/
07
31/
07
03/
08
06/
08
09/
08
12/
08
15/
08
18/
08
21/
08
24/
08
27/
08
30/
08
02/
09
05/
09
08/
09
11/
09
Usa
ge
Day and month
Cumulative App registrations Daily scans and manual entries

IN CONFIDENCE – NOT FOR DISTRIBUTION
11
Testing19 Table 6: Testing by functional groups, as at 0900 12 September 2020
3. *Numbers have been sourced from different data extracts in comparison to Table 7.
Laboratory testing numbers20 Table 7: Number of laboratory tests processed nationally as at 0900 12 September 2020
Testing supply update21
25. There are no issues with regent supplies, and hologic supplies are now in labs around
the country. There are 43 days of reagent stocks on hand nationally.
19 ÉCLAIR/MoH Public Health Intelligence, 1000 12 September 2020
20 Daily Lab Report, 0807 12 September 2020
21 Testing supply email, 1001 09 September 2020
Reason for test 11 September 05 – 11 September
GPs and other primary health 3899 19975
CBACs and pop-ups 3994 24444
Border workers - air crew 34 222
Border workers - airport staff 202 1024
Border workers - maritime crew 0 1
Border workers – Port of Tauranga staff 6 127
Border workers – Remaining Port staff 59 266
Border workers - MIF 110 1076
Border workers - MIQ 109 294
Travellers - Staying at MIF 356 2242
Travellers - Staying at MIQ 69 78
Total 8838 49749
Time period Number of laboratory tests
11 September 8838
Last 7 days (05 Sep to 11 Sep) 49,789
Total 857,258

IN CONFIDENCE – NOT FOR DISTRIBUTION
12
Testing activity by region
Focus areas
26. As at 1700 08 September there are 28 Community testing Centres in the Metro
Auckland area. Three of these are closed CTC's for close contacts only.22
Healthline updates23 27. On 11 September there were 2,249 contacts in Healthline. Of those calls, 1,015 were to
the COVID-19 Info line. Demand on 1737 Need to talk? and other mental health services
was 623 contacts (slightly lower than forecast).
28. The main themes yesterday/today:
o Most of the callers are calling because they are symptomatic and want to get a test,
o Calls relating to the latest exposure events,
o Confusion around Alert Level rules (i.e. crowd sizes in Auckland, around the rest of
the country etc) it is recommended to reemphasise this given recent media
confusion.
Logistics
Health Workforce24
29. Health Workforce have identified a small group of people on the surge workforce who
have indicated they would be willing to work in an ARC facility in the event of an
outbreak – this week we will work on whether this pool can be expanded and actions to
keep the group “warm” in the event ARC employers require them.
30. Upskilling of alternative workforces for testing continues to progress, including plans
for a training package and scoping of micro-credentialing, in addition to understanding
where this workforce would be obtained from. It is anticipated this training package will
be available within four weeks (estimated).
31. Health Workforce continue to work with TAS and all 20 GMsHR on workforce needs and
issues – regular workforce intelligence information will be provided to Health
Workforce, which will be incorporated into frequent dashboard reports.
22 Community Testing Centres report, 1800 08 September 2020
23 National Telehealth Service Coronavirus Update, 0932 12 September 2020
24 Health Workforce Directorate, 0832 01 September 2020

IN CONFIDENCE – NOT FOR DISTRIBUTION
13
Hospital capacity25 Table 8: Number and occupancy of hospital beds by type as at 0800 12 September 2020
Type Number of units Number (%) occupied/in use
ICU and HDU beds 325 185 (56.9%)
Ventilators 265 46 (17.4%)
Ward beds 6541 5075 (77.6%)
25 COVID-19 Hospital Summary, 1012 12 September 2020

14
IN CONFIDENCE – NOT FOR DISTRIBUTION
Appendix 1: Case summary
Table 5: All community cases reported between 0900 11 September and 0900 12 September
s 9(2)(a)

15
IN CONFIDENCE – NOT FOR DISTRIBUTION
Appendix 2: COVID-19 Provisional Disease Indicators, by date
of case notification17 Table 6: NCTS data for cases in the community
Indicator (as per Table
9832) Refined Indicator description Target 4 Sept 5 Sept ** 6 Sept 7 Sept 8 Sept ** 9 Sept ** 10 Sept **
1 - (S001) Time from exposure to contact isolation / quarantine 80% within 96 hours
100% - 100% 30% - - -
2 – (S002) Time from case first symptom to contact isolation / quarantine 80% within 96 hours
100% - 0% *
(0/2) 77% - - -
3 – (S003) Time from test sample taken to close contact isolation / quarantine
80% within 72 hours
73% - 100% 82% 4% - -
4 – (C001) Time from first symptom to test sample taken for positive cases 80% within 48 hours
33% 100% 50% 50% 33% 0% *
(0/1) -
5 – (L001) Time from test sample taken to notification of positive result 80% within 24 hours
25% 0% *
(0/1) 20% 75% 80%
0% *
(0/2) 100%
6 – (P002) Time from case notification to isolation / quarantine of contact 80% within 48 hours
73% - 100% 93% 88% 100% -
7 – (P001) Time from notification to case interview 80% within 24 hours
100% 100% 100% 100% 100% 100% 100%
8 – (P003) Time from close contact identification to isolated / quarantined 80% within 24 hours
82% - 100% 96% 97% 100% 100%
10 – (P004) Proportion of contacts traced in 48 hours 80% within 48 hours
100% - 100% 98% 88% 100% -
C – (S005) Proportion of close contacts with confirmed or suspected COVID-19 at the time of tracing <20% 0% - 0% 4% 1% 0% 0%
• * The numerator and denominator are provided in some instances to provide context for low percentages.
• **Data is not available for metrics where there is no data that meets the definition, or where the time/days to reach target has not fully elapsed
• The value of P002 can drop due to the addition of new close contacts to exposure events after the 48-hour period since case notification had elapsed. This can happen for a number of reasons, including a case recalling further details following the original case
interview.
• These metrics report all cases during the specified period, including those in Managed Isolation and Quarantine, and do not include casual contacts.
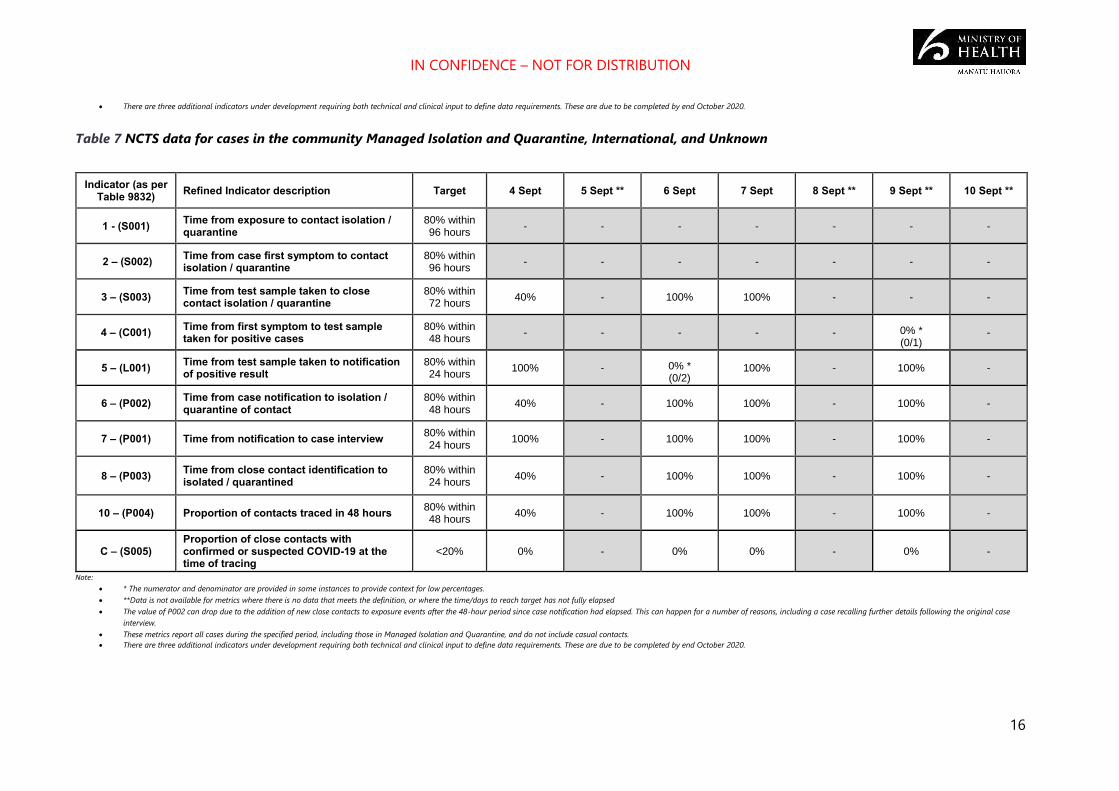
IN CONFIDENCE – NOT FOR DISTRIBUTION
16
• There are three additional indicators under development requiring both technical and clinical input to define data requirements. These are due to be completed by end October 2020.
Table 7 NCTS data for cases in the community Managed Isolation and Quarantine, International, and Unknown
Indicator (as per Table 9832) Refined Indicator description Target 4 Sept 5 Sept ** 6 Sept 7 Sept 8 Sept ** 9 Sept ** 10 Sept **
1 - (S001) Time from exposure to contact isolation / quarantine
80% within 96 hours
- - - - - - -
2 – (S002) Time from case first symptom to contact isolation / quarantine
80% within 96 hours
- - - - - - -
3 – (S003) Time from test sample taken to close contact isolation / quarantine
80% within 72 hours
40% - 100% 100% - - -
4 – (C001) Time from first symptom to test sample taken for positive cases
80% within 48 hours
- - - - - 0% * (0/1)
-
5 – (L001) Time from test sample taken to notification of positive result
80% within 24 hours
100% - 0% * (0/2)
100% - 100% -
6 – (P002) Time from case notification to isolation / quarantine of contact
80% within 48 hours
40% - 100% 100% - 100% -
7 – (P001) Time from notification to case interview 80% within 24 hours
100% - 100% 100% - 100% -
8 – (P003) Time from close contact identification to isolated / quarantined
80% within 24 hours
40% - 100% 100% - 100% -
10 – (P004) Proportion of contacts traced in 48 hours 80% within 48 hours
40% - 100% 100% - 100% -
C – (S005) Proportion of close contacts with confirmed or suspected COVID-19 at the time of tracing
<20% 0% - 0% 0% - 0% -
Note:
• * The numerator and denominator are provided in some instances to provide context for low percentages.
• **Data is not available for metrics where there is no data that meets the definition, or where the time/days to reach target has not fully elapsed
• The value of P002 can drop due to the addition of new close contacts to exposure events after the 48-hour period since case notification had elapsed. This can happen for a number of reasons, including a case recalling further details following the original case
interview.
• These metrics report all cases during the specified period, including those in Managed Isolation and Quarantine, and do not include casual contacts.
• There are three additional indicators under development requiring both technical and clinical input to define data requirements. These are due to be completed by end October 2020.
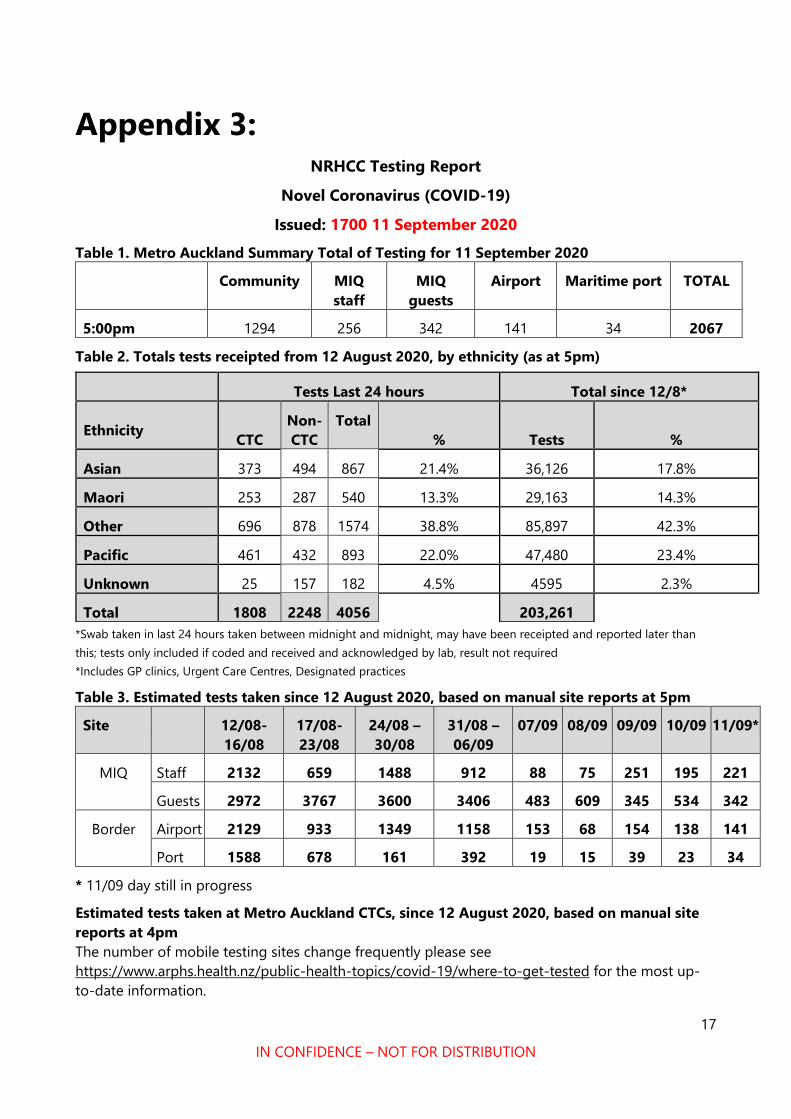
17
IN CONFIDENCE – NOT FOR DISTRIBUTION
Appendix 3: NRHCC Testing Report
Novel Coronavirus (COVID-19)
Issued: 1700 11 September 2020
Table 1. Metro Auckland Summary Total of Testing for 11 September 2020
Community MIQ
staff
MIQ
guests
Airport Maritime port TOTAL
5:00pm 1294 256 342 141 34 2067
Table 2. Totals tests receipted from 12 August 2020, by ethnicity (as at 5pm)
*Swab taken in last 24 hours taken between midnight and midnight, may have been receipted and reported later than
this; tests only included if coded and received and acknowledged by lab, result not required
*Includes GP clinics, Urgent Care Centres, Designated practices
Table 3. Estimated tests taken since 12 August 2020, based on manual site reports at 5pm
Site 12/08-
16/08
17/08-
23/08
24/08 –
30/08
31/08 –
06/09
07/09 08/09 09/09 10/09 11/09*
MIQ Staff 2132 659 1488 912 88 75 251 195 221
Guests 2972 3767 3600 3406 483 609 345 534 342
Border Airport 2129 933 1349 1158 153 68 154 138 141
Port 1588 678 161 392 19 15 39 23 34
* 11/09 day still in progress
Estimated tests taken at Metro Auckland CTCs, since 12 August 2020, based on manual site
reports at 4pm
The number of mobile testing sites change frequently please see
https://www.arphs.health.nz/public-health-topics/covid-19/where-to-get-tested for the most up-
to-date information.
Tests Last 24 hours Total since 12/8*
Ethnicity CTC
Non-
CTC
Total
% Tests %
Asian 373 494 867 21.4% 36,126 17.8%
Maori 253 287 540 13.3% 29,163 14.3%
Other 696 878 1574 38.8% 85,897 42.3%
Pacific 461 432 893 22.0% 47,480 23.4%
Unknown 25 157 182 4.5% 4595 2.3%
Total 1808 2248 4056 203,261

IN CONFIDENCE – NOT FOR DISTRIBUTION
18
Appendix 4: Testing by DHB and ethnicity The tables that follow are the number of people tested. The numbers in the laboratory testing
section are the number of laboratory tests processed. There is an error in the source data and these
results are from 12 August to 10 September. This is being rectified and the below table will be
updated when this has been corrected.
Table 8: Number of people tested for COVID-19 from 12 August to 10 September
Prioritised Ethnicity MPAO
DHB of Domicile Māori Pacific Asian Other Unknown Total
Auckland 3239 6680 8570 18618 326 37,433
Bay of Plenty 2417 271 525 6063 56 9332
Canterbury 1520 592 1570 12724 190 16,596
Capital and Coast 1359 1034 1215 8530 182 12,320
Counties Manukau 6836 18847 8343 11783 407 46,216
Hawkes Bay 1305 271 197 3354 49 5176
Hutt Valley 728 417 505 2883 38 4571
Lakes 2213 287 442 3033 84 6059
MidCentral 979 247 344 3973 78 5621
Nelson Marlborough 546 142 246 3909 49 4892
Northland 2906 196 241 3829 41 7213
South Canterbury 137 33 75 1597 13 1855
Southern 998 313 629 8975 78 10,993
Tairāwhiti 822 52 56 754 19 1703
Taranaki 650 63 154 2464 41 3372
Waikato 4074 957 1312 9423 200 15,966
Wairarapa 215 35 36 993 7 1286
Waitematā 4243 4476 6905 22644 289 38,557
West Coast 46 8 13 307 6 380
Whanganui 614 72 62 1374 14 2136
Unknown 1334 672 722 3855 1512 8095
Total 37,181 35,665 32,162 131,086 3679 239,773

19
IN CONFIDENCE – NOT FOR DISTRIBUTION
Table 9: Rate per 1000 people tested for COVID-19 from 12 August to 10 September
Prioritised Ethnicity MPAO
DHB of Domicile Māori Pacific Asian Other Total
Auckland 74.5 119.1 45.8 71.2 68.3
Bay of Plenty 40.4 61 26.8 38.5 38.7
Canterbury 29 41.7 25.8 28.5 28.9
Capital and Coast 37.2 46.6 24.2 40.1 38.3
Counties Manukau 76.8 156.9 55.2 56.3 81.2
Hawkes Bay 30.2 42.2 21.5 31 31
Hutt Valley 27.9 35.7 26.9 30.6 30.3
Lakes 57.5 112.3 45.4 50.6 54.7
MidCentral 26.9 44.5 22.2 32.1 31
Nelson Marlborough 34 57.5 33.1 31.1 32.2
Northland 47.8 52.1 29.1 35.1 39.7
South Canterbury 25.8 67.6 31.7 30.9 31
Southern 29.7 45.5 24.4 33.6 32.9
Tairāwhiti 33.2 46.5 48 34.1 34.6
Taranaki 27.8 45.2 24.7 27.4 27.9
Waikato 42.3 71.8 29.7 35 37.7
Wairarapa 27 42.1 28.9 27.8 28.1
Waitematā 67.8 100.4 48 59.2 60.9
West Coast 11.9 31.7 14.1 11.4 11.9
Whanganui 35.4 47.3 21.2 31.9 32.9
Total 47.8 111.5 42 42.3 48.3

1
IN CONFIDENCE – NOT FOR DISTRIBUTION
SITREP 051
Coronavirus disease 2019 (COVID-19)
Issued: 1030 hours 13 September 2020
Information current at: 1000 hours
This report provides a daily update on the COVID-19 health system response. New information is denoted by red text.
Please use the single point of contact email [email protected] for help/support. Your email will be
logged and promptly passed to the appropriate team.
This document is classified IN CONFIDENCE and not for further distribution.
Need to know
COMMUNITY CASES
NEW LAST 24 hrs
1
IMPORTED MIQ
CASES
NEW LAST 24 hrs
1
COMMUNITY CASES
TOTAL RECOVERED
119
105
COMMUNITY CASES
ACTIVE
58 TOTAL CASES SINCE 11 AUG
179
39
TOTAL IMPORTED MIQ CASES
144
TOTAL ACTIVE CASES IN NZ (COMMUNITY & MIQ): 97
IMPORTED MIQ CASES
TOTAL RECOVERED
IMPORTED MIQ CASES
ACTIVE
LABORATORY TESTS
12 September
7,211
LABORATORY TESTS
06 to 12 Sep
49,831
LABORATORY TESTS
TOTAL
864,469
CASES DECEASED
2

IN CONFIDENCE – NOT FOR DISTRIBUTION
2
Total COVID-19 cases
Table 1: Total number of COVID-19 cases as at 0900 13 September 2020
Case Status Active Recovered Deceased Total
Confirmed 97* (-11) 1330 (+13) 19 1446 (+2)
Probable 0 346 5 351
Total 97* (-11) 1676 (+13) 24 1797 (+2)
*2 new case identified, 13 cases classified as recovered.
Total community cases since 11 August
Table 2: Community cases by DHB and case status as at 0900 13 September 20201
New community cases since 0900 12 September 20202
1. One new community case has been reported, as at 0900 13 September.
o The case is a health worker at a quarantine facility in Auckland.
Community cases linked to the Auckland Community Cluster August 20203
2. 177 of the 179 community cases have been linked to the Auckland Community Cluster
August 2020, as at 0900 13 September. The unlinked cases are summarised as follows:
o The Rydges employee (this investigation has been closed).
o A case (reported 21 August) is still under investigation for an epidemiological link to
the community cluster and there is insufficient data to confirm a genomic link to the
community cluster (see 3).
Community cases under investigation to determine a link to the Auckland community
cluster
3. The case under investigation is summarised as follows:
o One case (reported 21 August) came through the border on 18 June. The case tested
negative at Day 3 and Day 12 of quarantine. The case subsequently tested positive
1 EpiSurv Database, 0900 10 September 2020
2 EpiSurv Database, 0900 11 September 2020
3 EpiSurv Database, 0900 11 September 2020
Case
Status
Counties Manukau Waitematā Auckland Waikato Total
Confirmed 76 55 (+1) 46 1 178 (+1)
Probable 1 0 0 0 1
Total 77 55 (+1) 46 1 179 (+1)

IN CONFIDENCE – NOT FOR DISTRIBUTION
3
on 21 August after being swabbed at a mobile testing clinic in Auckland. Despite
using two different whole genome sequencing protocols only a partial genome was
obtained. There is insufficient data to confirm the case is genomically linked to the
community cluster.4 Their epidemiological link to the community cluster is still under
investigation.
Community cases and household contacts at Jet Park
4. As at 0800 13 September there are 63 people isolating in Jet Park from the community.
38 are confirmed cases, the remaining 25 are household contacts. This number will
fluctuate as people finish their isolation and depart from the facility.5
MIQ cases since 0900 12 September 20206
5. There has been one new case detected at the border, as at 0900 13 September. In total
144 cases have been detected at the border since the establishment of MIFs/MIQs.
o The case arrived from South Africa on 08 September and is in managed isolation in
Canterbury.
Cases in hospital
6. As at 0800 11 September there are three cases in hospital with COVID-19.7
Table 3: Number of cases in hospital with COVID-19 by DHB as at 0800 13 September 2020
Health system response
Overall approach
7. Our investigation has two main focus areas that run in parallel:
o Source attribution – a focus on investigating the case with the earliest symptom
onset date to gather details actions of movements 14 days prior. This will help to
understand the possible source of the new outbreak.
4 ESR WGS report 03 September 2020
5 NRHCC Morning Report, 0900 13 September 2020
6 EpiSurv Database, 0900 13 September 2020
7 NRHCC Morning Report 13 September 2020 and COVID-19 Hospital Summary, 0900 12 September 2020
DHB Hospital Number in a general ward Number in ICU/HDU
Auckland Auckland City 1 0
Waitematā North Shore 0 1
Waikato Waikato 0 1
Total - 1 2

IN CONFIDENCE – NOT FOR DISTRIBUTION
4
o Containment – rigorous case investigation, identification of close contacts and
isolation and testing to ensure that chain of transmission is broken.
Current outbreak overview8
o There are two sub-clusters which most new community cases are linked to (Mount
Roskill Evangelical Church and Bereavements sub-clusters). There are 33 confirmed
cases in the Mount Roskill Evangelical Church sub-cluster and 15 confirmed cases in the
Bereavements sub-cluster.
Current outbreak investigation priorities
o Contact tracing and containment of Mount Roskill Evangelical Church sub-cluster and
recent bereavement events.
o Contact tracing and containment of Botany sub-cluster.
o Clarify whether June border case is a new infection and clarify strain.
o Seek to identify epidemiological link for index case in Mount Roskill Evangelical Church
sub-cluster.
o Waikato PHU will scope any positive cases in MIFs in the Auckland region for the next
week to alleviate some workload pressure at ARPHS.
Sub-clusters and settings of interest9
8. The new case in the community reported today is a healthcare worker in a quarantine
facility. The swab is being transported to ESR this morning for whole genome
sequencing on Monday 14 September. Scoping by ARPHS is underway to identify close
and casual contacts. The case is isolating at Jet Park facility. The case has three
household close contacts who are self-isolating at home. All staff at the quarantine
facility will be tested and staff who are considered close contacts have been stood
down. CCTV footage at the facility will be reviewed as part of the scoping process.
Community contact tracing is underway.10
9. On 7 September several exposure events were identified with epidemiological links to
Mt Roskill Evangelical Church sub-cluster. Between 24 August and 2 September there
were multiple gatherings associated with bereavement of a (non COVID-19 related)
death, including a funeral
10. A sub-cluster has been created to include cases whose source of infection occurred at
the bereavement events. There are 15 cases in the bereavement sub-cluster and 33
cases in the Mt Roskill Evangelical Church sub-cluster.
11. St Dominic’s College in Henderson, Auckland, was identified as a setting of interest on 8
September. A confirmed case linked to the bereavement sub-cluster
The school has
8 ARPHS Strategic Report 08 September 2020
9 ARPHS Strategic Report 08 September 2020
10 ARPHS text 1000 13 September 2020
s 9(2)(a)
s 9(2)(a)

IN CONFIDENCE – NOT FOR DISTRIBUTION
5
been informed and communications have been sent. A list of contacts has been
gathered by the school and includes 87 students and 11 teachers.11
12. A confirmed case linked to the bereavement sub-cluster worked as a bus driver for two
days while infectious but pre-symptomatic. wore a facemask and had 2m distance
from passengers due to AT policy. A contact tracing exercise based on HOP card data is
ongoing.
o 293 individuals rode these routes on 3 and 4 September, all of whom are casual
contacts. No individual rode the bus for more than two hours cumulatively over
these two days.
o There are two close contacts, they are in self-isolation.
13. All five of the confirmed cases in the Botany sub-cluster were in Jet Park but have been
released. Two workplaces associated with the Botany cases have been identified and
close contacts have been scoped. Three at one of the of a
case are close contacts and had been stood down, self-isolated, and tested negative. All
three have since been released from isolation. The second is related to a
case who is a and no close contacts were identified. Four members of one
of the families in the sub-cluster have had serology testing on 11 September, results
are pending.
14. ARPHS actions:12
o Maintain positive relationships with Church leaders and liaise with Church members
about their need for financial and welfare support if asked to isolate.
o Scope new cases.
o Quarantine and test household contacts of the new cases. Testing is underway for
household contacts, including repeat testing as needed for people previously tested
from the Mt Roskill church.
o Develop and implement a testing strategy which includes communication with
church leaders around the reason for testing and who should be tested.
o MoH have signed off on two medical officers of health to support ARPHS.
Case investigation
15. Source investigation for the epidemiological link to the main cluster for four cases that
have been genomically linked to the main cluster is ongoing:
o The
o GP
o The second Mount Albert Grammar student
11 ARPHS email 1800 11 September 2020
12 ARPHS Strategic Report 08 September 2020
s 9(2)(a)
s 9(2)(a)
s 9(2)(a)
s 9(2)(a)
s 9(2)(a)
s 9(2)(a)
s 9(2)(a)
s 9(2)(a)

IN CONFIDENCE – NOT FOR DISTRIBUTION
6
o The Botany case
Self-isolation compliance13
16. Discussions with a key representative from Ngaa Amokura have confirmed that the
option below will reinforce the trust/relationship between the health sector and the
fellowship whanau for supporting compliance with self-isolation requirements (to be
used if standard contact tracing cannot be established within 48 hrs).
o Engagement of the Kaimanaaki workforce (community champions employed by our
Maaori providers in the community). Kaimanaaki have access to clinical
support/advice. And will support and enable whaanau wellbeing through the
pandemic. They have specific skills to help whaanau cope with isolation. They are
also trained in the use of PPE so can make house visits and/or contact whaanau by
phone for the duration of their isolation. Daily contact is anticipated and Kaimanaaki
will report back to the DHB/public health officials on a daily basis. An
implementation plan is being developed and will be stood up from Monday.
13 ADHB Email, 1000 11 September 2020

7
IN CONFIDENCE – NOT FOR DISTRIBUTION
s 9(2)(a)
s 9(2)(a)

IN CONFIDENCE – NOT FOR DISTRIBUTION
8
s 9(2)(a)

IN CONFIDENCE – NOT FOR DISTRIBUTION
9
s 9(2)(a)

10
IN CONFIDENCE – NOT FOR DISTRIBUTION
ESR and wider testing14 17. ESR now has an arrangement in place with Massey University for genome sequencing.
ESR will still validate all results, however this arrangement is predicted to speed up
genome testing.
18. A further 34 community cases are genomically linked with the Auckland cluster. These
cases are from the following known sub-clusters; Church 1 (6 cases), Church 2 (4 cases),
Church 3 (9 cases), Finance Now HH (1 case), Americold HH (3 cases), Botany (4 cases),
(4 cases) and (3 cases).15
19.
20. Work is underway to analyse how the whole genome sequencing can be used to tell us
how COVID-19 has been transmitted through the community cluster and to further
inform its management.
21. No direct links have been found between the community outbreak genome
sequencing, with the 67 genomes currently available from cases in managed isolation
facilities (MIFs).
22.
Contact tracing16 23. Between 04 and 10 September 86% (357/413) of Community close contacts and 79%
(11/14) MIQ close contacts have been contacted within 48 hours of being determined
to be a contact. KPI for this metric is 80% of close contacts within 48 hours.
Table 5: Close contact tracing recorded in the National Contact Tracing Solution since 12 August as at
0900 11 September 2020
10/09/2020 11/09/2020 12/09/2020 13/09/2020
Number of close contacts
identified1 3372 3623 3647 3664
14 ESR Whole Genome Sequencing Report 02 September 2020, Email 1859 11 September 2020
15 ESR email update 0900 08 September 2020
16 COVID-19 NCCS Analytics and Reporting 0909 13 September 2020
s 9(2)(a) s 9(2)(a)
s 9(2)(g)(i)
s 9(2)(g)(i)

IN CONFIDENCE – NOT FOR DISTRIBUTION
11
Number of close contacts
successfully contacted (and are
self-isolating)
3354 3608 3640 3650
Number of close contacts
referred to "finding services"2 0 3 0 0
Number of close contacts
awaiting contact 18 12 7 14
1. Contacts loaded into the National Contact Tracing Solution, and managed by either the National Investigation
and Tracing Unit or the Public Health Units. Contacts from MIQ and overseas cases are not included in this
report.
2. "Finding services" refers to the mechanism the National Close Contact Service uses to find valid contact details
for close contacts we do not have the correct contact details for. These services utilise internal Ministry of Health
databases along with Police, Customs and Airlines where relevant.
3. The total number and number successfully contacted can decrease due to duplicates and invalid records being
removed from the system.
COVID-19 Tracer App usage17 Figure 1: COVID-19 Tracer App cumulative registered users and daily scans/manual entries as at 1045
12 September 2020
1. The number of scans and manual entries on any given date is subject to change for up to 31 days. This is because there can be
a delay before anonymised analytic information is received (e.g. device not connected to internet when scan carried out).
2. The number of App registrations and QR codes for any given date is subject to change for up to 1 day. This is because due to
reporting timeframes these numbers may be extracted before the 12pm cut-off for the reporting period.
17 Response Analyst – Digital Channels, 1056 12 September 2020
0
500,000
1,000,000
1,500,000
2,000,000
2,500,000
3,000,000
20/
05
23/
05
26/
05
29/
05
01/
06
04/
06
07/
06
10/
06
13/
06
16/
06
19/
06
22/
06
25/
06
28/
06
01/
07
04/
07
07/
07
10/
07
13/
07
16/
07
19/
07
22/
07
25/
07
28/
07
31/
07
03/
08
06/
08
09/
08
12/
08
15/
08
18/
08
21/
08
24/
08
27/
08
30/
08
02/
09
05/
09
08/
09
11/
09
Usa
ge
Day and month
Cumulative App registrations Daily scans and manual entries

IN CONFIDENCE – NOT FOR DISTRIBUTION
12
Testing18 Table 6: Testing by functional groups, as at 0900 13 September 2020
*Numbers have been sourced from different data extracts in comparison to Table 7.
Laboratory testing numbers19 Table 7: Number of laboratory tests processed nationally as at 0900 13 September 2020
Testing supply update20
24. There are no issues with regent supplies, and hologic supplies are now in labs around
the country. There are 43 days of reagent stocks on hand nationally.
18 ÉCLAIR/MoH Public Health Intelligence, 1012 13 September 2020
19 Daily Lab Report, 0834 13 September 2020
20 Testing supply email, 1001 09 September 2020
Reason for test 12 September 06 – 12 September
GPs and other primary health 3515 20856
CBACs and pop-ups 2824 23659
Border workers - air crew 21 214
Border workers - airport staff 205 1113
Border workers - maritime crew 0 1
Border workers – Port of Tauranga staff 0 127
Border workers – Remaining Port staff 19 222
Border workers - MIF 226 946
Border workers - MIQ 54 325
Travellers - Staying at MIF 186 2196
Travellers - Staying at MIQ 161 242
Total 7211 49901
Time period Number of laboratory tests
12 September 7211
Last 7 days (06 Sep to 12 Sep) 49,831
Total 864,469

IN CONFIDENCE – NOT FOR DISTRIBUTION
13
Testing activity by region
Focus areas
25. As at 1700 08 September there are 28 Community testing Centres in the Metro
Auckland area. Three of these are closed CTC's for close contacts only.21
Healthline updates22 26. On 12 September there were 2,354 contacts in Healthline. Of those calls, 1,082 were to
the COVID-19 Info line. Demand on 1737 Need to talk? and other mental health services
was 545 contacts (lower than forecast).
27. The main themes yesterday/today:
o Most of the callers are calling because they are symptomatic and want to get a test,
o Calls relating to the latest exposure events,
o Confusion around Alert Level rules (i.e. crowd sizes in Auckland, around the rest of
the country etc) it is recommended to reemphasise this given recent media
confusion.
Logistics
Health Workforce23
28. Health Workforce have identified a small group of people on the surge workforce who
have indicated they would be willing to work in an ARC facility in the event of an
outbreak – this week we will work on whether this pool can be expanded and actions to
keep the group “warm” in the event ARC employers require them.
29. Upskilling of alternative workforces for testing continues to progress, including plans
for a training package and scoping of micro-credentialing, in addition to understanding
where this workforce would be obtained from. It is anticipated this training package will
be available within four weeks (estimated).
30. Health Workforce continue to work with TAS and all 20 GMsHR on workforce needs and
issues – regular workforce intelligence information will be provided to Health
Workforce, which will be incorporated into frequent dashboard reports.
21 Community Testing Centres report, 1800 08 September 2020
22 National Telehealth Service Coronavirus Update, 0933 13 September 2020
23 Health Workforce Directorate, 0832 01 September 2020
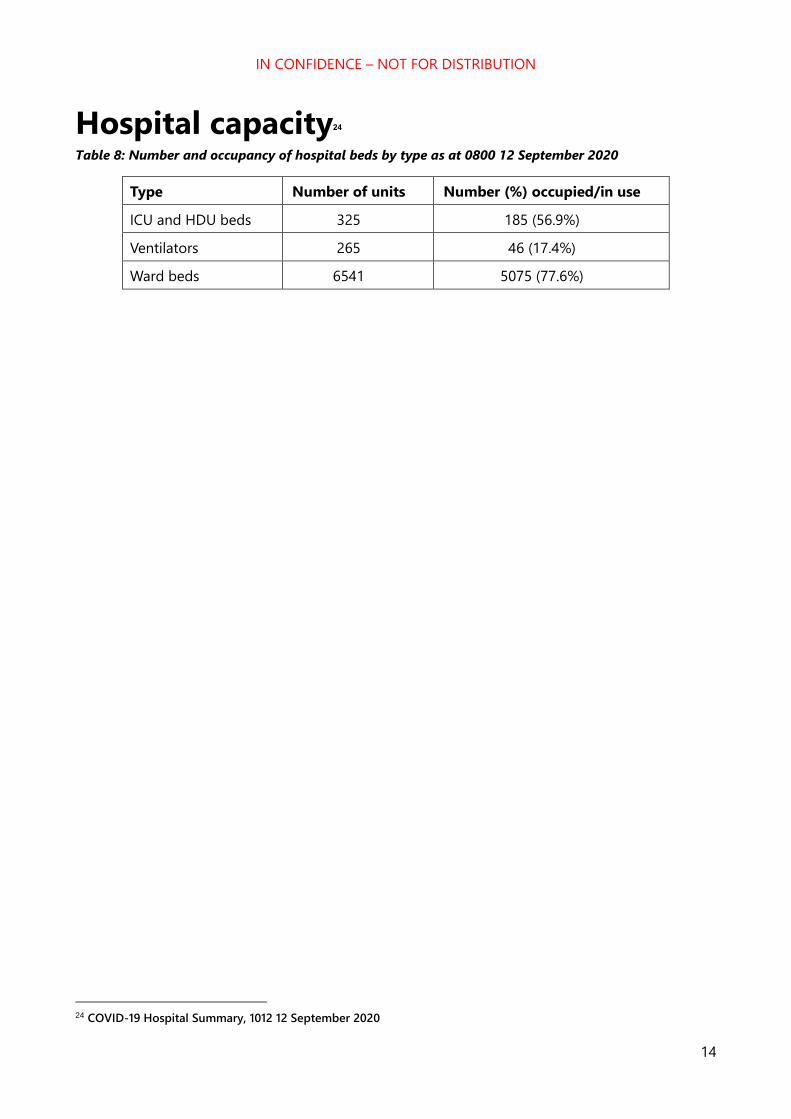
IN CONFIDENCE – NOT FOR DISTRIBUTION
14
Hospital capacity24 Table 8: Number and occupancy of hospital beds by type as at 0800 12 September 2020
Type Number of units Number (%) occupied/in use
ICU and HDU beds 325 185 (56.9%)
Ventilators 265 46 (17.4%)
Ward beds 6541 5075 (77.6%)
24 COVID-19 Hospital Summary, 1012 12 September 2020

15
IN CONFIDENCE – NOT FOR DISTRIBUTION
Appendix 1: Case summary Table 9: All community cases reported between 0900 12 September and 0900 13 September. Source: ESR EpiSurv Estract 0900 13 September 2020
s 9(2)(a)

16
IN CONFIDENCE – NOT FOR DISTRIBUTION
Appendix 2: COVID-19 Provisional Disease Indicators, by date
of case notification16 Table 10:NCTS data for cases in the community
Indicator (as per Table
9832) Refined Indicator description Target 5 Sept ** 6 Sept 7 Sept 8 Sept 9 Sept ** 10 Sept ** 11 Sept **
1 - (S001) Time from exposure to contact isolation / quarantine 80% within 96 hours
- 100% 27% 4% - - -
2 – (S002) Time from case first symptom to contact isolation / quarantine 80% within 96 hours
- 0% *
(0/2) 70% 4% - - -
3 – (S003) Time from test sample taken to close contact isolation / quarantine
80% within 72 hours
- 100% 74% 4% 100% - -
4 – (C001) Time from first symptom to test sample taken for positive cases 80% within 48 hours
100% 50% 50% 33% 0% *
(0/1) 100% -
5 – (L001) Time from test sample taken to notification of positive result 80% within 24 hours
0% *
(0/1) 20% 75% 80%
0% *
(0/2) 100% 67%
6 – (P002) Time from case notification to isolation / quarantine of contact 80% within 48 hours
- 100% 84% 87% 100% 100% -
7 – (P001) Time from notification to case interview 80% within 24 hours
100% 100% 100% 100% 100% 100% 100%
8 – (P003) Time from close contact identification to isolated / quarantined 80% within 24 hours
- 100% 89% 97% 100% 100% 94%
10 – (P004) Proportion of contacts traced in 48 hours 80% within 48 hours
- 100% 91% 88% 100% 100% -
C – (S005) Proportion of close contacts with confirmed or suspected COVID-19 at the time of tracing <20% - 0% 4% 1% 0% 0% 0%
• * The numerator and denominator are provided in some instances to provide context for low percentages.
• **Data is not available for metrics where there is no data that meets the definition, or where the time/days to reach target has not fully elapsed
• The value of P002 can drop due to the addition of new close contacts to exposure events after the 48-hour period since case notification had elapsed. This can happen for a number of reasons, including a case recalling further details following the original case
interview.
• These metrics report all cases during the specified period, including those in Managed Isolation and Quarantine, and do not include casual contacts.

IN CONFIDENCE – NOT FOR DISTRIBUTION
17
• There are three additional indicators under development requiring both technical and clinical input to define data requirements. These are due to be completed by end October 2020.
Table 11: NCTS data for cases in the community Managed Isolation and Quarantine, International, and Unknown
Indicator (as per Table 9832) Refined Indicator description Target 5 Sept ** 6 Sept ** 7 Sept ** 8 Sept ** 9 Sept ** 10 Sept ** 11 Sept **
1 - (S001) Time from exposure to contact isolation / quarantine
80% within 96 hours
- - - - - - -
2 – (S002) Time from case first symptom to contact isolation / quarantine
80% within 96 hours
- - - - - - -
3 – (S003) Time from test sample taken to close contact isolation / quarantine
80% within 72 hours
- 100% 100% - 100% - -
4 – (C001) Time from first symptom to test sample taken for positive cases
80% within 48 hours
- - - - 0% * (0/1)
- -
5 – (L001) Time from test sample taken to notification of positive result
80% within 24 hours
- 0% * (0/2)
100% - 100% - -
6 – (P002) Time from case notification to isolation / quarantine of contact
80% within 48 hours
- 100% 100% - 100% - -
7 – (P001) Time from notification to case interview 80% within 24 hours
- 100% 100% - 100% - -
8 – (P003) Time from close contact identification to isolated / quarantined
80% within 24 hours
- 100% 100% - 100% - -
10 – (P004) Proportion of contacts traced in 48 hours 80% within 48 hours
- 100% 100% - 100% - -
C – (S005) Proportion of close contacts with confirmed or suspected COVID-19 at the time of tracing
<20% - 0% 0% - 0% - -
Note:
• * The numerator and denominator are provided in some instances to provide context for low percentages.
• **Data is not available for metrics where there is no data that meets the definition, or where the time/days to reach target has not fully elapsed
• The value of P002 can drop due to the addition of new close contacts to exposure events after the 48-hour period since case notification had elapsed. This can happen for a number of reasons, including a case recalling further details following the original case
interview.
• These metrics report all cases during the specified period, including those in Managed Isolation and Quarantine, and do not include casual contacts.
• There are three additional indicators under development requiring both technical and clinical input to define data requirements. These are due to be completed by end October 2020.

18
IN CONFIDENCE – NOT FOR DISTRIBUTION
Appendix 3: NRHCC Testing Report
Novel Coronavirus (COVID-19) Table 12: Metro Auckland Summary Total of Testing for 11 September 2020
Community MIQ
staff
MIQ
guests
Airport Maritime port TOTAL
5:00pm 1294 256 342 141 34 2067
Table 13: Totals tests receipted from 12 August 2020, by ethnicity (as at 5pm)
*Swab taken in last 24 hours taken between midnight and midnight, may have been receipted and reported later than
this; tests only included if coded and received and acknowledged by lab, result not required
*Includes GP clinics, Urgent Care Centres, Designated practices
Table 14: Estimated tests taken since 12 August 2020, based on manual site reports at 5pm
Site 12/08-
16/08
17/08-
23/08
24/08 –
30/08
31/08 –
06/09
07/09 08/09 09/09 10/09 11/09*
MIQ Staff 2132 659 1488 912 88 75 251 195 221
Guests 2972 3767 3600 3406 483 609 345 534 342
Border Airport 2129 933 1349 1158 153 68 154 138 141
Port 1588 678 161 392 19 15 39 23 34
* 11/09 day still in progress
CTCs and mobile testing site locations
Please see https://www.arphs.health.nz/public-health-topics/covid-19/where-to-get-tested for the
most up-to-date information on CTCs and mobile testing sites in the Auckland region.
Tests Last 24 hours Total since 12/8*
Ethnicity CTC
Non-
CTC
Total
% Tests %
Asian 373 494 867 21.4% 36,126 17.8%
Maori 253 287 540 13.3% 29,163 14.3%
Other 696 878 1574 38.8% 85,897 42.3%
Pacific 461 432 893 22.0% 47,480 23.4%
Unknown 25 157 182 4.5% 4595 2.3%
Total 1808 2248 4056 203,261

IN CONFIDENCE – NOT FOR DISTRIBUTION
19
Appendix 4: Testing by DHB and ethnicity The tables that follow are the number of people tested. The numbers in the laboratory testing
section are the number of laboratory tests processed.
Table 15: Number of people tested for COVID-19 from 12 August to 12 September
Prioritised Ethnicity MPAO
DHB of Domicile Māori Pacific Asian Other Unknown Total
Auckland 3393 6974 9094 19625 365 39451
Bay of Plenty 2549 287 555 6442 56 9889
Canterbury 1596 623 1709 13384 209 17521
Capital and Coast 1452 1099 1354 9092 197 13194
Counties Manukau 7196 19593 8893 12433 423 48538
Hawkes Bay 1376 284 212 3504 54 5430
Hutt Valley 793 462 542 3095 40 4932
Lakes 2288 299 452 3142 93 6274
MidCentral 1014 251 358 4125 81 5829
Nelson Marlborough 581 174 258 4193 52 5258
Northland 3028 207 256 4003 45 7539
South Canterbury 145 34 77 1717 11 1984
Southern 1074 338 682 9696 85 11875
Tairāwhiti 853 54 63 779 21 1770
Taranaki 677 67 168 2587 44 3543
Waikato 4262 980 1456 9992 224 16914
Wairarapa 231 37 45 1075 8 1396
Waitematā 4664 5078 7932 24607 315 42596
West Coast 47 10 13 326 6 402
Whanganui 639 77 68 1426 14 2224
Unknown 1388 697 698 4090 1741 8614
Total 39246 37625 34885 139334 4084 255174

20
IN CONFIDENCE – NOT FOR DISTRIBUTION
Table 16: Rate per 1000 people tested for COVID-19 from 12 August to 12 September
Prioritised Ethnicity MPAO
DHB of Domicile Māori Pacific Asian Other Total
Auckland 78 124.4 48.6 75.1 72
Bay of Plenty 42.6 64.6 28.3 40.9 41
Canterbury 30.4 43.9 28.1 30 30.5
Capital and Coast 39.8 49.6 27 42.7 41
Counties Manukau 80.8 163.2 58.8 59.4 85.2
Hawkes Bay 31.8 44.3 23.1 32.4 32.5
Hutt Valley 30.4 39.6 28.9 32.8 32.7
Lakes 59.5 117 46.5 52.4 56.7
MidCentral 27.9 45.2 23.1 33.3 32.2
Nelson Marlborough 36.2 70.4 34.8 33.3 34.6
Northland 49.8 55.1 31 36.7 41.5
South Canterbury 27.3 69.6 32.5 33.2 33.2
Southern 32 49.1 26.4 36.2 35.6
Tairāwhiti 34.4 48.3 54 35.2 36
Taranaki 29 48.1 27 28.8 29.3
Waikato 44.2 73.5 33 37.1 40
Wairarapa 29 44.5 36.1 30.1 30.5
Waitematā 74.5 113.9 55.2 64.3 67.3
West Coast 12.1 39.6 14.1 12.1 12.5
Whanganui 36.8 50.6 23.2 33.1 34.3
Total 50.5 117.6 45.5 45 51.4

1
IN CONFIDENCE – NOT FOR DISTRIBUTION
SITREP 052
Coronavirus disease 2019 (COVID-19)
Issued: 1030 hours 14 September 2020
Information current at: 1000 hours
This report provides a daily update on the COVID-19 health system response. New information is denoted by red text.
Please use the single point of contact email [email protected] for help/support. Your email will be
logged and promptly passed to the appropriate team.
This document is classified IN CONFIDENCE and not for further distribution.
Need to know
COMMUNITY CASES
NEW LAST 24 hrs
1
IMPORTED MIQ
CASES
NEW LAST 24 hrs
0
COMMUNITY CASES
TOTAL RECOVERED
121
105
COMMUNITY CASES
ACTIVE
57 TOTAL CASES SINCE 11 AUG
180
39
TOTAL IMPORTED MIQ CASES
144
TOTAL ACTIVE CASES IN NZ (COMMUNITY & MIQ): 96
IMPORTED MIQ CASES
TOTAL RECOVERED
IMPORTED MIQ CASES
ACTIVE
LABORATORY TESTS
LAST 24 hrs
3,573
LABORATORY TESTS
LAST SEVEN DAYS
49,413
LABORATORY TESTS
TOTAL
868,042
CASES DECEASED
2

IN CONFIDENCE – NOT FOR DISTRIBUTION
2
Total COVID-19 cases
Table 1: Total number of COVID-19 cases as at 0900 14 September 2020
Case Status Active Recovered Deceased Total
Confirmed 96* (-1) 1332 (+2) 19 1447 (+1)
Probable 0 346 5 351
Total 96* (-1) 1678 (+2) 24 1798 (+1)
*1 new case identified, 2 cases classified as recovered.
Total community cases since 11 August
Table 2: Community cases by DHB and case status as at 0900 14 September 20201
New community cases since 0900 13 September 20202
1. One new community case has been reported, as at 0900 14 September.
o The case has an epidemiological link to an existing case associated with the Botany
sub-cluster. The case is and has been in isolation since 30 August due
to household contact being a confirmed case.
Community cases linked to the Auckland Community Cluster August 20203
2. 177 of the 180 community cases have been linked to the Auckland Community Cluster
August 2020, as at 0900 14 September. The unlinked cases are summarised as follows:
o The Rydges employee (this investigation has been closed).
o A case (reported 21 August) is still under investigation for an epidemiological link to
the community cluster and there is insufficient data to confirm a genomic link to the
community cluster (see 3).
o The quarantine facility healthcare worker case reported 13 September is currently
under investigation for an epidemiological and genomic link. Genomic sequencing is
currently underway with ESR.
1 EpiSurv Database, 0900 14 September 2020
2 EpiSurv Database, 0900 14 September 2020
3 EpiSurv Database, 0900 14 September 2020
Case
Status
Counties Manukau Waitematā Auckland Waikato Total
Confirmed 77 (+1) 55 46 1 179 (+1)
Probable 1 0 0 0 1
Total 78 (+1) 55 46 1 180 (+1)
s 9(2)(a)

IN CONFIDENCE – NOT FOR DISTRIBUTION
3
Community cases under investigation to determine a link to the Auckland community
cluster
3. The case under investigation is summarised as follows:
o One case (reported 21 August) came through the border on 18 June. The case tested
negative at Day 3 and Day 12 of quarantine. The case subsequently tested positive
on 21 August after being swabbed at a mobile testing clinic in Auckland. Despite
using two different whole genome sequencing protocols only a partial genome was
obtained. There is insufficient data to confirm the case is genomically linked to the
community cluster.4 Their epidemiological link to the community cluster is still under
investigation.
Community cases and household contacts at Jet Park
4. As at 0800 14 September there are 53 people isolating in Jet Park from the community.
29 are confirmed cases, the remaining 24 are household contacts. This number will
fluctuate as people finish their isolation and depart from the facility.5
MIQ cases since 0900 13 September 20206
5. There have been no new cases detected at the border, as at 0900 14 September. In
total 144 cases have been detected at the border since the establishment of
MIFs/MIQs.
Cases in hospital
6. As at 0800 14 September there are three cases in hospital with COVID-19.7
Table 3: Number of cases in hospital with COVID-19 by DHB as at 0800 14 September 2020
4 ESR WGS report 03 September 2020
5 NRHCC Morning Report, 0900 14 September 2020
6 EpiSurv Database, 0900 14 September 2020
7 NRHCC Morning Report 14 September 2020 and COVID-19 Hospital Summary, 0900 14 September 2020
DHB Hospital Number in a general ward Number in ICU/HDU
Auckland Auckland City 1 0
Waitematā North Shore 0 1
Waikato Waikato 0 1
Total - 1 2

IN CONFIDENCE – NOT FOR DISTRIBUTION
4
Health system response
Overall approach
7. Our investigation has two main focus areas that run in parallel:
o Source attribution – a focus on investigating the case with the earliest symptom
onset date to gather details actions of movements 14 days prior. This will help to
understand the possible source of the new outbreak.
o Containment – rigorous case investigation, identification of close contacts and
isolation and testing to ensure that chain of transmission is broken.
Current outbreak overview8
o There are two sub-clusters which most new community cases are linked to (Mount
Roskill Evangelical Church and Bereavements sub-clusters). There are 33 confirmed
cases in the Mount Roskill Evangelical Church sub-cluster and 15 confirmed cases in the
Bereavements sub-cluster.
Current outbreak investigation priorities
o Contact tracing and containment of Mount Roskill Evangelical Church sub-cluster and
recent bereavement events.
o Contact tracing and containment of Botany sub-cluster.
o Clarify whether June border case is a new infection and clarify strain.
o Seek to identify epidemiological link for index case in Mount Roskill Evangelical Church
sub-cluster.
o Waikato PHU will scope any positive cases in MIFs in the Auckland region for the next
week to alleviate some workload pressure at ARPHS.
Sub-clusters and settings of interest9
8. A healthcare worker at Jet Park was reported 13 September Sitrep. The swab is with ESR
for whole genome sequencing. Scoping by ARPHS is underway to identify close and
casual contacts. The case is isolating at Jet Park facility. The case has five household
close contacts who are self-isolating at home. Four of five household contacts have
returned negative test results, one is pending. All staff at Jet Park will be tested and
staff who are considered close contacts have been stood down. Testing is underway
and results are pending. CCTV footage at the facility will be reviewed as part of the
scoping process. Community contact tracing is underway.10 As at 0800 14 September
there has been close contacts identified at three exposure events at Les Mills gym
8 ARPHS Strategic Report 08 September 2020
9 ARPHS Strategic Report 08 September 2020
10 ARPHS text 1000 13 September 2020

IN CONFIDENCE – NOT FOR DISTRIBUTION
5
classes on 9 and 10 September. Contacts at exposure events at The Warehouse,
Starbucks and Countdown are all considered casual contacts only.11
9. On 7 September several exposure events were identified with epidemiological links to
Mt Roskill Evangelical Church sub-cluster. Between 24 August and 2 September there
were multiple gatherings associated with bereavement of a (non COVID-19 related)
death, including a funeral on . Active monitoring and follow up of
compliance with self-isolation is ongoing with contacts associated with these events.12
10. A sub-cluster has been created to include cases whose source of infection occurred at
the bereavement events. There are 15 cases in the bereavement sub-cluster and 33
cases in the Mt Roskill Evangelical Church sub-cluster.
11. St Dominic’s College in Henderson, Auckland, was identified as a setting of interest on 8
September. A confirmed case linked to the bereavement sub-cluster
The school has
been informed and communications have been sent. A list of contacts has been
gathered by the school and includes 87 students and 11 teachers.13 The school will be
reopened today (14 September) and casual contacts will be able to attend.14
12. A confirmed case linked to the bereavement sub-cluster worked as a bus driver for two
days while infectious but pre-symptomatic. wore a facemask and had 2m distance
from passengers due to Auckland Transport policy. A contact tracing exercise based on
HOP card data is ongoing.
o 293 individuals rode these routes on 3 and 4 September, all of whom are casual
contacts. No individual rode the bus for more than two hours cumulatively over
these two days.
o There are two close contacts, they are in self-isolation.
13. All five of the confirmed cases in the Botany sub-cluster were in Jet Park but have been
released. Two workplaces associated with the Botany cases have been identified and
close contacts have been scoped. Three at one of the of a
case are close contacts and had been stood down, self-isolated, and tested negative. All
three have since been released from isolation. The second is related to a
case who is a and no close contacts were identified. Four members of one
of the families in the sub-cluster have had serology testing on 11 September, results
are pending.
14. ARPHS actions:15
o Maintain positive relationships with Church leaders and liaise with Church members
about their need for financial and welfare support if asked to isolate.
o Scope new cases.
11 NRHCC Morning Report 0900 14 September 2020
12 NRHCC Morning Report 0900 14 September 2020
13 ARPHS email 1800 11 September 2020
14 NRHCC Morning Report 0900 14 September 2020
15 ARPHS Strategic Report 08 September 2020
s 9(2)(a)
s 9(2)(a)
s 9(2)(a)
s 9(2)(a)
s 9(2)(a)
s 9(2)(a)
s 9(2)(a)
s 9(2)(a)

IN CONFIDENCE – NOT FOR DISTRIBUTION
6
o Quarantine and test household contacts of the new cases. Testing is underway for
household contacts, including repeat testing as needed for people previously tested
from the Mt Roskill church.
o Develop and implement a testing strategy which includes communication with
church leaders around the reason for testing and who should be tested.
o MoH have signed off on two medical officers of health to support ARPHS.
Case investigation
15. Source investigation for the epidemiological link to the main cluster for four cases that
have been genomically linked to the main cluster is ongoing:
o The
o GP
o The second Mount Albert Grammar student
o The Botany case
Self-isolation compliance16
16. Discussions with a key representative from Ngaa Amokura have confirmed that the
option below will reinforce the trust/relationship between the health sector and the
fellowship whanau for supporting compliance with self-isolation requirements (to be
used if standard contact tracing cannot be established within 48 hrs).
o Engagement of the Kaimanaaki workforce (community champions employed by our
Māori providers in the community). Kaimanaaki have access to clinical
support/advice. And will support and enable whaanau wellbeing through the
pandemic. They have specific skills to help whaanau cope with isolation. They are
also trained in the use of PPE so can make house visits and/or contact whaanau by
phone for the duration of their isolation. Daily contact is anticipated and Kaimanaaki
will report back to the DHB/public health officials on a daily basis. An
implementation plan is being developed and will be stood up from Monday.
16 ADHB Email, 1000 11 September 2020
s 9(2)(a)
s 9(2)(a)

7
IN CONFIDENCE – NOT FOR DISTRIBUTION
1.
s 9(2)(a)
s 9(2)(a)

IN CONFIDENCE – NOT FOR DISTRIBUTION
8
s 9(2)(a)

9
IN CONFIDENCE – NOT FOR DISTRIBUTION
ESR and wider testing17 17. ESR now has an arrangement in place with Massey University for genome sequencing.
ESR will still validate all results, however this arrangement is predicted to speed up
genome testing.
18. A further 34 community cases are genomically linked with the Auckland cluster. These
cases are from the following known sub-clusters; Church 1 (6 cases), Church 2 (4 cases),
Church 3 (9 cases), Finance Now HH (1 case), Americold HH (3 cases), Botany (4 cases),
(4 cases) and (3 cases).18
19.
20. Work is underway to analyse how the whole genome sequencing can be used to tell us
how COVID-19 has been transmitted through the community cluster and to further
inform its management.
21. No direct links have been found between the community outbreak genome
sequencing, with the 67 genomes currently available from cases in managed isolation
facilities (MIFs).
22.
23. Genomic sequencing of the Jet Park case is under way.
Contact tracing19 24. Between 05 and 11 September 89% (372/418) of Community close contacts and 100%
(9/9) MIQ close contacts have been contacted within 48 hours of being determined to
be a contact. KPI for this metric is 80% of close contacts within 48 hours.
Table 5: Close contact tracing recorded in the National Contact Tracing Solution since 12 August as at
0830 14 September 2020
11/09/2020 12/09/2020 13/09/2020 14/09/2020
Number of close contacts
identified1 3623 3647 3664 3708
17 ESR Whole Genome Sequencing Report 02 September 2020, Email 1859 11 September 2020
18 ESR email update 0900 08 September 2020
19 COVID-19 NCCS Analytics and Reporting 0846 14 September 2020
s 9(2)(a)s 9(2)(a)
s 9(2)(g)(i)
s 9(2)(g)(i)

IN CONFIDENCE – NOT FOR DISTRIBUTION
10
Number of close contacts
successfully contacted (and are
self-isolating)
3608 3640 3650 3697
Number of close contacts
referred to "finding services"2 3 0 0 0
Number of close contacts
awaiting contact 12 7 14 11
1. Contacts loaded into the National Contact Tracing Solution, and managed by either the National Investigation
and Tracing Unit or the Public Health Units. Contacts from MIQ and overseas cases are not included in this
report.
2. "Finding services" refers to the mechanism the National Close Contact Service uses to find valid contact details
for close contacts we do not have the correct contact details for. These services utilise internal Ministry of Health
databases along with Police, Customs and Airlines where relevant.
3. The total number and number successfully contacted can decrease due to duplicates and invalid records being
removed from the system.
COVID-19 Tracer App usage20 Figure 1: COVID-19 Tracer App cumulative registered users and daily scans/manual entries as at 0835
14 September 2020
1. The number of scans and manual entries on any given date is subject to change for up to 31 days. This is because there can be
a delay before anonymised analytic information is received (e.g. device not connected to internet when scan carried out).
2. The number of App registrations and QR codes for any given date is subject to change for up to 1 day. This is because due to
reporting timeframes these numbers may be extracted before the 12pm cut-off for the reporting period.
20 Response Analyst – Digital Channels, 1056 13 September 2020
0
500,000
1,000,000
1,500,000
2,000,000
2,500,000
0
500,000
1,000,000
1,500,000
2,000,000
2,500,000
20/0
523
/05
26/0
529
/05
01/0
604
/06
07/0
610
/06
13/0
616
/06
19/0
622
/06
25/0
628
/06
01/0
704
/07
07/0
710
/07
13/0
716
/07
19/0
722
/07
25/0
728
/07
31/0
703
/08
06/0
809
/08
12/0
815
/08
18/0
821
/08
24/0
827
/08
30/0
802
/09
05/0
908
/09
11/0
9
Da
ily
sca
ns
an
d m
an
ua
l e
ntr
ies
Cu
mu
lati
ve
Ap
p r
eg
istr
ati
on
s
Day and month
Cumulative App registrations Daily scans and manual entries

IN CONFIDENCE – NOT FOR DISTRIBUTION
11
Testing21 Table 6: Testing by functional groups, as at 0900 14 September 2020
*Numbers have been sourced from different data extracts in comparison to Table 7.
Laboratory testing numbers22 Table 7: Number of laboratory tests processed nationally as at 0900 14 September 2020
Testing supply update23
25. There are no issues with regent supplies, and hologic supplies are now in labs around
the country. There are 43 days of reagent stocks on hand nationally.
21 ÉCLAIR/MoH Public Health Intelligence, 0954 14 September 2020
22 Daily Lab Report, 0834 13 September 2020
23 Testing supply email, 1001 09 September 2020
Reason for test 13 September 07 – 13 September
GPs and other primary health 1528 19,386
CBACs and pop-ups 1541 24,694
Border workers - air crew 25 234
Border workers - airport staff 139 1143
Border workers - maritime crew 0 0
Border workers – Port of Tauranga staff 1 51
Border workers – Remaining Port staff 4 154
Border workers - MIF 108 978
Border workers - MIQ 83 426
Travellers - Staying at MIF 141 2248
Travellers - Staying at MIQ 3 241
Total 3573 49,555
Time period Number of laboratory tests
13 September 3573
Last 7 days (07 Sep to 13 Sep) 49,413
Total 868,042

IN CONFIDENCE – NOT FOR DISTRIBUTION
12
Testing activity by region
Focus areas
26. As at 1700 08 September there are 28 Community testing Centres in the Metro
Auckland area. Three of these are closed CTC's for close contacts only.24
Healthline updates25 27. On 13 September there were 2,590 contacts in Healthline. Of those calls, 1,112 were to
the COVID-19 Info line. Demand on 1737 Need to talk? and other mental health services
was 605 contacts (lower than forecast).
28. The main themes yesterday/today:
o National Telehealth Service (Healthline) received over 160 calls related to the
exposures in the community at Les Mills and the locations in Milford. From these
calls we have identified 53 casual contacts and 87 close contacts who have been sent
to the contact tracing service and referred for testing. A number of close contacts
reported being symptomatic.
o Over the weekend in response to various media items we had a number of calls from
the public expressing anger towards the lack of compliance by various religious
groups and close contacts not being honest with officials during interviews.
o Most of the general public Service Users were calling because they are symptomatic
and wanted to be tested.
o Calls relating to the latest exposure events
o Confusion around alert leave rules (i.e. crowd sizes in Auckland, around the rest of
the country etc).
Logistics
Health Workforce26
29. Health Workforce continue to work with employers who have expressed a need for
assistance with identifying people who are willing to work within the health system and
to provide some relief from COVID-19 related staffing issues.
30. Upskilling of alternative workforces for testing continues to progress. Health Workforce
are currently engaged with Careerforce and DHBs to create a testing workforce training
and education package. This will be utilised by DHBs across the country, to increase the
pool of people who are able to perform COVID-19 testing. Following on from the
24 Community Testing Centres report, 1800 08 September 2020
25 National Telehealth Service Coronavirus Update, 0937 14 September 2020
26 Health Workforce Directorate, 0945 14 September 2020

IN CONFIDENCE – NOT FOR DISTRIBUTION
13
didactic component, will be practical training and assessment, which will continue to be
provided by the relevant DHB.
31. Health Workforce are monitoring staffing needs in MIFs facilities and are providing
support where possible.
Hospital capacity27 Table 8: Number and occupancy of hospital beds by type as at 0800 14 September 2020
Type Number of units Number (%) occupied/in use
ICU and HDU beds 355 178 (50.1%)
Ventilators 314 55 (17.5%)
Ward beds 7502 5706 (76.1%)
27 COVID-19 Hospital Summary, 0916 14 September 2020

14
IN CONFIDENCE – NOT FOR DISTRIBUTION
Appendix 1: Case summary Table 9: All community cases reported between 0900 13 September and 0900 14 September. Source: ESR EpiSurv Extract 0900 14 September 2020
s 9(2)(a)

15
IN CONFIDENCE – NOT FOR DISTRIBUTION
Appendix 2: COVID-19 Provisional Disease Indicators, by date
of case notification19 Table 10:NCTS data for cases in the community
Indicator (as per Table
9832) Refined Indicator description Target 6 Sept 7 Sept 8 Sept 9 Sept 10 Sept ** 11 Sept ** 12 Sept **
1 - (S001) Time from exposure to contact isolation / quarantine 80% within 96 hours
100% 27% 4% 0% *
(0/4) - - -
2 – (S002) Time from case first symptom to contact isolation / quarantine 80% within 96 hours
0% *
(0/2) 70% 4%
0% *
(0/4) - - -
3 – (S003) Time from test sample taken to close contact isolation / quarantine
80% within 72 hours
100% 80% 4% 100% 100% - -
4 – (C001) Time from first symptom to test sample taken for positive cases 80% within 48 hours
50% 50% 33% 0% *
(0/1) 100% 67% -
5 – (L001) Time from test sample taken to notification of positive result 80% within 24 hours
20% 75% 80% 0% *
(0/2) 100% 67% 100%
6 – (P002) Time from case notification to isolation / quarantine of contact 80% within 48 hours
100% 90% 87% 100% 100% 94% -
7 – (P001) Time from notification to case interview 80% within 24 hours
100% 100% 100% 100% 100% 100% 100%
8 – (P003) Time from close contact identification to isolated / quarantined 80% within 24 hours
100% 96% 97% 100% 100% 94% 89%
10 – (P004) Proportion of contacts traced in 48 hours 80% within 48 hours
100% 98% 88% 100% 100% 94% -
C – (S005) Proportion of close contacts with confirmed or suspected COVID-19 at the time of tracing <20% 0% 4% 1% 0% 0% 0% 0%
• * The numerator and denominator are provided in some instances to provide context for low percentages.
• **Data is not available for metrics where there is no data that meets the definition, or where the time/days to reach target has not fully elapsed
• The value of P002 can drop due to the addition of new close contacts to exposure events after the 48-hour period since case notification had elapsed. This can happen for a number of reasons, including a case recalling further details following the original case interview.
• These metrics report all cases during the specified period, including those in Managed Isolation and Quarantine, and do not include casual contacts.
• There are three additional indicators under development requiring both technical and clinical input to define data requirements. These are due to be completed by end October 2020.

IN CONFIDENCE – NOT FOR DISTRIBUTION
16
Table 11: NCTS data for cases in the community Managed Isolation and Quarantine, International, and Unknown
Indicator (as per Table 9832) Refined Indicator description Target 6 Sept ** 7 Sept ** 8 Sept ** 9 Sept ** 10 Sept ** 11 Sept ** 12 Sept **
1 - (S001) Time from exposure to contact isolation / quarantine
80% within 96 hours
- - - - - - -
2 – (S002) Time from case first symptom to contact isolation / quarantine
80% within 96 hours
- - - - - - -
3 – (S003) Time from test sample taken to close contact isolation / quarantine
80% within 72 hours
100% 100% - 100% - - -
4 – (C001) Time from first symptom to test sample taken for positive cases
80% within 48 hours
- - - 0% * (0/1)
- - -
5 – (L001) Time from test sample taken to notification of positive result
80% within 24 hours
0% * (0/2)
100% - 100% - - 0% * (0/1)
6 – (P002) Time from case notification to isolation / quarantine of contact
80% within 48 hours
100% 100% - 100% - - -
7 – (P001) Time from notification to case interview 80% within 24 hours
100% 100% - 100% - - 100%
8 – (P003) Time from close contact identification to isolated / quarantined
80% within 24 hours
100% 100% - 100% - - 100%
10 – (P004) Proportion of contacts traced in 48 hours 80% within 48 hours
100% 100% - 100% - - -
C – (S005) Proportion of close contacts with confirmed or suspected COVID-19 at the time of tracing
<20% 0% 0% - 0% - - 0%
Note:
• * The numerator and denominator are provided in some instances to provide context for low percentages.
• **Data is not available for metrics where there is no data that meets the definition, or where the time/days to reach target has not fully elapsed
• The value of P002 can drop due to the addition of new close contacts to exposure events after the 48-hour period since case notification had elapsed. This can happen for a number of reasons, including a case recalling further details following the original case
interview.
• These metrics report all cases during the specified period, including those in Managed Isolation and Quarantine, and do not include casual contacts.
• There are three additional indicators under development requiring both technical and clinical input to define data requirements. These are due to be completed by end October 2020.

17
IN CONFIDENCE – NOT FOR DISTRIBUTION
Appendix 3: NRHCC Testing Report
Novel Coronavirus (COVID-19)
Issued: 1700 11 September Table 12: Metro Auckland Summary Total of Testing for 11 September 2020
Community MIQ
staff
MIQ
guests
Airport Maritime port TOTAL
5:00pm 1294 256 342 141 34 2067
Table 13: Totals tests receipted from 12 August 2020, by ethnicity (as at 5pm)
*Swab taken in last 24 hours taken between midnight and midnight, may have been receipted and reported later than
this; tests only included if coded and received and acknowledged by lab, result not required
*Includes GP clinics, Urgent Care Centres, Designated practices
Table 14: Estimated tests taken since 12 August 2020, based on manual site reports at 5pm
Site 12/08-
16/08
17/08-
23/08
24/08 –
30/08
31/08 –
06/09
07/09 08/09 09/09 10/09 11/09*
MIQ Staff 2132 659 1488 912 88 75 251 195 221
Guests 2972 3767 3600 3406 483 609 345 534 342
Border Airport 2129 933 1349 1158 153 68 154 138 141
Port 1588 678 161 392 19 15 39 23 34
* 11/09 day still in progress
CTCs and mobile testing site locations
Please see https://www.arphs.health.nz/public-health-topics/covid-19/where-to-get-tested for the
most up-to-date information on CTCs and mobile testing sites in the Auckland region.
Tests Last 24 hours Total since 12/8*
Ethnicity CTC
Non-
CTC
Total
% Tests %
Asian 174 137 311 15.8% 38,159 17.9%
Maori 149 125 274 13.9% 30,397 14.3%
Other 433 406 839 42.6% 90,099 42.3%
Pacific 253 94 347 17.6% 49,269 23.1%
Unknown 1 199 200 10.1% 5032 2.4%
Total 1010 961 1971 212,956

IN CONFIDENCE – NOT FOR DISTRIBUTION
18
Appendix 4: Testing by DHB and ethnicity The tables that follow are the number of people tested. The numbers in the laboratory testing
section are the number of laboratory tests processed.
Table 15: Number of people tested for COVID-19 from 12 August to 13 September
Prioritised Ethnicity MPAO
DHB of Domicile Māori Pacific Asian Other Unknown Total
Auckland 3416 7036 9208 19,804 371 39,835
Bay of Plenty 2569 291 564 6488 59 9971
Canterbury 1603 626 1721 13,462 210 17,622
Capital and Coast 1460 1100 1367 9165 204 13,296
Counties Manukau 7255 19,713 8957 12,535 428 48,888
Hawkes Bay 1380 284 213 3512 60 5449
Hutt Valley 792 467 547 3111 44 4961
Lakes 2293 300 452 3153 94 6292
MidCentral 1017 251 358 4131 83 5840
Nelson Marlborough 584 174 257 4209 53 5277
Northland 3038 208 264 4050 46 7606
South Canterbury 145 34 78 1720 11 1988
Southern 1078 338 683 9719 86 11,904
Tairāwhiti 859 54 63 782 21 1779
Taranaki 687 67 173 2647 45 3619
Waikato 4288 985 1474 10,058 228 17,033
Wairarapa 233 39 46 1082 8 1408
Waitematā 4707 5162 8031 24,837 322 43,059
West Coast 47 10 13 327 6 403
Whanganui 639 77 68 1427 14 2225
Unknown 1398 709 741 4144 1820 8812
Total 39,488 37,925 35,278 140,364 4213 257,268

19
IN CONFIDENCE – NOT FOR DISTRIBUTION
Table 16: Rate per 1000 people tested for COVID-19 from 12 August to 13 September
Prioritised Ethnicity MPAO
DHB of Domicile Māori Pacific Asian Other Total
Auckland 78.5 125.5 49.2 75.8 72.7
Bay of Plenty 43 65.5 28.8 41.2 41.3
Canterbury 30.6 44.1 28.3 30.2 30.7
Capital and Coast 40 49.6 27.2 43.1 41.3
Counties Manukau 81.5 164.2 59.3 59.9 85.8
Hawkes Bay 31.9 44.3 23.2 32.5 32.7
Hutt Valley 30.4 40 29.1 33 32.9
Lakes 59.6 117.4 46.5 52.6 56.8
MidCentral 28 45.2 23.1 33.4 32.2
Nelson Marlborough 36.4 70.4 34.6 33.4 34.8
Northland 49.9 55.3 31.9 37.2 41.8
South Canterbury 27.3 69.6 33 33.3 33.2
Southern 32.1 49.1 26.5 36.3 35.7
Tairāwhiti 34.7 48.3 54 35.4 36.2
Taranaki 29.4 48.1 27.8 29.4 29.9
Waikato 44.5 73.9 33.4 37.4 40.3
Wairarapa 29.2 46.9 36.9 30.3 30.8
Waitematā 75.2 115.8 55.9 65 68
West Coast 12.1 39.6 14.1 12.1 12.6
Whanganui 36.8 50.6 23.2 33.2 34.3
Total 50.8 118.6 46 45.3 51.9

1
IN CONFIDENCE – NOT FOR DISTRIBUTION
SITREP 053
Coronavirus disease 2019 (COVID-19)
Issued: 1030 hours 15 September 2020
Information current at: 1000 hours
This report provides a daily update on the COVID-19 health system response. New information is denoted by red text.
Please use the single point of contact email [email protected] for help/support. Your email will be
logged and promptly passed to the appropriate team.
This document is classified IN CONFIDENCE and not for further distribution.
Need to know
COMMUNITY CASES
NEW LAST 24 hrs
0
IMPORTED MIQ
CASES
NEW LAST 24 hrs
3
COMMUNITY CASES
TOTAL RECOVERED
123
119
COMMUNITY CASES
ACTIVE
55 TOTAL CASES SINCE 11 AUG
180
28
TOTAL IMPORTED MIQ CASES
147
TOTAL ACTIVE CASES IN NZ (COMMUNITY & MIQ): 83
IMPORTED MIQ CASES
TOTAL RECOVERED
IMPORTED MIQ CASES
ACTIVE
LABORATORY TESTS
LAST 24 hrs
4,402
LABORATORY TESTS
LAST SEVEN DAYS
49,290
LABORATORY TESTS
TOTAL
872,444
CASES DECEASED
2

IN CONFIDENCE – NOT FOR DISTRIBUTION
2
Total COVID-19 cases
Table 1: Total number of COVID-19 cases as at 0900 15 September 20201
Case Status Active Recovered Deceased Total
Confirmed 83* (-13) 1348 (+16) 19 1450 (+3)
Probable 0 346 5 351
Total 83* (-13) 1694 (+16) 24 1801 (+3)
*3 new case identified, 16 cases classified as recovered.
Total community cases since 11 August
Table 2: Community cases by DHB and case status as at 0900 15 September 20201
New community cases since 0900 14 September 20202
1. No new community cases have been reported, as at 0900 15 September.
Community cases linked to the Auckland Community Cluster August 20203
2. 178 of the 180 community cases have been linked to the Auckland Community Cluster
August 2020, as at 0900 15 September. The unlinked cases are summarised as follows:
o The Rydges employee (this investigation has been closed).
o A case (reported 21 August) is still under investigation for an epidemiological link to
the community cluster and there is insufficient data to confirm a genomic link to the
community cluster (see 3).
Community cases under investigation to determine a link to the Auckland community
cluster
3. The case under investigation is summarised as follows:
o One case (reported 21 August) came through the border on 18 June. The case tested
negative at Day 3 and Day 12 of quarantine. The case subsequently tested positive
on 21 August after being swabbed at a mobile testing clinic in Auckland. Despite
1 EpiSurv Database, 0900 15 September 2020
2 EpiSurv Database, 0900 15 September 2020
3 EpiSurv Database, 0900 15 September 2020
Case
Status
Counties Manukau Waitematā Auckland Waikato Total
Confirmed 77 55 46 1 179
Probable 1 0 0 0 1
Total 78 55 46 1 180

IN CONFIDENCE – NOT FOR DISTRIBUTION
3
using two different whole genome sequencing protocols only a partial genome was
obtained. There is insufficient data to confirm the case is genomically linked to the
community cluster.4 Their epidemiological link to the community cluster is still under
investigation. As at 15 September no additional information has been revealed by
the investigation.11
Community cases and household contacts at Jet Park
4. As at 0800 15 September there are 56 people isolating in Jet Park from the community.
26 are confirmed cases, the remaining 30 are household contacts. This number will
fluctuate as people finish their isolation and depart from the facility.5
MIQ cases since 0900 14 September 20206
5. Three new cases detected at the border, as at 0900 15 September. In total 147 cases
have been detected at the border since the establishment of MIFs/MIQs.
Cases in hospital
6. As at 0800 15 September there are three cases in hospital with COVID-19.7
Table 3: Number of cases in hospital with COVID-19 by DHB as at 0800 15 September 2020
4 ESR WGS report 03 September 2020
5 NRHCC Morning Report, 0900 15 September 2020
6 EpiSurv Database, 0900 15 September 2020
7 NRHCC Morning Report 15 September 2020 and COVID-19 Hospital Summary, 0900 15 September 2020
DHB Hospital Number in a general ward Number in ICU/HDU
Auckland Auckland City 1 0
Waitematā North Shore 0 1
Waikato Waikato 0 1
Total - 1 2

IN CONFIDENCE – NOT FOR DISTRIBUTION
4
Health system response
Overall approach
7. Our investigation has two main focus areas that run in parallel:
o Source attribution – a focus on investigating the case with the earliest symptom
onset date to gather details actions of movements 14 days prior. This will help to
understand the possible source of the new outbreak.
o Containment – rigorous case investigation, identification of close contacts and
isolation and testing to ensure that chain of transmission is broken.
Current outbreak overview8
o There are two sub-clusters which most new community cases are linked to (Mount
Roskill Evangelical Church and Bereavements sub-clusters). There are 33 confirmed
cases in the Mount Roskill Evangelical Church sub-cluster and 15 confirmed cases in the
Bereavements sub-cluster.
Current outbreak investigation priorities
o Contact tracing and containment of Mount Roskill Evangelical Church sub-cluster and
recent bereavement events.
o Contact tracing and containment of Botany sub-cluster.
o Clarify whether June border case is a new infection and clarify strain.
o Seek to identify epidemiological link for index case in Mount Roskill Evangelical Church
sub-cluster.
o Waikato PHU will scope any positive cases in MIFs in the Auckland region for the next
week to alleviate some workload pressure at ARPHS.
o Investigation and close contact tracing of Jet Park healthcare worker9
Sub-clusters and settings of interest8
8. A healthcare worker at Jet Park was reported as a case on the 13 September Sitrep. The
case has been genomically linked to the Auckland Community Cluster however a clear
epidemiological link is still being investigated. The case was working in the facility
where other confirmed community cases were completing managed isolation however
a clear link to an existing case is not yet determined (see para 15 for further information
on genomic sequencing). Scoping by ARPHS is underway to identify close and casual
contacts. The case is isolating at Jet Park facility. The case has five household close
contacts who are self-isolating at home. All five household contacts have returned
negative test results.9 All staff at Jet Park staff who are considered close contacts have
been stood down and have returned negative results so far.9 CCTV footage at the
facility will be reviewed as part of the scoping process. Community contact tracing is
8 ARPHS Strategic Report 08 September 2020
9 NRHCC Morning Report, 0900 15 September 2020

IN CONFIDENCE – NOT FOR DISTRIBUTION
5
underway.10 A total of 29311 gym users have been identified between three exposure
events at Les Mills gym classes on 9 and 10 September (See table 4 for further details).
These people are in the process of being contacted by NCTS and are all being
encouraged to be tested.12 Contacts at exposure events at The Warehouse, Starbucks
and Countdown are all considered casual contacts only.13
9. On 7 September several exposure events were identified with epidemiological links to
Mt Roskill Evangelical Church sub-cluster. Between 24 August and 2 September there
were multiple gatherings associated with bereavement of a (non COVID-19 related)
death, including a funeral on Active monitoring and follow up of
compliance with self-isolation is ongoing with contacts associated with these events.13
10. St Dominic’s College in Henderson, Auckland, was identified as a setting of interest on 8
September. A confirmed case linked to the bereavement sub-cluster
The school has
been informed and communications have been sent. A list of contacts has been
gathered by the school and includes 87 students and 11 teachers.14 The school was
reopened on 14 September and casual contacts will be able to attend.13
11. A confirmed case linked to the bereavement sub-cluster worked as a bus driver for two
days while infectious but pre-symptomatic. wore a facemask and had 2m distance
from passengers due to Auckland Transport policy. A contact tracing exercise based on
HOP card data is ongoing. No further contacts have been identified as of 14 September
regarding this case.15
o 293 individuals rode these routes on 3 and 4 September, all of whom are casual
contacts. No individual rode the bus for more than two hours cumulatively over
these two days.
o There are two close contacts, they are in self-isolation.
12. members of one of the families in the Botany sub-cluster had serology testing on
11 September and all returned negative results.11 A case reported in 14 September
SitRep is also associated with the Botany sub-cluster. The case is and has
been in isolation at Jet Park since 30 August due to being a household contact of a
confirmed case. The case and their close contacts will remain in isolation for a further
14 days.11
Case investigation
10 ARPHS text 1000 13 September 2020
11 Email update from ARPHS 0848 15 September 2020
12 MoH, ARPHS teleconference 1500 14 September 2020
13 NRHCC Morning Report 0900 14 September 2020
14 ARPHS email 1800 11 September 2020
15 NRHCC Morning Report, 0900 15 September 2020
s 9(2)(a)
s 9(2)(a)
s 9(2)(a)
s 9(2)(a)
s 9(2)(a)
s 9(2)(a)
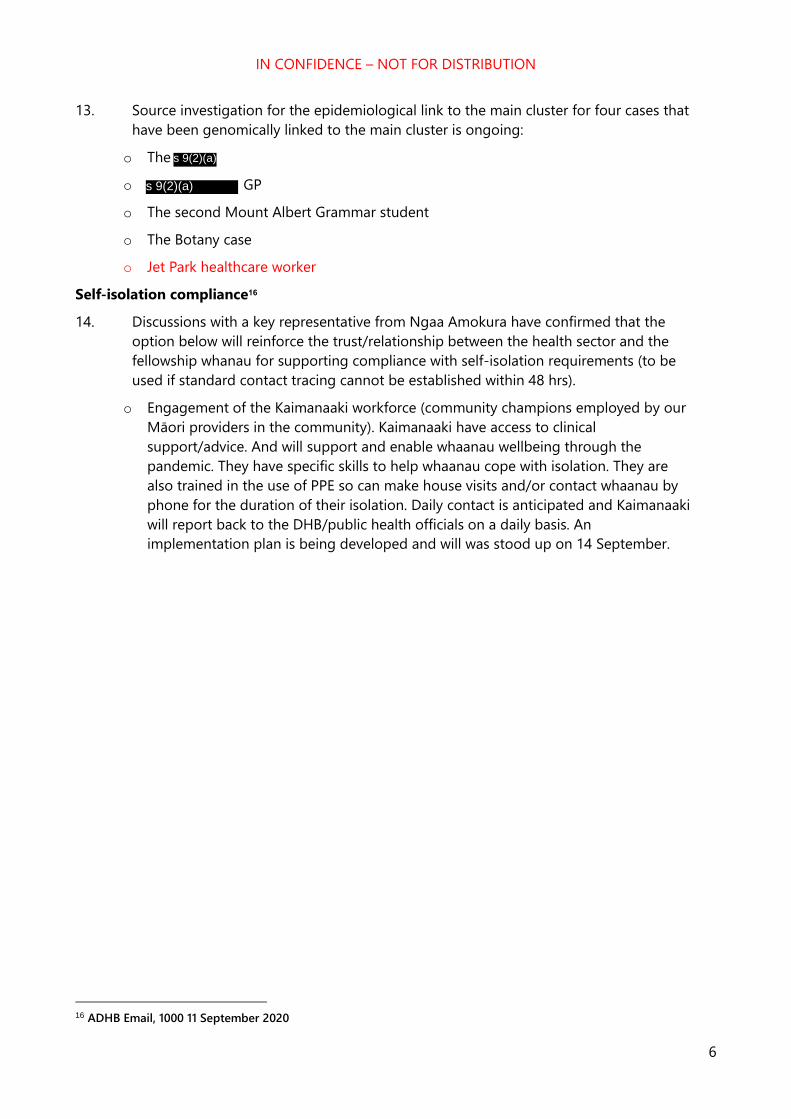
IN CONFIDENCE – NOT FOR DISTRIBUTION
6
13. Source investigation for the epidemiological link to the main cluster for four cases that
have been genomically linked to the main cluster is ongoing:
o The
o GP
o The second Mount Albert Grammar student
o The Botany case
o Jet Park healthcare worker
Self-isolation compliance16
14. Discussions with a key representative from Ngaa Amokura have confirmed that the
option below will reinforce the trust/relationship between the health sector and the
fellowship whanau for supporting compliance with self-isolation requirements (to be
used if standard contact tracing cannot be established within 48 hrs).
o Engagement of the Kaimanaaki workforce (community champions employed by our
Māori providers in the community). Kaimanaaki have access to clinical
support/advice. And will support and enable whaanau wellbeing through the
pandemic. They have specific skills to help whaanau cope with isolation. They are
also trained in the use of PPE so can make house visits and/or contact whaanau by
phone for the duration of their isolation. Daily contact is anticipated and Kaimanaaki
will report back to the DHB/public health officials on a daily basis. An
implementation plan is being developed and will was stood up on 14 September.
16 ADHB Email, 1000 11 September 2020
s 9(2)(a)
s 9(2)(a)

7
IN CONFIDENCE – NOT FOR DISTRIBUTION
s 9(2)(a)
s 9(2)(a)

8
IN CONFIDENCE – NOT FOR DISTRIBUTION
ESR and wider testing17 15. Whole genome sequencing was undertaken on a sample from a confirmed COVID-19
case in a health care worker at Auckland’s quarantine facility Jet Park. The sequencing
results indicate that the case is linked to the Auckland community cluster and is most
closely genomically related to three community cases that have been isolated in the Jet
Park quarantine facility. This sequence information indicates that the health care worker
was most likely exposed at Jet Park and the Public Health Unit are continuing to
investigate how the infection occurred.
16. ESR now has an arrangement in place with Massey University for genome sequencing.
ESR will still validate all results, however this arrangement is predicted to speed up
genome testing.
17. A further 34 community cases are genomically linked with the Auckland cluster. These
cases are from the following known sub-clusters; Church 1 (6 cases), Church 2 (4 cases),
Church 3 (9 cases), Finance Now HH (1 case), Americold HH (3 cases), Botany (4 cases),
(4 cases) and (3 cases).18
18.
19. Work is underway to analyse how the whole genome sequencing can be used to tell us
how COVID-19 has been transmitted through the community cluster and to further
inform its management.
20. No direct links have been found between the community outbreak genome
sequencing, with the 67 genomes currently available from cases in managed isolation
facilities (MIFs).
21.
Contact tracing19 22. Between 06 and 12 September 91% (471/516) of Community close contacts and 100%
(29/29) MIQ close contacts have been contacted within 48 hours of being determined
to be a contact. KPI for this metric is 80% of close contacts within 48 hours.
17 ESR Whole Genome Sequencing Report 02 September 2020, Email 1859 11 September 2020
18 ESR email update 0900 08 September 2020
19 COVID-19 NCCS Analytics and Reporting 0836 15 September 2020
s 9(2)(a)s 9(2)(a)
s 9(2)(g)(i)
s 9(2)(g)(i)

IN CONFIDENCE – NOT FOR DISTRIBUTION
9
Table 4: Close contact tracing recorded in the National Contact Tracing Solution since 12 August as at
0830 15 September 2020
12/09/2020 13/09/2020 14/09/2020 15/09/2020
Number of close contacts
identified1 3647 3664 3708 3779
Number of close contacts
successfully contacted (and are
self-isolating)
3640 3650 3697 3772
Number of close contacts
referred to "finding services"2 0 0 0 0
Number of close contacts
awaiting contact 7 14 11 7
1. Contacts loaded into the National Contact Tracing Solution, and managed by either the National Investigation and Tracing
Unit or the Public Health Units. Contacts from MIQ and overseas cases are not included in this report.
2. "Finding services" refers to the mechanism the National Close Contact Service uses to find valid contact details for close
contacts we do not have the correct contact details for. These services utilise internal Ministry of Health databases along with
Police, Customs and Airlines where relevant.
3. The total number and number successfully contacted can decrease due to duplicates and invalid records being removed from
the system.
COVID-19 Tracer App usage20 Figure 1: COVID-19 Tracer App cumulative registered users and daily scans/manual entries as at 1610
14 September 2020
1. The number of scans and manual entries on any given date is subject to change for up to 31 days. This is because there can be
a delay before anonymised analytic information is received (e.g. device not connected to internet when scan carried out).
2. The number of App registrations and QR codes for any given date is subject to change for up to 1 day. This is because due to
reporting timeframes these numbers may be extracted before the 12pm cut-off for the reporting period.
20 Response Analyst – Digital Channels, 1614 14 September 2020
0
500,000
1,000,000
1,500,000
2,000,000
2,500,000
0
500,000
1,000,000
1,500,000
2,000,000
2,500,000
20
/05
23/0
526
/05
29
/05
01/0
604
/06
07
/06
10/0
613
/06
16
/06
19/0
622
/06
25
/06
28/0
601
/07
04
/07
07/0
710
/07
13
/07
16/0
719
/07
22
/07
25/0
728
/07
31
/07
03/0
806
/08
09
/08
12/0
815
/08
18
/08
21/0
824
/08
27
/08
30/0
802
/09
05
/09
08/0
911
/09
14
/09
Da
ily
sca
ns
an
d m
an
ua
l e
ntr
ies
Cu
mu
lati
ve
Ap
p r
eg
istr
ati
on
s
Day and month
Cumulative App registrations Daily scans and manual entries

IN CONFIDENCE – NOT FOR DISTRIBUTION
10
Testing21 Table 5: Testing by functional groups, as at 0900 15 September 2020
*Numbers have been sourced from different data extracts in comparison to Table 7.
Laboratory testing numbers22 Table 6: Number of laboratory tests processed nationally as at 0900 15 September 2020
Testing supply update23
23. There are no issues with regent supplies, and hologic supplies are now in labs around
the country. There are 43 days of reagent stocks on hand nationally.
21 ÉCLAIR/MoH Public Health Intelligence, 1000 15 September 2020
22 Daily Lab Report, 0913 15 September 2020
23 Testing supply email, 1001 09 September 2020
Reason for test 14 September 08–14 September
GPs and other primary health 1904 19,287
CBACs and pop-ups 1908 24,263
Border workers - air crew 16 216
Border workers - airport staff 87 1168
Border workers - maritime crew 0 0
Border workers – Port of Tauranga staff 0 12
Border workers – Remaining Port staff 5 128
Border workers - MIF 137 986
Border workers - MIQ 145 504
Travellers - Staying at MIF 194 2134
Travellers - Staying at MIQ 6 243
Total 4402 48,941
Time period Number of laboratory tests
14 September 4402
Last 7 days (08 Sep to 14 Sep) 49,290
Total 872,444

IN CONFIDENCE – NOT FOR DISTRIBUTION
11
Testing activity by region
Focus areas
24. As at 1700 08 September there are 28 Community testing Centres in the Metro
Auckland area. Three of these are closed CTC's for close contacts only.24
Healthline updates25 25. On 14 September there were 3,176 contacts in Healthline. Of those calls, 1,112 were to
the COVID-19 Info line. Demand on 1737 Need to talk? and other mental health services
was 675 contacts (slightly higher than forecast).
26. The main themes yesterday/today:
o National Telehealth Service (Healthline) continued to take calls related to the
exposure events.
o National Telehealth Service (Healthline) continued to have a number of calls from the
public expressing anger towards the lack of compliance by various religious groups
and close contacts not being honest with officials during interviews.
o Most of the general public Service Users were calling because they are symptomatic
and wanted to be tested.
o Calls relating to the latest exposure events
o Confusion around alert leave rules (i.e. crowd sizes in Auckland, around the rest of
the country etc).
Logistics
Health Workforce26
27. Health Workforce continue to work with employers who have expressed a need for
assistance with identifying people who are willing to work within the health system and
to provide some relief from COVID-19 related staffing issues.
28. Upskilling of alternative workforces for testing continues to progress. Health Workforce
are currently engaged with Careerforce and DHBs to create a testing workforce training
and education package. This will be utilised by DHBs across the country, to increase the
pool of people who are able to perform COVID-19 testing. Following on from the
didactic component, will be practical training and assessment, which will continue to be
provided by the relevant DHB.
29. Health Workforce are monitoring staffing needs in MIFs facilities and are providing
support where possible.
24 Community Testing Centres report, 1800 08 September 2020
25 National Telehealth Service Coronavirus Update, 0903 15 September 2020
26 Health Workforce Directorate, 0945 14 September 2020

IN CONFIDENCE – NOT FOR DISTRIBUTION
12
Hospital capacity27 Table 7: Number and occupancy of hospital beds by type as at 0800 15 September 2020
Type Number of units Number (%) occupied/in use
ICU and HDU beds 365 208 (57.0%)
Ventilators 320 58 (18.1%)
Ward beds 7728 6351 (82.2%)
27 COVID-19 Hospital Summary, 0918 15 September 2020

13
IN CONFIDENCE – NOT FOR DISTRIBUTION
Appendix 1: Case summary Table 8: All community cases reported between 0900 14 September and 0900 15 September. Source: ESR EpiSurv Extract 0900 15 September 2020
Cumulative
Number
Date tested
positive Onset date
Case
status DHB Sex Age Ethnicity
Symptoms
[Yes/No] Hospitalised Occupation Source of transmission

14
IN CONFIDENCE – NOT FOR DISTRIBUTION
Appendix 2: COVID-19 Provisional Disease Indicators, by date
of case notification19 Table 9:NCTS data for cases in the community
Indicator (as per Table
9832) Refined Indicator description Target 7 Sept 8 Sept 9 Sept 10 Sept 11 Sept
** 12 Sept
** 13 Sept
**
1 - (S001) Time from exposure to contact isolation / quarantine 80% within 96 hours 28% 4% 0% *
(0/4) 100% - - -
2 – (S002) Time from case first symptom to contact isolation / quarantine 80% within 96 hours 72% 4% 0% *
(0/4) 100% - - -
3 – (S003) Time from test sample taken to close contact isolation / quarantine 80% within 72 hours 83% 4% 100% 100% 89% - -
4 – (C001) Time from first symptom to test sample taken for positive cases 80% within 48 hours 50% 33% 0% *
(0/1) 100% 67% 100% -
5 – (L001) Time from test sample taken to notification of positive result 80% within 24 hours 75% 80% 0% *
(0/2) 100% 67% 100% -
6 – (P002) Time from case notification to isolation / quarantine of contact 80% within 48 hours 93% 87% 100% 100% 89% 98% -
7 – (P001) Time from notification to case interview 80% within 24 hours 100% 100% 100% 100% 100% 100% -
8 – (P003) Time from close contact identification to isolated / quarantined 80% within 24 hours 97% 97% 100% 100% 100% 98% -
10 – (P004) Proportion of contacts traced in 48 hours 80% within 48 hours 98% 88% 100% 100% 100% 98% -
C – (S005) Proportion of close contacts with confirmed or suspected COVID-19 at the time of tracing <20% 4% 1% 0% 0% 0% 0% -
• * The numerator and denominator are provided in some instances to provide context for low percentages.
• **Data is not available for metrics where there is no data that meets the definition, or where the time/days to reach target has not fully elapsed
• The value of P002 can drop due to the addition of new close contacts to exposure events after the 48-hour period since case notification had elapsed. This can happen for a number of reasons, including a case recalling further details following the original case
interview.
• These metrics report all cases during the specified period, including those in Managed Isolation and Quarantine, and do not include casual contacts.
• There are three additional indicators under development requiring both technical and clinical input to define data requirements. These are due to be completed by end October 2020.

IN CONFIDENCE – NOT FOR DISTRIBUTION
15
Table 10: NCTS data for cases in the community Managed Isolation and Quarantine, International, and Unknown
Indicator (as per Table 9832) Refined Indicator description Target 7 Sept ** 8 Sept ** 9 Sept ** 10 Sept ** 11 Sept ** 12 Sept ** 13 Sept **
1 - (S001) Time from exposure to contact isolation / quarantine
80% within 96 hours
- - - - - - -
2 – (S002) Time from case first symptom to contact isolation / quarantine
80% within 96 hours
- - - - - - -
3 – (S003) Time from test sample taken to close contact isolation / quarantine
80% within 72 hours
100% - 100% - - - -
4 – (C001) Time from first symptom to test sample taken for positive cases
80% within 48 hours
- - 0% * (0/1)
- - - -
5 – (L001) Time from test sample taken to notification of positive result
80% within 24 hours
100% - 100% - - 0% * (0/1)
-
6 – (P002) Time from case notification to isolation / quarantine of contact
80% within 48 hours
100% - 100% - - 100% -
7 – (P001) Time from notification to case interview 80% within 24 hours
100% - 100% - - 100% -
8 – (P003) Time from close contact identification to isolated / quarantined
80% within 24 hours
100% - 100% - - 100% -
10 – (P004) Proportion of contacts traced in 48 hours 80% within 48 hours
100% - 100% - - 100% -
C – (S005) Proportion of close contacts with confirmed or suspected COVID-19 at the time of tracing
<20% 0% - 0% - - 0% -
Note:
• * The numerator and denominator are provided in some instances to provide context for low percentages.
• **Data is not available for metrics where there is no data that meets the definition, or where the time/days to reach target has not fully elapsed
• The value of P002 can drop due to the addition of new close contacts to exposure events after the 48-hour period since case notification had elapsed. This can happen for a number of reasons, including a case recalling further details following the original case
interview.
• These metrics report all cases during the specified period, including those in Managed Isolation and Quarantine, and do not include casual contacts.
• There are three additional indicators under development requiring both technical and clinical input to define data requirements. These are due to be completed by end October 2020.

16
IN CONFIDENCE – NOT FOR DISTRIBUTION
Appendix 3: NRHCC Testing Report
Novel Coronavirus (COVID-19)
Issued: 1700 14 September
Table 11: Metro Auckland Summary Total of Testing for 11 September 2020
Community MIQ
staff
MIQ
guests
Airport Maritime
port
Ship’s
Crew
TOTAL
12/09/2020
5:00pm
1004 75 461 93 23 0 1656
13/09/2020
5:00pm
922 92 650 106 No Testing 0 1770
14/09/2020
5:00pm
1482 118 648 156 90 0 2494
Table 12: Estimated tests taken since 12 August 2020, based on manual site reports at 5pm
Site 12/08-
16/08
17/08-
23/08
24/08 –
30/08
31/08 –
06/09
07/09 –
13/09
12/09 13/09 14/09*
MIQ Staff 2132 659 1488 912 1086 75 92 118
Guests 2972 3767 3600 3406 3424 461 650 648
Border Airport 2129 933 1349 1158 853 93 106 156
Port 1588 678 161 392 153 23 0 90
* 14/09 day still in progress
CTCs and mobile testing site locations
Please see https://www.arphs.health.nz/public-health-topics/covid-19/where-to-get-tested for the
most up-to-date information on CTCs and mobile testing sites in the Auckland region.

IN CONFIDENCE – NOT FOR DISTRIBUTION
17
Appendix 4: Testing by DHB and ethnicity The tables that follow are the number of people tested. The numbers in the laboratory testing
section are the number of laboratory tests processed.
Table 13: Number of people tested for COVID-19 from 12 August to 14 September
Prioritised Ethnicity MPAO
DHB of Domicile Māori Pacific Asian Other Unknown Total
Auckland 3441 7066 9312 19950 380 40,149
Bay of Plenty 2580 292 569 6516 62 10,019
Canterbury 1614 627 1769 13581 211 17,802
Capital and Coast 1466 1110 1377 9211 205 13,369
Counties Manukau 7286 19774 9053 12617 435 49,165
Hawkes Bay 1398 287 219 3559 60 5523
Hutt Valley 794 515 553 3134 45 5041
Lakes 2305 300 456 3164 94 6319
MidCentral 1038 258 369 4215 86 5966
Nelson Marlborough 584 174 259 4235 53 5305
Northland 3044 208 266 4085 50 7653
South Canterbury 145 35 78 1724 11 1993
Southern 1090 369 694 9980 88 12,221
Tairāwhiti 875 55 64 796 22 1812
Taranaki 688 68 174 2665 45 3640
Waikato 4306 988 1490 10100 232 17,116
Wairarapa 234 39 46 1093 8 1420
Waitematā 4750 5210 8142 25117 324 43,543
West Coast 47 10 13 329 6 405
Whanganui 645 77 72 1458 14 2266
Unknown 1415 706 724 4177 1851 8873
Total 39,745 38,168 35,699 141,707 4282 259,601

18
IN CONFIDENCE – NOT FOR DISTRIBUTION
Table 14: Rate per 1000 people tested for COVID-19 from 12 August to 14 September
Prioritised Ethnicity MPAO
DHB of Domicile Māori Pacific Asian Other Total
Auckland 79.1 126 49.8 76.3 73.2
Bay of Plenty 43.1 65.7 29 41.4 41.5
Canterbury 30.8 44.2 29.1 30.4 31
Capital and Coast 40.1 50.1 27.4 43.3 41.6
Counties Manukau 81.8 164.7 59.9 60.3 86.3
Hawkes Bay 32.3 44.7 23.9 32.9 33.1
Hutt Valley 30.5 44.1 29.5 33.3 33.4
Lakes 59.9 117.4 46.9 52.8 57.1
MidCentral 28.5 46.5 23.8 34.1 32.9
Nelson Marlborough 36.4 70.4 34.9 33.7 35
Northland 50 55.3 32.2 37.5 42.1
South Canterbury 27.3 71.7 33 33.4 33.3
Southern 32.5 53.6 26.9 37.3 36.6
Tairāwhiti 35.3 49.2 54.8 36 36.9
Taranaki 29.5 48.8 27.9 29.6 30.1
Waikato 44.7 74.1 33.8 37.5 40.5
Wairarapa 29.3 46.9 36.9 30.6 31.1
Waitematā 75.9 116.8 56.6 65.7 68.7
West Coast 12.1 39.6 14.1 12.2 12.6
Whanganui 37.1 50.6 24.6 33.9 34.9
Total 51.1 119.3 46.6 45.8 52.3

1
IN CONFIDENCE – NOT FOR DISTRIBUTION
SITREP 054
Coronavirus disease 2019 (COVID-19)
Issued: 1030 hours 16 September 2020
Information current at: 1000 hours
This report provides a daily update on the COVID-19 health system response. New information is denoted by red text.
Please use the single point of contact email [email protected] for help/support. Your email will be
logged and promptly passed to the appropriate team.
This document is classified IN CONFIDENCE and not for further distribution.
Need to know
COMMUNITY CASES
NEW LAST 24 hrs
0
IMPORTED MIQ
CASES
NEW LAST 24 hrs
1
COMMUNITY CASES
TOTAL RECOVERED
125
121
COMMUNITY CASES
ACTIVE
52 TOTAL CASES SINCE 11 AUG
180
27
TOTAL IMPORTED MIQ CASES
148
TOTAL ACTIVE CASES IN NZ (COMMUNITY & MIQ): 79
IMPORTED MIQ CASES
TOTAL RECOVERED
IMPORTED MIQ CASES
ACTIVE
LABORATORY TESTS
LAST 24 hrs
9,088
LABORATORY TESTS
LAST SEVEN DAYS
50,015
LABORATORY TESTS
TOTAL
881,532
CASES DECEASED
3
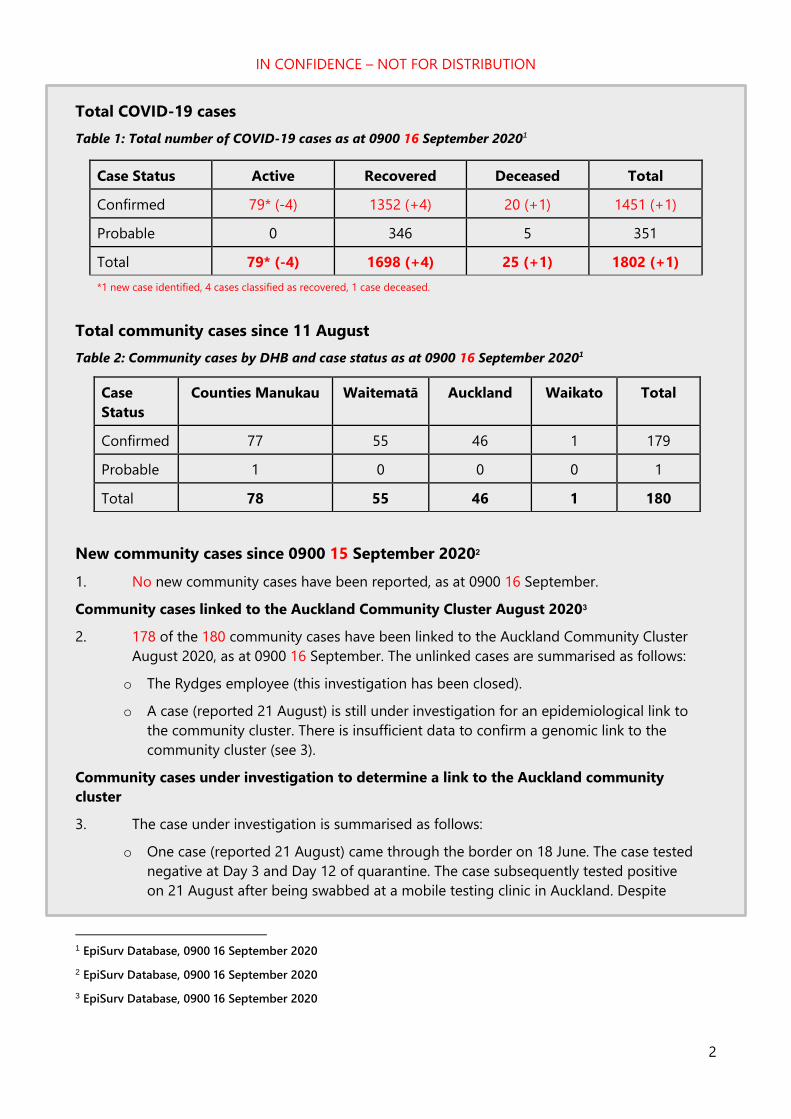
IN CONFIDENCE – NOT FOR DISTRIBUTION
2
Total COVID-19 cases
Table 1: Total number of COVID-19 cases as at 0900 16 September 20201
Case Status Active Recovered Deceased Total
Confirmed 79* (-4) 1352 (+4) 20 (+1) 1451 (+1)
Probable 0 346 5 351
Total 79* (-4) 1698 (+4) 25 (+1) 1802 (+1)
*1 new case identified, 4 cases classified as recovered, 1 case deceased.
Total community cases since 11 August
Table 2: Community cases by DHB and case status as at 0900 16 September 20201
New community cases since 0900 15 September 20202
1. No new community cases have been reported, as at 0900 16 September.
Community cases linked to the Auckland Community Cluster August 20203
2. 178 of the 180 community cases have been linked to the Auckland Community Cluster
August 2020, as at 0900 16 September. The unlinked cases are summarised as follows:
o The Rydges employee (this investigation has been closed).
o A case (reported 21 August) is still under investigation for an epidemiological link to
the community cluster. There is insufficient data to confirm a genomic link to the
community cluster (see 3).
Community cases under investigation to determine a link to the Auckland community
cluster
3. The case under investigation is summarised as follows:
o One case (reported 21 August) came through the border on 18 June. The case tested
negative at Day 3 and Day 12 of quarantine. The case subsequently tested positive
on 21 August after being swabbed at a mobile testing clinic in Auckland. Despite
1 EpiSurv Database, 0900 16 September 2020
2 EpiSurv Database, 0900 16 September 2020
3 EpiSurv Database, 0900 16 September 2020
Case
Status
Counties Manukau Waitematā Auckland Waikato Total
Confirmed 77 55 46 1 179
Probable 1 0 0 0 1
Total 78 55 46 1 180

IN CONFIDENCE – NOT FOR DISTRIBUTION
3
using two different whole genome sequencing protocols only a partial genome was
obtained. There is insufficient data to confirm the case is genomically linked to the
community cluster.4 Their epidemiological link to the community cluster is still under
investigation. As at 15 September no additional information has been revealed by
the investigation.11
Community cases and household contacts at Jet Park
4. As at 0800 16 September there are 57 people isolating in Jet Park from the community.
27 are confirmed cases, the remaining 30 are household contacts. This number will
fluctuate as people finish their isolation and depart from the facility.5
MIQ cases since 0900 15 September 20206
5. One new case detected at the border, as at 0900 16 September. In total 148 cases have
been detected at the border since the establishment of MIFs/MIQs.
Cases in hospital
6. As at 0800 16 September there are three cases in hospital with COVID-19.7
o One death was reported. The case was in ICU at Waikato Hospital on 15 September.
o The case in Middlemore ICU is receiving ward level treatment and will be transferred
to a general ward.
Table 3: Number of cases in hospital with COVID-19 by DHB as at 0800 16 September 2020
4 ESR WGS report 03 September 2020
5 NRHCC Morning Report, 0900 16 September 2020
6 EpiSurv Database, 0900 16 September 2020
7 NRHCC Morning Report 16 September 2020 and COVID-19 Hospital Summary, 0900 16 September 2020
DHB Hospital Number in a general ward Number in ICU/HDU
Auckland Auckland City 1 0
Waitematā North Shore 0 1
Counties Manukau Middlemore 0 1
Waikato Waikato 0 0
Total - 1 2

IN CONFIDENCE – NOT FOR DISTRIBUTION
4
Health system response
Overall approach
7. Our investigation has two main focus areas that run in parallel:
o Source attribution – a focus on investigating the case with the earliest symptom
onset date to gather details actions of movements 14 days prior. This will help to
understand the possible source of the new outbreak.
o Containment – rigorous case investigation, identification of close contacts and
isolation and testing to ensure that chain of transmission is broken.
Current outbreak overview8
o There are two sub-clusters which most new community cases are linked to (Mount
Roskill Evangelical Church and Bereavements sub-clusters). There are 33 confirmed
cases in the Mount Roskill Evangelical Church sub-cluster and 15 confirmed cases in the
Bereavements sub-cluster.
Current outbreak investigation priorities
o Contact tracing and containment of Mount Roskill Evangelical Church sub-cluster and
recent bereavement events.
o Contact tracing and containment of Botany sub-cluster.
o Clarify whether June border case is a new infection and clarify strain.
o Seek to identify epidemiological link for index case in Mount Roskill Evangelical Church
sub-cluster.
o Waikato PHU will scope any positive cases in MIFs in the Auckland region for the next
week to alleviate some workload pressure at ARPHS.
o Investigation and close contact tracing of Jet Park healthcare worker9
Sub-clusters and settings of interest8
8. A healthcare worker at Jet Park was reported as a case on the 13 September Sitrep. The
case has been genomically linked to the Auckland Community Cluster. The
epidemiological link has been identified to a community case who was completing
isolation at Jet Park and required hospitalisation. A review is underway of the processes
at Jet Park with a focus on lessons learnt by this situation.
The case is isolating at Jet Park facility. Scoping by ARPHS is underway to identify close
and casual contacts. The case has five household close contacts who are self-isolating
at home. All five household contacts initially returned negative test results and were
retested on 15 September, results expected today (16 September)9 All staff at Jet Park
staff who are considered close contacts have been stood down and have returned
8 ARPHS Strategic Report 08 September 2020
9 NRHCC Morning Report, 0900 16 September 2020

IN CONFIDENCE – NOT FOR DISTRIBUTION
5
negative results so far.9 CCTV footage at the facility will be reviewed as part of the
scoping process. Community contact tracing is underway.10 A total of 29311 gym users
have been identified between three exposure events at Les Mills gym classes on 9 and
10 September (See table 4 for further details). These people are in the process of being
contacted by NCTS and are all being encouraged to be tested.12 Contacts at exposure
events at The Warehouse, Starbucks and Countdown are all considered casual contacts
only.13
9. On 7 September several exposure events were identified with epidemiological links to
Mt Roskill Evangelical Church sub-cluster. Between 24 August and 2 September there
were multiple gatherings associated with bereavement of a (non COVID-19 related)
death, including a funeral on Active monitoring and follow up of
compliance with self-isolation is ongoing with contacts associated with these events.13
10. St Dominic’s College in Henderson, Auckland, was identified as a setting of interest on 8
September. A confirmed case linked to the bereavement sub-cluster
The school has
been informed and communications have been sent. A list of contacts has been
gathered by the school and includes 87 students and 11 teachers.14 The school was
reopened on 14 September and casual contacts will be able to attend.13
11. A confirmed case linked to the bereavement sub-cluster worked as a bus driver for two
days while infectious but pre-symptomatic. wore a facemask and had 2m distance
from passengers due to Auckland Transport policy. A contact tracing exercise based on
HOP card data is ongoing. No further contacts have been identified as of 14 September
regarding this case.15
o 293 individuals rode these routes on 3 and 4 September, all of whom are casual
contacts. No individual rode the bus for more than two hours cumulatively over
these two days.
o There are two close contacts, they are in self-isolation.
12. members of one of the families in the Botany sub-cluster had serology testing on
11 September and all returned negative results.11 A case reported in 14 September
SitRep is also associated with the Botany sub-cluster. The case is and has
been in isolation at Jet Park since 30 August due to being a household contact of a
confirmed case. The case and their close contacts will remain in isolation for a further
14 days.11
10 ARPHS text 1000 13 September 2020
11 Email update from ARPHS 0848 15 September 2020
12 MoH, ARPHS teleconference 1500 14 September 2020
13 NRHCC Morning Report 0900 14 September 2020
14 ARPHS email 1800 11 September 2020
15 NRHCC Morning Report, 0900 15 September 2020
s 9(2)(a)
s 9(2)(a)
s 9(2)(a)
s 9(2)(a)
s 9(2)(a)
s 9(2)(a)

IN CONFIDENCE – NOT FOR DISTRIBUTION
6
Case investigation
13. Source investigation for the epidemiological link to the main cluster for four cases that
have been genomically linked to the main cluster is ongoing:
o The
o GP
o The second Mount Albert Grammar student
o The Botany case
Self-isolation compliance16
14. Discussions with a key representative from Ngaa Amokura have confirmed that the
option below will reinforce the trust/relationship between the health sector and the
fellowship whanau for supporting compliance with self-isolation requirements (to be
used if standard contact tracing cannot be established within 48 hrs).
o Engagement of the Kaimanaaki workforce (community champions employed by our
Māori providers in the community). Kaimanaaki have access to clinical
support/advice. And will support and enable whānau wellbeing through the
pandemic. They have specific skills to help whānau cope with isolation. They are also
trained in the use of PPE so can make house visits and/or contact whānau by phone
for the duration of their isolation. Daily contact is anticipated and Kaimanaaki will
report back to the DHB/public health officials on a daily basis. An implementation
plan is being developed and will be stood up on 14 September.
16 ADHB Email, 1000 11 September 2020
s 9(2)(a)
s 9(2)(a)

7
IN CONFIDENCE – NOT FOR DISTRIBUTION
s 9(2)(a)
s 9(2)(a)

8
IN CONFIDENCE – NOT FOR DISTRIBUTION
ESR and wider testing17 15. A further 10 community cases are genomically linked with the Auckland cluster. These
cases are from the following known subclusters; Church 1 (1 cases), Church 3 (5 cases),
Americold HH (2 cases), MREF Bereavement (C-0018) (2 cases). A total of 153 cases
(86%) from the community cluster have now been sequenced, of which 134 (76%)
yielded a high quality genome.
16.
17. Ongoing analysis of the whole genome sequencing results is being used to show how
COVID-19 has been transmitted through the community cluster and to further inform
its management.
18. No direct links have been found between the community outbreak genome
sequencing, and the 65 full genomes (49 high quality) currently available from cases
detected in border arrivals in managed isolation facilities (MIFs). There has been one
case in a health worker at a managed isolation facility. WGS results indicate that this
case is genomically linked to the Auckland community cluster and clustered closely with
three community cases in the managed isolation facility (as discussed in para 8).
19.
Table 5: Sub-cluster sequencing table as at 14 September 202018
Sub-cluster Sequenced and
Genomically Clustered
Sequence Not
available
Total
Americold 9 1 10
Americold HH 24 3 27
7 1 8
Botany 4 1 5
3 0 3
Church 1 22 4 26
17 ESR Whole Genome Sequencing Report 02 September 2020, Email 0946 16 September 2020
18 ESR email 1608 14 September 2020
s 9(2)(a)
s 9(2)(a)
s 9(2)(g)(i)
s 9(2)(g)(i)

IN CONFIDENCE – NOT FOR DISTRIBUTION
9
Church 2 14 5 19
Church 3 24 9 33
Finance Now 6 1 7
Finance Now HH 4 1 5
Household 1 5 0 5
Household 2 2 0 2
Household 3 3 0 3
MREF-Bereavement 2 13 15
GP 5 0 5
NZ Courier Post 1 1 2
Pending 0 2 2
Warehouse 1 0 1
Contact tracing19 20. Between 07 and 13 September 70% (465/663) of Community close contacts and 100%
(25/25) MIQ close contacts have been contacted within 48 hours of being determined
to be a contact. KPI for this metric is 80% of close contacts within 48 hours.
Table 6: Close contact tracing recorded in the National Contact Tracing Solution since 12 August as at
0830 16 September 2020
13/09/2020 14/09/2020 15/09/2020 16/09/2020
Number of close contacts
identified1 3664 3708 3779 4139
Number of close contacts
successfully contacted (and are
self-isolating)
3650 3697 3772 4046
Number of close contacts
referred to "finding services"2 0 0 0 8
Number of close contacts
awaiting contact 14 11 7 85
1. Contacts loaded into the National Contact Tracing Solution, and managed by either the National Investigation and Tracing
Unit or the Public Health Units. Contacts from MIQ and overseas cases are not included in this report.
19 COVID-19 NCCS Analytics and Reporting 0924 16 September 2020
s 9(2)(a)

IN CONFIDENCE – NOT FOR DISTRIBUTION
10
2. "Finding services" refers to the mechanism the National Close Contact Service uses to find valid contact details for close
contacts we do not have the correct contact details for. These services utilise internal Ministry of Health databases along with
Police, Customs and Airlines where relevant.
3. The total number and number successfully contacted can decrease due to duplicates and invalid records being removed from
the system.
COVID-19 Tracer App usage20 21. Since 20 May 2020, a total of 18 contact alerts have been sent out from the NCTS
system for exposure events. These exposure events are ones where contact tracers
deem a positive case to have been in a location where a risk of transmission warrants
releasing a contact alert (these are also notified on the Ministry of Health website).
22. Since 03 September 2020 (Release 4 of the app), we have measured that the app has
notified 113 people where a contact alert was presented because they had been in a
location of interest (we were not recording this before Release 4).
Figure 1: COVID-19 Tracer App cumulative registered users and daily scans/manual entries as at 1615
15 September 2020
1. The number of scans and manual entries on any given date is subject to change for up to 31 days. This is because there can be
a delay before anonymised analytic information is received (e.g. device not connected to internet when scan carried out).
2. The number of App registrations and QR codes for any given date is subject to change for up to 1 day. This is because due to
reporting timeframes these numbers may be extracted before the 12pm cut-off for the reporting period.
20 Response Analyst – Digital Channels, 1618 15 September 2020
0
500,000
1,000,000
1,500,000
2,000,000
2,500,000
0
500,000
1,000,000
1,500,000
2,000,000
2,500,000
20/0
523
/05
26/0
529
/05
01/0
604
/06
07/0
610
/06
13/0
616
/06
19/0
622
/06
25/0
628
/06
01/0
704
/07
07/0
710
/07
13/0
716
/07
19/0
722
/07
25/0
728
/07
31/0
703
/08
06/0
809
/08
12/0
815
/08
18/0
821
/08
24/0
827
/08
30/0
802
/09
05/0
908
/09
11/0
914
/09
Da
ily
sca
ns
an
d m
an
ua
l e
ntr
ies
Cu
mu
lati
ve
Ap
p r
eg
istr
ati
on
s
Day and month
Cumulative App registrations Daily scans and manual entries

IN CONFIDENCE – NOT FOR DISTRIBUTION
11
Testing21 Table 7: Testing by functional groups, as at 0900 16 September 2020
*Numbers have been sourced from different data extracts in comparison to Table 7.
Laboratory testing numbers22 Table 8: Number of laboratory tests processed nationally as at 0900 16 September 2020
Testing supply update23
23. There are no issues with regent supplies, and hologic supplies are now in labs around
the country. There are 43 days of reagent stocks on hand nationally.
21 ÉCLAIR/MoH Public Health Intelligence, 1000 16 September 2020
22 Daily Lab Report, 0952 16 September 2020
23 Testing supply email, 1001 09 September 2020
Reason for test 15 September 09–15 September
GPs and other primary health 2841 18,333
CBACs and pop-ups 2971 23,201
Border workers - air crew 29 206
Border workers - airport staff 152 1114
Border workers - maritime crew 13 13
Border workers – Port of Tauranga staff 34 43
Border workers – Remaining Port staff 4 121
Border workers - MIF 165 1006
Border workers - MIQ 21 462
Travellers - Staying at MIF 255 1989
Travellers - Staying at MIQ 4 244
Total 6489* 46,732
Time period Number of laboratory tests
15 September 9088*
Last 7 days (09 Sep to 15 Sep) 50,015
Total 881,532

IN CONFIDENCE – NOT FOR DISTRIBUTION
12
Testing activity by region
Focus areas
24. As at 1700 08 September there are 28 Community testing Centres in the Metro
Auckland area. Three of these are closed CTC's for close contacts only.24
Healthline updates25 25. On 15 September there were 2,579 contacts in Healthline. Of those calls, 1,208 were to
the COVID-19 Info line. Demand on 1737 Need to talk? and other mental health services
was 659 contacts (in line with forecast).
26. The main themes yesterday/today:
o National Telehealth Service (Healthline) continued to take calls related to the
exposure events and media reporting caused confusion on this. It maybe timely to
clarify close and casual contact information again.
o Ongoing confusion around alert leave rules (i.e. crowd sizes in Auckland, around the
rest of the country etc).
o Most of the general public Service Users were calling because they are symptomatic
and wanted to be tested.
Logistics
Health Workforce26
27. Health Workforce continue to work with employers who have expressed a need for
assistance with identifying people who are willing to work within the health system and
to provide some relief from COVID-19 related staffing issues.
28. Upskilling of alternative workforces for testing continues to progress. Health Workforce
are currently engaged with Careerforce and DHBs to create a testing workforce training
and education package. This will be utilised by DHBs across the country, to increase the
pool of people who are able to perform COVID-19 testing. Following on from the
didactic component, will be practical training and assessment, which will continue to be
provided by the relevant DHB.
29. Health Workforce are monitoring staffing needs in MIFs facilities and are providing
support where possible.
24 Community Testing Centres report, 1800 08 September 2020
25 National Telehealth Service Coronavirus Update, 0939 16 September 2020
26 Health Workforce Directorate, 0945 14 September 2020

IN CONFIDENCE – NOT FOR DISTRIBUTION
13
Hospital capacity27 Table 9: Number and occupancy of hospital beds by type as at 0800 16 September 2020
Type Number of units Number (%) occupied/in use
ICU and HDU beds 365 228 (62.5%)
Ventilators 323 51 (15.8%)
Ward beds 7847 6439 (82.1%)
27 COVID-19 Hospital Summary, 0938 16 September 2020

14
IN CONFIDENCE – NOT FOR DISTRIBUTION
Appendix 1: Case summary Table 10: All community cases reported between 0900 15 September and 0900 16 September. Source: ESR EpiSurv Extract 0900 16 September 2020
Cumulative
Number
Date tested
positive Onset date
Case
status DHB Sex Age Ethnicity
Symptoms
[Yes/No] Hospitalised Occupation Source of transmission

15
IN CONFIDENCE – NOT FOR DISTRIBUTION
Appendix 2: COVID-19 Provisional Disease Indicators, by date
of case notification19 Table 11: NCTS data for cases in the community
Indicator (as per Table
9832) Refined Indicator description Target 8 Sept 9 Sept 10 Sept 11 Sept 12 Sept
** 13 Sept
** 14 Sept
**
1 - (S001) Time from exposure to contact isolation / quarantine 80% within 96 hours 4% 0% 100% 5% - - -
2 – (S002) Time from case first symptom to contact isolation / quarantine 80% within 96 hours 4% 0% 100% 58% - - -
3 – (S003) Time from test sample taken to close contact isolation / quarantine 80% within 72 hours 4% 100% 100% 89% 38% - -
4 – (C001) Time from first symptom to test sample taken for positive cases 80% within 48 hours 33% 0% 100% 67% 100% - -
5 – (L001) Time from test sample taken to notification of positive result 80% within 24 hours 80% 0% 100% 67% 100% - 0%
6 – (P002) Time from case notification to isolation / quarantine of contact 80% within 48 hours 87% 100% 100% 89% 38% - -
7 – (P001) Time from notification to case interview 80% within 24 hours 100% 100% 100% 100% 100% - 100%
8 – (P003) Time from close contact identification to isolated / quarantined 80% within 24 hours 97% 100% 100% 100% 79% - 100%
10 – (P004) Proportion of contacts traced in 48 hours 80% within 48 hours 88% 100% 100% 100% 87% - -
C – (S005) Proportion of close contacts with confirmed or suspected COVID-19 at the time of tracing <20% 1% 0% 0% 0% 0% - 0%
• * The numerator and denominator are provided in some instances to provide context for low percentages.
• **Data is not available for metrics where there is no data that meets the definition, or where the time/days to reach target has not fully elapsed
• The value of P002 can drop due to the addition of new close contacts to exposure events after the 48-hour period since case notification had elapsed. This can happen for a number of reasons, including a case recalling further details following the original case
interview.
• These metrics report all cases during the specified period, including those in Managed Isolation and Quarantine, and do not include casual contacts.
• There are three additional indicators under development requiring both technical and clinical input to define data requirements. These are due to be completed by end October 2020.

IN CONFIDENCE – NOT FOR DISTRIBUTION
16
Table 12:NCTS data for cases in the community Managed Isolation and Quarantine, International, and Unknown
Indicator (as per Table 9832) Refined Indicator description Target 8 Sept ** 9Sept ** 10 Sept ** 11 Sept ** 12 Sept ** 13 Sept ** 14 Sept **
1 - (S001) Time from exposure to contact isolation / quarantine
80% within 96 hours - - - - - - -
2 – (S002) Time from case first symptom to contact isolation / quarantine
80% within 96 hours - - - - - - -
3 – (S003) Time from test sample taken to close contact isolation / quarantine
80% within 72 hours - 100% - - 100% - -
4 – (C001) Time from first symptom to test sample taken for positive cases
80% within 48 hours - 0% - - - - -
5 – (L001) Time from test sample taken to notification of positive result
80% within 24 hours - 100% - - 0% - 0%
6 – (P002) Time from case notification to isolation / quarantine of contact
80% within 48 hours - 100% - - 100% - -
7 – (P001) Time from notification to case interview 80% within 24 hours - 100% - - 100% - 0%
8 – (P003) Time from close contact identification to isolated / quarantined
80% within 24 hours 100% 100% - - 89% - -
10 – (P004) Proportion of contacts traced in 48 hours 80% within 48 hours - 100% - - 100% - -
C – (S005) Proportion of close contacts with confirmed or suspected COVID-19 at the time of tracing
<20%
0% 0% - - 0% - -
Note:
• * The numerator and denominator are provided in some instances to provide context for low percentages.
• **Data is not available for metrics where there is no data that meets the definition, or where the time/days to reach target has not fully elapsed
• The value of P002 can drop due to the addition of new close contacts to exposure events after the 48-hour period since case notification had elapsed. This can happen for a number of reasons, including a case recalling further details following the original case
interview.
• These metrics report all cases during the specified period, including those in Managed Isolation and Quarantine, and do not include casual contacts.
• There are three additional indicators under development requiring both technical and clinical input to define data requirements. These are due to be completed by end October 2020.

17
IN CONFIDENCE – NOT FOR DISTRIBUTION
Appendix 3: NRHCC Testing Report
Novel Coronavirus (COVID-19)
Issued: 1700 15 September
Table 13: Metro Auckland Summary Total of Testing for 15 September 2020
Community MIQ
staff
MIQ
guests
Airport Maritime
port
Ship’s
Crew
TOTAL
5:00pm 1558 113 688 137 18* 0 2514
*Note: the Port was an afternoon start and is running through until 8pm tonight
Table 14: Estimated tests taken since 12 August 2020, based on manual site reports at 5pm
Site 12/08-16/08 17/08-
23/08
24/08 –
30/08
31/08 –
06/09
07/09 –
13/09
14/09 15/09*
MIQ Staff 2132 659 1488 912 1086 136 113
Guests 2972 3767 3600 3406 3424 648 688
Border Airport 2129 933 1349 1158 853 156 137
Port 1588 678 161 392 153 90 18
Crew 0 0 0 0 0 0 0
* 15/09 day still in progress
Table 15: Estimated tests taken at Metro Auckland CTCs, since 12 August 2020, based on manual site
reports at 4pm
Site 12/08-
16/08
17/08-
23/08
24/08 –
30/08
31/08 –
06/09
07/09 –
13/09
14/09 15/09*
Airport Oaks 1148 515 366 265 181 27 19
Botany CTC 1151 948 905 749 681 126 151
Health New Lynn 2603 1258 1703 732 889 148 125
Mangere Town Centre 1748 1684 1599 860 660 75 109
Otara CTC 3221 1712 1429 930 699 91 78
St Lukes 1368 1045 1414 797 666 204 132
Takanini Urgent Care 1886 1216 1153 684 440 93 108
Whanau House 2502 1371 1442 928 1613 219 174

IN CONFIDENCE – NOT FOR DISTRIBUTION
18
Whanau Ora - Central 1957 964 1583 937 783 100 84
Whanau Ora - North 1442 669 637 982 947 208 186
Whanau Ora - South 2945 1250 718 677 620 48 69
Henderson (EFKS
Church) Pop Up
N/A N/A N/A N/A 460 43 46
Henderson (Te
Wananga O Aotearoa)
Pop Up
N/A N/A N/A N/A N/A 44 22
Manurewa (Netball
Courts) Pop Up
N/A N/A N/A N/A N/A 44 50
Mt Wellington Pop Up N/A N/A N/A N/A N/A N/A 53
Wairau Valley Pop Up N/A N/A N/A N/A N/A N/A 60
Otahuhu Pop Up N/A N/A N/A N/A N/A N/A 22
Papatoetoe Pop Up N/A N/A N/A N/A N/A N/A 10
Waipuna Targeted Site 143 549 376 219 251 28 46
Henderson Targeted
Site
N/A N/A N/A N/A 631 20 14
Total 26,148 16,781 21,215 13,002 10,475 1518 1558
*15/09 day still in progress; N/A = not open as a CTC; Previous sites that are no longer open are not
included in this report
CTCs and mobile testing site locations
Please see https://www.arphs.health.nz/public-health-topics/covid-19/where-to-get-tested for the
most up-to-date information on CTCs and mobile testing sites in the Auckland region.

IN CONFIDENCE – NOT FOR DISTRIBUTION
19
Appendix 4: Testing by DHB and ethnicity The tables that follow are the number of people tested. The numbers in the laboratory testing
section are the number of laboratory tests processed.
Table 16: Number of people tested for COVID-19 from 12 August to 15 September
Prioritised ethnicity MPAO
DHB of domicile Māori Pacific Asian Other Unknown Total
Auckland 3467 7103 9433 20,264 388 40,655
Bay of Plenty 2622 297 585 6647 63 10,214
Canterbury 1624 631 1775 13,683 212 17,925
Capital and Coast 1485 1114 1398 9358 213 13,568
Counties Manukau 7392 19,936 9139 12,774 440 49,681
Hawkes Bay 1426 301 232 3620 60 5639
Hutt Valley 815 533 564 3189 43 5144
Lakes 2324 302 463 3227 95 6411
MidCentral 1037 259 369 4232 89 5986
Nelson Marlborough 602 187 277 4332 58 5456
Northland 3059 208 270 4125 50 7712
South Canterbury 146 35 79 1749 11 2020
Southern 1108 383 717 10,191 92 12,491
Tairāwhiti 875 56 64 800 23 1818
Taranaki 693 69 175 2683 46 3666
Waikato 4361 1005 1522 10,293 243 17,424
Wairarapa 235 39 46 1108 8 1436
Waitematā 4832 5274 8295 25,758 341 44,500
West Coast 47 10 13 330 6 406
Whanganui 647 77 72 1459 15 2270
Unknown 1429 711 728 4246 1891 9009
Total 40,226 38,530 36,216 144,069 4387 263,432
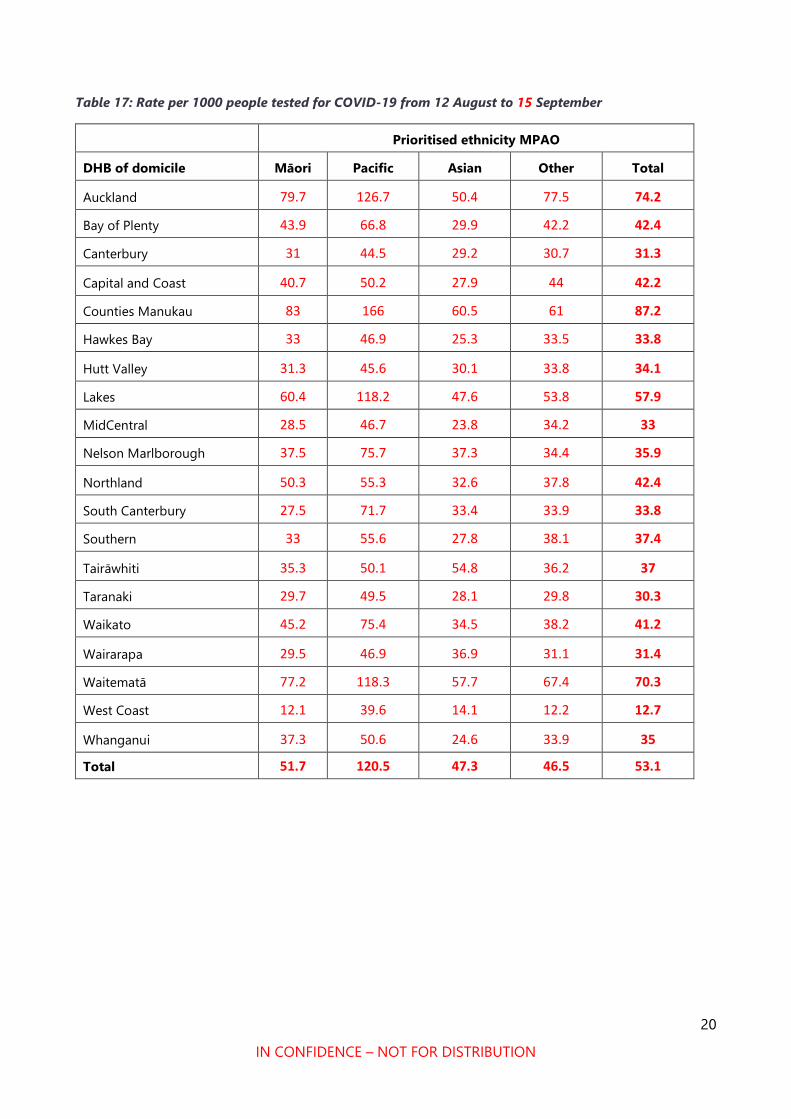
20
IN CONFIDENCE – NOT FOR DISTRIBUTION
Table 17: Rate per 1000 people tested for COVID-19 from 12 August to 15 September
Prioritised ethnicity MPAO
DHB of domicile Māori Pacific Asian Other Total
Auckland 79.7 126.7 50.4 77.5 74.2
Bay of Plenty 43.9 66.8 29.9 42.2 42.4
Canterbury 31 44.5 29.2 30.7 31.3
Capital and Coast 40.7 50.2 27.9 44 42.2
Counties Manukau 83 166 60.5 61 87.2
Hawkes Bay 33 46.9 25.3 33.5 33.8
Hutt Valley 31.3 45.6 30.1 33.8 34.1
Lakes 60.4 118.2 47.6 53.8 57.9
MidCentral 28.5 46.7 23.8 34.2 33
Nelson Marlborough 37.5 75.7 37.3 34.4 35.9
Northland 50.3 55.3 32.6 37.8 42.4
South Canterbury 27.5 71.7 33.4 33.9 33.8
Southern 33 55.6 27.8 38.1 37.4
Tairāwhiti 35.3 50.1 54.8 36.2 37
Taranaki 29.7 49.5 28.1 29.8 30.3
Waikato 45.2 75.4 34.5 38.2 41.2
Wairarapa 29.5 46.9 36.9 31.1 31.4
Waitematā 77.2 118.3 57.7 67.4 70.3
West Coast 12.1 39.6 14.1 12.2 12.7
Whanganui 37.3 50.6 24.6 33.9 35
Total 51.7 120.5 47.3 46.5 53.1

1
IN CONFIDENCE – NOT FOR DISTRIBUTION
SITREP 055
Coronavirus disease 2019 (COVID-19)
Issued: 1030 hours 17 September 2020
Information current at: 1000 hours
This report provides a daily update on the COVID-19 health system response. New information is denoted by red text.
Please use the single point of contact email [email protected] for help/support. Your email will be
logged and promptly passed to the appropriate team.
This document is classified IN CONFIDENCE and not for further distribution.
Need to know
COMMUNITY CASES
NEW LAST 24 hrs
0
IMPORTED MIQ
CASES
NEW LAST 24 hrs
7
COMMUNITY CASES
TOTAL RECOVERED
133
122
COMMUNITY CASES
ACTIVE
44 TOTAL CASES SINCE 11 AUG
180
33
TOTAL IMPORTED MIQ CASES
155
TOTAL ACTIVE CASES IN NZ (COMMUNITY & MIQ): 77
IMPORTED MIQ CASES
TOTAL RECOVERED
IMPORTED MIQ CASES
ACTIVE
LABORATORY TESTS
LAST 24 hrs
8,185
LABORATORY TESTS
LAST SEVEN DAYS
50,250
LABORATORY TESTS
TOTAL
889,717
CASES DECEASED
3

IN CONFIDENCE – NOT FOR DISTRIBUTION
2
Total COVID-19 cases
Table 1: Total number of COVID-19 cases as at 0900 17 September 20201
Case Status Active Recovered Deceased Total
Confirmed 77* (-2) 1361 (+9) 20 1458 (+7)
Probable 0 346 5 351
Total 77* (-2) 1707 (+9) 25 1809 (+7)
*7 new case identified, 9 cases classified as recovered.
Total community cases since 11 August
Table 2: Community cases by DHB and case status as at 0900 17 September 20201
New community cases since 0900 16 September 20202
1. No new community cases have been reported, as at 0900 17 September.
Community cases linked to the Auckland Community Cluster August 20203
2. 178 of the 180 community cases have been linked to the Auckland Community Cluster
August 2020, as at 0900 17 September. The unlinked cases are summarised as follows:
o The Rydges employee (this investigation has been closed).
o A case (reported 21 August) is still under investigation for an epidemiological link to
the community cluster. There is insufficient data to confirm a genomic link to the
community cluster (see 3).
Community cases under investigation to determine a link to the Auckland community
cluster
3. The case under investigation is summarised as follows:
o One case came through the border on 18 June. The case tested negative at Day 3
and Day 12 of quarantine. The case subsequently tested positive on 21 August.
Despite using two different whole genome sequencing protocols only there is
1 EpiSurv Database, 0900 17 September 2020
2 EpiSurv Database, 0900 17 September 2020
3 EpiSurv Database, 0900 17 September 2020
Case
Status
Counties Manukau Waitematā Auckland Waikato Total
Confirmed 77 55 46 1 179
Probable 1 0 0 0 1
Total 78 55 46 1 180

IN CONFIDENCE – NOT FOR DISTRIBUTION
3
insufficient data to confirm the case is genomically linked to the community cluster.4
Their epidemiological link to the community cluster is still under investigation. As at
15 September no additional information has been revealed by the investigation.
Community cases and household contacts at Jet Park
4. As at 0800 17 September there are 54 people isolating in Jet Park from the community.
23 are confirmed cases, the remaining 31 are household contacts. This number will
fluctuate as people finish their isolation and depart from the facility.5
MIQ cases since 0900 16 September 20206
5. Seven new cases detected at the border, as at 0900 17 September. In total 155 cases
have been detected at the border since the establishment of MIFs/MIQs.
o One case is in managed isolation in Wellington, arriving from the United States of
America and was identified through routine day 3 testing.
o Three cases were in managed isolation in Hamilton upon arriving from India and
were identified through routine day 3 testing. The cases have been transferred to Jet
Park, Auckland for quarantine due to positive test results.
o One case was managed isolation in Hamilton upon arriving from Uzbekistan and was
identified through testing due to showing symptoms. The case has been transferred
to Jet Park, Auckland for quarantine due to positive test.
o One case is in managed isolation in Christchurch, arriving from the Indonesia and
was identified through routine day 3 testing.
o One case is in managed isolation in Hamilton upon arriving from India and were
identified through routine day 3 testing.
4 ESR WGS report 03 September 2020
5 NRHCC Morning Report, 0900 17 September 2020
6 EpiSurv Database, 0900 17 September 2020

IN CONFIDENCE – NOT FOR DISTRIBUTION
4
Cases in hospital
6. As at 0800 17 September there are four cases in hospital with COVID-19.7
o Case in Waitematā ICU was transferred to a general ward on 16 September.
o One new admission to Counties Manukau overnight of an existing case from Jet Park.
Table 3: Number of cases in hospital with COVID-19 by DHB as at 0800 17 September 2020
Health system response
Overall approach
7. Our investigation has two main focus areas that run in parallel:
o Source attribution – a focus on investigating the case with the earliest symptom
onset date to gather details actions of movements 14 days prior. This will help to
understand the possible source of the new outbreak.
o Containment – rigorous case investigation, identification of close contacts and
isolation and testing to ensure that chain of transmission is broken.
Current outbreak overview8
o There are two sub-clusters which most new community cases are linked to (Mount
Roskill Evangelical Church and Bereavements sub-clusters). There are 33 confirmed
cases in the Mount Roskill Evangelical Church sub-cluster and 15 confirmed cases in the
Bereavements sub-cluster.
Current outbreak investigation priorities
o Contact tracing and containment of Mount Roskill Evangelical Church sub-cluster and
recent bereavement events.
o Contact tracing and containment of Botany sub-cluster.
o Clarify whether June border case is a new infection and clarify strain.
o Seek to identify epidemiological link for index case in Mount Roskill Evangelical Church
sub-cluster.
7 NRHCC Morning Report 17 September 2020
8 ARPHS Strategic Report 08 September 2020
DHB Hospital Number in a general ward Number in ICU/HDU
Auckland Auckland City 1 0
Waitematā North Shore 1 0
Counties Manukau Middlemore 0 2
Total - 2 2
IN CONFIDENCE – NOT FOR DISTRIBUTION
5
o Waikato PHU will scope any positive cases in MIFs in the Auckland region for the next
week to alleviate some workload pressure at ARPHS.
o Investigation and close contact tracing of Jet Park healthcare worker9
Sub-clusters and settings of interest8
8. A healthcare worker at Jet Park was reported as a case on the 13 September Sitrep. The
case has been genomically linked to the Auckland Community Cluster. The
epidemiological link has been identified to a community case who was completing
isolation at Jet Park and required hospitalisation. A review is underway of the processes
at Jet Park with a focus on lessons learnt by this situation.
The case is isolating at Jet Park facility. Scoping by ARPHS is underway to identify close
and casual contacts. The case has five household close contacts who are self-isolating
at home. All five household contacts initially returned negative test results and were
retested on 15 September, results are pending.9 All staff at Jet Park staff who are
considered close contacts have been stood down and have returned negative results so
far.9 CCTV footage at the facility will be reviewed as part of the scoping process.
9. members of one of the families in the Botany sub-cluster had serology testing on
11 September and all returned negative results. A case reported in 14 September
SitRep is also associated with the Botany sub-cluster.
10. An existing confirmed case has been identified as attending school for
prior to been taken home due to feeling unwell.10 The school
has been closed for 3 days as a precaution while close contact tracing is completed.
Part of the investigation will focus on what the child did while at school.
Case investigation
11. Source investigation for the epidemiological link to the main cluster for four cases that
have been genomically linked to the main cluster is ongoing:
o The
o GP
o The second Mount Albert Grammar student
o The Botany case
Self-isolation compliance11
12. Discussions with a key representative from Ngaa Amokura have confirmed that the
option below will reinforce the trust/relationship between the health sector and the
fellowship whanau for supporting compliance with self-isolation requirements (to be
used if standard contact tracing cannot be established within 48 hrs).
9 NRHCC Morning Report, 0900 16 September 2020
10 NRHCC Morning Report 17 September 2020
11 ADHB Email, 1000 11 September 2020
s 9(2)(a)
s 9(2)(a)
s 9(2)(a)
s 9(2)(a)

IN CONFIDENCE – NOT FOR DISTRIBUTION
6
o Engagement of the Kaimanaaki workforce (community champions employed by our
Māori providers in the community). Kaimanaaki have access to clinical
support/advice. And will support and enable whānau wellbeing through the
pandemic. They have specific skills to help whānau cope with isolation. They are also
trained in the use of PPE so can make house visits and/or contact whānau by phone
for the duration of their isolation. Daily contact is anticipated and Kaimanaaki will
report back to the DHB/public health officials on a daily basis. An implementation
plan is being developed and will be stood up on 14 September.

7
IN CONFIDENCE – NOT FOR DISTRIBUTION
s 9(2)(a)
s 9(2)(a)
8
IN CONFIDENCE – NOT FOR DISTRIBUTION
ESR and wider testing12 13. A further 10 community cases are genomically linked with the Auckland cluster. These
cases are from the following known subclusters; Church 1 (1 cases), Church 3 (5 cases),
Americold HH (2 cases), MREF Bereavement (C-0018) (2 cases). A total of 153 cases
(86%) from the community cluster have now been sequenced, of which 134 (76%)
yielded a high quality genome.
14.
15. Ongoing analysis of the whole genome sequencing results is being used to show how
COVID-19 has been transmitted through the community cluster and to further inform
its management.
16. No direct links have been found between the community outbreak genome
sequencing, and the 65 full genomes (49 high quality) currently available from cases
detected in border arrivals in managed isolation facilities (MIFs). There has been one
case in a health worker at a managed isolation facility. WGS results indicate that this
case is genomically linked to the Auckland community cluster and clustered closely with
three community cases in the managed isolation facility (as discussed in para 8).
17.
12 ESR Whole Genome Sequencing Report 02 September 2020, Email 0946 16 September 2020
s 9(2)(g)(i)
s 9(2)(g)(i)

IN CONFIDENCE – NOT FOR DISTRIBUTION
9
Figure 1: Number of cases that have been whole genome sequenced and are genomically clustered
with the Auckland August cluster by sub-cluster as at 14 September 202013
Source: ESR *A sample may not have been received by ESR, may not have been sequenced yet or a sequencing result could not be
obtained from the sample received.
Contact tracing14 18. Between 08 and 14 September 62% (363/584) of Community close contacts and 100%
(22/22) MIQ close contacts have been contacted within 48 hours of being determined
to be a contact. KPI for this metric is 80% of close contacts within 48 hours.
o Note: This metric is low for community cases as it includes some casual contacts associated with
the Les Mills exposure events. This will be rectified in reporting tomorrow.
Table 5: Close contact tracing recorded in the National Contact Tracing Solution since 12 August as at
0830 17 September 2020
14/09/2020 15/09/2020 16/09/2020 17/09/2020
Number of close contacts
identified1 3708 3779 4139 4043
Number of close contacts
successfully contacted (and are
self-isolating)
3697 3772 4046 4036
Number of close contacts
referred to "finding services"2 0 0 8 1
13 ESR email 1608 14 September 2020
14 COVID-19 NCCS Analytics and Reporting 0924 16 September 2020
0 5 10 15 20 25 30 35
Americold
Americold HH
Auckland Bus
Botany
Church 1
Church 2
Church 3
Finance Now
Finance Now HH
Household 1
Household 2
Household 3
MREF-Bereavement
GP
NZ Courier Post
Pending
Warehouse
Number of cases
Sequenced and genomically clustered Sequence not available*
s 9(2)(a)
s 9(2)(a)
s 9(2)(a)

IN CONFIDENCE – NOT FOR DISTRIBUTION
10
Number of close contacts
awaiting contact 11 7 85 6
1. Contacts loaded into the National Contact Tracing Solution, and managed by either the National Investigation and Tracing
Unit or the Public Health Units. Contacts from MIQ and overseas cases are not included in this report.
2. "Finding services" refers to the mechanism the National Close Contact Service uses to find valid contact details for close
contacts we do not have the correct contact details for. These services utilise internal Ministry of Health databases along with
Police, Customs and Airlines where relevant.
3. The total number and number successfully contacted can decrease due to duplicates and invalid records being removed from
the system.
COVID-19 Tracer App usage15 19. Since 20 May 2020, a total of 18 contact alerts have been sent out from the NCTS
system for exposure events. These exposure events are ones where contact tracers
deem a positive case to have been in a location where a risk of transmission warrants
releasing a contact alert (these are also notified on the Ministry of Health website).
20. Since 03 September 2020 (Release 4 of the app), we have measured that the app has
notified 113 people where a contact alert was presented because they had been in a
location of interest (we were not recording this before Release 4).
Figure 2: COVID-19 Tracer App cumulative registered users and daily scans/manual entries as at 1615
16 September 2020
1. The number of scans and manual entries on any given date is subject to change for up to 31 days. This is because there can be
a delay before anonymised analytic information is received (e.g. device not connected to internet when scan carried out).
2. The number of App registrations and QR codes for any given date is subject to change for up to 1 day. This is because due to
reporting timeframes these numbers may be extracted before the 12pm cut-off for the reporting period.
15 Response Analyst – Digital Channels, 1625 16 September 2020
0
500,000
1,000,000
1,500,000
2,000,000
2,500,000
0
500,000
1,000,000
1,500,000
2,000,000
2,500,000
20/0
523
/05
26/0
529
/05
01/0
604
/06
07/0
610
/06
13/0
616
/06
19/0
622
/06
25/0
628
/06
01/0
704
/07
07/0
710
/07
13/0
716
/07
19/0
722
/07
25/0
728
/07
31/0
703
/08
06/0
809
/08
12/0
815
/08
18/0
821
/08
24/0
827
/08
30/0
802
/09
05/0
908
/09
11/0
914
/09
Da
ily
sca
ns
an
d m
an
ua
l e
ntr
ies
Cu
mu
lati
ve
Ap
p r
eg
istr
ati
on
s
Day and month
Cumulative App registrations Daily scans and manual entries

IN CONFIDENCE – NOT FOR DISTRIBUTION
11
Testing16 Table 6: Testing by functional groups, as at 0900 17 September 2020
*Numbers have been sourced from different data extracts in comparison to Table 7.
Laboratory testing numbers17 Table 7: Number of laboratory tests processed nationally as at 0900 17 September 2020
Testing supply update18
21. There are no issues with regent supplies, and hologic supplies are now in labs around
the country. There are 43 days of reagent stocks on hand nationally.
16 ÉCLAIR/MoH Public Health Intelligence, 1000 17 September 2020
17 Daily Lab Report, 0843 16 September 2020
18 Testing supply email, 1001 09 September 2020
Reason for test 16 September 10–16 September
GPs and other primary health 3641 20,104
CBACs and pop-ups 3587 24,762
Border workers - air crew 44 225
Border workers - airport staff 221 1288
Border workers - maritime crew 2 15
Border workers – Port of Tauranga staff 88 131
Border workers – Remaining Port staff 34 130
Border workers - MIF 161 1101
Border workers - MIQ 22 455
Travellers - Staying at MIF 376 1887
Travellers - Staying at MIQ 9 253
Total 8185 50,351*
Time period Number of laboratory tests
16 September 8185
Last 7 days (10 Sep to 16 Sep) 50,250*
Total 889,717

IN CONFIDENCE – NOT FOR DISTRIBUTION
12
Healthline updates19 22. On 16 September there were 2,275 contacts in Healthline. Of those calls, 933 were to
the COVID-19 Info line. Demand on 1737 Need to talk? and other mental health services
was 695 contacts (slightly higher than forecast).
23. The main themes yesterday/today:
o National Telehealth Service (Healthline) continued to take calls related to the
exposure events and media reporting caused confusion on this. It maybe timely to
clarify close and casual contact information again.
o Ongoing confusion around alert leave rules (i.e. crowd sizes in Auckland, around the
rest of the country etc).
o Most of the general public Service Users were calling because they are symptomatic
and wanted to be tested.
Logistics
Health Workforce20
24. Health Workforce continue to work with employers who have expressed a need for
assistance with identifying people who are willing to work within the health system and
to provide some relief from COVID-19 related staffing issues.
25. Upskilling of alternative workforces for testing continues to progress. Health Workforce
are currently engaged with Careerforce and DHBs to create a testing workforce training
and education package. This will be utilised by DHBs across the country, to increase the
pool of people who are able to perform COVID-19 testing. Following on from the
didactic component, will be practical training and assessment, which will continue to be
provided by the relevant DHB.
26. Health Workforce are monitoring staffing needs in MIFs facilities and are providing
support where possible.
Hospital capacity21 Table 8: Number and occupancy of hospital beds by type as at 0800 17 September 2020
Type Number of units Number (%) occupied/in use
ICU and HDU beds 337 210 (62.3%)
Ventilators 296 59 (19.9%)
Ward beds 7219 5862 (81.2%)
19 National Telehealth Service Coronavirus Update, 0948 17 September 2020
20 Health Workforce Directorate, 0945 14 September 2020
21 COVID-19 Hospital Summary, 1000 17 September 2020

13
IN CONFIDENCE – NOT FOR DISTRIBUTION
Appendix 1: Case summary Table 9: All community cases reported between 0900 16 September and 0900 17 September. Source: ESR EpiSurv Extract 0900 17 September 2020
Cumulative
Number
Date tested
positive Onset date
Case
status DHB Sex Age Ethnicity
Symptoms
[Yes/No] Hospitalised Occupation Source of transmission

14
IN CONFIDENCE – NOT FOR DISTRIBUTION
Appendix 2: COVID-19 Provisional Disease Indicators, by date
of case notification14 Table 10: NCTS data for cases in the community
Indicator (as per Table
9832) Refined Indicator description Target 8 Sept 9 Sept 10 Sept 11 Sept 12 Sept
** 13 Sept
** 14 Sept
**
1 - (S001) Time from exposure to contact isolation / quarantine 80% within 96 hours 4% 0% 100% 5% - - -
2 – (S002) Time from case first symptom to contact isolation / quarantine 80% within 96 hours 4% 0% 100% 58% - - -
3 – (S003) Time from test sample taken to close contact isolation / quarantine 80% within 72 hours 4% 100% 100% 89% 38% - -
4 – (C001) Time from first symptom to test sample taken for positive cases 80% within 48 hours 33% 0% 100% 67% 100% - -
5 – (L001) Time from test sample taken to notification of positive result 80% within 24 hours 80% 0% 100% 67% 100% - 0%
6 – (P002) Time from case notification to isolation / quarantine of contact 80% within 48 hours 87% 100% 100% 89% 38% - -
7 – (P001) Time from notification to case interview 80% within 24 hours 100% 100% 100% 100% 100% - 100%
8 – (P003) Time from close contact identification to isolated / quarantined 80% within 24 hours 97% 100% 100% 100% 79% - 100%
10 – (P004) Proportion of contacts traced in 48 hours 80% within 48 hours 88% 100% 100% 100% 87% - -
C – (S005) Proportion of close contacts with confirmed or suspected COVID-19 at the time of tracing <20% 1% 0% 0% 0% 0% - 0%
• * The numerator and denominator are provided in some instances to provide context for low percentages.
• **Data is not available for metrics where there is no data that meets the definition, or where the time/days to reach target has not fully elapsed
• The value of P002 can drop due to the addition of new close contacts to exposure events after the 48-hour period since case notification had elapsed. This can happen for a number of reasons, including a case recalling further details following the original case
interview.
• These metrics report all cases during the specified period, including those in Managed Isolation and Quarantine, and do not include casual contacts.
• There are three additional indicators under development requiring both technical and clinical input to define data requirements. These are due to be completed by end October 2020.

IN CONFIDENCE – NOT FOR DISTRIBUTION
15
Table 11:NCTS data for cases in the community Managed Isolation and Quarantine, International, and Unknown
Indicator (as per Table 9832) Refined Indicator description Target 8 Sept ** 9Sept ** 10 Sept ** 11 Sept ** 12 Sept ** 13 Sept ** 14 Sept **
1 - (S001) Time from exposure to contact isolation / quarantine
80% within 96 hours - - - - - - -
2 – (S002) Time from case first symptom to contact isolation / quarantine
80% within 96 hours - - - - - - -
3 – (S003) Time from test sample taken to close contact isolation / quarantine
80% within 72 hours - 100% - - 100% - -
4 – (C001) Time from first symptom to test sample taken for positive cases
80% within 48 hours - 0% - - - - -
5 – (L001) Time from test sample taken to notification of positive result
80% within 24 hours - 100% - - 0% - 0%
6 – (P002) Time from case notification to isolation / quarantine of contact
80% within 48 hours - 100% - - 100% - -
7 – (P001) Time from notification to case interview 80% within 24 hours - 100% - - 100% - 0%
8 – (P003) Time from close contact identification to isolated / quarantined
80% within 24 hours 100% 100% - - 89% - -
10 – (P004) Proportion of contacts traced in 48 hours 80% within 48 hours - 100% - - 100% - -
C – (S005) Proportion of close contacts with confirmed or suspected COVID-19 at the time of tracing
<20%
0% 0% - - 0% - -
Note:
• * The numerator and denominator are provided in some instances to provide context for low percentages.
• **Data is not available for metrics where there is no data that meets the definition, or where the time/days to reach target has not fully elapsed
• The value of P002 can drop due to the addition of new close contacts to exposure events after the 48-hour period since case notification had elapsed. This can happen for a number of reasons, including a case recalling further details following the original case
interview.
• These metrics report all cases during the specified period, including those in Managed Isolation and Quarantine, and do not include casual contacts.
• There are three additional indicators under development requiring both technical and clinical input to define data requirements. These are due to be completed by end October 2020.

16
IN CONFIDENCE – NOT FOR DISTRIBUTION
Appendix 3: NRHCC Testing Report
Novel Coronavirus (COVID-19)
Issued: 1700 16 September
Table 12: Metro Auckland Summary Total of Testing for 16 September 2020
Community MIQ
staff
MIQ
guests
Airport Maritime
port
Ship’s
Crew
TOTAL
5:00pm 1109 202 522 194 123 0 2150
*Note: the Port was an afternoon start and is running through until 8pm tonight
Table 13: Estimated tests taken since 12 August 2020, based on manual site reports at 5pm
Site 12/08-
16/08
17/08-
23/08
24/08 –
30/08
31/08 –
06/09
07/09 –
13/09
14/09 15/09 16/09*
MIQ Staff 2132 659 1488 912 1086 136 133 202
Guests 2972 3767 3600 3406 3424 648 688 522
Border Airport 2129 933 1349 1158 853 156 137 194
Port 1588 678 161 392 153 90 18 123
Crew 0 0 0 0 0 0 0 0
* 16/09 day still in progress
Table 14: Estimated tests taken at Metro Auckland CTCs, since 12 August 2020, based on manual site
reports at 4pm
Site 12/08-
16/08
17/08-
23/08
24/08 –
30/08
31/08 –
06/09
07/09
–
13/09
14/09 15/09 16/09*
Airport Oaks 1148 515 366 265 181 27 19 25
Botany CTC 1151 948 905 749 681 126 151 86
Health New Lynn 2603 1258 1703 732 889 148 125 82
Mangere Town
Centre
1748 1684 1599 860 660 75 109 79
Otara CTC 3221 1712 1429 930 699 91 78 62
St Lukes 1368 1045 1414 797 666 204 132 111
Takanini Urgent Care 1886 1216 1153 684 440 93 108 62

IN CONFIDENCE – NOT FOR DISTRIBUTION
17
Whanau House 2502 1371 1442 928 1613 219 174 134
Whanau Ora - Central 1957 964 1583 937 783 100 99 45
Whanau Ora - North 1442 669 637 982 947 208 221 133
Whanau Ora - South 2945 1250 718 677 620 48 79 54
Henderson (EFKS
Church) Pop Up
N/A N/A N/A N/A 460 43 46 35
Henderson (Te
Wananga O
Aotearoa) Pop Up
N/A N/A N/A N/A N/A 44 22 21
Manurewa Pop Up N/A N/A N/A N/A N/A 44 50 36
Mt Wellington Pop
Up
N/A N/A N/A N/A N/A N/A 53 42
Wairau Valley Pop Up N/A N/A N/A N/A N/A N/A 60 50
Port Waikato Pop Up N/A N/A N/A N/A N/A N/A N/A 17
Waipuna Targeted
Site
143 549 376 219 251 28 39 No
Data
Henderson Targeted
Site
N/A N/A N/A N/A 631 20 14 35
Total 26,148 16,781 21,215 13,002 10,475 1518 1622 1109
*16/09 day still in progress; N/A = not open as a CTC; Previous sites that are no longer open are not
included in this report
CTCs and mobile testing site locations
Please see https://www.arphs.health.nz/public-health-topics/covid-19/where-to-get-tested for the
most up-to-date information on CTCs and mobile testing sites in the Auckland region.

IN CONFIDENCE – NOT FOR DISTRIBUTION
18
Appendix 4: Testing by DHB and ethnicity The tables that follow are the number of people tested. The numbers in the laboratory testing
section are the number of laboratory tests processed.
Table 15: Number of people tested for COVID-19 from 12 August to 16 September
Prioritised ethnicity MPAO
DHB of domicile Māori Pacific Asian Other Unknown Total
Auckland 3543 7211 9665 20,732 402 41,553
Bay of Plenty 2654 360 595 6770 68 10,447
Canterbury 1667 658 1848 14,093 223 18,489
Capital and Coast 1520 1145 1481 9678 221 14,045
Counties Manukau 7533 20,247 9390 13,062 449 50,681
Hawkes Bay 1445 320 237 3688 63 5753
Hutt Valley 829 548 585 3282 46 5290
Lakes 2349 306 470 3269 97 6491
MidCentral 1085 264 402 4368 96 6215
Nelson Marlborough 617 237 290 4490 61 5695
Northland 3115 214 278 4258 52 7917
South Canterbury 146 38 81 1780 11 2056
Southern 1134 394 768 10,482 98 12,876
Tairāwhiti 906 57 67 826 23 1879
Taranaki 703 71 182 2782 50 3788
Waikato 4448 1018 1554 10,508 251 17,779
Wairarapa 240 42 47 1165 8 1502
Waitematā 4952 5406 8566 26,551 352 45,827
West Coast 47 10 13 340 6 416
Whanganui 655 81 73 1490 15 2314
Unknown 1453 722 759 4364 1969 9267
Total 41,041 39,349 37,351 147,979 4561 270,281

19
IN CONFIDENCE – NOT FOR DISTRIBUTION
Table 16: Rate per 1000 people tested for COVID-19 from 12 August to 16 September
Prioritised ethnicity MPAO
DHB of domicile Māori Pacific Asian Other Total
Auckland 81.5 128.6 51.6 79.3 75.8
Bay of Plenty 44.4 81 30.4 43 43.3
Canterbury 31.8 46.4 30.4 31.6 32.2
Capital and Coast 41.6 51.6 29.5 45.5 43.7
Counties Manukau 84.6 168.6 62.1 62.4 89
Hawkes Bay 33.4 49.9 25.9 34.1 34.5
Hutt Valley 31.8 46.9 31.2 34.8 35.1
Lakes 61.1 119.8 48.3 54.5 58.6
MidCentral 29.8 47.6 25.9 35.3 34.3
Nelson Marlborough 38.5 95.9 39.1 35.7 37.5
Northland 51.2 56.9 33.6 39.1 43.5
South Canterbury 27.5 77.8 34.2 34.5 34.4
Southern 33.8 57.2 29.8 39.2 38.6
Tairāwhiti 36.6 51 57.4 37.4 38.2
Taranaki 30.1 51 29.2 30.9 31.3
Waikato 46.1 76.4 35.2 39 42
Wairarapa 30.1 50.5 37.7 32.7 32.8
Waitematā 79.1 121.2 59.6 69.4 72.4
West Coast 12.1 39.6 14.1 12.6 13
Whanganui 37.7 53.2 24.9 34.6 35.7
Total 52.8 123 48.7 47.8 54.5

1
IN CONFIDENCE – NOT FOR DISTRIBUTION
SITREP 056
Coronavirus disease 2019 (COVID-19)
Issued: 1030 hours 18 September 2020
Information current at: 1000 hours
This report provides a daily update on the COVID-19 health system response. New information is denoted by red text.
Please use the single point of contact email [email protected] for help/support. Your email will be
logged and promptly passed to the appropriate team.
This document is classified IN CONFIDENCE and not for further distribution.
Need to know
COMMUNITY CASES
NEW LAST 24 hrs
0
IMPORTED MIQ
CASES
NEW LAST 24 hrs
0
COMMUNITY CASES
TOTAL RECOVERED
140
122
COMMUNITY CASES
ACTIVE
37 TOTAL CASES SINCE 11 AUG
180
33
TOTAL IMPORTED MIQ CASES
155
TOTAL ACTIVE CASES IN NZ (COMMUNITY & MIQ): 70
IMPORTED MIQ CASES
TOTAL RECOVERED
IMPORTED MIQ CASES
ACTIVE
LABORATORY TESTS
LAST 24 hrs
7,360
LABORATORY TESTS
LAST SEVEN DAYS
48,657
LABORATORY TESTS
TOTAL
897,077
CASES DECEASED
3

IN CONFIDENCE – NOT FOR DISTRIBUTION
2
Total COVID-19 cases
Table 1: Total number of COVID-19 cases as at 0900 18 September 20201
Case Status Active Recovered Deceased Total
Confirmed 70* (-7) 1368 (+7) 20 1458
Probable 0 346 5 351
Total 70* (-7) 1714 (+7) 25 1809
*0 new cases identified, 7 cases classified as recovered.
Total community cases since 11 August
Table 2: Community cases by DHB and case status as at 0900 18 September 20201
New community cases since 0900 17 September 20202
1. No new community cases have been reported, as at 0900 18 September.
Community cases linked to the Auckland Community Cluster August 20203
2. 178 of the 180 community cases have been linked to the Auckland Community Cluster
August 2020, as at 0900 18 September. The unlinked cases are summarised as follows:
o The Rydges employee (this investigation has been closed).
o A case (reported 21 August) is still under investigation for an epidemiological link to
the community cluster. There is insufficient data to confirm a genomic link to the
community cluster (see 3).
Community cases under investigation to determine a link to the Auckland community
cluster
3. The case under investigation is summarised as follows:
o One case came through the border on 18 June. The case tested negative at Day 3
and Day 12 of quarantine. The case subsequently tested positive on 21 August.
Despite using two different whole genome sequencing protocols only there is
1 EpiSurv Database, 0900 18 September 2020
2 EpiSurv Database, 0900 18 September 2020
3 EpiSurv Database, 0900 18 September 2020
Case
Status
Counties Manukau Waitematā Auckland Waikato Total
Confirmed 77 55 46 1 179
Probable 1 0 0 0 1
Total 78 55 46 1 180

IN CONFIDENCE – NOT FOR DISTRIBUTION
3
insufficient data to confirm the case is genomically linked to the community cluster.4
Their epidemiological link to the community cluster is still under investigation. As at
15 September no additional information has been revealed by the investigation.
Community cases and household contacts at Jet Park
4. As at 0800 18 September there are 54 people isolating in Jet Park from the community.
22 are confirmed cases, the remaining 32 are household contacts. This number will
fluctuate as people finish their isolation and depart from the facility.5
MIQ cases since 0900 17 September 20206
5. No new cases detected at the border, as at 0900 18 September. In total 155 cases have
been detected at the border since the establishment of MIFs/MIQs.
Cases in hospital
6. As at 0800 18 September there are four cases in hospital with COVID-19.7
Table 3: Number of cases in hospital with COVID-19 by DHB as at 0800 18 September 2020
Health system response
Overall approach
7. Our investigation has two main focus areas that run in parallel:
o Source attribution – a focus on investigating the case with the earliest symptom
onset date to gather details actions of movements 14 days prior. This will help to
understand the possible source of the new outbreak.
o Containment – rigorous case investigation, identification of close contacts and
isolation and testing to ensure that chain of transmission is broken.
4 ESR WGS report 03 September 2020
5 NRHCC Morning Report, 0900 17 September 2020
6 EpiSurv Database, 0900 18 September 2020
7 NRHCC Morning Report 17 September 2020
DHB Hospital Number in a general ward Number in ICU/HDU
Auckland Auckland City 1 0
Waitematā North Shore 1 0
Counties Manukau Middlemore 1 1
Total - 3 1

IN CONFIDENCE – NOT FOR DISTRIBUTION
4
Current outbreak overview8
o There are two sub-clusters which most new community cases are linked to (Mount
Roskill Evangelical Church and Bereavements sub-clusters). There are 33 confirmed
cases in the Mount Roskill Evangelical Church sub-cluster and 15 confirmed cases in the
Bereavements sub-cluster.
Current outbreak investigation priorities
o Contact tracing and containment of Mount Roskill Evangelical Church sub-cluster and
recent bereavement events.
o Contact tracing and containment of Botany sub-cluster.
o Clarify whether June border case is a new infection and clarify strain.
o Seek to identify epidemiological link for index case in Mount Roskill Evangelical Church
sub-cluster.
o Waikato PHU will scope any positive cases in MIFs in the Auckland region for the next
week to alleviate some workload pressure at ARPHS.
o Investigation and close contact tracing of Jet Park healthcare worker9
Sub-clusters and settings of interest8
8. A healthcare worker at Jet Park was reported as a case on the 13 September Sitrep. The
case has been genomically linked to the Auckland Community Cluster. The
epidemiological link has been identified to a community case who was completing
isolation at Jet Park and required hospitalisation. A review is underway of the processes
at Jet Park with a focus on lessons learnt by this situation.
The case is isolating at Jet Park facility. Scoping by ARPHS is underway to identify close
and casual contacts. The case has five household close contacts who are self-isolating
at home. All five household contacts initially returned negative test results and were
retested on 15 September and were negative.9 All staff at Jet Park staff who are
considered close contacts have been stood down and have returned negative results so
far.9 CCTV footage at the facility will be reviewed as part of the scoping process.
9. members of one of the families in the Botany sub-cluster had serology testing on
11 September and all returned negative results. A case reported in 14 September
SitRep is also associated with the Botany sub-cluster. This case briefly attended school
on Monday 14 September prior to being notified of the positive test result.10 The school
has been closed as a precaution while close contact tracing and a deep clean is
completed.11 A total of four close contacts have been identified.12 All students who
attended school (about 470) on 14 September are considered to be casual contacts.
Letters have been sent asking students to be tested and to remain self-isolated at
8 ARPHS Strategic Report 08 September 2020
9 NRHCC Morning Report, 0900 16 September 2020
10 NRHCC Morning Report 17 September 2020
11 ARPHS email update – 1210 17 September 2020
12 NRHCC Morning Report, 0900 18 September 2020
s 9(2)(a)

IN CONFIDENCE – NOT FOR DISTRIBUTION
5
home until they receive a negative test result. They have also been asked to contact
Healthline if they become symptomatic.13 Onsite testing has been arranged from today
(18 September) until 20 September.14 The school will remain closed until at least
Monday 21 September. Students who receive a negative test will be able to attend.15
Part of the investigation will focus on what the child did while at school.
Case investigation
10. Source investigation for the epidemiological link to the main cluster for four cases that
have been genomically linked to the main cluster is ongoing:
o The
o GP
o The second Mount Albert Grammar student
o The Botany case
Self-isolation compliance16
11. Discussions with a key representative from Ngaa Amokura have confirmed that the
option below will reinforce the trust/relationship between the health sector and the
fellowship whanau for supporting compliance with self-isolation requirements (to be
used if standard contact tracing cannot be established within 48 hrs).
o Engagement of the Kaimanaaki workforce (community champions employed by our
Māori providers in the community). Kaimanaaki have access to clinical
support/advice. And will support and enable whānau wellbeing through the
pandemic. They have specific skills to help whānau cope with isolation. They are also
trained in the use of PPE so can make house visits and/or contact whānau by phone
for the duration of their isolation. Daily contact is anticipated and Kaimanaaki will
report back to the DHB/public health officials on a daily basis. An implementation
plan is being developed and will be stood up on 14 September
13 ARPHS email update – 17 September 2020 1210
14 ARPHS email update – 17 September 2020 1210
15 ARPHS email update – 17 September 2020 1210
16 ADHB Email, 1000 11 September 2020
s 9(2)(a)
s 9(2)(a)

6
IN CONFIDENCE – NOT FOR DISTRIBUTION
s 9(2)(a)
s 9(2)(a)

7
IN CONFIDENCE – NOT FOR DISTRIBUTION
ESR and wider testing17 12. A further 10 community cases are genomically linked with the Auckland cluster. These
cases are from the following known subclusters; Church 1 (1 cases), Church 3 (5 cases),
Americold HH (2 cases), MREF Bereavement (C-0018) (2 cases). A total of 153 cases
(86%) from the community cluster have now been sequenced, of which 134 (76%)
yielded a high quality genome.
13.
14. Ongoing analysis of the whole genome sequencing results is being used to show how
COVID-19 has been transmitted through the community cluster and to further inform
its management.
15. No direct links have been found between the community outbreak genome
sequencing, and the 65 full genomes (49 high quality) currently available from cases
detected in border arrivals in managed isolation facilities (MIFs). There has been one
case in a health worker at a managed isolation facility. WGS results indicate that this
case is genomically linked to the Auckland community cluster and clustered closely with
three community cases in the managed isolation facility (as discussed in para 8).
16.
17 ESR Whole Genome Sequencing Report 02 September 2020, Email 0946 16 September 2020
s 9(2)(g)(i)
s 9(2)(g)(i)

IN CONFIDENCE – NOT FOR DISTRIBUTION
8
Figure 1: Number of cases that have been whole genome sequenced and are genomically clustered
with the Auckland August cluster by sub-cluster as at 14 September 202018
Source: ESR *A sample may not have been received by ESR, may not have been sequenced yet or a sequencing result could not be
obtained from the sample received.
Contact tracing19 17. Between 09 and 15 September 78.1% (139/178) of Community close contacts and 100%
(14/14) MIQ close contacts have been contacted within 48 hours of being determined
to be a contact. KPI for this metric is 80% of close contacts within 48 hours.
o Note: Please note that the total number and number successfully contacted has decreased due
to casual contacts associated with the Les Mills exposure events being excluded.
Table 5: Close contact tracing recorded in the National Contact Tracing Solution since 12 August as at
0830 18 September 2020
15/09/2020 16/09/2020 17/09/2020 18/09/2020
Number of close contacts
identified1 3779 4139 4043 3912
Number of close contacts
successfully contacted (and are
self-isolating)
3772 4046 4036 3908
Number of close contacts
referred to "finding services"2 0 8 1 0
18 ESR email 1608 14 September 2020
19 COVID-19 NCCS Analytics and Reporting 0931 18 September 2020
0 5 10 15 20 25 30 35
Americold
Americold HH
Auckland Bus
Botany
Church 1
Church 2
Church 3
Finance Now
Finance Now HH
Household 1
Household 2
Household 3
MREF-Bereavement
GP
NZ Courier Post
Pending
Warehouse
Number of cases
Sequenced and genomically clustered Sequence not available*
s 9(2)(a)
s 9(2)(a)
s 9(2)(a)

IN CONFIDENCE – NOT FOR DISTRIBUTION
9
Number of close contacts
awaiting contact 7 85 6 4
1. Contacts loaded into the National Contact Tracing Solution, and managed by either the National Investigation and Tracing
Unit or the Public Health Units. Contacts from MIQ and overseas cases are not included in this report.
2. "Finding services" refers to the mechanism the National Close Contact Service uses to find valid contact details for close
contacts we do not have the correct contact details for. These services utilise internal Ministry of Health databases along with
Police, Customs and Airlines where relevant.
3. The total number and number successfully contacted can decrease due to duplicates and invalid records being removed from
the system.
COVID-19 Tracer App usage20 Figure 2: COVID-19 Tracer App cumulative registered users and daily scans/manual entries as at 1615
17 September 2020
1. The number of scans and manual entries on any given date is subject to change for up to 31 days. This is because there can be
a delay before anonymised analytic information is received (e.g. device not connected to internet when scan carried out).
2. The number of App registrations and QR codes for any given date is subject to change for up to 1 day. This is because due to
reporting timeframes these numbers may be extracted before the 12pm cut-off for the reporting period.
20 Response Analyst – Digital Channels, 1631 17 September 2020
0
500,000
1,000,000
1,500,000
2,000,000
2,500,000
0
500,000
1,000,000
1,500,000
2,000,000
2,500,000
20/
05
23/
05
26/
05
29/
05
01/
06
04/
06
07/
06
10/
06
13/
06
16/
06
19/
06
22/
06
25/
06
28/
06
01/
07
04/
07
07/
07
10/
07
13/
07
16/
07
19/
07
22/
07
25/
07
28/
07
31/
07
03/
08
06/
08
09/
08
12/
08
15/
08
18/
08
21/
08
24/
08
27/
08
30/
08
02/
09
05/
09
08/
09
11/
09
14/
09
17/
09
Dai
ly s
can
s an
d m
anu
al e
ntr
ies
Cu
mu
lati
ve A
pp
re
gist
rati
on
s
Day and month
Cumulative App registrations Daily scans and manual entries

IN CONFIDENCE – NOT FOR DISTRIBUTION
10
Testing21 Table 6: Testing by functional groups, as at 0900 18 September 2020
*Numbers have been sourced from different data extracts in comparison to Table 7.
Laboratory testing numbers22 Table 7: Number of laboratory tests processed nationally as at 0900 18 September 2020
Testing supply update23
18. There are no issues with regent supplies, and hologic supplies are now in labs around
the country. There are 43 days of reagent stocks on hand nationally.
21 ÉCLAIR/MoH Public Health Intelligence, 1000 18 September 2020
22 Daily Lab Report, 0917 18 September 2020
23 Testing supply email, 1001 09 September 2020
Reason for test 17 September 11–17 September
GPs and other primary health 3497 19,314
CBACs and pop-ups 3179 24,399
Border workers - air crew 34 243
Border workers - airport staff 169 1231
Border workers - maritime crew 3 18
Border workers – Port of Tauranga staff 29 158
Border workers – Remaining Port staff 24 154
Border workers - MIF 203 1175
Border workers - MIQ 51 499
Travellers - Staying at MIF 168 1802
Travellers - Staying at MIQ 3 257
Total 7360 49,250*
Time period Number of laboratory tests
17 September 7360
Last 7 days (11 Sep to 17 Sep) 48,657*
Total 897,077

IN CONFIDENCE – NOT FOR DISTRIBUTION
11
Healthline updates24 19. On 17 September there were 2,235 contacts in Healthline. Of those calls, 933 were to
the COVID-19 Info line. Demand on 1737 Need to talk? and other mental health services
was 687 contacts (6% higher than forecast).
20. The main themes yesterday/today:
o National Telehealth Service (Healthline) continued to take calls related to the
exposure events and media reporting caused confusion on this.
o Ongoing confusion around alert leave rules (i.e. crowd sizes in Auckland, around the
rest of the country etc).
o Most of the general public Service Users were calling because they are symptomatic
and wanted to be tested.
Logistics
Health Workforce25
21. Health Workforce continue to work with employers who have expressed a need for
assistance with identifying people who are willing to work within the health system and
to provide some relief from COVID-19 related staffing issues.
22. Upskilling of alternative workforces for testing continues to progress. Health Workforce
are currently engaged with Careerforce and DHBs to create a testing workforce training
and education package. This will be utilised by DHBs across the country, to increase the
pool of people who are able to perform COVID-19 testing. Following on from the
didactic component, will be practical training and assessment, which will continue to be
provided by the relevant DHB.
23. Health Workforce are monitoring staffing needs in MIFs facilities and are providing
support where possible.
Hospital capacity26 Table 8: Number and occupancy of hospital beds by type as at 0800 18 September 2020
Type Number of units Number (%) occupied/in use
ICU and HDU beds 336 212 (63.1%)
Ventilators 298 64 (21.5%)
Ward beds 7182 5848 (81.4%)
24 National Telehealth Service Coronavirus Update, 0910 18 September 2020
25 Health Workforce Directorate, 0945 14 September 2020
26 COVID-19 Hospital Summary, 0926 18 September 2020

12
IN CONFIDENCE – NOT FOR DISTRIBUTION
Appendix 1: Case summary Table 9: All community cases reported between 0900 17 September and 0900 18 September. Source: ESR EpiSurv Extract 0900 18 September 2020
Cumulative
Number
Date tested
positive Onset date
Case
status DHB Sex Age Ethnicity
Symptoms
[Yes/No] Hospitalised Occupation Source of transmission

13
IN CONFIDENCE – NOT FOR DISTRIBUTION
Appendix 2: COVID-19 Provisional Disease Indicators, by date
of case notification19 Table 10: NCTS data for cases in the community
Indicator (as per Table
9832) Refined Indicator description Target 10 Sept 11 Sept 12 Sept 13 Sept 14 Sept
** 15 Sept
** 16 Sept
**
1 - (S001) Time from exposure to contact isolation / quarantine 80% within 96 hours 100% 5% 33% - - - -
2 – (S002) Time from case first symptom to contact isolation / quarantine 80% within 96 hours 100% 58% 83% - - - -
3 – (S003) Time from test sample taken to close contact isolation / quarantine 80% within 72 hours 100% 95% 69% - 100% - -
4 – (C001) Time from first symptom to test sample taken for positive cases 80% within 48 hours 100% 67% 100% - - - -
5 – (L001) Time from test sample taken to notification of positive result 80% within 24 hours 100% 67% 100% - 0% - -
6 – (P002) Time from case notification to isolation / quarantine of contact 80% within 48 hours 100% 95% 69% - 100% - -
7 – (P001) Time from notification to case interview 80% within 24 hours 100% 100% 100% - 100% - -
8 – (P003) Time from close contact identification to isolated / quarantined 80% within 24 hours 100% 100% 98% - 100% - -
10 – (P004) Proportion of contacts traced in 48 hours 80% within 48 hours 100% 100% 83% - 100% - -
C – (S005) Proportion of close contacts with confirmed or suspected COVID-19 at the time of tracing <20% 0% 0% 0% - 0% - -
• * The numerator and denominator are provided in some instances to provide context for low percentages.
• **Data is not available for metrics where there is no data that meets the definition, or where the time/days to reach target has not fully elapsed
• The value of P002 can drop due to the addition of new close contacts to exposure events after the 48-hour period since case notification had elapsed. This can happen for a number of reasons, including a case recalling further details following the original case
interview.
• These metrics report all cases during the specified period, including those in Managed Isolation and Quarantine, and do not include casual contacts.
• There are three additional indicators under development requiring both technical and clinical input to define data requirements. These are due to be completed by end October 2020.

IN CONFIDENCE – NOT FOR DISTRIBUTION
14
Table 11:NCTS data for cases in the community Managed Isolation and Quarantine, International, and Unknown
Indicator (as per Table 9832) Refined Indicator description Target 10 Sept ** 11Sept ** 11 Sept ** 12 Sept ** 13 Sept ** 14 Sept ** 15 Sept **
1 - (S001) Time from exposure to contact isolation / quarantine
80% within 96 hours - - - - - - -
2 – (S002) Time from case first symptom to contact isolation / quarantine
80% within 96 hours - - - - - - -
3 – (S003) Time from test sample taken to close contact isolation / quarantine
80% within 72 hours - - 100% - 100% - -
4 – (C001) Time from first symptom to test sample taken for positive cases
80% within 48 hours - - - - 33% - -
5 – (L001) Time from test sample taken to notification of positive result
80% within 24 hours - - 0% - 0% - 71%
6 – (P002) Time from case notification to isolation / quarantine of contact
80% within 48 hours - - 100% - 100% - -
7 – (P001) Time from notification to case interview 80% within 24 hours - - 100% - 75% - 58%
8 – (P003) Time from close contact identification to isolated / quarantined
80% within 24 hours - - 100% - 100% - 100%
10 – (P004) Proportion of contacts traced in 48 hours 80% within 48 hours - - 100% - 100% - -
C – (S005) Proportion of close contacts with confirmed or suspected COVID-19 at the time of tracing
<20%
- - 0% - 0% - 0%
Note:
• * The numerator and denominator are provided in some instances to provide context for low percentages.
• **Data is not available for metrics where there is no data that meets the definition, or where the time/days to reach target has not fully elapsed
• The value of P002 can drop due to the addition of new close contacts to exposure events after the 48-hour period since case notification had elapsed. This can happen for a number of reasons, including a case recalling further details following the original case
interview.
• These metrics report all cases during the specified period, including those in Managed Isolation and Quarantine, and do not include casual contacts.
• There are three additional indicators under development requiring both technical and clinical input to define data requirements. These are due to be completed by end October 2020.

15
IN CONFIDENCE – NOT FOR DISTRIBUTION
Appendix 3: NRHCC Testing Report
Novel Coronavirus (COVID-19)
Issued: 1700 17 September
Table 12: Metro Auckland Summary Total of Testing for 17 September 2020
Community MIQ
staff
MIQ
guests
Airport Maritime port Ship’s
Crew
TOTAL
5:00pm 1501 132 627 164 32 0 2456
Table 13: Estimated tests taken since 12 August 2020, based on manual site reports at 5pm
Site 12/08-
16/08
17/08-23/08 24/08 –
30/08
31/08 –
06/09
07/09 –
13/09
14/09 15/09 16/09 17/09*
MIQ Staff 2132 659 1488 912 1086 136 133 202 132
Guests 2972 3767 3600 3406 3424 648 688 522 627
Border Airport 2129 933 1349 1158 853 156 137 194 164
Port 1588 678 161 392 153 90 18 123 32
Crew 0 0 0 0 0 0 0 0 0
* 17/09 day still in progress
Table 14: Estimated tests taken at Metro Auckland CTCs, since 12 August 2020, based on manual site reports at 4pm
Site 12/08-
16/08
17/08-
23/08
24/08 –
30/08
31/08 –
06/09
07/09
–
13/09
14/09 15/09 16/09 17/09*
Airport Oaks 1148 515 366 265 181 27 19 25 40
Botany CTC 1151 948 905 749 681 126 151 86 184
Health New Lynn 2603 1258 1703 732 889 148 125 82 76
Mangere Town
Centre
1748 1684 1599 860 660 75 109 79 98
Otara CTC 3221 1712 1429 930 699 91 78 121 355
St Lukes 1368 1045 1414 797 666 204 132 111 131
Takanini Urgent
Care
1886 1216 1153 684 440 93 108 62 70
Whanau House 2502 1371 1442 928 1613 219 174 134 123

IN CONFIDENCE – NOT FOR DISTRIBUTION
16
Whanau Ora -
Central
1957 964 1583 937 783 100 99 45 55
Whanau Ora - North 1442 669 637 982 947 208 221 133 106
Whanau Ora - South 2945 1250 718 677 620 48 79 54 119
Manurewa Pop Up N/A N/A N/A N/A N/A 44 50 36 73
Mangere Pop Up N/A N/A N/A N/A N/A N/A N/A N/A 9
Beach Haven Pop
Up
N/A N/A N/A N/A N/A N/A N/A N/A 27
Westgate Pop Up N/A N/A N/A N/A N/A N/A N/A N/A 21
Waipuna Targeted
Site
143 549 376 219 251 28 39 29 No
Data
Henderson Targeted
Site
N/A N/A N/A N/A 631 20 14 35 14
Total 26,148 16,781 21,215 13,002 10,475 1518 1622 1228 1501
*17/09 day still in progress; N/A = not open as a CTC; Previous sites that are no longer open are not included in
this report
CTCs and mobile testing site locations
Please see https://www.arphs.health.nz/public-health-topics/covid-19/where-to-get-tested for the most up-
to-date information on CTCs and mobile testing sites in the Auckland region.
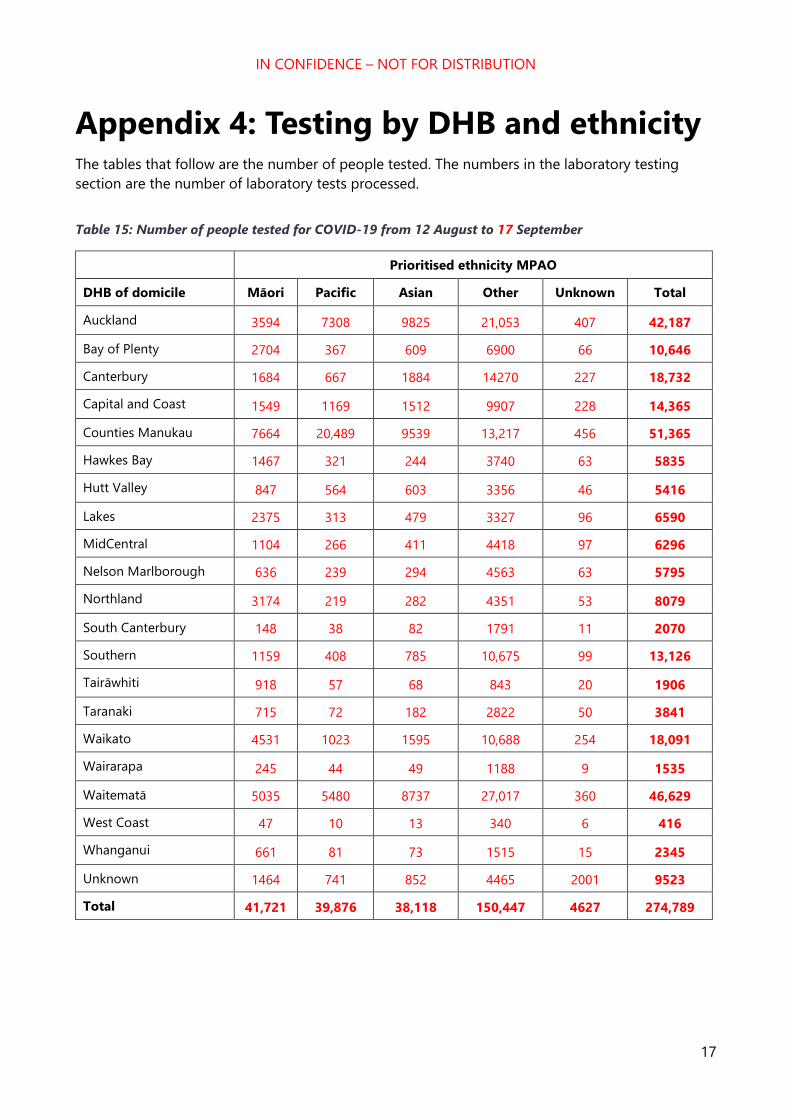
IN CONFIDENCE – NOT FOR DISTRIBUTION
17
Appendix 4: Testing by DHB and ethnicity The tables that follow are the number of people tested. The numbers in the laboratory testing
section are the number of laboratory tests processed.
Table 15: Number of people tested for COVID-19 from 12 August to 17 September
Prioritised ethnicity MPAO
DHB of domicile Māori Pacific Asian Other Unknown Total
Auckland 3594 7308 9825 21,053 407 42,187
Bay of Plenty 2704 367 609 6900 66 10,646
Canterbury 1684 667 1884 14270 227 18,732
Capital and Coast 1549 1169 1512 9907 228 14,365
Counties Manukau 7664 20,489 9539 13,217 456 51,365
Hawkes Bay 1467 321 244 3740 63 5835
Hutt Valley 847 564 603 3356 46 5416
Lakes 2375 313 479 3327 96 6590
MidCentral 1104 266 411 4418 97 6296
Nelson Marlborough 636 239 294 4563 63 5795
Northland 3174 219 282 4351 53 8079
South Canterbury 148 38 82 1791 11 2070
Southern 1159 408 785 10,675 99 13,126
Tairāwhiti 918 57 68 843 20 1906
Taranaki 715 72 182 2822 50 3841
Waikato 4531 1023 1595 10,688 254 18,091
Wairarapa 245 44 49 1188 9 1535
Waitematā 5035 5480 8737 27,017 360 46,629
West Coast 47 10 13 340 6 416
Whanganui 661 81 73 1515 15 2345
Unknown 1464 741 852 4465 2001 9523
Total 41,721 39,876 38,118 150,447 4627 274,789

18
IN CONFIDENCE – NOT FOR DISTRIBUTION
Table 16: Rate per 1000 people tested for COVID-19 from 12 August to 17 September
Prioritised ethnicity MPAO
DHB of domicile Māori Pacific Asian Other Total
Auckland 82.6 130.3 52.5 80.5 77
Bay of Plenty 45.2 82.6 31.1 43.9 44.1
Canterbury 32.1 47 31 32 32.7
Capital and Coast 42.4 52.7 30.1 46.6 44.7
Counties Manukau 86.1 170.6 63.1 63.2 90.2
Hawkes Bay 33.9 50 26.6 34.6 35
Hutt Valley 32.5 48.3 32.1 35.6 35.9
Lakes 61.7 122.5 49.2 55.5 59.5
MidCentral 30.3 47.9 26.5 35.7 34.7
Nelson Marlborough 39.6 96.7 39.6 36.3 38.2
Northland 52.2 58.3 34.1 39.9 44.4
South Canterbury 27.9 77.8 34.6 34.7 34.6
Southern 34.5 59.2 30.4 39.9 39.3
Tairāwhiti 37 51 58.3 38.1 38.8
Taranaki 30.6 51.7 29.2 31.4 31.8
Waikato 47 76.7 36.1 39.7 42.8
Wairarapa 30.7 52.9 39.3 33.3 33.6
Waitematā 80.5 122.9 60.8 70.7 73.6
West Coast 12.1 39.6 14.1 12.6 13
Whanganui 38.1 53.2 24.9 35.2 36.2
Total 53.7 124.7 49.7 48.6 55.4

1
IN CONFIDENCE – NOT FOR DISTRIBUTION
SITREP 057
Coronavirus disease 2019 (COVID-19)
Issued: 1030 hours 19 September 2020
Information current at: 1000 hours
This report provides a daily update on the COVID-19 health system response. New information is denoted by red text.
Please use the single point of contact email [email protected] for help/support. Your email will be
logged and promptly passed to the appropriate team.
This document is classified IN CONFIDENCE and not for further distribution.
Need to know
COMMUNITY CASES
NEW LAST 24 hrs
1
IMPORTED MIQ
CASES
NEW LAST 24 hrs
1
COMMUNITY CASES
TOTAL RECOVERED
145
122
COMMUNITY CASES
ACTIVE
33 TOTAL CASES SINCE 11 AUG
181
34
TOTAL IMPORTED MIQ CASES
156
TOTAL ACTIVE CASES IN NZ (COMMUNITY & MIQ): 67
IMPORTED MIQ CASES
TOTAL RECOVERED
IMPORTED MIQ CASES
ACTIVE
LABORATORY TESTS
LAST 24 hrs
8,359
LABORATORY TESTS
LAST SEVEN DAYS
48,178
LABORATORY TESTS
TOTAL
905,436
CASES DECEASED
3

IN CONFIDENCE – NOT FOR DISTRIBUTION
2
Total COVID-19 cases
Table 1: Total number of COVID-19 cases as at 0900 19 September 20201
Case Status Active Recovered Deceased Total
Confirmed 67* (-3) 1373 (+5) 20 1460 (+2)
Probable 0 346 5 351
Total 67* (-3) 1719 (+5) 25 1811 (+2)
*2 new cases identified, 5 cases classified as recovered.
Total community cases since 11 August
Table 2: Community cases by DHB and case status as at 0900 19 September 20201
New community cases since 0900 18 September 20202
1. One new community case has been reported, as at 0900 19 September. More
information on this case in paragraph 2 below.
New case under investigation since 0900 18 September 20203
2. The new case reported today (19 September) is a returnee who arrived in New Zealand
on 27 August and completed managed isolation in Christchurch. They tested negative
on day 3 and day 12. They left managed isolation on 11 September and returned home
to Auckland. They were tested after developing symptoms on 16 September. The test
returned positive on 18 September. The case and their household contacts have been
transferred to the Auckland Jet Park quarantine facility. The case is possibly a close
contact of a confirmed case from the same flight to New Zealand. Source of infection is
under investigation.
Community cases linked to the Auckland Community Cluster August 20204
3. 178 of the 181 community cases have been linked to the Auckland Community Cluster
August 2020, as at 0900 19 September 2020. The unlinked cases are summarised as
follows:
1 EpiSurv Database, 0900 19 September 2020
2 EpiSurv Database, 0900 19 September 2020
3 EpiSurv Database, 0900 19 September 2020
4 EpiSurv Database, 0900 19 September 2020
Case
Status
Counties Manukau Waitematā Auckland Waikato Total
Confirmed 77 55 47 (+1) 1 180 (+1)
Probable 1 0 0 0 1
Total 78 55 47 (+1) 1 181 (+1)

IN CONFIDENCE – NOT FOR DISTRIBUTION
3
o The Rydges employee (this investigation has been closed).
o A case (reported 21 August) is still under investigation for an epidemiological link to
the community cluster. There is insufficient data to confirm a genomic link to the
community cluster (see 4).
o The third case is detailed in paragraph two.
Community cases under investigation to determine a link to the Auckland
community cluster
4. The case under investigation is summarised as follows:
o One case came through the border on 18 June. The case tested negative at day 3 and
day 12 of quarantine. The case subsequently tested positive on 21 August. Despite
using two different whole genome sequencing protocols only there is insufficient
data to confirm the case is genomically linked to the community cluster.5 Their
epidemiological link to the community cluster is still under investigation. As at 15
September no additional information has been revealed by the investigation.
Community cases and household contacts at Jet Park
5. As at 0800 18 September there are 50 people isolating in Jet Park from the community.
20 are confirmed cases, the remaining 30 are household contacts. This number will
fluctuate as people finish their isolation and depart from the facility.6
MIQ cases since 0900 18 September 20207
6. One new case detected at the border, as at 0900 19 September. In total 156 cases have
been detected at the border since the establishment of MIQ facilities.
Cases in hospital
7. As at 0800 19 September there are four cases in hospital with COVID-19.8
Table 3: Number of cases in hospital with COVID-19 by DHB as at 0800 19 September 2020
5 ESR WGS report 03 September 2020
6 NRHCC Morning Report, 0900 19 September 2020
7 EpiSurv Database, 0900 19 September 2020
8 NRHCC Morning Report 19 September 2020
DHB Hospital Number in a general ward Number in ICU/HDU
Auckland Auckland City 1 0
Waitematā North Shore 1 0
Counties Manukau Middlemore 2 0
Total - 4 0

IN CONFIDENCE – NOT FOR DISTRIBUTION
4
Health system response
Overall approach
8. Our investigation has two main focus areas that run in parallel:
o Source attribution – a focus on investigating the case with the earliest symptom
onset date to gather details actions of movements 14 days prior. This will help to
understand the possible source of the new outbreak.
o Containment – rigorous case investigation, identification of close contacts and
isolation and testing to ensure that chain of transmission is broken.
Current outbreak overview
o There are two sub-clusters which most new community cases are linked to (Mount
Roskill Evangelical Church and Bereavements sub-clusters). There are 33 confirmed
cases in the Mount Roskill Evangelical Church sub-cluster and 15 confirmed cases in the
Bereavements sub-cluster. Ongoing scoping of community settings since 14 September
has revealed no major concerns.9
Current outbreak investigation priorities10
o Ongoing management of healthcare workers from Jet Park
o Ongoing management of Chapel Down’s Primary School associated with Botany Cluster.
o Investigation and scoping of new confirmed case.
Sub-clusters and settings of interest11
9. A healthcare worker at Jet Park was reported as a case on 13 September. The case has
been epidemiologically and genomically linked to the Auckland Community Cluster.
The case has been epidemiologically linked to a community case who was completing
isolation at Jet Park and required hospitalisation. A review of processes at Jet Park is
underway with a focus on lessons to be learnt from this situation.
10. The case is isolating at Jet Park facility. The case has five household close contacts who
are self-isolating at home. All five household contacts have tested negative twice. All
staff at Jet Park staff who are considered close contacts have been stood down and
have returned negative results so far.
11. members of a family in the Botany sub-cluster had serology testing on 11
September which returned negative results for all members. A case linked to the
Botany sub-cluster briefly attended school on 14 September, prior to being notified of
9 NRHCC Morning Report, 0900 19 September 2020
10NRHCC Morning Report, 0900 19 September 2020
11 NRHCC Morning Report, 0900 16 September 2020
s 9(2)(a)
s 9(2)(a)

IN CONFIDENCE – NOT FOR DISTRIBUTION
5
the positive test result that day.12 The school has been closed as a precaution while
close contact tracing and a deep clean is completed. A total of four close contacts have
been identified. All students who attended school (about 470) on 14 September are
considered to be casual contacts. Letters have been sent asking students to be tested
and to remain in self-isolation at home until they receive a negative test result. They
have also been asked to contact Healthline if they become symptomatic. Onsite testing
has been arranged from 18 September until 20 September. The school will remain
closed until at least Monday 21 September. Students who receive a negative test will be
able to attend school once it reopens. The investigation is also focusing on what the
child did while at school. 13
Case investigation
12. Source investigation for an epidemiological link to the main cluster for four cases who
have been genomically linked to the main cluster is ongoing:
o The
o GP
o The second Mount Albert Grammar student
o The Botany case
12 NRHCC Morning Report 17 September 2020
13 ARPHS email update – 1210 17 September 2020
s 9(2)(a)
s 9(2)(a)

6
IN CONFIDENCE – NOT FOR DISTRIBUTION
s 9(2)(a)
s 9(2)(a)

7
IN CONFIDENCE – NOT FOR DISTRIBUTION
ESR and wider testing14 13. A further 10 community cases are genomically linked with the Auckland cluster. These
cases are from the following known subclusters; Church 1 (1 cases), Church 3 (5 cases),
Americold HH (2 cases), MREF Bereavement (C-0018) (2 cases). A total of 153 cases
(86%) from the community cluster have now been sequenced, of which 134 (76%)
yielded a high quality genome.
14.
15. Ongoing analysis of the whole genome sequencing results is being used to show how
COVID-19 has been transmitted through the community cluster and to further inform
its management.
16. No direct links have been found between the community outbreak genome
sequencing, and the 65 full genomes (49 high quality) currently available from cases
detected in border arrivals in managed isolation facilities (MIFs). There has been one
case in a health worker at a managed isolation facility. WGS results indicate that this
case is genomically linked to the Auckland community cluster and clustered closely with
three community cases in the managed isolation facility (as discussed in para 8).
17.
14 ESR Whole Genome Sequencing Report 02 September 2020, Email 0946 16 September 2020
s 9(2)(g)(i)
s 9(2)(g)(i)

IN CONFIDENCE – NOT FOR DISTRIBUTION
8
Figure 1: Number of cases that have been whole genome sequenced and are genomically clustered
with the Auckland August cluster by sub-cluster as at 14 September 202015
Source: ESR *A sample may not have been received by ESR, may not have been sequenced yet or a sequencing result could not be
obtained from the sample received.
Contact tracing16 18. Between 10 and 16 September 75.8% (119/157) of Community close contacts and 100%
(30/30) MIQ close contacts have been contacted within 48 hours of being determined
to be a contact. KPI for this metric is 80% of close contacts within 48 hours.
o Note: Please note that the total number and number successfully contacted has decreased due
to casual contacts associated with the Les Mills exposure events being excluded.
Table 5: Close contact tracing recorded in the National Contact Tracing Solution since 12 August as at
0830 19 September 2020
16/09/2020 17/09/2020 18/09/2020 19/09/2020
Number of close contacts
identified1 4139 4043 3912 3918
Number of close contacts
successfully contacted (and are
self-isolating)
4046 4036 3908 3912
Number of close contacts
referred to "finding services"2 8 1 0 0
15 ESR email 1608 14 September 2020
16 COVID-19 NCCS Analytics and Reporting 0928 19 September 2020
0 5 10 15 20 25 30 35
Americold
Americold HH
Auckland Bus
Botany
Church 1
Church 2
Church 3
Finance Now
Finance Now HH
Household 1
Household 2
Household 3
MREF-Bereavement
GP
NZ Courier Post
Pending
Warehouse
Number of cases
Sequenced and genomically clustered Sequence not available*
s 9(2)(a)
s 9(2)(a)
s 9(2)(a)

IN CONFIDENCE – NOT FOR DISTRIBUTION
9
Number of close contacts
awaiting contact 85 6 4 2
1. Contacts loaded into the National Contact Tracing Solution, and managed by either the National Investigation and Tracing
Unit or the Public Health Units. Contacts from MIQ and overseas cases are not included in this report.
2. "Finding services" refers to the mechanism the National Close Contact Service uses to find valid contact details for close
contacts we do not have the correct contact details for. These services utilise internal Ministry of Health databases along with
Police, Customs and Airlines where relevant.
3. The total number and number successfully contacted can decrease due to duplicates and invalid records being removed from
the system.
COVID-19 Tracer App usage17 Figure 2: COVID-19 Tracer App cumulative registered users and daily scans/manual entries as at 1615
18 September 2020
1. The number of scans and manual entries on any given date is subject to change for up to 31 days. This is because there can be
a delay before anonymised analytic information is received (e.g. device not connected to internet when scan carried out).
2. The number of App registrations and QR codes for any given date is subject to change for up to 1 day. This is because due to
reporting timeframes these numbers may be extracted before the 12pm cut-off for the reporting period.
17 Response Analyst – Digital Channels, 1631 18 September 2020
0
500,000
1,000,000
1,500,000
2,000,000
2,500,000
0
500,000
1,000,000
1,500,000
2,000,000
2,500,000
20
/05
23
/05
26
/05
29
/05
01
/06
04
/06
07
/06
10
/06
13
/06
16
/06
19
/06
22
/06
25
/06
28
/06
01
/07
04
/07
07
/07
10
/07
13
/07
16
/07
19
/07
22
/07
25
/07
28
/07
31
/07
03
/08
06
/08
09
/08
12
/08
15
/08
18
/08
21
/08
24
/08
27
/08
30
/08
02
/09
05
/09
08
/09
11
/09
14
/09
17
/09
Dai
ly s
can
s an
d m
anu
al e
ntr
ies
Cu
mu
lati
ve A
pp
regi
stra
tio
ns
Day and month
Cumulative App registrations Daily scans and manual entries

IN CONFIDENCE – NOT FOR DISTRIBUTION
10
Testing18 Table 6: Testing by functional groups, as at 0900 19 September 2020
*Numbers have been sourced from different data extracts in comparison to Table 7.
Laboratory testing numbers19 Table 7: Number of laboratory tests processed nationally as at 0900 19 September 2020
Testing supply update20
19. There are no issues with regent supplies, and hologic supplies are now in labs around
the country. There are 43 days of reagent stocks on hand nationally.
18 ÉCLAIR/MoH Public Health Intelligence, 1000 19 September 2020
19 Daily Lab Report, 0847 19 September 2020
20 Testing supply email, 1001 09 September 2020
Reason for test 18 September 12–18 September
GPs and other primary health 4015 19,933
CBACs and pop-ups 3298 22,766
Border workers - air crew 49 242
Border workers - airport staff 295 1364
Border workers - maritime crew 13 31
Border workers – Port of Tauranga staff 138 290
Border workers – Remaining Port staff 50 144
Border workers - MIF 164 1227
Border workers - MIQ 41 461
Travellers - Staying at MIF 291 1696
Travellers - Staying at MIQ 5 192
Total 8359 48,346*
Time period Number of laboratory tests
18 September 8359
Last 7 days (12 Sep to 18 Sep) 48,178*
Total 905,436

IN CONFIDENCE – NOT FOR DISTRIBUTION
11
Healthline updates21 20. On 18 September there were 2,008 contacts in Healthline. Of those calls, 726 were to
the COVID-19 Info line. Demand on 1737 Need to talk? and other mental health services
was 586 contacts (slightly lower than forecast).
21. The main themes on 18 September were:
o National Telehealth Service (Healthline) continued to take calls related to the
exposure events.
o Ongoing confusion around alert leave rules (i.e. crowd sizes in Auckland, around the
rest of the country etc).
o Most of the general public Service Users were calling because they are symptomatic
and wanted to be tested.
Logistics
Health Workforce22
22. Health Workforce continue to work with employers who have expressed a need for
assistance with identifying people who are willing to work within the health system and
to provide some relief from COVID-19 related staffing issues.
23. Upskilling of alternative workforces for testing continues to progress. Health Workforce
are currently engaged with Careerforce and DHBs to create a testing workforce training
and education package. This will be utilised by DHBs across the country, to increase the
pool of people who are able to perform COVID-19 testing. Following on from the
didactic component, will be practical training and assessment, which will continue to be
provided by the relevant DHB.
24. Health Workforce are monitoring staffing needs in MIFs facilities and are providing
support where possible.
Hospital capacity23 Table 8: Number and occupancy of hospital beds by type as at 0800 19 September 2020
Type Number of units Number (%) occupied/in use
ICU and HDU beds 336 218 (64.9%)
Ventilators 302 64 (21.2%)
Ward beds 7494 5781 (77.1%)
21 National Telehealth Service Coronavirus Update, 0958 19 September 2020
22 Health Workforce Directorate, 0945 14 September 2020
23 COVID-19 Hospital Summary, 0918 19 September 2020

12
IN CONFIDENCE – NOT FOR DISTRIBUTION
Appendix 1: Case summary Table 9: All community cases reported between 0900 18 September and 0900 19 September. Source: ESR EpiSurv Extract 0900 19 September 2020
s 9(2)(a)
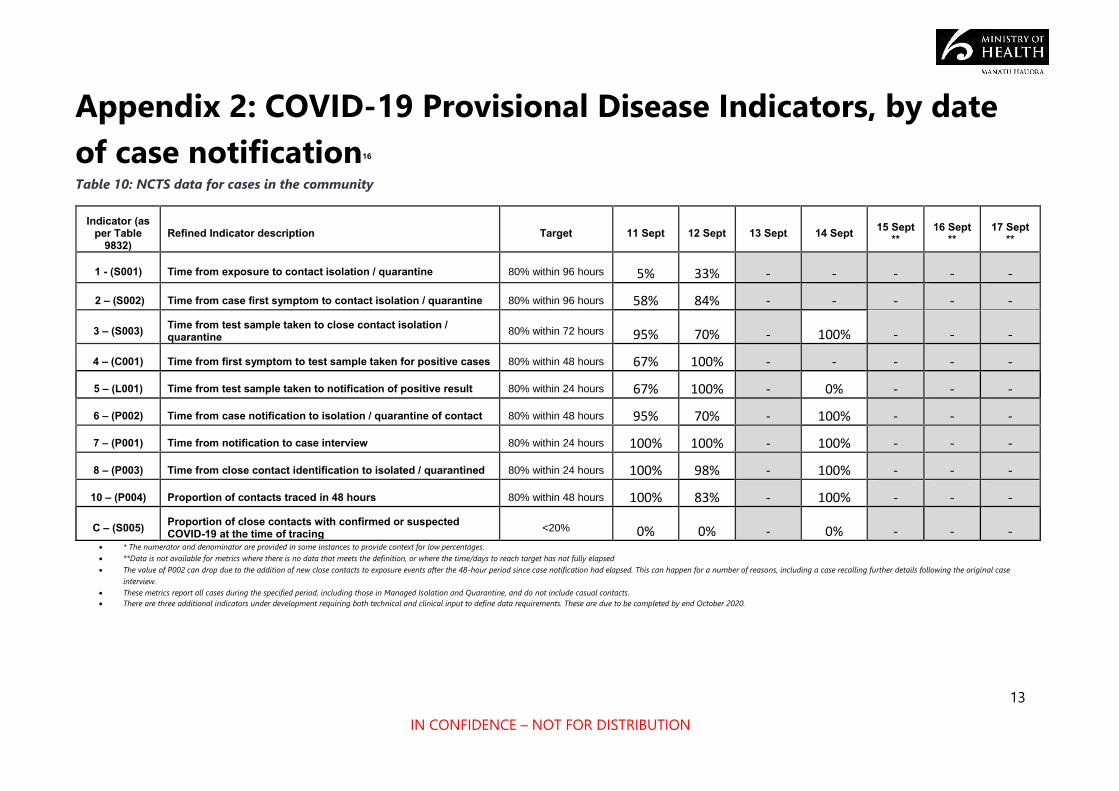
13
IN CONFIDENCE – NOT FOR DISTRIBUTION
Appendix 2: COVID-19 Provisional Disease Indicators, by date
of case notification16 Table 10: NCTS data for cases in the community
Indicator (as per Table
9832) Refined Indicator description Target 11 Sept 12 Sept 13 Sept 14 Sept 15 Sept
** 16 Sept
** 17 Sept
**
1 - (S001) Time from exposure to contact isolation / quarantine 80% within 96 hours 5% 33% - - - - -
2 – (S002) Time from case first symptom to contact isolation / quarantine 80% within 96 hours 58% 84% - - - - -
3 – (S003) Time from test sample taken to close contact isolation / quarantine 80% within 72 hours 95% 70% - 100% - - -
4 – (C001) Time from first symptom to test sample taken for positive cases 80% within 48 hours 67% 100% - - - - -
5 – (L001) Time from test sample taken to notification of positive result 80% within 24 hours 67% 100% - 0% - - -
6 – (P002) Time from case notification to isolation / quarantine of contact 80% within 48 hours 95% 70% - 100% - - -
7 – (P001) Time from notification to case interview 80% within 24 hours 100% 100% - 100% - - -
8 – (P003) Time from close contact identification to isolated / quarantined 80% within 24 hours 100% 98% - 100% - - -
10 – (P004) Proportion of contacts traced in 48 hours 80% within 48 hours 100% 83% - 100% - - -
C – (S005) Proportion of close contacts with confirmed or suspected COVID-19 at the time of tracing <20% 0% 0% - 0% - - -
• * The numerator and denominator are provided in some instances to provide context for low percentages.
• **Data is not available for metrics where there is no data that meets the definition, or where the time/days to reach target has not fully elapsed
• The value of P002 can drop due to the addition of new close contacts to exposure events after the 48-hour period since case notification had elapsed. This can happen for a number of reasons, including a case recalling further details following the original case
interview.
• These metrics report all cases during the specified period, including those in Managed Isolation and Quarantine, and do not include casual contacts.
• There are three additional indicators under development requiring both technical and clinical input to define data requirements. These are due to be completed by end October 2020.

IN CONFIDENCE – NOT FOR DISTRIBUTION
14
Table 11:NCTS data for cases in the community Managed Isolation and Quarantine, International, and Unknown
Indicator (as per Table 9832) Refined Indicator description Target 11 Sept ** 12 Sept ** 13 Sept ** 14 Sept ** 15 Sept ** 16 Sept ** 17 Sept **
1 - (S001) Time from exp osure to contact isolation / quarantine
80% within 96 hours - - - 100% - - -
2 – (S002) Time from case first symptom to contact isolation / quarantine
80% within 96 hours - - - 100% - - -
3 – (S003) Time from test sample taken to close contact isolation / quarantine
80% within 72 hours - 100% - 100% - - -
4 – (C001) Time from first symptom to test sample taken for positive cases
80% within 48 hours - - - 33% - 33% -
5 – (L001) Time from test sample taken to notification of positive result
80% within 24 hours - 0% - 0% - 71% 0%
6 – (P002) Time from case notification to isolation / quarantine of contact
80% within 48 hours - 100% - 100% - 100% -
7 – (P001) Time from notification to case interview 80% within 24 hours - 100% - 75% - 58% 0%
8 – (P003) Time from close contact identification to isolated / quarantined
80% within 24 hours - 100% - 100% - 100% -
10 – (P004) Proportion of contacts traced in 48 hours 80% within 48 hours - 100% - 100% - 100% -
C – (S005) Proportion of close contacts with confirmed or suspected COVID-19 at the time of tracing
<20%
- 0% - 0% - 0% -
Note:
• * The numerator and denominator are provided in some instances to provide context for low percentages.
• **Data is not available for metrics where there is no data that meets the definition, or where the time/days to reach target has not fully elapsed
• The value of P002 can drop due to the addition of new close contacts to exposure events after the 48-hour period since case notification had elapsed. This can happen for a number of reasons, including a case recalling further details following the original case
interview.
• These metrics report all cases during the specified period, including those in Managed Isolation and Quarantine, and do not include casual contacts.
• There are three additional indicators under development requiring both technical and clinical input to define data requirements. These are due to be completed by end October 2020.

15
IN CONFIDENCE – NOT FOR DISTRIBUTION
Appendix 3: NRHCC Testing Report
Novel Coronavirus (COVID-19)
Issued: 1700 18 September
Table 12: Metro Auckland Summary Total of Testing for 18 September 2020
Community MIQ
staff
MIQ
guests
Airport Maritime port Ship’s
Crew
TOTAL
5:00pm 1188 122 423 95 57 0 1885
Table 13: Estimated tests taken since 12 August 2020, based on manual site reports at 5pm
Site 12/08-
16/08
17/08-
23/08
24/08 –
30/08
31/08 –
06/09
07/09 –
13/09
14/09 15/09 16/09 17/09 18/09*
MIQ Staff 2132 659 1488 912 1086 136 133 202 132 122
Guests 2972 3767 3600 3406 3424 648 688 522 627 423
Border Airport 2129 933 1349 1158 853 156 137 194 164 95
Port 1588 678 161 392 153 90 18 123 32 57
Crew 0 0 0 0 0 0 0 0 0 0
* 18/09 day still in progress
Table 14: Estimated tests taken at Metro Auckland CTCs, since 12 August 2020, based on manual site reports at 4pm
Site 12/08-
16/08
17/08-
23/08
24/08 –
30/08
31/08 –
06/09
07/09 –
13/09
14/0
9
15/09 16/09 17/09 18/09
*
Airport Oaks 1148 515 366 265 181 27 19 25 40 19
Botany CTC 1151 948 905 749 681 126 151 86 184 162
Health New
Lynn
2603 1258 1703 732 889 148 125 82 85 80
Mangere Town
Centre
1748 1684 1599 860 660 75 109 79 98 64
Otara CTC 3221 1712 1429 930 699 91 78 121 383 117
St Lukes 1368 1045 1414 797 666 204 132 111 131 89
Takanini Urgent
Care
1886 1216 1153 684 440 93 108 62 70 70
Whanau House 2502 1371 1442 928 1613 219 174 134 123 101

IN CONFIDENCE – NOT FOR DISTRIBUTION
16
Whanau Ora -
Central
1957 964 1583 937 783 100 99 45 64 50
Whanau Ora -
North
1442 669 637 982 947 208 221 133 114 88
Whanau Ora -
South
2945 1250 718 677 620 48 79 54 144 76
Manurewa Pop
Up**
N/A N/A N/A N/A N/A 44 50 36 73 24**
Beach Haven
Pop Up**
N/A N/A N/A N/A N/A N/A N/A N/A 27 1**
Westgate Pop
Up**
N/A N/A N/A N/A N/A N/A N/A N/A 21 5**
Henderson Pop
Up
N/A N/A N/A N/A N/A N/A N/A N/A N/A No
Data
Flat Bush Pop
Up
N/A N/A N/A N/A N/A N/A N/A N/A N/A 200
Waiuku Pop Up N/A N/A N/A N/A N/A N/A N/A N/A N/A No
Data
Waipuna
Targeted Site
143 549 376 219 251 28 39 29 44 38
Henderson
Targeted Site
N/A N/A N/A N/A 631 20 14 35 14 4
Total 26,148 16,781 21,215 13,002 10,475 1518 1622 1228 1624 1188
*18/09 day still in progress; N/A = not open as a CTC; Previous sites that are no longer open are not included in
this report
CTCs and mobile testing site locations
Please see https://www.arphs.health.nz/public-health-topics/covid-19/where-to-get-tested for the most up-
to-date information on CTCs and mobile testing sites in the Auckland region.

IN CONFIDENCE – NOT FOR DISTRIBUTION
17
Appendix 4: Testing by DHB and ethnicity The tables that follow are the number of people tested. The numbers in the laboratory testing
section are the number of laboratory tests processed.
Table 15: Number of people tested for COVID-19 from 12 August to 18 September
Prioritised ethnicity MPAO
DHB of domicile Māori Pacific Asian Other Unknown Total
Auckland 3650 7387 9981 21,330 426 42,774
Bay of Plenty 2741 369 621 7010 67 10,808
Canterbury 1703 676 1956 14,474 238 19,047
Capital and Coast 1574 1200 1541 10,086 232 14,633
Counties Manukau 7848 21,048 9829 13,475 464 52,664
Hawkes Bay 1478 325 248 3794 63 5908
Hutt Valley 861 571 615 3419 47 5513
Lakes 2407 314 481 3357 100 6659
MidCentral 1116 270 418 4465 99 6368
Nelson Marlborough 641 240 298 4607 65 5851
Northland 3207 221 285 4412 54 8179
South Canterbury 150 42 87 1812 12 2103
Southern 1176 416 836 10,908 101 13,437
Tairāwhiti 921 58 70 852 21 1922
Taranaki 722 72 186 2848 52 3880
Waikato 4602 1027 1625 10,850 256 18,360
Wairarapa 246 47 49 1228 9 1579
Waitematā 5092 5550 8904 27,434 370 47,350
West Coast 48 10 13 345 6 422
Whanganui 662 82 73 1530 16 2363
Unknown 1485 747 801 4529 2063 9625

IN CONFIDENCE – NOT FOR DISTRIBUTION
18
Total 42,330 40,672 38,917 152,766 4761 279,446

19
IN CONFIDENCE – NOT FOR DISTRIBUTION
Table 16: Rate per 1000 people tested for COVID-19 from 12 August to 18 September
Prioritised ethnicity MPAO
DHB of domicile Māori Pacific Asian Other Total
Auckland 83.9 131.7 53.3 81.6 78
Bay of Plenty 45.8 83 31.7 44.6 44.8
Canterbury 32.5 47.7 32.2 32.4 33.2
Capital and Coast 43.1 54.1 30.7 47.4 45.5
Counties Manukau 88.1 175.3 65 64.4 92.5
Hawkes Bay 34.2 50.6 27.1 35.1 35.4
Hutt Valley 33 48.9 32.8 36.3 36.6
Lakes 62.6 122.9 49.4 56 60.1
MidCentral 30.7 48.7 27 36.1 35.1
Nelson Marlborough 40 97.1 40.2 36.6 38.5
Northland 52.7 58.8 34.5 40.5 45
South Canterbury 28.2 86 36.8 35.1 35.2
Southern 35 60.4 32.4 40.8 40.3
Tairāwhiti 37.2 51.9 60 38.5 39.1
Taranaki 30.9 51.7 29.9 31.7 32.1
Waikato 47.7 77 36.8 40.3 43.4
Wairarapa 30.8 56.5 39.3 34.4 34.5
Waitematā 81.4 124.5 61.9 71.7 74.8
West Coast 12.4 39.6 14.1 12.8 13.2
Whanganui 38.1 53.9 24.9 35.6 36.4
Total 54.4 127.2 50.8 49.3 56.3

1
IN CONFIDENCE – NOT FOR DISTRIBUTION
SITREP 058
Coronavirus disease 2019 (COVID-19)
Issued: 1030 hours 20 September 2020
Information current at: 1000 hours
This report provides a daily update on the COVID-19 health system response. New information is denoted by red text.
Please use the single point of contact email [email protected] for help/support. Your email will be
logged and promptly passed to the appropriate team.
This document is classified IN CONFIDENCE and not for further distribution.
Need to know
COMMUNITY CASES
NEW LAST 24 hrs
2
IMPORTED MIQ
CASES
NEW LAST 24 hrs
2
COMMUNITY CASES
TOTAL RECOVERED
144
123
COMMUNITY CASES
ACTIVE
36 TOTAL CASES SINCE 11 AUG
183
35
TOTAL IMPORTED MIQ CASES
158
TOTAL ACTIVE CASES IN NZ (COMMUNITY & MIQ): 71
IMPORTED MIQ CASES
TOTAL RECOVERED
IMPORTED MIQ CASES
ACTIVE
LABORATORY TESTS
LAST 24 hrs
5,417
LABORATORY TESTS
LAST SEVEN DAYS
46,384
LABORATORY TESTS
TOTAL
910,853
CASES DECEASED
3

IN CONFIDENCE – NOT FOR DISTRIBUTION
2
Total COVID-19 cases
Table 1: Total number of COVID-19 cases as at 0900 20 September 20201
Case Status Active Recovered Deceased Total
Confirmed 71* (+4) 1373 20 1464 (+4)
Probable 0 346 5 351
Total 71* (+4) 1719 25 1815 (+4)
*4 new cases identified, no cases classified as recovered.
Total community cases since 11 August
Table 2: Community cases by DHB and case status as at 0900 20 September 20201
New community cases since 0900 19 September 20202
1. Two new community cases have been reported, as at 0900 20 September. Both cases
are household contacts of the community case reported yesterday (see paragraph 2).
New case under investigation since 0900 19 September 20203
2. The new case reported yesterday (19 September) is a returnee who arrived in New
Zealand on 27 August and completed managed isolation in Christchurch. The case
tested negative on day 3 and day 12. They left managed isolation on 11 September and
returned home to Auckland. They were tested after developing symptoms on 16
September. The test returned positive on 18 September. The case and their household
contacts have been transferred to the Auckland Jet Park quarantine facility. The case’s
genome sequence is consistent with two confirmed cases from the same flight to New
Zealand. Source of infection is still under investigation. The two household contacts of
this case returned positive and are now confirmed cases. All three cases have been
isolating at Jet Park quarantine facility since 18 September. Three neighbours who are
close contacts, have all tested negative and been in self-isolation.
1 EpiSurv Database, 0900 20 September 2020
2 EpiSurv Database, 0900 20 September 2020
3 EpiSurv Database, 0900 20 September 2020
Case
Status
Counties Manukau Waitematā Auckland Waikato Total
Confirmed 79 (+2) 55 47 1 182 (+2)
Probable 1 0 0 0 1
Total 80 (+2) 55 47 1 183 (+2)

IN CONFIDENCE – NOT FOR DISTRIBUTION
3
Community cases linked to the Auckland Community Cluster August 20204
3. 178 of the 183 community cases have been linked to the Auckland Community Cluster
August 2020, as at 0900 20 September 2020. The unlinked cases are summarised as
follows:
o The Rydges employee (this investigation has been closed).
o A case (reported 21 August) is still under investigation for an epidemiological link to
the community cluster. There is insufficient data to confirm a genomic link to the
community cluster (see 4).
o The remaining three cases are detailed in paragraph 2.
Community cases under investigation to determine a link to the Auckland
community cluster
4. The case under investigation is summarised as follows:
o One case came through the border on 18 June. The case tested negative at day 3 and
day 12 of quarantine. The case subsequently tested positive on 21 August. Despite
using two different whole genome sequencing protocols only there is insufficient
data to confirm the case is genomically linked to the community cluster.5 Their
epidemiological link to the community cluster is still under investigation. As at 15
September no additional information has been revealed by the investigation.
Community cases and household contacts at Jet Park
5. As at 0800 20 September there are 47 people isolating in Jet Park from the community.
20 are confirmed cases, the remaining 27 are household contacts. This number will
fluctuate as people finish their isolation and depart from the facility.6
MIQ cases since 0900 19 September 20207
6. Two new cases have been detected at the border, as at 0900 20 September. In total 158
cases have been detected at the border since the establishment of MIQ facilities.
Cases in hospital
4 EpiSurv Database, 0900 20 September 2020
5 ESR WGS report 03 September 2020
6 NRHCC Morning Report, 0900 19 September 2020
7 EpiSurv Database, 0900 20 September 2020

IN CONFIDENCE – NOT FOR DISTRIBUTION
4
7. As at 0800 20 September there are three cases in hospital with COVID-19.8
Table 3: Number of cases in hospital with COVID-19 by DHB as at 0800 20 September 2020
Health system response
Overall approach
8. Our investigation has two main focus areas that run in parallel:
o Source attribution – a focus on investigating the case with the earliest symptom
onset date to gather details actions of movements 14 days prior. This will help to
understand the possible source of the new outbreak.
o Containment – rigorous case investigation, identification of close contacts and
isolation and testing to ensure that chain of transmission is broken.
Current outbreak overview
o There have been no new cases reported in the Auckland community cluster since 14
September. Ongoing scoping of community settings since 14 September has revealed
no major concerns.9
Current outbreak investigation priorities10
o Ongoing management of healthcare workers from Jet Park
o Ongoing management of Chapel Down’s Primary School associated with Botany Cluster.
o Investigation and scoping of the cases linked to the case reported yesterday from the
Christchurch MIF.
8 NRHCC Morning Report 19 September 2020
9 NRHCC Morning Report, 0900 19 September 2020
10NRHCC Morning Report, 0900 20 September 2020
DHB Hospital Number in a general ward Number in ICU/HDU
Auckland Auckland City 1 0
Waitematā North Shore 1 0
Counties Manukau Middlemore 1 0
Total - 3 0

IN CONFIDENCE – NOT FOR DISTRIBUTION
5
Sub-clusters and settings of interest11
9. The child of the case (paragraph 2) attended an Auckland primary school. As soon as
the developed symptoms, the whole family self-isolated and the child was kept
home from school. One of the close contacts
and attended the same school until 18 September (tested negative).12 The school is now
considered low risk. Further analysis of the symptoms of the is
underway this morning and any implications for the school will be clarified by early
afternoon.
10. A healthcare worker at Jet Park was reported as a case on 13 September. The case has
been epidemiologically and genomically linked to the Auckland Community Cluster.
The case has been epidemiologically linked to a community case who was completing
isolation at Jet Park and required hospitalisation. A review of processes at Jet Park is
underway with a focus on lessons to be learnt from this situation.
11. The healthcare worker is isolating at Jet Park facility. The case has five household close
contacts who are self-isolating at home. All five household contacts have tested
negative twice. All staff at Jet Park staff who are considered close contacts have been
stood down and have returned negative results so far.
12. members of a family in the Botany sub-cluster had serology testing on 11
September which returned negative results for all members. A case linked to the
Botany sub-cluster briefly attended school on 14 September, prior to being notified of
the positive test result that day.13 The school has been closed as a precaution while
close contact tracing and a deep clean is completed. A total of four close contacts have
been identified. All students who attended school (about 470) on 14 September are
casual contacts. Letters have been sent asking students to be tested and to remain in
self-isolation at home until they receive a negative test result. They have also been
asked to contact Healthline if they become symptomatic. Onsite testing has been
arranged from 18 September until 20 September. The school will remain closed until at
least Monday 21 September. Students who receive a negative test will be able to attend
school once it reopens. The investigation is also focusing on what the child did while at
school.14
Case investigation
13. Source investigation for an epidemiological link to the main cluster for four cases who
have been genomically linked to the main cluster is ongoing:
o The
o GP
o The second Mount Albert Grammar student
o The Botany case
11 NRHCC Morning Report, 0900 16 September 2020
12 NRHCC Morning Report, 0900 20 September 2020
13 NRHCC Morning Report 17 September 2020
14 ARPHS email update – 1210 17 September 2020
s 9(2)(a)
s 9(2)(a) s 9(2)(a)
s 9(2)(a)
s 9(2)(a)
s 9(2)(a)
s 9(2)(a)
s 9(2)(a)

6
IN CONFIDENCE – NOT FOR DISTRIBUTION
)
s 9(2)(a)
s 9(2)(a)

7
IN CONFIDENCE – NOT FOR DISTRIBUTION
ESR and wider testing15 14. A further 10 community cases are genomically linked with the Auckland cluster. These
cases are from the following known subclusters; Church 1 (1 cases), Church 3 (5 cases),
Americold HH (2 cases), MREF Bereavement (C-0018) (2 cases). A total of 153 cases
(86%) from the community cluster have now been sequenced, of which 134 (76%)
yielded a high quality genome.
15.
16. Ongoing analysis of the whole genome sequencing results is being used to show how
COVID-19 has been transmitted through the community cluster and to further inform
its management.
17. No direct links have been found between the community outbreak genome
sequencing, and the 65 full genomes (49 high quality) currently available from cases
detected in border arrivals in managed isolation facilities (MIFs). There has been one
case in a health worker at a managed isolation facility. WGS results indicate that this
case is genomically linked to the Auckland community cluster and clustered closely with
three community cases in the managed isolation facility (as discussed in para 8).
18.
15 ESR Whole Genome Sequencing Report 02 September 2020, Email 0946 16 September 2020
s 9(2)(g)(i)
s 9(2)(g)(i)

IN CONFIDENCE – NOT FOR DISTRIBUTION
8
Figure 1: Number of cases that have been whole genome sequenced and are genomically clustered
with the Auckland August cluster by sub-cluster as at 14 September 202016
Source: ESR *A sample may not have been received by ESR, may not have been sequenced yet or a sequencing result could not be
obtained from the sample received.
Contact tracing17 19. Between 11 and 17 September 75.0% (111/148) of Community close contacts and 100%
(32/32) MIQ close contacts have been contacted within 48 hours of being determined
to be a contact. KPI for this metric is 80% of close contacts within 48 hours.
o Note: Please note that the total number and number successfully contacted has decreased due
to casual contacts associated with the Les Mills exposure events being excluded.
Table 5: Close contact tracing recorded in the National Contact Tracing Solution since 12 August as at
0830 20 September 2020
17/09/2020 18/09/2020 19/09/2020 20/09/2020
Number of close contacts
identified1 4043 3912 3918 3916
Number of close contacts
successfully contacted (and are
self-isolating)
4036 3908 3912 3912
Number of close contacts
referred to "finding services"2 1 0 0 0
16 ESR email 1608 14 September 2020
17 COVID-19 NCCS Analytics and Reporting 0931 20 September 2020
0 5 10 15 20 25 30 35
Americold
Americold HH
Auckland Bus
Botany
Church 1
Church 2
Church 3
Finance Now
Finance Now HH
Household 1
Household 2
Household 3
MREF-Bereavement
GP
NZ Courier Post
Pending
Warehouse
Number of cases
Sequenced and genomically clustered Sequence not available*
s 9(2)(a)
s 9(2)(a)
s 9(2)(a)

IN CONFIDENCE – NOT FOR DISTRIBUTION
9
Number of close contacts
awaiting contact 6 4 2 4
1. Contacts loaded into the National Contact Tracing Solution, and managed by either the National Investigation and Tracing
Unit or the Public Health Units. Contacts from MIQ and overseas cases are not included in this report.
2. "Finding services" refers to the mechanism the National Close Contact Service uses to find valid contact details for close
contacts we do not have the correct contact details for. These services utilise internal Ministry of Health databases along with
Police, Customs and Airlines where relevant.
3. The total number and number successfully contacted can decrease due to duplicates and invalid records being removed from
the system.
COVID-19 Tracer App usage18 Figure 2: COVID-19 Tracer App cumulative registered users and daily scans/manual entries as at 1615
18 September 2020
1. The number of scans and manual entries on any given date is subject to change for up to 31 days. This is because there can be
a delay before anonymised analytic information is received (e.g. device not connected to internet when scan carried out).
2. The number of App registrations and QR codes for any given date is subject to change for up to 1 day. This is because due to
reporting timeframes these numbers may be extracted before the 12pm cut-off for the reporting period.
18 Response Analyst – Digital Channels, 1631 18 September 2020
0
500,000
1,000,000
1,500,000
2,000,000
2,500,000
0
500,000
1,000,000
1,500,000
2,000,000
2,500,000
20
/05
23
/05
26
/05
29
/05
01
/06
04
/06
07
/06
10
/06
13
/06
16
/06
19
/06
22
/06
25
/06
28
/06
01
/07
04
/07
07
/07
10
/07
13
/07
16
/07
19
/07
22
/07
25
/07
28
/07
31
/07
03
/08
06
/08
09
/08
12
/08
15
/08
18
/08
21
/08
24
/08
27
/08
30
/08
02
/09
05
/09
08
/09
11
/09
14
/09
17
/09
Dai
ly s
can
s an
d m
anu
al e
ntr
ies
Cu
mu
lati
ve A
pp
regi
stra
tio
ns
Day and month
Cumulative App registrations Daily scans and manual entries

IN CONFIDENCE – NOT FOR DISTRIBUTION
10
Testing19 Table 6: Testing by functional groups, as at 0900 20 September 2020
*Numbers have been sourced from different data extracts in comparison to Table 7.
Laboratory testing numbers20 Table 7: Number of laboratory tests processed nationally as at 0900 20 September 2020
Testing supply update21
20. There are no issues with regent supplies, and hologic supplies are now in labs around
the country. There are 43 days of reagent stocks on hand nationally.
19 ÉCLAIR/MoH Public Health Intelligence, 1000 20 September 2020
20 Daily Lab Report, 0818 20 September 2020
21 Testing supply email, 1001 09 September 2020
Reason for test 19 September 13–19 September
GPs and other primary health 3522 20,725
CBACs and pop-ups 1075 20,104
Border workers - air crew 31 245
Border workers - airport staff 207 1339
Border workers - maritime crew 1 32
Border workers – Port of Tauranga staff 183 473
Border workers – Remaining Port staff 57 182
Border workers - MIF 163 1175
Border workers - MIQ 48 465
Travellers - Staying at MIF 127 1686
Travellers - Staying at MIQ 3 33
Total 5417 46,459*
Time period Number of laboratory tests
19 September 5417
Last 7 days (13 Sep to 19 Sep) 46,384*
Total 910,853

IN CONFIDENCE – NOT FOR DISTRIBUTION
11
Healthline updates22 21. On 19 September there were 2,227 contacts in Healthline. Of those calls, 482 were to
the COVID-19 Info line. Demand on 1737 Need to talk? and other mental health services
was 504 contacts (lower than forecast).
22. The main themes on 18 September were:
o National Telehealth Service (Healthline) continued to take calls related to the
exposure events.
o Questions relating to the changes to Alert Levels that may occur this week.
o Most of the general public Service Users were calling because they are symptomatic
and wanted to be tested.
Logistics
Health Workforce23
23. Health Workforce continue to work with employers who have expressed a need for
assistance with identifying people who are willing to work within the health system and
to provide some relief from COVID-19 related staffing issues.
24. Upskilling of alternative workforces for testing continues to progress. Health Workforce
are currently engaged with Careerforce and DHBs to create a testing workforce training
and education package. This will be utilised by DHBs across the country, to increase the
pool of people who are able to perform COVID-19 testing. Following on from the
didactic component, will be practical training and assessment, which will continue to be
provided by the relevant DHB.
25. Health Workforce are monitoring staffing needs in MIFs facilities and are providing
support where possible.
Hospital capacity24 Table 8: Number and occupancy of hospital beds by type as at 0800 20 September 2020
Type Number of units Number (%) occupied/in use
ICU and HDU beds 278 141 (50.7%)
Ventilators 188 29 (15.4%)
Ward beds 4586 3474 (75.8%)
22 National Telehealth Service Coronavirus Update, 0938 20 September 2020
23 Health Workforce Directorate, 0945 14 September 2020
24 COVID-19 Hospital Summary, 0916 20 September 2020

12
IN CONFIDENCE – NOT FOR DISTRIBUTION
Appendix 1: Case summary Table 9: All community cases reported between 0900 19 September and 0900 20 September. Source: ESR EpiSurv Extract 0900 20 September 2020
s 9(2)(a)

13
IN CONFIDENCE – NOT FOR DISTRIBUTION
Appendix 2: COVID-19 Provisional Disease Indicators, by date
of case notification17 Table 10: NCTS data for cases in the community
Indicator (as per Table
9832) Refined Indicator description Target 12 Sept 13 Sept
** 14 Sept ** 15 Sept ** 16 Sept **
17 Sept **
18 Sept **
1 - (S001) Time from exposure to contact isolation / quarantine 80% within 96 hours 19% - - - - - -
2 – (S002) Time from case first symptom to contact isolation / quarantine 80% within 96 hours 84% - - - - - -
3 – (S003) Time from test sample taken to close contact isolation / quarantine 80% within 72 hours 70% - 100% - - - -
4 – (C001) Time from first symptom to test sample taken for positive cases 80% within 48 hours 100% - - - - - -
5 – (L001) Time from test sample taken to notification of positive result 80% within 24 hours 100% - 0% - - - 100%
6 – (P002) Time from case notification to isolation / quarantine of contact 80% within 48 hours 70% - 100% - - - -
7 – (P001) Time from notification to case interview 80% within 24 hours 100% - 100% - - - 100%
8 – (P003) Time from close contact identification to isolated / quarantined 80% within 24 hours 99% - 100% - - - 50%
10 – (P004) Proportion of contacts traced in 48 hours 80% within 48 hours 70% - 100% - - - -
C – (S005) Proportion of close contacts with confirmed or suspected COVID-19 at the time of tracing <20% 0% - 0% - - - 0%
• * The numerator and denominator are provided in some instances to provide context for low percentages.
• **Data is not available for metrics where there is no data that meets the definition, or where the time/days to reach target has not fully elapsed
• The value of P002 can drop due to the addition of new close contacts to exposure events after the 48-hour period since case notification had elapsed. This can happen for a number of reasons, including a case recalling further details following the original case
interview.
• These metrics report all cases during the specified period, including those in Managed Isolation and Quarantine, and do not include casual contacts.
• There are three additional indicators under development requiring both technical and clinical input to define data requirements. These are due to be completed by end October 2020.

IN CONFIDENCE – NOT FOR DISTRIBUTION
14
Table 11:NCTS data for cases in the community Managed Isolation and Quarantine, International, and Unknown
Indicator (as per Table 9832) Refined Indicator description Target 1 Sept ** 13 Sept ** 14 Sept 15 Sept ** 16 Sept ** 17 Sept ** 18 Sept **
1 - (S001) Time from exposure to contact isolation / quarantine
80% within 96 hours - - 100% - - - -
2 – (S002) Time from case first symptom to contact isolation / quarantine
80% within 96 hours - - 100% - - - -
3 – (S003) Time from test sample taken to close contact isolation / quarantine
80% within 72 hours 100% - 100% - 100% - -
4 – (C001) Time from first symptom to test sample taken for positive cases
80% within 48 hours - - 33% - 50% - -
5 – (L001) Time from test sample taken to notification of positive result
80% within 24 hours 0% - 0% - 71% 0% 100%
6 – (P002) Time from case notification to isolation / quarantine of contact
80% within 48 hours 100% - 100% - 100% 100% -
7 – (P001) Time from notification to case interview 80% within 24 hours 100% - 75% - 58% 100% 100%
8 – (P003) Time from close contact identification to isolated / quarantined
80% within 24 hours 100% - 100% - 100% 100% -
10 – (P004) Proportion of contacts traced in 48 hours 80% within 48 hours 100% - 100% - 100% 100% -
C – (S005) Proportion of close contacts with confirmed or suspected COVID-19 at the time of tracing
<20%
0% - 0% - 0% 0% -
Note:
• * The numerator and denominator are provided in some instances to provide context for low percentages.
• **Data is not available for metrics where there is no data that meets the definition, or where the time/days to reach target has not fully elapsed
• The value of P002 can drop due to the addition of new close contacts to exposure events after the 48-hour period since case notification had elapsed. This can happen for a number of reasons, including a case recalling further details following the original case
interview.
• These metrics report all cases during the specified period, including those in Managed Isolation and Quarantine, and do not include casual contacts.
• There are three additional indicators under development requiring both technical and clinical input to define data requirements. These are due to be completed by end October 2020.

15
IN CONFIDENCE – NOT FOR DISTRIBUTION
Appendix 3: NRHCC Testing Report
Novel Coronavirus (COVID-19)
Issued: 1700 18 September
Note this report is not provided over the weekend Table 12: Metro Auckland Summary Total of Testing for 18 September 2020
Community MIQ
staff
MIQ
guests
Airport Maritime port Ship’s
Crew
TOTAL
5:00pm 1188 122 423 95 57 0 1885
Table 13: Estimated tests taken since 12 August 2020, based on manual site reports at 5pm
Site 12/08-
16/08
17/08-
23/08
24/08 –
30/08
31/08 –
06/09
07/09 –
13/09
14/09 15/09 16/09 17/09 18/09*
MIQ Staff 2132 659 1488 912 1086 136 133 202 132 122
Guests 2972 3767 3600 3406 3424 648 688 522 627 423
Border Airport 2129 933 1349 1158 853 156 137 194 164 95
Port 1588 678 161 392 153 90 18 123 32 57
Crew 0 0 0 0 0 0 0 0 0 0
* 18/09 day still in progress
Table 14: Estimated tests taken at Metro Auckland CTCs, since 12 August 2020, based on manual site reports at 4pm
Site 12/08-
16/08
17/08-
23/08
24/08 –
30/08
31/08 –
06/09
07/09 –
13/09
14/0
9
15/09 16/09 17/09 18/09
*
Airport Oaks 1148 515 366 265 181 27 19 25 40 19
Botany CTC 1151 948 905 749 681 126 151 86 184 162
Health New
Lynn
2603 1258 1703 732 889 148 125 82 85 80
Mangere Town
Centre
1748 1684 1599 860 660 75 109 79 98 64
Otara CTC 3221 1712 1429 930 699 91 78 121 383 117
St Lukes 1368 1045 1414 797 666 204 132 111 131 89
Takanini Urgent
Care
1886 1216 1153 684 440 93 108 62 70 70
Whanau House 2502 1371 1442 928 1613 219 174 134 123 101

IN CONFIDENCE – NOT FOR DISTRIBUTION
16
Whanau Ora -
Central
1957 964 1583 937 783 100 99 45 64 50
Whanau Ora -
North
1442 669 637 982 947 208 221 133 114 88
Whanau Ora -
South
2945 1250 718 677 620 48 79 54 144 76
Manurewa Pop
Up**
N/A N/A N/A N/A N/A 44 50 36 73 24**
Beach Haven
Pop Up**
N/A N/A N/A N/A N/A N/A N/A N/A 27 1**
Westgate Pop
Up**
N/A N/A N/A N/A N/A N/A N/A N/A 21 5**
Henderson Pop
Up
N/A N/A N/A N/A N/A N/A N/A N/A N/A No
Data
Flat Bush Pop
Up
N/A N/A N/A N/A N/A N/A N/A N/A N/A 200
Waiuku Pop Up N/A N/A N/A N/A N/A N/A N/A N/A N/A No
Data
Waipuna
Targeted Site
143 549 376 219 251 28 39 29 44 38
Henderson
Targeted Site
N/A N/A N/A N/A 631 20 14 35 14 4
Total 26,148 16,781 21,215 13,002 10,475 1518 1622 1228 1624 1188
*18/09 day still in progress; N/A = not open as a CTC; Previous sites that are no longer open are not included in
this report
CTCs and mobile testing site locations
Please see https://www.arphs.health.nz/public-health-topics/covid-19/where-to-get-tested for the most up-
to-date information on CTCs and mobile testing sites in the Auckland region.
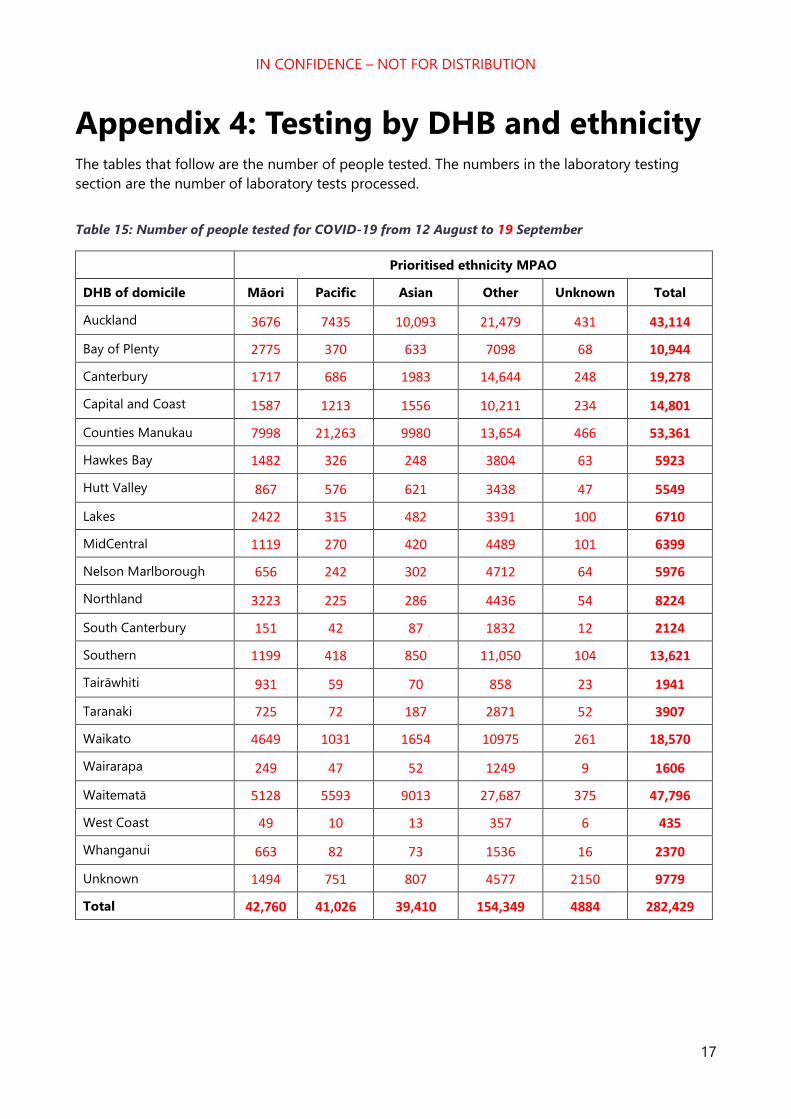
IN CONFIDENCE – NOT FOR DISTRIBUTION
17
Appendix 4: Testing by DHB and ethnicity The tables that follow are the number of people tested. The numbers in the laboratory testing
section are the number of laboratory tests processed.
Table 15: Number of people tested for COVID-19 from 12 August to 19 September
Prioritised ethnicity MPAO
DHB of domicile Māori Pacific Asian Other Unknown Total
Auckland 3676 7435 10,093 21,479 431 43,114
Bay of Plenty 2775 370 633 7098 68 10,944
Canterbury 1717 686 1983 14,644 248 19,278
Capital and Coast 1587 1213 1556 10,211 234 14,801
Counties Manukau 7998 21,263 9980 13,654 466 53,361
Hawkes Bay 1482 326 248 3804 63 5923
Hutt Valley 867 576 621 3438 47 5549
Lakes 2422 315 482 3391 100 6710
MidCentral 1119 270 420 4489 101 6399
Nelson Marlborough 656 242 302 4712 64 5976
Northland 3223 225 286 4436 54 8224
South Canterbury 151 42 87 1832 12 2124
Southern 1199 418 850 11,050 104 13,621
Tairāwhiti 931 59 70 858 23 1941
Taranaki 725 72 187 2871 52 3907
Waikato 4649 1031 1654 10975 261 18,570
Wairarapa 249 47 52 1249 9 1606
Waitematā 5128 5593 9013 27,687 375 47,796
West Coast 49 10 13 357 6 435
Whanganui 663 82 73 1536 16 2370
Unknown 1494 751 807 4577 2150 9779
Total 42,760 41,026 39,410 154,349 4884 282,429

18
IN CONFIDENCE – NOT FOR DISTRIBUTION
Table 16: Rate per 1000 people tested for COVID-19 from 12 August to 19 September
Prioritised ethnicity MPAO
DHB of domicile Māori Pacific Asian Other Total
Auckland 84.5 132.6 53.9 82.2 78.7
Bay of Plenty 46.4 83.2 32.3 45.1 45.4
Canterbury 32.7 48.4 32.6 32.8 33.6
Capital and Coast 43.4 54.7 31 48 46
Counties Manukau 89.8 177.1 66 65.3 93.7
Hawkes Bay 34.3 50.8 27.1 35.2 35.5
Hutt Valley 33.3 49.3 33.1 36.5 36.8
Lakes 63 123.3 49.5 56.5 60.6
MidCentral 30.8 48.7 27.1 36.3 35.3
Nelson Marlborough 40.9 97.9 40.7 37.4 39.4
Northland 53 59.9 34.6 40.7 45.2
South Canterbury 28.4 86 36.8 35.5 35.5
Southern 35.7 60.7 32.9 41.3 40.8
Tairāwhiti 37.6 52.8 60 38.8 39.5
Taranaki 31.1 51.7 30 31.9 32.3
Waikato 48.2 77.3 37.5 40.8 43.9
Wairarapa 31.2 56.5 41.7 35 35.1
Waitematā 81.9 125.4 62.7 72.4 75.5
West Coast 12.6 39.6 14.1 13.2 13.6
Whanganui 38.2 53.9 24.9 35.7 36.5
Total 55 128.3 51.4 49.9 56.9

1
IN CONFIDENCE – NOT FOR DISTRIBUTION
SITREP 059
Coronavirus disease 2019 (COVID-19)
Issued: 1030 hours 21 September 2020
Information current at: 1000 hours
This report provides a daily update on the COVID-19 health system response. New information is denoted by red text.
Please use the single point of contact email [email protected] for help/support. Your email will be
logged and promptly passed to the appropriate team.
This document is classified IN CONFIDENCE and not for further distribution.
Need to know
COMMUNITY CASES
NEW LAST 24 hrs
0
IMPORTED MIQ
CASES
NEW LAST 24 hrs
0
COMMUNITY CASES
TOTAL RECOVERED
147
129
COMMUNITY CASES
ACTIVE
33 TOTAL CASES SINCE 11 AUG
183
29
TOTAL IMPORTED MIQ CASES
158
TOTAL ACTIVE CASES IN NZ (COMMUNITY & MIQ): 62
IMPORTED MIQ CASES
TOTAL RECOVERED
IMPORTED MIQ CASES
ACTIVE
LABORATORY TESTS
LAST 24 hrs
3,568
LABORATORY TESTS
LAST SEVEN DAYS
46,379
LABORATORY TESTS
TOTAL
914,421
CASES DECEASED
3

IN CONFIDENCE – NOT FOR DISTRIBUTION
2
Total COVID-19 cases
Table 1: Total number of COVID-19 cases as at 0900 21 September 20201
Case Status Active Recovered Deceased Total
Confirmed 62* (-9) 1382 (+9) 20 1464
Probable 0 346 5 351
Total 62* (-9) 1728 (+9) 25 1815
*0 new cases identified, 9 cases classified as recovered.
Total community cases since 11 August
Table 2: Community cases by DHB and case status as at 0900 21 September 20201
New community cases since 0900 20 September 20202
1. No new community cases have been reported, as at 0900 21 September.
New case under investigation since 0900 20 September 20203
2. The case reported on 19 September is a returnee who arrived in New Zealand on 27
August and completed managed isolation in Christchurch. The case tested negative on
day 3 and day 12. They left managed isolation on 11 September and returned home to
Auckland on a charter flight from Christchurch. They were tested after developing
symptoms on 16 September. The test returned positive on 18 September. The case and
their two household contacts (both reported as confirmed cases on 19 September)
were transferred to the Auckland Jet Park quarantine facility on 18 September. The
case’s genome sequence is consistent with two confirmed cases from the same flight to
New Zealand.4 Source of infection is still under investigation. Three neighbours who are
close contacts, have all tested negative and been in self-isolation. The 87 passengers of
the charter flight are being contacted and assessed. The first nine rows (who sat near
the case) have been asked to self-isolate and have been tested, with results pending.
1 EpiSurv Database, 0900 21 September 2020
2 EpiSurv Database, 0900 21 September 2020
3 EpiSurv Database, 0900 21 September 2020
4 WGS Interim Report, 0313 21 September 2020
Case
Status
Counties Manukau Waitematā Auckland Waikato Total
Confirmed 79 55 47 1 182
Probable 1 0 0 0 1
Total 80 55 47 1 183

IN CONFIDENCE – NOT FOR DISTRIBUTION
3
Community cases linked to the Auckland Community Cluster August 20205
3. 178 of the 183 community cases have been linked to the Auckland Community Cluster
August 2020, as at 0900 21 September 2020. The unlinked cases are summarised as
follows:
o The Rydges employee (this investigation has been closed).
o A case (reported 21 August) is still under investigation for an epidemiological link to
the community cluster. There is insufficient data to confirm a genomic link to the
community cluster (see 4).
o The three cases detailed in paragraph 2.
Community cases under investigation to determine a link to the Auckland
community cluster
4. The case under investigation is summarised as follows:
o One case came through the border on 18 June. The case tested negative at day 3 and
day 12 of quarantine. The case subsequently tested positive on 21 August. Despite
using two different whole genome sequencing protocols only there is insufficient
data to confirm the case is genomically linked to the community cluster.6 Their
epidemiological link to the community cluster is still under investigation. As at 21
September no additional information has been revealed by the investigation.
Community cases and household contacts at Jet Park
5. As at 0800 21 September there are 40 people isolating in Jet Park from the community.
17 are confirmed cases, the remaining 23 are household contacts. This number will
fluctuate as people finish their isolation and depart from the facility.7
MIQ cases since 0900 20 September 20208
6. No new cases have been detected at the border, as at 0900 21 September. In total 158
cases have been detected at the border since the establishment of MIQ facilities.
5 EpiSurv Database, 0900 21 September 2020
6 ESR WGS report 03 September 2020
7 NRHCC Morning Report, 0900 21 September 2020
8 EpiSurv Database, 0900 21 September 2020

IN CONFIDENCE – NOT FOR DISTRIBUTION
4
Cases in hospital
7. As at 0800 21 September there are three cases in hospital with COVID-19.9
Table 3: Number of cases in hospital with COVID-19 by DHB as at 0800 21 September 2020
Health system response
Overall approach
8. Our investigation has two main focus areas that run in parallel:
o Source attribution – a focus on investigating the case with the earliest symptom
onset date to gather details actions of movements 14 days prior. This will help to
understand the possible source of the new outbreak.
o Containment – rigorous case investigation, identification of close contacts and
isolation and testing to ensure that chain of transmission is broken.
Current outbreak overview
o There have been no new cases reported in the Auckland community cluster since 14
September. Ongoing scoping of community settings since 14 September has revealed
no major concerns.10
Current outbreak investigation priorities11
o Ongoing management of healthcare workers from Jet Park.
o Ongoing management of Auckland community cluster work.
o Ongoing source investigation and contact tracing linked to the case reported 19
September.
9 NRHCC Morning Report 21 September 2020
10 NRHCC Morning Report, 0900 19 September 2020
11NRHCC Morning Report, 0900 21 September 2020
DHB Hospital Number in a general ward Number in ICU/HDU
Auckland Auckland City 1 0
Waitematā North Shore 1 0
Counties Manukau Middlemore 1 0
Total - 3 0

IN CONFIDENCE – NOT FOR DISTRIBUTION
5
Sub-clusters and settings of interest12
9. The child of the case (paragraph 2) attended an Auckland primary school. As soon as
the developed symptoms, the whole family self-isolated and the child was kept
home from school. One of the close contacts
and attended the same school until 18 September (tested negative).13 The school is
considered low risk. Further analysis of the symptoms of the is
underway and any implications for the school will be clarified.
10. A healthcare worker at Jet Park was reported as a case on 13 September. The case has
been epidemiologically and genomically linked to the Auckland Community Cluster.
The case has been epidemiologically linked to a community case who was completing
isolation at Jet Park and required hospitalisation. A review of processes at Jet Park is
underway with a focus on lessons to be learnt from this situation.
11. The healthcare worker is isolating at Jet Park facility. The case has five household close
contacts who are self-isolating at home. All five household contacts have tested
negative twice. All staff at Jet Park staff who are considered close contacts have been
stood down and have returned negative results so far.
12. members of a family in the Botany sub-cluster had serology testing on 11
September which returned negative results for all members. A case linked to the
Botany sub-cluster briefly attended school on 14 September, prior to being notified of
the positive test result that day.14 The school has been closed as a precaution while
close contact tracing and a deep clean is completed. A total of four close contacts have
been identified. All students who attended school (about 470) on 14 September are
casual contacts. Letters have been sent asking students to be tested and to remain in
self-isolation at home until they receive a negative test result. They have also been
asked to contact Healthline if they become symptomatic. Onsite testing has been
arranged from 18 September until 20 September. The school is now open.
Case investigation
13. Source investigation for an epidemiological link to the main cluster for four cases who
have been genomically linked to the main cluster is ongoing:
o The
o GP
o The second Mount Albert Grammar student
o The Botany case
12 NRHCC Morning Report, 0900 16 September 2020
13 NRHCC Morning Report, 0900 20 September 2020
14 NRHCC Morning Report 17 September 2020
s 9(2)(a)
s 9(2)(a)
s 9(2)(a)
s 9(2)(a)
s 9(2)(a)
s 9(2)(a)
s 9(2)(a)
s 9(2)(a)

6
IN CONFIDENCE – NOT FOR DISTRIBUTION
1.
2.
s 9(2)(a)
s 9(2)(a)

7
IN CONFIDENCE – NOT FOR DISTRIBUTION
ESR and wider testing15 14. A further 10 community cases are genomically linked with the Auckland cluster. These
cases are from the following known subclusters; Church 1 (1 cases), Church 3 (5 cases),
Americold HH (2 cases), MREF Bereavement (C-0018) (2 cases). A total of 153 cases
(86%) from the community cluster have now been sequenced, of which 134 (76%)
yielded a high quality genome.
15.
16. Ongoing analysis of the whole genome sequencing results is being used to show how
COVID-19 has been transmitted through the community cluster and to further inform
its management.
17. No direct links have been found between the community outbreak genome
sequencing, and the 65 full genomes (49 high quality) currently available from cases
detected in border arrivals in managed isolation facilities (MIFs). There has been one
case in a health worker at a managed isolation facility. WGS results indicate that this
case is genomically linked to the Auckland community cluster and clustered closely with
three community cases in the managed isolation facility (as discussed in para 8).
18.
15 ESR Whole Genome Sequencing Report 02 September 2020, Email 0946 16 September 2020
s 9(2)(g)(i)
s 9(2)(g)(i)

IN CONFIDENCE – NOT FOR DISTRIBUTION
8
Figure 1: Number of cases that have been whole genome sequenced and are genomically clustered
with the Auckland August cluster by sub-cluster as at 14 September 202016
Source: ESR *A sample may not have been received by ESR, may not have been sequenced yet or a sequencing result could not be
obtained from the sample received.
Contact tracing17 19. Between 12 and 18 September 77.2% (169/219) of Community close contacts and 100%
(32/32) MIQ close contacts have been contacted within 48 hours of being determined
to be a contact. KPI for this metric is 80% of close contacts within 48 hours.
o Note: Please note that the total number and number successfully contacted has decreased due
to casual contacts associated with the Les Mills exposure events being excluded.
Table 5: Close contact tracing recorded in the National Contact Tracing Solution since 12 August as at
0830 21 September 2020
18/09/2020 19/09/2020 20/09/2020 21/09/2020
Number of close contacts
identified1 3912 3918 3916 3989
Number of close contacts
successfully contacted (and are
self-isolating)
3908 3912 3912 3978
Number of close contacts
referred to "finding services"2 0 0 0 0
16 ESR email 1608 14 September 2020
17 COVID-19 NCCS Analytics and Reporting 0928 21 September 2020
0 5 10 15 20 25 30 35
Americold
Americold HH
Auckland Bus
Botany
Church 1
Church 2
Church 3
Finance Now
Finance Now HH
Household 1
Household 2
Household 3
MREF-Bereavement
GP
NZ Courier Post
Pending
Warehouse
Number of cases
Sequenced and genomically clustered Sequence not available*
s 9(2)(a)
s 9(2)(a)
s 9(2)(a)

IN CONFIDENCE – NOT FOR DISTRIBUTION
9
Number of close contacts
awaiting contact 4 2 4 11
1. Contacts loaded into the National Contact Tracing Solution, and managed by either the National Investigation and Tracing
Unit or the Public Health Units. Contacts from MIQ and overseas cases are not included in this report.
2. "Finding services" refers to the mechanism the National Close Contact Service uses to find valid contact details for close
contacts we do not have the correct contact details for. These services utilise internal Ministry of Health databases along with
Police, Customs and Airlines where relevant.
3. The total number and number successfully contacted can decrease due to duplicates and invalid records being removed from
the system.
COVID-19 Tracer App usage18 Figure 2: COVID-19 Tracer App cumulative registered users and daily scans/manual entries as at 0900
21 September 2020
1. The number of scans and manual entries on any given date is subject to change for up to 31 days. This is because there can be
a delay before anonymised analytic information is received (e.g. device not connected to internet when scan carried out).
2. The number of App registrations and QR codes for any given date is subject to change for up to 1 day. This is because due to
reporting timeframes these numbers may be extracted before the 12pm cut-off for the reporting period.
18 Response Analyst – Digital Channels, 0912 21 September 2020
0
500,000
1,000,000
1,500,000
2,000,000
2,500,000
0
500,000
1,000,000
1,500,000
2,000,000
2,500,000
20
/05
23
/05
26
/05
29
/05
01
/06
04
/06
07
/06
10
/06
13
/06
16
/06
19
/06
22
/06
25
/06
28
/06
01
/07
04
/07
07
/07
10
/07
13
/07
16
/07
19
/07
22
/07
25
/07
28
/07
31
/07
03
/08
06
/08
09
/08
12
/08
15
/08
18
/08
21
/08
24
/08
27
/08
30
/08
02
/09
05
/09
08
/09
11
/09
14
/09
17
/09
Dai
ly s
can
s an
d m
anu
al e
ntr
ies
Cu
mu
lati
ve A
pp
regi
stra
tio
ns
Day and month
Cumulative App registrations Daily scans and manual entries

IN CONFIDENCE – NOT FOR DISTRIBUTION
10
Testing19 Table 6: Testing by functional groups, as at 0900 21 September 2020
*Numbers have been sourced from different data extracts in comparison to Table 7.
Laboratory testing numbers20 Table 7: Number of laboratory tests processed nationally as at 0900 21 September 2020
Testing supply update21
20. There are good levels of testing supplies available, with 299,747 tests currently in the
labs. The Ministry of Health is continuing to work with major suppliers in order to meet
ongoing need.
19 ÉCLAIR/MoH Public Health Intelligence, 1000 20 September 2020
20 Daily Lab Report, 0923 21 September 2020
21 Testing supply email, 0939 21 September 2020
Reason for test 20 September 14–20 September
GPs and other primary health 1572 17,917
CBACs and pop-ups 1395 22,932
Border workers - air crew 25 246
Border workers - airport staff 104 1332
Border workers - maritime crew 0 32
Border workers – Port of Tauranga staff 1 473
Border workers – Remaining Port staff 3 181
Border workers - MIF 156 1212
Border workers - MIQ 54 435
Travellers - Staying at MIF 255 1770
Travellers - Staying at MIQ 4 34
Total 3569* 46,564*
Time period Number of laboratory tests
20 September 3568*
Last 7 days (14 Sep to 20 Sep) 46,379*
Total 914,421

IN CONFIDENCE – NOT FOR DISTRIBUTION
11
Healthline updates22 21. On 20 September there were 2,357 contacts in Healthline. Of those calls, 588 were to
the COVID-19 Info line. Demand on 1737 Need to talk? and other mental health services
was 562 contacts (lower than forecast).
22. The main themes on 20 September were:
o National Telehealth Service (Healthline) continued to take calls related to the
exposure event, including in response to media reporting on possible school
students yesterday.
o Questions relating to the changes to Alert Levels that may occur this week. When
alert levels are changed it would be useful to ensure that this is supported by a single
source of information on the various alert levels being set and what it means.
o Most of the general public Service Users were calling because they are symptomatic
and wanted to be tested.
Logistics
Health Workforce23
23. Health Workforce continue to work with employers who have expressed a need for
assistance with identifying people who are willing to work within the health system and
to provide some relief from COVID-19 related staffing issues.
24. Upskilling of alternative workforces for testing continues to progress. Health Workforce
are currently engaged with Careerforce and DHBs to create a testing workforce training
and education package. This will be utilised by DHBs across the country, to increase the
pool of people who are able to perform COVID-19 testing. Following on from the
didactic component, will be practical training and assessment, which will continue to be
provided by the relevant DHB.
25. Health Workforce are monitoring staffing needs in MIFs facilities and are providing
support where possible.
22 National Telehealth Service Coronavirus Update, 0921 21 September 2020
23 Health Workforce Directorate, 0945 14 September 2020

IN CONFIDENCE – NOT FOR DISTRIBUTION
12
Hospital capacity24 Table 8: Number and occupancy of hospital beds by type as at 0800 21 September 2020
Type Number of units Number (%) occupied/in use
ICU and HDU beds 389 208 (53.5%)
Ventilators 299 53 (17.7%)
Ward beds 7257 5782 (79.7%)
24 COVID-19 Hospital Summary, 0904 21 September 2020

13
IN CONFIDENCE – NOT FOR DISTRIBUTION
Appendix 1: Case summary Table 9: All community cases reported between 0900 20 September and 0900 21 September. Source: ESR EpiSurv Extract 0900 21 September 2020
Cumulative
Number
Date tested
positive Onset date
Case
status DHB Sex Age Ethnicity
Symptoms
[Yes/No] Hospitalised Occupation Source of transmission

14
IN CONFIDENCE – NOT FOR DISTRIBUTION
Appendix 2: COVID-19 Provisional Disease Indicators, by date
of case notification17 Table 10: NCTS data for cases in the community
Indicator (as per Table
9832) Refined Indicator description Target 13 Sept ** 14 Sept
** 15 Sept ** 16 Sept ** 17 Sept **
18 Sept **
19 Sept **
1 - (S001) Time from exposure to contact isolation / quarantine 80% within 96 hours - - - - - - -
2 – (S002) Time from case first symptom to contact isolation / quarantine 80% within 96 hours - - - - - - -
3 – (S003) Time from test sample taken to close contact isolation / quarantine 80% within 72 hours - 100% - - - - -
4 – (C001) Time from first symptom to test sample taken for positive cases 80% within 48 hours - - - - - 100% -
5 – (L001) Time from test sample taken to notification of positive result 80% within 24 hours - 0% - - - 100% 100%
6 – (P002) Time from case notification to isolation / quarantine of contact 80% within 48 hours - 100% - - - 84% -
7 – (P001) Time from notification to case interview 80% within 24 hours - 100% - - - 100% 100%
8 – (P003) Time from close contact identification to isolated / quarantined 80% within 24 hours - 100% - - - 83% 100%
10 – (P004) Proportion of contacts traced in 48 hours 80% within 48 hours - 100% - - - 84% -
C – (S005) Proportion of close contacts with confirmed or suspected COVID-19 at the time of tracing <20% - 0% - - - 7% 0%
• * The numerator and denominator are provided in some instances to provide context for low percentages.
• **Data is not available for metrics where there is no data that meets the definition, or where the time/days to reach target has not fully elapsed
• The value of P002 can drop due to the addition of new close contacts to exposure events after the 48-hour period since case notification had elapsed. This can happen for a number of reasons, including a case recalling further details following the original case
interview.
• These metrics report all cases during the specified period, including those in Managed Isolation and Quarantine, and do not include casual contacts.
• There are three additional indicators under development requiring both technical and clinical input to define data requirements. These are due to be completed by end October 2020.

IN CONFIDENCE – NOT FOR DISTRIBUTION
15
Table 11:NCTS data for cases in the community Managed Isolation and Quarantine, International, and Unknown
Indicator (as per Table 9832) Refined Indicator description Target 13 Sept ** 14 Sept 15 Sept ** 16 Sept 17 Sept ** 18 Sept ** 19 Sept **
1 - (S001) Time from exposure to contact isolation / quarantine
80% within 96 hours - 100% - 38% - - -
2 – (S002) Time from case first symptom to contact isolation / quarantine
80% within 96 hours - 100% - 38% - - -
3 – (S003) Time from test sample taken to close contact isolation / quarantine
80% within 72 hours - 100% - 100% 100% - -
4 – (C001) Time from first symptom to test sample taken for positive cases
80% within 48 hours - 33% - 50% - - -
5 – (L001) Time from test sample taken to notification of positive result
80% within 24 hours - 0% - 71% 0% 100% 50%
6 – (P002) Time from case notification to isolation / quarantine of contact
80% within 48 hours - 100% - 100% 100% - -
7 – (P001) Time from notification to case interview 80% within 24 hours - 75% - 58% 100% 100% 100%
8 – (P003) Time from close contact identification to isolated / quarantined
80% within 24 hours - 100% - 100% 100% - 100%
10 – (P004) Proportion of contacts traced in 48 hours 80% within 48 hours - 100% - 100% 100% - -
C – (S005) Proportion of close contacts with confirmed or suspected COVID-19 at the time of tracing
<20%
- 0% - 0% 0% - 0%
Note:
• * The numerator and denominator are provided in some instances to provide context for low percentages.
• **Data is not available for metrics where there is no data that meets the definition, or where the time/days to reach target has not fully elapsed
• The value of P002 can drop due to the addition of new close contacts to exposure events after the 48-hour period since case notification had elapsed. This can happen for a number of reasons, including a case recalling further details following the original case
interview.
• These metrics report all cases during the specified period, including those in Managed Isolation and Quarantine, and do not include casual contacts.
• There are three additional indicators under development requiring both technical and clinical input to define data requirements. These are due to be completed by end October 2020.

16
IN CONFIDENCE – NOT FOR DISTRIBUTION
Appendix 3: NRHCC Testing Report
Novel Coronavirus (COVID-19)
Issued: 1000 21 September
Table 12: Metro Auckland Summary Total of Testing for 18 September 2020
Community MIQ
staff
MIQ
guests
Airport Maritime port Ship’s
Crew
TOTAL
19/09/2020 962 98 526 91 No testing No
testing 1677
20/09/2020 635 75 409 72 No testing No
testing 1191
Table 13: Estimated tests taken since 12 August 2020, based on manual site reports at 5pm
Site 12/08-
16/08
17/08-
23/08
24/08 –
30/08
31/08 –
06/09
07/09 –
13/09
14/09 –
20/09
19/09 20/09
MIQ Staff 2132 659 1488 912 1086 908 98 75
Guests 2972 3767 3600 3406 3424 3843 526 409
Border Airport 2129 933 1349 1158 853 951 91 72
Port 1588 678 161 392 153 320 No
testing
No
testing
Table 14: Estimated tests taken at Metro Auckland CTCs, since 12 August 2020, based on manual site reports at
4pm
Site 12/08-
16/08
17/08-
23/08
24/08 –
30/08
31/08 –
06/09
07/09 –
13/09
14/09 –
20/09
19/09 20/09
Airport Oaks 1148 515 366 265 181 152 8 14
Botany CTC 1151 948 905 749 681 802 52 41
Health New Lynn 2603 1258 1703 732 889 613 45 48
Mangere Town
Centre
1748 1684 1599 860 660 487 41 21
Otara CTC 3221 1712 1429 930 699 938 86 62
St Lukes 1368 1045 1414 797 666 830 75 88

IN CONFIDENCE – NOT FOR DISTRIBUTION
17
Takanini Urgent
Care
1886 1216 1153 684 440 487 37 47
Whanau House 2502 1371 1442 928 1613 822 71 48
Whanau Ora -
Central
1957 964 1583 937 783 470 43 49
Whanau Ora -
North
1442 669 637 982 947 907 64 79
Whanau Ora -
South
2945 1250 718 677 620 470 46 12
Flat Bush Pop Up N/A N/A N/A N/A N/A 349 111 38
Pakuranga Pop Up N/A N/A N/A N/A N/A 59 30 29
Panmure Pop Up N/A N/A N/A N/A N/A 100 57 43
Beach Haven Pop
Up N/A N/A N/A N/A N/A 74 46 N/A
Henderson Pop Up N/A N/A N/A N/A N/A 46 45 N/A
Otara Pop Up N/A N/A N/A N/A N/A 73 73 N/A
Waipuna Targeted
Site
143 549 376 219 251 220 28 14
Henderson
Targeted Site
N/A N/A N/A N/A 631 93 4 2
Total 26,148 16,781 21,215 13,002 10,475 8,776 962 635
N/A = not open as a CTC; Previous sites that are no longer open are not included in this report
CTCs and mobile testing site locations
Please see https://www.arphs.health.nz/public-health-topics/covid-19/where-to-get-tested for the most up-
to-date information on CTCs and mobile testing sites in the Auckland region.

IN CONFIDENCE – NOT FOR DISTRIBUTION
18
Appendix 4: Testing by DHB and ethnicity The tables that follow are the number of people tested. The numbers in the laboratory testing
section are the number of laboratory tests processed.
Table 15: Number of people tested for COVID-19 from 12 August to 20 September
Prioritised ethnicity MPAO
DHB of domicile Māori Pacific Asian Other Unknown Total
Auckland 3699 7480 10,198 21,644 441 43,462
Bay of Plenty 2789 373 634 7126 68 10,990
Canterbury 1723 687 2006 14,703 254 19,373
Capital and Coast 1596 1219 1576 10,266 239 14,896
Counties Manukau 8039 21,442 10,087 13,757 475 53,800
Hawkes Bay 1485 326 248 3809 64 5932
Hutt Valley 871 577 625 3457 50 5580
Lakes 2432 315 485 3400 101 6733
MidCentral 1125 271 420 4505 101 6422
Nelson Marlborough 657 242 304 4725 68 5996
Northland 3243 226 288 4470 57 8284
South Canterbury 151 43 87 1843 14 2138
Southern 1199 418 851 11,083 109 13,660
Tairāwhiti 933 59 70 861 23 1946
Taranaki 731 74 189 2911 53 3958
Waikato 4667 1040 1672 11,043 267 18,689
Wairarapa 250 47 52 1252 10 1611
Waitematā 5152 5653 9075 27,868 382 48,130
West Coast 49 10 13 357 6 435
Whanganui 663 82 73 1536 16 2370
Unknown 1514 755 825 4614 2223 9931
Total 42,968 41,339 39,778 155,231 5021 284,337
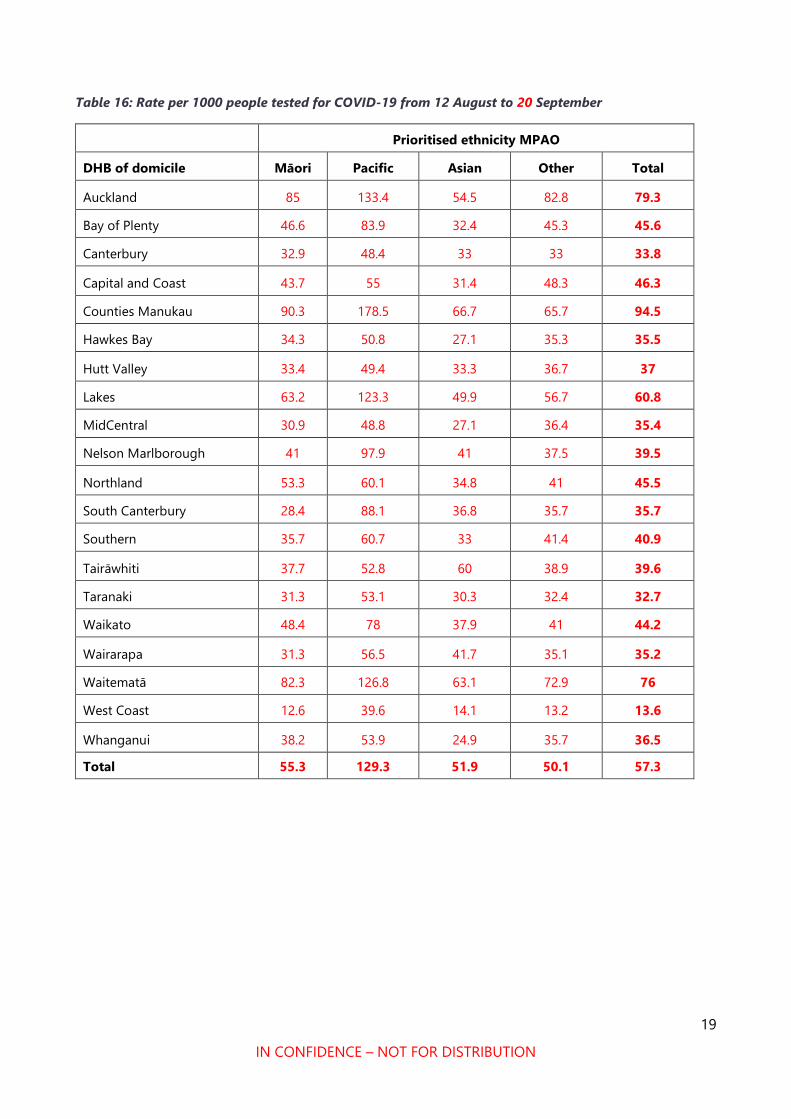
19
IN CONFIDENCE – NOT FOR DISTRIBUTION
Table 16: Rate per 1000 people tested for COVID-19 from 12 August to 20 September
Prioritised ethnicity MPAO
DHB of domicile Māori Pacific Asian Other Total
Auckland 85 133.4 54.5 82.8 79.3
Bay of Plenty 46.6 83.9 32.4 45.3 45.6
Canterbury 32.9 48.4 33 33 33.8
Capital and Coast 43.7 55 31.4 48.3 46.3
Counties Manukau 90.3 178.5 66.7 65.7 94.5
Hawkes Bay 34.3 50.8 27.1 35.3 35.5
Hutt Valley 33.4 49.4 33.3 36.7 37
Lakes 63.2 123.3 49.9 56.7 60.8
MidCentral 30.9 48.8 27.1 36.4 35.4
Nelson Marlborough 41 97.9 41 37.5 39.5
Northland 53.3 60.1 34.8 41 45.5
South Canterbury 28.4 88.1 36.8 35.7 35.7
Southern 35.7 60.7 33 41.4 40.9
Tairāwhiti 37.7 52.8 60 38.9 39.6
Taranaki 31.3 53.1 30.3 32.4 32.7
Waikato 48.4 78 37.9 41 44.2
Wairarapa 31.3 56.5 41.7 35.1 35.2
Waitematā 82.3 126.8 63.1 72.9 76
West Coast 12.6 39.6 14.1 13.2 13.6
Whanganui 38.2 53.9 24.9 35.7 36.5
Total 55.3 129.3 51.9 50.1 57.3

1
IN CONFIDENCE – NOT FOR DISTRIBUTION
SITREP 060
Coronavirus disease 2019 (COVID-19)
Issued: 1030 hours 22 September 2020
Information current at: 1000 hours
This report provides a daily update on the COVID-19 health system response. New information is denoted by red text.
Please use the single point of contact email [email protected] for help/support. Your email will be
logged and promptly passed to the appropriate team.
This document is classified IN CONFIDENCE and not for further distribution.
Need to know
COMMUNITY CASES
NEW LAST 24 hrs
0
IMPORTED MIQ
CASES
NEW LAST 24 hrs
0
COMMUNITY CASES
TOTAL RECOVERED
148
129
COMMUNITY CASES
ACTIVE
32 TOTAL CASES SINCE 11 AUG
183
29
TOTAL IMPORTED MIQ CASES
158
TOTAL ACTIVE CASES IN NZ (COMMUNITY & MIQ): 61
IMPORTED MIQ CASES
TOTAL RECOVERED
IMPORTED MIQ CASES
ACTIVE
LABORATORY TESTS
LAST 24 hrs
3,278
LABORATORY TESTS
LAST SEVEN DAYS
45,255
LABORATORY TESTS
TOTAL
917,699
CASES DECEASED
3

IN CONFIDENCE – NOT FOR DISTRIBUTION
2
Total COVID-19 cases
Table 1: Total number of COVID-19 cases as at 0900 22 September 20201
Case Status Active Recovered Deceased Total
Confirmed 61* (-1) 1383 (+1) 20 1464
Probable 0 346 5 351
Total 61* (-1) 1729 (+1) 25 1815
*0 new cases identified, 1 case classified as recovered.
Total community cases since 11 August
Table 2: Community cases by DHB and case status as at 0900 22 September 20201
New community cases since 0900 21 September 20202
1. No new community cases have been reported, as at 0900 22 September.
Community cases under investigation since 0900 21 September 20203
2. The case reported on 19 September is a returnee who arrived in New Zealand on 27
August and completed managed isolation in Christchurch. The case tested negative on
day 3 and day 12. They left managed isolation on 11 September and returned home to
Auckland on a charter flight from Christchurch. They were tested after developing
symptoms on 16 September. The test returned positive on 18 September. The case and
their two household contacts (both reported as confirmed cases on 19 September)
were transferred to the Auckland Jet Park quarantine facility on 18 September. The
case’s genome sequence is consistent with two confirmed cases from the same flight to
New Zealand.4 Source of infection is still under investigation. Three neighbours who are
close contacts, have all tested negative and been in self-isolation.
3. The 87 passengers of the charter flight are being contacted and assessed. The first nine
rows (who sat near the case) have been asked to self-isolate and have been tested,
results in table 4 below. One of the passengers from the chartered flight returned a
positive test with a high CT value yesterday (21 September). They were retested and
returned a negative result this morning (22 September). This person was reported in
1 EpiSurv Database, 0900 22 September 2020
2 EpiSurv Database, 0900 22 September 2020
3 EpiSurv Database, 0900 22 September 2020
4 WGS Interim Report, 0313 21 September 2020
Case
Status
Counties Manukau Waitematā Auckland Waikato Total
Confirmed 79 55 47 1 182
Probable 1 0 0 0 1
Total 80 55 47 1 183

IN CONFIDENCE – NOT FOR DISTRIBUTION
3
the end of day report on 21 September and in the text message at 0900 22 September
as a confirmed case. However, the case status of this person has been reclassified as
under investigation, due to the subsequent negative test, to determine if it is an historic
case and if they were already reported as a case in India. A precautionary approach is
being taken and they have been transferred to the Auckland Jet Park facility. The case
was a close contact of the case reported on 19 September on the flight from Fiji to
Christchurch on 27 August and was also a passenger on the charter flight from
Christchurch to Auckland on 11 September.
4. An expert panel is being established to consider cases with high CT counts to
determine their status and develop a protocol for reporting, management, and
investigation of potentially historic infections. As a consequence, historic cases under
investigation will be included in future reporting.
Community cases linked to the Auckland Community Cluster August 20205
5. 178 of the 183 community cases have been linked to the Auckland Community Cluster
August 2020, as at 0900 22 September 2020. The unlinked cases are summarised as
follows:
o The Rydges employee (this investigation has been closed).
o A case (reported 21 August) is still under investigation for an epidemiological link to
the community cluster. There is insufficient data to confirm a genomic link to the
community cluster (see 4).
o The three cases detailed in paragraph 2.
Community cases under investigation to determine a link to the Auckland
community cluster
6. The case under investigation is summarised as follows:
o One case came through the border on 18 June. The case tested negative at day 3 and
day 12 of quarantine. The case subsequently tested positive on 21 August. Despite
using two different whole genome sequencing protocols only there is insufficient
data to confirm the case is genomically linked to the community cluster.6 Their
epidemiological link to the community cluster is still under investigation. As at 21
September no additional information has been revealed by the investigation.
Community cases and household contacts at Jet Park
7. As at 0800 22 September there are 39 people isolating in Jet Park from the community.
18 are confirmed cases, the remaining 21 are household contacts. This number will
fluctuate as people finish their isolation and depart from the facility.7
5 EpiSurv Database, 0900 22 September 2020
6 ESR WGS report 03 September 2020
7 NRHCC Morning Report, 0845 22 September 2020

IN CONFIDENCE – NOT FOR DISTRIBUTION
4
MIQ cases since 0900 21 September 20208
8. No new cases have been detected at the border, as at 0900 22 September. In total 158
cases have been detected at the border since the establishment of MIQ facilities.
Cases in hospital
9. As at 0800 22 September there are three cases in hospital with COVID-19.9
Table 3: Number of cases in hospital with COVID-19 by DHB as at 0800 22 September 2020
Health system response
Overall approach
10. Our investigation has two main focus areas that run in parallel:
o Source attribution – a focus on investigating the case with the earliest symptom
onset date to gather details actions of movements 14 days prior. This will help to
understand the possible source of the new outbreak.
o Containment – rigorous case investigation, identification of close contacts and
isolation and testing to ensure that chain of transmission is broken.
Current outbreak overview
o There have been no new cases reported in the Auckland community cluster since 14
September.
Current outbreak investigation priorities10
o Ongoing management of healthcare workers from Jet Park.
o Ongoing management of Auckland community cluster work.
8 EpiSurv Database, 0900 22 September 2020
9 NRHCC Morning Report, 0845 22 September 2020
10NRHCC Morning Report, 0845 22 September 2020
DHB Hospital Number in a general ward Number in ICU/HDU
Auckland Auckland City 1 0
Waitematā North Shore 1 0
Counties Manukau Middlemore 1 0
Total - 3 0

IN CONFIDENCE – NOT FOR DISTRIBUTION
5
o Ongoing source investigation and contact tracing linked to the case reported 19
September.
Sub-clusters and settings of interest11
11. The child of the case (paragraph 2) attended an Auckland primary school. As soon as
the developed symptoms, the whole family self-isolated and the child was kept
home from school. One of the close contacts
and attended the same school until 18 September (tested negative).12 The school is
considered low risk. Further analysis of the symptoms of the is
underway and any implications for the school will be clarified.
12. A healthcare worker at Jet Park was reported as a case on 13 September. The case has
been epidemiologically and genomically linked to the Auckland Community Cluster.
The case has been epidemiologically linked to a community case who was completing
isolation at Jet Park and required hospitalisation. A review of processes at Jet Park is
underway with a focus on lessons to be learnt from this situation.
13. The healthcare worker is isolating at Jet Park facility. The case has close
contacts who are self-isolating at home. All contacts have tested
negative twice. All staff at Jet Park staff who are considered close contacts have been
stood down and have returned negative results so far.
14. members of a family in the Botany sub-cluster had serology testing on 11
September which returned negative results for all members. A case linked to the
Botany sub-cluster briefly attended school on 14 September, prior to being notified of
the positive test result that day.13 The school has been closed as a precaution while
close contact tracing and a deep clean is completed. A total of four close contacts have
been identified. All students who attended school (about 470) on 14 September are
casual contacts. Letters have been sent asking students to be tested and to remain in
self-isolation at home until they receive a negative test result. They have also been
asked to contact Healthline if they become symptomatic. Onsite testing has been
arranged from 18 September until 20 September. The school is now open.
Case investigation
15. Source investigation for an epidemiological link to the main cluster for four cases who
have been genomically linked to the main cluster is ongoing:
o The
o GP
o The second Mount Albert Grammar student
o The Botany case
11 NRHCC Morning Report, 0900 16 September 2020
12 NRHCC Morning Report, 0900 20 September 2020
13 NRHCC Morning Report 17 September 2020
s 9(2)(a)
s 9(2)(a) s 9(2)(a)
s 9(2)(a)
s 9(2)(a)
s 9(2)(a)
s 9(2)(a)
s 9(2)(a)
s 9(2)(a)
s 9(2)(a)

6
IN CONFIDENCE – NOT FOR DISTRIBUTION
1.
2.
s 9(2)(a)
s 9(2)(a)

IN CONFIDENCE – NOT FOR DISTRIBUTION
7
s 9(2)(a)

8
IN CONFIDENCE – NOT FOR DISTRIBUTION
ESR and wider testing14 16. A further 10 community cases are genomically linked with the Auckland cluster. These
cases are from the following known subclusters; Church 1 (1 cases), Church 3 (5 cases),
Americold HH (2 cases), MREF Bereavement (C-0018) (2 cases). A total of 153 cases
(86%) from the community cluster have now been sequenced, of which 134 (76%)
yielded a high quality genome.
17.
18. Ongoing analysis of the whole genome sequencing results is being used to show how
COVID-19 has been transmitted through the community cluster and to further inform
its management.
19. No direct links have been found between the community outbreak genome
sequencing, and the 65 full genomes (49 high quality) currently available from cases
detected in border arrivals in managed isolation facilities (MIFs). There has been one
case in a health worker at a managed isolation facility. WGS results indicate that this
case is genomically linked to the Auckland community cluster and clustered closely with
three community cases in the managed isolation facility (as discussed in para 8).
20.
14 ESR Whole Genome Sequencing Report 02 September 2020, Email 0946 16 September 2020
s 9(2)(g)(i)
s 9(2)(g)(i)

IN CONFIDENCE – NOT FOR DISTRIBUTION
9
Figure 1: Number of cases that have been whole genome sequenced and are genomically clustered
with the Auckland August cluster by sub-cluster as at 14 September 202015
Source: ESR *A sample may not have been received by ESR, may not have been sequenced yet or a sequencing result could not be
obtained from the sample received.
Contact tracing16 21. Since the 11 August, 4003 community close contacts have been identified and recorded
in the National Contact Tracing Solution, 3992 of these have been contacted and are
self-isolating, and we are in the process of contacting the rest.
Table 5: Close contact tracing recorded in the National Contact Tracing Solution since 11 August as at
0830 22 September 2020
19/09/2020 20/09/2020 21/09/2020 22/09/2020
Cumulative number of close
contacts identified1 3918 3916 3989 4003
Cumulative number of close
contacts successfully contacted 3912 3912 3978 3992
Number of close contacts
referred to "finding services"2 0 0 0 0
Number of close contacts
awaiting contact 2 4 11 11
1. Contacts loaded into the National Contact Tracing Solution, and managed by either the National Investigation and Tracing
Unit or the Public Health Units. Contacts from MIQ and overseas cases are not included in this report.
2. "Finding services" refers to the mechanism the National Close Contact Service uses to find valid contact details for close
contacts we do not have the correct contact details for. These services utilise internal Ministry of Health databases along with
Police, Customs and Airlines where relevant.
15 ESR email 1608 14 September 2020
16 COVID-19 NCCS Analytics and Reporting 0921 22 September 2020
0 5 10 15 20 25 30 35
Americold
Americold HH
Auckland Bus
Botany
Church 1
Church 2
Church 3
Finance Now
Finance Now HH
Household 1
Household 2
Household 3
MREF-Bereavement
GP
NZ Courier Post
Pending
Warehouse
Number of cases
Sequenced and genomically clustered Sequence not available*
s 9(2)(a)
s 9(2)(a)
s 9(2)(a)

IN CONFIDENCE – NOT FOR DISTRIBUTION
10
3. The total number and number successfully contacted can decrease due to duplicates and invalid records being removed from
the system.
COVID-19 Tracer App usage17 Figure 2: COVID-19 Tracer App cumulative registered users and daily scans/manual entries as at 1600
21 September 2020
1. The number of scans and manual entries on any given date is subject to change for up to 31 days. This is because there can be
a delay before anonymised analytic information is received (e.g. device not connected to internet when scan carried out).
2. The number of App registrations and QR codes for any given date is subject to change for up to 1 day. This is because due to
reporting timeframes these numbers may be extracted before the 12pm cut-off for the reporting period.
17 Response Analyst – Digital Channels, 1617 21 September 2020
0
500,000
1,000,000
1,500,000
2,000,000
2,500,000
0
500,000
1,000,000
1,500,000
2,000,000
2,500,000
20/
05
23/
05
26/
05
29/
05
01/
06
04/
06
07/
06
10/
06
13/
06
16/
06
19/
06
22/
06
25/
06
28/
06
01/
07
04/
07
07/
07
10/
07
13/
07
16/
07
19/
07
22/
07
25/
07
28/
07
31/
07
03/
08
06/
08
09/
08
12/
08
15/
08
18/
08
21/
08
24/
08
27/
08
30/
08
02/
09
05/
09
08/
09
11/
09
14/
09
17/
09
20/
09
Dai
ly s
can
s an
d m
anu
al e
ntr
ies
Cu
mu
lati
ve A
pp
re
gist
rati
on
s
Day and month
Cumulative App registrations Daily scans and manual entries

IN CONFIDENCE – NOT FOR DISTRIBUTION
11
Testing18 Table 6: Testing by functional groups, as at 0900 22 September 2020
*Numbers have been sourced from different data extracts in comparison to Table 7.
Laboratory testing numbers19 Table 7: Number of laboratory tests processed nationally as at 0900 22 September 2020
Testing supply update20
22. There are good levels of testing supplies available, with 299,747 tests currently in the
labs. The Ministry of Health is continuing to work with major suppliers in order to meet
ongoing need.
18 ÉCLAIR/MoH Public Health Intelligence, 1000 22 September 2020
19 Daily Lab Report, 0921 22 September 2020
20 Testing supply email, 0939 21 September 2020
Reason for test 21 September 15–21 September
GPs and other primary health 1488 17908
CBACs and pop-ups 1044 21600
Border workers - air crew 20 261
Border workers - airport staff 85 1288
Border workers - maritime crew 26 58
Border workers – Port of Tauranga staff 0 473
Border workers – Remaining Port staff 3 180
Border workers - MIF 95 1190
Border workers - MIQ 43 313
Travellers - Staying at MIF 312 1869
Travellers - Staying at MIQ 162 190
Total 3278* 45,330*
Time period Number of laboratory tests
21 September 3278*
Last 7 days (15 Sep to 21 Sep) 45,255*
Total 917,699

IN CONFIDENCE – NOT FOR DISTRIBUTION
12
Healthline updates21 23. On 21 September there were 2,510 contacts in Healthline. Of those calls, 1,121were to
the COVID-19 Info line. Demand on 1737 Need to talk? and other mental health services
was 647 contacts (in line with forecast).
24. The main themes on 21 September were:
o Most of the general public Service Users were calling because they are symptomatic
and wanted to be tested. Increased level of people checking testing centre locations
and asking if family need to isolate with them.
o Some questions on pre-departure testing requirements.
o Questions relating to the changes to alert levels.
Logistics
Health Workforce22
25. Health Workforce continue to work with employers who have expressed a need for
assistance with identifying people who are willing to work within the health system and
to provide some relief from COVID-19 related staffing issues.
26. Upskilling of alternative workforces for testing continues to progress. Health Workforce
are currently engaged with Careerforce and DHBs to create a testing workforce training
and education package. This will be utilised by DHBs across the country, to increase the
pool of people who are able to perform COVID-19 testing. Following on from the
didactic component, will be practical training and assessment, which will continue to be
provided by the relevant DHB.
27. Health Workforce are monitoring staffing needs in MIFs facilities and are providing
support where possible.
Hospital capacity23 Table 8: Number and occupancy of hospital beds by type as at 0800 22 September 2020
Type Number of units Number (%) occupied/in use
ICU and HDU beds 422 282 (66.8%)
Ventilators 330 74 (22.4%)
Ward beds 7641 6228 (81.5%)
21 National Telehealth Service Coronavirus Update, 0940 22 September 2020
22 Health Workforce Directorate, 0945 14 September 2020
23 COVID-19 Hospital Summary, 0914 22 September 2020

13
IN CONFIDENCE – NOT FOR DISTRIBUTION
Appendix 1: Case summary Table 9: All community cases reported between 0900 21 September and 0900 22 September. Source: ESR EpiSurv Extract 0900 22 September 2020
Cumulative
Number
Date tested
positive Onset date
Case
status DHB Sex Age Ethnicity
Symptoms
[Yes/No] Hospitalised Occupation Source of transmission

14
IN CONFIDENCE – NOT FOR DISTRIBUTION
Appendix 2: COVID-19 Provisional Disease Indicators, by date
of case notification16 Table 10: NCTS data for cases in the community
Indicator (as per Table
9832) Refined Indicator description Target 13 Sept ** 14 Sept
** 15 Sept ** 16 Sept ** 17 Sept **
18 Sept **
19 Sept **
1 - (S001) Time from exposure to contact isolation / quarantine 80% within 96 hours - - - - - - -
2 – (S002) Time from case first symptom to contact isolation / quarantine 80% within 96 hours - - - - - - -
3 – (S003) Time from test sample taken to close contact isolation / quarantine 80% within 72 hours - 100% - - - - -
4 – (C001) Time from first symptom to test sample taken for positive cases 80% within 48 hours - - - - - 100% -
5 – (L001) Time from test sample taken to notification of positive result 80% within 24 hours - 0% - - - 100% 100%
6 – (P002) Time from case notification to isolation / quarantine of contact 80% within 48 hours - 100% - - - 84% -
7 – (P001) Time from notification to case interview 80% within 24 hours - 100% - - - 100% 100%
8 – (P003) Time from close contact identification to isolated / quarantined 80% within 24 hours - 100% - - - 83% 100%
10 – (P004) Proportion of contacts traced in 48 hours 80% within 48 hours - 100% - - - 84% -
C – (S005) Proportion of close contacts with confirmed or suspected COVID-19 at the time of tracing <20% - 0% - - - 7% 0%
• * The numerator and denominator are provided in some instances to provide context for low percentages.
• **Data is not available for metrics where there is no data that meets the definition, or where the time/days to reach target has not fully elapsed
• The value of P002 can drop due to the addition of new close contacts to exposure events after the 48-hour period since case notification had elapsed. This can happen for a number of reasons, including a case recalling further details following the original case
interview.
• These metrics report all cases during the specified period, including those in Managed Isolation and Quarantine, and do not include casual contacts.
• There are three additional indicators under development requiring both technical and clinical input to define data requirements. These are due to be completed by end October 2020.

IN CONFIDENCE – NOT FOR DISTRIBUTION
15
Table 11:NCTS data for cases in the community Managed Isolation and Quarantine, International, and Unknown
Indicator (as per Table 9832) Refined Indicator description Target 13 Sept ** 14 Sept 15 Sept ** 16 Sept 17 Sept ** 18 Sept ** 19 Sept **
1 - (S001) Time from exposure to contact isolation / quarantine
80% within 96 hours - 100% - 38% - - -
2 – (S002) Time from case first symptom to contact isolation / quarantine
80% within 96 hours - 100% - 38% - - -
3 – (S003) Time from test sample taken to close contact isolation / quarantine
80% within 72 hours - 100% - 100% 100% - -
4 – (C001) Time from first symptom to test sample taken for positive cases
80% within 48 hours - 33% - 50% - - -
5 – (L001) Time from test sample taken to notification of positive result
80% within 24 hours - 0% - 71% 0% 100% 50%
6 – (P002) Time from case notification to isolation / quarantine of contact
80% within 48 hours - 100% - 100% 100% - -
7 – (P001) Time from notification to case interview 80% within 24 hours - 75% - 58% 100% 100% 100%
8 – (P003) Time from close contact identification to isolated / quarantined
80% within 24 hours - 100% - 100% 100% - 100%
10 – (P004) Proportion of contacts traced in 48 hours 80% within 48 hours - 100% - 100% 100% - -
C – (S005) Proportion of close contacts with confirmed or suspected COVID-19 at the time of tracing
<20%
- 0% - 0% 0% - 0%
Note:
• * The numerator and denominator are provided in some instances to provide context for low percentages.
• **Data is not available for metrics where there is no data that meets the definition, or where the time/days to reach target has not fully elapsed
• The value of P002 can drop due to the addition of new close contacts to exposure events after the 48-hour period since case notification had elapsed. This can happen for a number of reasons, including a case recalling further details following the original case
interview.
• These metrics report all cases during the specified period, including those in Managed Isolation and Quarantine, and do not include casual contacts.
• There are three additional indicators under development requiring both technical and clinical input to define data requirements. These are due to be completed by end October 2020.

16
IN CONFIDENCE – NOT FOR DISTRIBUTION
Appendix 3: NRHCC Testing Report
Novel Coronavirus (COVID-19)
Issued: 1700 21 September
Table 12: Metro Auckland Summary Total of Testing for 18 September 2020
Community MIQ
staff
MIQ
guests
Airport Maritime port Ship’s
Crew
TOTAL
21/09/2020 1,013 118 599 112 49 0 1,891
Table 13: Estimated tests taken since 12 August 2020, based on manual site reports at 5pm
Site 12/08-
16/08
17/08-
23/08
24/08 –
30/08
31/08 – 06/09 07/09 – 13/09 14/09 –
20/09
21/09*
MIQ Staff 2132 659 1488 912 1086 908 118
Guests 2972 3767 3600 3406 3424 3843 599
Border Airport 2129 933 1349 1158 853 951 112
Port 1588 678 161 392 153 320 49
Crew 0 0 0 0 0 0 0
Table 14: Estimated tests taken at Metro Auckland CTCs, since 12 August 2020, based on manual site reports at 4pm
Site 12/08-
16/08
17/08-
23/08
24/08 –
30/08
31/08 –
06/09
07/09 –
13/09
14/09 –
20/09
21/09*
Airport Oaks 1148 515 366 265 181 152 18
Botany CTC 1151 948 905 749 681 802 99
Health New Lynn 2603 1258 1703 732 889 621 101
Mangere Town
Centre
1748 1684 1599 860 660 487 70
Otara CTC 3221 1712 1429 930 699 938 65
St Lukes 1368 1045 1414 797 666 830 158
Takanini Urgent Care 1886 1216 1153 684 440 487 65
Whanau House 2502 1371 1442 928 1613 870 129
Whanau Ora - Central 1957 964 1583 937 783 470 90

IN CONFIDENCE – NOT FOR DISTRIBUTION
17
Whanau Ora - North 1442 669 637 982 947 907 111
Whanau Ora - South 2945 1250 718 677 620 470 61
Takanini Pop Up N/A N/A N/A N/A N/A N/A 17
Waipuna Targeted
Site
143 549 376 219 251 220 28
Henderson Targeted
Site
N/A N/A N/A N/A 631 93 1
Total 26,148 16,781 21,215 13,002 10,475 8,832 1,013
N/A = not open as a CTC; Previous sites that are no longer open are not included in this report
CTCs and mobile testing site locations
Please see https://www.arphs.health.nz/public-health-topics/covid-19/where-to-get-tested for the most up-
to-date information on CTCs and mobile testing sites in the Auckland region.

IN CONFIDENCE – NOT FOR DISTRIBUTION
18
Appendix 4: Testing by DHB and ethnicity The tables that follow are the number of people tested. The numbers in the laboratory testing
section are the number of laboratory tests processed.
Table 15: Number of people tested for COVID-19 from 12 August to 21 September
Prioritised ethnicity MPAO
DHB of domicile Māori Pacific Asian Other Unknown Total
Auckland 3714 7504 10,287 21,759 447 43,711
Bay of Plenty 2799 374 636 7144 69 11,022
Canterbury 1726 688 2027 14,749 256 19,446
Capital and Coast 1613 1311 1598 10,364 243 15,129
Counties Manukau 8075 21,522 10,161 13,824 477 54,059
Hawkes Bay 1526 330 252 3893 65 6066
Hutt Valley 877 582 629 3468 50 5606
Lakes 2432 314 487 3410 102 6745
MidCentral 1150 273 430 4600 103 6556
Nelson Marlborough 657 243 310 4749 68 6027
Northland 3247 226 288 4476 56 8293
South Canterbury 151 43 88 1845 14 2141
Southern 1202 419 871 11,139 110 13,741
Tairāwhiti 938 59 70 877 23 1967
Taranaki 734 74 189 2923 53 3973
Waikato 4676 1044 1683 11,066 268 18,737
Wairarapa 252 47 52 1267 10 1628
Waitematā 5171 5667 9166 28,014 388 48,406
West Coast 49 10 13 357 6 435
Whanganui 671 83 75 1563 16 2408
Unknown 1518 752 840 4657 2246 10,013
Total 43,178 41,565 40,152 156,145 5070 286,110

19
IN CONFIDENCE – NOT FOR DISTRIBUTION
Table 16: Rate per 1000 people tested for COVID-19 from 12 August to 21 September
Prioritised ethnicity MPAO
DHB of domicile Māori Pacific Asian Other Total
Auckland 85.4 133.8 55 83.2 79.7
Bay of Plenty 46.8 84.1 32.5 45.4 45.7
Canterbury 32.9 48.5 33.4 33.1 33.9
Capital and Coast 44.2 59.1 31.8 48.7 47
Counties Manukau 90.7 179.2 67.2 66.1 94.9
Hawkes Bay 35.3 51.4 27.5 36 36.4
Hutt Valley 33.7 49.8 33.5 36.8 37.2
Lakes 63.2 122.9 50.1 56.9 60.9
MidCentral 31.6 49.2 27.7 37.2 36.2
Nelson Marlborough 41 98.3 41.8 37.7 39.7
Northland 53.4 60.1 34.8 41.1 45.6
South Canterbury 28.4 88.1 37.2 35.7 35.8
Southern 35.8 60.8 33.8 41.6 41.2
Tairāwhiti 37.9 52.8 60 39.7 40
Taranaki 31.4 53.1 30.3 32.5 32.9
Waikato 48.5 78.3 38.1 41.1 44.3
Wairarapa 31.6 56.5 41.7 35.5 35.6
Waitematā 82.6 127.1 63.7 73.3 76.4
West Coast 12.6 39.6 14.1 13.2 13.6
Whanganui 38.6 54.5 25.6 36.3 37.1
Total 55.5 130 52.4 50.4 57.7

1
IN CONFIDENCE – NOT FOR DISTRIBUTION
SITREP 061
Coronavirus disease 2019 (COVID-19)
Issued: 1030 hours 23 September 2020
Information current at: 1000 hours
This report provides a daily update on the COVID-19 health system response. New information is denoted by red text.
Please use the single point of contact email [email protected] for help/support. Your email will be
logged and promptly passed to the appropriate team.
This document is classified IN CONFIDENCE and not for further distribution.
Need to know
COMMUNITY CASES
NEW LAST 24 hrs
3
IMPORTED MIQ CASES
NEW LAST 24 hrs
0
COMMUNITY CASES
TOTAL RECOVERED
149
130
COMMUNITY CASES
ACTIVE
34 TOTAL CASES SINCE 11 AUG
186
28
TOTAL IMPORTED MIQ CASES
158
TOTAL ACTIVE CASES IN NZ (COMMUNITY & MIQ): 62
IMPORTED MIQ CASES
TOTAL RECOVERED
IMPORTED MIQ CASES
ACTIVE
LABORATORY TESTS
LAST 24 hrs
6,938
LABORATORY TESTS
LAST SEVEN DAYS
43,105
LABORATORY TESTS
TOTAL
924,637
CASES DECEASED
3

IN CONFIDENCE – NOT FOR DISTRIBUTION
2
Total COVID-19 cases
Table 1: Total number of COVID-19 cases as at 0900 23 September 20201
Case Status Active Recovered Deceased Total
Confirmed 62* (+1) 1386 (+3) 20 1468 (+4)
Probable 0 351 (+5) 5 356 (+5)
Total 62* (+1) 1737 (+8) 25 1824** (+9)
*3 newly identified cases, 2 cases classified as recovered from the August 2020 Auckland outbreak
**6 historic community cases newly reported today (1 confirmed, 5 probable) all are recovered.
Total community cases since 11 August
Table 2: Community cases by DHB and case status as at 0900 23 September 20201
New community cases since 0900 22 September 20202
1. Three new community cases have been reported, as at 0900 23 September.
o All three cases are within the same family unit. They were tested as contacts from the
charter flight from Christchurch to Auckland which had a confirmed case reported on
19 September. . All
have been in isolation since 20 September.
o There are also six newly reported historic cases. See paragraph 8 for details.
Community cases under investigation since 0900 22 September 20203
2. The case reported on 19 September is a returnee who arrived in New Zealand on 27
August and completed managed isolation in Christchurch. The case tested negative on
day 3 and day 12. They left managed isolation on 11 September and returned home to
Auckland on a charter flight from Christchurch. They were tested after developing
symptoms on 16 September. The test returned positive on 18 September. The case and
their two household contacts (both reported as confirmed cases on 19 September)
were transferred to the Auckland Jet Park quarantine facility on 18 September. The
case’s genome sequence is consistent with two confirmed cases from the same flight to
New Zealand.4 Source of infection is still under investigation.
1 EpiSurv Database, 0900 23 September 2020
2 EpiSurv Database, 0900 23 September 2020
3 EpiSurv Database, 0900 23 September 2020
4 WGS Interim Report, 0313 21 September 2020
Case
Status
Counties Manukau Waitematā Auckland Waikato Total
Confirmed 79 55 50 (+3) 1 185 (+3)
Probable 1 0 0 0 1
Total 80 55 50 (+3) 1 186 (+3)
s 9(2)(a)

IN CONFIDENCE – NOT FOR DISTRIBUTION
3
3. One of the passengers from the same chartered flight from Christchurch to Auckland as
the initially reported positive returnee returned a positive test with a high CT value on
21 September. They were retested and returned a negative result on 22 September.
This person was reported in the end of day report on 22 September and in the text
message at 0900 22 September as a confirmed case. However, the case status of this
person has been reclassified as under investigation, due to the subsequent negative
test, to determine if it is an historic case and if they were already reported as a case in
India. A precautionary approach is being taken and they have been transferred to the
Auckland Jet Park facility. The case was a close contact of the case reported on 19
September on the flight from Fiji to Christchurch on 27 August and was also a
passenger on the charter flight from Christchurch to Auckland on 11 September.
Additional investigations are underway today (23 September).
Community cases linked to the Auckland Community Cluster August 20205
4. 178 of the 186 community cases have been linked to the Auckland Community Cluster
August 2020, as at 0900 23 September 2020. The unlinked cases are summarised as
follows:
o The Rydges employee (this investigation has been closed).
o A case (reported 21 August) is still under investigation for an epidemiological link to
the community cluster. There is insufficient data to confirm a genomic link to the
community cluster (see 4).
o The third case is the case report on 19 September as detailed in paragraph 2.
o The final three are the three new cases reported today, see paragraph 1 for details.
Community cases under investigation to determine a link to the Auckland
community cluster
5. The case under investigation is summarised as follows:
o One case came through the border on 18 June. The case tested negative at day 3 and
day 12 of quarantine. The case subsequently tested positive on 21 August. Despite
using two different whole genome sequencing protocols only there is insufficient
data to confirm the case is genomically linked to the community cluster.6 Their
epidemiological link to the community cluster is still under investigation. As at 21
September no additional information has been revealed by the investigation.
Community cases and household contacts at Jet Park
6. As at 0800 23 September there are 37 people isolating in Jet Park from the community.
17 are confirmed cases, the remaining 20 are household contacts. This number will
fluctuate as people finish their isolation and depart from the facility.7
5 EpiSurv Database, 0900 23 September 2020
6 ESR WGS report 03 September 2020
7 NRHCC Morning Report, 0845 22 September 2020

IN CONFIDENCE – NOT FOR DISTRIBUTION
4
MIQ cases since 0900 22 September 20208
7. No new cases have been detected at the border, as at 0900 23 September. In total 158
cases have been detected at the border since the establishment of MIQ facilities.
Historically reported cases
8. Six cases reported today (23 September), one confirmed and five probable, are historic
cases. This means they all have old infections which have been diagnosed
retrospectively. They are not included in the total cases since 11 August, as they are
historic cases. All members had positive serology tests, and one family member has
returned a positive PCR test result. All six cases are from the same family unit and have
recovered.
9. A member of the family arrived in New Zealand from Italy in February. became
symptomatic while in New Zealand however was not tested. Subsequently, all other
family members experienced symptoms in February/early March. The family were not
tested when they were unwell, as they did not meet the case definition in place at that
time. In July, the family member from Italy completed serology in Italy which was
returned positive. Of the six cases, the one confirmed case is a member of the family
who experienced mild symptoms recently so was tested on 10
September and returned a positive result. The result had a high Ct value, which means
low levels of viral load and indicates an old infection. The case has had four tests, all
with a high Ct value, which is consistent with an old infection together with positive
serology. The other family members had a negative PCR result but positive
serology and have been classified as probable cases.
Cases in hospital
10. Three cases in hospital with COVID-19 as at 0800 23 September.9
Table 3: Number of cases in hospital with COVID-19 by DHB as at 0800 23 September 2020
Health system response
Overall approach
11. Our investigation has two main focus areas that run in parallel:
8 EpiSurv Database, 0900 22 September 2020
9 NRHCC Morning Report, 0845 22 September 2020
DHB Hospital Number in a general ward Number in ICU/HDU
Auckland Auckland City 1 0
Waitematā North Shore 1 0
Counties Manukau Middlemore 1 0
Total - 3 0
s 9(2)(a)
s 9(2)(a)
s 9(2)(a)

IN CONFIDENCE – NOT FOR DISTRIBUTION
5
o Source attribution – a focus on investigating the case with the earliest symptom
onset date to gather details actions of movements 14 days prior. This will help to
understand the possible source of the new outbreak.
o Containment – rigorous case investigation, identification of close contacts and
isolation and testing to ensure that chain of transmission is broken.
Current outbreak overview
o There have been no new cases reported in the Auckland community cluster since 14
September.
Current outbreak investigation priorities10
o Ongoing management of healthcare workers from Jet Park.
o Ongoing management of Auckland community cluster work.
o Ongoing source investigation and contact tracing linked to the case reported 19
September.
Sub-clusters and settings of interest11
12. The child of the case (paragraph 2) attended an Auckland primary school. As soon as
the developed symptoms, the whole family self-isolated and the child was kept
home from school. One of the close contacts
and attended the same school until 18 September (tested negative).12 The school is
considered low risk. Further analysis of the symptoms of the is
underway and any implications for the school will be clarified.
13. A healthcare worker at Jet Park was reported as a case on 13 September. The case has
been epidemiologically and genomically linked to the Auckland Community Cluster.
The case has been epidemiologically linked to a community case who was completing
isolation at Jet Park and required hospitalisation. A review of processes at Jet Park is
underway with a focus on lessons to be learnt from this situation.
14. members of a family in the Botany sub-cluster had serology testing on 11
September which returned negative results for all members. A case linked to the
Botany sub-cluster briefly attended school on 14 September, prior to being notified of
the positive test result that day.13 The school has been closed as a precaution while
close contact tracing and a deep clean is completed. A total of four close contacts have
been identified. All students who attended school (about 470) on 14 September are
casual contacts. Letters have been sent asking students to be tested and to remain in
self-isolation at home until they receive a negative test result. They have also been
asked to contact Healthline if they become symptomatic. Onsite testing has been
arranged from 18 September until 20 September. The school is now open.
Case investigation
10NRHCC Morning Report, 0845 22 September 2020
11 NRHCC Morning Report, 0900 16 September 2020
12 NRHCC Morning Report, 0900 20 September 2020
13 NRHCC Morning Report 17 September 2020
s 9(2)(a)
s 9(2)(a) s 9(2)(a)
s 9(2)(a)
s 9(2)(a)
s 9(2)(a)

IN CONFIDENCE – NOT FOR DISTRIBUTION
6
15. Source investigation for an epidemiological link to the main cluster for four cases who
have been genomically linked to the main cluster is ongoing:
o The
o GP
o The second Mount Albert Grammar student
o The Botany case
16. Investigation regarding the recent Christchurch flight case is ongoing. The 87
passengers of the charter flight are being contacted and assessed. The first nine rows
(who sat near the case) have been asked to self-isolate and have been tested, results in
table 4 below. Three neighbours who are close contacts, have all tested negative and
been in self-isolation.
17. One of the passengers from the same chartered flight from Christchurch to Auckland as
the initially reported positive returnee returned a positive test with a high CT value on
21 September. They were retested and returned a negative result this on 22 September.
This person was reported in the end of day report on 22 September and in the text
message at 0900 22 September as a confirmed case. However, the case status of this
person has been reclassified as under investigation, due to the subsequent negative
test, to determine if it is an historic case and if they were already reported as a case in
India. A precautionary approach is being taken and they have been transferred to the
Auckland Jet Park facility. The case was a close contact of the case reported on 19
September on the flight from Fiji to Christchurch on 27 August and was also a
passenger on the charter flight from Christchurch to Auckland on 11 September.
18. An expert panel is being established to consider cases with high CT counts to
determine their status and develop a protocol for reporting, management, and
investigation of potentially historic infections. As a consequence, historic cases under
investigation will be included in future reporting.
s 9(2)(a)
s 9(2)(a)

7
IN CONFIDENCE – NOT FOR DISTRIBUTION
1.
2.
3.
s 9(2)(a)
s 9(2)(a)

8
IN CONFIDENCE – NOT FOR DISTRIBUTION
ESR and wider testing14 19. A further 10 community cases are genomically linked with the Auckland cluster. These
cases are from the following known subclusters; Church 1 (1 cases), Church 3 (5 cases),
Americold HH (2 cases), MREF Bereavement (C-0018) (2 cases). A total of 153 cases
(86%) from the community cluster have now been sequenced, of which 134 (76%)
yielded a high quality genome.
20.
21. Ongoing analysis of the whole genome sequencing results is being used to show how
COVID-19 has been transmitted through the community cluster and to further inform
its management.
22. No direct links have been found between the community outbreak genome
sequencing, and the 65 full genomes (49 high quality) currently available from cases
detected in border arrivals in managed isolation facilities (MIFs). There has been one
case in a health worker at a managed isolation facility. WGS results indicate that this
case is genomically linked to the Auckland community cluster and clustered closely with
three community cases in the managed isolation facility (as discussed in para 8).
23.
14 ESR Whole Genome Sequencing Report 02 September 2020, Email 0946 16 September 2020
s 9(2)(g)(i)
s 9(2)(g)(i)

IN CONFIDENCE – NOT FOR DISTRIBUTION
9
Figure 1: Number of cases that have been whole genome sequenced and are genomically clustered
with the Auckland August cluster by sub-cluster as at 14 September 202015
Source: ESR *A sample may not have been received by ESR, may not have been sequenced yet or a sequencing result could not be
obtained from the sample received.
Contact tracing16 24. Since the 11 August, 4014 community close contacts have been identified and recorded
in the National Contact Tracing Solution, 4006 of these have been contacted and are
self-isolating, and we are in the process of contacting the rest.
Table 5: Close contact tracing recorded in the National Contact Tracing Solution since 11 August as at
0830 23 September 2020
20/09/2020 21/09/2020 22/09/2020 23/09/2020
Cumulative number of close
contacts identified1 3916 3989 4003 4014
Cumulative number of close
contacts successfully contacted 3912 3978 3992 4006
Number of close contacts
referred to "finding services"2 0 0 0 0
Number of close contacts
awaiting contact 4 11 11 8
1. Contacts loaded into the National Contact Tracing Solution, and managed by either the National Investigation and Tracing
Unit or the Public Health Units. Contacts from MIQ and overseas cases are not included in this report.
2. "Finding services" refers to the mechanism the National Close Contact Service uses to find valid contact details for close
contacts we do not have the correct contact details for. These services utilise internal Ministry of Health databases along with
Police, Customs and Airlines where relevant.
15 ESR email 1608 14 September 2020
16 COVID-19 NCCS Analytics and Reporting 0934 23 September 2020
0 5 10 15 20 25 30 35
Americold
Americold HH
Auckland Bus
Botany
Church 1
Church 2
Church 3
Finance Now
Finance Now HH
Household 1
Household 2
Household 3
MREF-Bereavement
GP
NZ Courier Post
Pending
Warehouse
Number of cases
Sequenced and genomically clustered Sequence not available*
s 9(2)(a)
s 9(2)(a)
s 9(2)(a)

IN CONFIDENCE – NOT FOR DISTRIBUTION
10
3. The total number and number successfully contacted can decrease due to duplicates and invalid records being removed from
the system.
COVID-19 Tracer App usage17 Figure 2: COVID-19 Tracer App cumulative registered users and daily scans/manual entries as at 1615
22 September 2020
1. The number of scans and manual entries on any given date is subject to change for up to 31 days. This is because there can be
a delay before anonymised analytic information is received (e.g. device not connected to internet when scan carried out).
2. The number of App registrations and QR codes for any given date is subject to change for up to 1 day. This is because due to
reporting timeframes these numbers may be extracted before the 12pm cut-off for the reporting period.
17 Response Analyst – Digital Channels, 1616 22 September 2020
0
500,000
1,000,000
1,500,000
2,000,000
2,500,000
0
500,000
1,000,000
1,500,000
2,000,000
2,500,000
20/
05
23/
05
26/
05
29/
05
01/
06
04/
06
07/
06
10/
06
13/
06
16/
06
19/
06
22/
06
25/
06
28/
06
01/
07
04/
07
07/
07
10/
07
13/
07
16/
07
19/
07
22/
07
25/
07
28/
07
31/
07
03/
08
06/
08
09/
08
12/
08
15/
08
18/
08
21/
08
24/
08
27/
08
30/
08
02/
09
05/
09
08/
09
11/
09
14/
09
17/
09
20/
09
Dai
ly s
can
s an
d m
anu
al e
ntr
ies
Cu
mu
lati
ve A
pp
re
gist
rati
on
s
Day and month
Cumulative App registrations Daily scans and manual entries

IN CONFIDENCE – NOT FOR DISTRIBUTION
11
Testing18 Table 6: Testing by functional groups, as at 0900 23 September 2020
*Numbers have been sourced from different data extracts in comparison to Table 7.
Laboratory testing numbers19 Table 7: Number of laboratory tests processed nationally as at 0900 23 September 2020
Testing supply update20
25. There are good levels of testing supplies available, with 299,747 tests currently in the
labs. The Ministry of Health is continuing to work with major suppliers in order to meet
ongoing need.
18 ÉCLAIR/MoH Public Health Intelligence, 1000 23 September 2020
19 Daily Lab Report, 0927 23 September 2020
20 Testing supply email, 0939 21 September 2020
Reason for test 22 September 16–22 September
GPs and other primary health 3139 17026
CBACs and pop-ups 3010 20796
Border workers - air crew 46 255
Border workers - airport staff 135 1285
Border workers - maritime crew 0 45
Border workers – Port of Tauranga staff 3 442
Border workers – Remaining Port staff 59 230
Border workers - MIF 154 1128
Border workers - MIQ 40 306
Travellers - Staying at MIF 351 1936
Travellers - Staying at MIQ 1 186
Total 6938 43635*
Time period Number of laboratory tests
22 September 6938
Last 7 days (16 Sep to 22 Sep) 43,105*
Total 924,637

IN CONFIDENCE – NOT FOR DISTRIBUTION
12
Healthline updates21 26. On 22 September there were 2,184 contacts in Healthline. Of those calls, 845 were to
the COVID-19 Info line. Demand on 1737 Need to talk? and other mental health services
was 615 contacts (lower than forecast).
27. The main themes on 21 September were:
o Most of the general public Service Users were calling because they are symptomatic
and wanted to be tested. Increased level of people checking testing centre locations.
o Some questions on pre-departure testing requirements.
o Questions relating to the changes to alert levels.
Logistics
Health Workforce22
28. Health Workforce continue to work with employers who have expressed a need for
assistance with identifying people who are willing to work within the health system and
to provide some relief from COVID-19 related staffing issues.
29. Upskilling of alternative workforces for testing continues to progress. Health Workforce
are currently engaged with Careerforce and DHBs to create a testing workforce training
and education package. This will be utilised by DHBs across the country, to increase the
pool of people who are able to perform COVID-19 testing. Following on from the
didactic component, will be practical training and assessment, which will continue to be
provided by the relevant DHB.
30. Health Workforce are monitoring staffing needs in MIFs facilities and are providing
support where possible.
Hospital capacity23 Table 8: Number and occupancy of hospital beds by type as at 0800 23 September 2020
Type Number of units Number (%) occupied/in use
ICU and HDU beds 334 228 (68.3%)
Ventilators 303 61 (20.1%)
Ward beds 7120 5888 (82.7%)
21 National Telehealth Service Coronavirus Update, 0839 23 September 2020
22 Health Workforce Directorate, 0945 14 September 2020
23 COVID-19 Hospital Summary, 0917 23 September 2020

13
IN CONFIDENCE – NOT FOR DISTRIBUTION
Appendix 1: Case summary Table 9: All new community cases reported between 0900 22 September and 0900 23 September. Source: ESR EpiSurv Extract 0900 23 September 2020
s 9(2)(a)

IN CONFIDENCE – NOT FOR DISTRIBUTION
14
Appendix 2: COVID-19 Provisional Disease Indicators, by date
of case notification16 Table 10: NCTS data for cases in the community
Indicator (as per Table
9832) Refined Indicator description Target 13 Sept ** 14 Sept
** 15 Sept ** 16 Sept ** 17 Sept **
18 Sept **
19 Sept **
1 - (S001) Time from exposure to contact isolation / quarantine 80% within 96 hours - - - - - - -
2 – (S002) Time from case first symptom to contact isolation / quarantine 80% within 96 hours - - - - - - -
3 – (S003) Time from test sample taken to close contact isolation / quarantine 80% within 72 hours - 100% - - - - -
4 – (C001) Time from first symptom to test sample taken for positive cases 80% within 48 hours - - - - - 100% -
5 – (L001) Time from test sample taken to notification of positive result 80% within 24 hours - 0% - - - 100% 100%
6 – (P002) Time from case notification to isolation / quarantine of contact 80% within 48 hours - 100% - - - 84% -
7 – (P001) Time from notification to case interview 80% within 24 hours - 100% - - - 100% 100%
8 – (P003) Time from close contact identification to isolated / quarantined 80% within 24 hours - 100% - - - 83% 100%
10 – (P004) Proportion of contacts traced in 48 hours 80% within 48 hours - 100% - - - 84% -
C – (S005) Proportion of close contacts with confirmed or suspected COVID-19 at the time of tracing <20% - 0% - - - 7% 0%
• * The numerator and denominator are provided in some instances to provide context for low percentages.
• **Data is not available for metrics where there is no data that meets the definition, or where the time/days to reach target has not fully elapsed
• The value of P002 can drop due to the addition of new close contacts to exposure events after the 48-hour period since case notification had elapsed. This can happen for a number of reasons, including a case recalling further details following the original case
interview.
• These metrics report all cases during the specified period, including those in Managed Isolation and Quarantine, and do not include casual contacts.
• There are three additional indicators under development requiring both technical and clinical input to define data requirements. These are due to be completed by end October 2020.

IN CONFIDENCE – NOT FOR DISTRIBUTION
15
Table 11:NCTS data for cases in the community Managed Isolation and Quarantine, International, and Unknown
Indicator (as per Table 9832) Refined Indicator description Target 13 Sept ** 14 Sept 15 Sept ** 16 Sept 17 Sept ** 18 Sept ** 19 Sept **
1 - (S001) Time from exposure to contact isolation / quarantine
80% within 96 hours - 100% - 38% - - -
2 – (S002) Time from case first symptom to contact isolation / quarantine
80% within 96 hours - 100% - 38% - - -
3 – (S003) Time from test sample taken to close contact isolation / quarantine
80% within 72 hours - 100% - 100% 100% - -
4 – (C001) Time from first symptom to test sample taken for positive cases
80% within 48 hours - 33% - 50% - - -
5 – (L001) Time from test sample taken to notification of positive result
80% within 24 hours - 0% - 71% 0% 100% 50%
6 – (P002) Time from case notification to isolation / quarantine of contact
80% within 48 hours - 100% - 100% 100% - -
7 – (P001) Time from notification to case interview 80% within 24 hours - 75% - 58% 100% 100% 100%
8 – (P003) Time from close contact identification to isolated / quarantined
80% within 24 hours - 100% - 100% 100% - 100%
10 – (P004) Proportion of contacts traced in 48 hours 80% within 48 hours - 100% - 100% 100% - -
C – (S005) Proportion of close contacts with confirmed or suspected COVID-19 at the time of tracing
<20%
- 0% - 0% 0% - 0%
Note:
• * The numerator and denominator are provided in some instances to provide context for low percentages.
• **Data is not available for metrics where there is no data that meets the definition, or where the time/days to reach target has not fully elapsed
• The value of P002 can drop due to the addition of new close contacts to exposure events after the 48-hour period since case notification had elapsed. This can happen for a number of reasons, including a case recalling further details following the original case
interview.
• These metrics report all cases during the specified period, including those in Managed Isolation and Quarantine, and do not include casual contacts.
• There are three additional indicators under development requiring both technical and clinical input to define data requirements. These are due to be completed by end October 2020.

16
IN CONFIDENCE – NOT FOR DISTRIBUTION
Appendix 3: NRHCC Testing Report
Novel Coronavirus (COVID-19)
Issued: 1700 22 September
Table 12: Metro Auckland Summary Total of Testing for 22 September 2020
Community MIQ
staff
MIQ
guests
Airport Maritime port Ship’s
Crew
TOTAL
22/09/2020 881 246 600 121 13 0 1861
Table 13: Estimated tests taken since 12 August 2020, based on manual site reports at 5pm
Site 12/08-
16/08
17/08-
23/08
24/08 –
30/08
31/08 –
06/09
07/09 –
13/09
14/09 –
20/09
21/09 22/09*
MIQ Staff 2132 659 1488 912 1086 908 118 246
Guests 2972 3767 3600 3406 3424 3843 599 600
Border Airport 2129 933 1349 1158 853 951 112 121
Port 1588 678 161 392 153 320 49 13 (PM
Start)
Crew 0 0 0 0 0 0 0 0
*22/09 day still in progress
Table 14: Estimated tests taken at Metro Auckland CTCs, since 12 August 2020, based on manual site reports at 4pm
Site 12/08-
16/08
17/08-
23/08
24/08 –
30/08
31/08 –
06/09
07/09 –
13/09
14/09 –
20/09
21/09 22/09*
Airport Oaks 1148 515 366 265 181 152 18 25
Botany CTC 1151 948 905 749 681 802 99 95
Health New Lynn 2603 1258 1703 732 889 621 102 66
Mangere Town
Centre
1748 1684 1599 860 660 487 70
45
Otara CTC 3221 1712 1429 930 699 938 65 57
St Lukes 1368 1045 1414 797 666 830 158 101
Takanini Urgent
Care
1886 1216 1153 684 440 487 65
61

IN CONFIDENCE – NOT FOR DISTRIBUTION
17
Whanau House 2502 1371 1442 928 1613 870 129 126
Whanau Ora -
Central
1957 964 1583 937 783 470 75
62
Whanau Ora -
North
1442 669 637 982 947 907 113
116
Whanau Ora -
South
2945 1250 718 677 620 470 66
54
Takanini Pop Up N/A N/A N/A N/A N/A N/A 17 25
Mangere Pop Up N/A N/A N/A N/A N/A N/A N/A 12
Waipuna Targeted
Site
143 549 376 219 251 220 28
34
Henderson
Targeted Site
N/A N/A N/A N/A 631 93 1
2
Total 26,148 16,781 21,215 13,002 10,475 8,832 1,020 881
*22/09 day still in progress; N/A = not open as a CTC; Previous sites that are no longer open are not included
in this report
CTCs and mobile testing site locations
Please see https://www.arphs.health.nz/public-health-topics/covid-19/where-to-get-tested for the most up-
to-date information on CTCs and mobile testing sites in the Auckland region.

IN CONFIDENCE – NOT FOR DISTRIBUTION
18
Appendix 4: Testing by DHB and ethnicity The tables that follow are the number of people tested. The numbers in the laboratory testing
section are the number of laboratory tests processed.
Table 15: Number of people tested for COVID-19 from 12 August to 22 September
Prioritised ethnicity MPAO
DHB of domicile Māori Pacific Asian Other Unknown Total
Auckland 3755 7567 10,434 22,100 453 44,309
Bay of Plenty 2833 377 646 7233 69 11,158
Canterbury 1751 697 2042 14,919 261 19,670
Capital and Coast 1637 1359 1624 10,555 249 15,424
Counties Manukau 8181 21,745 10,307 14,046 487 54,766
Hawkes Bay 1545 335 257 3942 68 6147
Hutt Valley 893 595 651 3545 51 5735
Lakes 2461 316 490 3461 105 6833
MidCentral 1168 277 439 4652 104 6640
Nelson Marlborough 664 249 315 4831 68 6127
Northland 3276 227 299 4536 60 8398
South Canterbury 152 46 90 1863 16 2167
Southern 1224 422 882 11,314 110 13,952
Tairāwhiti 950 61 70 886 23 1990
Taranaki 745 75 191 2977 65 4053
Waikato 4734 1052 1722 11,219 275 19,002
Wairarapa 257 47 52 1294 12 1662
Waitematā 5242 5722 9304 28,421 390 49,079
West Coast 49 10 13 358 8 438
Whanganui 673 83 76 1576 16 2424
Unknown 1539 760 839 4740 2363 10,241
Total 43,729 42,022 40,743 158,469 5253 290,216

19
IN CONFIDENCE – NOT FOR DISTRIBUTION
Table 16: Rate per 1000 people tested for COVID-19 from 12 August to 22 September
Prioritised ethnicity MPAO
DHB of domicile Māori Pacific Asian Other Total
Auckland 86.3 134.9 55.7 84.5 80.8
Bay of Plenty 47.4 84.8 33 46 46.3
Canterbury 33.4 49.1 33.6 33.4 34.3
Capital and Coast 44.8 61.3 32.4 49.6 48
Counties Manukau 91.9 181.1 68.2 67.1 96.2
Hawkes Bay 35.7 52.2 28 36.5 36.8
Hutt Valley 34.3 50.9 34.7 37.6 38
Lakes 64 123.7 50.4 57.7 61.7
MidCentral 32.1 49.9 28.3 37.6 36.6
Nelson Marlborough 41.4 100.8 42.4 38.4 40.4
Northland 53.8 60.4 36.2 41.6 46.2
South Canterbury 28.6 94.2 38 36.1 36.2
Southern 36.5 61.3 34.2 42.3 41.8
Tairāwhiti 38.3 54.6 60 40.1 40.5
Taranaki 31.9 53.9 30.7 33.1 33.5
Waikato 49.1 78.9 39 41.7 44.9
Wairarapa 32.2 56.5 41.7 36.3 36.3
Waitematā 83.8 128.3 64.7 74.3 77.5
West Coast 12.6 39.6 14.1 13.3 13.7
Whanganui 38.8 54.5 26 36.6 37.4
Total 56.2 131.4 53.2 51.2 58.5

1
IN CONFIDENCE – NOT FOR DISTRIBUTION
SITREP 062
Coronavirus disease 2019 (COVID-19)
Issued: 1030 hours 24 September 2020
Information current at: 1000 hours
This report provides a daily update on the COVID-19 health system response. New information is denoted by red text.
Please use the single point of contact email [email protected] for help/support. Your email will be
logged and promptly passed to the appropriate team.
This document is classified IN CONFIDENCE and not for further distribution.
Need to know
COMMUNITY CASES
NEW LAST 24 hrs
0
IMPORTED MIQ CASES
NEW LAST 24 hrs
3
COMMUNITY CASES
TOTAL RECOVERED
149
130
COMMUNITY CASES
ACTIVE
34 TOTAL CASES SINCE 11 AUG
186
31 TOTAL IMPORTED MIQ CASES
160*
TOTAL ACTIVE CASES IN NZ (COMMUNITY & MIQ): 65
IMPORTED MIQ CASES
TOTAL RECOVERED
IMPORTED MIQ CASES
ACTIVE
LABORATORY TESTS
LAST 24 hrs
6,142
LABORATORY TESTS
LAST SEVEN DAYS
41,062
LABORATORY TESTS
TOTAL
930,779
CASES DECEASED
3
*This number has been reviewed and revised to 160, by ESR.

IN CONFIDENCE – NOT FOR DISTRIBUTION
2
Total COVID-19 cases
Table 1: Total number of COVID-19 cases as at 0900 24 September 20201
Case Status Active Recovered Deceased Total
Confirmed 65* (+3) 1386 20 1471 (+3)
Probable 0 351 5 356
Total 65* (+3) 1737 25 1827 (+3)
*3 newly identified cases, 0 cases classified as recovered.
Total community cases since 11 August
Table 2: Community cases by DHB and case status as at 0900 24 September 20201
New Cases in New Zealand since 0900 23 September 2020, as at 0900 24 September2
Imported in MIQ facilities
1. Three new cases have been detected at the border. In total 160 cases have been
detected at the border since the establishment of MIQ facilities.
o One case arrived on 18 September. Tested positive on day 3 in Auckland MIQ facility.
o One case arrived on 16 September. Tested positive as a contact of a confirmed case
in Auckland MIQ facility.
o One case arrived on 18 September. Tested positive on day 3 in Rotorua MIQ facility.
Historical
2. No new historical cases have been reported.
Community cases
3. No new community cases have been reported.
1 EpiSurv Database, 0900 24 September 2020
2 EpiSurv Database, 0900 24 September 2020
Case
Status
Counties Manukau Waitematā Auckland Waikato Total
Confirmed 79 55 50 1 185
Probable 1 0 0 0 1
Total 80 55 50 1 186

IN CONFIDENCE – NOT FOR DISTRIBUTION
3
Total community cases by DHB since 11 August
Table 3: Community cases by DHB and case status as at 0900 24 September 20203
Total community cases by outbreak since 11 August4
Table 4: Community cases by Outbreak as at 0900 24 September 2020
Community cases and household contacts at Jet Park
4. As at 0800 24 September there are 32 people isolating in Jet Park from the community.
15 are confirmed cases, the remaining 17 are household contacts. This number will
fluctuate as people finish their isolation and depart from the facility.5
Cases in hospital
5. Three cases in hospital with COVID-19 as at 0800 24 September.6
Table 5: Number of cases in hospital with COVID-19 by DHB as at 0800 24 September 2020
3 EpiSurv Database, 0900 24 September 2020
4 EpiSurv Database, 0900 24 September 2020
5 NRHCC Morning Report, 0845 22 September 2020
6 NRHCC Morning Report, 0845 22 September 2020
Case
Status
Counties Manukau Waitematā Auckland Waikato Total
Confirmed 79 55 50 1 185
Probable 1 0 0 0 1
Total 80 55 50 1 186
Outbreak New Cases (last 24 hrs) Total Cases
Auckland August 0 178
Christchurch Returnees 0 6
Rydges Hotel (MIF) 0 1
Under Investigation 0 1
Total 0 186
DHB Hospital Number in a general ward Number in ICU/HDU
Auckland Auckland City 1 0
Waitematā North Shore 1 0
Counties Manukau Middlemore 1 0
Total - 3 0
s 9(2)(a)

IN CONFIDENCE – NOT FOR DISTRIBUTION
4
Health system response
Overall approach
6. Our investigation has two main focus areas that run in parallel:
o Source attribution – a focus on investigating the case with the earliest symptom
onset date to gather details actions of movements 14 days prior. This will help to
understand the possible source of the new outbreak.
o Containment – rigorous case investigation, identification of close contacts and
isolation and testing to ensure that chain of transmission is broken.
o Case classification – An expert panel has been established to consider cases with
high CT counts to determine their status and develop a protocol for reporting,
management, and investigation of potentially historic infections.
Current outbreak investigation priorities7
o Ongoing management of healthcare worker from Jet Park.
o Ongoing management of Auckland August outbreak.
o Ongoing source investigation and contact tracing of Christchurch Returnees outbreak.
Settings of interest8
7. Christchurch to Auckland Charter flight and related Christchurch MIF cases.
8. Settings of interest for the Christchurch Returnees outbreak include
o A supermarket and two retail stores in Auckland.
o Several locations outside of Auckland, which have been identified and are being
followed up by the relevant PHUs.
Case investigation Christchurch Returnee Outbreak
9. A case reported on 19 September is a returnee who arrived in New Zealand on 27
August and completed managed isolation in Christchurch. The case tested negative on
day 3 and day 12. They left managed isolation on 11 September and returned home to
Auckland on a charter flight from Christchurch. They were tested after developing
symptoms on 16 September. The test returned positive on 18 September. The case and
their two household contacts (both reported as confirmed cases on 19 September)
were transferred to the Auckland Jet Park quarantine facility on 18 September. The
case’s genome sequence is consistent with two confirmed cases from the same flight to
New Zealand.9 Source of infection is still under investigation.
7NRHCC Morning Report, 0845 24 September 2020
8 NRHCC Morning Report, 0845 24 September 2020
9 WGS Interim Report, 0313 21 September 2020

IN CONFIDENCE – NOT FOR DISTRIBUTION
5
10. Another passenger from the same chartered flight returned a positive test with a high
CT value on 21 September. They were retested and returned a negative result on 22
September. They are classified as under investigation until it is determined if it is an
historic case and if they were already reported as a case in India.
11. Three cases from the same family unit tested positive on 22 September. Two cases were
tested because they were passengers on the chartered flight
and the third case is a household contact
. The family has
been in isolation since 20 September. Contact tracing has been underway for this family
since 20 September. The family visited Tāupo from 18 to 20 September and met
parties from across the country. They also had dinner with a family
outside of the Tāupo trip.
12. 31 contacts have been identified in total to date, and all have been tested. As at 1000,
25 contacts are isolating. Relevant PHUs have been notified. All parties who were
contacts of these cases have been contacted. Contact tracing and testing is underway
for these families.
Case investigation Auckland Community Cluster
13. Source investigation for an epidemiological link to the main cluster for four cases who
have been genomically linked to the main cluster is ongoing:
o The
o GP
o The second Mount Albert Grammar student
o The Botany case
s 9(2)(a)
s 9(2)(a)
s 9(2)(a)
s 9(2)(a)
s 9(2)(a)
s 9(2)(a)
s 9(2)(a)

6
IN CONFIDENCE – NOT FOR DISTRIBUTION
1.
2.
s 9(2)(a)
s 9(2)(a)

7
IN CONFIDENCE – NOT FOR DISTRIBUTION
ESR and wider testing10 14. A further 10 community cases are genomically linked with the Auckland cluster. These
cases are from the following known subclusters; Church 1 (1 cases), Church 3 (5 cases),
Americold HH (2 cases), MREF Bereavement (C-0018) (2 cases). A total of 153 cases
(86%) from the community cluster have now been sequenced, of which 134 (76%)
yielded a high quality genome.
15.
16. Ongoing analysis of the whole genome sequencing results is being used to show how
COVID-19 has been transmitted through the community cluster and to further inform
its management.
17. No direct links have been found between the community outbreak genome
sequencing, and the 65 full genomes (49 high quality) currently available from cases
detected in border arrivals in managed isolation facilities (MIFs). There has been one
case in a health worker at a managed isolation facility. WGS results indicate that this
case is genomically linked to the Auckland community cluster and clustered closely with
three community cases in the managed isolation facility (as discussed in para 8).
18.
10 ESR Whole Genome Sequencing Report 02 September 2020, Email 0946 16 September 2020
s 9(2)(g)(i)
s 9(2)(g)(i)

IN CONFIDENCE – NOT FOR DISTRIBUTION
8
Figure 1: Number of cases that have been whole genome sequenced and are genomically clustered
with the Auckland August cluster by sub-cluster as at 14 September 202011
Source: ESR *A sample may not have been received by ESR, may not have been sequenced yet or a sequencing result could not be
obtained from the sample received.
Contact tracing12 19. Since the 11 August, 4044 community close contacts have been identified and recorded
in the National Contact Tracing Solution, 4025 of these have been contacted and are
self-isolating, and we are in the process of contacting the rest.
Table 7: Close contact tracing recorded in the National Contact Tracing Solution since 11 August as at
0830 24 September 2020
21/09/2020 22/09/2020 23/09/2020 24/09/2020
Cumulative number of close
contacts identified1 3989 4003 4014 4044
Cumulative number of close
contacts successfully contacted 3978 3992 4006 4025
Number of close contacts
referred to "finding services"2 0 0 0 0
Number of close contacts
awaiting contact 11 11 8 19
1. Contacts loaded into the National Contact Tracing Solution, and managed by either the National Investigation and Tracing
Unit or the Public Health Units. Contacts from MIQ and overseas cases are not included in this report.
2. "Finding services" refers to the mechanism the National Close Contact Service uses to find valid contact details for close
contacts we do not have the correct contact details for. These services utilise internal Ministry of Health databases along with
Police, Customs and Airlines where relevant.
11 ESR email 1608 14 September 2020
12 COVID-19 NCCS Analytics and Reporting 0857 24 September 2020
0 5 10 15 20 25 30 35
Americold
Americold HH
Auckland Bus
Botany
Church 1
Church 2
Church 3
Finance Now
Finance Now HH
Household 1
Household 2
Household 3
MREF-Bereavement
GP
NZ Courier Post
Pending
Warehouse
Number of cases
Sequenced and genomically clustered Sequence not available*
s 9(2)(a)
s 9(2)(a)
s 9(2)(a)

IN CONFIDENCE – NOT FOR DISTRIBUTION
9
3. The total number and number successfully contacted can decrease due to duplicates and invalid records being removed from
the system.
COVID-19 Tracer App usage13 Figure 2: COVID-19 Tracer App cumulative registered users and daily scans/manual entries as at 1615
23 September 2020
1. The number of scans and manual entries on any given date is subject to change for up to 31 days. This is because there can be
a delay before anonymised analytic information is received (e.g. device not connected to internet when scan carried out).
2. The number of App registrations and QR codes for any given date is subject to change for up to 1 day. This is because due to
reporting timeframes these numbers may be extracted before the 12pm cut-off for the reporting period.
13 Response Analyst – Digital Channels, 1625 23 September 2020
0
500,000
1,000,000
1,500,000
2,000,000
2,500,000
0
500,000
1,000,000
1,500,000
2,000,000
2,500,000
20/
05
23/
05
26/
05
29/
05
01/
06
04/
06
07/
06
10/
06
13/
06
16/
06
19/
06
22/
06
25/
06
28/
06
01/
07
04/
07
07/
07
10/
07
13/
07
16/
07
19/
07
22/
07
25/
07
28/
07
31/
07
03/
08
06/
08
09/
08
12/
08
15/
08
18/
08
21/
08
24/
08
27/
08
30/
08
02/
09
05/
09
08/
09
11/
09
14/
09
17/
09
20/
09
23/
09
Dai
ly s
can
s an
d m
anu
al e
ntr
ies
Cu
mu
lati
ve A
pp
re
gist
rati
on
s
Day and month
Cumulative App registrations Daily scans and manual entries

IN CONFIDENCE – NOT FOR DISTRIBUTION
10
Testing14 Table 8: Testing by functional groups, as at 0900 24 September 2020
*Numbers have been sourced from different data extracts in comparison to Table 7.
Laboratory testing numbers15 Table 9: Number of laboratory tests processed nationally as at 0900 24 September 2020
Testing supply update16
20. There are good levels of testing supplies available, with 299,747 tests currently in the
labs. The Ministry of Health is continuing to work with major suppliers in order to meet
ongoing need.
14 ÉCLAIR/MoH Public Health Intelligence, 1000 24 September 2020
15 Daily Lab Report, 0905 24 September 2020
16 Testing supply email, 0939 21 September 2020
Reason for test 23 September 17–23 September
GPs and other primary health 2543 15802
CBACs and pop-ups 2555 19515
Border workers - air crew 41 248
Border workers - airport staff 215 1295
Border workers - maritime crew 0 43
Border workers – Port of Tauranga staff 0 354
Border workers – Remaining Port staff 26 223
Border workers - MIF 233 1192
Border workers - MIQ 39 344
Travellers - Staying at MIF 490 2013
Travellers - Staying at MIQ 0 177
Total 6142 41206*
Time period Number of laboratory tests
23 September 6142
Last 7 days (17 Sep to 23 Sep) 41,062*
Total 930,779

IN CONFIDENCE – NOT FOR DISTRIBUTION
11
Healthline updates17 21. On 23 September there were 2,236 contacts in Healthline. Of those calls, 1068 were to
the COVID-19 Info line. Demand on 1737 Need to talk? and other mental health services
was 696 contacts (higher than forecast).
22. The main themes on 22 September were:
o Most of the general public Service Users were calling because they are symptomatic
and wanted to be tested. Increased level of people checking testing centre locations.
o Some questions on pre-departure testing requirements.
o Questions relating to the changes to alert levels.
Logistics
Health Workforce18
23. Health Workforce continue to work with employers who have expressed a need for
assistance with identifying people who are willing to work within the health system and
to provide some relief from COVID-19 related staffing issues.
24. Upskilling of alternative workforces for testing continues to progress. Health Workforce
are currently engaged with Careerforce and DHBs to create a testing workforce training
and education package. This will be utilised by DHBs across the country, to increase the
pool of people who are able to perform COVID-19 testing. Following on from the
didactic component, will be practical training and assessment, which will continue to be
provided by the relevant DHB.
25. Health Workforce are monitoring staffing needs in MIFs facilities and are providing
support where possible.
Hospital capacity19 Table 10: Number and occupancy of hospital beds by type as at 0800 24 September 2020
Type Number of units Number (%) occupied/in use
ICU and HDU beds 325 217 (66.8%)
Ventilators 296 60 (20.3%)
Ward beds 6822 5553 (81.4%)
17 National Telehealth Service Coronavirus Update, 0918 24 September 2020
18 Health Workforce Directorate, 0945 14 September 2020
19 COVID-19 Hospital Summary, 0905 24 September 2020

12
IN CONFIDENCE – NOT FOR DISTRIBUTION
Appendix 1: Case summary Table 11: All new community cases reported between 0900 23 September and 0900 24 September. Source: ESR EpiSurv Extract 0900 24 September 2020
Cumulative
Number
Date tested
positive Onset date Case status DHB Sex Age Ethnicity
Symptoms
[Yes/No] Hospitalised Occupation Source of transmission

IN CONFIDENCE – NOT FOR DISTRIBUTION
13
Appendix 2: COVID-19 Provisional Disease Indicators, by date
of case notification12 Table 12: NCTS data for cases in the community - Please note, National Investigation and Tracing Centre are working through data quality issues, so
will not be reporting the metrics this morning.
Indicator (as per Table
9832) Refined Indicator description Target 13 Sept ** 14 Sept
** 15 Sept ** 16 Sept ** 17 Sept **
18 Sept **
19 Sept **
1 - (S001) Time from exposure to contact isolation / quarantine 80% within 96 hours - - - - - - -
2 – (S002) Time from case first symptom to contact isolation / quarantine 80% within 96 hours - - - - - - -
3 – (S003) Time from test sample taken to close contact isolation / quarantine 80% within 72 hours - 100% - - - - -
4 – (C001) Time from first symptom to test sample taken for positive cases 80% within 48 hours - - - - - 100% -
5 – (L001) Time from test sample taken to notification of positive result 80% within 24 hours - 0% - - - 100% 100%
6 – (P002) Time from case notification to isolation / quarantine of contact 80% within 48 hours - 100% - - - 84% -
7 – (P001) Time from notification to case interview 80% within 24 hours - 100% - - - 100% 100%
8 – (P003) Time from close contact identification to isolated / quarantined 80% within 24 hours - 100% - - - 83% 100%
10 – (P004) Proportion of contacts traced in 48 hours 80% within 48 hours - 100% - - - 84% -
C – (S005) Proportion of close contacts with confirmed or suspected COVID-19 at the time of tracing <20% - 0% - - - 7% 0%
• * The numerator and denominator are provided in some instances to provide context for low percentages.
• **Data is not available for metrics where there is no data that meets the definition, or where the time/days to reach target has not fully elapsed
• The value of P002 can drop due to the addition of new close contacts to exposure events after the 48-hour period since case notification had elapsed. This can happen for a number of reasons, including a case recalling further details following the original case
interview.
• These metrics report all cases during the specified period, including those in Managed Isolation and Quarantine, and do not include casual contacts.
• There are three additional indicators under development requiring both technical and clinical input to define data requirements. These are due to be completed by end October 2020.

IN CONFIDENCE – NOT FOR DISTRIBUTION
14
Table 13:NCTS data for cases in the community Managed Isolation and Quarantine, International, and Unknown
Indicator (as per Table 9832) Refined Indicator description Target 13 Sept ** 14 Sept 15 Sept ** 16 Sept 17 Sept ** 18 Sept ** 19 Sept **
1 - (S001) Time from exposure to contact isolation / quarantine
80% within 96 hours - 100% - 38% - - -
2 – (S002) Time from case first symptom to contact isolation / quarantine
80% within 96 hours - 100% - 38% - - -
3 – (S003) Time from test sample taken to close contact isolation / quarantine
80% within 72 hours - 100% - 100% 100% - -
4 – (C001) Time from first symptom to test sample taken for positive cases
80% within 48 hours - 33% - 50% - - -
5 – (L001) Time from test sample taken to notification of positive result
80% within 24 hours - 0% - 71% 0% 100% 50%
6 – (P002) Time from case notification to isolation / quarantine of contact
80% within 48 hours - 100% - 100% 100% - -
7 – (P001) Time from notification to case interview 80% within 24 hours - 75% - 58% 100% 100% 100%
8 – (P003) Time from close contact identification to isolated / quarantined
80% within 24 hours - 100% - 100% 100% - 100%
10 – (P004) Proportion of contacts traced in 48 hours 80% within 48 hours - 100% - 100% 100% - -
C – (S005) Proportion of close contacts with confirmed or suspected COVID-19 at the time of tracing
<20%
- 0% - 0% 0% - 0%
Note:
• * The numerator and denominator are provided in some instances to provide context for low percentages.
• **Data is not available for metrics where there is no data that meets the definition, or where the time/days to reach target has not fully elapsed
• The value of P002 can drop due to the addition of new close contacts to exposure events after the 48-hour period since case notification had elapsed. This can happen for a number of reasons, including a case recalling further details following the original case
interview.
• These metrics report all cases during the specified period, including those in Managed Isolation and Quarantine, and do not include casual contacts.
• There are three additional indicators under development requiring both technical and clinical input to define data requirements. These are due to be completed by end October 2020.

15
IN CONFIDENCE – NOT FOR DISTRIBUTION
Appendix 3: NRHCC Testing Report
Novel Coronavirus (COVID-19)
Issued: 1700 23 September
Table 14: Metro Auckland Summary Total of Testing for 22 September 2020
Community MIQ
staff
MIQ
guests
Airport Maritime port Ship’s
Crew
TOTAL
23/09/2020 780 187 543 173 34 0 1717
Table 15: Estimated tests taken since 12 August 2020, based on manual site reports at 5pm
Site 12/08-
16/08
17/08-
23/08
24/08 –
30/08
31/08 –
06/09
07/09 –
13/09
14/09 –
20/09
21/09 22/09 23/09*
MIQ Staff 2132 659 1488 912 1086 908 118 246 187
Guests 2972 3767 3600 3406 3424 3843 599 600 543
Border Airport 2129 933 1349 1158 853 951 112 121 173
Port 1588 678 161 392 153 320 49 16 34
Crew 0 0 0 0 0 0 0 0 0
*23/09 day still in progress
Table 16: Estimated tests taken at Metro Auckland CTCs, since 12 August 2020, based on manual site reports at 4pm
Site 12/08-
16/08
17/08-
23/08
24/08 –
30/08
31/08 –
06/09
07/09 –
13/09
14/09
–
20/09
21/09 22/09 23/09*
Airport Oaks 1148 515 366 265 181 152 18 25 23
Botany CTC 1151 948 905 749 681 802 99 93 74
Health New Lynn 2603 1258 1703 732 889 621 102 66 65
Mangere Town
Centre
1748 1684 1599 860 660 487 70
45 55
Otara CTC 3221 1712 1429 930 699 938 65 61 61
St Lukes 1368 1045 1414 797 666 830 158 101 104
Takanini Urgent
Care
1886 1216 1153 684 440 487 65
61 40
Whanau House 2502 1371 1442 928 1613 870 129 126 88

IN CONFIDENCE – NOT FOR DISTRIBUTION
16
Whanau Ora -
Central
1957 964 1583 937 783 470 75
64 58
Whanau Ora -
North
1442 669 637 982 947 907 113
119 96
Whanau Ora -
South
2945 1250 718 677 620 470 66
62 26
Takanini Pop Up N/A N/A N/A N/A N/A N/A 17 25 22
Mangere Pop Up N/A N/A N/A N/A N/A N/A N/A 12 17
Glen Eden Pop Up N/A N/A N/A N/A N/A N/A N/A N/A 20
Waipuna
Targeted Site
143 549 376 219 251 220 28
34 29
Henderson
Targeted Site
N/A N/A N/A N/A 631 93 1
2 2
Total 26,148 16,781 21,215 13,002 10,475 8,832 1,020 896 780
*23/09 day still in progress; N/A = not open as a CTC; Previous sites that are no longer open are not included
in this report
CTCs and mobile testing site locations
Please see https://www.arphs.health.nz/public-health-topics/covid-19/where-to-get-tested for the most up-
to-date information on CTCs and mobile testing sites in the Auckland region.

IN CONFIDENCE – NOT FOR DISTRIBUTION
17
Appendix 4: Testing by DHB and ethnicity The tables that follow are the number of people tested. The numbers in the laboratory testing
section are the number of laboratory tests processed.
Table 17: Number of people tested for COVID-19 from 12 August to 23 September
Prioritised ethnicity MPAO
DHB of domicile Māori Pacific Asian Other Unknown Total
Auckland 3777 7595 10,504 22,286 462 44,624
Bay of Plenty 2873 380 657 7340 72 11,322
Canterbury 1779 713 2081 15,212 268 20,053
Capital and Coast 1663 1399 1665 10,772 254 15,753
Counties Manukau 8255 21,856 10,392 14,165 486 55,154
Hawkes Bay 1557 339 258 3976 67 6197
Hutt Valley 911 604 657 3606 52 5830
Lakes 2483 316 497 3507 110 6913
MidCentral 1182 285 444 4699 105 6715
Nelson Marlborough 670 258 317 4900 72 6217
Northland 3315 229 304 4584 59 8491
South Canterbury 158 46 93 1895 16 2208
Southern 1241 429 895 11,442 110 14,117
Tairāwhiti 964 61 70 896 23 2014
Taranaki 751 75 197 3018 67 4108
Waikato 4784 1061 1750 11,338 285 19,218
Wairarapa 263 48 52 1320 11 1694
Waitematā 5272 5764 9360 28,625 403 49,424
West Coast 50 10 13 372 8 453
Whanganui 683 85 77 1590 18 2453
Unknown 1566 774 866 4897 2570 10673
Total 44,197 42,327 41,149 160,441 5518 293,632

18
IN CONFIDENCE – NOT FOR DISTRIBUTION
Table 18: Rate per 1000 people tested for COVID-19 from 12 August to 23 September
Prioritised ethnicity MPAO
DHB of domicile Māori Pacific Asian Other Total
Auckland 86.8 135.4 56.1 85.3 81.4
Bay of Plenty 48 85.5 33.5 46.7 46.9
Canterbury 33.9 50.3 34.2 34.1 35
Capital and Coast 45.5 63.1 33.2 50.6 49
Counties Manukau 92.7 182 68.8 67.7 96.8
Hawkes Bay 36 52.8 28.2 36.8 37.1
Hutt Valley 35 51.7 35 38.3 38.7
Lakes 64.5 123.7 51.1 58.5 62.4
MidCentral 32.5 51.4 28.6 38 37.1
Nelson Marlborough 41.8 104.4 42.7 38.9 41
Northland 54.5 60.9 36.8 42.1 46.7
South Canterbury 29.8 94.2 39.3 36.7 36.9
Southern 37 62.3 34.7 42.8 42.3
Tairāwhiti 38.9 54.6 60 40.5 41
Taranaki 32.2 53.9 31.6 33.6 34
Waikato 49.6 79.6 39.7 42.1 45.4
Wairarapa 33 57.7 41.7 37 37
Waitematā 84.2 129.3 65.1 74.9 78
West Coast 12.9 39.6 14.1 13.8 14.1
Whanganui 39.3 55.9 26.3 36.9 37.8
Total 56.8 132.3 53.7 51.8 59.2
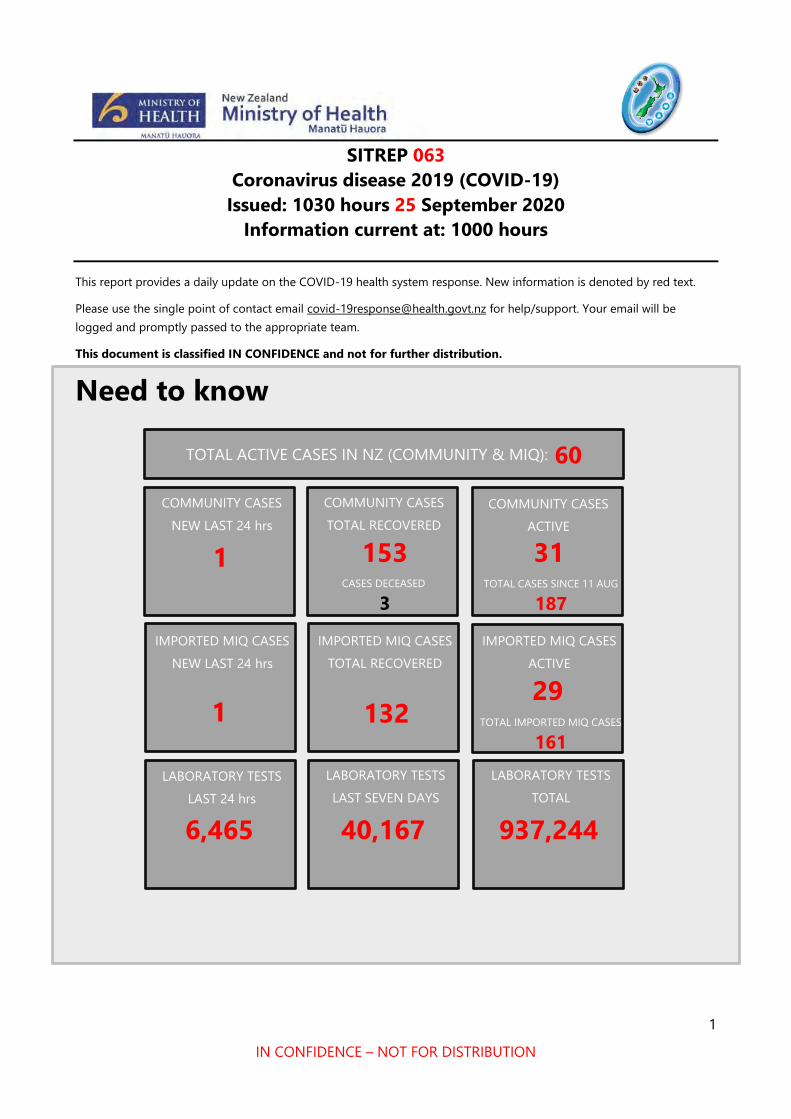
1
IN CONFIDENCE – NOT FOR DISTRIBUTION
SITREP 063
Coronavirus disease 2019 (COVID-19)
Issued: 1030 hours 25 September 2020
Information current at: 1000 hours
This report provides a daily update on the COVID-19 health system response. New information is denoted by red text.
Please use the single point of contact email [email protected] for help/support. Your email will be
logged and promptly passed to the appropriate team.
This document is classified IN CONFIDENCE and not for further distribution.
Need to know
COMMUNITY CASES
NEW LAST 24 hrs
1
IMPORTED MIQ CASES
NEW LAST 24 hrs
1
COMMUNITY CASES
TOTAL RECOVERED
153
132
COMMUNITY CASES
ACTIVE
31 TOTAL CASES SINCE 11 AUG
187
29 TOTAL IMPORTED MIQ CASES
161
TOTAL ACTIVE CASES IN NZ (COMMUNITY & MIQ): 60
IMPORTED MIQ CASES
TOTAL RECOVERED
IMPORTED MIQ CASES
ACTIVE
LABORATORY TESTS
LAST 24 hrs
6,465
LABORATORY TESTS
LAST SEVEN DAYS
40,167
LABORATORY TESTS
TOTAL
937,244
CASES DECEASED
3

IN CONFIDENCE – NOT FOR DISTRIBUTION
2
Total COVID-19 cases
Table 1: Total number of COVID-19 cases as at 0900 25 September 20201
Case status Active Recovered Deceased Total
Confirmed 60* (-5) 1393 (+7) 20 1473 (+2)
Probable 0 351 5 356
Total 60* (-5) 1744 (+7) 25 1829 (+2)
*2 newly identified cases, 5 cases classified as recovered.
New cases in New Zealand since 0900 24 September 2020, as at 0900 25 September2
Imported in MIQ facilities
1. One new case has been detected at the border. In total 161 cases have been detected
at the border since the establishment of MIQ facilities.
o The case arrived on 19 September from Moscow via Istanbul and Kuala Lumpur. They
tested positive on day 3 in an Auckland MIQ facility and have since moved to Jet Park
Auckland.
Community
2. One new community case has been reported.
o The case is a contact of a confirmed case, associated with the MREF Bereavement
sub-cluster. The case was in Jet Park as a close contact of this known case. The case
left Jet Park on 18 September to complete a 14 day isolation period at home (the
clock was re-started on leaving Jet Park). The case has been monitored daily. The
case tested positive on day five. The case has now returned to Jet Park. Community
risk is assessed as low.3
Total community cases by DHB since 11 August
Table 2: Community cases by DHB and case status as at 0900 25 September 20204
1 EpiSurv Database, 0900 25 September 2020
2 EpiSurv Database, 0900 25 September 2020
3 NRHCC Intelligence lead phone call 1035 25 September
4 EpiSurv Database, 0900 25 September 2020
Case Status Counties Manukau Waitematā Auckland Waikato Total
Confirmed 79 56 (+1) 50 1 186 (+1)
Probable 1 0 0 0 1
Total 80 56 (+1) 50 1 187 (+1)

IN CONFIDENCE – NOT FOR DISTRIBUTION
3
Total community cases by outbreak since 11 August5 Table 3: Community cases by Outbreak as at 0900 25 September 20206
Community cases and household contacts at Jet Park
3. As at 0800 25 September there are 35 people isolating in Jet Park from the community.
15 are confirmed cases, the remaining 20 are household contacts. This number will
fluctuate as people finish their isolation and depart from the facility.7
Cases in hospital
4. Three cases in hospital with COVID-19 as at 0800 25 September.8
Table 4: Number of cases in hospital with COVID-19 by DHB as at 0800 25 September 2020
Pop up testing9
5. Testing services around New Zealand have been strengthened in relation to the
Christchurch returnees cluster. See table 9 for more details.
6. The following CTCs have been stood up:
o Lakes DHB: 2 x Rotorua, 1 x Taupo
o Canterbury DHB: 3 x Christchurch
o Awaiting information from Bay of Plenty and Capital & Coast DHBs.
5 EpiSurv Database, 0900 25 September 2020
6 EpiSurv Database, 0900 25 September 2020
7 NRHCC Morning Report, 0859 25 September 2020
8 NRHCC Morning Report, 0859 25 September 2020
9 Testing Strategy email 1024 25 September 2020
Outbreak New cases (last 24 hrs) Total cases
Auckland August 1 179
Christchurch Returnees 0 6
Rydges Hotel (MIF) 0 1
Under Investigation 0 1
Total 1 187
DHB Hospital Number in a general ward Number in ICU/HDU
Auckland Auckland City 1 0
Waitematā North Shore 1 0
Counties Manukau Middlemore 1 0
Total - 3 0
s 9(2)(a)

IN CONFIDENCE – NOT FOR DISTRIBUTION
4
Health system response
Overall approach
7. Our investigation has two main focus areas that run in parallel:
o Source attribution – a focus on investigating the case with the earliest symptom
onset date to gather details actions of movements 14 days prior. This will help to
understand the possible source of the new outbreak.
o Containment – rigorous case investigation, identification of close contacts and
isolation and testing to ensure that chain of transmission is broken.
o Case classification – An expert panel has been established to consider cases with
high CT counts to determine their status and develop a protocol for reporting,
management, and investigation of potentially historic infections.
Current outbreak investigation priorities10
o Ongoing management of healthcare worker from Jet Park.
o Ongoing management of Auckland August outbreak.
o Ongoing source investigation and contact tracing of Christchurch Returnees outbreak.
Settings of interest11
8. Christchurch to Auckland Charter flight and related Christchurch MIF cases.
9. Settings of interest for the Christchurch Returnees outbreak include
o A supermarket and two retail stores in Auckland.
o Several locations outside of Auckland, which have been identified and are being
followed up by the relevant PHUs.
Case investigation Christchurch Returnee Outbreak
10. A case reported on 19 September is a returnee who arrived in New Zealand on 27
August and completed managed isolation in Christchurch. The case tested negative on
day 3 and day 12. They left managed isolation on 11 September and returned home to
Auckland on a charter flight from Christchurch. They were tested after developing
symptoms on 16 September. The test returned positive on 18 September. The case and
their two household contacts (both reported as confirmed cases on 19 September)
were transferred to the Auckland Jet Park quarantine facility on 18 September. The
case’s genome sequence is consistent with two confirmed cases from the same flight to
New Zealand.12 Source of infection is still under investigation.
11. Another passenger from the same chartered flight returned a positive test with a high
CT value on 21 September. They were retested and returned a negative result on 22
10NRHCC Morning Report, 0845 24 September 2020
11 NRHCC Morning Report, 0845 24 September 2020
12 WGS Interim Report, 0313 21 September 2020

IN CONFIDENCE – NOT FOR DISTRIBUTION
5
September. They are classified as under investigation until it is determined if it is an
historic case and if they were already reported as a case in India.
12. Three cases from the same family unit tested positive on 22 September. Two cases were
tested because they were passengers on the chartered flight
and the third case is a household contact
The family has
been in isolation since 20 September. Contact tracing has been underway for this family
since 20 September, and whole genome sequencing for the three cases is underway.
The family visited Tāupo from 18 to 20 September and met parties from across the
country. They also had dinner with a family of outside of the Tāupo trip.
13. 34 close contacts have been identified in total to date. As at 1700 24 September, 31
contacts are isolating. Relevant PHUs have been notified. All parties who were
contacts of these cases have been contacted. Contact tracing and testing is underway
for these families. All PHUs with responsibility for close contacts have reported good
compliance with isolation requirements.13
14. 12 contacts from the charter flight on 11 September from Christchurch to Auckland
who subsequently went to Taranaki have all been swabbed 4 times and will come out
of isolation on 26 September.14
Case investigation Auckland August Outbreak
15. Source investigation for an epidemiological link to the main cluster for four cases who
have been genomically linked to the main cluster is ongoing:
o The
o GP
o The second Mount Albert Grammar student
o The Botany case
13 PHU MOH phone call, 1000 25 September
14 Canterbury DHB report, 24 September
s 9(2)(a)
s 9(2)(a)
s 9(2)(a)
s 9(2)(a)
s 9(2)(a)
s 9(2)(a)
s 9(2)(a)
6
IN CONFIDENCE – NOT FOR DISTRIBUTION
s 9(2)(a)
s 9(2)(a)

IN CONFIDENCE – NOT FOR DISTRIBUTION
7
s 9(2)(a)

8
IN CONFIDENCE – NOT FOR DISTRIBUTION
ESR and wider testing15 16. A further 10 community cases are genomically linked with the Auckland cluster. These
cases are from the following known subclusters; Church 1 (1 cases), Church 3 (5 cases),
Americold HH (2 cases), MREF Bereavement (C-0018) (2 cases). A total of 153 cases
(86%) from the community cluster have now been sequenced, of which 134 (76%)
yielded a high quality genome.
17.
18. Ongoing analysis of the whole genome sequencing results is being used to show how
COVID-19 has been transmitted through the community cluster and to further inform
its management.
19. No direct links have been found between the community outbreak genome
sequencing, and the 65 full genomes (49 high quality) currently available from cases
detected in border arrivals in managed isolation facilities (MIFs). There has been one
case in a health worker at a managed isolation facility. WGS results indicate that this
case is genomically linked to the Auckland community cluster and clustered closely with
three community cases in the managed isolation facility (as discussed in para 8).
20.
15 ESR Whole Genome Sequencing Report 02 September 2020, Email 0946 16 September 2020
s 9(2)(g)(i)
s 9(2)(g)(i)

IN CONFIDENCE – NOT FOR DISTRIBUTION
9
Figure 1: Number of cases that have been whole genome sequenced and are genomically clustered
with the Auckland August cluster by sub-cluster as at 14 September 202016
Source: ESR *A sample may not have been received by ESR, may not have been sequenced yet or a sequencing result could not be
obtained from the sample received.
Contact tracing17 21. Since the 11 August, 4044 community close contacts have been identified and recorded
in the National Contact Tracing Solution, 4025 of these have been contacted and are
self-isolating, and we are in the process of contacting the rest.
Table 6: Close contact tracing recorded in the National Contact Tracing Solution since 11 August as at
0830 25 September 2020
22/09/2020 23/09/2020 24/09/2020 25/09/2020
Cumulative number of close
contacts identified1 4003 4014 4044 4053
Cumulative number of close
contacts successfully contacted 3992 4006 4025 4050
Number of close contacts
referred to "finding services"2 0 0 0 0
Number of close contacts
awaiting contact 11 8 19 3
1. Contacts loaded into the National Contact Tracing Solution, and managed by either the National Investigation and Tracing
Unit or the Public Health Units. Contacts from MIQ and overseas cases are not included in this report.
2. "Finding services" refers to the mechanism the National Close Contact Service uses to find valid contact details for close
contacts we do not have the correct contact details for. These services utilise internal Ministry of Health databases along with
Police, Customs and Airlines where relevant.
16 ESR email 1608 14 September 2020
17 COVID-19 NCCS Analytics and Reporting 0857 24 September 2020
0 5 10 15 20 25 30 35
Americold
Americold HH
Auckland Bus
Botany
Church 1
Church 2
Church 3
Finance Now
Finance Now HH
Household 1
Household 2
Household 3
MREF-Bereavement
GP
NZ Courier Post
Pending
Warehouse
Number of cases
Sequenced and genomically clustered Sequence not available*
s 9(2)(a)
s 9(2)(a)
s 9(2)(a)

IN CONFIDENCE – NOT FOR DISTRIBUTION
10
3. The total number and number successfully contacted can decrease due to duplicates and invalid records being removed from
the system.
COVID-19 Tracer App usage18 Figure 2: COVID-19 Tracer App cumulative registered users and daily scans/manual entries as at 1615
24 September 2020
1. The number of scans and manual entries on any given date is subject to change for up to 31 days. This is because there can be
a delay before anonymised analytic information is received (e.g. device not connected to internet when scan carried out).
2. The number of App registrations and QR codes for any given date is subject to change for up to 1 day. This is because due to
reporting timeframes these numbers may be extracted before the 12pm cut-off for the reporting period.
18 Response Analyst – Digital Channels, 1614 24 September 2020
0
500,000
1,000,000
1,500,000
2,000,000
2,500,000
0
500,000
1,000,000
1,500,000
2,000,000
2,500,000
20/
05
23/
05
26/
05
29/
05
01/
06
04/
06
07/
06
10/
06
13/
06
16/
06
19/
06
22/
06
25/
06
28/
06
01/
07
04/
07
07/
07
10/
07
13/
07
16/
07
19/
07
22/
07
25/
07
28/
07
31/
07
03/
08
06/
08
09/
08
12/
08
15/
08
18/
08
21/
08
24/
08
27/
08
30/
08
02/
09
05/
09
08/
09
11/
09
14/
09
17/
09
20/
09
23/
09
Dai
ly s
can
s an
d m
anu
al e
ntr
ies
Cu
mu
lati
ve A
pp
re
gist
rati
on
s
Day and month
Cumulative App registrations Daily scans and manual entries

IN CONFIDENCE – NOT FOR DISTRIBUTION
11
Testing19 Table 7: Testing by functional groups, as at 0900 25 September 2020
*Numbers have been sourced from different data extracts in comparison to Table 7.
Laboratory testing numbers20 Table 8: Number of laboratory tests processed nationally as at 0900 25 September 2020
Testing supply update21
22. There are good levels of testing supplies available, with 299,747 tests currently in the
labs. The Ministry of Health is continuing to work with major suppliers in order to meet
ongoing need.
19 ÉCLAIR/MoH Public Health Intelligence, 1000 25 September 2020
20 Daily Lab Report, 0958 25 September 2020
21 Testing supply email, 0939 21 September 2020
Reason for test 24 September 18–24 September
GPs and other primary health 3147 15,293
CBACs and pop-ups 2661 19,241
Border workers - air crew 33 300
Border workers - airport staff 159 1268
Border workers - maritime crew 0 58
Border workers – Port of Tauranga staff 0 325
Border workers – Remaining Port staff 13 209
Border workers - MIF 140 1111
Border workers - MIQ 40 322
Travellers - Staying at MIF 274 2122
Travellers - Staying at MIQ 0 174
Total 6467 40,423*
Time period Number of laboratory tests
24 September 6465
Last 7 days (18 Sep to 24 Sep) 40,167*
Total 937,244

IN CONFIDENCE – NOT FOR DISTRIBUTION
12
Community Testing Centres for the Christchurch returnee cluster22 Table 9: Number of CTCs available in relation to the Christchurch Returnee Outbreak as at 1000 25
September 2020
Lakes DHB Rotorua 2 Vaughan Rd • 9am – 4pm –
Thursday (24/9) -
Sunday (27/9)
Rotorua Pukatua st (note
change of
venue)
• 11am-4pm –
Monday (28/9)
• 9am-4pm – Tuesday
– Friday (29/9-2/10)
Taupo 79 Miro Street • 1pm – 4pm –
Thursday (24/9)
• 9am-4pm – Friday
(25/9) – Friday
(2/10)
Canterbury DHB Christchurch Orchard Road CBAC
(near Airport)
• Open 9am- 4pm 7
days a week
Christchurch Whanau Ora
Community Clinic
CBAC
(Wainoni)
• Open 9am- 4pm 7
days a week
Capital and
Coast DHB
On standby depending outcome of testing
Bay of Plenty
DHB
Healthline updates23 23. On 24 September there were 2,578 contacts in Healthline. Of those calls, 1203 were to
the COVID-19 Info line. Demand on 1737 Need to talk? and other mental health services
was 696 contacts (higher than forecast).
24. The main themes on 22 September were:
o A large number of calls relating to the exposure events outlined in the media
yesterday. Registration of casual and close contacts is ongoing.
22 Testing Strategy Lead MoH, 1025 25 September
23 National Telehealth Service Coronavirus Update, 0938 25 September 2020
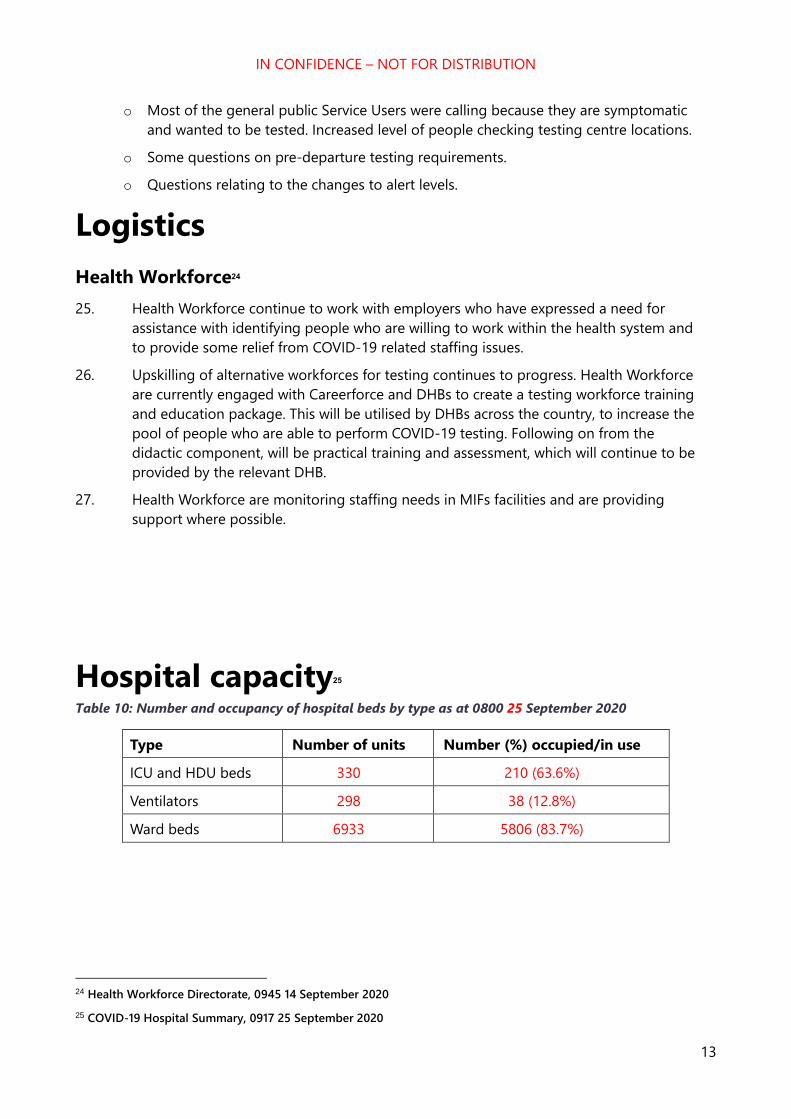
IN CONFIDENCE – NOT FOR DISTRIBUTION
13
o Most of the general public Service Users were calling because they are symptomatic
and wanted to be tested. Increased level of people checking testing centre locations.
o Some questions on pre-departure testing requirements.
o Questions relating to the changes to alert levels.
Logistics
Health Workforce24
25. Health Workforce continue to work with employers who have expressed a need for
assistance with identifying people who are willing to work within the health system and
to provide some relief from COVID-19 related staffing issues.
26. Upskilling of alternative workforces for testing continues to progress. Health Workforce
are currently engaged with Careerforce and DHBs to create a testing workforce training
and education package. This will be utilised by DHBs across the country, to increase the
pool of people who are able to perform COVID-19 testing. Following on from the
didactic component, will be practical training and assessment, which will continue to be
provided by the relevant DHB.
27. Health Workforce are monitoring staffing needs in MIFs facilities and are providing
support where possible.
Hospital capacity25 Table 10: Number and occupancy of hospital beds by type as at 0800 25 September 2020
Type Number of units Number (%) occupied/in use
ICU and HDU beds 330 210 (63.6%)
Ventilators 298 38 (12.8%)
Ward beds 6933 5806 (83.7%)
24 Health Workforce Directorate, 0945 14 September 2020
25 COVID-19 Hospital Summary, 0917 25 September 2020

14
IN CONFIDENCE – NOT FOR DISTRIBUTION
Appendix 1: Case summary Table 11: All new community cases reported between 0900 24 September and 0900 25 September. Source: ESR EpiSurv Extract 0900 25 September 2020
s 9(2)(a)

IN CONFIDENCE – NOT FOR DISTRIBUTION
15
Appendix 2: COVID-19 Provisional Disease Indicators, by date
of case notification17 Table 12: NCTS data for cases in the community - Please note, National Investigation and Tracing Centre are working through data quality issues, so
will not be reporting the metrics this morning.
Indicator (as per Table
9832) Refined Indicator description Target 13 Sept ** 14 Sept
** 15 Sept ** 16 Sept ** 17 Sept **
18 Sept **
19 Sept **
1 - (S001) Time from exposure to contact isolation / quarantine 80% within 96 hours - - - - - - -
2 – (S002) Time from case first symptom to contact isolation / quarantine 80% within 96 hours - - - - - - -
3 – (S003) Time from test sample taken to close contact isolation / quarantine 80% within 72 hours - 100% - - - - -
4 – (C001) Time from first symptom to test sample taken for positive cases 80% within 48 hours - - - - - 100% -
5 – (L001) Time from test sample taken to notification of positive result 80% within 24 hours - 0% - - - 100% 100%
6 – (P002) Time from case notification to isolation / quarantine of contact 80% within 48 hours - 100% - - - 84% -
7 – (P001) Time from notification to case interview 80% within 24 hours - 100% - - - 100% 100%
8 – (P003) Time from close contact identification to isolated / quarantined 80% within 24 hours - 100% - - - 83% 100%
10 – (P004) Proportion of contacts traced in 48 hours 80% within 48 hours - 100% - - - 84% -
C – (S005) Proportion of close contacts with confirmed or suspected COVID-19 at the time of tracing <20% - 0% - - - 7% 0%
• * The numerator and denominator are provided in some instances to provide context for low percentages.
• **Data is not available for metrics where there is no data that meets the definition, or where the time/days to reach target has not fully elapsed
• The value of P002 can drop due to the addition of new close contacts to exposure events after the 48-hour period since case notification had elapsed. This can happen for a number of reasons, including a case recalling further details following the original case
interview.
• These metrics report all cases during the specified period, including those in Managed Isolation and Quarantine, and do not include casual contacts.
• There are three additional indicators under development requiring both technical and clinical input to define data requirements. These are due to be completed by end October 2020.
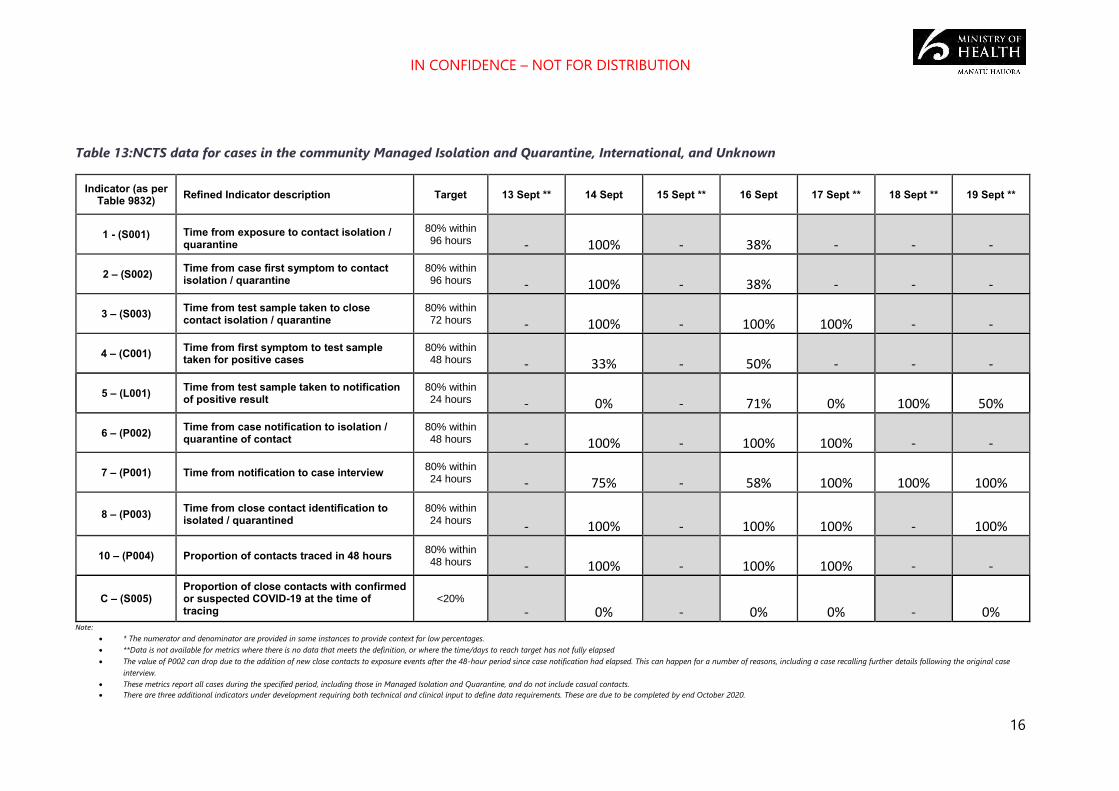
IN CONFIDENCE – NOT FOR DISTRIBUTION
16
Table 13:NCTS data for cases in the community Managed Isolation and Quarantine, International, and Unknown
Indicator (as per Table 9832) Refined Indicator description Target 13 Sept ** 14 Sept 15 Sept ** 16 Sept 17 Sept ** 18 Sept ** 19 Sept **
1 - (S001) Time from exposure to contact isolation / quarantine
80% within 96 hours - 100% - 38% - - -
2 – (S002) Time from case first symptom to contact isolation / quarantine
80% within 96 hours - 100% - 38% - - -
3 – (S003) Time from test sample taken to close contact isolation / quarantine
80% within 72 hours - 100% - 100% 100% - -
4 – (C001) Time from first symptom to test sample taken for positive cases
80% within 48 hours - 33% - 50% - - -
5 – (L001) Time from test sample taken to notification of positive result
80% within 24 hours - 0% - 71% 0% 100% 50%
6 – (P002) Time from case notification to isolation / quarantine of contact
80% within 48 hours - 100% - 100% 100% - -
7 – (P001) Time from notification to case interview 80% within 24 hours - 75% - 58% 100% 100% 100%
8 – (P003) Time from close contact identification to isolated / quarantined
80% within 24 hours - 100% - 100% 100% - 100%
10 – (P004) Proportion of contacts traced in 48 hours 80% within 48 hours - 100% - 100% 100% - -
C – (S005) Proportion of close contacts with confirmed or suspected COVID-19 at the time of tracing
<20%
- 0% - 0% 0% - 0%
Note:
• * The numerator and denominator are provided in some instances to provide context for low percentages.
• **Data is not available for metrics where there is no data that meets the definition, or where the time/days to reach target has not fully elapsed
• The value of P002 can drop due to the addition of new close contacts to exposure events after the 48-hour period since case notification had elapsed. This can happen for a number of reasons, including a case recalling further details following the original case
interview.
• These metrics report all cases during the specified period, including those in Managed Isolation and Quarantine, and do not include casual contacts.
• There are three additional indicators under development requiring both technical and clinical input to define data requirements. These are due to be completed by end October 2020.

17
IN CONFIDENCE – NOT FOR DISTRIBUTION
Appendix 3: NRHCC Testing Report
Novel Coronavirus (COVID-19)
Issued: 1700 24 September
Table 14: Metro Auckland Summary Total of Testing for 24 September 2020
Community MIQ
staff
MIQ
guests
Airport Maritime port Ship’s
Crew
TOTAL
24/09/2020 754 184 447 122 59 20 1586
Table 15: Estimated tests taken since 12 August 2020, based on manual site reports at 5pm
Site 12/08-
16/08
17/08-
23/08
24/08 –
30/08
31/08 –
06/09
07/09 –
13/09
14/09 –
20/09
21/09 22/09 23/09 24/09*
MIQ Staff 2132 659 1488 912 1086 908 136 246 187 184
Guests 2972 3767 3600 3406 3424 3843 599 600 543 447
Border Airport 2129 933 1349 1158 853 951 112 121 173 122
Port 1588 678 161 392 153 320 49 16 34 59
Crew 0 0 0 0 0 0 0 0 0 20
*24/09 day still in progress
Table 16: Estimated tests taken at Metro Auckland CTCs, since 12 August 2020, based on manual site reports at 4pm
Site 12/08-
16/08
17/08-
23/08
24/08 –
30/08
31/08 –
06/09
07/09
–
13/09
14/09 –
20/09
21/09 22/
09
23/09 24/09
*
Airport Oaks 1148 515 366 265 181 152 18 25 23 15
Botany CTC 1151 948 905 749 681 802 99 93 74 74
Health New
Lynn 2603 1258 1703 732 889 621 102 66 73 61
Mangere Town
Centre 1748 1684 1599 860 660 487 70 45 55 44
Otara CTC 3221 1712 1429 930 699 938 65 61 67 53
St Lukes 1368 1045 1414 797 666 830 158 101 104 105
Takanini Urgent
Care 1886 1216 1153 684 440 487 65 61 40 50

IN CONFIDENCE – NOT FOR DISTRIBUTION
18
Whanau House 2502 1371 1442 928 1613 870 129 126 88 80
Whanau Ora -
Central 1957 964 1583 937 783 470 75 64 71 45
Whanau Ora -
North 1442 669 637 982 947 907 113 119 112 90
Whanau Ora -
South 2945 1250 718 677 620 470 66 62 29 51
Takanini Pop Up N/A N/A N/A N/A N/A N/A 17 25 22 5
Glen Eden Pop
Up N/A N/A N/A N/A N/A N/A N/A N/A 20 25
Henderson Pop
Up N/A N/A N/A N/A N/A N/A N/A N/A 11 13
Beach haven
Pop Up N/A N/A N/A N/A N/A N/A N/A N/A N/A 14
Waipuna
Targeted Site 143 549 376 219 251 220 28 34 30 27
Henderson
Targeted Site N/A N/A N/A N/A 631 93 1 2 2 2
Total 26,148 16,781 21,215 13,002 10,475 8,832 1,020 896 843 754
*24/09 day still in progress; N/A = not open as a CTC; Previous sites that are no longer open are not included
in this report
CTCs and mobile testing site locations
Please see https://www.arphs.health.nz/public-health-topics/covid-19/where-to-get-tested for the most up-
to-date information on CTCs and mobile testing sites in the Auckland region.

IN CONFIDENCE – NOT FOR DISTRIBUTION
19
Appendix 4: Testing by DHB and ethnicity The tables that follow are the number of people tested. The numbers in the laboratory testing
section are the number of laboratory tests processed.
Table 17: Number of people tested for COVID-19 from 12 August to 24 September
Prioritised ethnicity MPAO
DHB of domicile Māori Pacific Asian Other Unknown Total
Auckland 3826 7655 10,679 22,631 481 45,272
Bay of Plenty 2895 386 667 7441 74 11,463
Canterbury 1781 715 2084 15,223 270 20,073
Capital and Coast 1687 1421 1708 10,962 259 16,037
Counties Manukau 8377 22,063 10,586 14,384 486 55,896
Hawkes Bay 1559 339 258 3976 70 6202
Hutt Valley 926 609 671 3656 53 5915
Lakes 2502 317 502 3551 112 6984
MidCentral 1193 285 452 4771 106 6807
Nelson Marlborough 674 260 324 4983 74 6315
Northland 3360 230 306 4637 59 8592
South Canterbury 158 46 94 1913 30 2241
Southern 1257 433 903 11,583 110 14,286
Tairāwhiti 968 62 70 902 23 2025
Taranaki 758 77 203 3052 68 4158
Waikato 4833 1068 1787 11,468 289 19,445
Wairarapa 266 49 53 1337 12 1717
Waitematā 5341 5812 9511 29,099 410 50,173
West Coast 50 10 13 373 8 454
Whanganui 685 85 78 1599 18 2465
Unknown 1585 772 858 4938 2570 10,723
Total 44,681 42,694 41,807 162,480 5582 297,244

20
IN CONFIDENCE – NOT FOR DISTRIBUTION
Table 18: Rate per 1000 people tested for COVID-19 from 12 August to 24 September
Prioritised ethnicity MPAO
DHB of domicile Māori Pacific Asian Other Total
Auckland 88 136.5 57.1 86.6 82.6
Bay of Plenty 48.4 86.8 34 47.3 47.5
Canterbury 34 50.4 34.3 34.1 35
Capital and Coast 46.2 64.1 34 51.5 49.9
Counties Manukau 94.1 183.7 70 68.7 98.1
Hawkes Bay 36 52.8 28.2 36.8 37.2
Hutt Valley 35.5 52.1 35.8 38.8 39.2
Lakes 65 124.1 51.6 59.2 63.1
MidCentral 32.8 51.4 29.2 38.6 37.6
Nelson Marlborough 42 105.2 43.7 39.6 41.6
Northland 55.2 61.2 37 42.5 47.2
South Canterbury 29.8 94.2 39.7 37 37.5
Southern 37.5 62.9 35 43.3 42.8
Tairāwhiti 39.1 55.5 60 40.8 41.2
Taranaki 32.5 55.3 32.6 33.9 34.4
Waikato 50.1 80.1 40.5 42.6 46
Wairarapa 33.3 58.9 42.5 37.5 37.5
Waitematā 85.3 130.3 66.1 76.1 79.2
West Coast 12.9 39.6 14.1 13.8 14.2
Whanganui 39.4 55.9 26.6 37.2 38
Total 57.5 133.5 54.6 52.5 59.9

1
IN CONFIDENCE – NOT FOR DISTRIBUTION
SITREP 064
Coronavirus disease 2019 (COVID-19)
Issued: 1030 hours 26 September 2020
Information current at: 1000 hours
This report provides a daily update on the COVID-19 health system response. New information is denoted by red text.
Please use the single point of contact email [email protected] for help/support. Your email will be
logged and promptly passed to the appropriate team.
This document is classified IN CONFIDENCE and not for further distribution.
Need to know
COMMUNITY CASES
NEW LAST 24 hrs
0
IMPORTED MIQ CASES
NEW LAST 24 hrs
1
COMMUNITY CASES
TOTAL RECOVERED
153
132
COMMUNITY CASES
ACTIVE
31 TOTAL CASES SINCE 11 AUG
187
30 TOTAL IMPORTED MIQ CASES
162
TOTAL ACTIVE CASES IN NZ (COMMUNITY & MIQ): 61
IMPORTED MIQ CASES
TOTAL RECOVERED
IMPORTED MIQ CASES
ACTIVE
LABORATORY TESTS
LAST 24 hrs
5,952
LABORATORY TESTS
LAST SEVEN DAYS
37,760
LABORATORY TESTS
TOTAL
943,196
CASES DECEASED
3

IN CONFIDENCE – NOT FOR DISTRIBUTION
2
Total COVID-19 cases
Table 1: Total number of COVID-19 cases as at 0900 26 September 20201
Case status Active Recovered Deceased Total
Confirmed 61* (+1) 1394 (+1) 20 1475 (+2)
Probable 0 351 5 356
Total 61* (+1) 1745 (+1) 25 1831 (+2)
*2 newly identified cases, 1 case classified as recovered.
New cases in New Zealand since 0900 25 September 2020, as at 0900 26 September2
Imported in MIQ facilities
1. One new case has been detected at the border. In total 162 cases have been detected
at the border since the establishment of MIQ facilities.
o The case arrived on 21 September from Russia via United Arab Emirates. They tested
positive on day 3 in an Auckland MIQ facility and have moved to Jet Park Auckland.
Community
2. No new community cases have been reported.
Historic cases
3. One case has been reported.
o The case has been under investigation since 22 September. The case was tested because
they were a passenger on the charter flight from Christchurch to Auckland associated
with the Christchurch Returnees cluster. They returned a positive test with a high CT
value on 21 September. They were retested and returned a negative result on 22
September. ARPHS and Ministry of Health have determined this case is historic based
on the testing history and a positive serology result. The case is reported in the total
New Zealand case numbers. As this case is historic they are not included in the
Christchurch Returnees cluster.
Total community cases by DHB since 11 August
Table 2: Community cases by DHB and case status as at 0900 26 September 20203
1 EpiSurv Database, 0900 25 September 2020
2 EpiSurv Database, 0900 25 September 2020
3 EpiSurv Database, 0900 25 September 2020
Case Status Counties Manukau Waitematā Auckland Waikato Total
Confirmed 79 56 50 1 186
Probable 1 0 0 0 1
Total 80 56 50 1 187

IN CONFIDENCE – NOT FOR DISTRIBUTION
3
Total community cases by outbreak since 11 August4 Table 3: Community cases by Outbreak as at 0900 26 September 20205
Community cases and household contacts at Jet Park
4. As at 0800 26 September there are 32 people isolating in Jet Park from the community.
15 are confirmed cases, the remaining 17 are household contacts. This number will
fluctuate as people finish their isolation and depart from the facility.6
Cases in hospital
5. Two cases in hospital with COVID-19 as at 0800 26 September.7
Table 4: Number of cases in hospital with COVID-19 by DHB as at 0800 26 September 2020
Pop up testing8
6. Testing services around New Zealand have been strengthened in relation to the
Christchurch returnees cluster. See table 9 for more details.
7. The following CTCs have been stood up:
o Lakes DHB: 2 x Rotorua, 1 x Taupo
o Canterbury DHB: 2 x Christchurch
4 EpiSurv Database, 0900 25 September 2020
5 EpiSurv Database, 0900 25 September 2020
6 NRHCC Morning Report, 0859 25 September 2020
7 NRHCC Morning Report, 0859 25 September 2020
8 Testing Strategy email 1024 25 September 2020
Outbreak New cases (last 24 hrs) Total cases
Auckland August 0 179
Christchurch Returnees 0 6
Rydges Hotel (MIF) 0 1
Under Investigation 0 1
Total 0 187
DHB Hospital Number in a general ward Number in ICU/HDU
Auckland Auckland City 1 0
Waitematā North Shore 0 0
Counties Manukau Middlemore 1 0
Total - 2 0
s 9(2)(a)

IN CONFIDENCE – NOT FOR DISTRIBUTION
4
Health system response
Overall approach
8. Our investigation has two main focus areas that run in parallel:
o Source attribution – a focus on investigating the case with the earliest symptom
onset date to gather details actions of movements 14 days prior. This will help to
understand the possible source of the new outbreak.
o Containment – rigorous case investigation, identification of close contacts and
isolation and testing to ensure that chain of transmission is broken.
o Case classification – An expert panel has been established to consider cases with
high CT counts to determine their status and develop a protocol for reporting,
management, and investigation of potentially historic infections.
Current outbreak investigation priorities9
o Ongoing management of healthcare worker from Jet Park.
o Ongoing management of Auckland August outbreak.
o Ongoing source investigation and contact tracing of Christchurch Returnees outbreak.
Settings of interest10
9. Christchurch to Auckland Charter flight and related Christchurch MIF cases.
10. Settings of interest for the Christchurch Returnees outbreak include
o A supermarket and two retail stores in Auckland.
o Several locations outside of Auckland, which have been identified and are being
followed up by the relevant PHUs.
Case investigation Christchurch Returnee Outbreak
11. The case reported in SitRep on 25 September is a contact of a confirmed case and
associated with the Mt Roskill Evangelical Church Bereavement sub-cluster. The case
was in Jet Park as a close contact of this known case. The case is and left Jet Park
on 18 September to complete a 14 day isolation period at home (the
isolation clock was re-started on leaving Jet Park). The case has been monitored daily,
and tested positive on day five. Community risk is assessed as low.11
9NRHCC Morning Report, 0845 24 September 2020
10 NRHCC Morning Report, 0845 24 September 2020
11 NRHCC Intelligence lead phone call 1035 25 September
12 MoH PHU 1000 phone call 26 September
s 9(2)(a)
s 9(2)(a)
s 9(2)(a)

IN CONFIDENCE – NOT FOR DISTRIBUTION
5
12. A case reported on 19 September is a returnee who arrived in New Zealand on 27
August and completed managed isolation in Christchurch. The case tested negative on
day 3 and day 12. They left managed isolation on 11 September and returned home to
Auckland on a charter flight from Christchurch. They were tested after developing
symptoms on 16 September and returned a positive result on 18 September. The case
and their two household contacts (both reported as confirmed cases on 19 September)
were transferred to the Auckland Jet Park quarantine facility on 18 September. The
case’s genome sequence is consistent with two confirmed cases from the same flight to
New Zealand.13 Source of infection is still under investigation.
13. Three cases from the same family unit tested positive on 22 September. Two cases were
tested because they were passengers on the chartered flight
and the third case is a household contact
The family has
been in isolation since 20 September. Contact tracing has been underway for this family
since 20 September. Genome sequencing has been performed and the three cases are
all part of the B.1.36 cluster. Source investigation continues14. The family visited Tāupo
from 18 to 20 September and met parties from across the country. They also had
dinner with a family of outside of the Tāupo trip. All parties who were
contacts of these cases have been tested and are self-isolating. Contact tracing is
underway for these families. All PHUs with responsibility for close contacts have
reported good compliance with isolation requirements.15. Scoping of possible exposure
settings and contact tracing is still ongoing.
14. 42 close contacts have been identified in total to date. As at 0915 26 September, 42 of
these contacts have been tested and are isolating, and 34 have returned a negative
result16. Relevant PHUs have been notified.
15. All passengers on the Christchurch to Auckland charter flight have been tested, except
one. Of those tested, one result is pending and the rest are negative.
Case investigation Auckland August Outbreak
16. Source investigation for an epidemiological link to the main cluster for four cases who
have been genomically linked to the main cluster is ongoing:
o The
o GP
o The second Mount Albert Grammar student
o The Botany case
13 WGS Interim Report, 0313 21 September 2020
14 End of day update, Chief Advisor public health, 25 September 1700.
15 PHU MOH phone call, 1000 25 September
16 26 September: NICTS report 0915
s 9(2)(a)
s 9(2)(a)
s 9(2)(a)
s 9(2)(a) s 9(2)(a)
s 9(2)(a)
s 9(2)(a)
s 9(2)(a)

6
IN CONFIDENCE – NOT FOR DISTRIBUTION
s 9(2)(a)
s 9(2)(a)

IN CONFIDENCE – NOT FOR DISTRIBUTION
7
s 9(2)(a)

8
IN CONFIDENCE – NOT FOR DISTRIBUTION
ESR and wider testing17 17. A further 10 community cases are genomically linked with the Auckland cluster. These
cases are from the following known subclusters; Church 1 (1 cases), Church 3 (5 cases),
Americold HH (2 cases), MREF Bereavement (C-0018) (2 cases). A total of 153 cases
(86%) from the community cluster have now been sequenced, of which 134 (76%)
yielded a high quality genome.
18.
19. Ongoing analysis of the whole genome sequencing results is being used to show how
COVID-19 has been transmitted through the community cluster and to further inform
its management.
20. No direct links have been found between the community outbreak genome
sequencing, and the 65 full genomes (49 high quality) currently available from cases
detected in border arrivals in managed isolation facilities (MIFs). There has been one
case in a health worker at a managed isolation facility. WGS results indicate that this
case is genomically linked to the Auckland community cluster and clustered closely with
three community cases in the managed isolation facility (as discussed in para 8).
21.
17 ESR Whole Genome Sequencing Report 02 September 2020, Email 0946 16 September 2020
s 9(2)(g)(i)
s 9(2)(g)(i)

IN CONFIDENCE – NOT FOR DISTRIBUTION
9
Figure 1: Number of cases that have been whole genome sequenced and are genomically clustered
with the Auckland August cluster by sub-cluster as at 14 September 202018
Source: ESR *A sample may not have been received by ESR, may not have been sequenced yet or a sequencing result could not be
obtained from the sample received.
Contact tracing19 22. Since the 11 August, 4177 community close contacts have been identified and recorded
in the National Contact Tracing Solution, 4170 of these have been contacted and are
self-isolating, and we are in the process of contacting the rest.
Table 6: Close contact tracing recorded in the National Contact Tracing Solution since 11 August as at
0830 26 September 2020
23/09/2020 24/09/2020 25/09/2020 26/09/2020
Cumulative number of close
contacts identified1 4014 4044 4053 4177
Cumulative number of close
contacts successfully contacted 4006 4025 4050 4170
Number of close contacts
referred to "finding services"2 0 0 0 0
Number of close contacts
awaiting contact 8 19 3 7
1. Contacts loaded into the National Contact Tracing Solution, and managed by either the National Investigation and Tracing
Unit or the Public Health Units. Contacts from MIQ and overseas cases are not included in this report.
2. "Finding services" refers to the mechanism the National Close Contact Service uses to find valid contact details for close
contacts we do not have the correct contact details for. These services utilise internal Ministry of Health databases along with
Police, Customs and Airlines where relevant.
18 ESR email 1608 14 September 2020
19 COVID-19 NCCS Analytics and Reporting 0937 26 September 2020
0 5 10 15 20 25 30 35
Americold
Americold HH
Auckland Bus
Botany
Church 1
Church 2
Church 3
Finance Now
Finance Now HH
Household 1
Household 2
Household 3
MREF-Bereavement
GP
NZ Courier Post
Pending
Warehouse
Number of cases
Sequenced and genomically clustered Sequence not available*
s 9(2)(a)
s 9(2)(a)
s 9(2)(a)

IN CONFIDENCE – NOT FOR DISTRIBUTION
10
3. The total number and number successfully contacted can decrease due to duplicates and invalid records being removed from
the system.
COVID-19 Tracer App usage20 Figure 2: COVID-19 Tracer App cumulative registered users and daily scans/manual entries as at 1615
25 September 2020
1. The number of scans and manual entries on any given date is subject to change for up to 31 days. This is because there can be
a delay before anonymised analytic information is received (e.g. device not connected to internet when scan carried out).
2. The number of App registrations and QR codes for any given date is subject to change for up to 1 day. This is because due to
reporting timeframes these numbers may be extracted before the 12pm cut-off for the reporting period.
20 Response Analyst – Digital Channels, 1616 25 September 2020
0
500,000
1,000,000
1,500,000
2,000,000
2,500,000
0
500,000
1,000,000
1,500,000
2,000,000
2,500,000
20/
05
23/
05
26/
05
29/
05
01/
06
04/
06
07/
06
10/
06
13/
06
16/
06
19/
06
22/
06
25/
06
28/
06
01/
07
04/
07
07/
07
10/
07
13/
07
16/
07
19/
07
22/
07
25/
07
28/
07
31/
07
03/
08
06/
08
09/
08
12/
08
15/
08
18/
08
21/
08
24/
08
27/
08
30/
08
02/
09
05/
09
08/
09
11/
09
14/
09
17/
09
20/
09
23/
09
Dai
ly s
can
s an
d m
anu
al e
ntr
ies
Cu
mu
lati
ve A
pp
re
gist
rati
on
s
Day and month
Cumulative App registrations Daily scans and manual entries

IN CONFIDENCE – NOT FOR DISTRIBUTION
11
Testing21 Table 7: Testing by functional groups, as at 0900 25 September 2020
*Numbers have been sourced from different data extracts in comparison to Table 7.
Laboratory testing numbers22 Table 8: Number of laboratory tests processed nationally as at 0900 26 September 2020
Testing supply update23
23. There are good levels of testing supplies available, with 299,747 tests currently in the
labs. The Ministry of Health is continuing to work with major suppliers in order to meet
ongoing need.
21 ÉCLAIR/MoH Public Health Intelligence, 1000 25 September 2020
22 Daily Lab Report, 0844 26 September 2020
23 Testing supply email, 0939 21 September 2020
Reason for test 24 September 18–24 September
GPs and other primary health 3147 15,293
CBACs and pop-ups 2661 19,241
Border workers - air crew 33 300
Border workers - airport staff 159 1268
Border workers - maritime crew 0 58
Border workers – Port of Tauranga staff 0 325
Border workers – Remaining Port staff 13 209
Border workers - MIF 140 1111
Border workers - MIQ 40 322
Travellers - Staying at MIF 274 2122
Travellers - Staying at MIQ 0 174
Total 6467 40,423*
Time period Number of laboratory tests
25 September 5952
Last 7 days (19 Sep to 25 Sep) 37,760*
Total 943,196

IN CONFIDENCE – NOT FOR DISTRIBUTION
12
Community Testing Centres for the Christchurch returnee cluster24 Table 9: Number of CTCs available in relation to the Christchurch Returnee Outbreak as at 1000 25
September 2020
Lakes DHB Rotorua 2 Vaughan Rd • 9am – 4pm –
Thursday (24/9) -
Sunday (27/9)
Rotorua Pukatua st (note
change of
venue)
• 11am-4pm –
Monday (28/9)
• 9am-4pm – Tuesday
– Friday (29/9-2/10)
Taupo 79 Miro Street • 1pm – 4pm –
Thursday (24/9)
• 9am-4pm – Friday
(25/9) – Friday
(2/10)
Canterbury DHB Christchurch Orchard Road CBAC
(near Airport)
• Open 9am- 4pm 7
days a week
Christchurch Whanau Ora
Community Clinic
CBAC
(Wainoni)
• Open 9am- 4pm 7
days a week
Capital and
Coast DHB
On standby depending outcome of testing
Bay of Plenty
DHB
Healthline updates25 24. On 25 September there were 2,307 contacts in Healthline. Of those calls, 977 were to
the COVID-19 Info line. Demand on 1737 Need to talk? and other mental health services
was 560 contacts (lower than forecast).
25. The main themes on 25 September were:
o Questions relating to what it means to take your alert level with you from Auckland.
o A large number of calls relating to the exposure events outlined in the media
yesterday. Registration of casual and close contacts is ongoing.
24 Testing Strategy Lead MoH, 1025 25 September
25 National Telehealth Service Coronavirus Update, 0939 26 September 2020

IN CONFIDENCE – NOT FOR DISTRIBUTION
13
o Most of the general public Service Users were calling because they are symptomatic
and wanted to be tested. Increased level of people checking testing centre locations.
o Questions relating to the changes to alert levels.
Logistics
Health Workforce26
26. Health Workforce continue to work with employers who have expressed a need for
assistance with identifying people who are willing to work within the health system and
to provide some relief from COVID-19 related staffing issues.
27. Upskilling of alternative workforces for testing continues to progress. Health Workforce
are currently engaged with Careerforce and DHBs to create a testing workforce training
and education package. This will be utilised by DHBs across the country, to increase the
pool of people who are able to perform COVID-19 testing. Following on from the
didactic component, will be practical training and assessment, which will continue to be
provided by the relevant DHB.
28. Health Workforce are monitoring staffing needs in MIFs facilities and are providing
support where possible.
Hospital capacity27 Table 10: Number and occupancy of hospital beds by type as at 0800 26 September 2020
Type Number of units Number (%) occupied/in use
ICU and HDU beds 327 213 (65.1%)
Ventilators 295 42 (14.2%)
Ward beds 6868 5528 (80.5%)
26 Health Workforce Directorate, 0945 14 September 2020
27 COVID-19 Hospital Summary, 0924 26 September 2020

14
IN CONFIDENCE – NOT FOR DISTRIBUTION
Appendix 1: Case summary Table 11: All new community cases reported between 0900 25 September and 0900 26 September. Source: ESR EpiSurv Extract 0900 26 September 2020
Cumulative
Number
Date tested
positive Onset date Case status DHB Sex Age Ethnicity
Symptoms
[Yes/No] Hospitalised Occupation
Source of
transmission

IN CONFIDENCE – NOT FOR DISTRIBUTION
15
Appendix 2: COVID-19 Provisional Disease Indicators, by date
of case notification19 Table 12: NCTS data for cases in the community - Please note, National Investigation and Tracing Centre are working through data quality issues, so
will not be reporting the metrics this morning.
Indicator (as per Table
9832) Refined Indicator description Target 13 Sept ** 14 Sept
** 15 Sept ** 16 Sept ** 17 Sept **
18 Sept **
19 Sept **
1 - (S001) Time from exposure to contact isolation / quarantine 80% within 96 hours - - - - - - -
2 – (S002) Time from case first symptom to contact isolation / quarantine 80% within 96 hours - - - - - - -
3 – (S003) Time from test sample taken to close contact isolation / quarantine 80% within 72 hours - 100% - - - - -
4 – (C001) Time from first symptom to test sample taken for positive cases 80% within 48 hours - - - - - 100% -
5 – (L001) Time from test sample taken to notification of positive result 80% within 24 hours - 0% - - - 100% 100%
6 – (P002) Time from case notification to isolation / quarantine of contact 80% within 48 hours - 100% - - - 84% -
7 – (P001) Time from notification to case interview 80% within 24 hours - 100% - - - 100% 100%
8 – (P003) Time from close contact identification to isolated / quarantined 80% within 24 hours - 100% - - - 83% 100%
10 – (P004) Proportion of contacts traced in 48 hours 80% within 48 hours - 100% - - - 84% -
C – (S005) Proportion of close contacts with confirmed or suspected COVID-19 at the time of tracing <20% - 0% - - - 7% 0%
• * The numerator and denominator are provided in some instances to provide context for low percentages.
• **Data is not available for metrics where there is no data that meets the definition, or where the time/days to reach target has not fully elapsed
• The value of P002 can drop due to the addition of new close contacts to exposure events after the 48-hour period since case notification had elapsed. This can happen for a number of reasons, including a case recalling further details following the original case
interview.
• These metrics report all cases during the specified period, including those in Managed Isolation and Quarantine, and do not include casual contacts.
• There are three additional indicators under development requiring both technical and clinical input to define data requirements. These are due to be completed by end October 2020.

IN CONFIDENCE – NOT FOR DISTRIBUTION
16
Table 13:NCTS data for cases in the community Managed Isolation and Quarantine, International, and Unknown
Indicator (as per Table 9832) Refined Indicator description Target 13 Sept ** 14 Sept 15 Sept ** 16 Sept 17 Sept ** 18 Sept ** 19 Sept **
1 - (S001) Time from exposure to contact isolation / quarantine
80% within 96 hours - 100% - 38% - - -
2 – (S002) Time from case first symptom to contact isolation / quarantine
80% within 96 hours - 100% - 38% - - -
3 – (S003) Time from test sample taken to close contact isolation / quarantine
80% within 72 hours - 100% - 100% 100% - -
4 – (C001) Time from first symptom to test sample taken for positive cases
80% within 48 hours - 33% - 50% - - -
5 – (L001) Time from test sample taken to notification of positive result
80% within 24 hours - 0% - 71% 0% 100% 50%
6 – (P002) Time from case notification to isolation / quarantine of contact
80% within 48 hours - 100% - 100% 100% - -
7 – (P001) Time from notification to case interview 80% within 24 hours - 75% - 58% 100% 100% 100%
8 – (P003) Time from close contact identification to isolated / quarantined
80% within 24 hours - 100% - 100% 100% - 100%
10 – (P004) Proportion of contacts traced in 48 hours 80% within 48 hours - 100% - 100% 100% - -
C – (S005) Proportion of close contacts with confirmed or suspected COVID-19 at the time of tracing
<20%
- 0% - 0% 0% - 0%
Note:
• * The numerator and denominator are provided in some instances to provide context for low percentages.
• **Data is not available for metrics where there is no data that meets the definition, or where the time/days to reach target has not fully elapsed
• The value of P002 can drop due to the addition of new close contacts to exposure events after the 48-hour period since case notification had elapsed. This can happen for a number of reasons, including a case recalling further details following the original case
interview.
• These metrics report all cases during the specified period, including those in Managed Isolation and Quarantine, and do not include casual contacts.
• There are three additional indicators under development requiring both technical and clinical input to define data requirements. These are due to be completed by end October 2020.

17
IN CONFIDENCE – NOT FOR DISTRIBUTION
Appendix 3: NRHCC Testing Report
Novel Coronavirus (COVID-19)
Issued: 1700 25 September
Table 14: Metro Auckland Summary Total of Testing for 25 September 2020
Community MIQ
staff
MIQ
guests
Airport Maritime port Ship’s
Crew
TOTAL
25/09/2020 732 104 525 102 39 0 1502
Table 15: Estimated tests taken since 12 August 2020, based on manual site reports at 5pm
Site 12/08-
16/08
17/08-
23/08
24/08 –
30/08
31/08 –
06/09
07/09 –
13/09
14/09 –
20/09
21/09 22/09 23/09 24/09 25/09
*
MIQ Staff 2132 659 1488 912 1086 908 136 246 187 184 104
Guests 2972 3767 3600 3406 3424 3843 599 600 543 447 525
Border Airport 2129 933 1349 1158 853 951 112 121 173 167 102
Port 1588 678 161 392 153 320 49 16 34 59 39
Crew 0 0 0 0 0 0 0 0 0 21 0
*25/09 day still in progress
Table 16: Estimated tests taken at Metro Auckland CTCs, since 12 August 2020, based on manual site reports at 4pm
Site 12/08-
16/08
17/08-
23/08
24/08
–
30/08
31/08
–
06/09
07/09
–
13/09
14/09
–
20/09
21/09 22/
09
23/0
9
24/0
9
25/0
9*
Airport Oaks 1148 515 366 265 181 152 18 25 23 15 14
Botany CTC 1151 948 905 749 681 802 99 93 74 74 79
Health New
Lynn 2603 1258 1703 732 889 621 102 66 73 61
66
Mangere Town
Centre 1748 1684 1599 860 660 487 70 45 55 44
31
Otara CTC 3221 1712 1429 930 699 938 65 61 67 65 52
St Lukes 1368 1045 1414 797 666 830 158 101 104 105 128

IN CONFIDENCE – NOT FOR DISTRIBUTION
18
Takanini
Urgent Care 1886 1216 1153 684 440 487 65 61 40 50
50
Whanau
House 2502 1371 1442 928 1613 870 129 126 88 80
71
Whanau Ora -
Central 1957 964 1583 937 783 470 75 64 71 65
63
Whanau Ora -
North 1442 669 637 982 947 907 113 119 112 105
66
Whanau Ora -
South 2945 1250 718 677 620 470 66 62 29 55
54
Takanini Pop
Up N/A N/A N/A N/A N/A N/A 17 25 22 5
11
Glen Eden Pop
Up N/A N/A N/A N/A N/A N/A N/A N/A 20 25
11
Henderson
Pop Up N/A N/A N/A N/A N/A N/A N/A N/A 11 13
No
data
Beach haven
Pop Up N/A N/A N/A N/A N/A N/A N/A N/A N/A 14
19
Waipuna
Targeted Site 143 549 376 219 251 220 28 34 30 28
15
Henderson
Targeted Site N/A N/A N/A N/A 631 93 1 2 2 3
2
Total 26,148 16,781 21,356 13,002 10,475 8,832 1,020 896 843 768 732
*25/09 day still in progress; N/A = not open as a CTC; Previous sites that are no longer open are not included
in this report
CTCs and mobile testing site locations
Please see https://www.arphs.health.nz/public-health-topics/covid-19/where-to-get-tested for the most up-
to-date information on CTCs and mobile testing sites in the Auckland region.

IN CONFIDENCE – NOT FOR DISTRIBUTION
19
Appendix 4: Testing by DHB and ethnicity The tables that follow are the number of people tested. The numbers in the laboratory testing
section are the number of laboratory tests processed.
Table 17: Number of people tested for COVID-19 from 12 August to 24 September
Prioritised ethnicity MPAO
DHB of domicile Māori Pacific Asian Other Unknown Total
Auckland 3826 7655 10,679 22,631 481 45,272
Bay of Plenty 2895 386 667 7441 74 11,463
Canterbury 1781 715 2084 15,223 270 20,073
Capital and Coast 1687 1421 1708 10,962 259 16,037
Counties Manukau 8377 22,063 10,586 14,384 486 55,896
Hawkes Bay 1559 339 258 3976 70 6202
Hutt Valley 926 609 671 3656 53 5915
Lakes 2502 317 502 3551 112 6984
MidCentral 1193 285 452 4771 106 6807
Nelson Marlborough 674 260 324 4983 74 6315
Northland 3360 230 306 4637 59 8592
South Canterbury 158 46 94 1913 30 2241
Southern 1257 433 903 11,583 110 14,286
Tairāwhiti 968 62 70 902 23 2025
Taranaki 758 77 203 3052 68 4158
Waikato 4833 1068 1787 11,468 289 19,445
Wairarapa 266 49 53 1337 12 1717
Waitematā 5341 5812 9511 29,099 410 50,173
West Coast 50 10 13 373 8 454
Whanganui 685 85 78 1599 18 2465
Unknown 1585 772 858 4938 2570 10,723
Total 44,681 42,694 41,807 162,480 5582 297,244

20
IN CONFIDENCE – NOT FOR DISTRIBUTION
Table 18: Rate per 1000 people tested for COVID-19 from 12 August to 24 September
Prioritised ethnicity MPAO
DHB of domicile Māori Pacific Asian Other Total
Auckland 88 136.5 57.1 86.6 82.6
Bay of Plenty 48.4 86.8 34 47.3 47.5
Canterbury 34 50.4 34.3 34.1 35
Capital and Coast 46.2 64.1 34 51.5 49.9
Counties Manukau 94.1 183.7 70 68.7 98.1
Hawkes Bay 36 52.8 28.2 36.8 37.2
Hutt Valley 35.5 52.1 35.8 38.8 39.2
Lakes 65 124.1 51.6 59.2 63.1
MidCentral 32.8 51.4 29.2 38.6 37.6
Nelson Marlborough 42 105.2 43.7 39.6 41.6
Northland 55.2 61.2 37 42.5 47.2
South Canterbury 29.8 94.2 39.7 37 37.5
Southern 37.5 62.9 35 43.3 42.8
Tairāwhiti 39.1 55.5 60 40.8 41.2
Taranaki 32.5 55.3 32.6 33.9 34.4
Waikato 50.1 80.1 40.5 42.6 46
Wairarapa 33.3 58.9 42.5 37.5 37.5
Waitematā 85.3 130.3 66.1 76.1 79.2
West Coast 12.9 39.6 14.1 13.8 14.2
Whanganui 39.4 55.9 26.6 37.2 38
Total 57.5 133.5 54.6 52.5 59.9

1
IN CONFIDENCE – NOT FOR DISTRIBUTION
SITREP 065
Coronavirus disease 2019 (COVID-19)
Issued: 1030 hours 27 September 2020
Information current at: 1000 hours
This report provides a daily update on the COVID-19 health system response. New information is denoted by red text.
Please use the single point of contact email [email protected] for help/support. Your email will be
logged and promptly passed to the appropriate team.
This document is classified IN CONFIDENCE and not for further distribution.
Need to know
COMMUNITY CASES
NEW LAST 24 hrs
0
IMPORTED MIQ CASES
NEW LAST 24 hrs
2
COMMUNITY CASES
TOTAL RECOVERED
157
132
COMMUNITY CASES
ACTIVE
27 TOTAL CASES SINCE 11 AUG
187
32 TOTAL IMPORTED MIQ CASES
164
TOTAL ACTIVE CASES IN NZ (COMMUNITY & MIQ): 59
IMPORTED MIQ CASES
TOTAL RECOVERED
IMPORTED MIQ CASES
ACTIVE
LABORATORY TESTS
LAST 24 hrs
5,746
LABORATORY TESTS
LAST SEVEN DAYS
38,089
LABORATORY TESTS
TOTAL
948,942
CASES DECEASED
3

IN CONFIDENCE – NOT FOR DISTRIBUTION
2
Total COVID-19 cases
Table 1: Total number of COVID-19 cases as at 0900 27 September 20201
Case status Active Recovered Deceased Total
Confirmed 59* (-2) 1398 (+4) 20 1477 (+2)
Probable 0 351 5 356
Total 59* (-2) 1749 (+4) 25 1833 (+2)
*2 newly identified cases, 4 cases classified as recovered.
New cases in New Zealand since 0900 26 September 2020, as at 0900 27 September2
Imported in MIQ facilities
1. Two new case has been detected at the border. In total 164 cases have been detected
at the border since the establishment of MIQ facilities.
o The case arrived on 23 September from Philippines via Taiwan. They tested positive
on day 3 in an Auckland MIQ facility and have moved to Jet Park Auckland.
o The case arrived on 21 September from Germany via United Arab Emirates and
Malaysia. They tested positive on day 3 in an Auckland MIQ facility and have moved
to Jet Park Auckland.
Community
2. No new community cases have been reported.
Historic cases
3. No new historic cases have been reported.
Total community cases by DHB since 11 August
Table 2: Community cases by DHB and case status as at 0900 27 September 20203
1 EpiSurv Database, 0900 27 September 2020
2 EpiSurv Database, 0900 27 September 2020
3 EpiSurv Database, 0900 27 September 2020
Case Status Counties Manukau Waitematā Auckland Waikato Total
Confirmed 79 56 50 1 186
Probable 1 0 0 0 1
Total 80 56 50 1 187

IN CONFIDENCE – NOT FOR DISTRIBUTION
3
Total community cases by outbreak since 11 August4 Table 3: Community cases by Outbreak as at 0900 27 September 20205
Community cases and household contacts at Jet Park
4. As at 0800 27 September there are 22 people isolating in Jet Park from the community.
10 are confirmed cases, the remaining 12 are household contacts. This number will
fluctuate as people finish their isolation and depart from the facility.6
Cases in hospital
5. One case in hospital with COVID-19 as at 0800 27 September.7
Table 4: Number of cases in hospital with COVID-19 by DHB as at 0800 27 September 2020
Pop up testing8
6. Testing services around New Zealand have been strengthened in relation to the
Christchurch returnees cluster. See table 9 for more details.
7. The following CTCs have been stood up:
o Lakes DHB: 2 x Rotorua, 1 x Taupo
o Canterbury DHB: 2 x Christchurch
4 EpiSurv Database, 0900 27 September 2020
5 EpiSurv Database, 0900 27 September 2020
6 NRHCC Morning Report, 0859 25 September 2020
7 NRHCC Morning Report, 0859 25 September 2020
8 Testing Strategy email 1024 25 September 2020
Outbreak New cases (last 24 hrs) Total cases
Auckland August 0 179
Christchurch Returnees 0 6
Rydges Hotel (MIF) 0 1
Under Investigation 0 1
Total 0 187
DHB Hospital Number in a general ward Number in ICU/HDU
Auckland Auckland City 0 0
Waitematā North Shore 0 0
Counties Manukau Middlemore 1 0
Total - 1 0
s 9(2)(a)

IN CONFIDENCE – NOT FOR DISTRIBUTION
4
Health system response
Overall approach
8. Our investigation has two main focus areas that run in parallel:
o Source attribution – a focus on investigating the case with the earliest symptom
onset date to gather details actions of movements 14 days prior. This will help to
understand the possible source of the new outbreak.
o Containment – rigorous case investigation, identification of close contacts and
isolation and testing to ensure that chain of transmission is broken.
o Case classification – An expert panel has been established to consider cases with
high CT counts to determine their status and develop a protocol for reporting,
management, and investigation of potentially historic infections.
Current outbreak investigation priorities9
o Ongoing management of healthcare worker from Jet Park.
o Ongoing management of Auckland August outbreak.
o Ongoing source investigation and contact tracing of Christchurch Returnees outbreak.
Settings of interest10
9. Christchurch to Auckland Charter flight and related Christchurch MIF cases.
10. Settings of interest for the Christchurch Returnees outbreak include
o A supermarket and two retail stores in Auckland.
o Several locations outside of Auckland, which have been identified and are being
followed up by the relevant PHUs.
Case investigation Christchurch Returnee Outbreak –
11. A case reported on 19 September is a returnee who arrived in New Zealand on 27
August and completed managed isolation in Christchurch. The case tested negative on
day 3 and day 12. They left managed isolation on 11 September and returned home to
Auckland on a charter flight from Christchurch. They were tested after developing
symptoms on 16 September and returned a positive result on 18 September. The case
and their two household contacts (both reported as confirmed cases on 19 September)
were transferred to the Auckland Jet Park quarantine facility on 18 September.
Source of infection is still under
investigation.
9NRHCC Morning Report, 0845 24 September 2020
10 NRHCC Morning Report, 0845 24 September 2020
11 ESR email update 09.24 27 September 2020
s 9(2)(a)
s 9(2)(g)(i)

IN CONFIDENCE – NOT FOR DISTRIBUTION
5
12. Three cases from the same family unit tested positive on 22 September. Two cases were
tested because they were passengers on the chartered flight
and the third case is a household contact
The family has
been in isolation since 20 September. Genome sequencing has been performed, all
three cases are part of the B.1.36 lineage and are closely matched to other cases epi-
linked to 12 Source investigation continues13. The family visited Tāupo
from 18 to 20 September and met parties from across the country. They also had
dinner with a family of outside of the Tāupo trip. All parties who were
contacts of these cases have been tested and are self-isolating. All PHUs with
responsibility for close contacts have reported good compliance with isolation
requirements.14. Contact Tracing and testing results can be seen in Table 5.
13. All passengers on the Christchurch to Auckland charter flight have been tested, except
one. Of those tested no results are pending and the rest are negative.
Case investigation Auckland August Outbreak -
14. The case reported in SitRep on 25 September is a contact of a confirmed case and
associated with the Mt Roskill Evangelical Church Bereavement sub-cluster. The case
was in Jet Park as a close contact of this known case. and left Jet Park
on 18 September to complete a 14 day isolation period at home (the
isolation clock was re-started on leaving Jet Park). The case has been monitored daily
and tested positive on day five. Community risk is assessed as low.15
15. Source investigation for an epidemiological link to the main cluster for four cases who
have been genomically linked to the main cluster is ongoing:
o The
o GP
o The second Mount Albert Grammar student
o The Botany case
12 ESR email update 09.24 27 September 2020
13 End of day update, Chief Advisor public health, 25 September 1700.
14 PHU MOH phone call, 1000 25 September
15 NRHCC Intelligence lead phone call 1035 25 September
16 MoH PHU 1000 phone call 26 September
s 9(2)(a)
s 9(2)(a)
s 9(2)(a)s 9(2)(a)
s 9(2)(a) s 9(2)(a)
s 9(2)(a)
s 9(2)(a)
s 9(2)(a)
s 9(2)(a)
s 9(2)(a)
s 9(2)(a)
s 9(2)(a)

6
IN CONFIDENCE – NOT FOR DISTRIBUTION
s 9(2)(a)
s 9(2)(a)

IN CONFIDENCE – NOT FOR DISTRIBUTION
7
s 9(2)(a)

8
IN CONFIDENCE – NOT FOR DISTRIBUTION
ESR and wider testing17 16. A further 10 community cases are genomically linked with the Auckland cluster. These
cases are from the following known subclusters; Church 1 (1 cases), Church 3 (5 cases),
Americold HH (2 cases), MREF Bereavement (C-0018) (2 cases). A total of 153 cases
(86%) from the community cluster have now been sequenced, of which 134 (76%)
yielded a high quality genome.
17.
18. Ongoing analysis of the whole genome sequencing results is being used to show how
COVID-19 has been transmitted through the community cluster and to further inform
its management.
19. No direct links have been found between the community outbreak genome
sequencing, and the 65 full genomes (49 high quality) currently available from cases
detected in border arrivals in managed isolation facilities (MIFs). There has been one
case in a health worker at a managed isolation facility. WGS results indicate that this
case is genomically linked to the Auckland community cluster and clustered closely with
three community cases in the managed isolation facility (as discussed in para 8).
20.
17 ESR Whole Genome Sequencing Report 02 September 2020, Email 0946 16 September 2020
s 9(2)(g)(i)
s 9(2)(g)(i)

IN CONFIDENCE – NOT FOR DISTRIBUTION
9
Figure 1: Number of cases that have been whole genome sequenced and are genomically clustered
with the Auckland August cluster by sub-cluster as at 14 September 202018
Source: ESR *A sample may not have been received by ESR, may not have been sequenced yet or a sequencing result could not be
obtained from the sample received.
Contact tracing19 21. Since the 11 August, 4072 community close contacts have been identified and recorded
in the National Contact Tracing Solution, 4069 of these have been contacted and are
self-isolating, and we are in the process of contacting the rest. Please note that the
total number and number successfully contacted has decreased due to close contact
records being marked as casual contacts or invalid records in the system
Table 6: Close contact tracing recorded in the National Contact Tracing Solution since 11 August as at
0830 27 September 2020
24/09/2020 25/09/2020 26/09/2020 27/09/2020
Cumulative number of close
contacts identified1 4044 4053 4177 4072
Cumulative number of close
contacts successfully contacted 4025 4050 4170 4069
Number of close contacts
referred to "finding services"2 0 0 0 0
Number of close contacts
awaiting contact 19 3 7 3
1. Contacts loaded into the National Contact Tracing Solution, and managed by either the National Investigation and Tracing
Unit or the Public Health Units. Contacts from MIQ and overseas cases are not included in this report.
18 ESR email 1608 14 September 2020
19 COVID-19 NCCS Analytics and Reporting 0933 27 September 2020
0 5 10 15 20 25 30 35
Americold
Americold HH
Auckland Bus
Botany
Church 1
Church 2
Church 3
Finance Now
Finance Now HH
Household 1
Household 2
Household 3
MREF-Bereavement
GP
NZ Courier Post
Pending
Warehouse
Number of cases
Sequenced and genomically clustered Sequence not available*
s 9(2)(a)
s 9(2)(a)
s 9(2)(a)

IN CONFIDENCE – NOT FOR DISTRIBUTION
10
2. "Finding services" refers to the mechanism the National Close Contact Service uses to find valid contact details for close
contacts we do not have the correct contact details for. These services utilise internal Ministry of Health databases along with
Police, Customs and Airlines where relevant.
3. The total number and number successfully contacted can decrease due to duplicates and invalid records being removed from
the system.
COVID-19 Tracer App usage20 Figure 2: COVID-19 Tracer App cumulative registered users and daily scans/manual entries as at 1615
25 September 2020
1. The number of scans and manual entries on any given date is subject to change for up to 31 days. This is because there can be
a delay before anonymised analytic information is received (e.g. device not connected to internet when scan carried out).
2. The number of App registrations and QR codes for any given date is subject to change for up to 1 day. This is because due to
reporting timeframes these numbers may be extracted before the 12pm cut-off for the reporting period.
20 Response Analyst – Digital Channels, 1616 25 September 2020
0
500,000
1,000,000
1,500,000
2,000,000
2,500,000
0
500,000
1,000,000
1,500,000
2,000,000
2,500,000
20/0
523
/05
26/0
529
/05
01/0
604
/06
07/0
610
/06
13/0
616
/06
19/0
622
/06
25/0
628
/06
01/0
704
/07
07/0
710
/07
13/0
716
/07
19/0
722
/07
25/0
728
/07
31/0
703
/08
06/0
809
/08
12/0
815
/08
18/0
821
/08
24/0
827
/08
30/0
802
/09
05/0
908
/09
11/0
914
/09
17/0
920
/09
23/0
9
Dai
ly s
can
s an
d m
anu
al e
ntr
ies
Cu
mu
lati
ve A
pp
regi
stra
tio
ns
Day and month
Cumulative App registrations Daily scans and manual entries

IN CONFIDENCE – NOT FOR DISTRIBUTION
11
Testing21 Table 7: Testing by functional groups, as at 0900 27 September 2020
*Numbers have been sourced from different data extracts in comparison to Table 7.
Laboratory testing numbers22 Table 8: Number of laboratory tests processed nationally as at 0900 27 September 2020
Testing supply update23
22. There are good levels of testing supplies available, with 299,747 tests currently in the
labs. The Ministry of Health is continuing to work with major suppliers in order to meet
ongoing need.
21 ÉCLAIR/MoH Public Health Intelligence, 1000 27 September 2020
22 Daily Lab Report, 0905 27 September 2020
23 Testing supply email, 0939 21 September 2020
Reason for test 26 September 20–26 September
GPs and other primary health 3611 17,185
CBACs and pop-ups 1158 15,098
Border workers - air crew 18 268
Border workers - airport staff 217 1108
Border workers - maritime crew 0 70
Border workers – Port of Tauranga staff 1 10
Border workers – Remaining Port staff 24 270
Border workers - MIF 52 975
Border workers - MIQ 31 331
Travellers - Staying at MIF 103 2128
Travellers - Staying at MIQ 4 170
Total 5219* 37,613*
Time period Number of laboratory tests
26 September 5746*
Last 7 days (20 Sep to 26 Sep) 38,089*
Total 948,942

IN CONFIDENCE – NOT FOR DISTRIBUTION
12
Community Testing Centres for the Christchurch returnee cluster24 Table 9: Number of CTCs available in relation to the Christchurch Returnee Outbreak as at 1000 25
September 2020
Lakes DHB Rotorua 2 Vaughan Rd • 9am – 4pm –
Thursday (24/9) -
Sunday (27/9)
Rotorua Pukatua st (note
change of
venue)
• 11am-4pm –
Monday (28/9)
• 9am-4pm – Tuesday
– Friday (29/9-2/10)
Taupo 79 Miro Street • 9am-4pm – Friday
(25/9) – Friday
(2/10)
Canterbury DHB Christchurch Orchard Road CBAC
(near Airport)
• Open 9am- 4pm 7
days a week
Christchurch Whanau Ora
Community Clinic
CBAC
(Wainoni)
• Open 9am- 4pm 7
days a week
Capital and
Coast DHB
On standby depending outcome of testing
Bay of Plenty
DHB
Healthline updates25 23. On 26 September there were 2,241 contacts in Healthline. Of those calls, 1,039 were to
the COVID-19 Info line. Demand on 1737 Need to talk? and other mental health services
was 538 contacts (lower than forecast).
24. The main themes on 25 September were:
o A large number of calls relating to the exposure events outlined in the media
including Fuller ferries this morning.
o We are continuing to see a higher than normal acuity (of non covid related health
issues) through Healthline and some of this is geographically focussed – i.e. the wider
Auckland region.
24 Testing Strategy Lead MoH, 1632 25 September
25 National Telehealth Service Coronavirus Update, 0928 27 September 2020
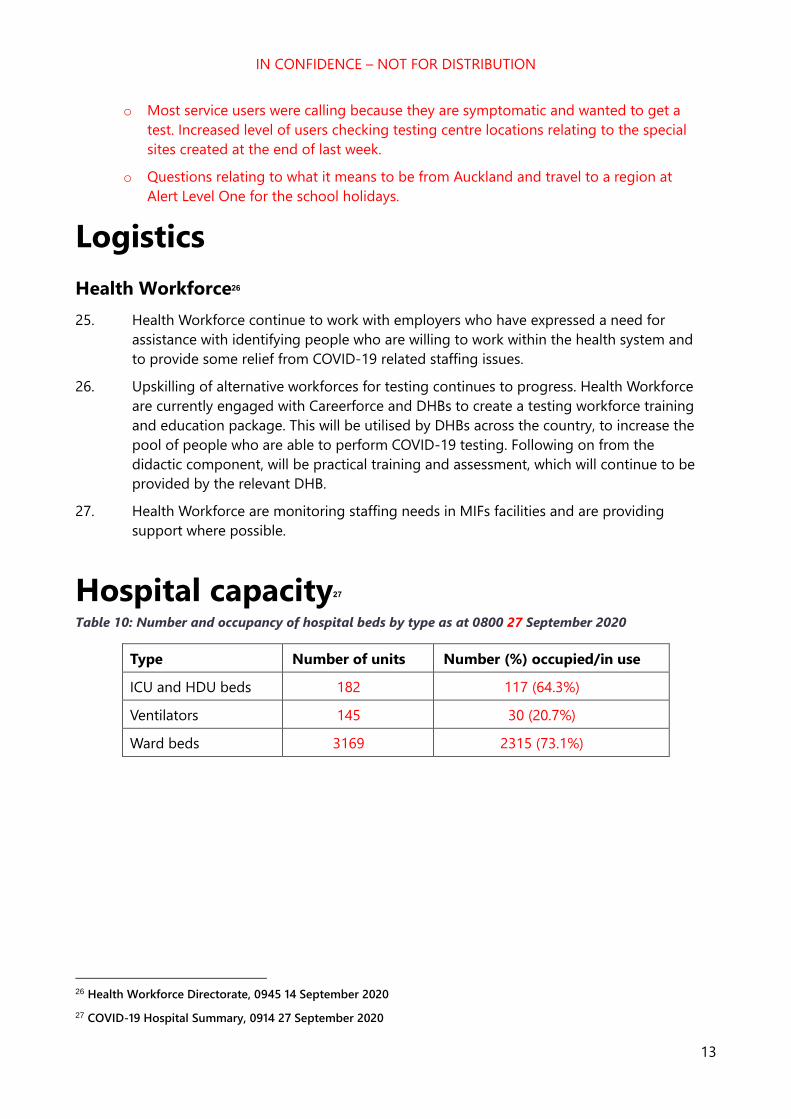
IN CONFIDENCE – NOT FOR DISTRIBUTION
13
o Most service users were calling because they are symptomatic and wanted to get a
test. Increased level of users checking testing centre locations relating to the special
sites created at the end of last week.
o Questions relating to what it means to be from Auckland and travel to a region at
Alert Level One for the school holidays.
Logistics
Health Workforce26
25. Health Workforce continue to work with employers who have expressed a need for
assistance with identifying people who are willing to work within the health system and
to provide some relief from COVID-19 related staffing issues.
26. Upskilling of alternative workforces for testing continues to progress. Health Workforce
are currently engaged with Careerforce and DHBs to create a testing workforce training
and education package. This will be utilised by DHBs across the country, to increase the
pool of people who are able to perform COVID-19 testing. Following on from the
didactic component, will be practical training and assessment, which will continue to be
provided by the relevant DHB.
27. Health Workforce are monitoring staffing needs in MIFs facilities and are providing
support where possible.
Hospital capacity27 Table 10: Number and occupancy of hospital beds by type as at 0800 27 September 2020
Type Number of units Number (%) occupied/in use
ICU and HDU beds 182 117 (64.3%)
Ventilators 145 30 (20.7%)
Ward beds 3169 2315 (73.1%)
26 Health Workforce Directorate, 0945 14 September 2020
27 COVID-19 Hospital Summary, 0914 27 September 2020

14
IN CONFIDENCE – NOT FOR DISTRIBUTION
Appendix 1: Case summary Table 11: All new community cases reported between 0900 26 September and 0900 27 September. Source: ESR EpiSurv Extract 0900 27 September 2020
Cumulative
Number
Date tested
positive Onset date Case status DHB Sex Age Ethnicity
Symptoms
[Yes/No] Hospitalised Occupation
Source of
transmission

IN CONFIDENCE – NOT FOR DISTRIBUTION
15
Appendix 2: COVID-19 Provisional Disease Indicators, by date
of case notification19 Table 12: NCTS data for cases in the community - Please note, National Investigation and Tracing Centre are working through data quality issues, so
will not be reporting the metrics this morning.
Indicator (as per Table
9832) Refined Indicator description Target 13 Sept ** 14 Sept
** 15 Sept ** 16 Sept ** 17 Sept **
18 Sept **
19 Sept **
1 - (S001) Time from exposure to contact isolation / quarantine 80% within 96 hours - - - - - - -
2 – (S002) Time from case first symptom to contact isolation / quarantine 80% within 96 hours - - - - - - -
3 – (S003) Time from test sample taken to close contact isolation / quarantine 80% within 72 hours - 100% - - - - -
4 – (C001) Time from first symptom to test sample taken for positive cases 80% within 48 hours - - - - - 100% -
5 – (L001) Time from test sample taken to notification of positive result 80% within 24 hours - 0% - - - 100% 100%
6 – (P002) Time from case notification to isolation / quarantine of contact 80% within 48 hours - 100% - - - 84% -
7 – (P001) Time from notification to case interview 80% within 24 hours - 100% - - - 100% 100%
8 – (P003) Time from close contact identification to isolated / quarantined 80% within 24 hours - 100% - - - 83% 100%
10 – (P004) Proportion of contacts traced in 48 hours 80% within 48 hours - 100% - - - 84% -
C – (S005) Proportion of close contacts with confirmed or suspected COVID-19 at the time of tracing <20% - 0% - - - 7% 0%
• * The numerator and denominator are provided in some instances to provide context for low percentages.
• **Data is not available for metrics where there is no data that meets the definition, or where the time/days to reach target has not fully elapsed
• The value of P002 can drop due to the addition of new close contacts to exposure events after the 48-hour period since case notification had elapsed. This can happen for a number of reasons, including a case recalling further details following the original case
interview.
• These metrics report all cases during the specified period, including those in Managed Isolation and Quarantine, and do not include casual contacts.
• There are three additional indicators under development requiring both technical and clinical input to define data requirements. These are due to be completed by end October 2020.

IN CONFIDENCE – NOT FOR DISTRIBUTION
16
Table 13:NCTS data for cases in the community Managed Isolation and Quarantine, International, and Unknown
Indicator (as per Table 9832) Refined Indicator description Target 13 Sept ** 14 Sept 15 Sept ** 16 Sept 17 Sept ** 18 Sept ** 19 Sept **
1 - (S001) Time from exposure to contact isolation / quarantine
80% within 96 hours - 100% - 38% - - -
2 – (S002) Time from case first symptom to contact isolation / quarantine
80% within 96 hours - 100% - 38% - - -
3 – (S003) Time from test sample taken to close contact isolation / quarantine
80% within 72 hours - 100% - 100% 100% - -
4 – (C001) Time from first symptom to test sample taken for positive cases
80% within 48 hours - 33% - 50% - - -
5 – (L001) Time from test sample taken to notification of positive result
80% within 24 hours - 0% - 71% 0% 100% 50%
6 – (P002) Time from case notification to isolation / quarantine of contact
80% within 48 hours - 100% - 100% 100% - -
7 – (P001) Time from notification to case interview 80% within 24 hours - 75% - 58% 100% 100% 100%
8 – (P003) Time from close contact identification to isolated / quarantined
80% within 24 hours - 100% - 100% 100% - 100%
10 – (P004) Proportion of contacts traced in 48 hours 80% within 48 hours - 100% - 100% 100% - -
C – (S005) Proportion of close contacts with confirmed or suspected COVID-19 at the time of tracing
<20%
- 0% - 0% 0% - 0%
Note:
• * The numerator and denominator are provided in some instances to provide context for low percentages.
• **Data is not available for metrics where there is no data that meets the definition, or where the time/days to reach target has not fully elapsed
• The value of P002 can drop due to the addition of new close contacts to exposure events after the 48-hour period since case notification had elapsed. This can happen for a number of reasons, including a case recalling further details following the original case
interview.
• These metrics report all cases during the specified period, including those in Managed Isolation and Quarantine, and do not include casual contacts.
• There are three additional indicators under development requiring both technical and clinical input to define data requirements. These are due to be completed by end October 2020.
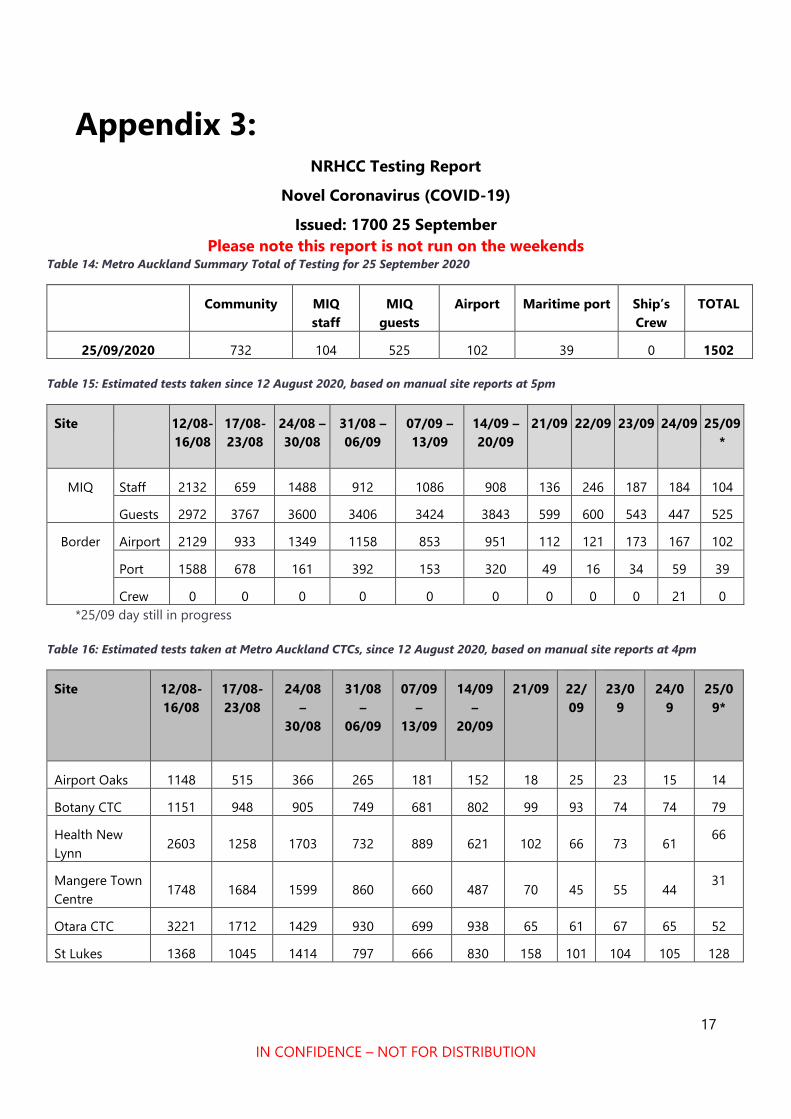
17
IN CONFIDENCE – NOT FOR DISTRIBUTION
Appendix 3: NRHCC Testing Report
Novel Coronavirus (COVID-19)
Issued: 1700 25 September
Please note this report is not run on the weekends Table 14: Metro Auckland Summary Total of Testing for 25 September 2020
Community MIQ
staff
MIQ
guests
Airport Maritime port Ship’s
Crew
TOTAL
25/09/2020 732 104 525 102 39 0 1502
Table 15: Estimated tests taken since 12 August 2020, based on manual site reports at 5pm
Site 12/08-
16/08
17/08-
23/08
24/08 –
30/08
31/08 –
06/09
07/09 –
13/09
14/09 –
20/09
21/09 22/09 23/09 24/09 25/09
*
MIQ Staff 2132 659 1488 912 1086 908 136 246 187 184 104
Guests 2972 3767 3600 3406 3424 3843 599 600 543 447 525
Border Airport 2129 933 1349 1158 853 951 112 121 173 167 102
Port 1588 678 161 392 153 320 49 16 34 59 39
Crew 0 0 0 0 0 0 0 0 0 21 0
*25/09 day still in progress
Table 16: Estimated tests taken at Metro Auckland CTCs, since 12 August 2020, based on manual site reports at 4pm
Site 12/08-
16/08
17/08-
23/08
24/08
–
30/08
31/08
–
06/09
07/09
–
13/09
14/09
–
20/09
21/09 22/
09
23/0
9
24/0
9
25/0
9*
Airport Oaks 1148 515 366 265 181 152 18 25 23 15 14
Botany CTC 1151 948 905 749 681 802 99 93 74 74 79
Health New
Lynn 2603 1258 1703 732 889 621 102 66 73 61
66
Mangere Town
Centre 1748 1684 1599 860 660 487 70 45 55 44
31
Otara CTC 3221 1712 1429 930 699 938 65 61 67 65 52
St Lukes 1368 1045 1414 797 666 830 158 101 104 105 128
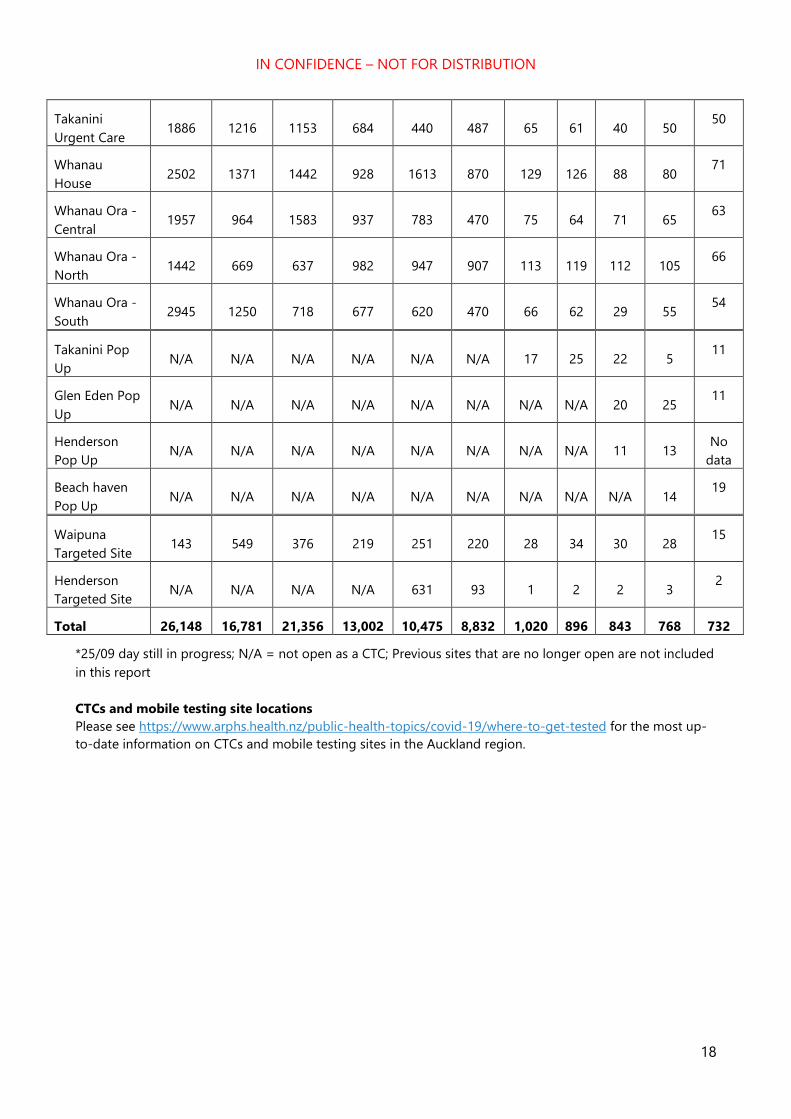
IN CONFIDENCE – NOT FOR DISTRIBUTION
18
Takanini
Urgent Care 1886 1216 1153 684 440 487 65 61 40 50
50
Whanau
House 2502 1371 1442 928 1613 870 129 126 88 80
71
Whanau Ora -
Central 1957 964 1583 937 783 470 75 64 71 65
63
Whanau Ora -
North 1442 669 637 982 947 907 113 119 112 105
66
Whanau Ora -
South 2945 1250 718 677 620 470 66 62 29 55
54
Takanini Pop
Up N/A N/A N/A N/A N/A N/A 17 25 22 5
11
Glen Eden Pop
Up N/A N/A N/A N/A N/A N/A N/A N/A 20 25
11
Henderson
Pop Up N/A N/A N/A N/A N/A N/A N/A N/A 11 13
No
data
Beach haven
Pop Up N/A N/A N/A N/A N/A N/A N/A N/A N/A 14
19
Waipuna
Targeted Site 143 549 376 219 251 220 28 34 30 28
15
Henderson
Targeted Site N/A N/A N/A N/A 631 93 1 2 2 3
2
Total 26,148 16,781 21,356 13,002 10,475 8,832 1,020 896 843 768 732
*25/09 day still in progress; N/A = not open as a CTC; Previous sites that are no longer open are not included
in this report
CTCs and mobile testing site locations
Please see https://www.arphs.health.nz/public-health-topics/covid-19/where-to-get-tested for the most up-
to-date information on CTCs and mobile testing sites in the Auckland region.

IN CONFIDENCE – NOT FOR DISTRIBUTION
19
Appendix 4: Testing by DHB and ethnicity The tables that follow are the number of people tested. The numbers in the laboratory testing
section are the number of laboratory tests processed.
Table 17: Number of people tested for COVID-19 from 12 August to 26 September
Prioritised ethnicity MPAO
DHB of domicile Māori Pacific Asian Other Unknown Total
Auckland 3889 7728 10,964 23,135 505 46,221
Bay of Plenty 2947 393 685 7575 76 11,676
Canterbury 1810 725 2137 15,505 271 20,448
Capital and Coast 1726 1441 1760 11,266 271 16,464
Counties Manukau 8510 22,283 10,835 14,651 496 56,775
Hawkes Bay 1596 342 263 4064 73 6338
Hutt Valley 952 619 688 3753 53 6065
Lakes 2566 319 521 3680 116 7202
MidCentral 1205 293 461 4852 112 6923
Nelson Marlborough 692 264 333 5117 71 6477
Northland 3409 232 316 4737 60 8754
South Canterbury 160 46 95 1947 31 2279
Southern 1299 444 936 11,832 114 14,625
Tairāwhiti 993 63 72 922 23 2073
Taranaki 774 80 203 3111 72 4240
Waikato 4926 1096 1839 11,800 294 19,955
Wairarapa 271 52 55 1379 13 1770
Waitematā 5423 5860 9749 29,660 424 51,116
West Coast 50 10 13 379 8 460
Whanganui 690 85 81 1620 19 2495
Unknown 1621 779 889 5037 2666 10,992
Total 45,509 43,154 42,895 166,023 5768 303,349

20
IN CONFIDENCE – NOT FOR DISTRIBUTION
Table 18: Rate per 1000 people tested for COVID-19 from 12 August to 26 September
Prioritised ethnicity MPAO
DHB of domicile Māori Pacific Asian Other Total
Auckland 89.4 137.8 58.6 88.5 84.3
Bay of Plenty 49.3 88.4 35 48.1 48.4
Canterbury 34.5 51.1 35.2 34.8 35.7
Capital and Coast 47.3 65 35.1 53 51.2
Counties Manukau 95.6 185.6 71.7 70 99.7
Hawkes Bay 36.9 53.3 28.7 37.6 38
Hutt Valley 36.5 53 36.7 39.8 40.2
Lakes 66.7 124.9 53.6 61.4 65
MidCentral 33.1 52.8 29.7 39.2 38.2
Nelson Marlborough 43.1 106.8 44.9 40.7 42.7
Northland 56 61.7 38.2 43.5 48.1
South Canterbury 30.1 94.2 40.1 37.7 38.1
Southern 38.7 64.5 36.3 44.2 43.8
Tairāwhiti 40.1 56.4 61.7 41.7 42.2
Taranaki 33.2 57.4 32.6 34.6 35.1
Waikato 51.1 82.2 41.7 43.8 47.2
Wairarapa 34 62.5 44.1 38.7 38.7
Waitematā 86.7 131.4 67.8 77.6 80.7
West Coast 12.9 39.6 14.1 14 14.4
Whanganui 39.7 55.9 27.7 37.6 38.5
Total 58.5 134.9 56 53.6 61.2

1
IN CONFIDENCE – NOT FOR DISTRIBUTION
SITREP 066
Coronavirus disease 2019 (COVID-19)
Issued: 1030 hours 28 September 2020
Information current at: 1000 hours
This report provides a daily update on the COVID-19 health system response. New information is denoted by red text.
Please use the single point of contact email [email protected] for help/support. Your email will be
logged and promptly passed to the appropriate team.
This document is classified IN CONFIDENCE and not for further distribution.
Need to know
COMMUNITY CASES
NEW LAST 24 hrs
0
IMPORTED MIQ CASES
NEW LAST 24 hrs
0
COMMUNITY CASES
TOTAL RECOVERED
157
136
COMMUNITY CASES
ACTIVE
27 TOTAL CASES SINCE 11 AUG
187
28 TOTAL IMPORTED MIQ CASES
164
TOTAL ACTIVE CASES IN NZ (COMMUNITY & MIQ): 55
IMPORTED MIQ CASES
TOTAL RECOVERED
IMPORTED MIQ CASES
ACTIVE
LABORATORY TESTS
LAST 24 hrs
3,539
LABORATORY TESTS
LAST SEVEN DAYS
37,533
LABORATORY TESTS
TOTAL
951,954
CASES DECEASED
3

IN CONFIDENCE – NOT FOR DISTRIBUTION
2
Total COVID-19 cases
Table 1: Total number of COVID-19 cases as at 0900 28 September 20201
Case status Active Recovered Deceased Total
Confirmed 55* (-4) 1402 (+4) 20 1477
Probable 0 351 5 356
Total 55* (-4) 1753 (+4) 25 1833
*0 newly identified cases, 4 cases classified as recovered.
New cases in New Zealand since 0900 27 September 2020, as at 0900 28 September2
Imported in MIQ facilities
1. No new cases have been detected at the border. In total 164 cases have been detected
at the border since the establishment of MIQ facilities.
Community
2. No new community cases have been reported.
Historic cases
3. No new historic cases have been reported.
Total community cases by DHB since 11 August
Table 2: Community cases by DHB and case status as at 0900 28 September 20203
1 EpiSurv Database, 0900 27 September 2020
2 EpiSurv Database, 0900 28 September 2020
3 EpiSurv Database, 0900 28 September 2020
Case Status Counties Manukau Waitematā Auckland Waikato Total
Confirmed 79 56 50 1 186
Probable 1 0 0 0 1
Total 80 56 50 1 187

IN CONFIDENCE – NOT FOR DISTRIBUTION
3
Total community cases by outbreak since 11 August4 Table 3: Community cases by Outbreak as at 0900 28 September 20205
Community cases and household contacts at Jet Park
4. As at 0800 28 September there are 18 people isolating in Jet Park from the community.
9 are confirmed cases, the remaining 9 are household contacts. This number will
decrease as people finish their isolation and depart from the facility.6
Cases in hospital
5. One case in hospital with COVID-19 as at 0800 28 September.7
Table 4: Number of cases in hospital with COVID-19 by DHB as at 0800 28 September 2020
4 EpiSurv Database, 0900 28 September 2020
5 EpiSurv Database, 0900 28 September 2020
6 NRHCC Morning Report, 0900 28 September 2020
7 NRHCC Morning Report, 0900 28 September 2020
Outbreak New cases (last 24 hrs) Total cases
Auckland August 0 179
Christchurch Returnees 0 6
Rydges Hotel (MIF) 0 1
Under Investigation 0 1
Total 0 187
DHB Hospital Number in a general ward Number in ICU/HDU
Auckland Auckland City 0 0
Waitematā North Shore 0 0
Counties Manukau Middlemore 1 0
Total - 1 0
s 9(2)(a)

IN CONFIDENCE – NOT FOR DISTRIBUTION
4
Health system response
Overall approach
6. Our investigation has two main focus areas that run in parallel:
o Source attribution – a focus on investigating the case with the earliest symptom
onset date to gather details actions of movements 14 days prior. This will help to
understand the possible source of the new outbreak.
o Containment – rigorous case investigation, identification of close contacts and
isolation and testing to ensure that chain of transmission is broken.
o Case classification –has been established to consider cases with high CT counts will
be investigated by an expert panel to determine their status and develop a protocol
for reporting, management, and investigation of potentially historic infections.
Current outbreak investigation priorities8
o Ongoing management of healthcare worker from Jet Park.
o Ongoing management of Auckland August outbreak.
o Ongoing source investigation and contact tracing of Christchurch Returnees outbreak.
Settings of interest9
7. Christchurch to Auckland Charter flight and related Christchurch MIF cases.
8. Settings of interest for the Christchurch Returnees outbreak include
o A supermarket and two retail stores in Auckland.
o Several locations outside of Auckland, which have been identified and are being
followed up by the relevant PHUs.
Case investigation Christchurch Returnee Outbreak –
9. A case reported on 19 September is a returnee who arrived in New Zealand on 27
August and completed managed isolation in Christchurch. The case tested negative on
day 3 and day 12. They left managed isolation on 11 September and returned home to
Auckland on a charter flight from Christchurch. They were tested after developing
symptoms on 16 September and returned a positive result on 18 September. The case
and their two household contacts (both reported as confirmed cases on 19 September)
were transferred to the Auckland Jet Park quarantine facility on 18 September.
Genomically, the three cases are part of the B.1.36 lineage and sequencing is consistent
with three confirmed cases from the same flight to New Zealand, all of whom tested
positive while in an MIQ facility in Christchurch.10 Source of infection is still under
investigation.
8NRHCC Morning Report, 0845 24 September 2020
9 NRHCC Morning Report, 0845 24 September 2020
10 ESR email update 09.24 27 September 2020
s 9(2)(a)

IN CONFIDENCE – NOT FOR DISTRIBUTION
5
10. Three cases from the same family unit tested positive on 22 September. Two cases were
tested because they were passengers on the chartered flight
and the third case is a household contact
The family has
been in isolation since 20 September. Genomes have been sequenced and all three
cases are part of the B.1.36 lineage and are closely matched to other cases epi-linked to
the Christchurch Returnees outbreak.11 Source investigation continues12. The family
visited Tāupo from 18 to 20 September and met parties from across the country.
They also had dinner with a family of outside of the Tāupo trip. All parties
who were contacts of these cases have been tested and are self-isolating. All PHUs with
responsibility for close contacts have reported good compliance with isolation
requirements.13. Contact Tracing and testing results can be seen in Table 5.
11. All passengers on the Christchurch to Auckland charter flight have been tested, except
one. Of those tested no results are pending and the rest are negative.
Case investigation Auckland August Outbreak -
12. The case reported in SitRep on 25 September is a contact of a confirmed case and
associated with the Mt Roskill Evangelical Church Bereavement sub-cluster. The case
was in Jet Park as a close contact of this known case. and left Jet Park
on 18 September to complete a 14 day isolation period at home (the
isolation clock was re-started on leaving Jet Park). The case has been monitored daily
and tested positive on day five. Community risk is assessed as low.14
13. Source investigation for an epidemiological link to the main cluster for four cases who
have been genomically linked to the main cluster is ongoing:
o The
o GP
o The second Mount Albert Grammar student
o The Botany case
11 ESR email update 09.24 27 September 2020
12 End of day update, Chief Advisor public health, 25 September 1700.
13 PHU MOH phone call, 1000 25 September
14 NRHCC Intelligence lead phone call 1035 25 September
15 MoH PHU 1000 phone call 26 September
s 9(2)(a)
s 9(2)(a)
s 9(2)(a)
s 9(2)(a) s 9(2)(a)
s 9(2)(a)
s 9(2)(a)
s 9(2)(a)
s 9(2)(a)
s 9(2)(a)
s 9(2)(a)
s 9(2)(a)

6
IN CONFIDENCE – NOT FOR DISTRIBUTION
s 9(2)(a)
s 9(2)(a)

IN CONFIDENCE – NOT FOR DISTRIBUTION
7
s 9(2)(a)

8
IN CONFIDENCE – NOT FOR DISTRIBUTION
ESR and wider testing16 14. A further 10 community cases are genomically linked with the Auckland cluster. These
cases are from the following known subclusters; Church 1 (1 cases), Church 3 (5 cases),
Americold HH (2 cases), MREF Bereavement (C-0018) (2 cases). A total of 153 cases
(86%) from the community cluster have now been sequenced, of which 134 (76%)
yielded a high quality genome.
15.
16. Ongoing analysis of the whole genome sequencing results is being used to show how
COVID-19 has been transmitted through the community cluster and to further inform
its management.
17. No direct links have been found between the community outbreak genome
sequencing, and the 65 full genomes (49 high quality) currently available from cases
detected in border arrivals in managed isolation facilities (MIFs). There has been one
case in a health worker at a managed isolation facility. WGS results indicate that this
case is genomically linked to the Auckland community cluster and clustered closely with
three community cases in the managed isolation facility (as discussed in para 8).
18.
16 ESR Whole Genome Sequencing Report 02 September 2020, Email 0946 16 September 2020
s 9(2)(g)(i)
s 9(2)(g)(i)

IN CONFIDENCE – NOT FOR DISTRIBUTION
9
Figure 1: Number of cases that have been whole genome sequenced and are genomically clustered
with the Auckland August cluster by sub-cluster as at 14 September 202017
Source: ESR *A sample may not have been received by ESR, may not have been sequenced yet or a sequencing result could not be
obtained from the sample received.
Contact tracing18 19. Since the 11 August, 4075 community close contacts have been identified and recorded
in the National Contact Tracing Solution, 4072 of these have been contacted and are
self-isolating, and we are in the process of contacting the rest.
Table 6: Close contact tracing recorded in the National Contact Tracing Solution since 11 August as at
0830 28 September 2020
25/09/2020 26/09/2020 27/09/2020 28/09/2020
Cumulative number of close
contacts identified1 4053 4177 4072 4075
Cumulative number of close
contacts successfully contacted 4050 4170 4069 4072
Number of close contacts
referred to "finding services"2 0 0 0 0
Number of close contacts
awaiting contact 3 7 3 3
1. Contacts loaded into the National Contact Tracing Solution, and managed by either the National Investigation and Tracing
Unit or the Public Health Units. Contacts from MIQ and overseas cases are not included in this report.
2. "Finding services" refers to the mechanism the National Close Contact Service uses to find valid contact details for close
contacts we do not have the correct contact details for. These services utilise internal Ministry of Health databases along with
Police, Customs and Airlines where relevant.
17 ESR email 1608 14 September 2020
18 COVID-19 NCCS Analytics and Reporting 0917 28 September 2020
0 5 10 15 20 25 30 35
Americold
Americold HH
Auckland Bus
Botany
Church 1
Church 2
Church 3
Finance Now
Finance Now HH
Household 1
Household 2
Household 3
MREF-Bereavement
GP
NZ Courier Post
Pending
Warehouse
Number of cases
Sequenced and genomically clustered Sequence not available*
s 9(2)(a)
s 9(2)(a)
s 9(2)(a)
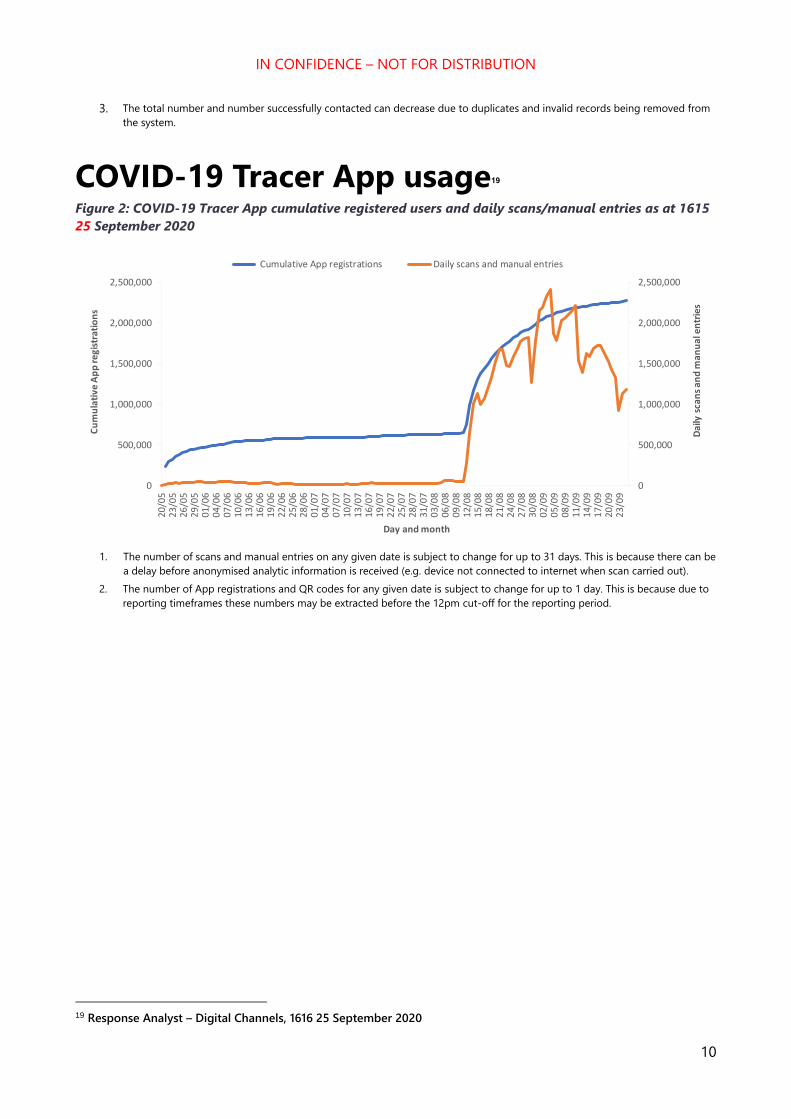
IN CONFIDENCE – NOT FOR DISTRIBUTION
10
3. The total number and number successfully contacted can decrease due to duplicates and invalid records being removed from
the system.
COVID-19 Tracer App usage19 Figure 2: COVID-19 Tracer App cumulative registered users and daily scans/manual entries as at 1615
25 September 2020
1. The number of scans and manual entries on any given date is subject to change for up to 31 days. This is because there can be
a delay before anonymised analytic information is received (e.g. device not connected to internet when scan carried out).
2. The number of App registrations and QR codes for any given date is subject to change for up to 1 day. This is because due to
reporting timeframes these numbers may be extracted before the 12pm cut-off for the reporting period.
19 Response Analyst – Digital Channels, 1616 25 September 2020
0
500,000
1,000,000
1,500,000
2,000,000
2,500,000
0
500,000
1,000,000
1,500,000
2,000,000
2,500,000
20/0
523
/05
26/0
529
/05
01/0
604
/06
07/0
610
/06
13/0
616
/06
19/0
622
/06
25/0
628
/06
01/0
704
/07
07/0
710
/07
13/0
716
/07
19/0
722
/07
25/0
728
/07
31/0
703
/08
06/0
809
/08
12/0
815
/08
18/0
821
/08
24/0
827
/08
30/0
802
/09
05/0
908
/09
11/0
914
/09
17/0
920
/09
23/0
9
Dai
ly s
can
s an
d m
anu
al e
ntr
ies
Cu
mu
lati
ve A
pp
regi
stra
tio
ns
Day and month
Cumulative App registrations Daily scans and manual entries

IN CONFIDENCE – NOT FOR DISTRIBUTION
11
Testing20 Table 7: Testing by functional groups, as at 0900 28 September 2020
*Numbers have been sourced from different data extracts in comparison to Table 7.
Laboratory testing numbers21 Table 8: Number of laboratory tests processed nationally as at 0900 28 September 2020
Testing supply update22
20. There are good levels of supplies available, with 278,208 tests available currently in the
labs. The Ministry of Health is continuing to work with major suppliers in order to meet
ongoing need.
20 ÉCLAIR/MoH Public Health Intelligence, 1000 27 September 2020
21 Daily Lab Report, 0844 28 September 2020
22 Testing supply email, 0920 28 September 2020
Reason for test 27 September 21–27 September
GPs and other primary health 2207 17,869
CBACs and pop-ups 619 14,302
Border workers - air crew 14 258
Border workers - airport staff 174 1208
Border workers - maritime crew 23 93
Border workers – Port of Tauranga staff 2 11
Border workers – Remaining Port staff 15 282
Border workers - MIF 184 1019
Border workers - MIQ 45 313
Travellers - Staying at MIF 256 2212
Travellers - Staying at MIQ 0 169
Total 3539 37,736*
Time period Number of laboratory tests
27 September 3,539
Last 7 days (21 Sep to 27 Sep) 37,533*
Total 951,954

IN CONFIDENCE – NOT FOR DISTRIBUTION
12
Community Testing Centres for the Christchurch returnee cluster23 Table 9: Number of CTCs available in relation to the Christchurch Returnee Outbreak as at 1000 25
September 2020
Lakes DHB Rotorua 2 Vaughan Rd • 9am – 4pm –
Thursday (24/9) -
Sunday (27/9)
Rotorua Pukatua st (note
change of
venue)
• 11am-4pm –
Monday (28/9)
• 9am-4pm – Tuesday
– Friday (29/9-2/10)
Taupo 79 Miro Street • 9am-4pm – Friday
(25/9) – Friday
(2/10)
Canterbury DHB Christchurch Orchard Road CBAC
(near Airport)
• Open 9am- 4pm 7
days a week
Christchurch Whanau Ora
Community Clinic
CBAC
(Wainoni)
• Open 9am- 4pm 7
days a week
Capital and
Coast DHB
On standby depending outcome of testing
Bay of Plenty
DHB
Healthline updates24 21. On 27 September there were 1,994 contacts in Healthline. Of those calls, 1,068 were to
the COVID-19 Info line. Demand on 1737 Need to talk? and other mental health services
was 574 contacts (lower than forecast).
22. The main themes on 26/27 September were:
o Ongoing calls relating to the exposure events.
o Healthline are continuing to see a higher than normal acuity (of non covid related
health issues) through Healthline and some of this is geographically focussed – i.e.
the wider Auckland region.
23 Testing Strategy Lead MoH, 1632 25 September
24 National Telehealth Service Coronavirus Update, 0923 28 September 2020

IN CONFIDENCE – NOT FOR DISTRIBUTION
13
o Increased level of people checking testing centre locations relating to the special
sites created at the end of last week.
o Most service users were calling because they are symptomatic and wanted to get a
test.
o Questions relating to what it means to be from Auckland and travel to a region at
Alert Level One for the school holidays.
Logistics
Health Workforce25
23. Upskilling of alternative workforces for testing continues to progress. Health Workforce
are currently engaged with Careerforce and DHBs to create a testing workforce training
and education package. This will be utilised by DHBs across the country, to increase the
pool of people who are able to perform COVID-19 testing. It is anticipated this package
will be released in the week of 12 October 2020.
24. Surge workforce requests continue to be monitored and responded to, with 3779
people listed on the surge as “available”.
25. Health Workforce are monitoring staffing needs in MIFs facilities and are providing
support where possible.
Hospital capacity26 Table 10: Number and occupancy of hospital beds by type as at 0800 28 September 2020
Type Number of units Number (%) occupied/in use
ICU and HDU beds 307 196 (63.8%)
Ventilators 272 42 (15.4%)
Ward beds 6775 5292 (78.1%)
25 Health Workforce Directorate, 0853 28 September 2020
26 COVID-19 Hospital Summary, 0913 28 September 2020

14
IN CONFIDENCE – NOT FOR DISTRIBUTION
Appendix 1: Case summary Table 11: All new community cases reported between 0900 27 September and 0900 28 September. Source: ESR EpiSurv Extract 0900 28 September 2020
Cumulative
Number
Date tested
positive Onset date Case status DHB Sex Age Ethnicity
Symptoms
[Yes/No] Hospitalised Occupation
Source of
transmission

IN CONFIDENCE – NOT FOR DISTRIBUTION
15
Appendix 2: COVID-19 Provisional Disease Indicators, by date
of case notification18 Table 12: NCTS data for cases in the community - Please note, National Investigation and Tracing Centre are working through data quality issues, so
will not be reporting the metrics this morning.
Indicator (as per Table
9832) Refined Indicator description Target 13 Sept ** 14 Sept
** 15 Sept ** 16 Sept ** 17 Sept **
18 Sept **
19 Sept **
1 - (S001) Time from exposure to contact isolation / quarantine 80% within 96 hours - - - - - - -
2 – (S002) Time from case first symptom to contact isolation / quarantine 80% within 96 hours - - - - - - -
3 – (S003) Time from test sample taken to close contact isolation / quarantine 80% within 72 hours - 100% - - - - -
4 – (C001) Time from first symptom to test sample taken for positive cases 80% within 48 hours - - - - - 100% -
5 – (L001) Time from test sample taken to notification of positive result 80% within 24 hours - 0% - - - 100% 100%
6 – (P002) Time from case notification to isolation / quarantine of contact 80% within 48 hours - 100% - - - 84% -
7 – (P001) Time from notification to case interview 80% within 24 hours - 100% - - - 100% 100%
8 – (P003) Time from close contact identification to isolated / quarantined 80% within 24 hours - 100% - - - 83% 100%
10 – (P004) Proportion of contacts traced in 48 hours 80% within 48 hours - 100% - - - 84% -
C – (S005) Proportion of close contacts with confirmed or suspected COVID-19 at the time of tracing <20% - 0% - - - 7% 0%
• * The numerator and denominator are provided in some instances to provide context for low percentages.
• **Data is not available for metrics where there is no data that meets the definition, or where the time/days to reach target has not fully elapsed
• The value of P002 can drop due to the addition of new close contacts to exposure events after the 48-hour period since case notification had elapsed. This can happen for a number of reasons, including a case recalling further details following the original case
interview.
• These metrics report all cases during the specified period, including those in Managed Isolation and Quarantine, and do not include casual contacts.
• There are three additional indicators under development requiring both technical and clinical input to define data requirements. These are due to be completed by end October 2020.

IN CONFIDENCE – NOT FOR DISTRIBUTION
16
Table 13:NCTS data for cases in the community Managed Isolation and Quarantine, International, and Unknown
Indicator (as per Table 9832) Refined Indicator description Target 13 Sept ** 14 Sept 15 Sept ** 16 Sept 17 Sept ** 18 Sept ** 19 Sept **
1 - (S001) Time from exposure to contact isolation / quarantine
80% within 96 hours - 100% - 38% - - -
2 – (S002) Time from case first symptom to contact isolation / quarantine
80% within 96 hours - 100% - 38% - - -
3 – (S003) Time from test sample taken to close contact isolation / quarantine
80% within 72 hours - 100% - 100% 100% - -
4 – (C001) Time from first symptom to test sample taken for positive cases
80% within 48 hours - 33% - 50% - - -
5 – (L001) Time from test sample taken to notification of positive result
80% within 24 hours - 0% - 71% 0% 100% 50%
6 – (P002) Time from case notification to isolation / quarantine of contact
80% within 48 hours - 100% - 100% 100% - -
7 – (P001) Time from notification to case interview 80% within 24 hours - 75% - 58% 100% 100% 100%
8 – (P003) Time from close contact identification to isolated / quarantined
80% within 24 hours - 100% - 100% 100% - 100%
10 – (P004) Proportion of contacts traced in 48 hours 80% within 48 hours - 100% - 100% 100% - -
C – (S005) Proportion of close contacts with confirmed or suspected COVID-19 at the time of tracing
<20%
- 0% - 0% 0% - 0%
Note:
• * The numerator and denominator are provided in some instances to provide context for low percentages.
• **Data is not available for metrics where there is no data that meets the definition, or where the time/days to reach target has not fully elapsed
• The value of P002 can drop due to the addition of new close contacts to exposure events after the 48-hour period since case notification had elapsed. This can happen for a number of reasons, including a case recalling further details following the original case
interview.
• These metrics report all cases during the specified period, including those in Managed Isolation and Quarantine, and do not include casual contacts.
• There are three additional indicators under development requiring both technical and clinical input to define data requirements. These are due to be completed by end October 2020.

17
IN CONFIDENCE – NOT FOR DISTRIBUTION
Appendix 3: NRHCC Testing Report
Novel Coronavirus (COVID-19)
Issued: 1700 25 September
Please note this report is not run on the weekends Table 14: Metro Auckland Summary Total of Testing for 25 September 2020
Community MIQ
staff
MIQ
guests
Airport Maritime port Ship’s
Crew
TOTAL
25/09/2020 732 104 525 102 39 0 1502
Table 15: Estimated tests taken since 12 August 2020, based on manual site reports at 5pm
Site 12/08-
16/08
17/08-
23/08
24/08 –
30/08
31/08 –
06/09
07/09 –
13/09
14/09 –
20/09
21/09 22/09 23/09 24/09 25/09
*
MIQ Staff 2132 659 1488 912 1086 908 136 246 187 184 104
Guests 2972 3767 3600 3406 3424 3843 599 600 543 447 525
Border Airport 2129 933 1349 1158 853 951 112 121 173 167 102
Port 1588 678 161 392 153 320 49 16 34 59 39
Crew 0 0 0 0 0 0 0 0 0 21 0
*25/09 day still in progress
Table 16: Estimated tests taken at Metro Auckland CTCs, since 12 August 2020, based on manual site reports at 4pm
Site 12/08-
16/08
17/08-
23/08
24/08
–
30/08
31/08
–
06/09
07/09
–
13/09
14/09
–
20/09
21/09 22/
09
23/0
9
24/0
9
25/0
9*
Airport Oaks 1148 515 366 265 181 152 18 25 23 15 14
Botany CTC 1151 948 905 749 681 802 99 93 74 74 79
Health New
Lynn 2603 1258 1703 732 889 621 102 66 73 61
66
Mangere Town
Centre 1748 1684 1599 860 660 487 70 45 55 44
31
Otara CTC 3221 1712 1429 930 699 938 65 61 67 65 52
St Lukes 1368 1045 1414 797 666 830 158 101 104 105 128

IN CONFIDENCE – NOT FOR DISTRIBUTION
18
Takanini
Urgent Care 1886 1216 1153 684 440 487 65 61 40 50
50
Whanau
House 2502 1371 1442 928 1613 870 129 126 88 80
71
Whanau Ora -
Central 1957 964 1583 937 783 470 75 64 71 65
63
Whanau Ora -
North 1442 669 637 982 947 907 113 119 112 105
66
Whanau Ora -
South 2945 1250 718 677 620 470 66 62 29 55
54
Takanini Pop
Up N/A N/A N/A N/A N/A N/A 17 25 22 5
11
Glen Eden Pop
Up N/A N/A N/A N/A N/A N/A N/A N/A 20 25
11
Henderson
Pop Up N/A N/A N/A N/A N/A N/A N/A N/A 11 13
No
data
Beach haven
Pop Up N/A N/A N/A N/A N/A N/A N/A N/A N/A 14
19
Waipuna
Targeted Site 143 549 376 219 251 220 28 34 30 28
15
Henderson
Targeted Site N/A N/A N/A N/A 631 93 1 2 2 3
2
Total 26,148 16,781 21,356 13,002 10,475 8,832 1,020 896 843 768 732
*25/09 day still in progress; N/A = not open as a CTC; Previous sites that are no longer open are not included
in this report
CTCs and mobile testing site locations
Please see https://www.arphs.health.nz/public-health-topics/covid-19/where-to-get-tested for the most up-
to-date information on CTCs and mobile testing sites in the Auckland region.

IN CONFIDENCE – NOT FOR DISTRIBUTION
19
Appendix 4: Testing by DHB and ethnicity The tables that follow are the number of people tested. The numbers in the laboratory testing
section are the number of laboratory tests processed.
Table 17: Number of people tested for COVID-19 from 12 August to 27 September
Prioritised ethnicity MPAO
DHB of domicile Māori Pacific Asian Other Unknown Total
Auckland 3900 7755 11,047 23,251 519 46,472
Bay of Plenty 2970 398 718 7636 76 11,798
Canterbury 1841 731 2191 15,816 278 20,857
Capital and Coast 1731 1445 1764 11,323 276 16,539
Counties Manukau 8530 22,335 10,900 14,718 499 56,982
Hawkes Bay 1624 351 266 4131 74 6446
Hutt Valley 954 619 688 3769 56 6086
Lakes 2568 319 523 3692 119 7221
MidCentral 1210 293 462 4862 114 6941
Nelson Marlborough 692 264 333 5127 72 6488
Northland 3416 232 316 4753 60 8777
South Canterbury 160 46 95 1950 31 2282
Southern 1299 445 941 11,857 116 14,658
Tairāwhiti 993 63 72 924 23 2075
Taranaki 778 81 205 3156 73 4293
Waikato 4950 1100 1850 11,872 296 20,068
Wairarapa 272 52 57 1389 13 1783
Waitematā 5449 5907 9829 29,797 438 51,420
West Coast 50 11 13 387 8 469
Whanganui 691 85 81 1623 19 2499
Unknown 1630 784 896 5108 2774 11,192
Total 45,708 43,316 43,247 167,142 5934 305,347

20
IN CONFIDENCE – NOT FOR DISTRIBUTION
Table 18: Rate per 1000 people tested for COVID-19 from 12 August to 27 September
Prioritised ethnicity MPAO
DHB of domicile Māori Pacific Asian Other Total
Auckland 89.7 138.3 59 88.9 84.8
Bay of Plenty 49.7 89.5 36.6 48.5 48.9
Canterbury 35.1 51.5 36.1 35.4 36.4
Capital and Coast 47.4 65.2 35.1 53.2 51.4
Counties Manukau 95.8 186 72.1 70.3 100.1
Hawkes Bay 37.5 54.7 29 38.2 38.6
Hutt Valley 36.6 53 36.7 40 40.4
Lakes 66.7 124.9 53.8 61.6 65.2
MidCentral 33.3 52.8 29.8 39.3 38.3
Nelson Marlborough 43.1 106.8 44.9 40.7 42.7
Northland 56.1 61.7 38.2 43.6 48.3
South Canterbury 30.1 94.2 40.1 37.7 38.1
Southern 38.7 64.6 36.5 44.3 43.9
Tairāwhiti 40.1 56.4 61.7 41.8 42.2
Taranaki 33.3 58.2 32.9 35.1 35.5
Waikato 51.3 82.5 41.9 44.1 47.4
Wairarapa 34.1 62.5 45.7 38.9 39
Waitematā 87.1 132.5 68.4 77.9 81.2
West Coast 12.9 43.5 14.1 14.3 14.6
Whanganui 39.8 55.9 27.7 37.7 38.5
Total 58.8 135.4 56.4 54 61.6

1
IN CONFIDENCE – NOT FOR DISTRIBUTION
SITREP 067
Coronavirus disease 2019 (COVID-19)
Issued: 1030 hours 29 September 2020
Information current at: 1000 hours
This report provides a daily update on the COVID-19 health system response. New information is denoted by red text.
Please use the single point of contact email [email protected] for help/support. Your email will be
logged and promptly passed to the appropriate team.
This document is classified IN CONFIDENCE and not for further distribution.
Need to know
COMMUNITY CASES
NEW LAST 24 hrs
0
IMPORTED MIQ CASES
NEW LAST 24 hrs
2
COMMUNITY CASES
TOTAL RECOVERED
158
137
COMMUNITY CASES
ACTIVE
26 TOTAL CASES SINCE 11 AUG
187
29 TOTAL IMPORTED MIQ CASES
166
TOTAL ACTIVE CASES IN NZ (COMMUNITY & MIQ): 55
IMPORTED MIQ CASES
TOTAL RECOVERED
IMPORTED MIQ CASES
ACTIVE
LABORATORY TESTS
LAST 24 hrs
3,636
LABORATORY TESTS
LAST SEVEN DAYS
37,891
LABORATORY TESTS
TOTAL
955,590
CASES DECEASED
3

IN CONFIDENCE – NOT FOR DISTRIBUTION
2
Total COVID-19 cases
Table 1: Total number of COVID-19 cases as at 0900 29 September 20201
Case status Active Recovered Deceased Total
Confirmed 55* 1404 (+2) 20 1479 (+2)
Probable 0 351 5 356
Total 55* 1755 (+2) 25 1835 (+2)
*2 newly identified cases, 2 cases classified as recovered.
New cases in New Zealand since 0900 28 September 2020, as at 0900 29 September2
Imported in MIQ facilities
1. Two new cases have been detected at the border. In total 166 cases have been
detected at the border since the establishment of MIQ facilities.
o One case arrived on 23 September from Pakistan via UAE. Managed isolation in
Waikato transferred to Auckland Jet Park facility.
o One case arrived on 23 September from Ukraine via UAE. Managed isolation in
Waikato transferred to Auckland Jet Park facility.
Community
2. No new community cases have been reported. It has been four days since the last
community case was reported.
Historic cases
3. No new historic cases have been reported.
Total community cases by DHB since 11 August
Table 2: Community cases by DHB and case status as at 0900 29 September 20203
1 EpiSurv Database, 0900 29 September 2020
2 EpiSurv Database, 0900 29 September 2020
3 EpiSurv Database, 0900 29 September 2020
Case Status Counties Manukau Waitematā Auckland Waikato Total
Confirmed 79 56 50 1 186
Probable 1 0 0 0 1
Total 80 56 50 1 187

IN CONFIDENCE – NOT FOR DISTRIBUTION
3
Total community cases by outbreak since 11 August4
Table 3: Community cases by Outbreak as at 0900 29 September 20205
Community cases and household contacts at Jet Park
4. As at 0800 29 September there are 18 people isolating in Jet Park from the community.
9 are confirmed cases, the remaining 9 are household contacts. This number will
decrease as people finish their isolation and depart from the facility.6
Cases in hospital
5. One case in hospital with COVID-19 as at 0800 29 September.7
Table 4: Number of cases in hospital with COVID-19 by DHB as at 0800 29 September 2020
4 EpiSurv Database, 0900 29 September 2020
5 EpiSurv Database, 0900 29 September 2020
6 NRHCC Morning Report, 0900 29 September 2020
7 NRHCC Morning Report, 0900 29 September 2020
Outbreak New cases (last 24
hrs)
Total cases Active cases
remaining
Auckland August 0 179 20
Christchurch Returnees 0 6 6
Rydges Hotel (MIF) 0 1 0
Under Investigation (
0 1 0
Total 0 187 26
DHB Hospital Number in a general ward Number in ICU/HDU
Auckland Auckland City 0 0
Waitematā North Shore 0 0
Counties Manukau Middlemore 1 0
Total - 1 0
s 9(2)(a)

IN CONFIDENCE – NOT FOR DISTRIBUTION
4
Health system response
Overall approach
6. Our investigation has two main focus areas that run in parallel:
o Source attribution – a focus on investigating the case with the earliest symptom
onset date to gather details actions of movements 14 days prior. This will help to
understand the possible source of the new outbreak.
o Containment – rigorous case investigation, identification of close contacts and
isolation and testing to ensure that chain of transmission is broken.
o Case classification –has been established to consider cases with high CT counts will
be investigated by an expert panel to determine their status and develop a protocol
for reporting, management, and investigation of potentially historic infections.
Current outbreak investigation priorities8
o Follow up of Christchurch Returnees cases and settings of interest.
o Ongoing management of Auckland August outbreak.
Settings of interest9
7. Christchurch to Auckland Charter flight and related Christchurch MIF cases.
8. Settings of interest for the Christchurch Returnees outbreak include
o A supermarket and two retail stores in Auckland.
o Several locations outside of Auckland, which have been identified and are being
followed up by the relevant PHUs.
9. No new settings of interest have been identified.
Case investigation Christchurch Returnee Outbreak –
10. A case reported on 19 September is a returnee who arrived in New Zealand on 27
August and completed managed isolation in Christchurch. The case tested negative on
day 3 and day 12. They left managed isolation on 11 September and returned home to
Auckland on a charter flight from Christchurch. They were tested after developing
symptoms on 16 September and returned a positive result on 18 September. The case
and their two household contacts (both reported as confirmed cases on 19 September)
were transferred to the Auckland Jet Park quarantine facility on 18 September.
Source of infection is still under
investigation.
8NRHCC Morning Report, 0900 29 September 2020
9 NRHCC Morning Report, 0845 24 September 2020
10 ESR email update 09.24 27 September 2020
s 9(2)(a)
s 9(2)(g)(i)

IN CONFIDENCE – NOT FOR DISTRIBUTION
5
11. Three cases from the same family unit tested positive on 22 September. Two cases were
tested because they were passengers on the chartered flight
and the third case is a household contact
The family has
been in isolation since 20 September. Genomes have been sequenced and all three
cases are part of the B.1.36 lineage and are closely matched to other cases epi-linked to
the Christchurch Returnees outbreak.11 Source investigation continues12. The family
visited Tāupo from 18 to 20 September and met parties from across the country.
They also had dinner with a family of outside of the Tāupo trip. All parties
who were contacts of these cases have been tested and are self-isolating. All PHUs with
responsibility for close contacts have reported good compliance with isolation
requirements.13. Contact Tracing and testing results can be seen in Table 5.
12. All passengers on the Christchurch to Auckland charter flight have been tested, except
one. Of those tested no results are pending and the rest are negative.
Case investigation Auckland August Outbreak -
13. Source investigation for an epidemiological link to the main cluster for four cases who
have been genomically linked to the main cluster is ongoing:
o The
o GP
o The second Mount Albert Grammar student
o The Botany case
11 ESR email update 09.24 27 September 2020
12 End of day update, Chief Advisor public health, 25 September 1700.
13 PHU MOH phone call, 1000 25 September
s 9(2)(a)
s 9(2)(a)
s 9(2)(a)
s 9(2)(a) s 9(2)(a)
s 9(2)(a)
s 9(2)(a)
s 9(2)(a)
s 9(2)(a)

6
IN CONFIDENCE – NOT FOR DISTRIBUTION
s 9(2)(a)
s 9(2)(a)

IN CONFIDENCE – NOT FOR DISTRIBUTION
7
s 9(2)(a)

8
IN CONFIDENCE – NOT FOR DISTRIBUTION
ESR and wider testing14 14. A total of 172 cases (96%) from the Auckland community cluster have now been
sequenced, of which 143 (80%) yielded a high quality genome. The remaining cases did
not have sufficient genetic material to be sequenced reliably. All cases are part of the
same B1.1.1 lineage and genomic cluster and the subsequent mutations observed are
consistent with the epidemiological sub-groupings.
15.
16. Ongoing analysis of the whole genome sequencing results is being used to show how
COVID-19 has been transmitted through the community cluster and to further inform
its management.
17. No direct links have been found between the community outbreak genome
sequencing, and the 71 full genomes (52 high quality) currently available from cases
detected in border arrivals in managed isolation facilities (MIFs). There has been one
case in a health worker at a managed isolation facility. WGS results indicate that this
case is genomically linked to the Auckland community cluster and clustered closely with
three community cases in the managed isolation facility (as discussed in para 8).
18. Genome sequencing on cases from the Christchurch returnees cluster
has also been completed, all cases are part of the B1.36 lineage.
19.
14 ESR Whole Genome Sequencing Report, Email 0927 29 September 2020
s 9(2)(g)(i)
s 9(2)(g)(i)
s 9(2)(a)

IN CONFIDENCE – NOT FOR DISTRIBUTION
9
Figure 1: Number of cases that have been whole genome sequenced and are genomically clustered
with the Auckland August cluster by sub-cluster as at 14 September 202015
Source: ESR *A sample may not have been received by ESR, may not have been sequenced yet or a sequencing result could not be
obtained from the sample received.
Contact tracing16 20. Since the 11 August, 4079 community close contacts have been identified and recorded
in the National Contact Tracing Solution, all of these have been contacted and are self-
isolating.
Table 6: Close contact tracing recorded in the National Contact Tracing Solution since 11 August as at
0830 29 September 2020
26/09/2020 27/09/2020 28/09/2020 29/09/2020
Cumulative number of close
contacts identified1 4177 4072 4075 4079
Cumulative number of close
contacts successfully contacted 4170 4069 4072 4079
Number of close contacts
referred to "finding services"2 0 0 0 0
Number of close contacts
awaiting contact 7 3 3 0
1. Contacts loaded into the National Contact Tracing Solution, and managed by either the National Investigation and Tracing
Unit or the Public Health Units. Contacts from MIQ and overseas cases are not included in this report.
2. "Finding services" refers to the mechanism the National Close Contact Service uses to find valid contact details for close
contacts we do not have the correct contact details for. These services utilise internal Ministry of Health databases along with
Police, Customs and Airlines where relevant.
15 ESR email 1608 14 September 2020
16 COVID-19 NCCS Analytics and Reporting 0819 29 September 2020
0 5 10 15 20 25 30 35
Americold
Americold HH
Auckland Bus
Botany
Church 1
Church 2
Church 3
Finance Now
Finance Now HH
Household 1
Household 2
Household 3
MREF-Bereavement
GP
NZ Courier Post
Pending
Warehouse
Number of cases
Sequenced and genomically clustered Sequence not available*
s 9(2)(a)
s 9(2)(a)
s 9(2)(a)

IN CONFIDENCE – NOT FOR DISTRIBUTION
10
3. The total number and number successfully contacted can decrease due to duplicates and invalid records being removed from
the system.
COVID-19 Tracer App usage17 Figure 2: COVID-19 Tracer App cumulative registered users and daily scans/manual entries as at 1615
28 September 2020
1. The number of scans and manual entries on any given date is subject to change for up to 31 days. This is because there can be
a delay before anonymised analytic information is received (e.g. device not connected to internet when scan carried out).
2. The number of App registrations and QR codes for any given date is subject to change for up to 1 day. This is because due to
reporting timeframes these numbers may be extracted before the 12pm cut-off for the reporting period.
17 Response Analyst – Digital Channels, 1625 28 September 2020
0
500,000
1,000,000
1,500,000
2,000,000
2,500,000
0
500,000
1,000,000
1,500,000
2,000,000
2,500,000
20/
05
23/
05
26/
05
29/
05
01/
06
04/
06
07/
06
10/
06
13/
06
16/
06
19/
06
22/
06
25/
06
28/
06
01/
07
04/
07
07/
07
10/
07
13/
07
16/
07
19/
07
22/
07
25/
07
28/
07
31/
07
03/
08
06/
08
09/
08
12/
08
15/
08
18/
08
21/
08
24/
08
27/
08
30/
08
02/
09
05/
09
08/
09
11/
09
14/
09
17/
09
20/
09
23/
09
26/
09
Dai
ly s
can
s an
d m
anu
al e
ntr
ies
Cu
mu
lati
ve A
pp
re
gist
rati
on
s
Day and month
Cumulative App registrations Daily scans and manual entries

IN CONFIDENCE – NOT FOR DISTRIBUTION
11
Testing18 Table 7: Testing by functional groups, as at 0900 28 September 2020
*Numbers have been sourced from different data extracts in comparison to Table 7.
Laboratory testing numbers19 Table 8: Number of laboratory tests processed nationally as at 0900 29 September 2020
Testing supply update20
21. There are good levels of supplies available, with 278,208 tests available currently in the
labs. The Ministry of Health is continuing to work with major suppliers in order to meet
ongoing need.
18 ÉCLAIR/MoH Public Health Intelligence, 1000 27 September 2020
19 Daily Lab Report, 0826 29 September 2020
20 Testing supply email, 0920 28 September 2020
Reason for test 27 September 21–27 September
GPs and other primary health 2207 17,869
CBACs and pop-ups 619 14,302
Border workers - air crew 14 258
Border workers - airport staff 174 1208
Border workers - maritime crew 23 93
Border workers – Port of Tauranga staff 2 11
Border workers – Remaining Port staff 15 282
Border workers - MIF 184 1019
Border workers - MIQ 45 313
Travellers - Staying at MIF 256 2212
Travellers - Staying at MIQ 0 169
Total 3539 37,736*
Time period Number of laboratory tests
28 September 3,636
Last 7 days (22 Sep to 28 Sep) 37,891*
Total 955,590

IN CONFIDENCE – NOT FOR DISTRIBUTION
12
Community Testing Centres for the Christchurch returnee cluster21 Table 9: Number of CTCs available in relation to the Christchurch Returnee Outbreak as at 1000 25
September 2020
Lakes DHB Rotorua 2 Vaughan Rd • 9am – 4pm – Thursday
(24/9) -Sunday (27/9)
Rotorua Pukatua st (note change
of venue)
• 11am-4pm – Monday (28/9)
• 9am-4pm – Tuesday –
Friday (29/9-2/10)
Taupo 79 Miro Street • 9am-4pm – Friday (25/9) –
Friday (2/10)
Canterbury DHB Christchurch Orchard Road CBAC
(near Airport)
• Open 9am- 4pm 7 days a
week
Christchurch Whanau Ora Community
Clinic CBAC
(Wainoni)
• Open 9am- 4pm 7 days a
week
Capital and
Coast DHB
On standby depending outcome of testing
Bay of Plenty
DHB
Healthline updates22 22. On 28 September there were 2,053 contacts in Healthline. Of those calls, 968 were to
the COVID-19 Info line. Demand on 1737 Need to talk? and other mental health services
was 641 contacts (in line forecast).
23. The main themes on 27/28 September were:
o Ongoing calls relating to the exposure events.
o Healthline are continuing to see a higher than normal acuity (of non covid related
health issues) through Healthline and some of this is geographically focussed – i.e.
the wider Auckland region.
o Increased level of people checking testing centre locations relating to the special
sites created at the end of last week.
o Questions relating to travel between alert levels.
o Most service users were calling because they are symptomatic and wanted to get a
test.
21 Testing Strategy Lead MoH, 1632 25 September
22 National Telehealth Service Coronavirus Update, 0923 28 September 2020

IN CONFIDENCE – NOT FOR DISTRIBUTION
13
Logistics
Health Workforce23
24. Upskilling of alternative workforces for testing continues to progress. Health Workforce
are currently engaged with Careerforce and DHBs to create a testing workforce training
and education package. This will be utilised by DHBs across the country, to increase the
pool of people who are able to perform COVID-19 testing. It is anticipated this package
will be released in the week of 12 October 2020.
25. Surge workforce requests continue to be monitored and responded to, with 3779
people listed on the surge as “available”.
26. Health Workforce are monitoring staffing needs in MIFs facilities and are providing
support where possible.
Hospital capacity24 Table 10: Number and occupancy of hospital beds by type as at 0800 29 September 2020
Type Number of units Number (%) occupied/in use
ICU and HDU beds 339 212 (62.5%)
Ventilators 297 48 (16.2%)
Ward beds 7193 5865 (81.5%)
23 Health Workforce Directorate, 0853 28 September 2020
24 COVID-19 Hospital Summary, 0918 29 September 2020

14
IN CONFIDENCE – NOT FOR DISTRIBUTION
Appendix 1: Case summary Table 11: All new community cases reported between 0900 28 September and 0900 29 September. Source: ESR EpiSurv Extract 0900 29 September 2020
Cumulative
Number
Date tested
positive Onset date Case status DHB Sex Age Ethnicity
Symptoms
[Yes/No] Hospitalised Occupation
Source of
transmission

IN CONFIDENCE – NOT FOR DISTRIBUTION
15
Appendix 2: COVID-19 Provisional Disease Indicators, by date
of case notification16 Table 12: NCTS data for cases in the community - Please note, National Investigation and Tracing Centre are working through data quality issues, so
will not be reporting the metrics this morning.
Indicator (as per Table
9832) Refined Indicator description Target 13 Sept ** 14 Sept
** 15 Sept ** 16 Sept ** 17 Sept **
18 Sept **
19 Sept **
1 - (S001) Time from exposure to contact isolation / quarantine 80% within 96 hours - - - - - - -
2 – (S002) Time from case first symptom to contact isolation / quarantine 80% within 96 hours - - - - - - -
3 – (S003) Time from test sample taken to close contact isolation / quarantine 80% within 72 hours - 100% - - - - -
4 – (C001) Time from first symptom to test sample taken for positive cases 80% within 48 hours - - - - - 100% -
5 – (L001) Time from test sample taken to notification of positive result 80% within 24 hours - 0% - - - 100% 100%
6 – (P002) Time from case notification to isolation / quarantine of contact 80% within 48 hours - 100% - - - 84% -
7 – (P001) Time from notification to case interview 80% within 24 hours - 100% - - - 100% 100%
8 – (P003) Time from close contact identification to isolated / quarantined 80% within 24 hours - 100% - - - 83% 100%
10 – (P004) Proportion of contacts traced in 48 hours 80% within 48 hours - 100% - - - 84% -
C – (S005) Proportion of close contacts with confirmed or suspected COVID-19 at the time of tracing <20% - 0% - - - 7% 0%
• * The numerator and denominator are provided in some instances to provide context for low percentages.
• **Data is not available for metrics where there is no data that meets the definition, or where the time/days to reach target has not fully elapsed
• The value of P002 can drop due to the addition of new close contacts to exposure events after the 48-hour period since case notification had elapsed. This can happen for a number of reasons, including a case recalling further details following the original case
interview.
• These metrics report all cases during the specified period, including those in Managed Isolation and Quarantine, and do not include casual contacts.
• There are three additional indicators under development requiring both technical and clinical input to define data requirements. These are due to be completed by end October 2020.

IN CONFIDENCE – NOT FOR DISTRIBUTION
16
Table 13:NCTS data for cases in the community Managed Isolation and Quarantine, International, and Unknown
Indicator (as per Table 9832) Refined Indicator description Target 13 Sept ** 14 Sept 15 Sept ** 16 Sept 17 Sept ** 18 Sept ** 19 Sept **
1 - (S001) Time from exposure to contact isolation / quarantine
80% within 96 hours - 100% - 38% - - -
2 – (S002) Time from case first symptom to contact isolation / quarantine
80% within 96 hours - 100% - 38% - - -
3 – (S003) Time from test sample taken to close contact isolation / quarantine
80% within 72 hours - 100% - 100% 100% - -
4 – (C001) Time from first symptom to test sample taken for positive cases
80% within 48 hours - 33% - 50% - - -
5 – (L001) Time from test sample taken to notification of positive result
80% within 24 hours - 0% - 71% 0% 100% 50%
6 – (P002) Time from case notification to isolation / quarantine of contact
80% within 48 hours - 100% - 100% 100% - -
7 – (P001) Time from notification to case interview 80% within 24 hours - 75% - 58% 100% 100% 100%
8 – (P003) Time from close contact identification to isolated / quarantined
80% within 24 hours - 100% - 100% 100% - 100%
10 – (P004) Proportion of contacts traced in 48 hours 80% within 48 hours - 100% - 100% 100% - -
C – (S005) Proportion of close contacts with confirmed or suspected COVID-19 at the time of tracing
<20%
- 0% - 0% 0% - 0%
Note:
• * The numerator and denominator are provided in some instances to provide context for low percentages.
• **Data is not available for metrics where there is no data that meets the definition, or where the time/days to reach target has not fully elapsed
• The value of P002 can drop due to the addition of new close contacts to exposure events after the 48-hour period since case notification had elapsed. This can happen for a number of reasons, including a case recalling further details following the original case
interview.
• These metrics report all cases during the specified period, including those in Managed Isolation and Quarantine, and do not include casual contacts.
• There are three additional indicators under development requiring both technical and clinical input to define data requirements. These are due to be completed by end October 2020.

17
IN CONFIDENCE – NOT FOR DISTRIBUTION
Appendix 3: NRHCC Testing Report
Novel Coronavirus (COVID-19)
Issued: 1700 28 September
Table 14: Metro Auckland Summary Total of Testing for 28 September 2020
Community MIQ
staff
MIQ
guests
Airport Maritime port Ship’s
Crew
TOTAL
26/09/2020 550 105 536 80 11 0 1282
27/09/2020 558 145 569 88 No Testing 0 1360
28/09/2020 685 89 454 129 76 0 1433
Table 15: Estimated tests taken since 12 August 2020, based on manual site reports at 5pm
Site 12/08-
16/08
17/08-
23/08
24/08 –
30/08
31/08 –
06/09
07/09 –
13/09
14/09 –
20/09
21/09
–
27/09
26/09 27/09 28/09*
MIQ Staff 2132 659 1488 912 1086 908 1136 105 145 89
Guests 2972 3767 3600 3406 3424 3843 3819 536 569 454
Border Airport 2129 933 1349 1158 853 951 843 80 88 129
Port 1588 678 161 392 153 320 208 11 0 76
Crew 0 0 0 0 0 0 21 0 0 0
*28/09 day still in progress
Table 16: Estimated tests taken at Metro Auckland CTCs, since 12 August 2020, based on manual site reports at 4pm
Site 12/08-
16/08
17/08-
23/08
24/08 –
30/08
31/08 –
06/09
07/09 –
13/09
14/09 –
20/09
21/09 –
27/09
26/09 27/09 28/09
*
Airport Oaks 1148 515 366 265 181 152 118 8 15 21
Botany CTC 1151 948 905 749 681 802 526 65 42 63
Health New
Lynn 2603 1258 1703 732 889 621 451 38 45 44
Mangere
Town Centre 1748 1684 1599 860 660 487 300 29 26 45
Otara CTC 3221 1712 1429 930 699 938 428 59 41 47
St Lukes 1368 1045 1414 797 666 830 793 73 124 85

IN CONFIDENCE – NOT FOR DISTRIBUTION
18
Takanini
Urgent Care 1886 1216 1153 684 440 487 313 17 30 44
Whanau
House 2502 1371 1442 928 1613 870 594 66 34 74
Whanau Ora
- Central 1957 964 1583 937 783 470 465 52 71 42
Whanau Ora
- North 1442 669 637 982 947 907 633 59 55 85
Whanau Ora
- South 2945 1250 718 677 620 470 310 18 19 36
Papakura
Pop Up N/A N/A N/A N/A N/A N/A N/A N/A N/A 13
Te Atatu Pop
Up N/A N/A N/A N/A N/A N/A N/A N/A N/A 48
West
Harbour Pop
Up
N/A N/A N/A N/A N/A N/A N/A N/A N/A 9
Mangere Pop
Up N/A N/A N/A N/A N/A N/A 66 16 16 N/A
Beach Haven
Pop Up N/A N/A N/A N/A N/A N/A 38 5 N/A N/A
Manukau
Pop Up N/A N/A N/A N/A N/A N/A 29 29 N/A N/A
Waipuna
Targeted Site 143 549 376 219 251 220 186 15 36 28
Henderson
Targeted Site N/A N/A N/A N/A 631 93 15 1 4 1
Total 26,148 16,781 21,356 13,002 10,475 8,832 5436 550 558 685
*28/09 day still in progress; N/A = not open as a CTC; Previous sites that are no longer open are not included
in this report
CTCs and mobile testing site locations
Please see https://www.arphs.health.nz/public-health-topics/covid-19/where-to-get-tested for the most up-
to-date information on CTCs and mobile testing sites in the Auckland region.

IN CONFIDENCE – NOT FOR DISTRIBUTION
19
Appendix 4: Testing by DHB and ethnicity The tables that follow are the number of people tested. The numbers in the laboratory testing
section are the number of laboratory tests processed.
Table 17: Number of people tested for COVID-19 from 12 August to 27 September
Prioritised ethnicity MPAO
DHB of domicile Māori Pacific Asian Other Unknown Total
Auckland 3900 7755 11,047 23,251 519 46,472
Bay of Plenty 2970 398 718 7636 76 11,798
Canterbury 1841 731 2191 15,816 278 20,857
Capital and Coast 1731 1445 1764 11,323 276 16,539
Counties Manukau 8530 22,335 10,900 14,718 499 56,982
Hawkes Bay 1624 351 266 4131 74 6446
Hutt Valley 954 619 688 3769 56 6086
Lakes 2568 319 523 3692 119 7221
MidCentral 1210 293 462 4862 114 6941
Nelson Marlborough 692 264 333 5127 72 6488
Northland 3416 232 316 4753 60 8777
South Canterbury 160 46 95 1950 31 2282
Southern 1299 445 941 11,857 116 14,658
Tairāwhiti 993 63 72 924 23 2075
Taranaki 778 81 205 3156 73 4293
Waikato 4950 1100 1850 11,872 296 20,068
Wairarapa 272 52 57 1389 13 1783
Waitematā 5449 5907 9829 29,797 438 51,420
West Coast 50 11 13 387 8 469
Whanganui 691 85 81 1623 19 2499
Unknown 1630 784 896 5108 2774 11,192
Total 45,708 43,316 43,247 167,142 5934 305,347

20
IN CONFIDENCE – NOT FOR DISTRIBUTION
Table 18: Rate per 1000 people tested for COVID-19 from 12 August to 27 September
Prioritised ethnicity MPAO
DHB of domicile Māori Pacific Asian Other Total
Auckland 89.7 138.3 59 88.9 84.8
Bay of Plenty 49.7 89.5 36.6 48.5 48.9
Canterbury 35.1 51.5 36.1 35.4 36.4
Capital and Coast 47.4 65.2 35.1 53.2 51.4
Counties Manukau 95.8 186 72.1 70.3 100.1
Hawkes Bay 37.5 54.7 29 38.2 38.6
Hutt Valley 36.6 53 36.7 40 40.4
Lakes 66.7 124.9 53.8 61.6 65.2
MidCentral 33.3 52.8 29.8 39.3 38.3
Nelson Marlborough 43.1 106.8 44.9 40.7 42.7
Northland 56.1 61.7 38.2 43.6 48.3
South Canterbury 30.1 94.2 40.1 37.7 38.1
Southern 38.7 64.6 36.5 44.3 43.9
Tairāwhiti 40.1 56.4 61.7 41.8 42.2
Taranaki 33.3 58.2 32.9 35.1 35.5
Waikato 51.3 82.5 41.9 44.1 47.4
Wairarapa 34.1 62.5 45.7 38.9 39
Waitematā 87.1 132.5 68.4 77.9 81.2
West Coast 12.9 43.5 14.1 14.3 14.6
Whanganui 39.8 55.9 27.7 37.7 38.5
Total 58.8 135.4 56.4 54 61.6

1
IN CONFIDENCE – NOT FOR DISTRIBUTION
SITREP 068
Coronavirus disease 2019 (COVID-19)
Issued: 1030 hours 30 September 2020
Information current at: 1000 hours
This report provides a daily update on the COVID-19 health system response. New information is denoted by red text.
Please use the single point of contact email [email protected] for help/support. Your email will be
logged and promptly passed to the appropriate team.
This document is classified IN CONFIDENCE and not for further distribution.
Need to know
COMMUNITY CASES
NEW LAST 24 hrs
0
IMPORTED MIQ CASES
NEW LAST 24 hrs
1
COMMUNITY CASES
TOTAL RECOVERED
170
137
COMMUNITY CASES
ACTIVE
14 TOTAL CASES SINCE 11 AUG
187
30 TOTAL IMPORTED MIQ CASES
167
TOTAL ACTIVE CASES IN NZ (COMMUNITY & MIQ): 44
IMPORTED MIQ CASES
TOTAL RECOVERED
IMPORTED MIQ CASES
ACTIVE
LABORATORY TESTS
LAST 24 hrs
4,969
LABORATORY TESTS
LAST SEVEN DAYS
35,922
LABORATORY TESTS
TOTAL
960,559
CASES DECEASED
3

IN CONFIDENCE – NOT FOR DISTRIBUTION
2
Total COVID-19 cases
Table 1: Total number of COVID-19 cases as at 0900 30 September 20201
Case status Active Recovered Deceased Total
Confirmed 44* (-11) 1416 (+12) 20 1480 (+1)
Probable 0 351 5 356
Total 44* (-11) 1767 (+12) 25 1836 (+1)
*1 newly identified case, 12 cases classified as recovered.
New cases in New Zealand since 0900 29 September 2020, as at 0900 30 September2
Imported in MIQ facilities
1. One new case has been detected at the border. In total 167 cases have been detected
at the border since the establishment of MIQ facilities.
o One case arrived on 25 September from France via Singapore. Managed isolation in
Auckland transferred to Auckland Jet Park facility.
Community
2. No new community cases have been reported. It has been five days since the last
community case was reported.
Historic cases
3. No new historic cases have been reported.
Total community cases by DHB since 11 August
Table 2: Community cases by DHB and case status as at 0900 30 September 20203
1 EpiSurv Database, 0900 30 September 2020
2 EpiSurv Database, 0900 30 September 2020
3 EpiSurv Database, 0900 30 September 2020
Case Status Counties Manukau Waitematā Auckland Waikato Total
Confirmed 79 56 50 1 186
Probable 1 0 0 0 1
Total 80 56 50 1 187

IN CONFIDENCE – NOT FOR DISTRIBUTION
3
Total community cases by outbreak since 11 August4
Table 3: Community cases by Outbreak as at 0900 30 September 20205
Community cases and household contacts at Jet Park
4. As at 0800 30 September there are 17 people isolating in Jet Park from the community.
nine are confirmed cases, the remaining eight are household contacts. This number will
decrease as people finish their isolation and depart from the facility.6
Cases in hospital
5. One case in hospital with COVID-19 as at 0800 30 September.7
Table 4: Number of cases in hospital with COVID-19 by DHB as at 0800 30 September 2020
4 EpiSurv Database, 0900 30 September 2020
5 EpiSurv Database, 0900 30 September 2020
6 NRHCC Morning Report, 0900 30 September 2020
7 NRHCC Morning Report, 0900 30 September 2020
Outbreak New cases (last 24
hrs)
Total cases Active cases
remaining
Auckland August 0 179 8
Christchurch Returnees 0 6 6
Rydges Hotel (MIF) 0 1 0
Under Investigation
0 1 0
Total 0 187 14
DHB Hospital Number in a general ward Number in ICU/HDU
Auckland Auckland City 0 0
Waitematā North Shore 0 0
Counties Manukau Middlemore 1 0
Total - 1 0
s 9(2)(a)
IN CONFIDENCE – NOT FOR DISTRIBUTION
4
Health system response
Overall approach
6. Our investigation has two main focus areas that run in parallel:
o Source attribution – a focus on investigating the case with the earliest symptom
onset date to gather details actions of movements 14 days prior. This will help to
understand the possible source of the new outbreak.
o Containment – rigorous case investigation, identification of close contacts and
isolation and testing to ensure that chain of transmission is broken.
o Case classification –has been established to consider cases with high CT counts will
be investigated by an expert panel to determine their status and develop a protocol
for reporting, management, and investigation of potentially historic infections.
Current outbreak investigation priorities8
o Follow up of Christchurch Returnees cases and settings of interest.
o Ongoing management of Auckland August outbreak.
Settings of interest9
7. Christchurch to Auckland Charter flight and related Christchurch MIF cases.
8. Settings of interest for the Christchurch Returnees outbreak include
o A supermarket and two retail stores in Auckland.
o Several locations outside of Auckland, which have been identified and are being
followed up by the relevant PHUs.
9. No new settings of interest have been identified.
Case investigation Christchurch Returnee Outbreak –
10. A case reported on 19 September is a returnee who arrived in New Zealand on 27
August and completed managed isolation in Christchurch. The case tested negative on
day 3 and day 12. They left managed isolation on 11 September and returned home to
Auckland on a charter flight from Christchurch. They were tested after developing
symptoms on 16 September and returned a positive result on 18 September. The case
and their two household contacts (both reported as confirmed cases on 19 September)
were transferred to the Auckland Jet Park quarantine facility on 18 September.
Genomically, the three cases are part of the B.1.36 lineage and sequencing is consistent
with three confirmed cases from the same flight to New Zealand, all of whom tested
positive while in an MIQ facility in Christchurch.10 Source of infection is still under
investigation.
8NRHCC Morning Report, 0900 30 September 2020
9 NRHCC Morning Report, 0845 24 September 2020
10 ESR email update 0924 27 September 2020
s 9(2)(a)

IN CONFIDENCE – NOT FOR DISTRIBUTION
5
11. Three cases from the same family unit tested positive on 22 September. Two cases were
tested because they were passengers on the chartered flight
and the third case is a household contact
The family has
been in isolation since 20 September. Genomes have been sequenced and all three
cases are part of the B.1.36 lineage and are closely matched to other cases epi-linked to
the Christchurch Returnees outbreak.11 Source investigation continues12. The family
visited Tāupo from 18 to 20 September and met parties from across the country.
They also had dinner with a family of outside of the Tāupo trip. All parties
who were contacts of these cases have been tested and are self-isolating. All PHUs with
responsibility for close contacts have reported good compliance with isolation
requirements.13. Contact Tracing and testing results can be seen in Table 5.
12. All passengers on the Christchurch to Auckland charter flight have been tested, except
one. Of those tested no results are pending and the rest are negative.
Case investigation Auckland August Outbreak -
13. Source investigation for an epidemiological link to the main cluster for four cases who
have been genomically linked to the main cluster is ongoing. Updates on the
investigation will be included in tomorrow’s SitRep (01 Oct):
o The
o GP
o The second Mount Albert Grammar student
o The Botany case
11 ESR email update 0924 27 September 2020
12 End of day update, Chief Advisor public health, 25 September 1700.
13 PHU MOH phone call, 1000 25 September
s 9(2)(a)
s 9(2)(a)
s 9(2)(a)
s 9(2)(a) s 9(2)(a)
s 9(2)(a)
s 9(2)(a)
s 9(2)(a)
s 9(2)(a)

6
IN CONFIDENCE – NOT FOR DISTRIBUTION
s 9(2)(a)
s 9(2)(a)

IN CONFIDENCE – NOT FOR DISTRIBUTION
7
s 9(2)(a)

IN CONFIDENCE – NOT FOR DISTRIBUTION
8
s 9(2)(a)

9
IN CONFIDENCE – NOT FOR DISTRIBUTION
ESR and wider testing14 14. A total of 172 cases (96%) from the Auckland community cluster have now been
sequenced, of which 143 (80%) yielded a high quality genome. The remaining cases did
not have sufficient genetic material to be sequenced reliably. All cases are part of the
same B1.1.1 lineage and genomic cluster and the subsequent mutations observed are
consistent with the epidemiological sub-groupings.
15.
16. Ongoing analysis of the whole genome sequencing results is being used to show how
COVID-19 has been transmitted through the community cluster and to further inform
its management.
17. No direct links have been found between the community outbreak genome
sequencing, and the 71 full genomes (52 high quality) currently available from cases
detected in border arrivals in managed isolation facilities (MIFs). There has been one
case in a health worker at a managed isolation facility. WGS results indicate that this
case is genomically linked to the Auckland community cluster and clustered closely with
three community cases in the managed isolation facility (as discussed in para 8).
18. Genome sequencing on cases from the Christchurch returnees cluster
has also been completed, all cases are part of the B1.36 lineage.
19.
14 ESR Whole Genome Sequencing Report, Email 0927 29 September 2020
s 9(2)(g)(i)
s 9(2)(g)(i)
s 9(2)(a)

IN CONFIDENCE – NOT FOR DISTRIBUTION
10
Figure 1: Number of cases that have been whole genome sequenced and are genomically clustered
with the Auckland August cluster by sub-cluster as at 14 September 202015
Source: ESR *A sample may not have been received by ESR, may not have been sequenced yet or a sequencing result could not be
obtained from the sample received.
Contact tracing16 20. Since the 11 August, 4073 community close contacts have been identified and recorded
in the National Contact Tracing Solution, all of these have been contacted and are self-
isolating.
Table 6: Close contact tracing recorded in the National Contact Tracing Solution since 11 August as at
0830 30 September 2020
27/09/2020 28/09/2020 29/09/2020 30/09/2020
Cumulative number of close
contacts identified1 4072 4075 4079 4073
Cumulative number of close
contacts successfully contacted 4069 4072 4079 4073
Number of close contacts
referred to "finding services"2 0 0 0 0
Number of close contacts
awaiting contact 3 3 0 0
1. Contacts loaded into the National Contact Tracing Solution, and managed by either the National Investigation and Tracing
Unit or the Public Health Units. Contacts from MIQ and overseas cases are not included in this report.
2. "Finding services" refers to the mechanism the National Close Contact Service uses to find valid contact details for close
contacts we do not have the correct contact details for. These services utilise internal Ministry of Health databases along with
Police, Customs and Airlines where relevant.
15 ESR email 1608 14 September 2020
16 COVID-19 NCCS Analytics and Reporting 0819 30 September 2020
0 5 10 15 20 25 30 35
Americold
Americold HH
Auckland Bus
Botany
Church 1
Church 2
Church 3
Finance Now
Finance Now HH
Household 1
Household 2
Household 3
MREF-Bereavement
GP
NZ Courier Post
Pending
Warehouse
Number of cases
Sequenced and genomically clustered Sequence not available*
s 9(2)(a)
s 9(2)(a)
s 9(2)(a)

IN CONFIDENCE – NOT FOR DISTRIBUTION
11
3. The total number and number successfully contacted can decrease due to duplicates and invalid records being removed from
the system.
COVID-19 Tracer App usage17 Figure 2: COVID-19 Tracer App cumulative registered users and daily scans/manual entries as at 1615
29 September 2020
1. The number of scans and manual entries on any given date is subject to change for up to 31 days. This is because there can be
a delay before anonymised analytic information is received (e.g. device not connected to internet when scan carried out).
2. The number of App registrations and QR codes for any given date is subject to change for up to 1 day. This is because due to
reporting timeframes these numbers may be extracted before the 12pm cut-off for the reporting period.
3. The ability to scan without being logged into the App was introduced on 09 September, delaying the data transfer to the
Ministry of Health until the individual re-logs into the App. This possibly results in under-reporting of daily scans reflected in
the data.
17 Response Analyst – Digital Channels, 1625 29 September 2020
0
500,000
1,000,000
1,500,000
2,000,000
2,500,000
0
500,000
1,000,000
1,500,000
2,000,000
2,500,000
28/0
7
31/0
7
03/0
8
06/0
8
09/0
8
12/0
8
15/0
8
18/0
8
21/0
8
24/0
8
27/0
8
30/0
8
02/0
9
05/0
9
08/0
9
11/0
9
14/0
9
17/0
9
20/0
9
23/0
9
26/0
9
29/0
9
Dai
ly s
can
s an
d m
anu
al e
ntr
ies
Cu
mu
lati
ve A
pp
regi
stra
tio
ns
Day and month
Cumulative App registrations Daily scans and manual entries

IN CONFIDENCE – NOT FOR DISTRIBUTION
12
Testing18 Table 7: Testing by functional groups, as at 0900 30 September 2020
*Numbers have been sourced from different data extracts in comparison to Table 7.
Laboratory testing numbers19 Table 8: Number of laboratory tests processed nationally as at 0900 30 September 2020
Testing supply update20
21. There are good levels of supplies available, with 278,208 tests available currently in the
labs. The Ministry of Health is continuing to work with major suppliers in order to meet
ongoing need.
18 ÉCLAIR/MoH Public Health Intelligence, 1000 30 September 2020
19 Daily Lab Report, 0934 30 September 2020
20 Testing supply email, 0920 28 September 2020
Reason for test 29 September 23–29 September
GPs and other primary health 2207 16578
CBACs and pop-ups 2041 14162
Border workers - air crew 20 255
Border workers - airport staff 63 1267
Border workers - maritime crew 0 49
Border workers – Port of Tauranga staff 14 22
Border workers – Remaining Port staff 25 278
Border workers - MIF 254 1149
Border workers - MIQ 25 304
Travellers - Staying at MIF 257 2001
Travellers - Staying at MIQ 65 72
Total 4,971* 36,137*
Time period Number of laboratory tests
29 September 4,969*
Last 7 days (23 Sept to 29 Sept) 35,922*
Total 960,559

IN CONFIDENCE – NOT FOR DISTRIBUTION
13
Healthline updates21 22. On 29 September there were 1,857 contacts in Healthline. Of those calls, 668 were to
the COVID-19 Info line. Demand on 1737 Need to talk? and other mental health services
was 567 contacts (in line forecast).
23. The main themes on 27/28 September were:
o Ongoing calls relating to the exposure events.
o Healthline are continuing to see a higher than normal acuity (of non-COVID related
health issues) through Healthline and some of this is geographically focussed – i.e.
the wider Auckland region.
o Questions relating to travel between alert levels.
o Most service users were calling because they are symptomatic and wanted to get a
test.
Logistics
Health Workforce22
24. Upskilling of alternative workforces for testing continues to progress. Health Workforce
are currently engaged with Careerforce and DHBs to create a testing workforce training
and education package. This will be utilised by DHBs across the country, to increase the
pool of people who are able to perform COVID-19 testing. It is anticipated this package
will be released in the week of 12 October 2020.
25. Surge workforce requests continue to be monitored and responded to, with 3779
people listed on the surge as “available”.
26. Health Workforce are monitoring staffing needs in MIFs facilities and are providing
support where possible.
Hospital capacity23 Table 9: Number and occupancy of hospital beds by type as at 0800 30 September 2020
Type Number of units Number (%) occupied/in use
ICU and HDU beds 339 229 (67.6%)
Ventilators 298 44 (14.8%)
Ward beds 7201 5982 (83.1%)
21 National Telehealth Service Coronavirus Update, 0938 30 September 2020
22 Health Workforce Directorate, 0853 28 September 2020
23 COVID-19 Hospital Summary, 0918 30 September 2020

14
IN CONFIDENCE – NOT FOR DISTRIBUTION
Appendix 1: Case summary Table 10: All new community cases reported between 0900 29 September and 0900 30 September. Source: ESR EpiSurv Extract 0900 30 September 2020
Cumulative
Number
Date tested
positive Onset date Case status DHB Sex Age Ethnicity
Symptoms
[Yes/No] Hospitalised Occupation
Source of
transmission

IN CONFIDENCE – NOT FOR DISTRIBUTION
15
Appendix 2: COVID-19 Provisional Disease Indicators, by date
of case notification16 Table 11: NCTS data for cases in the community - Please note, National Investigation and Tracing Centre are working through data quality issues, so
will not be reporting the metrics this morning.
Indicator (as per Table
9832) Refined Indicator description Target 13 Sept ** 14 Sept
** 15 Sept ** 16 Sept ** 17 Sept **
18 Sept **
19 Sept **
1 - (S001) Time from exposure to contact isolation / quarantine 80% within 96 hours - - - - - - -
2 – (S002) Time from case first symptom to contact isolation / quarantine 80% within 96 hours - - - - - - -
3 – (S003) Time from test sample taken to close contact isolation / quarantine 80% within 72 hours - 100% - - - - -
4 – (C001) Time from first symptom to test sample taken for positive cases 80% within 48 hours - - - - - 100% -
5 – (L001) Time from test sample taken to notification of positive result 80% within 24 hours - 0% - - - 100% 100%
6 – (P002) Time from case notification to isolation / quarantine of contact 80% within 48 hours - 100% - - - 84% -
7 – (P001) Time from notification to case interview 80% within 24 hours - 100% - - - 100% 100%
8 – (P003) Time from close contact identification to isolated / quarantined 80% within 24 hours - 100% - - - 83% 100%
10 – (P004) Proportion of contacts traced in 48 hours 80% within 48 hours - 100% - - - 84% -
C – (S005) Proportion of close contacts with confirmed or suspected COVID-19 at the time of tracing <20% - 0% - - - 7% 0%
• * The numerator and denominator are provided in some instances to provide context for low percentages.
• **Data is not available for metrics where there is no data that meets the definition, or where the time/days to reach target has not fully elapsed
• The value of P002 can drop due to the addition of new close contacts to exposure events after the 48-hour period since case notification had elapsed. This can happen for a number of reasons, including a case recalling further details following the original case
interview.
• These metrics report all cases during the specified period, including those in Managed Isolation and Quarantine, and do not include casual contacts.
• There are three additional indicators under development requiring both technical and clinical input to define data requirements. These are due to be completed by end October 2020.

IN CONFIDENCE – NOT FOR DISTRIBUTION
16
Table 12:NCTS data for cases in the community Managed Isolation and Quarantine, International, and Unknown
Indicator (as per Table 9832) Refined Indicator description Target 13 Sept ** 14 Sept 15 Sept ** 16 Sept 17 Sept ** 18 Sept ** 19 Sept **
1 - (S001) Time from exposure to contact isolation / quarantine
80% within 96 hours - 100% - 38% - - -
2 – (S002) Time from case first symptom to contact isolation / quarantine
80% within 96 hours - 100% - 38% - - -
3 – (S003) Time from test sample taken to close contact isolation / quarantine
80% within 72 hours - 100% - 100% 100% - -
4 – (C001) Time from first symptom to test sample taken for positive cases
80% within 48 hours - 33% - 50% - - -
5 – (L001) Time from test sample taken to notification of positive result
80% within 24 hours - 0% - 71% 0% 100% 50%
6 – (P002) Time from case notification to isolation / quarantine of contact
80% within 48 hours - 100% - 100% 100% - -
7 – (P001) Time from notification to case interview 80% within 24 hours - 75% - 58% 100% 100% 100%
8 – (P003) Time from close contact identification to isolated / quarantined
80% within 24 hours - 100% - 100% 100% - 100%
10 – (P004) Proportion of contacts traced in 48 hours 80% within 48 hours - 100% - 100% 100% - -
C – (S005) Proportion of close contacts with confirmed or suspected COVID-19 at the time of tracing
<20%
- 0% - 0% 0% - 0%
Note:
• * The numerator and denominator are provided in some instances to provide context for low percentages.
• **Data is not available for metrics where there is no data that meets the definition, or where the time/days to reach target has not fully elapsed
• The value of P002 can drop due to the addition of new close contacts to exposure events after the 48-hour period since case notification had elapsed. This can happen for a number of reasons, including a case recalling further details following the original case
interview.
• These metrics report all cases during the specified period, including those in Managed Isolation and Quarantine, and do not include casual contacts.
• There are three additional indicators under development requiring both technical and clinical input to define data requirements. These are due to be completed by end October 2020.

17
IN CONFIDENCE – NOT FOR DISTRIBUTION
Appendix 3: NRHCC Testing Report
Novel Coronavirus (COVID-19)
Issued: 1700 29 September
Table 13: Metro Auckland Summary Total of Testing for 29 September 2020
Community MIQ
staff
MIQ
guests
Airport Maritime port Ship’s
Crew
TOTAL
29/09/2020 617 133 625 124 PM Testing 0 1499
Table 14: Estimated tests taken since 12 August 2020, based on manual site reports at 5pm
Site 12/08-
16/08
17/08-
23/08
24/08 –
30/08
31/08 –
06/09
07/09 –
13/09
14/09 –
20/09
21/09 –
27/09
28/09 29/09*
MIQ Staff 2132 659 1488 912 1086 908 1136 122 133
Guests 2972 3767 3600 3406 3424 3843 3819 454 625
Border Airport 2129 933 1349 1158 853 951 843 129 124
Port 1588 678 161 392 153 320 208 76 PM
Testing
Crew 0 0 0 0 0 0 21 0 0
*29/09 day still in progress
Table 15: Estimated tests taken at Metro Auckland CTCs, since 12 August 2020, based on manual site reports at 4pm
Site 12/08-
16/08
17/08-
23/08
24/08 –
30/08
31/08 –
06/09
07/09 –
13/09
14/09 –
20/09
21/09 –
27/09
28/09 29/09*
Airport Oaks 1148 515 366 265 181 152 118 21 8
Botany CTC 1151 948 905 749 681 802 526 63 59
Health New
Lynn 2603 1258 1703 732 889 621 451 44 49
Mangere
Town Centre 1748 1684 1599 860 660 487 300 45 34
Otara CTC 3221 1712 1429 930 699 938 428 64 44
St Lukes 1368 1045 1414 797 666 830 793 85 72

IN CONFIDENCE – NOT FOR DISTRIBUTION
18
Takanini
Urgent Care 1886 1216 1153 684 440 487 313 44 29
Whanau
House 2502 1371 1442 928 1613 870 594 74 62
Whanau Ora -
Central 1957 964 1583 937 783 470 465 50 49
Whanau Ora -
North 1442 669 637 982 947 907 633 89 54
Whanau Ora -
South 2945 1250 718 677 620 470 310 40 33
Papakura Pop
Up N/A N/A N/A N/A N/A N/A N/A 13 21
Te Atatu Pop
Up N/A N/A N/A N/A N/A N/A N/A 48 39
West Harbour
Pop Up N/A N/A N/A N/A N/A N/A N/A 9 8
Otara Pop Up N/A N/A N/A N/A N/A N/A 38 N/A 27
Waipuna
Targeted Site 143 549 376 219 251 220 186 28 28
Henderson
Targeted Site N/A N/A N/A N/A 631 93 15 1 1
Total 26,148 16,781 21,356 13,002 10,475 8,832 5436 718 617
*29/09 day still in progress; N/A = not open as a CTC; Previous sites that are no longer open are not included
in this report
CTCs and mobile testing site locations
Please see https://www.arphs.health.nz/public-health-topics/covid-19/where-to-get-tested for the most up-
to-date information on CTCs and mobile testing sites in the Auckland region.

IN CONFIDENCE – NOT FOR DISTRIBUTION
19
Appendix 4: Testing by DHB and ethnicity The tables that follow are the number of people tested. The numbers in the laboratory testing
section are the number of laboratory tests processed.
Table 16: Number of people tested for COVID-19 from 12 August to 29 September
Prioritised ethnicity MPAO
DHB of domicile Māori Pacific Asian Other Unknown Total
Auckland 3945 7828 11,220 23,647 542 47,182
Bay of Plenty 3003 402 734 7736 84 11,959
Canterbury 1851 739 2213 15,971 277 21,051
Capital and Coast 1771 1471 1795 11,507 291 16,835
Counties Manukau 8641 22,538 11,072 14,978 521 57,750
Hawkes Bay 1644 352 274 4179 85 6534
Hutt Valley 971 699 704 3832 57 6263
Lakes 2607 323 528 3755 124 7337
MidCentral 1238 299 476 4991 120 7124
Nelson Marlborough 704 271 339 5212 75 6601
Northland 3438 236 318 4823 64 8879
South Canterbury 162 47 95 1957 31 2292
Southern 1319 457 960 12,053 126 14,915
Tairāwhiti 1004 63 73 943 23 2106
Taranaki 783 82 206 3183 75 4329
Waikato 5012 1112 1877 12,048 304 20,353
Wairarapa 278 52 57 1414 14 1815
Waitematā 5525 5981 9958 30,269 454 52,187
West Coast 50 11 13 387 8 469
Whanganui 701 85 83 1662 20 2551
Unknown 1667 789 908 5208 2938 11,510
Total 46,314 43,837 43,903 169,756 6233 310,043

20
IN CONFIDENCE – NOT FOR DISTRIBUTION
Table 17: Rate per 1000 people tested for COVID-19 from 12 August to 29 September
Prioritised ethnicity MPAO
DHB of domicile Māori Pacific Asian Other Total
Auckland 90.7 139.6 59.9 90.5 86.1
Bay of Plenty 50.2 90.4 37.5 49.2 49.6
Canterbury 35.3 52.1 36.4 35.8 36.7
Capital and Coast 48.5 66.3 35.8 54.1 52.3
Counties Manukau 97.1 187.7 73.3 71.6 101.4
Hawkes Bay 38 54.8 29.9 38.7 39.2
Hutt Valley 37.3 59.9 37.5 40.7 41.5
Lakes 67.8 126.4 54.3 62.6 66.3
MidCentral 34 53.9 30.7 40.3 39.3
Nelson Marlborough 43.9 109.7 45.7 41.4 43.5
Northland 56.5 62.8 38.4 44.2 48.8
South Canterbury 30.5 96.3 40.1 37.9 38.3
Southern 39.3 66.4 37.2 45.1 44.7
Tairāwhiti 40.5 56.4 62.5 42.7 42.8
Taranaki 33.5 58.9 33.1 35.4 35.8
Waikato 52 83.4 42.5 44.8 48.1
Wairarapa 34.9 62.5 45.7 39.6 39.7
Waitematā 88.3 134.1 69.3 79.2 82.4
West Coast 12.9 43.5 14.1 14.3 14.6
Whanganui 40.4 55.9 28.3 38.6 39.3
Total 59.6 137.1 57.3 54.8 62.5