third quarter report to shareholders - …staging.wajax.com/pdfs/quarterly_reports/2013/report...
TRANSCRIPT

THIRD QUARTER REPORT TO SHAREHOLDERS FOR THE NINE MONTHS ENDED SEPTEMBER 30, 2013
W A J A X C O R P O R A T I O N 2 0 1 3

2
WAJAX CORPORATION News Release
TSX Symbol: WJX
WAJAX ANNOUNCES 2013 THIRD QUARTER EARNINGS (Dollars in millions, except per share data) Three Months Ended September 30 Nine Months Ended September 30
2013 2012 2013 2012
CONSOLIDATED RESULTS
Revenue $338.5 $356.4 $1,036.8 $1,101.1
Net earnings $11.5 $16.2 $35.5 $51.7
Basic earnings per share $0.69 $0.97 $2.12 $3.10
SEGMENTS
Revenue – Equipment $179.5 $194.2 $545.5 $576.9
- Power Systems $69.2 $75.6 $218.6 $253.3
- Industrial Components $91.1 $87.5 $275.8 $274.7
Earnings – Equipment $11.8 $13.3 $35.6 $42.1 % margin 6.6% 6.9% 6.5% 7.3%
- Power Systems $3.7 $6.0 $11.1 $21.1 % margin 5.4% 7.9% 5.1% 8.3%
- Industrial Components $4.3 $5.5 $12.8 $18.5 % margin 4.7% 6.3% 4.7% 6.7%
Toronto, Ontario – November 5, 2013 – Wajax Corporation (“Wajax” or the “Corporation”) today announced its 2013 third quarter results.
Third Quarter Highlights
Consolidated third quarter revenue of $338.5 million decreased $17.9 million, or 5%, compared to last year on reduced sales in the Equipment and Power Systems segments. Lower mining equipment sales in the Equipment segment and the negative effect of reduced activity in the western Canada oil and gas sector on Power Systems segment revenue were the primary factors contributing to the consolidated revenue decline. Partially offsetting these factors was a 4% increase in the Industrial Components segment revenue as a result of the ACE Hydraulic and Kaman Canada acquisitions completed in the fourth quarter of 2012.
Net earnings for the quarter were $11.5 million, or $0.69 per share, compared to $16.2 million, or $0.97 per share recorded in 2012. Equipment and Power Systems segment earnings decreased $1.5 million and $2.3 million respectively on lower volumes and increased selling and administrative expenses. Industrial Components segment earnings declined by $1.2 million as higher acquisition related revenues were insufficient to offset reduced margins and an increase in selling and administrative costs.

3
Consolidated backlog of $204.8 million at September 30, 2013 increased 2% compared to June 30, 2013 on gains in the Equipment and Power Systems segments.
Funded net debt of $225.3 million at September 30, 2013 increased slightly compared to $221.2 million at the end of June 2013.
On October 23, 2013 the Corporation issued $125 million of senior unsecured notes. The notes carry a coupon of 6.125% per annum and will mature on October 23, 2020. The net proceeds of the notes were used to repay borrowings under the Corporation’s senior secured bank credit facility, which in turn may be redrawn for general corporate purposes. Effective upon the closing of the note offering, the Corporation reduced the total available committed amount of the bank credit facility from $300 million to $250 million. The issuance of the notes introduces a longer term fixed rate layer of debt into Wajax’s capital structure at a time when interest rates remain historically low. The Corporation declared monthly dividends of $0.20 per share ($2.40 annualized) for the months of November and December, 2013 and January and February, 2014. Outlook Commenting on the third quarter results and the outlook for the remainder of 2013, Mark Foote, President and CEO, stated: “Third quarter revenue and earnings were largely as expected. When compared to last year, revenue was negatively affected by continued weakness in the oil and gas and mining markets. Mining related revenue declines, including the loss of the LeTourneau product line, were partially mitigated by increases in mining associated aftermarket sales driven by improvements in equipment support revenue and continuing gains from our rotating products growth initiative. We continue to expect the weakness in the oil and gas market to remain for the balance of 2013, with demand for new equipment and aftermarket services for drilling and well stimulation continuing to be soft. In mining, quoting activity remains at a reasonable level for the Equipment segment, as well as Power Systems’ electrical power generation business. However, lower commodity prices continue to result in mining customers reducing their capital and development spending, limiting their ability to commit to new equipment orders. In spite of this, we were able to increase our consolidated backlog on increases in non-mining related orders and electric power generation orders in the Equipment and Power Systems segments respectively. As well, the commercial trial of the four Hitachi EH5000 320 ton mining trucks began in the oil sands in the fourth quarter. Consistent with our expectation disclosed at the end of the second quarter, we are maintaining a cautious outlook regarding our end markets for the rest of 2013 and continue to expect that full year 2013 earnings will be less than 2012.” Wajax Corporation Wajax is a leading Canadian distributor engaged in the sale, rental and after-sale parts and service support of equipment, power systems and industrial components, through a network of 126 branches across Canada. The Corporation is a multi-line distributor and represents a number of leading worldwide manufacturers across its core businesses. Its customer base is diversified, spanning natural resources, construction, transportation, manufacturing, industrial processing and utilities.

4
Cautionary Statement Regarding Forward Looking Information This news release contains certain forward-looking statements and forward-looking information, as defined in applicable securities laws (collectively, “forward-looking statements”). These forward-looking statements relate to future events or the Corporation’s future performance. All statements other than statements of historical fact are forward-looking statements. Often, but not always, forward looking statements can be identified by the use of words such as “plans”, “anticipates”, “intends”, “predicts”, “expects”, “is expected”, “scheduled”, “believes”, “estimates”, “projects” or “forecasts”, or variations of, or the negatives of, such words and phrases or state that certain actions, events or results “may”, “could”, “would”, “should”, “might” or “will” be taken, occur or be achieved. Forward looking statements involve known and unknown risks, uncertainties and other factors beyond the Corporation’s ability to predict or control which may cause actual results, performance and achievements to differ materially from those anticipated or implied in such forward looking statements. There can be no assurance that any forward looking statement will materialize. Accordingly, readers should not place undue reliance on forward looking statements. The forward looking statements in this news release are made as of the date of this news release, reflect management’s current beliefs and are based on information currently available to management. Although management believes that the expectations represented in such forward-looking statements are reasonable, there is no assurance that such expectations will prove to be correct. Specifically, this news release includes forward looking statements regarding, among other things, our 2013 outlook for certain of our key end markets, including oil and gas and mining and our outlook with respect to our financial results for the 2013 financial year, including earnings for full-year 2013. These statements are based on a number of assumptions which may prove to be incorrect, including, but not limited to, assumptions regarding general business and economic conditions, the supply and demand for, and the level and volatility of prices for, commodities, financial market conditions, including interest rates, the future financial performance of the Corporation, our costs, market competition, our ability to attract and retain skilled staff, our ability to procure quality products and inventory and our ongoing relations with suppliers, employees and customers. The foregoing list of assumptions is not exhaustive. Factors that may cause actual results to vary materially include, but are not limited to, a deterioration in general business and economic conditions, volatility in the supply and demand for, and the level of prices for, commodities, fluctuations in financial market conditions, including interest rates, the level of demand for, and prices of, the products and services we offer, market acceptance of the products we offer, termination of distribution or original equipment manufacturer agreements, unanticipated operational difficulties (including failure of plant, equipment or processes to operate in accordance with specifications or expectations, cost escalation, unavailability of quality products or inventory, supply disruptions, job action and unanticipated events related to health, safety and environmental matters), our ability to attract and retain skilled staff and our ability to maintain our relationships with suppliers, employees and customers. The foregoing list of factors is not exhaustive. The forward-looking statements contained in this news release are expressly qualified in their entirety by this cautionary statement. The Corporation does not undertake any obligation to publicly update such forward-looking statements to reflect new information, subsequent events or otherwise unless so required by applicable securities laws. Further information concerning the risks and uncertainties associated with these forward looking statements and the Corporation’s business may be found in our Annual Information Form for the year ended December 31, 2012, filed on SEDAR.

5
Management’s Discussion and Analysis – Q3 2013 The following management’s discussion and analysis (“MD&A”) discusses the consolidated financial condition and results of operations of Wajax Corporation (“Wajax” or the “Corporation”) for the quarter ended September 30, 2013. This MD&A should be read in conjunction with the information contained in the unaudited Condensed Consolidated Financial Statements and accompanying notes for the quarter ended September 30, 2013, the annual audited Consolidated Financial Statements and accompanying notes for the year ended December 31, 2012 and the associated MD&A. Information contained in this MD&A is based on information available to management as of November 5, 2013. Unless otherwise indicated, all financial information within this MD&A is in millions of Canadian dollars, except share and per share data. Additional information, including Wajax’s Annual Report and Annual Information Form, are available on SEDAR at www.sedar.com.
Responsibility of Management and the Board of Directors Management is responsible for the information disclosed in this MD&A and the unaudited Condensed Consolidated Financial Statements and accompanying notes, and has in place appropriate information systems, procedures and controls to ensure that information used internally by management and disclosed externally is materially complete and reliable. Wajax’s Board of Directors has approved this MD&A and the unaudited Condensed Consolidated Financial Statements and accompanying notes. In addition, Wajax’s Audit Committee, on behalf of the Board of Directors, provides an oversight role with respect to all public financial disclosures made by Wajax, and has reviewed this MD&A and the unaudited Condensed Consolidated Financial Statements and accompanying notes.
Disclosure Controls and Procedures and Internal Control over Financial Reporting Wajax’s management, under the supervision of its Chief Executive Officer (“CEO”) and Chief Financial Officer (“CFO”), is responsible for establishing and maintaining disclosure controls and procedures (“DC&P”) and internal control over financial reporting (“ICFR”). As at September 30, 2013, Wajax’s management, under the supervision of its CEO and CFO, had designed DC&P to provide reasonable assurance that information required to be disclosed by Wajax in annual filings, interim filings or other reports filed or submitted under applicable securities legislation is recorded, processed, summarized and reported within the time periods specified in such securities legislation. DC&P are designed to ensure that information required to be disclosed by Wajax in annual filings, interim filings or other reports filed or submitted under applicable securities legislation is accumulated and communicated to Wajax’s management, including its CEO and CFO, as appropriate, to allow timely decisions regarding required disclosure. As at September 30, 2013, Wajax’s management, under the supervision of its CEO and CFO, had designed internal control over financial reporting (“ICFR”) to provide reasonable assurance regarding the reliability of financial reporting and the preparation of financial statements for external purposes in accordance with International Financial Reporting Standards (“IFRS”). In completing the design, management used the criteria set forth by the Committee of Sponsoring Organizations of the Treadway Commission (“COSO”) in its 1992 version of Internal Control – Integrated Framework. With regard to general controls over information technology, management also used the set of practices of Control Objectives for Information and related Technology (“COBIT”) created by the IT Governance Institute. There was no change in Wajax’s ICFR that occurred during the three months ended September 30, 2013 that has materially affected, or is reasonably likely to materially affect, Wajax’s ICFR.

6
Cautionary Statement Regarding Forward-Looking Information
This MD&A contains certain forward-looking statements and forward-looking information, as defined in applicable securities laws (collectively, “forward-looking statements”). These forward-looking statements relate to future events or the Corporation’s future performance. All statements other than statements of historical fact are forward-looking statements. Often, but not always, forward looking statements can be identified by the use of words such as “plans”, “anticipates”, “intends”, “predicts”, “expects”, “is expected”, “scheduled”, “believes”, “estimates”, “projects” or “forecasts”, or variations of, or the negatives of, such words and phrases or state that certain actions, events or results “may”, “could”, “would”, “should”, “might” or “will” be taken, occur or be achieved. Forward looking statements involve known and unknown risks, uncertainties and other factors beyond the Corporation’s ability to predict or control which may cause actual results, performance and achievements to differ materially from those anticipated or implied in such forward looking statements. There can be no assurance that any forward looking statement will materialize. Accordingly, readers should not place undue reliance on forward looking statements. The forward looking statements in this MD&A are made as of the date of this MD&A, reflect management’s current beliefs and are based on information currently available to management. Although management believes that the expectations represented in such forward-looking statements are reasonable, there is no assurance that such expectations will prove to be correct. Specifically, this MD&A includes forward looking statements regarding, among other things, our plans for revenue and earnings growth, including planned strategic initiatives and their intended outcomes, our financing and capital requirements, our outlook for certain of our key end markets, including oil and gas and mining, our outlook with respect to our financial results for the 2013 financial year, including earnings for full-year 2013 and our objective with respect to the future payment of dividends. These statements are based on a number of assumptions which may prove to be incorrect, including, but not limited to, assumptions regarding general business and economic conditions, the supply and demand for, and the level and volatility of prices for, commodities, financial market conditions, including interest rates, the future financial performance of the Corporation, our costs, market competition, our ability to attract and retain skilled staff, our ability to procure quality products and inventory and our ongoing relations with suppliers, employees and customers. The foregoing list of assumptions is not exhaustive. Factors that may cause actual results to vary materially include, but are not limited to, a deterioration in general business and economic conditions, volatility in the supply and demand for, and the level of prices for, commodities, fluctuations in financial market conditions, including interest rates, the level of demand for, and prices of, the products and services we offer, market acceptance of the products we offer, termination of distribution or original equipment manufacturer agreements, unanticipated operational difficulties (including failure of plant, equipment or processes to operate in accordance with specifications or expectations, cost escalation, unavailability of quality products or inventory, supply disruptions, job action and unanticipated events related to health, safety and environmental matters), our ability to attract and retain skilled staff and our ability to maintain our relationships with suppliers, employees and customers. The foregoing list of factors is not exhaustive. Further information concerning the risks and uncertainties associated with these forward looking statements and the Corporation’s business may be found in this MD&A under the heading “Risk Management and Uncertainties” and in our Annual Information Form for the year ended December 31, 2012, filed on SEDAR. The forward-looking statements contained in this MD&A are expressly qualified in their entirety by this cautionary statement. The Corporation does not undertake any obligation to publicly update such forward-looking statements to reflect new information, subsequent events or otherwise unless so required by applicable securities laws. Readers are further cautioned that the preparation of financial statements in accordance with IFRS requires management to make certain judgments and estimates that affect the reported amounts of assets, liabilities, revenues and expenses. These estimates may change, having either a negative or positive effect on net earnings as further information becomes available, and as the economic environment changes.
Wajax Corporation Overview Wajax’s core distribution businesses are engaged in the sale, rental and after-sale parts and service support of mobile equipment, power systems and industrial components through a network of 126 branches across Canada. Wajax is a multi-line distributor and represents a number of leading worldwide manufacturers in its core businesses. Its customer base is diversified, spanning natural resources, construction, transportation, manufacturing, industrial processing and utilities.
7
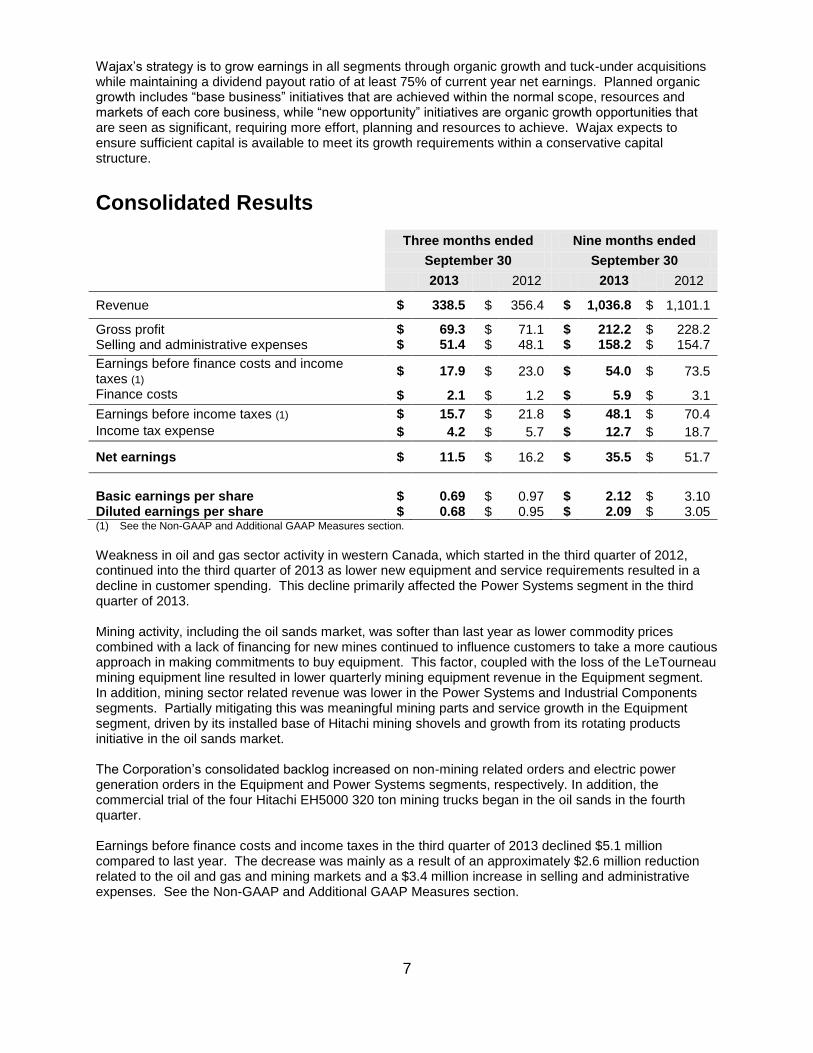
Wajax’s strategy is to grow earnings in all segments through organic growth and tuck-under acquisitions while maintaining a dividend payout ratio of at least 75% of current year net earnings. Planned organic growth includes “base business” initiatives that are achieved within the normal scope, resources and markets of each core business, while “new opportunity” initiatives are organic growth opportunities that are seen as significant, requiring more effort, planning and resources to achieve. Wajax expects to ensure sufficient capital is available to meet its growth requirements within a conservative capital structure.
Consolidated Results
Three months ended Nine months ended
September 30 September 30
2013 2012 2013 2012
Revenue $ 338.5 $ 356.4 $ 1,036.8 $ 1,101.1
Gross profit Selling and administrative expenses
$ $
69.3 51.4
$ $
71.1 48.1
$ $
212.2 158.2
$ $
228.2 154.7
Earnings before finance costs and income taxes (1)
$ 17.9 $ 23.0 $ 54.0 $ 73.5
Finance costs $ 2.1 $ 1.2 $ 5.9 $ 3.1
Earnings before income taxes (1) $ 15.7 $ 21.8 $ 48.1 $ 70.4
Income tax expense $ 4.2 $ 5.7 $ 12.7 $ 18.7
Net earnings $ 11.5 $ 16.2 $ 35.5 $ 51.7
Basic earnings per share Diluted earnings per share
$ $
0.69 0.68
$ $
0.97 0.95
$ $
2.12 2.09
$ $
3.10 3.05
(1) See the Non-GAAP and Additional GAAP Measures section.
Weakness in oil and gas sector activity in western Canada, which started in the third quarter of 2012, continued into the third quarter of 2013 as lower new equipment and service requirements resulted in a decline in customer spending. This decline primarily affected the Power Systems segment in the third quarter of 2013. Mining activity, including the oil sands market, was softer than last year as lower commodity prices combined with a lack of financing for new mines continued to influence customers to take a more cautious approach in making commitments to buy equipment. This factor, coupled with the loss of the LeTourneau mining equipment line resulted in lower quarterly mining equipment revenue in the Equipment segment. In addition, mining sector related revenue was lower in the Power Systems and Industrial Components segments. Partially mitigating this was meaningful mining parts and service growth in the Equipment segment, driven by its installed base of Hitachi mining shovels and growth from its rotating products initiative in the oil sands market. The Corporation’s consolidated backlog increased on non-mining related orders and electric power generation orders in the Equipment and Power Systems segments, respectively. In addition, the commercial trial of the four Hitachi EH5000 320 ton mining trucks began in the oil sands in the fourth quarter.
Earnings before finance costs and income taxes in the third quarter of 2013 declined $5.1 million compared to last year. The decrease was mainly as a result of an approximately $2.6 million reduction related to the oil and gas and mining markets and a $3.4 million increase in selling and administrative expenses. See the Non-GAAP and Additional GAAP Measures section.

8
Revenue Revenue in the third quarter of 2013 decreased 5% to $338.5 million compared to the third quarter of 2012 and included $5.2 million of revenue from two businesses acquired by the Industrial Components segment (ACE Hydraulic and Kaman Canada) in the fourth quarter of 2012. Compared to the same quarter last year, segment revenue decreased 8% in each of the Equipment and Power Systems segments due to lower equipment volumes and increased 4% in the Industrial Components segment. For the nine months ended September 30, 2013, revenue decreased 6%, or $64.3 million, over the same period last year. Revenue in 2013 includes $16.5 million from the two Industrial Components acquisitions noted above. Gross profit Gross profit in the third quarter of 2013 decreased $1.8 million compared to the third quarter of last year as an increase in the gross profit margin percentage was more than offset by lower volumes. The gross profit margin percentage for the quarter of 20.5% increased from 19.9% in 2012 as the positive sales mix impact from a lower proportion of equipment revenues compared to last year was partially offset by the negative impact of lower parts and service margins. For the nine months ended September 30, 2013, gross profit decreased $16.0 million due to lower volumes compared to the same period last year. The gross profit margin percentage decreased slightly to 20.5% in 2013 from 20.7% in 2012. Selling and administrative expenses Selling and administrative expenses increased $3.4 million in the third quarter of 2013 compared to the same quarter last year. Increases included higher costs in the Equipment segment’s western Canada operations and increases in the Industrial Components segment due mainly to the acquisitions of ACE Hydraulic and Kaman Canada in the fourth quarter of 2012. Selling and administrative expenses as a percentage of revenue increased to 15.2% in the third quarter of 2013 from 13.5% in the third quarter of 2012. For the nine months ended September 30, 2013, selling and administrative expenses increased $3.5 million compared to the same period last year. The impact of higher costs in the Equipment segment’s western Canada operations and increases in the Industrial Components segment, due mainly to the two acquisitions in the fourth quarter of 2012, was offset by lower annual and mid-term incentive accruals and other cost reductions compared to last year. Selling and administrative expenses as a percentage of revenue increased to 15.3% in 2013 from 14.0% in 2012. Finance costs Quarterly finance costs of $2.1 million increased $1.0 million compared to the same quarter last year due to the cost of higher funded debt levels outstanding during the quarter stemming from increased working capital levels and the two Industrial Components segment acquisitions in the fourth quarter of 2012. The Corporation’s higher cost of borrowing also contributed to the increase. Funded net debt includes bank debt, bank indebtedness and obligations under finance leases, net of cash. See the Liquidity and Capital Resources and the Non-GAAP and Additional GAAP Measures sections below. For the nine months ended September 30, 2013, finance costs of $5.9 million increased $2.8 million compared to the same period in 2012 due mainly to the cost of higher funded debt levels outstanding during the period driven by an increase in working capital and the two Industrial Components segment acquisitions completed in the fourth quarter of 2012. The Corporation’s higher cost of borrowing also contributed to the increase. Income tax expense The Corporation’s effective income tax rate of 26.5% for the third quarter of 2013 increased from 26.0% the previous year due in part to the impact of expenses not deductible for income tax purposes. For the nine months ended September 30, 2013, the effective income tax rate of 26.3% decreased slightly from 26.5% in the previous year. Net earnings Quarterly net earnings decreased $4.6 million to $11.5 million, or $0.69 per share, from $16.2 million, or $0.97 per share, in the same quarter of 2012. The decrease in net earnings resulted primarily from lower

9
volumes and higher selling and administrative expenses and finance costs compared to the same quarter last year. For the nine months ended September 30, 2013, net earnings decreased $16.3 million to $35.5 million, or $2.12 per share, from $51.7 million, or $3.10 per share, in the same period in 2012. The decrease in net earnings resulted primarily from lower volumes. Higher selling and administrative expenses and finance costs also contributed to the decline in net earnings compared to the same period last year. Comprehensive income Total comprehensive income of $11.4 million in the third quarter of 2013 included net earnings of $11.5 million and an other comprehensive loss of $0.2 million. For the nine months ended September 30, 2013, total comprehensive income of $35.6 million included net earnings of $35.5 million and an other comprehensive gain of $0.1 million. Funded net debt Funded net debt of $225.3 million at September 30, 2013 increased $4.1 million compared to June 30, 2013. Cash generated from operating activities for the quarter of $9.7 million was less than dividends paid of $10.0 million, investing activities of $1.6 million and finance lease payments of $0.6 million. Wajax’s leverage ratio of 2.4 times at September 30, 2013 increased from the June 30, 2013 ratio of 2.2 times. See the Consolidated Financial Condition and the Non-GAAP and Additional GAAP Measures sections below. Funded net debt of $225.3 million at September 30, 2013 increased $51.6 million compared to December 31, 2012. Cash used in operating activities during the period of $8.5 million resulted mainly from the impact of income taxes paid of $57.6 million, $44.6 million of which related to taxable income for 2011 and 2012. Other uses of cash included dividends paid of $36.0 million, investing activities of $3.8 million and finance lease payments of $1.9 million. On October 23, 2013 the Corporation issued $125 million of senior unsecured notes. The notes carry a coupon of 6.125% per annum and will mature on October 23, 2020. The net proceeds of the notes were used to repay borrowings under the Corporation’s senior secured bank credit facility, which in turn may be redrawn for general corporate purposes. Effective upon the closing of the note offering, the Corporation reduced the total available committed amount of the bank credit facility from $300 million to $250 million. The issuance of the notes introduces a longer term fixed rate layer of debt into Wajax’s capital structure at a time when interest rates remain historically low. See the Liquidity and Capital Resources section. Dividends For the third quarter ended September 30, 2013 monthly dividends declared totaled $0.60 per share. For the third quarter ended September 30, 2012 monthly dividends declared totaled $0.81 per share. For the nine months ended September 30, 2013 monthly dividends declared totaled $2.08 per share. For the nine months ended September 30, 2012 monthly dividends declared totaled $2.29 per share. On November 5, 2013, Wajax announced monthly dividends of $0.20 per share ($2.40 annualized) for each of the months of November, December, January and February payable on December 20, 2013, January 20, 2014, February 20, 2014 and March 20, 2014 to shareholders of record on November 29, 2013, December 31, 2013, January 31, 2014 and February 28, 2014 respectively. Backlog Consolidated backlog at September 30, 2013 of $204.8 million increased $4.9 million, or 2%, compared to June 30, 2013 with increases in the Equipment and Power Systems segments partially offset by a decrease in the Industrial Components segment. Consolidated backlog increased $2.4 million compared to September 30, 2012, or 1%, with increases in the Equipment segment partially offset by decreases in the Power Systems and Industrial Components segments. Backlog includes the total sales value of customer purchase commitments for future delivery or commissioning. See the Results of Operations section below for further backlog detail by segment.

10
Results of Operations
Equipment Three months ended Nine months ended
September 30 September 30
2013 2012 2013 2012
Equipment(1)
$ 106.1 $ 132.5 $ 326.7 $ 383.2
Parts and service $ 73.4 $ 61.7 $ 218.8 $ 193.7
Segment revenue $ 179.5 $ 194.2 $ 545.5 $ 576.9
Segment earnings $ 11.8 $ 13.3 $ 35.6 $ 42.1
Segment earnings margin 6.6% 6.9% 6.5% 7.3%
(1) Includes rental and other revenue.
Revenue in the third quarter of 2013 decreased $14.7 million, or 8%, to $179.5 million, from $194.2 million in the third quarter of 2012. Segment earnings for the quarter decreased $1.5 million, to $11.8 million, compared to the third quarter of 2012. The following factors contributed to the Equipment segment’s third quarter results compared to the third quarter of 2012:
Equipment revenue for the third quarter decreased $26.4 million with specific year-over-year variances as follows:
- Construction equipment revenue increased $3.6 million mainly as a result of an increase in JCB equipment volumes in eastern Canada and higher Hitachi excavator volumes in western Canada. These increases were partially offset by decreases in Hitachi excavator and Wirtgen road building equipment sales in central Canada.
- Material handling equipment revenue increased $3.1 million. The sale of higher dollar value reach stacker units in eastern Canada was somewhat offset by lower lift truck revenues in western Canada compared to last year.
- Forestry equipment revenue increased $1.3 million.
- Mining equipment sales decreased $32.1 million. Excluding the impact of the LeTourneau product line, for which distribution rights were discontinued in the third quarter of 2012, mining sales decreased $18.4 million on fewer Hitachi equipment deliveries.
- Crane and utility equipment revenue decreased $2.3 million due to declines in central and eastern Canada.
Parts and service volumes increased $11.7 million or 19.0%. The increase was led by higher mining
sector volumes in western Canada, driven by the segment’s installed base of Hitachi mining equipment and growth in rotating products.
Segment earnings for the third quarter decreased $1.5 million to $11.8 million. This was due mainly to the negative impact of lower equipment volumes, including the discontinued LeTourneau product line, and an increase in selling and administrative expenses. These declines were partially offset by the positive impact on earnings of increased parts and service volumes. For the three months ended September 30, 2012, the LeTourneau product line contributed approximately $1.5 million to the segment’s earnings. Selling and administrative expenses increased $1.2 million compared to last year due mainly to increased expenses in western Canada, which included costs related to strategic initiatives, the impact of prior year accrual and cost allocation adjustments, and other personnel related expenses.
Backlog of $102.6 million at September 30, 2013 increased $3.7 million compared to June 30, 2013. Backlog increased $7.2 million compared to September 30, 2012, due mainly to an increase in non-mining related orders.

11
Power Systems
Three months ended Nine months ended
September 30 September 30
2013 2012 2013 2012
Equipment(1)
$ 21.6 $ 28.6 $ 69.3 $ 97.5
Parts and service $ 47.6 $ 47.0 $ 149.3 $ 155.8
Segment revenue $ 69.2 $ 75.6 $ 218.6 $ 253.3
Segment earnings $ 3.7 $ 6.0 $ 11.1 $ 21.1
Segment earnings margin 5.4% 7.9% 5.1% 8.3%
(1) Includes rental and other revenue.
Revenue in the third quarter of 2013 decreased $6.4 million, or 8%, to $69.2 million, compared to $75.6 million in the third quarter of 2012. For the same comparative periods, segment earnings decreased $2.3 million to $3.7 million. The following factors impacted quarterly revenue and earnings compared to last year:
Equipment revenue decreased $7.0 million, due mainly to lower off-highway sales to oil and gas customers as a result of reduced industry activity in western Canada. In eastern and central Canada, lower power generation volumes and reduced off-highway sales to mining customers and the military also contributed to the revenue decline. The decrease in revenue was somewhat offset by higher rental volumes.
Parts and service volumes increased $0.6 million compared to last year as a result of higher sales to on-highway customers on increased activity in western and central Canada. These increases were partially offset by decreased sales to off-highway customers, primarily in western and central Canada.
Segment earnings in the third quarter of 2013 decreased $2.3 million compared to the same quarter last year, as the impact of reduced sales activity and higher selling and administrative expenses was mitigated somewhat by higher gross profit margins. Selling and administrative expenses increased $1.3 million principally due to a 2012 reversal of annual and mid-term incentive accruals and occupancy costs.
Backlog of $62.9 million as of September 30, 2013 increased $6.8 million compared to June 30, 2013 due primarily to an increase in power generation related orders. Backlog decreased $2.6 million compared to September 30, 2012.
Industrial Components
Three months ended Nine months ended
September 30 September 30
2013 2012 2013 2012
Segment revenue $ 91.1 $ 87.5 $ 275.8 $ 274.7
Segment earnings $ 4.3 $ 5.5 $ 12.8 $ 18.5
Segment earnings margin 4.7% 6.3% 4.7% 6.7%
Revenue of $91.1 million in the third quarter of 2013 increased $3.6 million, or 4%, from $87.5 million in the third quarter of 2012 and included $5.2 million of revenue from the ACE Hydraulic and Kaman Canada businesses acquired in the fourth quarter of 2012. Segment earnings decreased $1.2 million, to $4.3 million, for the same comparative periods. The following factors contributed to the segment’s third quarter year-over-year results:
Bearings and power transmission parts sales increased $2.4 million which was more than accounted for by the Kaman Canada acquisition in western Canada. This increase was offset by reduced sales

12
to mining customers in central and eastern Canada and lower oil and gas and construction sector sales.
Fluid power and process equipment products and service revenue in the third quarter of 2013 increased $1.2 million, or 3%. The increase was due mainly to higher transportation sector sales in eastern Canada and construction sector sales in western Canada.
Segment earnings in 2013 decreased $1.2 million as the positive impact of higher volumes was offset by lower gross profit margins and a $0.7 million increase in selling and administrative expenses. The decline in gross profit margin resulted mainly from product sales mix, competitive pressures in western Canada and a higher inventory obsolescence provision. The increase in selling and administrative expenses resulted primarily from costs related to the two acquisitions and higher bad debt expenses offset partially by lower annual incentive accruals and other cost reductions.
Backlog of $39.3 million as of September 30, 2013 decreased $5.6 million compared to June 30, 2013 due mainly to lower orders received during the quarter. Backlog decreased $2.2 million compared to September 30, 2012.
Selected Quarterly Information
The following table summarizes unaudited quarterly consolidated financial data for the eight most recently completed quarters. This quarterly information is unaudited but has been prepared on the same basis as the 2012 annual audited Consolidated Financial Statements.
Significant seasonal trends in quarterly revenue and earnings have not been evident over the last two years. A discussion of Wajax’s previous quarterly results can be found in Wajax’s quarterly MD&A available on SEDAR at www.sedar.com.
Consolidated Financial Condition Capital Structure and Key Financial Condition Measures ($millions, except ratio calculations)
September 30 2013
June 30 2013
December 31 2012
Shareholders’ equity $ 243.2 $ 241.7 $ 241.9
Funded net debt(1)
225.3 221.2 173.7
Total capital $ 468.5 $ 462.9 $ 415.6
Funded net debt to total capital(1)
48.1% 47.8% 41.8%
Leverage ratio(1)(2)
2.4 2.2 1.6
Interest coverage ratio(1)(2)(3)
13.2 15.9 25.2
(1) See Non-GAAP and Additional GAAP Measures section. (2) Calculation uses trailing four-quarter EBITDA. (3) Calculation uses trailing four-quarter EBITDA and finance costs.
2013 2012 2011 Q3 Q2 Q1 Q4 Q3 Q2 Q1 Q4
Revenue $ 338.5 $ 362.1 $ 336.3 $ 364.9 $ 356.4 $ 386.6 $ 358.1 $ 377.2
Net earnings
$
11.5
$
13.5
$
10.4
$
14.2
$
16.2
$
18.5
$
17.1
$
16.6
Net earnings per share
- Basic $ 0.69 $ 0.81 $ 0.62 $ 0.85 $ 0.97 $ 1.11 $ 1.03 $ 1.00
- Diluted $ 0.68 $ 0.80 $ 0.61 $ 0.84 $ 0.95 $ 1.09 $ 1.01 $ 0.98

13
The Corporation’s capital structure is managed such that it maintains a relatively low leverage ratio as the Corporation pays dividends to shareholders equal to a significant portion of its earnings. The Corporation’s objective is to maintain a leverage ratio between 1.5 times and 2.0 times. However, there may be instances where the Corporation is willing to maintain a leverage ratio outside the range to either support key growth initiatives or fluctuations in working capital levels during changes in economic cycles. In addition, the Corporation’s tolerance to interest rate risk decreases/increases as the Corporation’s leverage ratio increases/decreases. At September 30, 2013, the rate of interest on the Corporation’s funded debt was all floating, which is within the Corporation’s interest rate risk policy. On October 23, 2013, the amount of the Corporation’s floating rate funded debt was reduced through the issuance of $125 million fixed rate notes. See the Liquidity and Capital Resources section.
Shareholders’ Equity The Corporation’s shareholders’ equity at September 30, 2013 of $243.2 million increased $1.5 million from June 30, 2013 as earnings exceeded dividends declared during the quarter. For the nine months ending September 30, 2013 the Corporation’s shareholder’s equity increased by $1.3 million as earnings exceeded dividends declared for the period. The Corporation’s share capital, included in shareholders’ equity on the balance sheet, consists of: Issued and fully paid Shares as at September 30, 2013 Number Amount
Balance at the beginning and end of the quarter 16,736,447 $ 106.7
At the date of this MD&A, the Corporation had 16,736,447 common shares outstanding. Wajax has five share-based compensation plans; the Wajax Share Ownership Plan (“SOP”), the Deferred Share Program (“DSP”), the Directors’ Deferred Share Unit Plan (“DDSUP”), the Mid-Term Incentive Plan for Senior Executives (“MTIP”) and the Deferred Share Unit Plan (“DSUP”). SOP, DSP and DDSUP rights are issued to the participants and are settled by issuing Wajax Corporation shares on a one-for-one basis. As of September 30, 2013, there were 280,967 (2012 – 246,271) SOP, DSP and DDSUP rights outstanding. The cash-settled MTIP and DSUP consist of annual grants that vest over three years and are subject to time and performance vesting criteria. A portion of the MTIP and the full amount of the DSUP grants are determined by the price of the Corporation’s shares. Compensation expense for the SOP, DSP and DDSUP is determined based upon the fair value of the rights at the date of grant and charged to earnings on a straight line basis over the vesting period, with an offsetting adjustment to contributed surplus. Compensation expense for the DSUP and the share-based portion of the MTIP varies with the price of the Corporation’s shares and is recognized over the vesting period. Wajax recorded compensation cost of $0.3 million for the quarter (2012 – $0.6 million) and $0.7 million for the nine months ended (2012 – $3.7 million) in respect of these plans.
Funded Net Debt ($millions)
September 30 2013
June 30
2013
December 31 2012
Bank indebtedness $ 0.6 $ 1.9 $ 10.2
Obligations under finance lease 13.0 11.5 11.8
Bank debt 211.7 207.9 151.7
Funded net debt $ 225.3 $ 221.2 $ 173.7
Funded net debt of $225.3 million at September 30, 2013 increased $4.1 million compared to June 30, 2013. The increase during the quarter was due to $9.7 million of cash generated from operating activities being less than dividends paid of $10.0 million, finance lease payments of $0.6 million and cash used in investing activities of $1.6 million.

14
Funded net debt of $225.3 million at September 30, 2013 increased $51.6 million compared to December 31, 2012. Cash used in operating activities during the period of $8.5 million resulted mainly from the impact of income taxes paid of $57.6 million. Other uses of cash included dividends paid of $36.0 million, investing activities of $3.8 million and finance lease payments of $1.9 million. The Corporation’s ratio of funded net debt to capital increased to 48.1% at September 30, 2013 from 47.8% at June 30, 2013 driven by the higher funded net debt level. The Corporation’s leverage ratio of 2.4 times at September 30, 2013 increased from the June 30, 2013 ratio of 2.2 times due mainly to the combined impact of increased funded net debt outstanding and lower EBITDA for the trailing four quarters. The Corporation’s interest coverage ratio declined to 13.2 times at September 30, 2013 from 15.9 times at June 30, 2013 due to the combined impact of the higher cost of increased funded net debt outstanding and lower EBITDA for the trailing four quarters. See the Liquidity and Capital Resources and the Non-GAAP and Additional GAAP Measures sections.
Financial Instruments Wajax uses derivative financial instruments in the management of its foreign currency and interest rate exposures. Wajax’s policy is not to utilize derivative financial instruments for trading or speculative purposes. Significant derivative financial instruments outstanding at the end of the period were as follows:
Wajax enters into short-term currency forward contracts to hedge the exchange risk associated with the cost of certain inbound inventory and certain foreign currency-denominated sales to customers along with the associated receivables as part of its normal course of business. As at September 30, 2013, Wajax had contracts outstanding to buy U.S. $26.8 million (December 31, 2012 – to buy U.S. $26.5 million and to sell U.S. $11.1 million, September 30, 2012 – to buy U.S. $25.8 million and to sell U.S. $4.1 million). The U.S. dollar contracts expire between October 2013 and July 2014, with a weighted average U.S./Canadian dollar rate of 1.0376.
Wajax measures derivative instruments not accounted for as hedging items at fair value with subsequent changes in fair value being recorded in earnings. Derivatives designated as effective hedges are measured at fair value with subsequent changes in fair value being recorded in other comprehensive income until the related hedged item is recorded and affects income. The fair value of derivative instruments is estimated based upon market conditions using appropriate valuation models. The carrying values reported in the balance sheet for financial instruments are not significantly different from their fair values. The impact of a change in foreign currency relative to the Canadian dollar on the Corporation’s financial statements of unhedged foreign currency-denominated sales to customers along with the associated receivables and purchases from vendors along with associated payables would be insignificant. Wajax is exposed to the risk of non-performance by counterparties to short-term currency forward contracts. These counterparties are large financial institutions with a “Stable” outlook and high short-term and long-term credit ratings from Standard and Poor’s. To date, no such counterparty has failed to meet its financial obligations to Wajax. Management does not believe there is a significant risk of non-performance by these counterparties and will continue to monitor the credit risk of these counterparties.
Contractual Obligations
There have been no material changes to the Corporation’s contractual obligations since December 31, 2012 except for the issuance on October 23, 2013 of $125 million of senior unsecured notes due October 23, 2020. See Liquidity and Capital Resources section.

15
Off Balance Sheet Financing Off balance sheet financing arrangements include operating lease contracts entered into for facilities with various landlords, office equipment with various non-bank lenders and a portion of the long-term lift truck rental fleet in the Equipment segment with a non-bank lender. There have been no material changes to the Corporation’s total obligations for all operating leases since December 31, 2012. See the Contractual Obligations section above. Although Wajax’s consolidated contractual annual lease commitments decline year-by-year, it is anticipated that existing leases will either be renewed or replaced, resulting in lease commitments being sustained at current levels. In the alternative, Wajax may incur capital expenditures to acquire equivalent capacity. The Equipment segment had $104.2 million (2012 – $91.2 million) of consigned inventory on-hand from a major manufacturer at September 30, 2013. In the normal course of business, Wajax receives inventory on consignment from this manufacturer which is generally sold to customers or purchased by Wajax. This consigned inventory is not included in Wajax’s inventory as the manufacturer retains title to the goods. In the event the inventory consignment program was terminated, Wajax would utilize interest free financing, if any, made available by the manufacturer and/or utilize capacity under its credit facilities.
Liquidity and Capital Resources The Corporation’s liquidity is maintained through various sources, including bank and non-bank credit facilities and cash generated from operations.
Bank and Non-bank Credit Facilities and Notes At September 30, 2013, Wajax had borrowed $213.0 million and issued $6.3 million of letters of credit for a total utilization of $219.3 million of its $300 million bank credit facility. Borrowing capacity under the bank credit facility is dependent on the level of inventories on-hand and outstanding trade accounts receivables. At September 30, 2013, borrowing capacity under the bank credit facility was equal to $300 million. On October 23, 2013 the Corporation issued $125 million of senior unsecured notes. The notes carry a coupon of 6.125% per annum and will mature on October 23, 2020. The notes contain customary incurrence based covenants that, although different from those under the bank credit facility, are not expected to be any more restrictive than under the bank credit facility. The issuance of the notes introduces a longer term fixed rate layer of debt into Wajax’s capital structure at a time when interest rates remain historically low. The net proceeds of the notes were used to repay borrowings under the Corporation’s bank credit facility, which in turn may be redrawn for general corporate purposes. The cost of issuing the notes, approximately $3.5 million, will be amortized over the seven year term of the notes. Effective upon the note issuance, the Corporation reduced the total available committed amount of the bank credit facility from $300 million to $250 million. The fully secured bank credit facility is now comprised of a $60 million non-revolving term portion and a $190 million revolving term portion. Under the terms of the bank credit facility, Wajax is permitted to have additional interest bearing debt of $15 million. As such, Wajax has up to $15 million of demand inventory equipment financing capacity with three non-bank lenders. At September 30, 2013 Wajax had no utilization of these interest bearing equipment financing facilities. As of November 5, 2013, Wajax’s $250 million bank credit facility, along with the additional $15 million of capacity permitted under the bank credit facility and the $125 million of notes, should be sufficient to meet Wajax’s short-term normal course working capital and maintenance capital requirements. However, Wajax may be required to access the equity or debt markets in order to fund significant acquisitions and growth related working capital and capital expenditures.

16
Cash Flow The following table highlights the major components of cash flow as reflected in the Consolidated Statements of Cash Flows for the three and nine months ended September 30, 2013.
Three months ended Nine months ended
September 30 September 30
($millions) 2013 2012 2013 2012
Net earnings $ 11.5 $ 16.2 $ 35.5 $ 51.7
Items not affecting cash flow 12.8 11.6 34.8 34.9
Net change in non-cash operating working capital
(3.4) (23.2) 0.9 (89.0)
Income taxes paid (4.2) 0.0 (57.6) (0.5)
Other cash items(1)
(7.0) (8.7) (22.1) (27.5)
Cash generated from (used in) operating activities
$ 9.7 $ (4.2) $ (8.5) $ (30.3)
Cash used in investing activities $ (1.6) $ (1.5) $ (3.8) $ (5.4)
Cash (used in) generated from financing activities
$ (6.9) $ 15.1 $ 21.9 $ 24.0
(1) Other cash items includes rental equipment additions, changes in other non-current liabilities and finance costs paid
Cash Generated From (Used In) Operating Activities Cash flows generated from operating activities amounted to $9.7 million in the third quarter of 2013, compared to $4.2 million of cash used in operating activities in the same quarter of the previous year. The $13.9 million increase was mainly attributable to a reduction in cash used for non-cash working capital of $19.8 million, offset mostly by reduced earnings of $4.7 million and higher income taxes paid of $4.2 million. For the nine months ended September 30, 2013, cash flows used in operating activities amounted to $8.5 million, compared to $30.3 million of cash used in operating activities for the same period in the previous year. The $21.8 million decrease in cash flows used in operating activities was mainly attributable to cash generated from the change in non-cash working capital of $0.9 million during the current period compared to a use of $89.0 million for the same period last year, offset mostly by higher income taxes paid of $57.1 million and reduced earnings of $16.2 million. Income taxes paid of $57.6 million during the current period were comprised of a $44.6 million payment relating to 2011 and 2012 taxable income and 2013 income tax installments of $13.0 million. Significant components of non-cash operating working capital, along with changes for the three and nine months ending September 30, 2013 include the following:
Changes in Non-cash Operating Working Capital(1)
Three months ended Nine months ended
September 30
2013
September 30
2012
September 30
2013
September 30
2012
Trade and other receivables $ (1.3) $ 11.4 $ 9.2 $ (10.2)
Inventories (12.7) (5.3) (16.5) (47.9)
Prepaid expenses 0.9 2.5 1.0 1.7
Accounts payable and accrued liabilities
9.9 (31.6) 8.6 (31.4)
Provisions (0.2) (0.1) (1.4) (1.1)
Total Changes in Non-cash Operating Working Capital
$ (3.4) $ (23.2) $ 0.9 $ (89.0)
(1) Increase (decrease) in cash flow

17
Significant components of the changes in non-cash operating working capital for the quarter ended September 30, 2013 compared to the same quarter in 2012 are as follows:
Trade and other receivables increased $1.3 million in 2013 compared to a decrease of $11.4 million in 2012. The decrease in 2012 was attributable to lower sales activity in the Power Systems segment’s western Canada operation and in the Industrial Components segment.
Inventories increased $12.7 million in the current year, due mainly to higher mining and forestry equipment inventory in the Equipment segment. This compared to an increase of $5.3 million in 2012 due mainly to higher mining equipment inventory in the Equipment segment.
Accounts payable and accrued liabilities increased $9.9 million in 2013 compared to a decrease of $31.6 million in 2012. The increase in 2013 resulted primarily from higher inventory trade payables in the Equipment and Power Systems segments during the quarter. The decrease last year was attributable to reductions in the Equipment segment’s trade payables and customer deposits related to mining equipment sales.
Significant components of the changes in non-cash operating working capital for the nine months ended September 30, 2013 compared to the same period in 2012 are as follows:
Trade and other receivables decreased $9.2 million in 2013 compared to an increase of $10.2 million in 2012. The decrease in 2013 resulted primarily from lower sales activity in all segments and the collection of a large mining equipment receivable in the Equipment segment. The increase last year was driven by a significant increase in the Equipment segment related to mining equipment deliveries offset partially by reductions in the Power Systems segment on lower sales activity.
Inventories were $16.5 million higher in the current year compared to an increase of $47.9 million in 2012. The increase in 2013 resulted primarily from higher mining and construction equipment inventory in the Equipment segment. The increase in 2012 was primarily attributable to a $26.8 million increase in mining equipment in the Equipment segment. Also contributing to the 2012 increase were higher levels of construction equipment in the Equipment segment, project related engines in Power Systems segment’s eastern Canada operation and increased stock levels in the Industrial Components segment’s western Canada operation.
Accounts payable and accrued liabilities increased $8.6 million in 2013 compared to a decrease of $31.4 million in 2012. The increase in 2013 resulted primarily from higher inventory trade payables in the Equipment and Power Systems segments. The decrease in 2012 was primarily attributable to decreased customer deposits related to mining equipment sales and lower inventory trade payables in the Equipment segment.
Investing Activities During the third quarter of 2013, Wajax invested $1.6 million in property, plant and equipment additions, net of disposals, compared to $1.4 million in the third quarter of 2012. For the nine months ended September 30, 2013, Wajax invested $3.8 million in property, plant and equipment additions, net of disposals, compared to $5.2 million in the same period of 2012. Financing Activities The Corporation used $6.9 million of cash from financing activities in the third quarter of 2013 compared to $15.1 million generated in the same quarter of 2012. Financing activities in the quarter included bank debt borrowings of $4.0 million, for general corporate purposes, that were more than offset by dividends paid to shareholders totaling $10.0 million, or $0.60 per share, and finance lease payments of $0.6 million.
For the nine months ended September 30, 2013, the Corporation generated $21.9 million of cash from financing activities compared to $24.0 million in the same period of 2012. Financing activities for the nine months ended included bank debt borrowings of $60.0 million, offset by dividends paid to shareholders totaling $36.0 million, or $2.15 per share, and finance lease payments of $1.9 million. The bank debt

18
borrowings of $60.0 million during the period funded the income taxes paid and other cash items, as noted in the table above highlighting the major components of cash flow.
Dividends
Dividends to shareholders were declared as follows:
Record Date Payment Date Per Share Amount
July 31, 2013 August 20, 2013 $ 0.20 $ 3.3 August 30, 2013 September 20, 2013 0.20 3.3 September 30, 2013 October 21, 2013 0.20 3.3
Three months ended September 30, 2013 $ 0.60 $ 9.9
On August 9, 2013, Wajax announced a monthly dividend of $0.20 per share ($2.40 annualized) for the month of October payable on November 20, 2013 to shareholders of record on October 31, 2013. On November 5, 2013, Wajax announced monthly dividends of $0.20 per share ($2.40 annualized) for each of the months of November, December, January and February payable on December 20, 2013, January 20, 2014, February 20, 2014 and March 20, 2014 to shareholders of record on November 29, 2013, December 31, 2013, January 31, 2014 and February 28, 2014 respectively. See the Strategic Direction and Outlook section.
Non-GAAP and Additional GAAP Measures
The MD&A contains certain non-GAAP and additional GAAP measures that do not have a standardized meaning prescribed by GAAP. Therefore, these financial measures may not be comparable to similar measures presented by other issuers. Investors are cautioned that these measures should not be construed as an alternative to profit or to cash flow from operating, investing, and financing activities determined in accordance with GAAP as indicators of the Corporation’s performance. The Corporation’s management believes that:
(i) these measures are commonly reported and widely used by investors, (ii) the non-GAAP measures are commonly used as an indicator of a company’s cash operating
performance and ability to raise and service debt, and (iii) the additional GAAP measures are commonly used to assess a company’s earnings
performance excluding its capital and tax structures. Non-GAAP financial measures are identified and defined below: Leverage ratio
At the end of a particular quarter, the leverage ratio is defined as funded net debt at the end of a particular quarter divided by trailing 12-month EBITDA. The Corporation’s objective is to maintain this ratio between 1.5 times and 2.0 times.
Interest coverage ratio At the end of a particular quarter, the interest coverage ratio is defined as trailing 12-month EBITDA divided by trailing 12-month finance costs.
Funded net debt Funded net debt includes bank debt, bank indebtedness and obligations under finance leases, net of cash.
EBITDA Earnings before finance costs, income tax expense, depreciation and amortization.
Funded net debt to total capital
Defined as funded net debt divided by total capital. Total capital is the funded net debt plus shareholder’s equity.

19
Additional GAAP measures are identified and defined below: Earnings before finance costs and income taxes (EBIT)
Defined as gross profit less selling and administrative expenses.
Earnings before income taxes
Defined as gross profit less selling and administrative expenses less finance costs.
Reconciliation of the Corporation’s net earnings to EBITDA is as follows: For the twelve
months ended September 30
For the twelve months ended
June 30
For the twelve months ended
December 31 2013 2013 2012
Net earnings $ 49.7 $ 54.3 $ 65.9 Depreciation and amortization 20.5 19.5 17.8 Finance costs 7.2 6.2 4.4 Income tax expense 17.7 19.3 23.8
EBITDA $ 95.1 $ 99.3 $ 112.0
Calculation of the Corporations funded net debt, leverage ratio and interest coverage ratio is as follows: September 30 June 30 December 31 2013 2013 2012
Bank indebtedness $ 0.6 $ 1.9 $ 10.2 Obligations under finance leases 13.0 11.5 11.8 Bank debt 211.7 207.9 151.7
Funded net debt $ 225.3 $ 221.2 $ 173.7
Leverage ratio
2.4
2.2
1.6
Interest coverage ratio
13.2
15.9
25.2
Critical Accounting Estimates The preparation of the consolidated financial statements in conformity with IFRS requires management to make judgements, estimates and assumptions that affect the application of accounting policies and the reported amounts of assets, liabilities, revenue and expenses. Actual results could differ from those judgements, estimates and assumptions. The Corporation bases its estimates on historical experience and various other assumptions that are believed to be reasonable in the circumstances. The areas where significant judgements and assumptions are used to determine the amounts recognized in the financial statements include the allowance for doubtful accounts, inventory obsolescence, goodwill and intangible assets, and warranty provision. In preparing the financial statements for the quarter ended September 30, 2013, the significant judgments made by management in applying the Corporation’s accounting policies and the key sources of estimation uncertainty are the same as those applied in the recently reported audited consolidated financial statements for the year ended December 31, 2012 which can be found on SEDAR at www.sedar.com.

20
Changes in Accounting Policies
The following new standards have been adopted in the current year: On January 1, 2013, the Corporation adopted the amendments to IFRS 7 Offsetting Financial Assets and Liabilities, which contains new disclosure requirements for financial assets and liabilities that are offset in the statement of financial position or are subject to master netting arrangements or similar arrangements. The impact on the disclosures in the condensed consolidated financial statements from adopting IFRS 7 was not material. On January 1, 2013, the Corporation adopted IFRS 10 Consolidated Financial Statements, which establishes principles for the preparation and presentation of consolidated financial statements when an entity controls one or more other entities. There was no impact on the condensed consolidated financial statements from adopting IFRS 10. On January 1, 2013, the Corporation adopted IFRS 13 Fair Value Measurement, which defines fair value and sets out a framework for measuring fair value when fair value measurements are required or permitted by other standards. It also requires disclosure of the valuation techniques and inputs for financial instruments measured at fair value. The impact on the disclosures in the condensed consolidated financial statements from adopting IFRS 13 was not material. On January 1, 2013, the Corporation retrospectively adopted IAS 19R Employee Benefits, which requires recognition of actuarial gains and losses immediately in other comprehensive income, the full recognition of past service costs immediately in profit or loss, recognition of the expected return on plan assets in profit or loss to be calculated based on the rate used to discount the defined benefit obligation, and certain additional disclosures. No adjustment to prior years’ financial statements was necessary. The impact on the current year condensed consolidated financial statements from adopting IAS 19R was not material. New standards and interpretations not yet adopted The new standards or amendments to existing standards that may be significant to the Corporation set out below are not yet effective for the year ended December 31, 2013 and have not been applied in preparing these consolidated financial statements. It is currently anticipated that as of January 1, 2015, the Corporation will be required to adopt IFRS 9 Financial Instruments, which is the result of the first phase of the IASB’s project to replace IAS 39 Financial Instruments: Recognition and Measurement. The new standard replaces the current multiple classification and measurement models for financial assets and liabilities with a single model that has only two classification categories: amortized cost and fair value. The Corporation is currently assessing the impact of this standard on its consolidated financial statements.
Risk Management and Uncertainties As with most businesses, Wajax is subject to a number of marketplace and industry related risks and uncertainties which could have a material impact on operating results and Wajax’s ability to pay cash dividends to shareholders. Wajax attempts to minimize many of these risks through diversification of core businesses and through the geographic diversity of its operations. In addition, Wajax has adopted an annual enterprise risk management assessment which is prepared by the Corporation’s senior management and overseen by the Board of Directors and Committees of the Board. The enterprise risk management framework sets out principles and tools for identifying, evaluating, prioritizing and managing risk effectively and consistently across Wajax. There are however, a number of risks that deserve particular comment which are discussed in detail in the MD&A for the year ended December 31, 2012 which can be found on SEDAR at www.sedar.com. There have been no material changes to the business of Wajax that require an update to the discussion of the applicable risks discussed in the MD&A for the year ended December 31, 2012.

21
Strategic Direction and Outlook Third quarter revenue and earnings were largely as expected. When compared to last year, revenue was negatively affected by continued weakness in the oil and gas and mining markets. Mining related revenue declines, including the loss of the LeTourneau product line, were partially mitigated by increases in mining associated aftermarket sales driven by improvements in equipment support revenue and continuing gains from the Equipment segment’s rotating products growth initiative. Management expects the weakness in the oil and gas market to remain for the balance of 2013, with demand for new equipment and aftermarket services for drilling and well stimulation continuing to be soft. In mining, quoting activity remains at a reasonable level for the Equipment segment, as well as Power Systems’ electrical power generation business. However, lower commodity prices continue to result in mining customers reducing their capital and development spending, limiting their ability to commit to new equipment orders. In spite of this, the Corporation was able to increase its consolidated backlog on increases in non-mining related orders and electric power generation orders in the Equipment and Power Systems segments respectively. As well, the commercial trial of the four Hitachi EH5000 320 ton mining trucks began in the oil sands in the fourth quarter. Consistent with the Corporation’s expectation disclosed at the end of the second quarter, management is maintaining a cautious outlook regarding its end markets for the rest of 2013 and continues to expect that full year 2013 earnings will be less than 2012. Additional information, including Wajax’s Annual Report and Annual Information Form, are available on SEDAR at www.sedar.com.

22
WAJAX CORPORATION
Unaudited Condensed Consolidated Financial Statements
For the three and nine months ended September 30, 2013
Notice required under National Instrument 51-102, “Continuous Disclosure Obligations” Part 4.3(3) (a):
The attached condensed consolidated financial statements have been prepared by Management of Wajax Corporation and have not been reviewed by the Corporation’s auditors.

23
W A J A X C O R P O R A T I O N
C O N D E N S E D C O N S O L I D A T E D S T A T E M E N T S O F
F I N A N C I A L P O S I T I O N
As at (unaudited, in thousands of Canadian dollars)
Note September
30, 2013 December
31, 2012
ASSETS CURRENT Trade and other receivables $ 185,332 $ 194,567 Inventories 303,273 285,185 Income taxes receivable 1,571 - Prepaid expenses 6,073 7,089
496,249 486,841
NON-CURRENT Rental equipment 4 49,386 43,731 Property, plant and equipment 5 50,705 50,700 Intangible assets 86,309 87,668 Deferred taxes 8 1,941 2,922
188,341 185,021
$ 684,590 $ 671,862
LIABILITIES AND SHAREHOLDERS’ EQUITY CURRENT Bank indebtedness $ 631 $ 10,195 Accounts payable and accrued liabilities 195,219 186,897 Provisions 5,595 7,033 Dividends payable 6 3,347 4,519 Income taxes payable - 44,349 Obligations under finance leases 3,823 3,611 Derivative instruments 30 149
208,645 256,753
NON-CURRENT Provisions 3,358 4,088 Employee benefits 7,619 7,160 Other liabilities 913 2,083 Obligations under finance leases 9,163 8,192 Bank debt 211,702 151,701
232,755 173,224
SHAREHOLDERS’ EQUITY Share capital 106,651 106,651 Contributed surplus 4,906 4,346 Retained earnings 131,603 130,944 Accumulated other comprehensive income (loss) 30 (56)
Total shareholders’ equity 243,190 241,885
$ 684,590 $ 671,862
These condensed consolidated financial statements were approved by the Board of Directors on November 5, 2013.

24
W A J A X C O R P O R A T I O N
C O N D E N S E D C O N S O L I D A T E D S T A T E M E N T S O F
E A R N I N G S
(unaudited, in thousands of Canadian dollars, except per share data) Note
Three months ended September 30
Nine months ended September 30
2013 2012 2013 2012
Revenue $ 338,460 $ 356,396 $ 1,036,783 $ 1,101,085 Cost of sales 269,167 285,304 824,590 872,880
Gross profit 69,293 71,092 212,193 228,205
Selling and administrative expenses 51,442 48,087 158,160 154,662
Earnings before finance costs and income taxes 17,851 23,005 54,033 73,543 Finance costs 2,146 1,161 5,891 3,105
Earnings before income taxes 15,705 21,844 48,142 70,438 Income tax expense 8 4,160 5,669 12,671 18,693
Net earnings $ 11,545 $ 16,175 $ 35,471 $ 51,745
Basic earnings per share 9 $ 0.69 $ 0.97 $ 2.12 $ 3.10
Diluted earnings per share 9 $ 0.68 $ 0.95 $ 2.09 $ 3.05
W A J A X C O R P O R A T I O N
C O N D E N S E D C O N S O L I D A T E D S T A T E M E N T S O F
C O M P R E H E N S I V E I N C O M E
(unaudited, in thousands of Canadian dollars)
Three months ended September 30
Nine months ended September 30
2013 2012 2013 2012
Net earnings $ 11,545 $ 16,175 $ 35,471 $ 51,745
Items that will be subsequently reclassified to income (Gains) losses on derivative instruments designated as cash flow hedges in prior periods reclassified to cost of inventory or finance costs during the period, net of tax expense of $51 (2012 – recovery of $12) and year to date, net of tax expense of $73 (2012 – recovery of $121)
(145)
34
(206)
331 (Losses) gains on derivative instruments outstanding at the end of the period designated as cash flow hedges, net of tax recovery of $16 (2012 – $79) and year to date, net of tax expense of $104 (2012 – recovery of $134)
(46)
(223)
292
(381)
Other comprehensive (loss) income, net of tax (191) (189) 86 (50)
Total comprehensive income $ 11,354 $ 15,986 $ 35,557 $ 51,695

25
W A J A X C O R P O R A T I O N
C O N D E N S E D C O N S O L I D A T E D S T A T E M E N T S O F
C H A N G E S I N S H A R E H O L D E R S ’ E Q U I T Y
Accumulated other
comprehensive income (loss)
(“AOCL”)
For the nine months ended September 30, 2013 (unaudited, in thousands of Canadian dollars)
Note
Share capital
Contributed surplus
Retained earnings
Cash flow hedges
Total
January 1, 2013 $ 106,651 4,346 130,944 (56) $ 241,885
Net earnings - - 35,471 - 35,471 Other comprehensive income - - - 86 86
Total comprehensive income for the period - - 35,471 86 35,557 Dividends 6 - - (34,812) - (34,812) Share-based compensation expense 7 - 560 - - 560
September 30, 2013 $ 106,651 4,906 131,603 30 $ 243,190

26
W A J A X C O R P O R A T I O N
C O N D E N S E D C O N S O L I D A T E D S T A T E M E N T S O F
C H A N G E S I N S H A R E H O L D E R S ’ E Q U I T Y
AOCL
For the nine months ended September 30, 2012 (unaudited, in thousands of Canadian dollars)
Note
Share capital
Contributed surplus
Retained earnings
Cash flow hedges
Total
January 1, 2012 $ 105,371 4,888 117,477 (150) $ 227,586
Net earnings - - 51,745 - 51,745 Other comprehensive income - - - (50) (50)
Total comprehensive income for the period - - 51,745 (50) 51,695 Shares issued to settle share-based compensation plans 1,280 (1,280) - - - Dividends 6 - - (38,232) - (38,232) Share-based compensation expense 7 - 519 - - 519
September 30, 2012 $ 106,651 4,127 130,990 (200) $ 241,568

27
W A J A X C O R P O R A T I O N
C O N D E N S E D C O N S O L I D A T E D S T A T E M E N T S O F
C A S H F L O W S
Three months ended
September 30 Nine months ended
September 30
(unaudited, in thousands of Canadian dollars) Note 2013 2012 2013 2012
OPERATING ACTIVITIES
Net earnings $ 11,545 $ 16,175 $ 35,471 $ 51,745
Items not affecting cash flow: Depreciation and amortization: Rental equipment 2,613 2,079 7,194 5,479 Property, plant and equipment 2,449 2,153 6,851 6,202 Intangible assets 458 360 1,387 1,090 (Gain) loss on disposal of property, plant and equipment 5 (22) (17) (29) 129 Share-based compensation expense 7 185 222 560 519 Non-cash rental expense 18 (374) (162) (663) Employee benefits expense, net of payments 154 21 459 15 Unrealized loss (gain) on derivative instruments 643 295 (2) 313 Finance costs 2,146 1,161 5,891 3,105 Income tax expense 8 4,160 5,669 12,671 18,693
24,349 27,744 70,291 86,627
Changes in non-cash operating working capital 10 (3,415) (23,191) 871 (88,985)
Rental equipment additions 4 (4,846) (7,926) (14,425) (21,493) Other non-current liabilities (164) 279 (1,900) (3,222) Finance costs paid (2,011) (1,072) (5,735) (2,741) Income taxes paid (4,174) (25) (57,608) (500)
Cash generated from (used in) operating activities 9,739 (4,191) (8,506) (30,314)
INVESTING ACTIVITIES
Property, plant and equipment additions 5 (1,684) (1,469) (3,974) (5,648) Proceeds on disposal of property, plant and equipment 5 58 108 214 495 Intangible assets additions - (168) (30) (205)
Cash used in investing activities (1,626) (1,529) (3,790) (5,358)
FINANCING ACTIVITIES
Net increase in bank debt 4,000 29,000 60,000 62,998
Deferred financing costs (275) 7 (275) (225) Finance lease payments (553) (339) (1,881) (1,734) Dividends paid (10,042) (13,557) (35,984) (37,039)
Cash (used in) generated from financing activities (6,870) 15,111 21,860 24,000
Change in bank indebtedness 1,243 9,391 9,564 (11,672)
(Bank indebtedness) cash - beginning of period (1,874) (15,404) (10,195) 5,659
Bank indebtedness - end of period $ (631) $ (6,013) $ (631) $ (6,013)

28
W A J A X C O R P O R A T I O N
N O T E S T O C O N D E N S E D C O N S O L I D A T E D
F I N A N C I A L S T A T E M E N T S
SEPTEMBER 30, 2013
(unaudited, amounts in thousands of Canadian dollars, except share and per share data)
1. COMPANY PROFILE
Wajax Corporation (the “Corporation”) is incorporated in Canada. The address of the Corporation’s registered
office is 3280 Wharton Way, Mississauga, Ontario, Canada. The Corporation’s core distribution businesses are
engaged in the sale, rental and after-sale parts and service support of mobile equipment, power systems and
industrial components, through a network of 126 branches across Canada. The Corporation is a multi-line
distributor and represents a number of leading worldwide manufacturers across its core businesses. Its customer
base is diversified, spanning natural resources, construction, transportation, manufacturing, industrial processing
and utilities.
2. BASIS OF PREPARATION
Statement of compliance
These condensed consolidated financial statements have been prepared in accordance with International
Accounting Standard 34 Interim Financial Reporting and do not include all of the disclosures required for full
consolidated financial statements. Accordingly, these condensed consolidated financial statements should be
read in conjunction with the audited consolidated financial statements of Wajax Corporation for the year ended
December 31, 2012. The significant accounting policies follow those disclosed in the most recently reported
audited consolidated financial statements except as disclosed in Note 3.
Basis of measurement
The condensed consolidated financial statements have been prepared under the historical cost basis except for
derivative financial instruments and liabilities for cash-settled share-based payment arrangements that have been
measured at fair value. The defined benefit liability is recognized as the net of the fair value of the plan assets
less the present value of the defined benefit obligation.
Functional and presentation currency
These condensed consolidated financial statements are presented in Canadian dollars, which is the Corporation’s
functional currency. All financial information presented in Canadian dollars has been rounded to the nearest
thousand, unless otherwise stated and except share and per share data.

29
3. CHANGE IN ACCOUNTING POLICIES
The following new standards have been adopted in the current year:
On January 1, 2013, the Corporation adopted the amendments to IFRS 7 Offsetting Financial Assets and
Liabilities, which contains new disclosure requirements for financial assets and liabilities that are offset in the
statement of financial position or are subject to master netting arrangements or similar arrangements. The impact
on the disclosures in the condensed consolidated financial statements from adopting IFRS 7 was not material.
On January 1, 2013, the Corporation adopted IFRS 10 Consolidated Financial Statements, which establishes
principles for the preparation and presentation of consolidated financial statements when an entity controls one or
more other entities. There was no impact on the condensed consolidated financial statements from adopting IFRS
10.
On January 1, 2013, the Corporation adopted IFRS 13 Fair Value Measurement, which defines fair value and sets
out a framework for measuring fair value when fair value measurements are required or permitted by other
standards. It also requires disclosure of the valuation techniques and inputs for financial instruments measured at
fair value. The impact on the disclosures in the condensed consolidated financial statements from adopting IFRS
13 was not material.
On January 1, 2013, the Corporation retrospectively adopted IAS 19R Employee Benefits, which requires
recognition of actuarial gains and losses immediately in other comprehensive income, the full recognition of past
service costs immediately in profit or loss, recognition of the expected return on plan assets in profit or loss to be
calculated based on the rate used to discount the defined benefit obligation, and certain additional disclosures. No
adjustment to prior years’ financial statements was necessary. The impact on the current year condensed
consolidated financial statements from adopting IAS 19R was not material.
4. RENTAL EQUIPMENT
The Corporation acquired rental equipment with a cost of $4,846 during the quarter (2012 – $7,926) and $14,425
year to date (2012 – $21,493). Rental equipment with a carrying amount of $596 during the quarter (2012 – $596)
and $1,576 year to date (2012 – $1,246) ceased to be rented and was classified as held for sale in the normal
course of business and transferred to inventories.

30
5. PROPERTY, PLANT AND EQUIPMENT
The Corporation acquired property, plant and equipment with a cost of $1,684 during the quarter (2012 – $1,469)
and $3,974 year to date (2012 – $5,648). Assets with a carrying amount of $36 during the quarter (2012 – $91)
and $185 year to date (2012 – $624) were disposed of, resulting in a gain on disposal of $22 during the quarter
(2012 – $17) and $29 year to date (2012 – loss of $129).
6. DIVIDENDS DECLARED
During the three months ended September 30, 2013, the Corporation declared cash dividends of $0.60 per share
or $10,042 (2012 – dividends of $0.81 per share or $13,557).
Year to date, the Corporation declared cash dividends of $2.08 per share or $34,812 (2012 – dividends of $2.29
per share or $38,232).
The Corporation has declared dividends of $0.20 per share or $3,347 for the month of October 2013.
7. SHARE-BASED COMPENSATION PLANS
The Corporation has five share-based compensation plans: the Wajax Share Ownership Plan (“SOP”), the
Deferred Share Program (“DSP”), the Directors’ Deferred Share Unit Plan (“DDSUP”), the Mid-Term Incentive
Plan for Senior Executives (“MTIP”) and the Deferred Share Unit Plan (“DSUP”).
a) Share Rights Plans
The Corporation recorded compensation cost of $185 for the quarter (2012 – $222) and $560 for the year to date
(2012 – $519) in respect of these plans.
Share Rights Plans September 30, 2013 September 30, 2012
Number of Rights
Fair value at time of grant
Number of Rights
Fair value at time of grant
Outstanding at beginning of year 254,952 $ 4,932 316,595 $ 4,908 Granted in the period – new grants 10,759 253 23,417 1,148 – dividend equivalents 15,256 - 13,262 - Settled in the period - - (107,003) (1,280)
Outstanding at end of period 280,967 $ 5,185 246,271 $ 4,776
At September 30, 2013, 265,239 share rights were vested (2012 – 226,910).
b) Cash-settled rights plans
The Corporation recorded compensation cost of $159 for the quarter (2012 – $397) and $155 for the year to date
(2012 – $3,166) in respect of the share-based portion of the MTIP and DSUP. At September 30, 2013, the
carrying amount of the share-based portion of these liabilities was $1,140 (September 30, 2012 – $6,633).

31
8. INCOME TAXES
Income tax expense comprises current and deferred tax as follows:
For the nine months ended September 30
2013
2012
Current $ 11,720 $ 40,430 Deferred – Origination and reversal of temporary difference 951 (21,692) – Change in tax law and rates - (45)
Income tax expense $ 12,671 $ 18,693
The calculation of current tax is based on a combined federal and provincial statutory income tax rate of 26.1%
(2012 – 26.2%). Deferred tax assets and liabilities are measured at tax rates that are expected to apply to the
period when the asset is realized or the liability is settled. Deferred tax assets and liabilities have been measured
using an expected average combined statutory income tax rate of 26.1% based on the tax rates in years when the
temporary differences are expected to reverse.
The reconciliation of effective income tax rate is as follows:
2013 2012
Combined statutory income tax rate 26.1% 26.2%
Expected income tax expense at statutory rates $ 12,565 $ 18,455 Non-deductible expenses 422 383 Deferred tax related to changes in tax law and rates - (45) Other (316) (100)
Income tax expense $ 12,671 $ 18,693

32
9. EARNINGS PER SHARE
The following table sets forth the computation of basic and diluted earnings per share:
Three months ended September 30
Nine months ended September 30
2013 2012 2013 2012
Numerator for basic and diluted earnings per share:
– net earnings $ 11,545 $ 16,175 $ 35,471 $ 51,745
Denominator for basic earnings per share: – weighted average shares
16,736,447 16,736,447 16,736,447 16,687,593
Denominator for diluted earnings per share:
– weighted average shares 16,736,447 16,736,447 16,736,447 16,687,593
– effect of dilutive share rights 263,682 227,247 255,118 259,443
Denominator for diluted earnings per share 17,000,129 16,963,694 16,991,565 16,947,036
Basic earnings per share $ 0.69 $ 0.97 $ 2.12 $ 3.10
Diluted earnings per share $ 0.68 $ 0.95 $ 2.09 $ 3.05
No share rights were excluded from the above calculations as none were anti-dilutive.
10. CHANGES IN NON-CASH OPERATING WORKING CAPITAL
Three months ended September 30
Nine months ended September 30
2013 2012 2013 2012
Trade and other receivables $ (1,335) $ 11,386 $ 9,235 $ (10,239) Inventories (12,718) (5,281) (16,512) (47,889) Prepaid expenses 877 2,447 1,016 1,679 Accounts payable and accrued liabilities 9,919 (31,631) 8,570 (31,434) Provisions (158) (112) (1,438) (1,102)
Total $ (3,415) $ (23,191) $ 871 $ (88,985)

33
11. OPERATING SEGMENTS
The Corporation operates through a network of 126 branches in Canada in three core businesses which reflect
the internal organization and management structure according to the nature of the products and services
provided. The Corporation’s three core businesses are: i) the distribution, modification and servicing of
equipment; ii) the distribution, servicing and assembly of power systems; and iii) the distribution, servicing and
assembly of industrial components.
For the three months ended September 30, 2013
Equipment
Power
Systems Industrial
Components
Segment Eliminations
and Unallocated
Amounts Total
Equipment $ 94,788 $ 19,548 $ - $ - $ 114,336 Parts 47,503 31,962 85,862 - 165,327 Service 25,944 15,615 5,201 - 46,760 Rental and other 11,262 2,077 - (1,302) 12,037 Revenue $ 179,497 $ 69,202 $ 91,063 $ (1,302) $ 338,460
Segment earnings before finance costs and income taxes
$ 11,789 $ 3,740 $ 4,288 $ - $ 19,817 Corporate costs and eliminations - - - (1,966) (1,966)
Earnings before finance costs and income taxes
11,789 3,740 4,288 (1,966) 17,851
Finance costs - - - 2,146 2,146
Income tax expense - - - 4,160 4,160
Net earnings $ 11,789 $ 3,740 $ 4,288 $ (8,272) $ 11,545
For the nine months ended September 30, 2013
Equipment
Power
Systems Industrial
Components
Segment Eliminations
and Unallocated
Amounts Total
Equipment $ 292,214 $ 63,369 $ - $ - $ 355,583 Parts 136,919 100,307 262,103 - 499,329 Service 81,884 49,008 13,725 - 144,617 Rental and other 34,476 5,883 - (3,105) 37,254 Revenue $ 545,493 $ 218,567 $ 275,828 $ (3,105) $ 1,036,783
Segment earnings before finance costs and income taxes
$ 35,596 $ 11,098 $ 12,841 $ $ 59,535 Corporate costs and eliminations - - - (5,502) (5,502)
Earnings before finance costs and income taxes
35,596 11,098 12,841 (5,502) 54,033
Finance costs - - - 5,891 5,891
Income tax expense - - - 12,671 12,671
Net earnings $ 35,596 $ 11,098 $ 12,841 $ (24,064) $ 35,471

34
As at September 30, 2013
Segment assets excluding intangible assets
$ 328,894 $ 144,752 $ 120,184 $ - $ 593,830 Intangible assets 21,712 14,287 50,310 - 86,309 Corporate and other assets - - - 4,451 4,451 Total assets $ 350,606 $ 159,039 $ 170,494 $ 4,451 $ 684,590
Segment liabilities
$ 125,414 $ 43,392 $ 47,298 $ - $ 216,104 Corporate and other liabilities - - - 225,296 225,296 Total liabilities $ 125,414 $ 43,392 $ 47,298 $ 225,296 $ 441,400
For the three months ended September 30, 2012
Equipment
Power
Systems Industrial
Components
Segment Eliminations
and Unallocated
Amounts Total
Equipment $ 122,300 $ 27,383 $ - $ - $ 149,683 Parts 38,526 31,114 82,909 - 152,549 Service 23,177 15,863 4,575 - 43,615 Rental and other 10,190 1,234 - (875) 10,549 Revenue $ 194,193 $ 75,594 $ 87,484 $ (875) $ 356,396
Segment earnings before finance costs and income taxes
$ 13,306 $ 6,004 $ 5,511 $ - $ 24,821 Corporate costs and eliminations - - - (1,816) (1,816) Earnings before finance costs and income taxes
13,306 6,004 5,511 (1,816) 23,005
Finance costs - - - 1,161 1,161
Income tax expense - - - 5,669 5,669
Net earnings $ 13,306 $ 6,004 $ 5,511 $ (8,646) $ 16,175
For the nine months ended September 30, 2012
Equipment
Power
Systems Industrial
Components
Segment Eliminations
and Unallocated
Amounts Total
Equipment $ 356,832 $ 93,518 $ - $ - $ 450,350 Parts 123,203 103,738 260,485 - 487,426 Service 70,493 52,087 14,239 - 136,819 Rental and other 26,337 3,924 - (3,771) 26,490 Revenue $ 576,865 $ 253,267 $ 274,724 $ (3,771) $ 1,101,085
Segment earnings before finance costs and income taxes
$ 42,135 $ 21,115 $ 18,523 $ - $ 81,773 Corporate costs and eliminations - - - (8,230) (8,230) Earnings before finance costs and income taxes
42,135 21,115 18,523 (8,230) 73,543
Finance costs - - - 3,105 3,105
Income tax expense - - - 18,693 18,693
Net earnings $ 42,135 $ 21,115 $ 18,523 $ (30,028) $ 51,745

35
As at September 30, 2012
Segment assets excluding intangible assets
$ 307,928 $ 144,692 $ 121,398 $ - $ 574,018 Intangible assets 21,906 14,558 47,139 5 83,608 Corporate and other assets - - - 3,792 3,792 Total assets $ 329,834 $ 159,250 $ 168,537 $ 3,797 $ 661,418
Segment liabilities
$ 136,698 $ 49,927 $ 43,918 $ - $ 230,543 Corporate and other liabilities - - - 189,307 189,307 Total liabilities $ 136,698 $ 49,927 $ 43,918 $ 189,307 $ 419,850
Segment assets and liabilities do not include assets and liabilities associated with the corporate office including
deferred financing costs, income taxes, bank indebtedness, bank debt, employee benefits, and dividends
payable.
12. SUBSEQUENT EVENT
On October 23, 2013 the Corporation issued $125,000 of senior unsecured notes. The notes carry a coupon of
6.125% per annum and will mature on October 23, 2020. The net proceeds of the notes were used to repay
borrowings under the Corporation’s senior secured bank credit facility, which in turn may be redrawn for general
corporate purposes. Effective upon the closing of the note offering, the Corporation reduced the total available
committed amount of the bank credit facility from $300,000 to $250,000.