report to shareholders for the third quarter of 2021
TRANSCRIPT
All financial figures are unaudited and presented in Canadian dollars unless noted otherwise. Production volumes are presented on a working-interestbasis, before royalties, except for production volumes from Suncor Energy Inc.’s (Suncor or the company) Libya operations, which are presented on aneconomic basis. Certain financial measures in this document are not prescribed by Canadian generally accepted accounting principles (GAAP). For adescription of these non-GAAP financial measures, see the Non-GAAP Financial Measures Advisory section of Suncor’s Management’s Discussion andAnalysis (MD&A) dated October 27, 2021. See also the Advisories section of the MD&A. References to Oil Sands operations exclude Suncor’s interests inFort Hills and Syncrude.
“In the third quarter of 2021, Suncor generated funds from operations of $2.6 billion, underpinned by strong results from theRefining & Marketing business and including the significant planned turnaround at Oil Sands Base,” said Mark Little, presidentand chief executive officer. “Since the start of 2021, we have returned $2.6 billion to our shareholders through share repurchasesand dividends and have reduced net debt by $3.1 billion, demonstrating significant progress towards fortifying our balancesheet and meeting our capital allocation targets for the year.”
• Funds from operations(1) increased to $2.641 billion ($1.79 per common share) in the third quarter of 2021, compared to$1.166 billion ($0.76 per common share) in the prior year quarter. Cash flow provided by operating activities, which includeschanges in non-cash working capital, was $4.718 billion ($3.19 per common share) in the third quarter of 2021, comparedto $1.245 billion ($0.82 per common share) in the prior year quarter.
• The company recorded operating earnings(1)(2) of $1.043 billion ($0.71 per common share) in the third quarter of 2021,compared to an operating loss of $338 million ($0.22 per common share) in the prior year quarter. The company had netearnings of $877 million ($0.59 per common share) in the third quarter of 2021, compared to a net loss of $12 million($0.01 per common share) in the prior year quarter.
• Refining and Marketing (R&M) delivered $947 million in funds from operations in the current period, marking the thirdhighest results for third quarter funds from operations on record. The increase in funds from operations in the third quarterof 2021, compared to $594 million in the prior year quarter, was a result of the improving business environment andstrong refinery utilizations of 99%, and was achieved despite Canadian gasoline and diesel demand estimated to be 7%(3)
below the comparable period in 2019. R&M funds from operations included a first-in, first-out (FIFO) inventory valuation gainof $84 million after-tax in the third quarter of 2021, compared to $164 million in the prior year quarter.
• Suncor’s total upstream production increased to 698,600 barrels of oil equivalent per day (boe/d) in the third quarter of2021, compared to 616,200 boe/d in the prior year quarter, due to continued strong performance from the company’s InSitu assets and increased production volumes at Syncrude, partially offset by the impact of the significant planned turnaroundat Oil Sands Base plant Upgrader 2 and planned maintenance at Firebag, which was completed in the quarter.
• Suncor successfully assumed the role of operator of the Syncrude asset on September 30, 2021, a critical step towardsdriving greater integration, efficiencies and competitiveness across all Suncor-operated assets in the region.
• Suncor and the co-owners of the Terra Nova project finalized an agreement to restructure the project ownership and moveforward with the Asset Life Extension (ALE) project, which is expected to extend production life by approximately 10 years.
• Suncor, together with eight Indigenous communities, announced the formation of Astisiy Limited Partnership (Astisiy),which has signed agreements to acquire a 15% equity interest in the Northern Courier Pipeline. The pipeline, which connectsthe Fort Hills asset to Suncor’s East Tank Farm, will be operated by Suncor and is expected to provide the eight Indigenouscommunities with reliable income for decades.
• In the third quarter of 2021, the company returned $1.0 billion to its shareholders through $704 million in share repurchasesand payment of $309 million of dividends, and reduced net debt(4) by $2.0 billion.
• Since the beginning of 2021, Suncor has reduced net debt by $3.1 billion and repurchased $1.7 billion of its common sharessince the start of its normal course issuer bid program (NCIB) in February 2021, representing approximately 63 millioncommon shares at an average price of $26.39 per common share, or the equivalent of 4.1% of Suncor’s issued andoutstanding common shares as at January 31, 2021. The company is on track to exceed its previously communicated debtreduction and share repurchase targets for the year.
• Subsequent to the third quarter of 2021, the company completed the sale of its 26.69% working interest in the Golden EagleArea Development for after-tax proceeds of US$250 million net of closing adjustments and other closing costs, and futurecontingent consideration of up to US$50 million. The effective date of the sale was January 1, 2021.
• Subsequent to the third quarter of 2021, Suncor’s Board of Directors (the Board) approved a quarterly dividend of $0.42 pershare, which represents an increase of 100% over the prior quarter dividend, reinstating the dividend to the 2019 level. The Boardalso approved an increase to the company’s share repurchase program to approximately 7% of Suncor’s public float as atJanuary 31, 2021 and concurrently, the Toronto Stock Exchange (TSX) accepted a notice to increase the maximum number ofcommon shares the company may repurchase pursuant to its NCIB to 7% of the company’s public float. The acceleration of sharerepurchases, dividend increase and expected net debt reductions, compared to the company’s previously announced targetsdemonstrate the progress made during the year and management’s confidence in the company’s ability to generate cash flowand its commitment to increased shareholder returns.
(1) Funds from operations and operating earnings (loss) are non-GAAP financial measures. See page 6 for a reconciliation of net earnings (loss) tooperating earnings (loss). See the Non-GAAP Financial Measures Advisory section of the MD&A.
(2) Beginning in the first quarter of 2021, the company revised its calculation of operating earnings, a non-GAAP financial measure, to exclude unrealized(gains) losses on derivative financial instruments that are recorded at fair value to better align the earnings impact of the activity with the underlyingitems being risk-managed. Prior period comparatives have been restated to reflect this change.
(3) Sources: IHS Markit and Statistics Canada.
(4) Net debt is equal to total debt less cash and cash equivalents.
Report to Shareholdersfor the Third Quarter of 2021

698.6769.2616.2 785.9Total 699.7
2020(3)(4) 2021(4)2021(4)
Q3 Q4 Q1 Q2 Q3Funds from Operations (1)
and Capital Expenditures byQuarter($ millions)
2020(3)(4)
Q3 Q4 Q1 Q2 Q3Net (Loss) Earnings andOperating (Loss)Earnings(1)(2) by Quarter($ millions)
Net (loss) earnings
Operating (loss) earnings(1)(2)
868
722
(12)
(338)
(168)
(109)
821
746
199.6
93.5
405.5
157.2
97.7
514.3
108.2
97.2
410.8
170.7
95.3
519.9
2020(3)(4) 2021(4)
Q3 Q4 Q1 Q2 Q3Production by Quarter(thousands of boe/d)
Oil Sands - Bitumen
Exploration and Production
Oil Sands - SCO
2020(3)(4) 2021(4)
Q3 Q4 Q1 Q2 Q3Return on CapitalEmployed (1) (ROCE)by Quarter(%)
for the twelve months ended
Funds from operations(1)
Capital and exploration expenditures
Asset sustainment capital and dividends
2 110
772
808
2 362
1 310
1 346
1 166
912
987
1 221
941
911
2 641
1 183
1 145
877
1 043
178.5
84.0
437.2ROCE(1)(5) 4.5(6.9)(10.2) 1.9(1.4)
ROCE excluding impairmentsand impairment reversals(1) 4.9(2.9)(1.3) 2.6(0.6)
(1) Funds from operations, operating earnings (loss) and ROCE are non-GAAP financial measures. See page 6 for a reconciliation of net earnings (loss)
to operating earnings (loss). See the Non-GAAP Financial Measures Advisory section of the MD&A.
(2) Beginning in the first quarter of 2021, the company revised its calculation of operating earnings, a non-GAAP financial measure, to exclude unrealized
(gains) losses on derivative financial instruments that are recorded at fair value to better align the earnings impact of the activity with the underlying
items being risk-managed. Prior period comparatives have been restated to reflect this change.
(3) Includes the impacts of the Government of Alberta’s mandatory production curtailments in 2020.
(4) Includes the impacts of the COVID-19 pandemic for all periods presented.
(5) Includes impairment charges of $3.352 billion after-tax related to the fourth quarter of 2019, $1.798 billion after-tax related to the first quarter of
2020, $423 million after-tax related to the fourth quarter of 2020 and an impairment reversal of $168 million after-tax related to the third quarter of
2021.
Financial Results
Operating Earnings (Loss)
Suncor’s operating earnings increased to $1.043 billion ($0.71 per common share) in the third quarter of 2021, from an operating
loss of $338 million ($0.22 per common share) in the prior year quarter. The increase in operating earnings was primarily
related to higher crude oil and refined product realizations reflecting the improved business environment, higher crude
production and refinery crude throughput, and lower depreciation, depletion and amortization (DD&A) and exploration expenses.
Operating earnings were partially offset by an increase in operating expenses and royalties associated with Suncor’s increased
production in the third quarter of 2021. The prior year quarter operating earnings were negatively impacted by the unprecedented
decline in transportation fuel demand, partially offset by lower operating costs.
2 2021 Third Quarter Suncor Energy Inc.
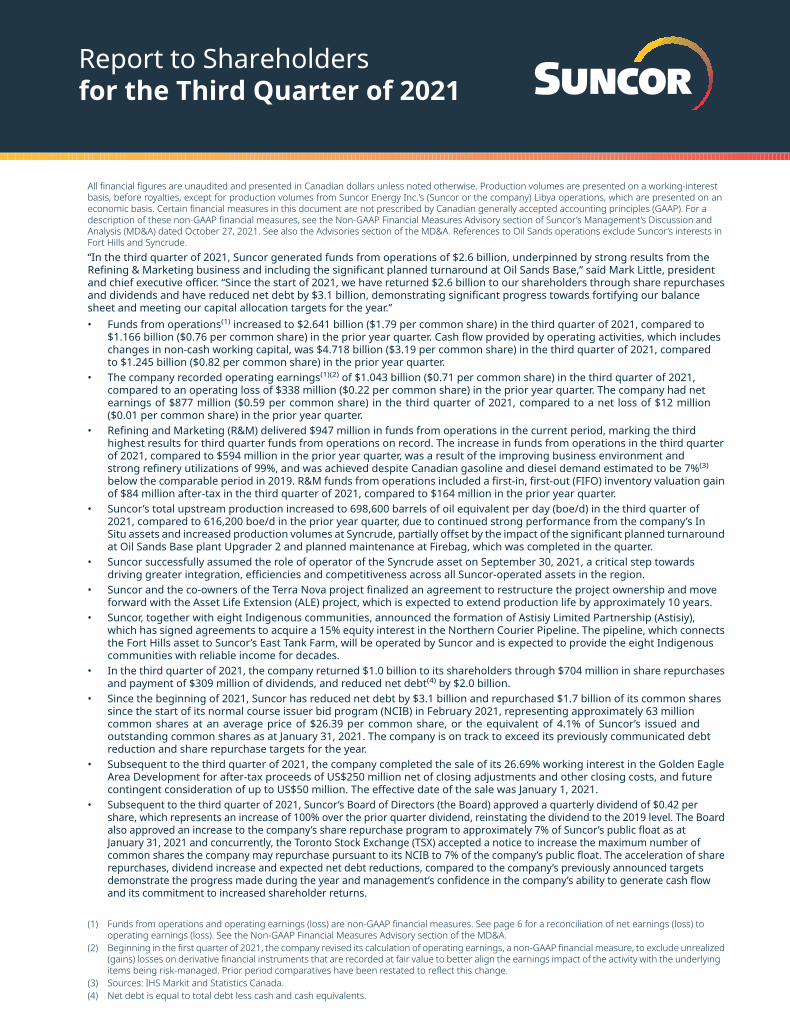
Bridge Analysis of Operating (Loss) Earnings ($ millions)(1)(2)
FinancingExpense and
Other
172 73 1 043
Q32021
(401)
DD&A andExploration
Expense
(84)
Operating andTransportation
Expense
InventoryValuation(3)
(325)
Royalties
1 611
Price, Marginand Other
Revenue
335
SalesVolumesand Mix
(338)
Q32020
(1) For an explanation of this bridge analysis, see the Non-GAAP Financial Measures Advisory section of the MD&A.
(2) Beginning in the first quarter of 2021, the company revised its calculation of operating earnings, a non-GAAP financial measure, to exclude unrealized
(gains) losses on derivative financial instruments that are recorded at fair value to better align the earnings impact of the activity with the underlying
items being risk-managed. Prior period comparatives have been restated to reflect this change.
(3) The bridge factor for Inventory Valuation is comprised of changes in the FIFO inventory valuation and the realized portion of short-term commodity
risk management activities reported in the R&M segment, and changes in the intersegment elimination of profit reported in the Corporate and
Eliminations segment.
Net Earnings (Loss)
Suncor’s net earnings were $877 million ($0.59 per common share) in the third quarter of 2021, compared to a net loss of
$12 million ($0.01 per common share) in the prior year quarter. In addition to the factors impacting operating earnings (loss)
discussed above, net earnings for the third quarter of 2021 were impacted by a $257 million unrealized after-tax foreign exchange
loss on the revaluation of U.S. dollar denominated debt, a non-cash after-tax impairment reversal of $168 million against the
Terra Nova assets, a $60 million after-tax loss for early repayment of long-term debt and a $17 million after-tax unrealized loss
on risk management activities. The net loss in the prior year quarter included a $290 million unrealized after-tax foreign exchange
gain on the revaluation of U.S. dollar denominated debt and a $36 million after-tax unrealized gain on risk management
activities.
Funds from Operations and Cash Flow Provided by Operating Activities
Funds from operations were $2.641 billion ($1.79 per common share) in the third quarter of 2021, compared to $1.166 billion
($0.76 per common share) in the third quarter of 2020. Funds from operations were influenced by the same factors impacting
operating earnings (loss) noted above.
Cash flow provided by operating activities, which includes changes in non-cash working capital, was $4.718 billion ($3.19 per
common share) for the third quarter of 2021, compared to $1.245 billion ($0.82 per common share) in the prior year quarter. In
addition to the factors noted above, cash flow provided by operating activities was further impacted by a greater source of cash
associated with the company’s working capital balances in the current period compared to the prior year quarter. The source
of cash in the third quarter of 2021 was primarily due to an increase in accounts payable and accrued liabilities and the receipt
of the company’s 2020 federal income tax refund.
2021 Third Quarter Suncor Energy Inc. 3

Operating Results
Suncor’s total upstream production increased to 698,600 boe/d in the third quarter of 2021, compared to 616,200 boe/d in the
prior year quarter, reflecting continued strong performance from the company’s In Situ assets and increased production volumes
at Syncrude, partially offset by the impact of the significant planned turnaround at Oil Sands Base plant Upgrader 2 and planned
maintenance at Firebag, which was completed in the quarter.
The company’s net synthetic crude oil production was 405,500 barrels per day (bbls/d) in the third quarter of 2021 compared to
410,800 bbls/d in the prior year quarter. In the third quarter of 2021, the company completed its five-year planned turnaround at
Oil Sands Base plant Upgrader 2, and subsequent to the quarter the asset ramped up to normal operating rates. Syncrude
upgrader utilization was 91% in the third quarter of 2021, compared to 78% in the prior year quarter. The prior year quarter was
impacted by planned turnaround maintenance at both Oil Sands operations and Syncrude, and an operational incident at the
secondary extraction facilities at Oil Sands Base plant.
The company’s non-upgraded bitumen production increased to 199,600 bbls/d in the third quarter of 2021 from 108,200 bbls/d
in the prior year quarter due to continued strong performance from the company’s In Situ assets and the impact of the
significant planned turnaround at Oil Sands Base plant Upgrader 2, resulting in less Firebag volumes being processed at the
upgrader and therefore increased non-upgraded bitumen being sold to market. The increase in production was partially offset
by planned maintenance at Firebag in the third quarter of 2021. Production at Fort Hills increased during the third quarter of 2021,
compared to the prior year quarter. During the third quarter of 2021, significant progress on the mine ramp up strategy was
achieved and Fort Hills continued to manage overburden removal and build ore inventory according to plan. Fort Hills is expected
to transition to a two-train operation and operate at full production rates by the end of the year.
Exploration and Production (E&P) produced 93,500 boe/d during the third quarter of 2021, compared to 97,200 boe/d in the
prior year quarter. The decrease was primarily due to natural production declines, partially offset by higher production at the
Golden Eagle Area Development and liftings in Libya in the third quarter of 2021 compared to no liftings in the prior year quarter.
Refinery crude throughput increased to 460,300 bbls/d and refinery utilization was 99% in the third quarter of 2021, compared
to refinery crude throughput of 399,700 bbls/d and refinery utilization of 87% in the prior year quarter, reflecting strong utilizations
across all refineries comparable to the same periods in 2018 and 2019, despite Canadian gasoline and diesel demand estimated
to be 7%(1) below the comparable period in 2019. The prior year quarter reflected reduced rates due to the completion of an
eight-week planned turnaround at the Edmonton refinery and lower demand for refined products.
Refined product sales in the third quarter of 2021 increased to 551,500 bbls/d, compared to 534,000 bbls/d in the prior year
quarter. Strong utilizations during the quarter, increased demand and secured sales channels positioned the company to capture
the improved business environment.
“We continue to execute on our commitment to operational excellence across our assets. During the third quarter of 2021,
Suncor once again outperformed the Canadian refining average, achieving 99% utilization at our refineries, and capturing funds
from operations that exceeded the comparable 2019 levels in the downstream business,” said Little. “In 2021, we completed
the largest annual maintenance program in the company’s history, including the completion of the significant turnaround at Oil
Sands Base and planned maintenance at Firebag during the quarter, enabling us to return to normal production rates across
our asset base in the fourth quarter.”
The company’s total operating, selling and general expenses were $2.768 billion in the third quarter of 2021, compared to
$2.235 billion in the prior year quarter. The increase was primarily due to higher crude production and refinery crude throughput,
a significant increase in natural gas prices and lower costs in the prior year quarter. The increase was partially offset by cost
reductions related to the company’s strategic initiatives. Increased production in the quarter resulted in higher absolute costs
but lower cash operating costs per barrel(2) at Oil Sands operations and Syncrude. The prior year quarter reflected lower costs
related to specific measures taken by the company to reduce operating costs in response to the COVID-19 pandemic.
In the first nine months of 2021, the company’s total operating, selling and general expenses were $8.388 billion, which included
one-time costs associated with restructuring and integration charges. While the company has made progress on its cost
reduction initiatives, it currently estimates that fourth quarter operating, selling, and general expenses will be in line with the year-
to-date run rate due to the planned increase in upstream production volumes in the fourth quarter and the expected increase
in natural gas input prices. The company’s exposure to higher natural gas costs is partially mitigated by increased revenue from
power sales.
(1) Sources: IHS Markit and Statistics Canada.
(2) Non-GAAP financial measures. See Non-GAAP Financial Measures Advisory section of the MD&A.
4 2021 Third Quarter Suncor Energy Inc.

Strategy Update
Suncor remains focused on operational excellence and its capital allocation strategy; fortifying the balance sheet through debt
reductions and increasing the return to its shareholders in the form of accelerated share repurchases and increased dividends. In
the third quarter of 2021, the company continued to make meaningful progress towards its debt reduction strategy by exercising
the early redemption option on its outstanding US$750 million 3.60% notes, originally maturing in December 2024, as well as
reducing short-term debt by approximately $1.1 billion, contributing to a reduction in net debt of approximately $2.0 billion. Since
the start of 2021, Suncor has reduced net debt by $3.1 billion and the company expects to return to 2019 net debt levels during
the fourth quarter and be within its 2025 targeted net debt range by the end of the year.
In the third quarter of 2021, the company repurchased approximately 28 million common shares for $704 million under its NCIB
and paid $309 million of dividends. Share repurchases in the quarter represent 1.8% of Suncor’s issued and outstanding
common shares as at January 31, 2021, and were purchased at an average price of $25.05 per common share. Since the start of
its NCIB in February 2021, the company has repurchased $1.7 billion in common shares, representing approximately 63 million
common shares at an average price of $26.39 per common share, or the equivalent of 4.1% of Suncor’s issued and outstanding
common shares as at January 31, 2021. Since the beginning of 2021, the company has returned approximately $2.6 billion to
shareholders, including $1.7 billion in common share repurchases and $943 million in dividends paid, demonstrating its
commitment to shareholder returns.
Subsequent to the third quarter of 2021, the Board approved a quarterly dividend of $0.42 per share, which represents an
increase of 100% over the prior quarter dividend, as well as an increase to the company’s share repurchase program to
approximately 7% of Suncor’s public float as at January 31, 2021. Concurrently, the TSX accepted a notice to increase the maximum
number of common shares the company may repurchase pursuant to its NCIB to 7% of the company’s public float. The
acceleration of the share repurchases, dividend increase and expected net debt reductions, compared to the company’s previously
announced targets demonstrate the progress made during the year and management’s confidence in the company’s ability to
generate cash flow and its commitment to increased shareholder returns.
On September 30, 2021, Suncor successfully assumed the role of operator of the Syncrude asset, a critical step towards driving
greater efficiencies and competitiveness across all Suncor-operated assets in the region. Suncor assuming operatorship reflects
the company’s confidence in the Syncrude asset and Suncor expects to improve operational performance, efficiency and
competitiveness and capture increased value by capitalizing on the collective strength of all of the Suncor-operated assets in
the region. The change in operatorship is expected to generate annual gross synergies for the joint venture owners of $100 million
in the first six months, with an additional $200 million through 2022-2023.
In E&P, Suncor, together with the co-owners of the Terra Nova project, finalized an agreement to restructure the project ownership
and move forward with the ALE project. As a result of the agreement, Suncor increased its ownership in the project by
approximately 10% to 48% in exchange for a cash payment from the exiting owners, and the agreement includes the previously
disclosed royalty and financial support from the Government of Newfoundland and Labrador. Proceeds from the acquisition
will be used to partially fund future capital expenditures for the ALE project. Maintenance work on the Floating, Production,
Storage and Offloading (FPSO) facility commenced late in the quarter and the FPSO is expected to sail to dry dock in Ferrol, Spain,
later in 2021. A safe return to operations is anticipated before the end of 2022. The ALE project is expected to extend the
production life by approximately 10 years, provide an additional 70 million barrels of resource for the partnership and provide
many benefits to the Newfoundland and Labrador and Canadian economies in the form of taxes, royalties and employment.
Suncor also entered into a conditional agreement to increase its interest in the White Rose asset subject to an economic restart
decision for the West White Rose project by mid-2022. Should the decision to restart occur, Suncor has agreed to increase its
interest in the White Rose asset by 12.5% to approximately 40% in exchange for a cash payment by the operator to Suncor.
“We continue to deliver on capital discipline and our strategy of optimizing our base business while focusing on high-margin, low-
capital projects that deliver significant returns, cash flow and long-term value generation for our shareholders,” said Little. “In
the third quarter of 2021, we successfully assumed the role of operator of the Syncrude asset, announced that we are progressing
the Terra Nova Asset Life Extension project and, subsequent to the quarter, completed the sale of our working interest in the
Golden Eagle Area Development.”
Suncor’s strategy is underpinned by the company’s principles of capital discipline and operational excellence. The company’s
2021 capital expenditures have been heavily focused on the safety and reliability of the company’s operations, which included
the completion of the significant planned turnaround at Oil Sands Base plant Upgrader 2 and planned maintenance at Firebag in
the third quarter, and significant turnaround activities at Syncrude, Buzzard and across all of the company’s refineries in the
second quarter. All significant planned maintenance has been safely completed for 2021, reinforcing the decision to stagger the
company’s planned turnarounds at Oil Sands Base plant Upgrader 2 and Syncrude in response to the impacts of the COVID-19
pandemic in the Fort McMurray region.
2021 Third Quarter Suncor Energy Inc. 5

The company continues to advance a number of strategic initiatives that are expected to contribute to the company’s $2.15 billion
incremental free funds flow(1) target. Significant initiatives contributing to the target include tailings management, the expansion
of our supply, marketing and trading capabilities, completion of the interconnecting pipelines between Oil Sands Base plant
and Syncrude and asset debottlenecks. A tailings management initiative implemented recently, Permanent Aquatic Storage
Structure, has lowered tailings treatment and handling requirements resulting in decreased sustaining capital and tailings
management spend.
During the third quarter of 2021, Suncor also announced the formation of Astisiy, a partnership with eight Indigenous
communities in the Regional Municipality of Wood Buffalo, which has signed agreements to acquire an equity interest in the
Northern Courier Pipeline. This historic partnership includes Suncor, three First Nations and five Métis communities who, together,
will own a 15% stake in this approximately $1.3 billion pipeline asset. Partners are expected to benefit from revenues generated
through competitive tolls from long-term transportation and terminalling services agreements supporting the pipeline,
regardless of the price of crude. The pipeline, which connects the Fort Hills asset to Suncor’s East Tank Farm, will be operated by
Suncor upon completion of the purchase, and adds to Suncor’s existing pipelines and infrastructure that the company operates
in the region. The transaction is anticipated to close in the fourth quarter of 2021.
Subsequent to the third quarter of 2021, the company completed the sale of its 26.69% working interest in the Golden Eagle
Area Development for after-tax proceeds of US$250 million net of closing adjustments and other closing costs, and future
contingent consideration of up to US$50 million. The effective date of the sale was January 1, 2021. The proceeds will be used to
support Suncor’s capital allocation strategy.
Operating Earnings (Loss) Reconciliation(1)(2)
Three months endedSeptember 30
Nine months endedSeptember 30
($ millions) 2021 2020 2021 2020
Net earnings (loss) 877 (12) 2 566 (4 151)
Unrealized foreign exchange loss (gain) on U.S. dollardenominated debt 257 (290) (80) 253
Unrealized loss (gain) on risk management activities(2) 17 (36) 7 (4)
Restructuring charge(3) — — 126 —
Asset impairment (reversal)(4) (168) — (168) 1 798
Loss on early repayment of long-term debt(5) 60 — 60 —
Operating earnings (loss)(1)(2) 1 043 (338) 2 511 (2 104)
(1) Operating earnings (loss) is a non-GAAP financial measure. All reconciling items are presented on an after-tax basis. See the Non-GAAP Financial
Measures Advisory section of the MD&A.
(2) Beginning in the first quarter of 2021, the company revised its calculation of operating earnings, a non-GAAP financial measure, to exclude unrealized
(gains) losses on derivative financial instruments that are recorded at fair value to better align the earnings impact of the activity with the underlying
items being risk-managed. Prior period comparatives have been restated to reflect this change.
(3) Restructuring charge in the Corporate segment recorded in the first quarter of 2021.
(4) During the first quarter of 2020, the company recorded non-cash after-tax impairment charges of $1.376 billion on its share of the Fort Hills
assets, in the Oil Sands segment, and $422 million against its share of the White Rose and Terra Nova assets, in the E&P segment, due to a decline
in forecasted crude oil prices as a result of decreased global demand due to the COVID-19 pandemic and changes to their respective capital,
operating and production plans. During the third quarter of 2021, the company recorded a non-cash after-tax impairment reversal of $168 million
on its share of the Terra Nova assets, in the E&P segment, as a result of the ALE project moving forward and the benefit of royalty and financial support
from the Government of Newfoundland and Labrador.
(5) Charges associated with the early repayment of debt in the Corporate segment.
(1) Non-GAAP financial measure. See Non-GAAP Financial Measures Advisory section of the MD&A.
6 2021 Third Quarter Suncor Energy Inc.

Corporate Guidance
Suncor has updated its full-year business environment outlook assumptions for Brent Sullom Voe from US$68.00/bbl to
US$71.00/bbl, WTI at Cushing from US$65.00/bbl to US$68.00/bbl, WCS at Hardisty from US$52.00/bbl to US$55.00/bbl and New
York Harbor 2-1-1 crack from US$18.00/bbl to US$19.00/bbl, due to improvements in key forward curve pricing for the remainder
of the year. As a result of these updates, the full-year current income tax expense range has increased from $1.2 billion – $1.5 billion
to $1.4 billion – $1.7 billion.
In addition, Oil Sands operations Crown royalties have been updated from 4% – 6% to 5% – 7%, Syncrude crown royalties have
been updated from 9% – 12% to 10% – 13% and East Coast Canada crown royalties have been updated from 10% – 14% to 11% – 15%,
with the increase in royalty rates attributed to higher forecasted benchmark prices.
For further details and advisories regarding Suncor’s 2021 annual guidance, see www.suncor.com/guidance.
Normal Course Issuer Bid
Subsequent to the third quarter of 2021, Suncor received approval from the TSX to amend its existing NCIB effective as of the
close of markets on October 29, 2021, to purchase common shares through the facilities of the TSX, New York Stock Exchange
and/or alternative trading platforms. The notice provides that Suncor may increase the maximum number of common shares that
may be repurchased in the period beginning February 8, 2021, and ending February 7, 2022, from 76,250,000 shares, or
approximately 5% of Suncor’s issued and outstanding common shares as at January 31, 2021, to 106,700,000, or approximately
7% of Suncor’s public float as at January 31, 2021. No other terms of the NCIB have been amended.
Between February 8, 2021, and October 25, 2021, and pursuant to the NCIB, Suncor has already repurchased approximately
$1.834 billion of common shares on the open market. Pursuant to the NCIB (as amended), Suncor has agreed that it will not
purchase more than 106,700,000 common shares, of which 69,058,156 common shares have already been purchased between
February 8, 2021, and October 25, 2021.
The actual number of common shares that may be purchased and the timing of any such purchases will be determined by
Suncor. Suncor believes that, depending on the trading price of its common shares and other relevant factors, purchasing its
own shares represents an attractive investment opportunity and is in the best interests of the company and its shareholders. The
company does not expect that the decision to allocate cash to repurchase shares will affect its long-term growth strategy.
Measurement Conversions
Certain natural gas volumes in this report to shareholders have been converted to boe on the basis of one bbl to six mcf. See
the Advisories section of the MD&A.
2021 Third Quarter Suncor Energy Inc. 7

Management’s Discussion and AnalysisOctober 27, 2021
Suncor Energy Inc. (Suncor or the company) is an integrated energy company headquartered in Calgary, Alberta, Canada. We
are strategically focused on developing one of the world’s largest petroleum resource basins – Canada’s Athabasca oil sands. In
addition, we explore for, acquire, develop, produce and market crude oil in Canada and internationally; we transport and refine
crude oil; and we market petroleum and petrochemical products primarily in Canada. We also operate a renewable energy
business and conduct energy trading activities focused principally on the marketing and trading of crude oil, natural gas,
byproducts, refined products and power.
For a description of Suncor’s segments, refer to Suncor’s Management’s Discussion and Analysis (MD&A) for the year ended
December 31, 2020, dated February 24, 2021 (the 2020 annual MD&A).
This MD&A, for the three and nine months ended September 30, 2021, should be read in conjunction with Suncor’s unaudited
interim Consolidated Financial Statements for the three and nine months ended September 30, 2021, Suncor’s audited
Consolidated Financial Statements for the year ended December 31, 2020, and the 2020 annual MD&A.
Additional information about Suncor filed with Canadian securities regulatory authorities and the United States Securities and
Exchange Commission (SEC), including quarterly and annual reports and Suncor’s Annual Information Form dated February 24,
2021 (the 2020 AIF), which is also filed with the SEC under cover of Form 40-F, is available online at www.sedar.com, www.sec.gov
and our website www.suncor.com. Information contained in or otherwise accessible through our website does not form part of
this MD&A, and is not incorporated into this document by reference.
Suncor Energy Inc. has numerous direct and indirect subsidiaries, partnerships and joint arrangements (collectively, affiliates),
which own and operate assets and conduct activities in different jurisdictions. The terms “we”, “our”, “Suncor”, or “the company”
are used herein for simplicity of communication and only mean there is an affiliation with Suncor Energy Inc., without necessarily
identifying the specific nature of the affiliation. The use of such terms in any statement herein does not mean they apply to Suncor
Energy Inc. or any particular affiliate, and does not waive the corporate separateness of any affiliate. For further clarity, Suncor
Energy Inc. does not directly operate or own assets in the U.S.
Table of Contents
1. Advisories 9
2. Third Quarter Highlights 10
3. Consolidated Financial Information 12
4. Segment Results and Analysis 18
5. Capital Investment Update 29
6. Financial Condition and Liquidity 31
7. Quarterly Financial Data 35
8. Other Items 37
9. Non-GAAP Financial Measures Advisory 39
10. Common Abbreviations 44
11. Forward-Looking Information 45
8 2021 Third Quarter Suncor Energy Inc.

1. Advisories
Basis of Presentation
Unless otherwise noted, all financial information has been prepared in accordance with Canadian generally accepted accounting
principles (GAAP), specifically International Accounting Standard (IAS) 34 Interim Financial Reporting as issued by the International
Accounting Standards Board (IASB), which is within the framework of International Financial Reporting Standards (IFRS) as
issued by the IASB.
All financial information is reported in Canadian dollars, unless otherwise noted. Production volumes are presented on a working-
interest basis, before royalties, except for production volumes from the company’s Libya operations, which is on an economic
basis.
References to Oil Sands operations exclude Suncor’s interests in Fort Hills and Syncrude.
Beginning in the first quarter of 2021, the company revised the presentation of its expenses from “transportation” to
“transportation and distribution” and reclassified certain operating, selling and general expenses to transportation and
distribution to better reflect the nature of these expenses. There is no impact to net earnings (loss) and comparative periods
have been restated to reflect this change.
Non-GAAP Financial Measures
Certain financial measures in this MD&A – namely operating earnings (loss), funds from (used in) operations, return on capital
employed (ROCE), Oil Sands operations cash operating costs, Fort Hills cash operating costs, Syncrude cash operating costs,
refining and marketing gross margin, refining operating expense, free funds flow, discretionary free funds flow (deficit), and last-
in, first-out (LIFO) inventory valuation methodology and related per share or per barrel amounts − are not prescribed by
GAAP. Operating earnings (loss) is defined in the Non-GAAP Financial Measures Advisory section of this MD&A and reconciled to
the most directly comparable GAAP measures in the Consolidated Financial Information and Segment Results and Analysis
sections of this MD&A. Oil Sands operations cash operating costs, Fort Hills cash operating costs, Syncrude cash operating costs
and LIFO inventory valuation methodology are defined in the Non-GAAP Financial Measures Advisory section of this MD&A
and reconciled to the most directly comparable GAAP measures in the Segment Results and Analysis section of this MD&A. Funds
from (used in) operations, ROCE, free funds flow, discretionary free funds flow (deficit), refining and marketing gross margin,
and refining operating expense are defined and reconciled, where applicable, to the most directly comparable GAAP measures
in the Non-GAAP Financial Measures Advisory section of this MD&A.
Risk Factors and Forward-Looking Information
The company’s business, reserves, financial condition and results of operations may be affected by a number of factors, including,
but not limited to, the factors described within the Forward-Looking Information section of this MD&A. This MD&A contains
forward-looking information based on Suncor’s current expectations, estimates, projections and assumptions. This information
is subject to a number of risks and uncertainties, including those discussed in this MD&A, the 2020 annual MD&A and Suncor’s
other disclosure documents filed with Canadian securities regulatory authorities and the SEC, many of which are beyond the
company’s control. Users of this information are cautioned that actual results may differ materially. Refer to the Forward-
Looking Information section of this MD&A for information on the material risk factors and assumptions underlying our forward-
looking information contained in this MD&A.
Measurement Conversions
Certain crude oil and natural gas liquids volumes have been converted to mcfe on the basis of one bbl to six mcf. Also, certain
natural gas volumes have been converted to boe or mboe on the same basis. Any figure presented in mcfe, boe or mboe may be
misleading, particularly if used in isolation. A conversion ratio of one bbl of crude oil or natural gas liquids to six mcf of natural
gas is based on an energy-equivalency conversion method primarily applicable at the burner tip and does not represent a value
equivalency at the wellhead. Given that the value ratio based on the current price of crude oil as compared to natural gas is
significantly different from the energy equivalency of 6:1, conversion on a 6:1 basis may be misleading as an indication of value.
Common Abbreviations
For a list of abbreviations that may be used in this MD&A, refer to the Common Abbreviations section of this MD&A.
2021 Third Quarter Suncor Energy Inc. 9

2. Third Quarter Highlights
• Third quarter financial results
• Suncor’s operating earnings(1)(2) increased to $1.043 billion ($0.71 per common share) in the third quarter of 2021, from
an operating loss of $338 million ($0.22 per common share) in the prior year quarter. The increase in operating earnings
was primarily related to higher crude oil and refined product realizations reflecting the improved business environment,
higher crude production and refinery crude throughput, and lower DD&A and exploration expenses. Operating earnings
were partially offset by an increase in operating expenses and royalties associated with Suncor’s increased production in
the third quarter of 2021. The prior year quarter operating earnings were negatively impacted by the unprecedented
decline in transportation fuel demand, partially offset by lower operating costs.
• Suncor’s net earnings were $877 million ($0.59 per common share) in the third quarter of 2021, compared to a net loss
of $12 million ($0.01 per common share) in the prior year quarter. In addition to the factors impacting operating earnings
(loss) discussed above, net earnings for the third quarter of 2021 were impacted by a $257 million unrealized after-tax
foreign exchange loss on the revaluation of U.S. dollar denominated debt, a non-cash after-tax impairment reversal of
$168 million against the Terra Nova assets, a $60 million after-tax loss for early repayment of long-term debt and a
$17 million after-tax unrealized loss on risk management activities. The net loss in the prior year quarter included a
$290 million unrealized after-tax foreign exchange gain on the revaluation of U.S. dollar denominated debt and a
$36 million after-tax unrealized gain on risk management activities.
• Funds from operations(1) were $2.641 billion ($1.79 per common share) in the third quarter of 2021, compared to
$1.166 billion ($0.76 per common share) in the third quarter of 2020. Funds from operations were influenced by the
same factors impacting operating earnings (loss) noted above. Cash flow provided by operating activities, which includes
changes in non-cash working capital, was $4.718 billion ($3.19 per common share) for the third quarter of 2021,
compared to $1.245 billion ($0.82 per common share) in the prior year quarter. In addition to the factors noted above,
cash flow provided by operating activities was further impacted by a greater source of cash associated with the company’s
working capital balances in the current period compared to the prior year quarter. The source of cash in the third
quarter of 2021 was primarily due to an increase in accounts payable and accrued liabilities and the receipt of the
company’s 2020 federal income tax refund.
• R&M delivered strong results. Refining and Marketing (R&M) delivered $947 million in funds from operations in the
current period, marking the third highest results for third quarter funds from operations on record. The increase in funds
from operations in the third quarter of 2021, compared to $594 million in the prior year quarter, was a result of the improving
business environment and strong refinery utilizations of 99%, and was achieved despite Canadian gasoline and diesel
demand estimated to be 7%(3) below the comparable period in 2019. R&M funds from operations included a first-in, first-out
(FIFO) inventory valuation gain of $84 million after-tax in the third quarter of 2021, compared to $164 million in the prior
year quarter.
• Strong upstream performance and completion of a planned turnaround. Suncor’s total upstream production increased
to 698,600 boe/d in the third quarter of 2021, compared to 616,200 boe/d in the prior year quarter, due to continued
strong performance from the company’s In Situ assets and increased production volumes at Syncrude, partially offset by
the impact of the significant planned turnaround at Oil Sands Base plant Upgrader 2 and planned maintenance at Firebag,
which was completed in the quarter.
• Suncor assumes operatorship of Syncrude. Suncor successfully assumed the role of operator of the Syncrude asset on
September 30, 2021, a critical step towards driving greater integration, efficiencies and competitiveness across all Suncor-
operated assets in the region.
• Terra Nova Asset Life Extension project moving forward. Suncor and the co-owners of the Terra Nova project finalized an
agreement to restructure the project ownership and move forward with the Asset Life Extension (ALE) project, which is
expected to extend production life by approximately 10 years.
(1) Non-GAAP financial measures. See the Non-GAAP Financial Measures Advisory section of this MD&A.
(2) Beginning in the first quarter of 2021, the company revised its calculation of operating earnings, a non-GAAP financial measure, to exclude unrealized
(gains) losses on derivative financial instruments that are recorded at fair value to better align the earnings impact of the activity with the underlying
items being risk-managed. Prior period comparatives have been restated to reflect this change.
(3) Sources: IHS Markit and Statistics Canada.
Management’s Discussion and Analysis
10 2021 Third Quarter Suncor Energy Inc.

• Historic partnership with Indigenous Communities. Suncor, together with eight Indigenous communities, announced
the formation of Astisiy Limited Partnership, which has signed agreements to acquire a 15% equity interest in the Northern
Courier Pipeline. The pipeline, which connects the Fort Hills asset to Suncor’s East Tank Farm, will be operated by Suncor
and is expected to provide the eight Indigenous communities with reliable income for decades.
• Maximized shareholder returns and fortified the balance sheet. In the third quarter of 2021, the company returned
$1.0 billion to its shareholders through $704 million in share repurchases and payment of $309 million of dividends, and
reduced net debt(1) by $2.0 billion.
• On track to reach debt reduction and capital allocation targets. Since the beginning of 2021, Suncor has reduced net
debt by $3.1 billion and repurchased $1.7 billion of its common shares since the start of its normal course issuer bid program
(NCIB) in February 2021, representing approximately 63 million common shares at an average price of $26.39 per common
share, or the equivalent of 4.1% of Suncor’s issued and outstanding common shares as at January 31, 2021. The company is on
track to exceed its previously communicated debt reduction and share repurchase targets for the year.
• Completed sale of the Golden Eagle Area Development. Subsequent to the third quarter of 2021, the company completed
the sale of its 26.69% working interest in the Golden Eagle Area Development for after-tax proceeds of US$250 million net
of closing adjustments and other closing costs, and future contingent consideration of up to US$50 million. The effective date
of the sale was January 1, 2021.
• Reinstatement of the 2019 dividend and acceleration of the share repurchase program. Subsequent to the third
quarter of 2021, Suncor’s Board of Directors (the Board) approved a quarterly dividend of $0.42 per share, which represents
an increase of 100% over the prior quarter dividend, reinstating the dividend to the 2019 level. The Board also approved
an increase to the company’s share repurchase program to approximately 7% of Suncor’s public float as at January 31, 2021
and concurrently, the Toronto Stock Exchange (TSX) accepted a notice to increase the maximum number of common
shares the company may repurchase pursuant to its NCIB to 7% of the company’s public float. The acceleration of share
repurchases, dividend increase and expected net debt reductions, compared to the company’s previously announced targets
demonstrate the progress made during the year and management’s confidence in the company’s ability to generate cash
flow and its commitment to increased shareholder returns.
(1) Net debt is equal to total debt less cash and cash equivalents.
2021 Third Quarter Suncor Energy Inc. 11

3. Consolidated Financial Information
Financial HighlightsThree months ended
September 30Nine months ended
September 30($ millions) 2021 2020 2021 2020
Net earnings (loss)
Oil Sands 484 (531) 1 251 (3 503)
Exploration and Production 407 25 820 (453)
Refining and Marketing 646 384 1 728 598
Corporate and Eliminations (660) 110 (1 233) (793)
Total 877 (12) 2 566 (4 151)
Operating earnings (loss)(1)(2)
Oil Sands 489 (539) 1 253 (2 135)
Exploration and Production 239 25 652 (31)
Refining and Marketing 658 356 1 733 602
Corporate and Eliminations (343) (180) (1 127) (540)
Total 1 043 (338) 2 511 (2 104)
Funds from (used in) operations(1)
Oil Sands 1 591 556 4 671 1 257
Exploration and Production 357 260 1 053 742
Refining and Marketing 947 594 2 490 1 293
Corporate and Eliminations (254) (244) (1 101) (637)
Total 2 641 1 166 7 113 2 655
Change in non-cash working capital 2 077 79 2 036 (794)
Cash flow provided by operating activities 4 718 1 245 9 149 1 861
Capital and exploration expenditures(3)
Asset sustainment and maintenance 821 653 2 309 1 802
Economic investment 362 259 956 1 063
Total 1 183 912 3 265 2 865
Three months endedSeptember 30
Nine months endedSeptember 30
($ millions) 2021 2020 2021 2020
Discretionary free funds flow (deficit)(1) 1 496 179 3 814 (538)
(1) Non-GAAP financial measures. See the Non-GAAP Financial Measures Advisory section of this MD&A.
(2) Beginning in the first quarter of 2021, the company revised its calculation of operating earnings, a non-GAAP financial measure, to exclude unrealized
(gains) losses on derivative financial instruments that are recorded at fair value to better align the earnings impact of the activity with the underlying
items being risk-managed. Prior period comparatives have been restated to reflect this change.
(3) Excludes capitalized interest of $38 million in the third quarter of 2021 and $29 million in the third quarter of 2020.
Management’s Discussion and Analysis
12 2021 Third Quarter Suncor Energy Inc.

Operating Highlights
Three months endedSeptember 30
Nine months endedSeptember 30
2021 2020 2021 2020
Production volumes by segment
Oil Sands – SCO (mbbls/d) 405.5 410.8 452.8 450.3
Oil Sands – Non-upgraded bitumen (mbbls/d) 199.6 108.2 183.9 117.2
Exploration and Production (mboe/d) 93.5 97.2 90.9 102.9
Total (mboe/d) 698.6 616.2 727.6 670.4
Refinery utilization (%) 99 87 87 86
Refinery crude oil processed (mbbls/d) 460.3 399.7 404.8 396.5
Net Earnings (Loss)
Suncor’s consolidated net earnings for the third quarter of 2021 were $877 million, compared to a net loss of $12 million for the
prior year quarter. Net earnings were primarily caused by the same factors that resulted in the operating earnings described
subsequently in this section of this MD&A.
Other items affecting net earnings (loss) over these periods included:
• The after-tax unrealized foreign exchange loss on the revaluation of U.S. dollar denominated debt was $257 million for the
third quarter of 2021, compared to a gain of $290 million for the third quarter of 2020.
• During the third quarter of 2021, the company recorded a non-cash after-tax impairment reversal of $168 million against its
share of the Terra Nova assets, in the Exploration and Production (E&P) segment, as a result of the ALE project moving
forward and the benefit of royalty and financial support from the Government of Newfoundland and Labrador.
• During the third quarter of 2021, the company recorded an after-tax loss of $60 million for early repayment of long-term
debt, in the Corporate segment.
• The after-tax unrealized loss on risk management activities was $17 million for the third quarter of 2021, compared to a
gain of $36 million for the third quarter of 2020.
2021 Third Quarter Suncor Energy Inc. 13

Operating Earnings (Loss) Reconciliation(1)(2)
Three months endedSeptember 30
Nine months endedSeptember 30
($ millions) 2021 2020 2021 2020
Net earnings (loss) 877 (12) 2 566 (4 151)
Unrealized foreign exchange loss (gain) on U.S. dollardenominated debt 257 (290) (80) 253
Unrealized loss (gain) on risk management activities(2) 17 (36) 7 (4)
Restructuring charge(3) — — 126 —
Asset impairment (reversal)(4) (168) — (168) 1 798
Loss on early repayment of long-term debt(5) 60 — 60 —
Operating earnings (loss)(1)(2) 1 043 (338) 2 511 (2 104)
(1) Operating earnings (loss) is a non-GAAP financial measure. All reconciling items are presented on an after-tax basis. See the Non-GAAP Financial
Measures Advisory section of this MD&A.
(2) Beginning in the first quarter of 2021, the company revised its calculation of operating earnings, a non-GAAP financial measure, to exclude unrealized
(gains) losses on derivative financial instruments that are recorded at fair value to better align the earnings impact of the activity with the underlying
items being risk-managed. Prior period comparatives have been restated to reflect this change.
(3) Restructuring charge in the Corporate segment recorded in the first quarter of 2021.
(4) During the first quarter of 2020, the company recorded non-cash after-tax impairment charges of $1.376 billion on its share of the Fort Hills
assets, in the Oil Sands segment, and $422 million against its share of the White Rose and Terra Nova assets, in the E&P segment, due to a decline
in forecasted crude oil prices as a result of decreased global demand due to the COVID-19 pandemic and changes to their respective capital,
operating and production plans. During the third quarter of 2021, the company recorded a non-cash after-tax impairment reversal of $168 million
on its share of the Terra Nova assets, in the E&P segment, as a result of the ALE project moving forward and the benefit of royalty and financial support
from the Government of Newfoundland and Labrador.
(5) Charges associated with the early repayment of debt in the Corporate segment.
Bridge Analysis of Operating (Loss) Earnings ($ millions)(1)(2)
FinancingExpense and
Other
172 73 1 043
Q32021
(401)
DD&A andExploration
Expense
(84)
Operating andTransportation
Expense
InventoryValuation(3)
(325)
Royalties
1 611
Price, Marginand Other
Revenue
335
SalesVolumesand Mix
(338)
Q32020
(1) For an explanation of this bridge analysis, see the Non-GAAP Financial Measures Advisory section of this MD&A.
(2) Beginning in the first quarter of 2021, the company revised its calculation of operating earnings, a non-GAAP financial measure, to exclude unrealized
(gains) losses on derivative financial instruments that are recorded at fair value to better align the earnings impact of the activity with the underlying
items being risk-managed. Prior period comparatives have been restated to reflect this change.
(3) The bridge factor for Inventory Valuation is comprised of changes in the FIFO inventory valuation and realized short-term commodity risk
management activities reported in the R&M segment, and changes in the intersegment elimination of profit reported in the Corporate and
Eliminations segment.
Management’s Discussion and Analysis
14 2021 Third Quarter Suncor Energy Inc.

Suncor’s operating earnings increased to $1.043 billion ($0.71 per common share) in the third quarter of 2021, from an operating
loss of $338 million ($0.22 per common share) in the prior year quarter. The increase in operating earnings was primarily
related to higher crude oil and refined product realizations reflecting the improved business environment, higher crude
production and refinery crude throughput, and lower DD&A and exploration expenses. Operating earnings were partially offset
by an increase in operating expenses and royalties associated with Suncor’s increased production in the third quarter of 2021.
The prior year quarter operating earnings were negatively impacted by the unprecedented decline in transportation fuel demand,
partially offset by lower operating costs.
In the first nine months of 2021, the company’s total operating, selling and general expenses were $8.388 billion, which included
one-time costs associated with restructuring and integration charges. While the company has made progress on its cost
reduction initiatives, it currently estimates that fourth quarter operating, selling, and general expenses will be in line with the year-
to-date run rate due to the planned increase in upstream production volumes in the fourth quarter and the expected increase
in natural gas input prices. The company’s exposure to higher natural gas costs is partially mitigated by increased revenue from
power sales.
After-Tax Share-Based Compensation Expense (Recovery) by Segment
Three months endedSeptember 30
Nine months endedSeptember 30
($ millions) 2021 2020 2021 2020
Oil Sands 2 (6) 44 (13)
Exploration and Production — (1) 5 (2)
Refining and Marketing 1 (4) 26 (8)
Corporate and Eliminations (1) (20) 78 (40)
Total share-based compensation expense (recovery) 2 (31) 153 (63)
The after-tax share-based compensation impact on results was an expense of $2 million during the third quarter of 2021,
compared to a recovery of $31 million during the prior year quarter, as a result of a smaller change in share price during the
current period when compared to the share price decrease in the prior year quarter.
2021 Third Quarter Suncor Energy Inc. 15

Business Environment
Commodity prices, refining crack spreads and foreign exchange rates are important factors that affect the results of Suncor’s
operations.
Average for thethree months ended
September 30
Average for thenine months ended
September 302021 2020 2021 2020
WTI crude oil at Cushing US$/bbl 70.55 40.95 64.85 38.30
Dated Brent crude US$/bbl 73.45 43.00 67.75 40.80
Dated Brent/Maya crude oil FOBprice differential US$/bbl 7.80 3.50 6.25 7.35
MSW at Edmonton Cdn$/bbl 83.75 51.30 75.90 44.50
WCS at Hardisty US$/bbl 56.95 31.90 52.35 24.65
Light/heavy differential for WTI atCushing less WCS at Hardisty US$/bbl (13.60) (9.05) (12.50) (13.65)
SYN-WTI differential US$/bbl (1.60) (2.45) (1.60) (3.20)
Condensate at Edmonton US$/bbl 69.20 37.55 64.60 35.30
Natural gas (Alberta spot) at AECO Cdn$/mcf 3.60 2.25 3.30 2.10
Alberta Power Pool Price Cdn$/MWh 100.35 43.85 100.10 46.90
New York Harbor 2-1-1 crack(1) US$/bbl 20.90 10.20 18.95 12.40
Chicago 2-1-1 crack(1) US$/bbl 20.45 7.75 18.05 8.10
Portland 2-1-1 crack(1) US$/bbl 26.70 12.55 22.40 14.30
Gulf Coast 2-1-1 crack(1) US$/bbl 19.55 8.55 17.45 10.20
Exchange rate US$/Cdn$ 0.79 0.75 0.80 0.74
Exchange rate (end of period) US$/Cdn$ 0.78 0.75 0.78 0.75
(1) 2-1-1 crack spreads are indicators of the refining margin generated by converting two barrels of WTI into one barrel of gasoline and one barrel of
diesel. The crack spreads presented here generally approximate the regions into which the company sells refined products through retail and
wholesale channels.
In the third quarter of 2021, crude oil and crack spread benchmarks improved compared to the prior year quarter, which was
significantly impacted by an unprecedented decline in transportation fuel demand due to the impacts of the COVID-19 pandemic.
Suncor’s sweet SCO price realizations are influenced primarily by the price of WTI at Cushing and by the supply and demand
for sweet SCO from Western Canada. Sweet SCO price realizations in the third quarter of 2021 reflected an increase in WTI at
Cushing, which averaged US$70.55/bbl compared to US$40.95/bbl in the prior year quarter. Suncor also produces sour SCO, the
price of which is influenced by various crude benchmarks, including, but not limited to, MSW at Edmonton and WCS at Hardisty,
and which can also be affected by prices negotiated for spot sales. Prices for MSW at Edmonton increased to $83.75/bbl in the third
quarter of 2021 compared to $51.30/bbl in the prior year quarter, and prices for WCS at Hardisty increased to US$56.95/bbl in
the third quarter of 2021, from US$31.90/bbl in the prior year quarter.
Bitumen production that Suncor does not upgrade is blended with diluent or SCO to facilitate delivery through pipeline systems.
Net bitumen price realizations are, therefore, influenced by both prices for Canadian heavy crude oil (WCS at Hardisty is a
common reference), prices for diluent (Condensate at Edmonton) and SCO. Bitumen price realizations can also be affected by
bitumen quality and spot sales, and the price variance between Hardisty, Alberta, and U.S. Gulf Coast heavy pricing.
The company leverages the expertise of its marketing and logistics business to optimize midstream capacity to the U.S. Gulf
Coast and this is reflected in bitumen and sour SCO price realizations. Bitumen prices were unfavourably impacted by the
widening of heavy crude oil differentials in the third quarter of 2021.
Suncor’s price realizations for production from E&P Canada and E&P International assets are influenced primarily by the price
for Brent crude, which increased to US$73.45/bbl in the third quarter of 2021 compared to US$43.00/bbl in the prior year quarter.
Suncor’s refining and marketing gross margins are primarily influenced by 2-1-1 benchmark crack spreads, which are industry
indicators approximating the gross margin on a barrel of crude oil that is refined to produce gasoline and distillates. Market crack
spreads are based on quoted near-month contracts for WTI and spot prices for gasoline and diesel and do not necessarily
Management’s Discussion and Analysis
16 2021 Third Quarter Suncor Energy Inc.

reflect the margins at a specific refinery. Suncor’s realized refining and marketing gross margins are influenced by actual crude
oil feedstock costs, refinery configuration, product mix and realized market prices unique to Suncor’s refining and marketing
business. In addition, the U.S. regulatory renewable blending obligations influence the benchmark cracks, which may increase
their volatility, while the cost of regulatory compliance is not deducted in calculating the benchmark cracks.
Suncor has developed an indicative 5-2-2-1 index based on publicly available pricing data to more accurately reflect Suncor’s
realized refining and marketing gross margin. This internal index is a single value calculated based on a notional five barrels of
crude oil of varying grades refined to produce two barrels each of gasoline and distillate and one barrel of secondary product to
approximate Suncor’s unique set of refinery configurations; overall crude slate and product mix; and the benefit of its location,
quality and grade differentials, and marketing margins. The internal index is calculated by taking the product value of refined
products less the crude value of refinery feedstock excluding the impact of FIFO inventory accounting methodology. The
product value incorporates the New York Harbor 2-1-1 crack, Chicago 2-1-1 crack, WTI benchmarks and seasonal factors. The
seasonal factor applies an incremental US$6.50/bbl in the first and fourth quarters and US$5.00/bbl in the second and third
quarters and reflects the location, quality and grade differentials for refined products sold in the company’s core markets during
the winter and summer months, respectively. The crude value incorporates the SYN, WCS and WTI benchmarks.
Crack spreads are based on current crude feedstock prices, whereas actual earnings are accounted for on a FIFO basis in
accordance with IFRS where a delay exists between the time that feedstock is purchased and when it is processed and when
products are sold to a third party. A FIFO loss normally reflects a declining price environment for crude oil and finished products,
whereas FIFO gains reflect an increasing price environment for crude oil and finished products. The company’s realized refining
and marketing gross margins are also presented on a LIFO basis, which is consistent with how industry benchmarks and the
Suncor 5-2-2-1 index are calculated and with how management evaluates performance.
In the third quarter of 2021, the New York Harbor 2-1-1 and Chicago 2-1-1 benchmark crack spreads increased compared to the
prior year quarter due to increased demand for transportation fuels and to compensate for increased costs associated with
renewable blending regulatory obligations. The Suncor 5-2-2-1 index was US$27.60/bbl in the third quarter of 2021 compared to
US$16.80/bbl in the third quarter of 2020, primarily related to the increase in benchmark crack spreads.
The cost of natural gas used in Suncor’s Oil Sands and Refining operations is primarily referenced to Alberta spot prices at
AECO. The average AECO benchmark increased to $3.60/mcf in the third quarter of 2021, from $2.25/mcf in the prior year quarter.
Excess electricity produced at Suncor’s Oil Sands assets is sold to the Alberta Electric System Operator, with the proceeds
netted against the applicable cash operating cost per barrel metric. The Alberta power pool price increased to an average of
$100.35/MWh in the third quarter of 2021 compared to $43.85/MWh in the prior year quarter.
The majority of Suncor’s revenues from the sale of oil and natural gas commodities are based on prices that are determined by
or referenced to U.S. dollar benchmark prices, while the majority of Suncor’s expenditures are realized in Canadian dollars. The
Canadian dollar strengthened in relation to the U.S. dollar in the third quarter of 2021, as the average exchange rate increased
to US$0.79 per one Canadian dollar from US$0.75 per one Canadian dollar in the prior year quarter. This rate increase had a
negative impact on price realizations for the company during the third quarter of 2021 when compared to the prior year
quarter.
Suncor also has assets and liabilities, including approximately 63% of the company’s debt, that are denominated in U.S. dollars
and translated to Suncor’s reporting currency (Canadian dollars) at each balance sheet date. A decrease in the value of the Canadian
dollar, relative to the U.S. dollar, from the previous balance sheet date increases the amount of Canadian dollars required to
settle U.S. dollar denominated obligations, while an increase in the value of the Canadian dollar, relative to the U.S. dollar,
decreases the amount of Canadian dollars required to settle U.S. dollar denominated obligations.
2021 Third Quarter Suncor Energy Inc. 17

4. Segment Results and Analysis
Oil Sands
Financial Highlights
Three months endedSeptember 30
Nine months endedSeptember 30
($ millions) 2021 2020 2021 2020
Gross revenues 4 977 2 567 13 964 7 536
Less: Royalties (504) (36) (882) (77)
Operating revenues, net of royalties 4 473 2 531 13 082 7 459
Net earnings (loss) 484 (531) 1 251 (3 503)
Adjusted for:
Unrealized loss (gain) on risk management activities(1) 5 (8) 2 (8)
Impairment(2) — — — 1 376
Operating earnings (loss)(3) 489 (539) 1 253 (2 135)
Funds from operations(3) 1 591 556 4 671 1 257
(1) Beginning in the first quarter of 2021, the company revised its calculation of operating earnings, a non-GAAP financial measure, to exclude unrealized
(gains) losses on derivative financial instruments that are recorded at fair value to better align the earnings impact of the activity with the underlying
items being risk-managed. Prior period comparatives have been restated to reflect this change.
(2) During the first quarter of 2020, the company recorded non-cash after-tax impairment charges of $1.376 billion on its share of the Fort Hills assets
due to a decline in forecasted crude oil prices as a result of decreased global demand due to the COVID-19 pandemic and changes to its respective
capital, operating and production plans.
(3) Non-GAAP financial measures. See the Non-GAAP Financial Measures Advisory section of this MD&A.
Bridge Analysis of Operating (Loss) Earnings ($ millions)(1)(2)
FinancingExpense and
Other
78 489
Q32021
94
DD&A andExploration
Expense
(260)
Operating andTransportation
Expense
(307)
Royalties
1 178
Price, Marginand Other
Income
245
SalesVolumesand Mix
(539)
Q32020
(1) For an explanation of this bridge analysis, see the Non-GAAP Financial Measures Advisory section of this MD&A.
(2) Beginning in the first quarter of 2021, the company revised its calculation of operating earnings, a non-GAAP financial measure, to exclude unrealized
(gains) losses on derivative financial instruments that are recorded at fair value to better align the earnings impact of the activity with the underlying
items being risk-managed. Prior period comparatives have been restated to reflect this change.
Management’s Discussion and Analysis
18 2021 Third Quarter Suncor Energy Inc.

The Oil Sands segment had operating earnings of $489 million in the third quarter of 2021, compared to an operating loss of
$539 million in the prior year quarter. The increase was primarily due to higher realized crude prices, as crude benchmarks were
significantly impacted in the prior year quarter as a result of the COVID-19 pandemic, increased production and lower DD&A
expenses. Operating earnings were partially offset by an increase in royalties and operating expenses associated with Suncor’s
increased production in the third quarter of 2021.
Production Volumes(1)
Three months endedSeptember 30
Nine months endedSeptember 30
(mbbls/d) 2021 2020 2021 2020
SCO and diesel production(2) 418.8 421.1 467.0 461.2
Internally consumed diesel and internal transfers(3)(4) (13.3) (10.3) (14.2) (10.9)
Upgraded production 405.5 410.8 452.8 450.3
Bitumen production 203.9 108.2 186.0 117.2
Internal bitumen transfers(4) (4.3) — (2.1) —
Non-upgraded bitumen production 199.6 108.2 183.9 117.2
Total Oil Sands production 605.1 519.0 636.7 567.5
(1) Bitumen production from Oil Sands Base is upgraded, while bitumen production from In Situ operations is either upgraded or sold directly to
customers, including Suncor’s own refineries, with SCO and diesel yields of approximately 79% of bitumen feedstock input. Fort Hills finished bitumen
is sold directly to customers, including Suncor’s own refineries. Essentially all of the bitumen produced at Syncrude is upgraded to sweet SCO and
a small amount of diesel, at an approximate yield of 85%.
(2) Combined upgrader utilization rates are calculated using total upgraded production, inclusive of internally consumed diesel and internal transfers.
(3) Both Oil Sands operations and Syncrude produce diesel, which is internally consumed in mining operations, and Fort Hills and Syncrude use
internally produced diesel from Oil Sands Base within their mining operations. In the third quarter of 2021, Oil Sands operations production volumes
included 8,400 bbls/d of internallyconsumed diesel, of which 6,300 bbls/d was consumed at Oil Sands Base, 1,600 bbls/d was consumed at Fort
Hills and 500 bbls/d was consumed at Syncrude. Syncrude production volumes included 2,700 bbls/d of internally consumed diesel.
(4) Internal feedstock transfers between Oil Sands operations and Syncrude through the interconnecting pipelines are included in gross SCO and
bitumen production volumes. In the third quarter of 2021, Oil Sands operations included 2,000 bbls/d of SCO and 1,500 bbls/d of bitumen that was
transferred to Suncor’s share of Syncrude through the interconnecting pipelines. Syncrude production included 200 bbls/d of SCO and 2,800 bbls/d
of bitumen that was transferred to Oil Sands Base through the interconnecting pipelines.
The company’s net SCO production was 405,500 bbls/d in the third quarter of 2021 compared to 410,800 bbls/d in the prior year
quarter. In the third quarter of 2021, the company completed its five-year planned turnaround at Oil Sands Base plant
Upgrader 2, and subsequent to the quarter the asset ramped up to normal operating rates. Syncrude upgrader utilization was
91% in the third quarter of 2021, compared to 78% in the prior year quarter. The prior year quarter was impacted by planned
turnaround maintenance at both Oil Sands operations and Syncrude, and an operational incident at the secondary extraction
facilities at Oil Sands Base plant.
The company’s non-upgraded bitumen production increased to 199,600 bbls/d in the third quarter of 2021 from 108,200 bbls/d
in the prior year quarter due to continued strong performance from the company’s In Situ assets and the impact of the
significant planned turnaround at Oil Sands Base plant Upgrader 2, resulting in less Firebag volumes being processed at the
upgrader and therefore increased non-upgraded bitumen being sold to market. The increase in production was partially offset
by planned maintenance at Firebag in the third quarter of 2021. Production at Fort Hills increased during the third quarter of 2021,
compared to the prior year quarter. During the third quarter of 2021, significant progress on the mine ramp up strategy was
achieved and Fort Hills continued to manage overburden removal and build ore inventory according to plan. Fort Hills is expected
to transition to a two-train operation and operate at full production rates by the end of the year.
Sales Volumes
Three months endedSeptember 30
Nine months endedSeptember 30
(mbbls/d) 2021 2020 2021 2020
SCO and diesel 418.6 420.1 455.4 458.4
Non-upgraded bitumen 194.4 119.1 186.2 121.0
Total 613.0 539.2 641.6 579.4
SCO and diesel sales volumes were 418,600 bbls/d in the third quarter of 2021, compared to 420,100 bbls/d in the prior year
quarter, consistent with the decrease in upgraded production.
2021 Third Quarter Suncor Energy Inc. 19

Non-upgraded bitumen sales volumes increased to 194,400 bbls/d in the third quarter of 2021, compared to 119,100 bbls/d in
the prior year quarter, and were influenced by the same factors that affected production volumes, discussed above, partially offset
by a build of inventory in the current period.
Price Realizations
Net of transportation costs, but before royaltiesThree months ended
September 30Nine months ended
September 30($/bbl) 2021 2020 2021 2020
SCO and diesel 80.21 46.18 73.44 42.45
Non-upgraded bitumen 59.91 24.28 51.16 19.83
Crude sales basket (all products) 73.78 41.34 66.97 37.73
Crude sales basket, relative to WTI (15.12) (13.19) (14.16) (14.10)
Oil Sands price realizations increased in the third quarter of 2021 from the prior year quarter, in line with the improved commodity
price environment. The prior period was impacted by the significant decline in transportation fuel demand due to the impacts
of the COVID-19 pandemic. Price realizations have improved in line with increased demand, optimism relating to vaccine rollouts
and OPEC+ supply management.
Royalties
Royalties for the Oil Sands segment were higher in the third quarter of 2021 compared to the prior year quarter, primarily due
to increased royalties for In Situ operations due to Firebag being in the higher post-payout phase of its royalty agreement, higher
crude price realizations and increased production volumes.
Expenses and Other Factors
Total Oil Sands operating and transportation expenses increased in the third quarter of 2021 compared to the prior year
quarter. See the reconciliation in the Cash Operating Costs section below for further details regarding cash operating costs and
a breakdown of non-production costs by asset. In the third quarter of 2020, the relief provided under the Government of Canada’s
Emergency Wage Subsidy (CEWS) program, in addition to safe-mode costs associated with the deferral of capital projects and
additional costs incurred in response to the COVID-19 pandemic, have been included in operating and transportation expense by
asset. These costs, however, have been excluded from cash operating costs per barrel for comparability purposes.
At Oil Sands operations, operating costs increased compared to the prior year quarter, primarily due to higher production and
increased natural gas prices.
At Fort Hills, operating costs in the third quarter of 2021 increased when compared to the prior year quarter, reflecting increased
mine activity to remove overburden and increase ore inventory in preparation for the transition back to a two-train operation
in the fourth quarter. The third quarter of 2020 reflected reduced costs associated with a one-train operation as a result of the
decline in the business environment. Operating costs during the third quarter of 2021 were also impacted by increased natural
gas prices compared to the prior year quarter.
Suncor’s share of Syncrude operating costs in the third quarter of 2021 increased when compared with the prior year quarter,
primarily due to higher production and increased natural gas prices, partially offset by decreased maintenance costs.
DD&A expense for the third quarter of 2021 was lower compared to the prior year quarter, as the prior year quarter included
higher derecognition charges of property, plant and equipment and exploration and evaluation assets.
Management’s Discussion and Analysis
20 2021 Third Quarter Suncor Energy Inc.

Cash Operating Costs
Three months endedSeptember 30
Nine months endedSeptember 30
($ millions, except as noted) 2021 2020 2021 2020
Oil Sands operating, selling and general expense (OS&G) 2 004 1 650 5 922 5 430
Oil Sands operations cash operating costs(1) reconciliation
Oil Sands operations OS&G 1 158 1 000 3 478 3 278
Non-production costs(2) (40) 5 (158) (90)
Excess power capacity and other(3) (68) (54) (274) (193)
Inventory changes (31) (1) (34) (75)
Oil Sands operations cash operating costs(1) 1 019 950 3 012 2 920
Oil Sands operations production volumes (mbbls/d) 381.7 325.6 438.1 369.8
Oil Sands operations cash operating costs(1) ($/bbl) 29.05 31.75 25.20 28.80
Fort Hills cash operating costs(1) reconciliation
Fort Hills OS&G 232 130 624 598
Non-production costs(2) (25) (8) (83) (45)
Inventory changes (16) 15 (10) (37)
Fort Hills cash operating costs(1) 191 137 531 516
Fort Hills production volumes (mbbls/d) 50.8 42.6 49.1 56.8
Fort Hills cash operating costs(1) ($/bbl) 40.90 35.20 39.70 33.25
Syncrude cash operating costs(1) reconciliation
Syncrude OS&G 614 520 1 820 1 554
Non-production costs(2) (71) (11) (196) (47)
Syncrude cash operating costs(1) 543 509 1 624 1 507
Syncrude production volumes (mbbls/d) 190.2 161.1 165.8 151.7
Syncrude cash operating costs(1) ($/bbl) 31.05 34.35 35.90 36.25
(1) Non-GAAP financial measures. See the Non-GAAP Financial Measures Advisory section of this MD&A.
(2) Significant non-production costs include, but are not limited to, share-based compensation adjustments, research costs, project startup costs and
adjustments to reflect the cost of internal transfers in the receiving asset at the cost of production. In addition, non-production costs include safe-
mode costs associated with the deferral of capital projects and additional costs incurred in response to the COVID-19 pandemic. Non-production
costs for 2020 include the relief provided under the CEWS program. Non-production costs at Fort Hills and Syncrude also include, but are not limited
to, excess power revenue from cogeneration units and an adjustment to reflect internally produced diesel from Oil Sands operations at the cost of
production.
(3) Oil Sands operations excess power capacity and other includes, but is not limited to, the operational revenue impacts of excess power from
cogeneration units and the natural gas expense recorded as part of a non-monetary arrangement involving a third-party processor.
Oil Sands operations cash operating costs(1) per barrel decreased to $29.05 in the third quarter of 2021, compared to $31.75 in
the prior year quarter, due to increased production, partially offset by higher operating, selling and general expenses, as detailed
above.
Oil Sands operations non-production costs, which are excluded from cash operating costs, were higher in the current quarter
compared to the prior year quarter, as the prior year quarter included CEWS, partially offset by safe-mode and COVID-19 response
costs.
Oil Sands operations inventory changes reflect a draw of inventory in the current period.
Fort Hills cash operating costs(1) per barrel were $40.90 in the third quarter of 2021, compared to $35.20 in the prior year
quarter, reflecting increased mine activity to remove overburden and increase ore inventory associated with the planned
transition to a two-train operation, partially offset by higher production. In the third quarter of 2021, non-production costs were
higher compared to the prior year quarter, as the prior year quarter included CEWS, partially offset by additional costs incurred
(1) Non-GAAP financial measures. See the Non-GAAP Financial Measures Advisory section of this MD&A.
2021 Third Quarter Suncor Energy Inc. 21

in response to the COVID-19 pandemic. Inventory changes in the third quarter of 2021 reflect a draw of inventory, compared to
a change in inventory valuation, partially offset by a draw of inventory in the prior year quarter.
Syncrude cash operating costs(1) per barrel decreased to $31.05 in the third quarter of 2021, compared to $34.35 in the prior
year quarter, due to higher production, partially offset by higher operating, selling and general expenses, as detailed above.
Syncrude non-production costs, which are excluded from cash operating costs, were higher in the current quarter compared to
the prior year quarter, as the prior year quarter included CEWS.
Results for the First Nine Months of 2021
Oil Sands net earnings were $1.251 billion for the first nine months of 2021 compared to a net loss of $3.503 billion in the prior
year period. In addition to the factors impacting operating (loss) earnings explained below, net earnings for the first nine months
of 2021 included a $2 million after-tax unrealized loss on risk management activities. Net loss for the first nine months of 2020
included $1.376 billion of non-cash after-tax asset impairment charges and an after-tax unrealized gain on risk management
activities of $8 million.
Oil Sands operating earnings for the first nine months of 2021 were $1.253 billion compared to an operating loss of $2.135 billion
for the same period in 2020. The increase was primarily due to higher realized crude prices, as crude benchmarks were
significantly impacted in the prior year period as a result of the COVID-19 pandemic and OPEC+ supply issues, and increased
production, partially offset by higher royalties and operating expenses.
Funds from operations for the first nine months of 2021 were $4.671 billion for the Oil Sands segment, compared to $1.257 billion
in the prior year period, with the increase primarily due to the same factors that influenced operating earnings noted above.
Oil Sands operations cash operating costs per barrel averaged $25.20 for the first nine months of 2021, a decrease from an
average of $28.80 for the first nine months of 2020, due to increased production, partially offset by higher natural gas prices.
Fort Hills cash operating costs per barrel averaged $39.70 for the first nine months of 2021, compared to $33.25 for the same
period of 2020, reflecting increased mine activity to increase ore inventory in preparation for the transition to a two-train operation.
Higher production for the first nine months of 2020 reflected Fort Hills operating on two primary extraction trains early in the
year. The company managed production to keep pace with reduced downstream demand as a result of the COVID-19 pandemic,
temporarily transitioning to a one-train operation at Fort Hills in the second quarter of 2020.
Syncrude cash operating costs per barrel averaged $35.90 for the first nine months of 2021, a decrease compared to $36.25 in
the first nine months of 2020, primarily due to an increase in production volumes, partially offset by higher planned maintenance
and increased natural gas prices.
Planned Maintenance Update
There are no significant maintenance events scheduled for the fourth quarter of 2021. In the third quarter of 2021, the significant
planned turnaround at Oil Sands Base plant Upgrader 2 was completed, as well as planned maintenance at Firebag.
(1) Non-GAAP financial measures. See the Non-GAAP Financial Measures Advisory section of this MD&A.
Management’s Discussion and Analysis
22 2021 Third Quarter Suncor Energy Inc.

Exploration and Production
Financial Highlights
Three months endedSeptember 30
Nine months endedSeptember 30
($ millions) 2021 2020 2021 2020
Gross revenues(1) 691 512 2 052 1 344
Less: Royalties(1) (56) (30) (183) (58)
Operating revenues, net of royalties 635 482 1 869 1 286
Net earnings (loss) 407 25 820 (453)
Adjusted for:
Asset impairment (reversal)(2) (168) — (168) 422
Operating earnings (loss)(3) 239 25 652 (31)
Funds from operations(3) 357 260 1 053 742
(1) Production, revenues and royalties from the company’s Libya operations have been presented in the E&P section of this MD&A on an economic
basis and exclude an equal and offsetting gross-up of revenues and royalties of $53 million in the third quarter of 2021 and $188 million in the first
nine months of 2021, which is required for presentation purposes in the company’s financial statements under the working-interest basis. In the
first nine months of 2020, there were no Libya sales included in production, revenues or royalties.
(2) During the first quarter of 2020, the company recorded non-cash after-tax impairment charges of $422 million against its share of the White Rose
and Terra Nova assets due to a decline in forecasted crude oil prices as a result of decreased global demand due to the COVID-19 pandemic and
changes to their respective capital, operating and production plans. During the third quarter of 2021, the company recorded a non-cash after-tax
impairment reversal of $168 million on its share of the Terra Nova assets as a result of the ALE project moving forward and the benefit of royalty and
financial support from the Government of Newfoundland and Labrador.
(3) Non-GAAP financial measures. See the Non-GAAP Financial Measures Advisory section of this MD&A.
Bridge Analysis of Operating (Loss) Earnings ($ millions)(1)
FinancingExpense and
Other
33 239
Q32021
65
DD&A andExploration
Expense
6
Operating andTransportation
Expense
(18)
Royalties
157
Price, Marginand Other
Revenue
(29)
SalesVolumesand Mix
25
Q32020
(1) For an explanation of this bridge analysis, see the Non-GAAP Financial Measures Advisory section of this MD&A.
Operating earnings for the E&P segment in the third quarter of 2021 increased to $239 million compared to $25 million in the
prior year quarter, with the increase primarily due to higher realized crude prices and lower DD&A and exploration expense,
partially offset by lower sales volumes and higher royalties.
2021 Third Quarter Suncor Energy Inc. 23

Production Volumes
Three months endedSeptember 30
Nine months endedSeptember 30
2021 2020 2021 2020
E&P Canada (mbbls/d) 54.4 57.1 56.6 60.6
E&P International (mboe/d) 39.1 40.1 34.3 42.3
Total production (mboe/d) 93.5 97.2 90.9 102.9
Total sales volumes (mboe/d) 76.3 96.0 88.1 103.9
Production volumes for E&P Canada were 54,400 bbls/d in the third quarter of 2021, compared to 57,100 bbls/d in the prior
year quarter, primarily due to natural declines and lower asset performance. Both periods were impacted by the absence of
production from Terra Nova as the asset has remained off-line since the fourth quarter of 2019. During the third quarter of 2021,
Suncor and the co-owners of the Terra Nova project finalized an agreement to restructure the project ownership and move
forward with the ALE project. The agreement increased the company’s working interest to 48% (previously approximately 38%)
in exchange for a cash payment from the exiting owners, and includes the previously disclosed royalty and financial support from
the Government of Newfoundland and Labrador. The company received $26 million (net of taxes of $8 million) in cash
consideration to acquire the additional 10% working interest in the Terra Nova project, which will be used to partially fund the
2022 capital spend of the project. In mid-September, maintenance work commenced on the Terra Nova Floating, Production,
Storage and Offloading facility and upon completion the facility is expected to sail to dry dock in Ferrol, Spain later this year, with
a safe return to operations anticipated before the end of 2022.
E&P International production was 39,100 boe/d in the third quarter of 2021, compared to 40,100 boe/d in the prior year quarter.
Production volumes decreased in the current quarter primarily due to natural declines, partially offset by higher production at
the Golden Eagle Area Development and liftings in Libya in the third quarter of 2021 compared to no liftings in the prior year
quarter.
E&P sales volumes decreased to 76,300 boe/d in the third quarter of 2021, compared to 96,000 boe/d in the prior year quarter,
due to a build of inventory at E&P International associated with the timing of cargo sales.
Price Realizations
Three months endedSeptember 30
Nine months endedSeptember 30
Net of transportation costs, but before royalties 2021 2020 2021 2020
Exploration and Production
E&P Canada – Crude oil and natural gas liquids ($/bbl) 90.23 56.21 81.43 48.25
E&P International(1) ($/boe) 85.29 54.06 77.09 49.53
(1) E&P International price realizations exclude Libya.
Price realizations at E&P Canada and E&P International increased in the third quarter of 2021 from the prior year quarter, in line
with the improved commodity price environment. The prior period was impacted by the significant decline in transportation
fuel demand due to the impacts of the COVID-19 pandemic. Price realizations have improved in line with increased demand,
optimism relating to vaccine rollouts and OPEC+ supply management.
Royalties
E&P royalties in the third quarter of 2021 were higher than the prior year quarter primarily due to the increase in price realizations.
Expenses and Other Factors
Operating and transportation expenses for the third quarter of 2021 were comparable to the prior year quarter.
DD&A and exploration expense in the third quarter of 2021 decreased from the prior year quarter as a result of lower sales
volumes, the absence of DD&A on the company’s White Rose assets as a result of impairment charges in the fourth quarter of
2020 and on the Golden Eagle Area Development asset as a result of the asset classified as held for sale in the third quarter
of 2021.
Non-Cash Asset Impairment Reversal
During the third quarter of 2021, the company recorded a non-cash impairment reversal of $168 million (net of taxes of
$53 million) on its share of the Terra Nova assets as a result of the ALE project moving forward and the benefit of royalty and
financial support from the Government of Newfoundland and Labrador.
Management’s Discussion and Analysis
24 2021 Third Quarter Suncor Energy Inc.
Results for the First Nine Months of 2021
Net earnings for E&P were $820 million for the first nine months of 2021 compared to a net loss of $453 million in the prior year
period. In addition to the factors impacting operating earnings (loss) described below, net earnings for the first nine months
of 2021 included a non-cash after-tax impairment reversal of $168 million against the company’s share of the Terra Nova assets.
Net earnings for the first nine months of 2020 included non-cash after-tax impairment charges of $422 million against the
company’s share of the White Rose and Terra Nova assets.
Operating earnings for E&P for the first nine months of 2021 were $652 million compared to an operating loss of $31 million for
the first nine months of 2020. The increase was primarily due to higher realized crude prices as crude benchmarks were
significantly impacted in the prior year period due to the impacts of the COVID-19 pandemic and OPEC+ supply issues as well as
lower DD&A and exploration expense, partially offset by lower production volumes and higher royalties.
Funds from operations were $1.053 billion for the first nine months of 2021, compared to $742 million for the first nine months
of 2020, due to the same reasons noted in operating (loss) earnings above, excluding the impacts of DD&A and exploration
expense.
Subsequent Event
Subsequent to the third quarter of 2021, the company completed the sale of its 26.69% working interest in the Golden Eagle
Area Development for after-tax proceeds of US$250 million net of closing adjustments and other closing costs, and future
contingent consideration of up to US$50 million, resulting in an estimated after-tax gain on sale of approximately $235 million.
The company completed the sale on October 22, 2021 with an effective date of January 1, 2021.
Planned Maintenance Update for Operated Assets
There are no significant maintenance events scheduled for the fourth quarter of 2021.
Refining and Marketing
Financial Highlights
Three months endedSeptember 30
Nine months endedSeptember 30
($ millions) 2021 2020 2021 2020
Operating revenues 6 341 4 050 16 292 11 396
Net earnings 646 384 1 728 598
Adjusted for:
Unrealized loss (gain) on risk management activities(1) 12 (28) 5 4
Operating earnings(2) 658 356 1 733 602
Funds from operations(2) 947 594 2 490 1 293
(1) Beginning in the first quarter of 2021, the company revised its calculation of operating earnings, a non-GAAP financial measure, to exclude unrealized
(gains) losses on derivative financial instruments that are recorded at fair value to better align the earnings impact of the activity with the underlying
items being risk-managed. Prior period comparatives have been restated to reflect this change.
(2) Non-GAAP financial measures. See the Non-GAAP Financial Measures Advisory section of this MD&A.
2021 Third Quarter Suncor Energy Inc. 25

Bridge Analysis of Operating Earnings ($ millions)(1)(2)
658
Q32021
(51) (13)
FinancingExpense and
Other
(34)
OperatingExpense and
DD&A
FIFO InventoryValuation and
Short-TermCommodity Risk
Management
281
Refining andMarketing
Margin
119
RefineryProduction
356
Q32020
(1) For an explanation of this bridge analysis, see the Non-GAAP Financial Measures Advisory section of this MD&A.
(2) Beginning in the first quarter of 2021, the company revised its calculation of operating earnings, a non-GAAP financial measure, to exclude unrealized(gains) losses on derivative financial instruments that are recorded at fair value to better align the earnings impact of the activity with the underlyingitems being risk-managed. Prior period comparatives have been restated to reflect this change.
R&M operating earnings in the third quarter of 2021 increased to $658 million from $356 million in the prior year quarter,
primarily due to higher refining and marketing margins as a result of significantly higher crack spread benchmarks and higher
crude throughput and refined product sales in the third quarter of 2021 compared to the prior year quarter.
VolumesThree months ended
September 30Nine months ended
September 302021 2020 2021 2020
Crude oil processed (mbbls/d)
Eastern North America 212.3 208.7 198.9 197.0
Western North America 248.0 191.0 205.9 199.5
Total 460.3 399.7 404.8 396.5
Refinery utilization(1)(2) (%)
Eastern North America 96 94 90 89
Western North America 102 80 84 83
Total 99 87 87 86
Refined product sales (mbbls/d)
Gasoline 236.5 233.4 223.4 214.5
Distillate 233.8 220.6 225.4 213.2
Other 81.2 80.0 72.3 73.9
Total 551.5 534.0 521.1 501.6
Refining and marketing gross margin – FIFO(3) ($/bbl) 35.75 30.75 38.10 25.10
Refining and marketing gross margin – LIFO(3) ($/bbl) 33.80 25.00 31.25 29.95
Refining operating expense(3) ($/bbl) 5.45 5.40 5.90 5.60
(1) Refinery utilization is the amount of crude oil and natural gas plant liquids run through crude distillation units, expressed as a percentage of thecapacity of these units.
(2) The Edmonton refinery crude processing capacity has increased to 146,000 bbls/d in 2021 from 142,000 bbls/d in 2020.
(3) Non-GAAP financial measures. See the Non-GAAP Financial Measures Advisory section of this MD&A.
Management’s Discussion and Analysis
26 2021 Third Quarter Suncor Energy Inc.

Refinery crude throughput increased to 460,300 bbls/d and refinery utilization was 99% in the third quarter of 2021, compared
to refinery crude throughput of 399,700 bbls/d and refinery utilization of 87% in the prior year quarter, reflecting strong utilizations
across all refineries comparable to the same periods in 2018 and 2019, despite Canadian gasoline and diesel demand estimated
to be 7%(1) below the comparable period in 2019. The prior year quarter reflected reduced rates due to the completion of an
eight-week planned turnaround at the Edmonton refinery and lower demand for refined products.
Refined product sales in the third quarter of 2021 increased to 551,500 bbls/d, compared to 534,000 bbls/d in the prior year
quarter. Strong utilizations during the quarter, increased demand and secured sales channels positioned the company to capture
the improved business environment.
Refining and Marketing Gross Margins
Refining and marketing gross margins were influenced by the following:
• On a LIFO(2) basis, Suncor’s refining and marketing gross margin increased to $33.80/bbl in the third quarter of 2021, from
$25.00/bbl in the prior year quarter, due to improved market crack spreads and demand and the widening of heavy crude oil
differentials. Suncor’s refining and marketing gross margin also reflects Suncor’s feedstock advantage, which enables the
company to process heavier crude oil, marketing and logistics capabilities and strong sales channels within its integrated
retail and wholesale networks.
• On a FIFO basis, Suncor’s refining and marketing gross margin increased to $35.75/bbl in the third quarter of 2021, from
$30.75/bbl in the prior year quarter, due to the same factors noted above, in addition to FIFO inventory valuation impacts.
In the third quarter of 2021, the FIFO method of inventory valuation, relative to an estimated LIFO(2) accounting method,
resulted in an after-tax gain of $84 million. In the prior year quarter, FIFO resulted in an after-tax gain of $164 million, for an
unfavourable quarter-over-quarter impact of $34 million, after-tax, including the impact of short-term commodity risk
management activities.
Expenses and Other Factors
Operating expenses and DD&A in the third quarter of 2021 increased compared to the prior year quarter, primarily due to an
increase in throughput and higher commodity prices in the current period and the prior year period being favourably impacted
by CEWS. Refining operating expense(3) per barrel was $5.45 in the third quarter of 2021, comparable to $5.40 in the prior
year quarter.
Results for the First Nine Months of 2021
R&M’s net earnings were $1.728 billion for the first nine months of 2021 compared to $598 million in the prior year period. In
addition to the factors impacting operating earnings described below, net earnings for the first nine months of 2021 included a
$5 million after-tax unrealized loss on risk management activities, compared to a $4 million loss in the prior year period.
Operating earnings for R&M in the first nine months of 2021 were $1.733 billion, compared to $602 million in the first nine months
of 2020, with the increase primarily due to a FIFO inventory valuation gain as a result of a significant increase in crude and
refined product benchmarks compared to the prior year period, which included a FIFO inventory valuation loss. For the first
nine months of 2021, the impact of the FIFO method of inventory valuation, relative to an estimated LIFO method, had a positive
impact to operating earnings and funds from operations of $689 million after-tax, compared to a negative after-tax impact of
$428 million in the first nine months of 2020.
Funds from operations were $2.490 billion in the first nine months of 2021, compared to $1.293 billion in the first nine months
of 2020, and increased primarily due to the same factors that influenced operating earnings described above.
Planned Maintenance
The company has completed all major planned refinery maintenance for 2021.
(1) Sources: IHS Markit and Statistics Canada.
(2) The estimated impact of the LIFO method is a non-GAAP financial measure. See the Non-GAAP Financial Measures Advisory section of this MD&A.
(3) Refining operating expense is a non-GAAP financial measure. See the Non-GAAP Financial Measures Advisory section of this MD&A.
2021 Third Quarter Suncor Energy Inc. 27

Corporate and Eliminations
Financial HighlightsThree months ended
September 30Nine months ended
September 30($ millions) 2021 2020 2021 2020
Net (loss) earnings (660) 110 (1 233) (793)
Adjusted for:
Unrealized foreign exchange loss (gain) on U.S. dollardenominated debt 257 (290) (80) 253
Restructuring charge(1) — — 126 —
Loss on early repayment of long-term debt(2) 60 — 60 —
Operating (loss) earnings(3) (343) (180) (1 127) (540)
Corporate (316) (203) (958) (654)
Eliminations (27) 23 (169) 114
Funds used in operations(3) (254) (244) (1 101) (637)
(1) During the first quarter of 2021, the company recorded a restructuring charge related to the previously announced workforce reductions.
(2) Charges associated with the early repayment of debt.
(3) Non-GAAP financial measures. See the Non-GAAP Financial Measures Advisory section of this MD&A.
Corporate incurred an operating loss of $316 million for the third quarter of 2021, compared to an operating loss of $203 million
for the prior year quarter, with the increased loss attributable to costs associated with digital and technology improvements
and the impact of tax settlements, partially offset by an operational foreign exchange gain in the current year quarter, as
compared to an operational foreign exchange loss in the prior year quarter. The third quarter of 2021 was also impacted by a lower
share-based compensation recovery compared to the prior year quarter. Suncor capitalized $38 million of its borrowing costs
in the third quarter of 2021 as part of the cost of major development assets and construction projects in progress, compared to
$29 million in the prior year quarter.
Eliminations reflect the deferral or realization of profit or loss on crude oil sales from Oil Sands to Suncor’s refineries. Consolidated
profits and losses are only realized when the refined products produced from internal purchases of crude feedstock have been
sold to third parties. During the third quarter of 2021, the company deferred $27 million of after-tax intersegment profit, compared
to a realization of intersegment profit and elimination of unrealized losses of $23 million after-tax in the prior year quarter. The
deferral of profit in the third quarter of 2021 was driven by a strengthening in benchmark pricing compared to a weakening in
benchmark pricing in the third quarter of 2020.
Corporate and Eliminations funds used in operations were $254 million for the third quarter of 2021, compared to $244 million
in the third quarter of 2020, and were influenced by the same factors impacting operating loss described above, excluding the
impact of tax settlements and share-based compensation.
Results for the First Nine Months of 2021
The net loss for Corporate and Eliminations was $1.233 billion for the first nine months of 2021, compared to $793 million in the
prior year period. In addition to the factors impacting operating loss described below, the net loss for the first nine months of
2021 included an after-tax restructuring charge of $126 million related to workforce reductions recorded in the first quarter of
2021, an $80 million unrealized after-tax foreign exchange gain on the revaluation of U.S. dollar denominated debt, and a
$60 million after-tax loss for early repayment of long-term debt in the third quarter of 2021. The net loss in the prior year period
included a $253 million unrealized after-tax foreign exchange loss on the revaluation of U.S. dollar denominated debt.
The operating loss for Corporate and Eliminations for the first nine months of 2021 was $1.127 billion compared to $540 million
in the first nine months of 2020. The increased operating loss was attributed to a share-based compensation expense in the
first nine months of 2021, as compared to a share-based compensation recovery incurred in the first nine months of 2020, costs
associated with digital and technology improvements in the first nine months of 2021 and an elimination of intercompany
profit in the current year period compared to an elimination of an intercompany loss in the prior year period. The company
capitalized $106 million of its borrowing costs in the first nine months of 2021 compared with $94 million in the first nine months
of 2020.
Corporate and Eliminations funds used in operations for the first nine months of 2021 were $1.101 billion, compared to
$637 million in the prior year period, and were influenced by the same factors impacting operating loss noted above, excluding
the impact of share-based compensation expense. Funds used in operations were also impacted by the restructuring charge
related to the workforce reductions recorded in the first quarter of 2021.
Management’s Discussion and Analysis
28 2021 Third Quarter Suncor Energy Inc.

5. Capital Investment Update
Capital and Exploration Expenditures by Segment
Three months endedSeptember 30
Nine months endedSeptember 30
($ millions) 2021 2020 2021 2020
Oil Sands 935 661 2 308 2 108
Exploration and Production 64 99 197 409
Refining and Marketing 142 156 637 334
Corporate and Eliminations 80 25 229 108
Total capital and exploration expenditures 1 221 941 3 371 2 959
Less: capitalized interest on debt (38) (29) (106) (94)
1 183 912 3 265 2 865
Capital and Exploration Expenditures by Type, Excluding Capitalized Interest
Three months endedSeptember 30, 2021
Nine months endedSeptember 30, 2021
($ millions)Asset Sustainment and
Maintenance(1)Economic
Investment(2) TotalAsset Sustainment and
Maintenance(1)Economic
Investment(2) Total
Oil Sands
Oil Sands Base 444 122 566 906 295 1 201
In Situ 41 78 119 94 208 302
Fort Hills 87 — 87 180 — 180
Syncrude 114 22 136 492 59 551
Exploration and Production — 57 57 — 176 176
Refining and Marketing 123 19 142 598 38 636
Corporate and Eliminations 12 64 76 39 180 219
821 362 1 183 2 309 956 3 265
(1) Asset sustainment and maintenance capital expenditures include capital investments that deliver on existing value by ensuring compliance or
maintaining relations with regulators and other stakeholders, maintaining current processing capacity and delivering existing developed reserves.
(2) Economic investment capital expenditures include capital investments that result in an increase in value through adding reserves, improving
processing capacity, utilization, cost or margin, including associated infrastructure.
The company’s 2021 capital expenditures are focused on the safety and reliability of the company’s operations, heavily weighted
towards asset sustainment and maintenance, which includes significant planned turnaround activities across all of its refineries,
at Oil Sands operations, including a significant planned turnaround at Oil Sands Base plant Upgrader 2, and a planned
turnaround at Syncrude’s largest coker. All significant planned maintenance has been completed for 2021 and there are no
significant planned maintenance events scheduled for the fourth quarter of 2021.
During the third quarter of 2021, the company spent $1.183 billion on capital expenditures, excluding capitalized interest,
compared to $912 million in the prior year quarter. In 2020, due to the impacts of the COVID-19 pandemic, the company deferred,
suspended and cancelled certain capital projects or changed the scope of work to reduce costs and to comply with COVID-19
safety measures.
2021 Third Quarter Suncor Energy Inc. 29

Activity in the third quarter of 2021 is summarized by business unit below.
Oil Sands
Oil Sands Base capital expenditures were $566 million in the third quarter of 2021 and were primarily focused on asset
sustainment and maintenance activities including the significant planned turnaround at Oil Sands Base plant Upgrader 2, as
well as economic investment to progress low-carbon power cogeneration to replace the coke-fired boilers.
In Situ capital expenditures were $119 million in the third quarter of 2021 and were primarily directed towards economic
investment activities, including the continued investment in well pad projects, and asset sustainment and maintenance activities
including planned maintenance at Firebag.
Capital expenditures at Fort Hills were $87 million in the third quarter of 2021, primarily directed towards asset sustainment
and maintenance activities in mine and tailings development.
Syncrude capital expenditures were $136 million in the third quarter of 2021, the majority of which were for asset sustainment
and maintenance expenditures.
Exploration and Production
Capital and exploration expenditures at E&P were $57 million in the third quarter of 2021 and were related to economic
investment projects, including development drilling at Hebron and development work at Buzzard and the Fenja project.
In the third quarter of 2021, the co-owners of the Terra Nova project finalized an agreement to restructure the project ownership
and move forward with the ALE project. The finalization of this agreement has no impact on Suncor’s 2021 capital guidance.
Refining and Marketing
R&M capital expenditures were $142 million in the third quarter of 2021 and were primarily related to asset sustainment and
maintenance activities.
Corporate and Eliminations
Corporate capital expenditures were $76 million in the third quarter of 2021 and were primarily directed towards the company’s
digital transformation and the Forty Mile Wind Power Project.
Management’s Discussion and Analysis
30 2021 Third Quarter Suncor Energy Inc.

6. Financial Condition and Liquidity
Indicators
Twelve months endedSeptember 30
2021 2020
Return on capital employed(1)(2) (%) 4.5 (10.2)
Net debt to funds from operations(3)(4) (times) 2.0 3.8
Interest coverage on long-term debt (times)
Earnings basis(5) 3.9 (7.5)
Funds from operations basis(4)(6) 10.0 5.4
Total debt to total debt plus shareholders’ equity (%) 34.3 36.8
Net debt to net debt plus shareholders’ equity(3)(7) (%) 31.5 35.2
Net debt to net debt plus shareholders’ equity – excluding leases(3)(7) (%) 27.5 31.6
(1) Non-GAAP financial measure. See the Non-GAAP Financial Measures Advisory section of this MD&A.
(2) ROCE would have been 4.9% for the twelve months ended September 30, 2021, excluding the impact of impairments of $423 million after-tax in
the fourth quarter of 2020 and the impact of the impairment reversal of $168 million after-tax in the third quarter of 2021. ROCE would have been
(1.3%) for the twelve months ended September 30, 2020, excluding the impact of impairments of $1.798 billion after-tax in the first quarter of
2020 and the impacts of impairments of $3.352 billion after-tax in the fourth quarter of 2019.
(3) Net debt is equal to total debt less cash and cash equivalents.
(4) Funds from operations and metrics that use funds from operations are non-GAAP financial measures. See the Non-GAAP Financial Measures
Advisory section of this MD&A.
(5) Equal to net earnings plus income taxes and interest expense, divided by the sum of interest expense and capitalized interest on debt.
(6) Equal to funds from operations plus current income taxes and interest expense, divided by the sum of interest expense and capitalized interest on
debt.
(7) Beginning in the first quarter of 2021, the company has added two supplemental debt metrics that reflect additional information that management
uses to evaluate capital management.
Capital Resources
Suncor’s capital resources consist primarily of cash flow provided by operating activities, cash and cash equivalents, and
available lines of credit. Suncor’s management believes the company will have the capital resources to fund its planned 2021
capital spending program of $3.8 billion to $4.5 billion and to meet current and future working capital requirements, through cash
and cash equivalents balances, cash flow provided by operating activities, available committed credit facilities, issuing
commercial paper and, if needed, accessing capital markets. The company’s cash flow provided by operating activities depends
on a number of factors, including commodity prices, production and sales volumes, refining and marketing gross margins,
operating expenses, taxes, royalties and foreign exchange rates.
The company has invested cash in short-term financial instruments that are presented as cash and cash equivalents. The
objectives of the company’s short-term investment portfolio are to ensure the preservation of capital, maintain adequate liquidity
to meet Suncor’s cash flow requirements and deliver competitive returns derived from the quality and diversification of
investments within acceptable risk parameters. The maximum weighted average term to maturity of the short-term investment
portfolio is not expected to exceed six months, and all investments will be with counterparties with investment grade debt
ratings.
Available Sources of Liquidity
For the three months ended September 30, 2021, cash and cash equivalents increased to $2.309 billion from $2.035 billion at
June 30, 2021, due to cash flow from operating activities exceeding the company’s capital and exploration expenditures, debt
reduction, dividend payments and the repurchase of Suncor’s own shares under its NCIB in the third quarter of 2021.
For the nine months ended September 30, 2021, cash and cash equivalents increased relative to $1.885 billion at December 31,
2020, due to cash flow from operating activities exceeding the company’s capital and exploration expenditures, debt reduction,
dividend payments and the repurchase of Suncor’s own shares under its NCIB.
As at September 30, 2021, the weighted average days to maturity of the company’s short-term investment portfolio was
approximately 22 days.
Available credit facilities for liquidity purposes at September 30, 2021, decreased to $4.050 billion, compared to $6.043 billion at
December 31, 2020. The decrease in liquidity was primarily due to the cancellation of $2.8 billion in bi-lateral credit facilities
2021 Third Quarter Suncor Energy Inc. 31

that were entered into in March and April of 2020 to ensure access to adequate financial resources in connection with the
COVID-19 pandemic, and a reduction in the size of the company’s syndicated credit facilities. The decrease was partially offset
by increased credit availability as a result of a lower commercial paper balance.
Financing Activities
Management of debt levels and liquidity continues to be a priority for Suncor given the company’s long-term plans and future
expected volatility in the current business environment. Suncor believes a phased and flexible approach to existing and future
projects should assist the company in maintaining its ability to manage project costs and debt levels.
During the third quarter of 2021, Suncor exercised the early redemption option on its outstanding US$750 million 3.60% senior
unsecured notes, originally maturing on December 1, 2024. A premium was paid to redeem the debt early, with future interest
savings expected to more than offset this amount.
Total Debt to Total Debt Plus Shareholders’ Equity
Suncor is subject to financial and operating covenants related to its bank debt and public market debt. Failure to meet the
terms of one or more of these covenants may constitute an “event of default” as defined in the respective debt agreements,
potentially resulting in accelerated repayment of one or more of the debt obligations. The company is in compliance with its
financial covenant that requires total debt to not exceed 65% of its total debt plus shareholders’ equity. At September 30, 2021,
total debt to total debt plus shareholders’ equity was 34.3% (December 31, 2020 – 37.8%). The company continues to be in
compliance with all operating covenants under its debt agreements.
September 30 December 31($ millions, except as noted) 2021 2020
Short-term debt 1 484 3 566
Current portion of long-term debt 611 1 413
Current portion of long-term lease liabilities 314 272
Long-term debt 13 998 13 812
Long-term lease liabilities 2 573 2 636
Total debt 18 980 21 699
Less: Cash and cash equivalents 2 309 1 885
Net debt 16 671 19 814
Shareholders’ equity 36 300 35 757
Total debt plus shareholders’ equity 55 280 57 456
Total debt to total debt plus shareholders’ equity (%) 34.3 37.8
Net debt to net debt plus shareholders’ equity (%) 31.5 35.7
Net debt to net debt plus shareholders’ equity – excluding leases (%) 27.5 32.1
Change in Debt
Three months ended Nine months ended($ millions) September 30, 2021 September 30, 2021
Total debt – beginning of period 20 716 21 699
Decrease in long-term debt (1 030) (657)
Decrease in short-term debt (1 155) (2 061)
Increase in lease liability 170 252
Lease payments (69) (237)
Foreign exchange on debt, and other 348 (16)
Total debt – September 30, 2021 18 980 18 980
Less: Cash and cash equivalents – September 30, 2021 2 309 2 309
Net debt – September 30, 2021 16 671 16 671
The company’s total debt decreased in the third quarter of 2021 due to a significant reduction in short-term debt, the repayment
of long-term debt and principal lease payments made during the third quarter of 2021, partially offset by unfavourable foreign
exchange rates on U.S. dollar denominated debt compared to June 30, 2021, and leases entered into in the third quarter of 2021.
Management’s Discussion and Analysis
32 2021 Third Quarter Suncor Energy Inc.

The company’s total debt decreased in the first nine months of 2021 due to the significant reduction of short-term debt, the
repayment of long-term debt, favourable foreign exchange rates on U.S. dollar denominated debt compared to December 31,
2020, and principal lease payments made during the first nine months of the year, partially offset by the issuance of long-term
debt and leases entered into during the first nine months of 2021.
Common Shares
September 30,(thousands) 2021
Common shares 1 462 150
Common share options – exercisable 28 713
Common share options – non-exercisable 8 882
As at October 25, 2021, the total number of common shares outstanding was 1,457,054,742 and the total number of exercisable
and non-exercisable common share options outstanding was 37,456,292. Once exercisable, each outstanding common share
option is convertible into one common share.
Share Repurchases
In the first quarter of 2021, the TSX accepted a notice filed by Suncor to commence a NCIB to repurchase common shares
through the facilities of the TSX, New York Stock Exchange and/or alternative trading platforms. The notice provided that,
beginning February 8, 2021, and ending February 7, 2022, Suncor may purchase for cancellation up to 44,000,000 common
shares, which is equal to approximately 2.9% of Suncor’s 1,525,150,794 issued and outstanding common shares as at January 31,
2021.
During the third quarter of 2021, and following the Board’s approval to increase the company’s share repurchase program to
approximately 5% of the company’s outstanding common shares, Suncor received approval from the TSX to amend its existing
NCIB effective as of the close of markets on July 30, 2021, to repurchase common shares through the facilities of the TSX, New York
Stock Exchange and/or alternative trading platforms. The amended notice provided that Suncor may increase the maximum
number of common shares that may be repurchased in the period beginning February 8, 2021, and ending February 7, 2022, from
44,000,000 common shares, or approximately 2.9% of Suncor’s issued and outstanding common shares as at January 31, 2021,
to 76,250,000 common shares, or approximately 5% of Suncor’s issued and outstanding common shares as at January 31, 2021.
Subsequent to the third quarter of 2021, and following the Board’s approval to increase the company’s share repurchase
program to approximately 7% of the company’s public float, Suncor received approval from the TSX to amend its existing NCIB
effective as of the close of markets on October 29, 2021, to purchase common shares through the facilities of the TSX, New York
Stock Exchange and/or alternative trading platforms. The notice provides that Suncor may increase the maximum number of
common shares that may be repurchased in the period beginning February 8, 2021, and ending February 7, 2022, from
76,250,000 shares, or approximately 5% of Suncor’s issued and outstanding common shares as at January 31, 2021, to
106,700,000, or approximately 7% of Suncor’s public float as at January 31, 2021. No other terms of the NCIB have been amended.
Suncor security holders may obtain a copy of the amended notice, without charge, by contacting the company.
Between February 8, 2021, and October 25, 2021, and pursuant to the NCIB, Suncor has already repurchased approximately
$1.834 billion of common shares on the open market. Pursuant to the NCIB (as amended), Suncor has agreed that it will not
purchase more than 106,700,000 common shares, of which 69,058,156 common shares have already been purchased between
February 8, 2021, and October 25, 2021.
The actual number of common shares that may be repurchased under the NCIB and the timing of any such purchases will be
determined by Suncor. Suncor believes that, depending on the trading price of its common shares and other relevant factors,
repurchasing its common shares represents an attractive investment opportunity and is in the best interests of the company and
its shareholders. The company does not expect that the decision to allocate cash to repurchase shares will affect its long-term
growth strategy.
Three months endedSeptember 30
Nine months endedSeptember 30
($ millions, except as noted) 2021 2020 2021 2020
Share repurchase activities (thousands of common shares) 28 112 — 63 101 7 527
Weighted average repurchase price per share (dollars per share) 25.05 — 26.39 40.83
Share repurchase cost 704 — 1 665 307
2021 Third Quarter Suncor Energy Inc. 33

Contractual Obligations, Commitments, Guarantees and Off-Balance Sheet Arrangements
In the normal course of business, the company is obligated to make future payments, including contractual obligations and non-
cancellable commitments. Suncor has included these items in the Financial Condition and Liquidity section of the 2020 annual
MD&A with no material updates to note during the first nine months of 2021. Suncor does not believe it has any guarantees or off-
balance sheet arrangements that have, or are reasonably likely to have, a current or future material effect on the company’s
financial performance or financial condition, results of operations, liquidity or capital expenditures.
Management’s Discussion and Analysis
34 2021 Third Quarter Suncor Energy Inc.

7. Quarterly Financial Data
Trends in Suncor’s quarterly revenue, earnings and funds from operations are driven primarily by production volumes, which
can be significantly impacted by major maintenance events, changes in commodity prices and crude differentials, refining crack
spreads, foreign exchange rates and other significant events impacting operations, such as the COVID-19 pandemic beginning
in the first quarter of 2020, operational incidents and the Government of Alberta’s mandatory production curtailments that were
implemented during 2019 and suspended effective December 2020.
Financial Summary
Three months ended($ millions, unless otherwise noted)
Sep 302021
Jun 302021
Mar 312021
Dec 312020
Sep 302020
Jun 302020
Mar 312020
Dec 312019
Total production (mboe/d)
Oil Sands 605.1 615.7 690.6 671.5 519.0 553.7 630.1 662.3
Exploration and Production 93.5 84.0 95.3 97.7 97.2 101.8 109.7 115.9
698.6 699.7 785.9 769.2 616.2 655.5 739.8 778.2
Revenues and other income
Operating revenues, net of royalties 10 145 9 159 8 679 6 615 6 427 4 229 7 391 9 487
Other income (loss) 68 (66) (43) (21) 30 16 365 111
10 213 9 093 8 636 6 594 6 457 4 245 7 756 9 598
Net earnings (loss) 877 868 821 (168) (12) (614) (3 525) (2 335)
per common share – basic (dollars) 0.59 0.58 0.54 (0.11) (0.01) (0.40) (2.31) (1.52)
per common share – diluted (dollars) 0.59 0.58 0.54 (0.11) (0.01) (0.40) (2.31) (1.52)
Operating earnings (loss)(1)(2) 1 043 722 746 (109) (338) (1 345) (421) 812
per common share – basic(1)(2) (dollars) 0.71 0.48 0.49 (0.07) (0.22) (0.88) (0.28) 0.53
Funds from operations(1) 2 641 2 362 2 110 1 221 1 166 488 1 001 2 553
per common share – basic(1) (dollars) 1.79 1.57 1.39 0.80 0.76 0.32 0.66 1.66
Cash flow provided by (used in) operating activities 4 718 2 086 2 345 814 1 245 (768) 1 384 2 304
per common share – basic (dollars) 3.19 1.39 1.54 0.53 0.82 (0.50) 0.91 1.50
ROCE(1) (%) for the twelve months ended 4.5 1.9 (1.4) (6.9) (10.2) (7.5) (1.3) 4.9
ROCE(1)(3), excluding impairments (%) for thetwelve months ended 4.9 2.6 (0.6) (2.9) (1.3) 1.0 7.0 10.0
After-tax unrealized foreign exchange gain (loss) onU.S. dollar denominated debt (257) 156 181 539 290 478 (1 021) 235
Common share information (dollars)
Dividend per common share 0.21 0.21 0.21 0.21 0.21 0.21 0.47 0.42
Share price at the end of trading
Toronto Stock Exchange (Cdn$) 26.26 29.69 26.27 21.35 16.26 22.89 22.46 42.56
New York Stock Exchange (US$) 20.74 23.97 20.90 16.78 12.23 16.86 15.80 32.80
(1) Non-GAAP financial measures. See the Non-GAAP Financial Measures Advisory section of this MD&A.
(2) Beginning in the first quarter of 2021, the company revised its calculation of operating earnings, a non-GAAP financial measure, to exclude unrealized
(gains) losses on derivative financial instruments that are recorded at fair value to better align the earnings impact of the activity with the underlying
items being risk-managed. Prior period comparatives have been restated to reflect this change.
(3) ROCE excluding impairments would have been 8.2% and 5.1% for the fourth quarter of 2019 and first quarter of 2020, respectively, excluding the
impacts of the $1.116 billion deferred tax recovery for the Alberta corporate income tax rate change in the second quarter of 2019.
2021 Third Quarter Suncor Energy Inc. 35
Business Environment
(average for the three months ended)Sep 30
2021Jun 30
2021Mar 31
2021Dec 31
2020Sep 30
2020Jun 30
2020Mar 31
2020Dec 31
2019
WTI crude oil at Cushing US$/bbl 70.55 66.05 57.80 42.65 40.95 27.85 46.10 56.95
Dated Brent crude US$/bbl 73.45 68.85 60.85 44.20 43.00 29.20 50.15 63.30
Dated Brent/Maya FOB price differential US$/bbl 7.80 6.20 4.70 3.30 3.50 2.70 15.95 9.30
MSW at Edmonton Cdn$/bbl 83.75 77.25 66.55 50.25 51.30 30.20 52.00 68.10
WCS at Hardisty US$/bbl 56.95 54.60 45.40 33.35 31.90 16.35 25.60 41.10
Light/heavy crude oil differential forWTI at Cushing less WCS at Hardisty US$/bbl (13.60) (11.45) (12.40) (9.30) (9.05) (11.50) (20.50) (15.85)
SYN-WTI (differential) premium US$/bbl (1.60) 0.35 (3.50) (3.05) (2.45) (4.55) (2.70) (0.70)
Condensate at Edmonton US$/bbl 69.20 66.40 58.00 42.55 37.55 22.20 46.20 53.00
Natural gas (Alberta spot) at AECO Cdn$/mcf 3.60 3.10 3.15 2.65 2.25 2.00 2.05 2.50
Alberta Power Pool Price Cdn$/MWh 100.35 104.50 95.45 46.15 43.85 29.90 67.05 46.95
New York Harbor 2-1-1 crack(1) US$/bbl 20.90 20.35 15.60 9.85 10.20 12.20 14.75 18.45
Chicago 2-1-1 crack(1) US$/bbl 20.45 20.25 13.40 7.95 7.75 6.75 9.75 14.35
Portland 2-1-1 crack(1) US$/bbl 26.70 24.55 15.80 13.15 12.55 12.20 18.30 25.45
Gulf Coast 2-1-1 crack(1) US$/bbl 19.55 18.25 14.45 9.00 8.55 9.00 13.00 17.00
Exchange rate US$/Cdn$ 0.79 0.81 0.79 0.77 0.75 0.72 0.74 0.76
Exchange rate (end of period) US$/Cdn$ 0.78 0.81 0.80 0.78 0.75 0.73 0.71 0.77
(1) 2-1-1 crack spreads are indicators of the refining margin generated by converting two barrels of WTI into one barrel of gasoline and one barrel of
diesel. The crack spreads presented here generally approximate the regions into which the company sells refined products through retail and
wholesale channels.
Management’s Discussion and Analysis
36 2021 Third Quarter Suncor Energy Inc.

8. Other Items
Accounting Policies and New IFRS Standards
Suncor’s significant accounting policies and a summary of recently announced accounting standards are described in the
Accounting Policies and Critical Accounting Estimates section of Suncor’s 2020 annual MD&A and in notes 3 and 5 of Suncor’s
audited Consolidated Financial Statements for the year ended December 31, 2020.
Critical Accounting Estimates
The preparation of financial statements in accordance with GAAP requires management to make estimates, judgments and
assumptions that affect reported assets, liabilities, revenues and expenses, gains and losses, and disclosures of contingencies.
These estimates and assumptions are subject to change based on experience and new information. Critical accounting estimates
are those that require management to make assumptions about matters that are highly uncertain at the time the estimate is
made. Critical accounting estimates are also those estimates which, where a different estimate could have been used or where
changes in the estimate that are reasonably likely to occur, would have a material impact on the company’s financial condition,
changes in financial condition or financial performance. Critical accounting estimates and judgments are reviewed annually by
the Audit Committee of the Board of Directors. A detailed description of Suncor’s critical accounting estimates is provided in note 4
to the audited Consolidated Financial Statements for the year ended December 31, 2020, and in the Accounting Policies and
Critical Accounting Estimates section of Suncor’s 2020 annual MD&A.
On January 30, 2020, the World Health Organization declared the COVID-19 outbreak a Public Health Emergency of International
Concern and, on March 10, 2020, declared it to be a pandemic. Actions taken around the world to help mitigate the spread of
COVID-19 include restrictions on travel, quarantines in certain areas, and forced closures for certain types of public places and
businesses. These measures have and will continue to have significant disruption to business operations and a significant increase
in economic uncertainty, with reduced demand for commodities leading to volatile prices and currency exchange rates, and a
decline in long-term interest rates. Our operations and business are particularly sensitive to a reduction in the demand for, and
prices of, commodities that are closely linked to Suncor’s financial performance, including crude oil, refined petroleum products
(such as jet fuel and gasoline), natural gas and electricity. The potential direct and indirect impacts of the economic downturn
have been considered in management’s estimates, and assumptions at period end have been reflected in our results with any
significant changes described in the relevant notes to the company’s unaudited interim Consolidated Financial Statements for the
three and nine months ended September 30, 2021.
The COVID-19 pandemic is an evolving situation that will continue to have widespread implications for our business environment,
operations and financial condition. Management cannot reasonably estimate the length or severity of this pandemic, or the
extent to which the disruption may materially impact our consolidated statements of comprehensive income (loss), consolidated
balance sheets and consolidated statements of cash flows in fiscal 2021.
Financial Instruments
Suncor periodically enters into derivative contracts such as forwards, futures, swaps, options and costless collars to manage
exposure to fluctuations in commodity prices and foreign exchange rates, and to optimize the company’s position with respect
to interest payments. The company also uses physical and financial energy derivatives to earn trading profits. For more information
on Suncor’s financial instruments and the related financial risk factors, see note 27 of the audited Consolidated Financial
Statements for the year ended December 31, 2020, note 10 to the unaudited interim Consolidated Financial Statements for the
three months and nine months ended September 30, 2021, and the Financial Condition and Liquidity section of the 2020 annual
MD&A.
Control Environment
Based on their evaluation as at September 30, 2021, Suncor’s Chief Executive Officer and Chief Financial Officer concluded that
the company’s disclosure controls and procedures (as defined in Rules 13a-15(e) and 15d-15(e) under the United States Securities
Exchange Act of 1934, as amended (the Exchange Act)), are effective to ensure that information required to be disclosed by the
company in reports that are filed or submitted to Canadian and U.S. securities authorities is recorded, processed, summarized and
reported within the time periods specified in Canadian and U.S. securities laws. In addition, as at September 30, 2021, there
were no changes in the internal control over financial reporting (as defined in Exchange Act Rules 13a-15(f) and 15d-15(f)) that
occurred during the three-month period ended September 30, 2021, that have materially affected, or are reasonably likely to
materially affect, the company’s internal control over financial reporting. Management will continue to periodically evaluate the
company’s disclosure controls and procedures and internal control over financial reporting and will make any modifications
from time to time as deemed necessary.
Based on their inherent limitations, disclosure controls and procedures and internal control over financial reporting may not
prevent or detect misstatements, and even those controls determined to be effective can provide only reasonable assurance with
respect to financial statement preparation and presentation.
2021 Third Quarter Suncor Energy Inc. 37

Corporate Guidance
Suncor has further updated its previously announced 2021 guidance (which was originally disclosed via press release on
November 30, 2020), as set forth in Suncor’s press release dated October 27, 2021, a copy of which is available on www.sedar.com.
Management’s Discussion and Analysis
38 2021 Third Quarter Suncor Energy Inc.

9. Non-GAAP Financial Measures Advisory
Certain financial measures in this MD&A – namely operating earnings (loss), ROCE, funds from (used in) operations, free funds
flow, discretionary free funds flow (deficit), Oil Sands operations cash operating costs, Fort Hills cash operating costs, Syncrude
cash operating costs, refining and marketing gross margin, refining operating expense, LIFO inventory valuation methodology
and related per share or per barrel amounts – are not prescribed by GAAP. These non-GAAP financial measures are included
because management uses the information to analyze business performance, leverage and liquidity, as applicable, and it may
be useful to investors on the same basis. These non-GAAP financial measures do not have any standardized meaning and,
therefore, are unlikely to be comparable to similar measures presented by other companies. Therefore, these non-GAAP financial
measures should not be considered in isolation or as a substitute for measures of performance prepared in accordance with
GAAP. Except as otherwise indicated, these non-GAAP financial measures are calculated and disclosed on a consistent basis from
period to period. Specific adjusting items may only be relevant in certain periods.
Operating Earnings (Loss)
Operating earnings (loss) is a non-GAAP financial measure that adjusts net earnings (loss) for significant items that are not
indicative of operating performance. Management uses operating earnings (loss) to evaluate operating performance because
management believes it provides better comparability between periods. Operating earnings (loss) is reconciled to net earnings
(loss) in the Consolidated Financial Information and Segment Results and Analysis sections of this MD&A.
Beginning in the first quarter of 2021, the company revised its calculation of operating earnings to exclude unrealized (gains)
losses on derivative financial instruments that are recorded at fair value to better align the earnings impact of the activity with
the underlying items being risk-managed. Prior period comparatives have been restated to reflect this change.
Bridge Analyses of Operating Earnings (Loss)
Throughout this MD&A, the company presents charts that illustrate the change in operating earnings (loss) from the comparative
period through key variance factors. These factors are analyzed in the Operating Earnings (Loss) narratives following the
bridge analyses in particular sections of this MD&A. These bridge analyses are presented because management uses this
presentation to evaluate performance.
• The factor for Sales Volumes and Mix is calculated based on sales volumes and mix for the Oil Sands and E&P segments and
throughput volumes for the R&M segment.
• The factor for Price, Margin and Other Revenue includes upstream price realizations before royalties, with the exception of
Libya, which is net of royalties, and realized short-term commodity risk management activities. Also included are refining and
marketing gross margins, other operating revenue, and the net impacts of sales and purchases of third-party crude,
including product purchased for use as diluent in the company’s Oil Sands operations and subsequently sold as part of
diluted bitumen.
• The factor for Royalties excludes the impact of Libya, as royalties in Libya are taken into account in Price, Margin and Other
Revenue as described above.
• The factor for Inventory Valuation includes the after-tax impact of the FIFO method of inventory valuation in the company’s
R&M segment, as well as the impact of the deferral or realization of profit or loss on crude oil sales from the Oil Sands
segment to Suncor’s refineries, as both represent inventory valuation adjustments, and downstream realized short-term
commodity risk management activities.
• The factor for Operating and Transportation Expense includes project startup costs, operating, selling and general expense,
and transportation expense.
• The factor for Financing Expense and Other includes financing expenses, other income, operational foreign exchange gains
and losses, changes in gains and losses on disposal of assets that are not operating earnings (loss) adjustments, changes
in statutory income tax rates and other income tax adjustments.
2021 Third Quarter Suncor Energy Inc. 39

Return on Capital Employed (ROCE)
ROCE is a non-GAAP financial measure that management uses to analyze operating performance and the efficiency of Suncor’s
capital allocation process. Average capital employed is calculated as a twelve-month average of the capital employed balance at
the beginning of the twelve-month period and the month-end capital employed balances throughout the remainder of the twelve-
month period. Figures for capital employed at the beginning and end of the twelve-month period are presented to show the
changes in the components of the calculation over the twelve-month period.
For the twelve months ended September 30($ millions, except as noted) 2021 2020
Adjustments to net earnings (loss)
Net earnings (loss) 2 398 (6 486)
(Deduct) add after-tax amounts for:
Unrealized foreign exchange (gain) loss on U.S. dollar denominated debt (619) 18
Net interest expense 672 665
A 2 451 (5 803)
Capital employed – beginning of twelve-month period
Net debt 19 710 15 601
Shareholders’ equity 36 344 45 184
56 054 60 785
Capital employed – end of twelve-month period
Net debt 16 671 19 710
Shareholders’ equity 36 300 36 344
52 971 56 054
Average capital employed B 54 928 57 022
ROCE (%)(1) A/B 4.5 (10.2)
(1) ROCE would have been 4.9% for the twelve months ended September 30, 2021, excluding the impact of impairments of $423 million after-tax in
the fourth quarter of 2020 and the impact of the impairment reversal of $168 million after-tax in the third quarter of 2021. ROCE would have been
(1.3%) for the twelve months ended September 30, 2020, excluding the impact of impairments of $1.798 billion after-tax in the first quarter of
2020 and the impacts of impairments of $3.352 billion after-tax in the fourth quarter of 2019.
Management’s Discussion and Analysis
40 2021 Third Quarter Suncor Energy Inc.

Funds From (Used In) Operations
Funds from (used in) operations is a non-GAAP financial measure that adjusts a GAAP measure – cash flow provided by operating
activities – for changes in non-cash working capital, which management uses to analyze operating performance and liquidity.
Changes to non-cash working capital can be impacted by, among other factors, the timing of offshore feedstock purchases and
payments for commodity and income taxes, the timing of cash flows related to accounts receivable and accounts payable,
and changes in inventory, which management believes reduces comparability between periods.
Funds from (used in) operations for each quarter are separately defined and reconciled to the cash flow provided by the operating
activities measure in the Non-GAAP Financial Measures Advisory section of each respective management’s discussion and
analysis or quarterly report to shareholders, as applicable, for the related quarter.
Three months ended September 30 Oil SandsExploration and
ProductionRefining and
MarketingCorporate andEliminations Total
($ millions) 2021 2020 2021 2020 2021 2020 2021 2020 2021 2020
Net earnings (loss) 484 (531) 407 25 646 384 (660) 110 877 (12)
Adjustments for:
Depreciation, depletion, amortizationand impairment 1 098 1 242 (98) 261 193 214 25 21 1 218 1 738
Deferred income taxes (9) (141) 19 (9) 36 12 5 (46) 51 (184)
Accretion 60 57 14 12 2 2 — — 76 71
Unrealized foreign exchange loss (gain)on U.S. dollar denominated debt — — — — — — 282 (307) 282 (307)
Change in fair value of financialinstruments and trading inventory (30) (53) 15 (28) 68 (8) (1) — 52 (89)
(Gain) loss on disposal of assets — (2) — — (10) (2) 1 1 (9) (3)
Loss on extinguishment of long-termdebt — — — — — — 80 — 80 —
Share-based compensation 2 (9) — (2) 1 (6) (2) (27) 1 (44)
Exploration — — — — — — — — — —
Settlement of decommissioning andrestoration liabilities (67) (38) (1) (1) (7) — 1 — (74) (39)
Other 53 31 1 2 18 (2) 15 4 87 35
Funds from (used in) operations 1 591 556 357 260 947 594 (254) (244) 2 641 1 166
Change in non-cash working capital 2 077 79
Cash flow provided by operatingactivities 4 718 1 245
2021 Third Quarter Suncor Energy Inc. 41

Nine months ended September 30 Oil SandsExploration and
ProductionRefining and
MarketingCorporate andEliminations Total
($ millions) 2021 2020 2021 2020 2021 2020 2021 2020 2021 2020
Net earnings (loss) 1 251 (3 503) 820 (453) 1 728 598 (1 233) (793) 2 566 (4 151)
Adjustments for:
Depreciation, depletion,amortization and impairment 3 348 5 372 195 1 312 610 660 67 62 4 220 7 406
Deferred income taxes (40) (643) 35 (161) 68 29 (11) (20) 52 (795)
Accretion 179 169 43 35 5 5 — — 227 209
Unrealized foreign exchange(gain) loss on U.S. dollardenominated debt — — — — — — (88) 290 (88) 290
Change in fair value of financialinstruments and tradinginventory (74) 32 (39) (22) 50 53 — — (63) 63
Gain on disposal of assets — (2) — — (18) (6) (7) — (25) (8)
Loss on extinguishment oflong-term debt — — — — — — 80 — 80 —
Share-based compensation 25 (84) 1 (12) 13 (51) 41 (186) 80 (333)
Exploration — — — 80 — — — — — 80
Settlement of decommissioningand restoration liabilities (174) (171) (2) (7) (11) (5) — — (187) (183)
Other 156 87 — (30) 45 10 50 10 251 77
Funds from (used in) operations 4 671 1 257 1 053 742 2 490 1 293 (1 101) (637) 7 113 2 655
Change in non-cash workingcapital 2 036 (794)
Cash flow provided by operatingactivities 9 149 1 861
Free Funds Flow and Discretionary Free Funds Flow (Deficit)
Free funds flow is a non-GAAP financial measure that is calculated by taking funds from operations and subtracting capital
expenditures, including capitalized interest. Discretionary free funds flow (deficit) is a non-GAAP financial measure that is
calculated by taking funds from operations and subtracting asset sustainment and maintenance capital, inclusive of associated
capitalized interest, and dividends. Both free funds flow and discretionary free funds flow (deficit) reflect cash available for
increasing distributions to shareholders and to fund growth investments. Management uses free funds flow and discretionary
free funds flow (deficit) to measure the capacity of the company to increase returns to shareholders and to grow Suncor’s business.
Three months endedSep 30
Nine months endedSep 30
($ millions) 2021 2020 2021 2020
Funds from operations 2 641 1 166 7 113 2 655
Asset sustaining and maintenance capital and dividends(1) (1 145) (987) (3 299) (3 193)
Discretionary free funds flow (deficit) 1 496 179 3 814 (538)
(1) Includes capitalized interest on sustaining capital of $15 million in the third quarter of 2021 and $13 million in the third quarter of 2020.
Management’s Discussion and Analysis
42 2021 Third Quarter Suncor Energy Inc.

Oil Sands Operations, Fort Hills and Syncrude Cash Operating Costs
Cash operating costs are calculated by adjusting Oil Sands segment OS&G expense for i) non-production costs that management
believes do not relate to production performance, including, but not limited to, share-based compensation adjustments, CEWS
and COVID-19-related costs, research costs and the expense recorded as part of a non-monetary arrangement involving a
third-party processor; ii) revenues associated with excess capacity, including excess power generated and sold that is recorded
in operating revenue; iii) project startup costs; and iv) the impacts of changes in inventory levels and valuation, such that the
company is able to present cost information based on production volumes. Oil Sands operations and Syncrude production
volumes are gross of internally consumed diesel and feedstock transfers between assets through the interconnecting pipelines.
Oil Sands operations, Fort Hills and Syncrude cash operating costs are reconciled in the Segment Results and Analysis – Oil
Sands section of this MD&A. Management uses cash operating costs to measure operating performance.
Refining and Marketing Gross Margin and Refining Operating Expense
Refining and marketing gross margins and refining operating expense are non-GAAP financial measures. Refining and marketing
gross margin, on a FIFO basis, is calculated by adjusting R&M segment operating revenue, other income and purchases of
crude oil and products (all of which are GAAP measures) for intersegment marketing fees and the impact of inventory write-
downs. Refining and marketing gross margin, on a LIFO basis, is further adjusted for the impacts of FIFO inventory valuation and
short-term risk management activities. Refinery operating expense is calculated by adjusting R&M segment OS&G for i) non-
refining costs pertaining to the company’s supply, marketing and ethanol businesses; and ii) non-refining costs that management
believes do not relate to the production of refined products, including, but not limited to, CEWS, share-based compensation
and enterprise shared service allocations. Management uses refining and marketing gross margin and refining operating
expense to measure operating performance on a production barrel basis.
Three months endedSeptember 30
Nine months endedSeptember 30
($ millions, except as noted) 2021 2020 2021 2020
Refining and marketing margin reconciliation
Operating revenues 6 341 4 050 16 292 11 396
Purchases of crude oil and products (4 710) (2 840) (11 697) (8 499)
Total gross margin 1 631 1 210 4 595 2 897
Other (loss) income (9) (2) (48) 58
Non-refining and marketing margin (13) (14) (40) (43)
Refining and marketing gross margin 1 609 1 194 4 507 2 912
Refinery production(1) (mbbls) 45 008 38 857 118 272 115 955
Refining and marketing gross margin – FIFO ($/bbl) 35.75 30.75 38.10 25.10
FIFO adjustment (91) (223) (811) 562
Refining and marketing gross margin – LIFO 1 518 971 3 696 3 474
Refining and marketing gross margin – LIFO ($/bbl) 33.80 25.00 31.25 29.95
Refining operating expense reconciliation
Operating, selling and general expense(2) 502 417 1 453 1 287
Non-refining costs(2) (256) (207) (757) (637)
Refining operating expense 246 210 696 650
Refinery production(1) (mbbls) 45 026 38 857 118 287 115 955
Refining operating expense ($/bbl) 5.45 5.40 5.90 5.60
(1) Refinery production is the output of the refining process, and differs from crude oil processed as a result of volumetric adjustments for non-crude
feedstock, volumetric gain associated with the refining process and changes in unfinished product inventories.
(2) Prior period amounts of OS&G have been reclassified to align with the current year presentation of transportation and distribution expense. This
reclassification had no effect on the refining operating expense.
2021 Third Quarter Suncor Energy Inc. 43

Impact of First-in, First-out (FIFO) Inventory Valuation on Refining and Marketing NetEarnings (Loss)
GAAP requires the use of a FIFO inventory valuation methodology. For Suncor, this results in a disconnect between the sales
prices for refined products, which reflect current market conditions, and the amount recorded as the cost of sale for the related
refinery feedstock, which reflects market conditions at the time the feedstock was purchased. This lag between purchase and
sale can be anywhere from several weeks to several months, and is influenced by the time to receive crude after purchase (which
can be several weeks for foreign offshore crude purchases), regional crude inventory levels, the completion of refining processes,
transportation time to distribution channels and regional refined product inventory levels.
Suncor prepares and presents an estimate of the impact of using a FIFO inventory valuation methodology compared to a LIFO
methodology, because management uses the information to analyze operating performance and compare itself against refining
peers that are permitted to use LIFO inventory valuation under United States GAAP (U.S. GAAP).
The company’s estimate is not derived from a standardized calculation and, therefore, may not be directly comparable to similar
measures presented by other companies, and should not be considered in isolation or as a substitute for measures of
performance prepared in accordance with GAAP or U.S. GAAP.
10. Common Abbreviations
The following is a list of abbreviations that may be used in this MD&A:
Measurement Places and Currencies
bbl barrel U.S. United States
bbls/d barrels per day U.K. United Kingdom
mbbls/d thousands of barrels per day
$ or Cdn$ Canadian dollars
boe barrels of oil equivalent US$ United States dollars
boe/d barrels of oil equivalent per day
mboe thousands of barrels of oil equivalent
mboe/d thousands of barrels of oil equivalent per day Financial and Business Environment
Q3 Three months ended September 30
GJ Gigajoule DD&A Depreciation, depletion and amortization
WTI West Texas Intermediate
mcf thousands of cubic feet of natural gas WCS Western Canadian Select
mcfe thousands of cubic feet of natural gas equivalent SCO Synthetic crude oil
mmcf millions of cubic feet of natural gas SYN Synthetic crude oil benchmark
mmcf/d millions of cubic feet of natural gas per day MSW Mixed Sweet Blend
mmcfe millions of cubic feet of natural gas equivalent NYMEX New York Mercantile Exchange
mmcfe/d millions of cubic feet of natural gas equivalent YTD Year to date
per day
MW megawatts
MWh megawatts per hour
Management’s Discussion and Analysis
44 2021 Third Quarter Suncor Energy Inc.

11. Forward-Looking Information
This MD&A contains certain forward-looking information and forward-looking statements (collectively referred to herein as “forward-
looking statements”) within the meaning of applicable Canadian and U.S. securities laws. Forward-looking statements and other
information are based on Suncor’s current expectations, estimates, projections and assumptions that were made by the company in
light of information available at the time the statement was made and consider Suncor’s experience and its perception of historical trends,
including expectations and assumptions concerning: the accuracy of reserves estimates; the current and potential adverse impacts of
the COVID-19 pandemic, including the status of the pandemic and future waves and any associated policies around current business
restrictions, shelter-in-place orders or gatherings of individuals; commodity prices and interest and foreign exchange rates; the
performance of assets and equipment; capital efficiencies and cost savings; applicable laws and government policies; future production
rates; the sufficiency of budgeted capital expenditures in carrying out planned activities; the availability and cost of labour, services
and infrastructure; the satisfaction by third parties of their obligations to Suncor; the development and execution of projects; and the
receipt, in a timely manner, of regulatory and third-party approvals. All statements and information that address expectations or
projections about the future, and other statements and information about Suncor’s strategy for growth, expected and future expenditures
or investment decisions, commodity prices, costs, schedules, production volumes, operating and financial results, future financing and
capital activities, and the expected impact of future commitments are forward-looking statements. Some of the forward-looking statements
may be identified by words like “expects”, “anticipates”, “will”, “estimates”, “plans”, “scheduled”, “intends”, “believes”, “projects”,
“indicates”, “could”, “focus”, “vision”, “goal”, “outlook”, “proposed”, “target”, “objective”, “continue”, “should”, “may”, “future”, “potential”,
“opportunity”, “would”, “priority”, “strategy” and similar expressions. Forward-looking statements in this MD&A include references to:
• Suncor’s capital allocation strategy and target, including that: it remains on track to return to 2019 net debt levels during the
fourth quarter and be within its 2025 targeted net debt range by the end of the year, statements surrounding Suncor’s $2.15 billion
incremental free funds flow target and the strategic initiatives that are expected to contribute to it, Suncor’s belief that it is on
track to exceed its previously communicated debt reduction and share repurchase targets for the year, Suncor’s estimated fourth
quarter operating, selling and general expenses and the expectation that the proceeds of Suncor’s sale of its 26.69% working interest
in the Golden Eagle Area Development will be used to support Suncor’s capital allocation strategy;
• Suncor’s expectation regarding Fort Hills’ ramp up strategy, including its belief that it will transition to a two-train operation and
operate at full production rates by the end of the year;
• Suncor’s expectations with respect to the Terra Nova project, including with respect to the ALE project that is expected to extend
production life by approximately 10 years and provide an additional 70 million barrels of production, the expected use of proceeds
with respect to the acquisition of the increased project ownership interest, and the timing of maintenance work on the Floating,
Production, Storage and Offloading facility;
• the expectation that, now that operatorship of Syncrude has transferred, that there will be gross synergies of approximately
$100 million for the joint venture owners within the first six months with an additional $200 million through 2022 – 2023 and that
the assumption of operatorship will be a critical step towards improving operational performance, driving greater integration,
efficiencies and competitiveness and capturing increased value across all Suncor-operated assets in the region;
• expectations regarding Suncor’s acquisition, together with eight Indigenous communities, of a 15% equity interest in the Northern
Courier Pipeline, including that the transaction will close in the fourth quarter of 2021, that Suncor will operate the pipeline following
closing and that the acquisition will provide the eight Indigenous communities with reliable income for decades to come;
• Suncor’s belief that its indicative 5-2-2-1 index will continue to be an appropriate measure against Suncor’s actual results;
• statements regarding Suncor’s planned 2021 capital spending program of $3.8 billion to $4.5 billion, including Suncor’s belief that
it will have the capital resources to fund the capital spending program and to meet current and future working capital requirements
through cash and cash equivalents balances, cash flow provided by operating activities, available committed credit facilities, issuing
commercial paper and, if needed, accessing capital markets and Suncor’s expectations regarding the allocation of its capital
spending program and its expected benefits therefrom;
• the objectives of Suncor’s short-term investment portfolio and Suncor’s expectation that the maximum weighted average term to
maturity of the short-term investment portfolio will not exceed six months, and that all investments will be with counterparties with
investment grade debt ratings;
• the company’s priority regarding the management of debt levels and liquidity given the company’s long-term plans and future
expected volatility in the pricing environment and Suncor’s belief that a phased and flexible approach to existing and future projects
should assist Suncor in its ability to manage project costs and debt levels;
• the company’s belief that it does not have any guarantees or off-balance sheet arrangements that have, or are reasonably likely to
have, a current or future material effect on the company’s financial performance or financial condition, results of operations, liquidity
or capital expenditures;
2021 Third Quarter Suncor Energy Inc. 45

• statements about the NCIB, including the amount, timing and manner of purchases under the NCIB, that depending on the trading
price of its common shares and other relevant factors, repurchasing its common shares represents an attractive investment
opportunity and is in the best interest of the company and its shareholders, and the expectation that the decision to allocate cash
to repurchase shares will not affect its long-term growth strategy; and
• Suncor’s full-year outlook range on Oil Sands operations crown royalties, Syncrude crown royalties, East Coast Canada crown
royalties and current income tax expenses as well as business environment outlook assumptions for Brent Sullom Voe, WTI at Cushing,
WCS at Hardisty and New York Harbor 2-1-1 crack.
Forward-looking statements are not guarantees of future performance and involve a number of risks and uncertainties, some that are
similar to other oil and gas companies and some that are unique to Suncor. Suncor’s actual results may differ materially from those
expressed or implied by its forward-looking statements, so readers are cautioned not to place undue reliance on them. The financial
and operating performance of the company’s reportable operating segments, specifically Oil Sands, E&P and R&M, may be affected by
a number of factors.
Factors that affect Suncor’s Oil Sands segment include, but are not limited to, volatility in the prices for crude oil and other production,
and the related impacts of fluctuating light/heavy and sweet/sour crude oil differentials; changes in the demand for refinery feedstock and
diesel fuel, including the possibility that refiners that process the company’s proprietary production will be closed, experience equipment
failure or other accidents; Suncor’s ability to operate its Oil Sands facilities reliably in order to meet production targets; the output of
newly commissioned facilities, the performance of which may be difficult to predict during initial operations; Suncor’s dependence on
pipeline capacity and other logistical constraints, which may affect the company’s ability to distribute products to market and which may
cause the company to delay or cancel planned growth projects in the event of insufficient takeaway capacity; Suncor’s ability to
finance Oil Sands economic investment and asset sustainment and maintenance capital expenditures; the availability of bitumen
feedstock for upgrading operations, which can be negatively affected by poor ore grade quality, unplanned mine equipment and
extraction plant maintenance, tailings storage, and in situ reservoir and equipment performance, or the unavailability of third-party
bitumen; changes in operating costs, including the cost of labour, natural gas and other energy sources used in oil sands processes; and
the company’s ability to complete projects, including planned maintenance events, both on time and on budget, which could be
impacted by competition from other projects (including other oil sands projects) for goods and services and demands on infrastructure
in Alberta’s Wood Buffalo region and the surrounding area (including housing, roads and schools).
Factors that affect Suncor’s E&P segment include, but are not limited to, volatility in crude oil and natural gas prices; operational risks
and uncertainties associated with oil and gas activities, including unexpected formations or pressures, premature declines of reservoirs,
fires, blow-outs, equipment failures and other accidents, uncontrollable flows of crude oil, natural gas or well fluids, and pollution and
other environmental risks; adverse weather conditions, which could disrupt output from producing assets or impact drilling programs,
resulting in increased costs and/or delays in bringing on new production; political, economic and socioeconomic risks associated with
Suncor’s foreign operations, including the unpredictability of operating in Libya due to ongoing political unrest; and market demand for
mineral rights and producing properties, potentially leading to losses on disposition or increased property acquisition costs.
Factors that affect our R&M segment include, but are not limited to, fluctuations in demand and supply for refined products that
impact the company’s margins; market competition, including potential new market entrants; the company’s ability to reliably operate
refining and marketing facilities in order to meet production or sales targets; and risks and uncertainties affecting construction or planned
maintenance schedules, including the availability of labour and other impacts of competing projects drawing on the same resources
during the same time period.
Additional risks, uncertainties and other factors that could influence the financial and operating performance of all of Suncor’s operating
segments and activities include, but are not limited to, changes in general economic, market and business conditions, such as commodity
prices, interest rates and currency exchange rates (including as a result of demand and supply effects resulting from the COVID-19
pandemic and the actions of OPEC+); fluctuations in supply and demand for Suncor’s products; the successful and timely implementation
of capital projects, including growth projects and regulatory projects; risks associated with the development and execution of Suncor’s
major projects and the commissioning and integration of new facilities; the possibility that completed maintenance activities may not
improve operational performance or the output of related facilities; the risk that projects and initiatives intended to achieve cash flow
growth and/or reductions in operating costs may not achieve the expected results in the time anticipated or at all; competitive actions of
other companies, including increased competition from other oil and gas companies or from companies that provide alternative
sources of energy; labour and material shortages; actions by government authorities, including the imposition or reassessment of, or
changes to, taxes, fees, royalties, duties and other government-imposed compliance costs; changes to laws and government policies that
could impact the company’s business, including environmental (including climate change), royalty and tax laws and policies; the
ability and willingness of parties with whom Suncor has material relationships to perform their obligations to the company; the
unavailability of, or outages to, third-party infrastructure that could cause disruptions to production or prevent the company from being
able to transport its products; the occurrence of a protracted operational outage, a major safety or environmental incident, or
unexpected events such as fires (including forest fires), equipment failures and other similar events affecting Suncor or other parties
whose operations or assets directly or indirectly affect Suncor; the potential for security breaches of Suncor’s information technology and
Management’s Discussion and Analysis
46 2021 Third Quarter Suncor Energy Inc.

infrastructure by malicious persons or entities, and the unavailability or failure of such systems to perform as anticipated as a result of
such breaches; security threats and terrorist or activist activities; the risk that competing business objectives may exceed Suncor’s capacity
to adopt and implement change; risks and uncertainties associated with obtaining regulatory, third-party and stakeholder approvals
outside of Suncor’s control for the company’s operations, projects, initiatives and exploration and development activities and the
satisfaction of any conditions to approvals; the potential for disruptions to operations and construction projects as a result of Suncor’s
relationships with labour unions that represent employees at the company’s facilities; the company’s ability to find new oil and gas
reserves that can be developed economically; the accuracy of Suncor’s reserves, resources and future production estimates; market
instability affecting Suncor’s ability to borrow in the capital debt markets at acceptable rates or to issue other securities at acceptable
prices; maintaining an optimal debt to cash flow ratio; the success of the company’s marketing and logistics activities using derivatives
and other financial instruments; the cost of compliance with current and future environmental laws, including climate change laws; risks
relating to increased activism and public opposition to fossil fuels and oil sands; risks and uncertainties associated with closing a
transaction for the purchase or sale of a business, asset or oil and gas property, including estimates of the final consideration to be
paid or received; the ability of counterparties to comply with their obligations in a timely manner; risks associated with joint arrangements
in which the company has an interest; risks associated with land claims and Aboriginal consultation requirements; the risk that the
company may be subject to litigation; the impact of technology and risks associated with developing and implementing new technologies;
and the accuracy of cost estimates, some of which are provided at the conceptual or other preliminary stage of projects and prior to
commencement or conception of the detailed engineering that is needed to reduce the margin of error and increase the level of accuracy.
The foregoing important factors are not exhaustive.
Many of these risk factors and other assumptions related to Suncor’s forward-looking statements are discussed in further detail
throughout this MD&A, and in the company’s 2020 annual MD&A, the 2020 AIF and Form 40-F on file with Canadian securities
commissions at www.sedar.com and the United States Securities and Exchange Commission at www.sec.gov. Readers are also referred
to the risk factors and assumptions described in other MD&As that Suncor files from time to time with securities regulatory authorities.
Copies of these MD&As are available without charge from the company.
The forward-looking statements contained in this MD&A are made as of the date of this MD&A. Except as required by applicable
securities laws, we assume no obligation to update publicly or otherwise revise any forward-looking statements or the foregoing risks
and assumptions affecting such forward-looking statements, whether as a result of new information, future events or otherwise.
2021 Third Quarter Suncor Energy Inc. 47

Consolidated Statements of Comprehensive Income (Loss)(unaudited)
Three months endedSeptember 30
Nine months endedSeptember 30
($ millions) 2021 2020 2021 2020
Revenues and Other Income
Operating revenues, net of royalties (note 3) 10 145 6 427 27 983 18 047
Other income (loss) (note 4) 68 30 (41) 411
10 213 6 457 27 942 18 458
Expenses
Purchases of crude oil and products 3 891 2 356 9 721 6 955
Operating, selling and general(1) 2 768 2 235 8 388 7 300
Transportation and distribution(1) 368 321 1 099 1 044
Depreciation, depletion, amortization and impairment(note 11) 1 218 1 738 4 220 7 406
Exploration 11 12 31 176
Gain on disposal of assets (9) (3) (25) (8)
Financing expenses (note 6) 652 35 992 1 241
8 899 6 694 24 426 24 114
Earnings (Loss) before Income Taxes 1 314 (237) 3 516 (5 656)
Income Tax Expense (Recovery)
Current 386 (41) 898 (710)
Deferred 51 (184) 52 (795)
437 (225) 950 (1 505)
Net Earnings (Loss) 877 (12) 2 566 (4 151)
Other Comprehensive Income (Loss)
Items That May be Subsequently Reclassified toEarnings:
Foreign currency translation adjustment 61 (52) (35) 80
Items That Will Not be Reclassified to Earnings:
Actuarial gain (loss) on employee retirement benefitplans, net of income taxes (note 13) 152 204 810 (195)
Other Comprehensive Income (Loss) 213 152 775 (115)
Total Comprehensive Income (Loss) 1 090 140 3 341 (4 266)
Per Common Share (dollars) (note 8)
Net earnings (loss) – basic and diluted 0.59 (0.01) 1.71 (2.72)
Cash dividends 0.21 0.21 0.63 0.89
(1) Prior period amounts have been reclassified to align with the current year presentation of transportation and distribution expense. For the
three months and nine months ended September 30, 2020, $40 million and $98 million, respectively, was reclassified from operating, selling and
general expense to transportation and distribution expense. This reclassification had no effect on net earnings (loss).
See accompanying notes to the condensed interim consolidated financial statements.
48 2021 Third Quarter Suncor Energy Inc.

Consolidated Balance Sheets(unaudited)
($ millions)September 30
2021December 31
2020
Assets
Current assets
Cash and cash equivalents 2 309 1 885
Accounts receivable 4 184 3 157
Inventories 4 079 3 617
Income taxes receivable 129 727
Assets held for sale (note 14) 253 —
Total current assets 10 954 9 386
Property, plant and equipment, net (note 11) 66 031 68 130
Exploration and evaluation 2 225 2 286
Other assets 1 290 1 277
Goodwill and other intangible assets 3 484 3 328
Deferred income taxes 166 209
Total assets 84 150 84 616
Liabilities and Shareholders’ Equity
Current liabilities
Short-term debt (note 6) 1 484 3 566
Current portion of long-term debt (note 6) 611 1 413
Current portion of long-term lease liabilities 314 272
Accounts payable and accrued liabilities 6 864 4 684
Current portion of provisions 742 527
Income taxes payable 930 87
Liabilities associated with assets held for sale (note 14) 181 —
Total current liabilities 11 126 10 549
Long-term debt (note 6) 13 998 13 812
Long-term lease liabilities 2 573 2 636
Other long-term liabilities (note 13) 2 121 2 840
Provisions (note 12) 8 810 10 055
Deferred income taxes 9 222 8 967
Equity 36 300 35 757
Total liabilities and shareholders’ equity 84 150 84 616
See accompanying notes to the condensed interim consolidated financial statements.
2021 Third Quarter Suncor Energy Inc. 49

Consolidated Statements of Cash Flows(unaudited)
Three months endedSeptember 30
Nine months endedSeptember 30
($ millions) 2021 2020 2021 2020
Operating Activities
Net Earnings (Loss) 877 (12) 2 566 (4 151)
Adjustments for:
Depreciation, depletion, amortization and impairment(note 11) 1 218 1 738 4 220 7 406
Deferred income tax expense (recovery) 51 (184) 52 (795)
Accretion (note 6) 76 71 227 209
Unrealized foreign exchange loss (gain) on U.S. dollardenominated debt (note 6) 282 (307) (88) 290
Change in fair value of financial instruments and tradinginventory 52 (89) (63) 63
Gain on disposal of assets (9) (3) (25) (8)
Loss on extinguishment of long-term debt (note 6) 80 — 80 —
Share-based compensation 1 (44) 80 (333)
Exploration — — — 80
Settlement of decommissioning and restoration liabilities (74) (39) (187) (183)
Other 87 35 251 77
Decrease (increase) in non-cash working capital (note 7) 2 077 79 2 036 (794)
Cash flow provided by operating activities 4 718 1 245 9 149 1 861
Investing Activities
Capital and exploration expenditures (1 221) (941) (3 371) (2 959)
Proceeds from disposal of assets 8 5 18 12
Other investments and acquisitions (note 11) 27 (3) 11 (90)
(Increase) decrease in non-cash working capital (note 7) (2) 130 185 (414)
Cash flow used in investing activities (1 188) (809) (3 157) (3 451)
Financing Activities
Net (decrease) increase in short-term debt (note 6) (1 155) (370) (2 061) 354
Net (decrease) increase in long-term debt (note 6) (1 030) — (2 080) 2 634
Issuance of long-term debt (note 6) — — 1 423 —
Lease liability payments (69) (83) (237) (254)
Issuance of common shares under share option plans — — 3 29
Repurchase of common shares (note 9) (704) — (1 665) (307)
Distributions relating to non-controlling interest (2) (3) (7) (8)
Dividends paid on common shares (309) (321) (943) (1 350)
Cash flow (used in) provided by financing activities (3 269) (777) (5 567) 1 098
Increase (Decrease) in Cash and Cash Equivalents 261 (341) 425 (492)
Effect of foreign exchange on cash and cash equivalents 13 (16) (1) 21
Cash and cash equivalents at beginning of period 2 035 1 846 1 885 1 960
Cash and Cash Equivalents at End of Period 2 309 1 489 2 309 1 489
Supplementary Cash Flow Information
Interest paid 143 140 635 648
Income taxes (received) paid (523) 118 (605) 696
See accompanying notes to the condensed interim consolidated financial statements.
50 2021 Third Quarter Suncor Energy Inc.

Consolidated Statements of Changes in Equity(unaudited)
($ millions)Share
CapitalContributed
Surplus
AccumulatedOther
ComprehensiveIncome
RetainedEarnings Total
Number ofCommon
Shares(thousands)
At December 31, 2019 25 167 566 899 15 410 42 042 1 531 874
Net loss — — — (4 151) (4 151) —
Foreign currency translation adjustment — — 80 — 80 —
Actuarial loss on employee retirement benefitplans, net of income taxes of $60 — — — (195) (195) —
Total comprehensive income (loss) — — 80 (4 346) (4 266) —
Issued under share option plans 36 (5) — — 31 804
Repurchase of common shares for cancellation(note 9) (124) — — (183) (307) (7 527)
Change in liability for share repurchasecommitment 65 — — 103 168 —
Share-based compensation — 26 — — 26 —
Dividends paid on common shares — — — (1 350) (1 350) —
At September 30, 2020 25 144 587 979 9 634 36 344 1 525 151
At December 31, 2020 25 144 591 877 9 145 35 757 1 525 151
Net earnings — — — 2 566 2 566 —
Foreign currency translation adjustment — — (35) — (35) —
Actuarial gain on employee retirement benefitplans, net of income taxes of $255 (note 13) — — — 810 810 —
Total comprehensive (loss) income — — (35) 3 376 3 341 —
Issued under share option plans 3 — — — 3 100
Repurchase of common shares for cancellation(note 9) (1 039) — — (626) (1 665) (63 101)
Change in liability for share repurchasecommitment (132) — — (78) (210) —
Share-based compensation — 17 — — 17 —
Dividends paid on common shares — — — (943) (943) —
At September 30, 2021 23 976 608 842 10 874 36 300 1 462 150
See accompanying notes to the condensed interim consolidated financial statements.
2021 Third Quarter Suncor Energy Inc. 51

Notes to the Consolidated Financial Statements(unaudited)
1. Reporting Entity and Description of the Business
Suncor Energy Inc. (Suncor or the company) is an integrated energy company headquartered in Calgary, Alberta. The company
is focused on developing one of the world’s largest petroleum resource basins – Canada’s Athabasca oil sands. In addition, the
company explores for, acquires, develops, produces and markets crude oil in Canada and internationally; transports and
refines crude oil; and markets petroleum and petrochemical products primarily in Canada. The company also operates a
renewable energy business and conducts energy trading activities focused principally on the marketing and trading of crude oil,
natural gas, byproducts, refined products and power.
The address of the company’s registered office is 150 – 6th Avenue S.W., Calgary, Alberta, Canada, T2P 3E3.
2. Basis of Preparation
(a) Statement of Compliance
These condensed interim consolidated financial statements have been prepared in accordance with International Financial
Reporting Standards, specifically International Accounting Standard 34 Interim Financial Reporting as issued by the International
Accounting Standards Board. They are condensed as they do not include all of the information required for full annual financial
statements, and they should be read in conjunction with the consolidated financial statements of the company for the year ended
December 31, 2020. Beginning in the first quarter of 2021, the company has revised the presentation of its expenses from
“transportation” to “transportation and distribution” and reclassified certain operating, selling and general expenses to
transportation and distribution to better reflect the nature of these expenses. There is no impact on net earnings (loss) and
comparative periods have been restated to reflect this change.
(b) Basis of Measurement
The consolidated financial statements are prepared on a historical cost basis except as detailed in the accounting policies
disclosed in the company’s consolidated financial statements for the year ended December 31, 2020.
(c) Functional Currency and Presentation Currency
These consolidated financial statements are presented in Canadian dollars, which is the company’s functional currency.
(d) Use of Estimates, Assumptions and Judgments
The timely preparation of financial statements requires that management make estimates and assumptions and use judgment.
Accordingly, actual results may differ from estimated amounts as future confirming events occur. Significant estimates and
judgment used in the preparation of the financial statements are described in the company’s consolidated financial statements
for the year ended December 31, 2020.
On January 30, 2020, the World Health Organization declared the COVID-19 outbreak a Public Health Emergency of International
Concern and, on March 10, 2020, declared it to be a pandemic. Actions taken around the world to help mitigate the spread of
COVID-19 include restrictions on travel, quarantines in certain areas, and forced closures for certain types of public places and
businesses. These measures have and may continue to have significant disruption to business operations and a significant increase
in economic uncertainty, with reduced demand for commodities leading to volatile prices and currency exchange rates, and a
decline in long-term interest rates. Our operations and business are particularly sensitive to a reduction in the demand for, and
prices of, commodities that are closely linked to Suncor’s financial performance, including crude oil, refined petroleum products
(such as jet fuel and gasoline), natural gas and electricity. The potential direct and indirect impacts of the economic downturn
have been considered in management’s estimates, and assumptions at period end have been reflected in our results with any
significant changes described in the relevant notes to the company’s unaudited interim Consolidated Financial Statements for the
three months and nine months ended September 30, 2021.
The COVID-19 pandemic is an evolving situation that will continue to have widespread implications for our business environment,
operations and financial condition. Management cannot reasonably estimate the length or severity of this pandemic, or the
extent to which the disruption may materially impact our consolidated statements of comprehensive income (loss), consolidated
balance sheets and consolidated statements of cash flows in fiscal 2021.
(e) Income Taxes
The company recognizes the impacts of income tax rate changes in earnings in the period that the applicable rate change is
enacted or substantively enacted.
52 2021 Third Quarter Suncor Energy Inc.

3. Segmented Information
The company’s operating segments are reported based on the nature of their products and services and management
responsibility.
Intersegment sales of crude oil and natural gas are accounted for at market values and are included, for segmented reporting,
in revenues of the segment making the transfer and expenses of the segment receiving the transfer. Intersegment amounts are
eliminated on consolidation.
Three months ended September 30 Oil SandsExploration and
ProductionRefining and
MarketingCorporate andEliminations Total
($ millions) 2021 2020 2021 2020 2021 2020 2021 2020 2021 2020
Revenues and Other Income
Gross revenues 3 705 1 949 744 512 6 304 4 027 5 5 10 758 6 493
Intersegment revenues 1 272 618 — — 37 23 (1 309) (641) — —
Less: Royalties (504) (36) (109) (30) — — — — (613) (66)
Operating revenues, net of royalties 4 473 2 531 635 482 6 341 4 050 (1 304) (636) 10 145 6 427
Other income (loss) 76 40 4 (9) (9) (2) (3) 1 68 30
4 549 2 571 639 473 6 332 4 048 (1 307) (635) 10 213 6 457
Expenses
Purchases of crude oil and products 442 171 — — 4 710 2 840 (1 261) (655) 3 891 2 356
Operating, selling and general(1) 2 004 1 650 101 118 502 417 161 50 2 768 2 235
Transportation and distribution(1) 277 236 23 24 79 71 (11) (10) 368 321
Depreciation, depletion, amortizationand impairment 1 098 1 242 (98) 261 193 214 25 21 1 218 1 738
Exploration 2 2 9 10 — — — — 11 12
(Gain) loss on disposal of assets — (2) — — (10) (2) 1 1 (9) (3)
Financing expenses (income) 97 81 14 14 10 11 531 (71) 652 35
3 920 3 380 49 427 5 484 3 551 (554) (664) 8 899 6 694
Earnings (Loss) before Income Taxes 629 (809) 590 46 848 497 (753) 29 1 314 (237)
Income Tax Expense (Recovery)
Current 154 (137) 164 30 166 101 (98) (35) 386 (41)
Deferred (9) (141) 19 (9) 36 12 5 (46) 51 (184)
145 (278) 183 21 202 113 (93) (81) 437 (225)
Net Earnings (Loss) 484 (531) 407 25 646 384 (660) 110 877 (12)
Capital and Exploration Expenditures 935 661 64 99 142 156 80 25 1 221 941
(1) Prior period amounts of the Refining and Marketing segment have been reclassified to align with the current year presentation of transportation
and distribution expense. For the three months ended September 30, 2020, $40 million was reclassified from operating, selling and general expense
to transportation and distribution expense. This reclassification had no effect on net earnings (loss).
2021 Third Quarter Suncor Energy Inc. 53

Nine months ended September 30 Oil SandsExploration and
ProductionRefining and
MarketingCorporate andEliminations Total
($ millions) 2021 2020 2021 2020 2021 2020 2021 2020 2021 2020
Revenues and Other Income
Gross revenues 10 766 5 491 2 240 1 344 16 210 11 327 20 20 29 236 18 182
Intersegment revenues 3 198 2 045 — — 82 69 (3 280) (2 114) — —
Less: Royalties (882) (77) (371) (58) — — — — (1 253) (135)
Operating revenues, net ofroyalties 13 082 7 459 1 869 1 286 16 292 11 396 (3 260) (2 094) 27 983 18 047
Other (loss) income (5) 311 14 48 (48) 58 (2) (6) (41) 411
13 077 7 770 1 883 1 334 16 244 11 454 (3 262) (2 100) 27 942 18 458
Expenses
Purchases of crude oil andproducts 1 037 669 — — 11 697 8 499 (3 013) (2 213) 9 721 6 955
Operating, selling and general(1) 5 922 5 430 333 362 1 453 1 287 680 221 8 388 7 300
Transportation anddistribution(1) 833 797 95 80 202 199 (31) (32) 1 099 1 044
Depreciation, depletion,amortization and impairment 3 348 5 372 195 1 312 610 660 67 62 4 220 7 406
Exploration 7 60 24 116 — — — — 31 176
(Gain) loss on disposal of assets — (2) — — (18) (6) (7) — (25) (8)
Financing expenses 274 254 48 31 32 26 638 930 992 1 241
11 421 12 580 695 1 901 13 976 10 665 (1 666) (1 032) 24 426 24 114
Earnings (Loss) before IncomeTaxes 1 656 (4 810) 1 188 (567) 2 268 789 (1 596) (1 068) 3 516 (5 656)
Income Tax Expense(Recovery)
Current 445 (664) 333 47 472 162 (352) (255) 898 (710)
Deferred (40) (643) 35 (161) 68 29 (11) (20) 52 (795)
405 (1 307) 368 (114) 540 191 (363) (275) 950 (1 505)
Net Earnings (Loss) 1 251 (3 503) 820 (453) 1 728 598 (1 233) (793) 2 566 (4 151)
Capital and ExplorationExpenditures 2 308 2 108 197 409 637 334 229 108 3 371 2 959
(1) Prior period amounts of the Refining and Marketing segment have been reclassified to align with the current year presentation of transportation
and distribution expense. For the nine months ended September 30, 2020, $98 million was reclassified from operating, selling and general expense
to transportation and distribution expense. This reclassification had no effect on net earnings (loss).
Notes to the Consolidated Financial Statements
54 2021 Third Quarter Suncor Energy Inc.

Disaggregation of Revenue from Contracts with Customers and Intersegment Revenue
The company derives revenue from the transfer of goods mainly at a point in time in the following major commodities, revenue
streams and geographical regions:
Three months ended September 30 2021 2020($ millions) North America International Total North America International Total
Oil Sands
Synthetic crude oil and diesel 3 354 — 3 354 2 040 — 2 040
Bitumen 1 623 — 1 623 527 — 527
4 977 — 4 977 2 567 — 2 567
Exploration and Production
Crude oil and natural gas liquids 427 314 741 311 200 511
Natural gas — 3 3 — 1 1
427 317 744 311 201 512
Refining and Marketing
Gasoline 2 901 — 2 901 1 953 — 1 953
Distillate 2 559 — 2 559 1 534 — 1 534
Other 881 — 881 563 — 563
6 341 — 6 341 4 050 — 4 050
Corporate and Eliminations
(1 304) — (1 304) (636) — (636)
Total Revenue from Contracts withCustomers 10 441 317 10 758 6 292 201 6 493
Nine months ended September 30 2021 2020($ millions) North America International Total North America International Total
Oil Sands
Synthetic crude oil and diesel 9 995 — 9 995 6 131 — 6 131
Bitumen 3 969 — 3 969 1 405 — 1 405
13 964 — 13 964 7 536 — 7 536
Exploration and Production
Crude oil and natural gas liquids 1 331 903 2 234 790 551 1 341
Natural gas — 6 6 — 3 3
1 331 909 2 240 790 554 1 344
Refining and Marketing
Gasoline 7 212 — 7 212 4 979 — 4 979
Distillate 6 876 — 6 876 4 798 — 4 798
Other 2 204 — 2 204 1 619 — 1 619
16 292 — 16 292 11 396 — 11 396
Corporate and Eliminations
(3 260) — (3 260) (2 094) — (2 094)
Total Revenue from Contracts withCustomers 28 327 909 29 236 17 628 554 18 182
2021 Third Quarter Suncor Energy Inc. 55

4. Other Income (Loss)
Other income (loss) consists of the following:
Three months endedSeptember 30
Nine months endedSeptember 30
($ millions) 2021 2020 2021 2020
Energy trading activities
Gains (losses) recognized in earnings 41 (15) 50 152
Gains (losses) on inventory valuation 2 (18) 1 (28)
Short-term commodity risk management (24) 22 (194) 121
Investment and interest income 11 29 57 78
Insurance proceeds(1) 38 — 38 49
Other — 12 7 39
68 30 (41) 411
(1) Three and nine months ended September 30, 2021, includes insurance proceeds for the outage at the secondary extraction facilities at Oil SandsBase Plant and nine months ended September 30, 2020, includes insurance proceeds for the outage at MacKay River, both within the Oil Sandssegment.
5. Share-Based Compensation
The following table summarizes the share-based compensation expense (recovery) for all plans recorded within operating,
selling and general expense:
Three months endedSeptember 30
Nine months endedSeptember 30
($ millions) 2021 2020 2021 2020
Equity-settled plans 4 7 17 26
Cash-settled plans (2) (51) 180 (120)
2 (44) 197 (94)
6. Financing Expenses
Three months endedSeptember 30
Nine months endedSeptember 30
($ millions) 2021 2020 2021 2020
Interest on debt 213 225 639 666
Interest on lease liabilities 40 42 122 126
Capitalized interest (38) (29) (106) (94)
Interest expense 215 238 655 698
Interest on partnership liability 13 13 39 39
Interest on pension and other post-retirement benefits 15 14 44 41
Accretion 76 71 227 209
Foreign exchange loss (gain) on U.S. dollar denominated debt 282 (307) (88) 290
Operational foreign exchange and other (29) 6 35 (36)
Loss on extinguishment of long-term debt 80 — 80 —
652 35 992 1 241
During the third quarter of 2021, the company completed an early redemption of its US$750 million (book value of $951 million)
senior unsecured notes with a coupon interest of 3.60% originally scheduled to mature on December 1, 2024, for US$822 million
($1.0 billion), including US$9 million ($11 million) of accrued interest, resulting in a debt extinguishment loss of $80 million
($60 million after tax).
Notes to the Consolidated Financial Statements
56 2021 Third Quarter Suncor Energy Inc.

In the second quarter of 2021, the company reduced the size of each tranche of its syndicated credit facilities by US$500 million
and $500 million to US$2.0 billion and $3.0 billion, respectively, and extended the maturity from April 2022 and April 2023 to
June 2024 and June 2025, respectively.
On March 4, 2021, the company issued US$750 million of senior unsecured notes maturing on March 4, 2051. The notes have a
coupon of 3.75% and were priced at US$99.518 per US$100 principal amount for an effective yield of 3.777%. The company also
issued $500 million of senior unsecured Series 8 medium-term notes on March 4, 2021, maturing on March 4, 2051. The notes
have a coupon of 3.95% and were priced at $98.546 per $100 principal amount for an effective yield of 4.034%. Interest on the
3.75% and 3.95% notes is paid semi-annually.
During the first quarter of 2021, the company completed an early redemption of its $750 million senior unsecured Series 5 medium-
term notes with a coupon of 3.10%, originally scheduled to mature on November 26, 2021, for $770 million, including $8 million
of accrued interest, resulting in a debt extinguishment loss of $12 million ($9 million after-tax).
The company also completed an early redemption of its US$220 million (book value of $278 million) senior unsecured notes
with a coupon of 9.40%, originally scheduled to mature on September 1, 2021, for US$230 million ($290 million), including
US$2 million ($2 million) of accrued interest, resulting in a debt extinguishment loss of $10 million ($8 million after-tax).
Effective March 5, 2021, the company terminated $2.8 billion of bilateral credit facilities as these credit facilities were no longer
required. The terminated credit facilities had a two-year term and were entered into in March and April of 2020 to ensure access
to adequate financial resources in connection with the COVID-19 pandemic should they have been required.
7. Supplemental Cash Flow Information
The (increase) decrease in non-cash working capital is comprised of:
Three months endedSeptember 30
Nine months endedSeptember 30
($ millions) 2021 2020 2021 2020
Accounts receivable 321 (10) (767) 1 213
Inventories 100 (138) (544) 391
Accounts payable and accrued liabilities 699 523 1 891 (1 392)
Current portion of provisions 131 8 215 11
Income taxes payable (net) 824 (174) 1 426 (1 431)
2 075 209 2 221 (1 208)
Relating to:
Operating activities 2 077 79 2 036 (794)
Investing activities (2) 130 185 (414)
2 075 209 2 221 (1 208)
8. Earnings (Loss) per Common Share
Three months endedSeptember 30
Nine months endedSeptember 30
($ millions) 2021 2020 2021 2020
Net earnings (loss) 877 (12) 2 566 (4 151)
(millions of common shares)
Weighted average number of common shares 1 477 1 525 1 501 1 526
Dilutive securities:
Effect of share options — — — —
Weighted average number of diluted common shares 1 477 1 525 1 501 1 526
(dollars per common share)
Basic and diluted earnings (loss) per share 0.59 (0.01) 1.71 (2.72)
2021 Third Quarter Suncor Energy Inc. 57

9. Normal Course Issuer Bid
During the first quarter of 2021, the company announced its intention to commence a new Normal Course Issuer Bid (the 2021
NCIB) to repurchase common shares through the facilities of the Toronto Stock Exchange (TSX), New York Stock Exchange (NYSE)
and/or alternative trading platforms. Pursuant to the 2021 NCIB, the company may repurchase for cancellation up to
44,000,000 common shares between February 8, 2021, and February 7, 2022. For the three months ended September 30, 2021,
the company repurchased 28.1 million common shares under the 2021 NCIB at an average price of $25.05 per share, for a total
repurchase cost of $704 million. For the nine months ended September 30, 2021, the company repurchased 63.1 million
common shares under the 2021 NCIB at an average price of $26.39 per share, for a total repurchase cost of $1.67 billion.
During the third quarter of 2021, Suncor received approval from the TSX to amend the 2021 NCIB effective as of the close of
markets on July 30, 2021, to purchase common shares through the facilities of the TSX, NYSE and/or alternative trading platforms.
The amended notice provides that Suncor may increase the maximum number of common shares that may be repurchased
under the 2021 NCIB from February 8, 2021, and ending February 7, 2022, from 44,000,000 common shares, or approximately
2.9% of Suncor’s issued and outstanding common shares as at January 31, 2021, to 76,250,000 common shares, or approximately
5% of Suncor’s issued and outstanding common shares as at January 31, 2021. No other terms of the NCIB have been amended.
Subsequent to the third quarter of 2021, Suncor received approval from the TSX to amend its existing NCIB effective as of the
close of markets on October 29, 2021, to purchase common shares through the facilities of the TSX, NYSE and/or alternative
trading platforms. The notice provides that Suncor may increase the maximum number of common shares that may be
repurchased in the period beginning February 8, 2021, and ending February 7, 2022, from 76,250,000 shares, or approximately
5% of Suncor’s issued and outstanding common shares as at January 31, 2021, to 106,700,000, or approximately 7% of Suncor’s
public float as at January 31, 2021. No other terms of the NCIB have been amended.
The following table summarizes the share repurchase activities during the period:
Three months endedSeptember 30
Nine months endedSeptember 30
($ millions, except as noted) 2021 2020 2021 2020
Share repurchase activities (thousands of common shares)
Shares repurchased 28 112 — 63 101 7 527
Amounts charged to:
Share capital 463 — 1 039 124
Retained earnings 241 — 626 183
Share repurchase cost 704 — 1 665 307
Under an automatic repurchase plan agreement with an independent broker, the company has recorded the following liability
for share repurchases that may take place during its internal blackout period:
($ millions)September 30
2021December 31
2020
Amounts charged to:
Share capital 132 —
Retained earnings 78 —
Liability for share purchase commitment 210 —
10. Financial Instruments
Derivative Financial Instruments
(a) Non-Designated Derivative Financial Instruments
The company uses derivative financial instruments, such as physical and financial contracts, to manage certain exposures to
fluctuations in interest rates, short-term commodity prices and foreign currency exchange rates, as part of its overall risk
management program, as well as for trading purposes.
Notes to the Consolidated Financial Statements
58 2021 Third Quarter Suncor Energy Inc.

The changes in the fair value of non-designated derivatives are as follows:
($ millions) Total
Fair value outstanding at December 31, 2020 (121)
Cash settlements – paid during the year 208
Changes in fair value recognized in earnings during the year (144)
Fair value outstanding at September 30, 2021 (57)
(b) Fair Value Hierarchy
To estimate the fair value of derivatives, the company uses quoted market prices when available, or third-party models and
valuation methodologies that utilize observable market data. In addition to market information, the company incorporates
transaction-specific details that market participants would utilize in a fair value measurement, including the impact of non-
performance risk. However, these fair value estimates may not necessarily be indicative of the amounts that could be realized or
settled in a current market transaction. The company characterizes inputs used in determining fair value using a hierarchy that
prioritizes inputs depending on the degree to which they are observable. The three levels of the fair value hierarchy are as follows:
• Level 1 consists of instruments with a fair value determined by an unadjusted quoted price in an active market for identical
assets or liabilities. An active market is characterized by readily and regularly available quoted prices where the prices are
representative of actual and regularly occurring market transactions to assure liquidity.
• Level 2 consists of instruments with a fair value that is determined by quoted prices in an inactive market, prices with
observable inputs or prices with insignificant non-observable inputs. The fair value of these positions is determined using
observable inputs from exchanges, pricing services, third-party independent broker quotes and published transportation
tolls. The observable inputs may be adjusted using certain methods, which include extrapolation over the quoted price term
and quotes for comparable assets and liabilities.
• Level 3 consists of instruments with a fair value that is determined by prices with significant unobservable inputs. As at
September 30, 2021, the company does not have any derivative instruments measured at fair value Level 3.
In forming estimates, the company utilizes the most observable inputs available for valuation purposes. If a fair value
measurement reflects inputs of different levels within the hierarchy, the measurement is categorized based upon the lowest
level of input that is significant to the fair value measurement.
The following table presents the company’s derivative financial instruments measured at fair value for each hierarchy level as at
September 30, 2021:
($ millions) Level 1 Level 2 Level 3 Total Fair Value
Accounts receivable 75 82 — 157
Accounts payable (188) (26) — (214)
(113) 56 — (57)
During the third quarter of 2021, there were no transfers between Level 1 and Level 2 fair value measurements.
A substantial portion of the company’s accounts receivable are with customers in the oil and gas industry and are subject to
normal industry credit risk. While the industry has experienced credit downgrades due to the COVID-19 pandemic, Suncor has
not been significantly affected as the majority of Suncor’s customers are large and established downstream companies with
investment grade credit ratings.
Non-Derivative Financial Instruments
At September 30, 2021, the carrying value of fixed-term debt accounted for under amortized cost was $14.6 billion (December 31,
2020 – $15.2 billion) and the fair value was $17.8 billion (December 31, 2020 – $18.8 billion). The estimated fair value of long-term
debt is based on pricing sourced from market data.
11. Asset Impairment
Oil Sands
During the first quarter of 2020, the company recorded an impairment of $1.38 billion (net of taxes of $0.44 billion) on its share
of the Fort Hills assets in the Oil Sands segment.
2021 Third Quarter Suncor Energy Inc. 59
No indicators of impairment or reversals of impairment were identified at September 30, 2021.
Exploration and ProductionWhite Rose assets:
During the first quarter of 2020, the company recorded an impairment of $137 million (net of taxes of $45 million) on its share
of the White Rose assets in the Exploration and Production segment.
In the fourth quarter of 2020, the company reassessed the likelihood of completing the West White Rose Project. As a result of
this reassessment, the company performed another impairment test of the White Rose cash-generating unit (CGU). An after-tax
impairment charge of $423 million (net of taxes of $136 million) was recognized and the White Rose CGU was fully impaired at
December 31, 2020.
No indicators of impairment reversal were identified at September 30, 2021.
Terra Nova assets:
During the third quarter of 2021, the company finalized an agreement with the co-owners of the Terra Nova project to restructure
the project ownership and move forward with the Asset Life Extension project. The agreement increased the company’s working
interest to approximately 48% (previously approximately 38%) and includes royalty and financial support from the Government
of Newfoundland and Labrador. The company received $26 million (net of taxes of $8 million) in cash consideration to acquire the
additional 10% working interest, which was primarily allocated to the asset retirement obligation and property, plant and
equipment of the project. As a result of these events, during the third quarter of 2021, the company performed an impairment
reversal test on the Terra Nova cash generating unit (CGU) as the recoverable amount of this CGU was sensitive to the financial
support from the Government of Newfoundland and Labrador and revised royalty structure resulting in increased profitability
and economic value. The impairment reversal test was performed using recoverable amounts based on the fair value less cost of
disposal. An expected cash flow approach was used with the key assumptions discussed below (Level 3 fair value inputs – note 10).
As a result of the impairment reversal test, the recoverable amounts were determined to be greater than the carrying values
of the Terra Nova CGU and the company recorded an impairment reversal of $168 million (net of taxes of $53 million) on its share
of the Terra Nova assets in the Exploration and Production segment. In addition to the financial support from the government,
the recoverable amount was determined based on the following asset-specific assumptions:
• Brent price forecast of US$65.00/bbl in 2023 and US$68.00/bbl in 2024, escalating at 2% per year thereafter over the life of
the project to 2033 and adjusted for asset-specific location and quality differentials;
• the anticipated return to operations before the end of 2022 and the company’s share of production of approximately
6,000 bbls/d (37.68% working interest) over the life of the project; and
• risk-adjusted discount rate of 9.0% (after-tax).
The recoverable amount of the Terra Nova CGU was $177 million as at September 30, 2021.
During the first quarter of 2020, the company recorded an impairment of $285 million (net of taxes of $93 million) on its share
of the Terra Nova assets in the Exploration and Production segment.
No other indicators of impairment or reversals of impairment were identified at September 30, 2021.
12. Provisions
Suncor’s decommissioning and restoration provision decreased by $1.1 billion for the nine months ended September 30, 2021.
The decrease was primarily due to an increase in the credit-adjusted risk-free interest rate to 3.70% (December 31, 2020 – 3.10%).
13. Pensions and Other Post-Retirement Benefits
For the nine months ended September 30, 2021, the actuarial gain on employee retirement benefit plans was $810 million (net
of taxes of $255 million) mainly due to an increase in the discount rate to 3.30% (December 31, 2020 – 2.50%).
14. Assets Held for Sale
Subsequent to the third quarter of 2021, the company completed the sale of its 26.69% working interest in the Golden Eagle
Area Development for after-tax proceeds of US$250 million net of closing adjustments and other closing costs, and future
contingent consideration of up to US$50 million, resulting in an estimated after-tax gain on sale of approximately $235 million.
Notes to the Consolidated Financial Statements
60 2021 Third Quarter Suncor Energy Inc.

The contingent consideration is receivable in the second half of 2023, if between July 2021 and June 2023 the Dated Brent
average crude price equals or exceeds US$55/bbl, upon which US$25 million is receivable; or if the Dated Brent average crude
price equals or exceeds US$65/bbl, upon which US$50 million is receivable. As at September 30, 2021, the company has reclassified
the assets and liabilities related to its working interest in the Golden Eagle Area Development as assets held for sale. The
company completed the sale on October 22, 2021 with an effective date of January 1, 2021. The Golden Eagle Area Development
is reported within the Exploration and Production segment.
The table below details the assets and liabilities held for sale as at September 30, 2021:
($ millions)September 30
2021
Assets
Current assets 16
Property, plant and equipment, net 237
Total Assets 253
Liabilities
Current liabilities (8)
Provisions (170)
Deferred income taxes (3)
Total Liabilities (181)
Net Assets 72
15. Subsequent Event
On October 27, 2021, Suncor’s Board of Directors approved an increase in the company’s quarterly dividend to $0.42 per
common share from $0.21 per common share.
2021 Third Quarter Suncor Energy Inc. 61

Supplemental Financial and Operating InformationQuarterly Financial Summary(unaudited)
Three months ended Nine months ended
Twelvemonths
ended
($ millions, except per share amounts)Sep 30
2021Jun 30
2021Mar 31
2021Dec 31
2020Sep 30
2020Sep 30
2021Sep 30
2020Dec 31
2020
Revenues, net of royalties, and other income 10 213 9 093 8 636 6 594 6 457 27 942 18 458 25 052
Net earnings (loss)
Oil Sands 484 441 326 (293) (531) 1 251 (3 503) (3 796)
Exploration and Production 407 250 163 (379) 25 820 (453) (832)
Refining and Marketing 646 375 707 268 384 1 728 598 866
Corporate and Eliminations (660) (198) (375) 236 110 (1 233) (793) (557)
Total 877 868 821 (168) (12) 2 566 (4 151) (4 319)
Operating earnings (loss)(A)(B)
Oil Sands 489 465 299 (130) (539) 1 253 (2 135) (2 265)
Exploration and Production 239 250 163 44 25 652 (31) 13
Refining and Marketing 658 361 714 280 356 1 733 602 882
Corporate and Eliminations (343) (354) (430) (303) (180) (1 127) (540) (843)
Total 1 043 722 746 (109) (338) 2 511 (2 104) (2 213)
Funds from (used in) operations(A)
Oil Sands 1 591 1 680 1 400 729 556 4 671 1 257 1 986
Exploration and Production 357 411 285 312 260 1 053 742 1 054
Refining and Marketing 947 581 962 415 594 2 490 1 293 1 708
Corporate and Eliminations (254) (310) (537) (235) (244) (1 101) (637) (872)
Total 2 641 2 362 2 110 1 221 1 166 7 113 2 655 3 876
Change in non-cash working capital 2 077 (276) 235 (407) 79 2 036 (794) (1 201)
Cash flow provided by (used in) operating activities 4 718 2 086 2 345 814 1 245 9 149 1 861 2 675
Per common share
Net earnings (loss) – basic 0.59 0.58 0.54 (0.11) (0.01) 1.71 (2.72) (2.83)
Operating earnings (loss) – basic(A)(B) 0.71 0.48 0.49 (0.07) (0.22) 1.67 (1.38) (1.45)
Cash dividends – basic 0.21 0.21 0.21 0.21 0.21 0.63 0.89 1.10
Funds from operations – basic(A) 1.79 1.57 1.39 0.80 0.76 4.74 1.74 2.54
Cash flow provided by (used in) operatingactivities – basic 3.19 1.39 1.54 0.53 0.82 6.10 1.22 1.75
Capital and exploration expenditures (including capitalized interest)
Oil Sands 935 834 539 628 661 2 308 2 108 2 736
Exploration and Production 64 64 69 80 99 197 409 489
Refining and Marketing 142 375 120 181 156 637 334 515
Corporate and Eliminations 80 74 75 78 25 229 108 186
Total capital and exploration expenditures 1 221 1 347 803 967 941 3 371 2 959 3 926
For the twelve months endedSep 30
2021Jun 30
2021Mar 31
2021Dec 31
2020Sep 30
2020
Return on capital employed(A) (%) 4.5 1.9 (1.4) (6.9) (10.2)
Return on capital employed – excluding impairments and impairmentreversals(A) (%) 4.9 2.6 (0.6) (2.9) (1.3)
(A) Non-GAAP financial measures. See the Operating Summary Information – Non-GAAP Financial Measures section of this Quarterly Report.
(B) Beginning in the first quarter of 2021, the company has revised its operating earnings non-GAAP financial measure to exclude unrealized (gains)
losses on derivative financial instruments that are recorded at fair value to better align the earnings impact of the activity with the underlying items
being risk-managed. Prior period comparatives have been restated to reflect this change.
See accompanying footnotes and definitions to the quarterly operating summaries.
62 2021 Third Quarter Suncor Energy Inc.

Quarterly Operating Summary(unaudited)
Three months ended Nine months ended
Twelvemonths
ended
Oil SandsSep 30
2021Jun 30
2021Mar 31
2021Dec 31
2020Sep 30
2020Sep 30
2021Sep 30
2020Dec 31
2020
Production Volumes (mbbls/d)
Upgraded product (SCO and diesel) production
Oil Sands operations 221.0 326.8 329.6 309.7 252.3 291.1 301.1 303.1
Syncrude 184.5 110.4 190.3 204.6 158.5 161.7 149.2 163.1
Total upgraded production 405.5 437.2 519.9 514.3 410.8 452.8 450.3 466.2
Non-upgraded bitumen production
Oil Sands operations 148.8 133.2 119.5 94.8 65.6 134.8 60.4 69.1
Fort Hills 50.8 45.3 51.2 62.4 42.6 49.1 56.8 58.1
Total Oil Sands non-upgraded bitumen production 199.6 178.5 170.7 157.2 108.2 183.9 117.2 127.2
Total Oil Sands production volumes 605.1 615.7 690.6 671.5 519.0 636.7 567.5 593.4
Oil Sands sales volumes (mbbls/d)
Upgraded product (SCO and diesel) 418.6 433.9 515.2 495.6 420.1 455.4 458.4 467.9
Non-upgraded bitumen 194.4 183.5 180.2 139.6 119.1 186.2 121.0 125.6
Total Oil Sands sales volumes 613.0 617.4 695.4 635.2 539.2 641.6 579.4 593.5
Oil Sands operations cash operating costs – Average(1)(A) ($/bbl)*
Cash costs 25.20 21.25 20.60 23.50 28.85 22.20 26.35 25.60
Natural gas 3.85 2.60 2.70 3.00 2.90 3.00 2.45 2.60
29.05 23.85 23.30 26.50 31.75 25.20 28.80 28.20
Fort Hills bitumen cash operating costs(1)(A) ($/bbl)*
Cash costs 38.00 38.60 33.95 29.40 33.05 36.75 31.45 30.90
Natural gas 2.90 2.75 3.10 2.15 2.15 2.95 1.80 1.90
40.90 41.35 37.05 31.55 35.20 39.70 33.25 32.80
Syncrude SCO cash operating costs(1)(A) ($/bbl)*
Cash costs 29.75 47.65 30.85 27.30 33.30 34.25 34.95 32.55
Natural gas 1.30 2.60 1.40 1.15 1.05 1.65 1.30 1.25
31.05 50.25 32.25 28.45 34.35 35.90 36.25 33.80
(A) Non-GAAP financial measures. See the Quarterly Operating Metrics Reconciliation and the Operating Summary Information – Non-GAAP Financial
Measures section of this Quarterly Report.
See accompanying footnotes and definitions to the quarterly operating summaries.
2021 Third Quarter Suncor Energy Inc. 63

Quarterly Operating Summary (continued)
(unaudited)
Three months ended Nine months ended
Twelvemonths
ended
Oil Sands Segment Netbacks(A)(C)Sep 30
2021Jun 30
2021Mar 31
2021Dec 31
2020Sep 30
2020Sep 30
2021Sep 30
2020Dec 31
2020
Bitumen ($/bbl)
Average price realized 65.53 55.54 47.57 34.06 29.56 56.50 26.26 28.44
Royalties (7.99) (3.65) (0.83) (0.25) (0.36) (4.26) (0.34) (0.32)
Transportation and distribution costs (5.62) (5.34) (5.04) (5.16) (5.28) (5.34) (6.43) (6.07)
Net operating expenses (18.10) (15.55) (13.88) (19.84) (17.85) (15.92) (20.23) (20.14)
Operating netback 33.82 31.00 27.82 8.81 6.07 30.98 (0.74) 1.91
SCO and diesel ($/bbl)
Average price realized 84.80 81.34 69.40 51.34 50.72 77.96 47.04 48.19
Royalties (9.33) (4.01) (3.10) (0.31) (0.82) (5.32) (0.49) (0.45)
Transportation and distribution costs (4.59) (4.84) (4.18) (3.75) (4.54) (4.52) (4.59) (4.36)
Net operating expenses (33.44) (32.04) (26.64) (26.94) (31.49) (30.47) (30.35) (29.45)
Operating netback 37.44 40.45 35.48 20.34 13.87 37.65 11.61 13.93
Average Oil Sands segment ($/bbl)
Average price realized 78.69 73.67 63.73 47.54 46.04 71.73 42.70 44.01
Royalties (8.91) (3.90) (2.50) (0.31) (0.72) (5.01) (0.48) (0.44)
Transportation and distribution costs (4.91) (4.99) (4.41) (4.06) (4.70) (4.76) (4.97) (4.72)
Net operating expenses (28.58) (27.14) (23.34) (25.38) (28.47) (26.25) (28.24) (27.48)
Operating netback 36.29 37.64 33.48 17.79 12.15 35.71 9.01 11.37
(A) Non-GAAP financial measures. See the Quarterly Operating Metrics Reconciliation and the Operating Summary Information – Non-GAAP Financial
Measures section of this Quarterly Report.
(C) Netbacks are based on sales volumes. Impact of inventory write-down is excluded until product is sold.
See accompanying footnotes and definitions to the quarterly operating summaries.
64 2021 Third Quarter Suncor Energy Inc.
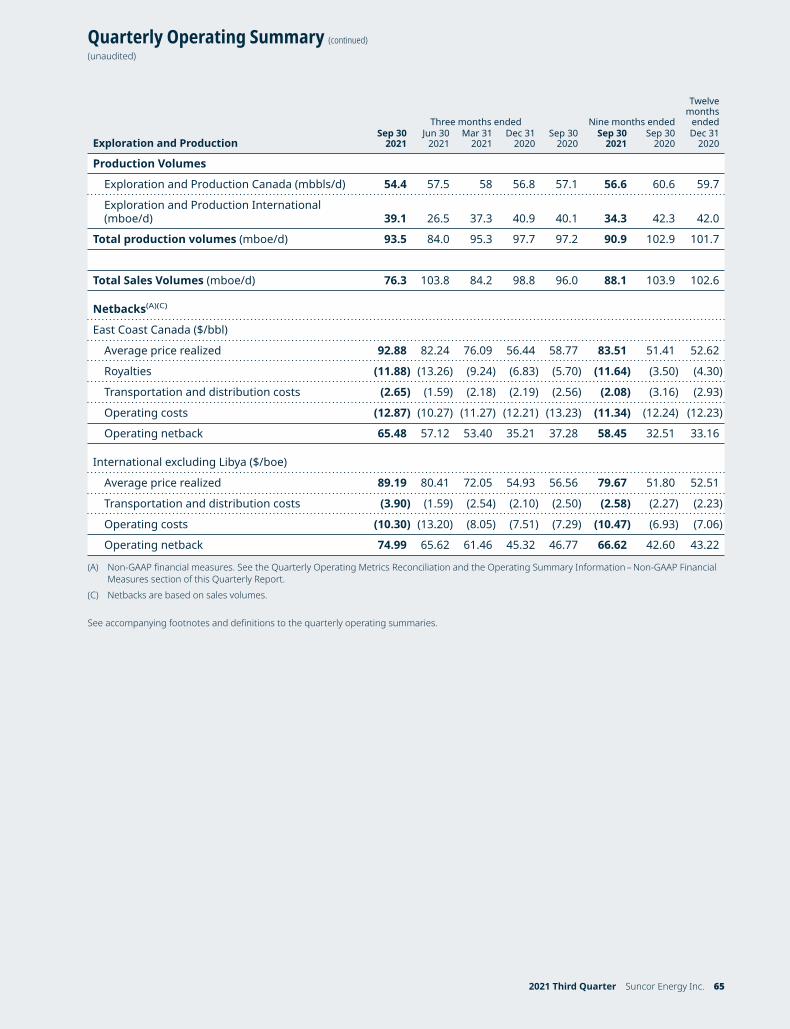
Quarterly Operating Summary (continued)
(unaudited)
Three months ended Nine months ended
Twelvemonths
ended
Exploration and ProductionSep 30
2021Jun 30
2021Mar 31
2021Dec 31
2020Sep 30
2020Sep 30
2021Sep 30
2020Dec 31
2020
Production Volumes
Exploration and Production Canada (mbbls/d) 54.4 57.5 58 56.8 57.1 56.6 60.6 59.7
Exploration and Production International(mboe/d) 39.1 26.5 37.3 40.9 40.1 34.3 42.3 42.0
Total production volumes (mboe/d) 93.5 84.0 95.3 97.7 97.2 90.9 102.9 101.7
Total Sales Volumes (mboe/d) 76.3 103.8 84.2 98.8 96.0 88.1 103.9 102.6
Netbacks(A)(C)
East Coast Canada ($/bbl)
Average price realized 92.88 82.24 76.09 56.44 58.77 83.51 51.41 52.62
Royalties (11.88) (13.26) (9.24) (6.83) (5.70) (11.64) (3.50) (4.30)
Transportation and distribution costs (2.65) (1.59) (2.18) (2.19) (2.56) (2.08) (3.16) (2.93)
Operating costs (12.87) (10.27) (11.27) (12.21) (13.23) (11.34) (12.24) (12.23)
Operating netback 65.48 57.12 53.40 35.21 37.28 58.45 32.51 33.16
International excluding Libya ($/boe)
Average price realized 89.19 80.41 72.05 54.93 56.56 79.67 51.80 52.51
Transportation and distribution costs (3.90) (1.59) (2.54) (2.10) (2.50) (2.58) (2.27) (2.23)
Operating costs (10.30) (13.20) (8.05) (7.51) (7.29) (10.47) (6.93) (7.06)
Operating netback 74.99 65.62 61.46 45.32 46.77 66.62 42.60 43.22
(A) Non-GAAP financial measures. See the Quarterly Operating Metrics Reconciliation and the Operating Summary Information – Non-GAAP Financial
Measures section of this Quarterly Report.
(C) Netbacks are based on sales volumes.
See accompanying footnotes and definitions to the quarterly operating summaries.
2021 Third Quarter Suncor Energy Inc. 65
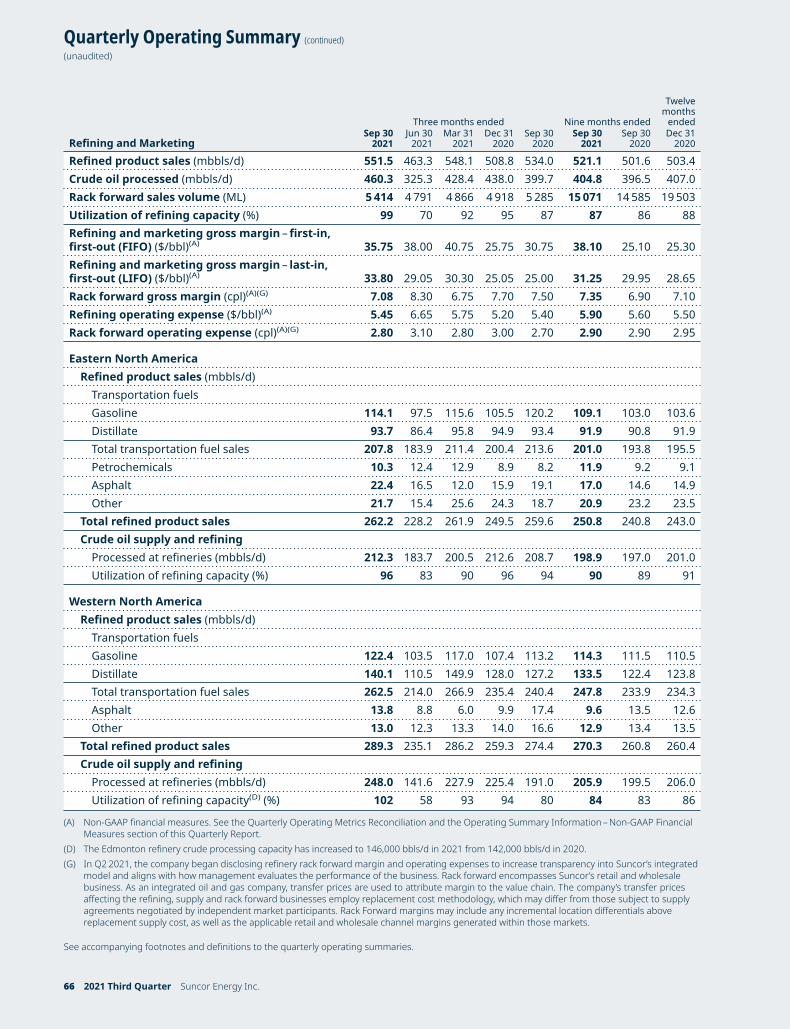
Quarterly Operating Summary (continued)
(unaudited)
Three months ended Nine months ended
Twelvemonths
ended
Refining and MarketingSep 30
2021Jun 30
2021Mar 31
2021Dec 31
2020Sep 30
2020Sep 30
2021Sep 30
2020Dec 31
2020
Refined product sales (mbbls/d) 551.5 463.3 548.1 508.8 534.0 521.1 501.6 503.4
Crude oil processed (mbbls/d) 460.3 325.3 428.4 438.0 399.7 404.8 396.5 407.0
Rack forward sales volume (ML) 5 414 4 791 4 866 4 918 5 285 15 071 14 585 19 503
Utilization of refining capacity (%) 99 70 92 95 87 87 86 88
Refining and marketing gross margin – first-in,first-out (FIFO) ($/bbl)(A) 35.75 38.00 40.75 25.75 30.75 38.10 25.10 25.30
Refining and marketing gross margin – last-in,first-out (LIFO) ($/bbl)(A) 33.80 29.05 30.30 25.05 25.00 31.25 29.95 28.65
Rack forward gross margin (cpl)(A)(G) 7.08 8.30 6.75 7.70 7.50 7.35 6.90 7.10
Refining operating expense ($/bbl)(A) 5.45 6.65 5.75 5.20 5.40 5.90 5.60 5.50
Rack forward operating expense (cpl)(A)(G) 2.80 3.10 2.80 3.00 2.70 2.90 2.90 2.95
Eastern North America
Refined product sales (mbbls/d)
Transportation fuels
Gasoline 114.1 97.5 115.6 105.5 120.2 109.1 103.0 103.6
Distillate 93.7 86.4 95.8 94.9 93.4 91.9 90.8 91.9
Total transportation fuel sales 207.8 183.9 211.4 200.4 213.6 201.0 193.8 195.5
Petrochemicals 10.3 12.4 12.9 8.9 8.2 11.9 9.2 9.1
Asphalt 22.4 16.5 12.0 15.9 19.1 17.0 14.6 14.9
Other 21.7 15.4 25.6 24.3 18.7 20.9 23.2 23.5
Total refined product sales 262.2 228.2 261.9 249.5 259.6 250.8 240.8 243.0
Crude oil supply and refining
Processed at refineries (mbbls/d) 212.3 183.7 200.5 212.6 208.7 198.9 197.0 201.0
Utilization of refining capacity (%) 96 83 90 96 94 90 89 91
Western North America
Refined product sales (mbbls/d)
Transportation fuels
Gasoline 122.4 103.5 117.0 107.4 113.2 114.3 111.5 110.5
Distillate 140.1 110.5 149.9 128.0 127.2 133.5 122.4 123.8
Total transportation fuel sales 262.5 214.0 266.9 235.4 240.4 247.8 233.9 234.3
Asphalt 13.8 8.8 6.0 9.9 17.4 9.6 13.5 12.6
Other 13.0 12.3 13.3 14.0 16.6 12.9 13.4 13.5
Total refined product sales 289.3 235.1 286.2 259.3 274.4 270.3 260.8 260.4
Crude oil supply and refining
Processed at refineries (mbbls/d) 248.0 141.6 227.9 225.4 191.0 205.9 199.5 206.0
Utilization of refining capacity(D) (%) 102 58 93 94 80 84 83 86
(A) Non-GAAP financial measures. See the Quarterly Operating Metrics Reconciliation and the Operating Summary Information – Non-GAAP FinancialMeasures section of this Quarterly Report.
(D) The Edmonton refinery crude processing capacity has increased to 146,000 bbls/d in 2021 from 142,000 bbls/d in 2020.
(G) In Q2 2021, the company began disclosing refinery rack forward margin and operating expenses to increase transparency into Suncor’s integratedmodel and aligns with how management evaluates the performance of the business. Rack forward encompasses Suncor’s retail and wholesalebusiness. As an integrated oil and gas company, transfer prices are used to attribute margin to the value chain. The company’s transfer pricesaffecting the refining, supply and rack forward businesses employ replacement cost methodology, which may differ from those subject to supplyagreements negotiated by independent market participants. Rack Forward margins may include any incremental location differentials abovereplacement supply cost, as well as the applicable retail and wholesale channel margins generated within those markets.
See accompanying footnotes and definitions to the quarterly operating summaries.
66 2021 Third Quarter Suncor Energy Inc.
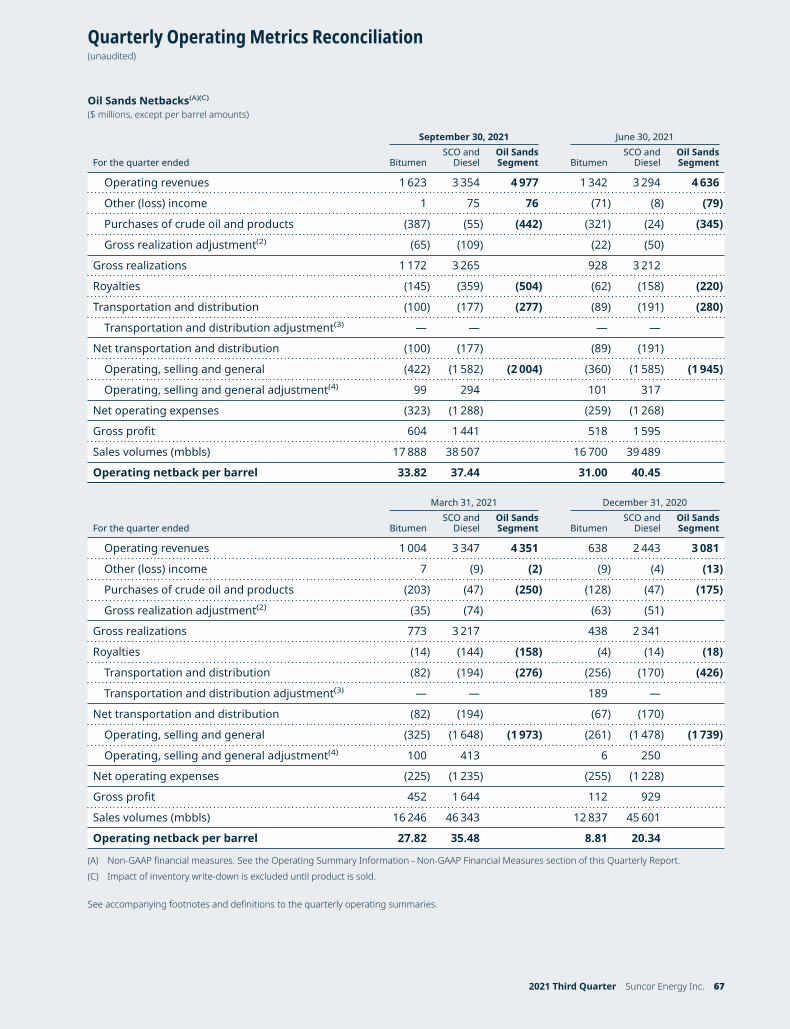
Quarterly Operating Metrics Reconciliation(unaudited)
Oil Sands Netbacks(A)(C)
($ millions, except per barrel amounts)
September 30, 2021 June 30, 2021
For the quarter ended BitumenSCO and
DieselOil SandsSegment Bitumen
SCO andDiesel
Oil SandsSegment
Operating revenues 1 623 3 354 4 977 1 342 3 294 4 636
Other (loss) income 1 75 76 (71) (8) (79)
Purchases of crude oil and products (387) (55) (442) (321) (24) (345)
Gross realization adjustment(2) (65) (109) (22) (50)
Gross realizations 1 172 3 265 928 3 212
Royalties (145) (359) (504) (62) (158) (220)
Transportation and distribution (100) (177) (277) (89) (191) (280)
Transportation and distribution adjustment(3) — — — —
Net transportation and distribution (100) (177) (89) (191)
Operating, selling and general (422) (1 582) (2 004) (360) (1 585) (1 945)
Operating, selling and general adjustment(4) 99 294 101 317
Net operating expenses (323) (1 288) (259) (1 268)
Gross profit 604 1 441 518 1 595
Sales volumes (mbbls) 17 888 38 507 16 700 39 489
Operating netback per barrel 33.82 37.44 31.00 40.45
March 31, 2021 December 31, 2020
For the quarter ended BitumenSCO and
DieselOil SandsSegment Bitumen
SCO andDiesel
Oil SandsSegment
Operating revenues 1 004 3 347 4 351 638 2 443 3 081
Other (loss) income 7 (9) (2) (9) (4) (13)
Purchases of crude oil and products (203) (47) (250) (128) (47) (175)
Gross realization adjustment(2) (35) (74) (63) (51)
Gross realizations 773 3 217 438 2 341
Royalties (14) (144) (158) (4) (14) (18)
Transportation and distribution (82) (194) (276) (256) (170) (426)
Transportation and distribution adjustment(3) — — 189 —
Net transportation and distribution (82) (194) (67) (170)
Operating, selling and general (325) (1 648) (1 973) (261) (1 478) (1 739)
Operating, selling and general adjustment(4) 100 413 6 250
Net operating expenses (225) (1 235) (255) (1 228)
Gross profit 452 1 644 112 929
Sales volumes (mbbls) 16 246 46 343 12 837 45 601
Operating netback per barrel 27.82 35.48 8.81 20.34
(A) Non-GAAP financial measures. See the Operating Summary Information – Non-GAAP Financial Measures section of this Quarterly Report.
(C) Impact of inventory write-down is excluded until product is sold.
See accompanying footnotes and definitions to the quarterly operating summaries.
2021 Third Quarter Suncor Energy Inc. 67

Quarterly Operating Metrics Reconciliation (continued)
(unaudited)
Oil Sands Netbacks(A)(C)
($ millions, except per barrel amounts)
September 30, 2020
For the quarter ended BitumenSCO and
DieselOil SandsSegment
Operating revenues 527 2 040 2 567
Other (loss) income 23 17 40
Purchases of crude oil and products (143) (28) (171)
Gross realization adjustment(2) (83) (69)
Gross realizations 324 1 960
Royalties (4) (32) (36)
Transportation and distribution (61) (175) (236)
Transportation and distribution adjustment(3) 3 —
Net transportation and distribution (58) (175)
Operating, selling and general (190) (1 460) (1 650)
Operating, selling and general adjustment(4) (5) 243
Net operating expenses (195) (1 217)
Gross Profit 67 536
Sales volumes (mbbls) 10 949 38 646
Operating netback per barrel 6.07 13.87
September 30, 2021 September 30, 2020
For the nine months ended BitumenSCO and
DieselOil SandsSegment Bitumen
SCO andDiesel
Oil SandsSegment
Operating revenues 3 969 9 995 13 964 1 405 6 131 7 536
Other (loss) income (63) 58 (5) 30 281 311
Purchases of crude oil and products (911) (126) (1 037) (574) (95) (669)
Gross realization adjustment(2) (122) (233) 9 (407)
Gross realizations 2 873 9 694 870 5 910
Royalties (221) (661) (882) (15) (62) (77)
Transportation and distribution (271) (562) (833) (220) (577) (797)
Transportation and distribution adjustment(3) — — 8 —
Net transportation and distribution (271) (562) (212) (577)
Operating, selling and general (1 107) (4 815) (5 922) (768) (4 662) (5 430)
Operating, selling and general adjustment(4) 300 1 024 97 849
Net operating expenses (807) (3 791) (671) (3 813)
Gross profit (loss) 1 574 4 680 (28) 1 458
Sales volumes (mbbls) 50 834 124 339 33 143 125 610
Operating netback per barrel 30.98 37.65 (0.74) 11.61
(A) Non-GAAP financial measures. See the Operating Summary Information – Non-GAAP Financial Measures section of this Quarterly Report.
(C) Impact of inventory write-down is excluded until product is sold.
See accompanying footnotes and definitions to the quarterly operating summaries.
68 2021 Third Quarter Suncor Energy Inc.

Quarterly Operating Metrics Reconciliation (continued)
(unaudited)
Oil Sands Netbacks(A)(C)
($ millions, except per barrel amounts)
December 31, 2020
For the year ended BitumenSCO and
DieselOil SandsSegment
Operating revenues 2 043 8 574 10 617
Other income 21 277 298
Purchases of crude oil and products (702) (142) (844)
Gross realization adjustment(2) (54) (458)
Gross realizations 1 308 8 251
Royalties (15) (76) (91)
Transportation and distribution (476) (747) (1 223)
Transportation and distribution adjustment(3) 197 —
Net transportation and distribution (279) (747)
Operating, selling and general (1 029) (6 140) (7 169)
Operating, selling and general adjustment(4) 103 1 099
Net operating expenses (926) (5 041)
Gross profit 88 2 387
Sales volumes (mbbls) 45 980 171 211
Operating netback per barrel 1.91 13.93
(A) Non-GAAP financial measures. See the Operating Summary Information – Non-GAAP Financial Measures section of this Quarterly Report.
(C) Impact of inventory write-down is excluded until product is sold.
See accompanying footnotes and definitions to the quarterly operating summaries.
2021 Third Quarter Suncor Energy Inc. 69

Quarterly Operating Metrics Reconciliation (continued)
(unaudited)
Exploration and Production Netbacks(A)
($ millions, except per barrel amounts)
September 30, 2021 June 30, 2021
For the quarter ended InternationalEast Coast
Canada Other(6)E&P
Segment InternationalEast Coast
Canada Other(6)E&P
Segment
Operating revenues 185 427 132 744 211 518 177 906
Royalties — (55) (54) (109) — (84) (134) (218)
Transportation anddistribution (8) (13) (2) (23) (4) (10) (6) (20)
Operating, selling andgeneral (29) (66) (6) (101) (43) (75) (4) (122)
Non-production costs(7) 7 9 8 11
Gross profit 155 302 172 360
Sales volumes (mboe) 2 058 4 613 2 619 6 301
Operating netback perbarrel 74.99 65.48 65.62 57.12
March 31, 2021 December 31, 2020
For the quarter ended InternationalEast Coast
Canada Other(6)E&P
Segment InternationalEast Coast
Canada Other(6)E&P
Segment
Operating revenues 204 361 25 590 193 299 63 555
Royalties — (44) — (44) — (36) (49) (85)
Transportation anddistribution (7) (10) (35) (52) (7) (12) (1) (20)
Operating, selling andgeneral (33) (66) (11) (110) (32) (71) (11) (114)
Non-production costs(7) 10 12 5 6
Gross profit 174 253 159 186
Sales volumes (mboe) 2 828 4 748 3 511 5 294
Operating netback perbarrel 61.46 53.40 45.32 35.21
September 30, 2020
For the quarter ended InternationalEast Coast
Canada Other(6)E&P
Segment
Operating revenues 201 311 — 512
Royalties — (30) — (30)
Transportation and distribution (9) (15) — (24)
Operating, selling and general (33) (77) (8) (118)
Non-production costs(7) 7 8
Gross profit 166 197
Sales volumes (mboe) 3 552 5 281
Operating netback per barrel 46.77 37.28
(A) Non-GAAP financial measures. See the Operating Summary Information – Non-GAAP Financial Measures section of this Quarterly Report.
See accompanying footnotes and definitions to the quarterly operating summaries.
70 2021 Third Quarter Suncor Energy Inc.

Quarterly Operating Metrics Reconciliation (continued)
(unaudited)
Exploration and Production Netbacks(A)
($ millions, except per barrel amounts)
September 30, 2021 September 30, 2020
For the nine monthsended International(G)
East CoastCanada Other(6)
E&PSegment International(G)
East CoastCanada Other(6)
E&PSegment
Operating revenues 600 1 306 334 2 240 616 853 (125) 1 344
Royalties — (183) (188) (371) — (58) — (58)
Transportation anddistribution (19) (33) (43) (95) (27) (53) — (80)
Operating, sellingand general (105) (207) (21) (333) (99) (230) (33) (362)
Non-productioncosts(7) 25 32 16 27
Gross profit 501 915 506 539
Sales volumes(mboe) 7 505 15 662 11 895 16 585
Operating netbackper barrel 66.62 58.45 42.60 32.51
December 31, 2020
For the year ended InternationalEast Coast
Canada Other(6)E&P
Segment
Operating revenues 809 1 152 (62) 1 899
Royalties — (94) (49) (143)
Transportation and distribution (34) (65) (1) (100)
Operating, selling and general (131) (301) (44) (476)
Non-production costs(7) 21 33
Gross profit 665 725
Sales volumes (mboe) 15 406 21 879
Operating netback per barrel 43.22 33.16
(A) Non-GAAP financial measures. See the Operating Summary Information – Non-GAAP Financial Measures section of this Quarterly Report.
See accompanying footnotes and definitions to the quarterly operating summaries.
2021 Third Quarter Suncor Energy Inc. 71

Quarterly Operating Metrics Reconciliation (continued)
(unaudited)
Refining and Marketing(A)
($ millions, except as noted)
Three months ended Nine months ended
Twelvemonths
ended
Refining and marketing margin reconciliationSep 30
2021Jun 30
2021Mar 31
2021Dec 31
2020Sep 30
2020Sep 30
2021Sep 30
2020Dec 31
2020
Operating revenues 6 341 4 938 5 013 3 876 4 050 16 292 11 396 15 272
Purchases of crude oil and products (4 710) (3 712) (3 275) (2 744) (2 840) (11 697) (8 499) (11 243)
Total gross margin 1 631 1 226 1 738 1 132 1 210 4 595 2 897 4 029
Other (loss) income (9) 6 (45) (10) (2) (48) 58 48
Non-refining and marketing margin(8) (13) (14) (13) (14) (14) (40) (43) (57)
Refining and marketing gross margin(A) 1 609 1 218 1 680 1 108 1 194 4 507 2 912 4 020
Refinery production (mbbls)(9) 45 008 32 053 41 211 43 036 38 857 118 272 115 955 158 991
Refining and marketing grossmargin – FIFO ($/bbl)(A) 35.75 38.00 40.75 25.75 30.75 38.10 25.10 25.30
FIFO adjustment (91) (288) (432) (30) (223) (811) 562 532
Refining and marketing grossmargin – LIFO(A) 1 518 930 1 248 1 078 971 3 696 3 474 4 552
Refining and marketing grossmargin – LIFO ($/bbl)(A)(E)(F) 33.80 29.05 30.30 25.05 25.00 31.25 29.95 28.65
Rack forward margin(G)
Refining and marketing gross margin(A) 1 609 1 218 1 680 1 108 1 194 4 507 2 912 4 020
Refining and supply gross margin (1 225) (820) (1 351) (728) (796) (3 396) (2 304) (2 634)
Rack forward gross margin(10) 384 398 329 380 398 1 111 608 1 386
Sales volume (ML) 5 414 4 791 4 866 4 918 5 285 15 071 14 585 19 503
Rack forward gross margin (cpl)(A) 7.08 8.30 6.75 7.70 7.50 7.35 6.90 7.10
Refining operating expensereconciliation
Refining operating expense 246 213 237 224 210 696 650 874
Rack forward operating expense 151 148 136 148 143 435 424 572
Other operating expenses(G)(11) 105 111 106 100 64 322 213 313
Operating, selling and general(H) 502 472 479 472 417 1,453 1 287 1 759
Refinery production (mbbls)(9) 45 026 32 050 41 211 43 036 38 857 118 287 115 955 158 991
Refining operating expense ($/bbl)(A) 5.45 6.65 5.75 5.20 5.40 5.90 5.60 5.50
Rack forward operating expense(G)
Rack forward operating expense 151 148 136 148 143 435 424 572
Sales volume (ML) 5 414 4,791 4,866 4,918 5,285 15 071 14 585 19 503
Rack forward operating expense(cpl)(A) 2.80 3.10 2.80 3.00 2.70 2.90 2.90 2.95
(A) Non-GAAP financial measures. See the Operating Summary Information – Non-GAAP Financial Measures section of this Quarterly Report.
(E) Refining and marketing margin – LIFO excludes the impact of short-term risk management activities.
(F) The Suncor 5-2-2-1 index is most comparable to the company’s realized refining and marketing margin presented on a LIFO basis.
(G) In Q2 2021, the company began disclosing refinery rack forward margin and operating expenses to increase transparency into Suncor’s integratedmodel and aligns with how management evaluates the performance of the business. Rack forward encompasses Suncor’s retail and wholesalebusiness. As an integrated oil and gas company, transfer prices are used to attribute margin to the value chain. The company’s transfer pricesaffecting the refining, supply and rack forward businesses employ replacement cost methodology, which may differ from those subject to supplyagreements negotiated by independent market participants. Rack Forward margins may include any incremental location differentials abovereplacement supply cost, as well as the applicable retail and wholesale channel margins generated within those markets.
(H) Prior period amounts of operating, selling and general expense have been reclassified to align with the current year presentation of transportationand distribution expense. This reclassification had no effect on the refining operating expense.
See accompanying footnotes and definitions to the quarterly operating summaries.
72 2021 Third Quarter Suncor Energy Inc.

Quarterly Operating Metrics Reconciliation (continued)
(unaudited)
Refining and Marketing(A)
Suncor custom 5-2-2-1 index(12)
(US$/bbl, except as noted) Three months ended Nine months ended
Twelvemonths
ended
(average for the three months, nine months and twelve months ended)Sep 30
2021Jun 30
2021Mar 31
2021Dec 31
2020Sep 30
2020Sep 30
2021Sep 30
2020Dec 31
2020
WTI crude oil at Cushing 70.55 66.05 57.80 42.65 40.95 64.85 38.30 39.40
SYN crude oil at Edmonton 68.95 66.40 54.30 39.60 38.50 63.25 35.10 36.25
WCS at Hardisty 56.95 54.60 45.40 33.35 31.90 52.35 24.65 26.85
New York Harbor 2-1-1 crack(I) 20.90 20.35 15.60 9.85 10.20 18.95 12.40 11.75
Chicago 2-1-1 crack(I) 20.45 20.25 13.40 7.95 7.75 18.05 8.10 8.05
Product value
New York Harbor 2-1-1 crack(J) 40% 36.60 34.55 29.35 21.00 20.45 33.50 20.30 20.45
Chicago 2-1-1 crack(K) 40% 36.40 34.50 28.50 20.25 19.50 33.15 18.55 19.00
WTI 20% 14.10 13.20 11.55 8.55 8.20 12.95 7.65 7.90
Seasonality factor 5.00 5.00 6.50 6.50 5.00 5.50 5.50 5.75
92.10 87.25 75.90 56.30 53.15 85.10 52.00 53.10
Crude value
SYN 40% 27.60 26.55 21.70 15.85 15.40 25.30 14.05 14.50
WCS 40% 22.80 21.85 18.15 13.35 12.75 20.95 9.85 10.75
WTI 20% 14.10 13.20 11.55 8.55 8.20 12.95 7.65 7.90
64.50 61.60 51.40 37.75 36.35 59.20 31.55 33.15
Suncor custom 5-2-2-1 index 27.60 25.65 24.50 18.55 16.80 25.90 20.45 19.95
Suncor custom 5-2-2-1 index (Cdn$/bbl)(F) 34.80 31.50 31.05 24.50 22.35 32.40 27.70 26.75
(A) Non-GAAP financial measures. See the Operating Summary Information – Non-GAAP Financial Measures section of this Quarterly Report.
(F) The Suncor 5-2-2-1 index is most comparable to the company’s realized refining and marketing margin presented on a LIFO basis.
(I) 2-1-1 crack spreads are indicators of the refining margin generated by converting two barrels of WTI into one barrel of gasoline and one barrel of
diesel.
( J) Product value of the New York Harbor 2-1-1 crack is calculated by adding the values of the New York Harbor 2-1-1 crack and WTI, multiplying it by
40% and rounding to the nearest nickel.
(K) Product value of the Chicago 2-1-1 crack is calculated by adding the values of the Chicago 2-1-1 crack and WTI, multiplying it by 40% and rounding
to the nearest nickel.
See accompanying footnotes and definitions to the quarterly operating summaries.
2021 Third Quarter Suncor Energy Inc. 73

Operating Summary Information
Non-GAAP Financial Measures
Certain financial measures in this document – namely operating earnings (loss), funds from (used in) operations, return on capital
employed (ROCE), Oil Sands operations cash operating costs, Fort Hills cash operating costs, Syncrude cash operating costs, refining
and marketing gross margin, rack forward gross margin, refining operating expense, rack forward operating expense and
netbacks – are not prescribed by generally accepted accounting principles (GAAP). Suncor uses this information to analyze business
performance, leverage and liquidity and includes these financial measures because investors may find such measures useful on the
same basis. These non-GAAP financial measures do not have any standardized meaning and, therefore, are unlikely to be comparable
to similar measures presented by other companies. The additional information should not be considered in isolation or as a substitute
for measures of performance prepared in accordance with GAAP.
Operating earnings (loss), Oil Sands operations cash operating costs, Fort Hills cash operating costs and Syncrude cash operating
costs are defined in the Non-GAAP Financial Measures Advisory section and reconciled to GAAP measures in the Consolidated Financial
Information and Segment Results and Analysis sections of each respective quarterly Report to Shareholders issued by Suncor in
respect of the relevant quarter (Quarterly Reports). Funds from (used in) operations and ROCE are defined and reconciled to GAAP
measures in the Non-GAAP Financial Measures Advisory section of each respective Quarterly Report. Refining and marketing gross
margin, rack forward gross margin, refining operating expense and rack forward operating expense are defined in the Non-GAAP
Financial Measures Advisory section and reconciled to GAAP measures in the Operating Metrics Reconciliation section of each
respective Quarterly Report. Netbacks are defined below and are reconciled to GAAP measures in the Quarterly Operating Metrics
Reconciliation section of each respective Quarterly Report. The remainder of the non-GAAP financial measures not otherwise mentioned
in this paragraph are defined and reconciled in this Quarterly Report.
Oil Sands Netbacks
Oil Sands operating netbacks are a non-GAAP measure, presented on a crude product and sales barrel basis, and are derived from
the Oil Sands segmented statement of net earnings (loss), after adjusting for items not directly attributable to the revenues and costs
associated with production and delivery. Management uses Oil Sands operating netbacks to measure crude product profitability on
a sales barrel basis.
Exploration and Production (E&P) Netbacks
E&P netbacks are a non-GAAP measure, presented on an asset location and sales barrel basis, and are derived from the E&P
segmented statement of net earnings (loss), after adjusting for items not directly attributable to the revenues and costs associated
with production and delivery. Management uses E&P netbacks to measure asset profitability by location on a sales barrel basis.
Definitions
(1) Cash operating costs are calculated by adjusting Oil Sands segment operating, selling and general expense for i) non-production costs that
management believes do not relate to production performance, including, but not limited to, share-based compensation adjustments, Canada’s
Emergency Wage Subsidy (CEWS) and COVID-19 related costs, research costs, adjustments to reflect the cost of internal transfers in the receiving
asset at the cost of production and the expense recorded as part of a non-monetary arrangement involving a third-party processor; ii) revenues
associated with excess capacity, including excess power generated and sold that is recorded in operating revenue; iii) project startup costs; and
iv) the impacts of changes in inventory levels and valuation, such that the company is able to present cost information based on production volumes.
Oil Sands operations and Syncrude production volumes are gross of internally consumed diesel and feedstock transfers between assets through
the interconnecting pipelines.
(2) Reflects the items not directly attributed to revenues received from the sale of proprietary crude and net non-proprietary activity at its deemed
point of sale.
(3) Reflects adjustments for expenses or credits not directly related to the transportation of the crude product to its deemed point of sale.
(4) Reflects adjustments for general and administrative costs not directly attributed to the production of each crude product type, as well as the
revenues associated with excess power from cogeneration units.
(5) Reflects adjustments for royalties not related to crude products.
(6) Reflects other E&P assets, such as Libya, for which netbacks are not provided.
(7) Reflects adjustments for general and administrative costs not directly attributed to production.
(8) Reflects adjustments for intersegment marketing fees and impact of inventory write-downs.
(9) Refinery production is the output of the refining process and differs from crude oil processed as a result of volumetric adjustments for non-crude
feedstock, volumetric gain associated with the refining process and changes in unfinished product inventories.
(10) Rack forward operating revenues, other income less purchases of crude oil and products.
(11) Reflects operating, selling and general expenses associated with the company’s ethanol businesses, certain general and administrative costs not
directly attributable to refinery production, and CEWS amounts.
74 2021 Third Quarter Suncor Energy Inc.

(12) The custom 5-2-2-1 index is designed to represent Suncor’s Refining and Marketing business based on publicly available pricing data and
approximates the gross margin on five barrels of crude oil of varying grades that is refined to produce two barrels of both gasoline and distillate
and one barrel of secondary product. The index is a single value that is calculated by taking the product value of refined products less the crude value
of refinery feedstock incorporating the company’s refining, product supply and rack forward businesses, but excluding the impact of first-in, first-
out accounting. The product value is influenced by New York Harbor 2-1-1 crack, Chicago 2-1-1 crack, WTI benchmarks and seasonal factors. The
seasonal factor is an estimate and reflects the location, quality and grade differentials for refined products sold in the company’s core markets during
the winter and summer months. The crude value is influenced by SYN, WCS and WTI benchmarks.
Explanatory Notes
* Users are cautioned that the Oil Sands operations, Fort Hills and Syncrude cash operating costs per barrel measures may not be fully comparable
to one another or to similar information calculated by other entities due to differing operations of each entity as well as other entities’ respective
accounting policy choices.
Abbreviations
bbl – barrel
bbls/d – barrels per day
mbbls – thousands of barrels
mbbls/d – thousands of barrels per day
boe – barrels of oil equivalent
boe/d – barrels of oil equivalent per day
mboe – thousands of barrels of oil equivalent
mboe/d – thousands of barrels of oil equivalent per day
cpl – cents per litre
ML – million of litres
WTI – West Texas intermediate
SYN – sweet synthetic crude oil
WCS – Western Canadian Select
Metric Conversion
1 m3 (cubic metre) = approximately 6.29 barrels
2021 Third Quarter Suncor Energy Inc. 75

Suncor Energy Inc.
150 – 6 Avenue S.W., Calgary, Alberta, Canada T2P 3E3
T: 403-296-8000
Suncor.com