third quarter 2019 earnings presentation
TRANSCRIPT
© Subsea 7 - 20191 subsea7.com
Third Quarter 2019Earnings Presentation
7 November 2019
© Subsea 7 - 20192 subsea7.com
Forward-looking statements
Certain statements made in this presentation may include ‘forward-looking statements’. These statements may be identified by the use of words like ‘anticipate’, ‘believe’, ‘could’, ‘estimate’, ‘expect’, ‘forecast’, ‘intend’, ‘may’, ‘might’, ‘plan’, ‘predict’, ‘project’, ‘scheduled’, ‘seek’, ‘should’, ‘will’, and similar expressions. The forward-looking statements reflect our current views and are subject to risks, uncertainties and assumptions. The principal risks and uncertainties which could impact the Group and the factors which could affect the actual results are described but not limited to those in the ‘Risk Management’ section in the Group’s Annual Report and Consolidated Financial Statements for the year ended 31 December 2018. These factors, and others which are discussed in our public announcements, are among those that may cause actual and future results and trends to differ materially from our forward-looking statements: actions by regulatory authorities or other third parties; our ability to recover costs on significant projects; the general economic conditions and competition in the markets and businesses in which we operate; our relationship with significant clients; the outcome of legal and administrative proceedings or governmental enquiries; uncertainties inherent in operating internationally; the timely delivery of vessels on order; the impact of laws and regulations; and operating hazards, including spills and environmental damage. Many of these factors are beyond our ability to control or predict. Other unknown or unpredictable factors could also have material adverse effects on our future results. Given these factors, you should not place undue reliance on the forward-looking statements.
© Subsea 7 - 20193 subsea7.com
Third Quarter 2019
Jean Cahuzac, CEO
- Highlights
Ricardo Rosa, CFO
- Financial performance
Jean Cahuzac, CEO
- Outlook
- Q&A
© Subsea 7 - 20194 subsea7.com
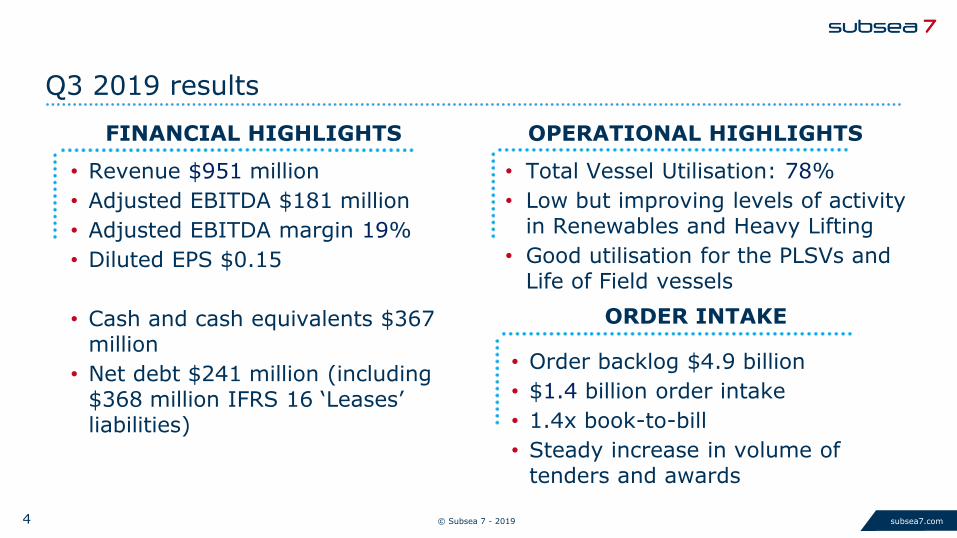
Q3 2019 results
OPERATIONAL HIGHLIGHTS
• Total Vessel Utilisation: 78%
• Low but improving levels of activity in Renewables and Heavy Lifting
• Good utilisation for the PLSVs and Life of Field vessels
ORDER INTAKE
• Order backlog $4.9 billion
• $1.4 billion order intake
• 1.4x book-to-bill
• Steady increase in volume of tenders and awards
FINANCIAL HIGHLIGHTS
• Revenue $951 million
• Adjusted EBITDA $181 million
• Adjusted EBITDA margin 19%
• Diluted EPS $0.15
• Cash and cash equivalents $367 million
• Net debt $241 million (including $368 million IFRS 16 ‘Leases’ liabilities)
© Subsea 7 - 20195 subsea7.com
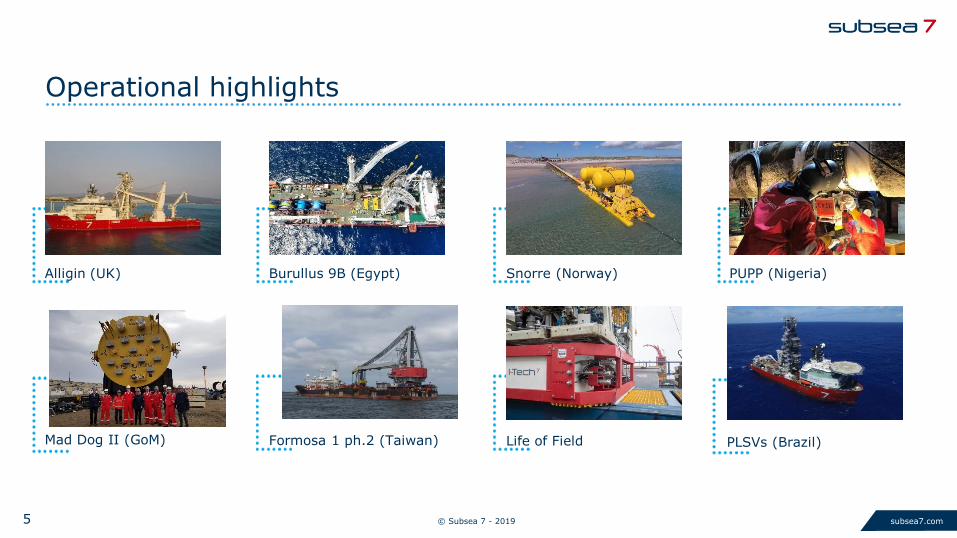
Operational highlights
Alligin (UK) Burullus 9B (Egypt) Snorre (Norway) PUPP (Nigeria)
Mad Dog II (GoM) Formosa 1 ph.2 (Taiwan) Life of Field PLSVs (Brazil)
To be updated
© Subsea 7 - 20196 subsea7.com
PLSVs in Brazil
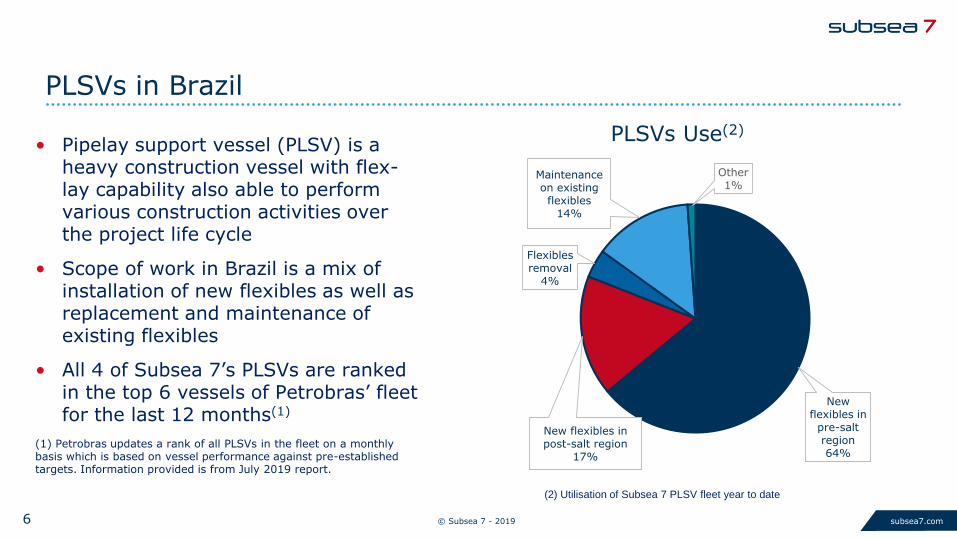
PLSVs Use(2)
New flexibles in
pre-salt region64%
New flexibles in post-salt region
17%
Flexibles removal
4%
Maintenance on existing flexibles
14%
Other1%
• Pipelay support vessel (PLSV) is a heavy construction vessel with flex-lay capability also able to perform various construction activities over the project life cycle
• Scope of work in Brazil is a mix of installation of new flexibles as well as replacement and maintenance of existing flexibles
• All 4 of Subsea 7’s PLSVs are ranked in the top 6 vessels of Petrobras’ fleet for the last 12 months(1)
(1) Petrobras updates a rank of all PLSVs in the fleet on a monthly basis which is based on vessel performance against pre-established targets. Information provided is from July 2019 report.
(2) Utilisation of Subsea 7 PLSV fleet year to date
© Subsea 7 - 20197 subsea7.com
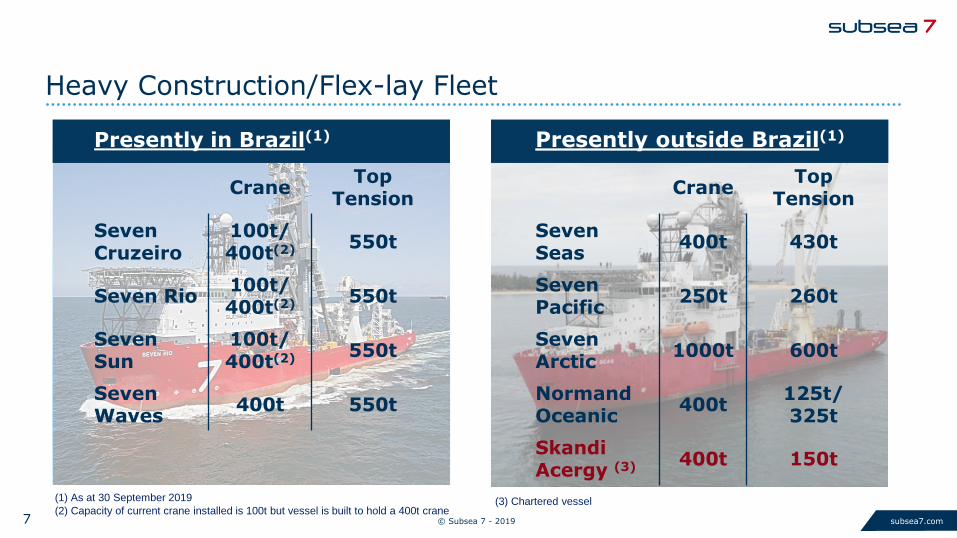
Heavy Construction/Flex-lay Fleet
(1) As at 30 September 2019 (3) Chartered vessel
Presently in Brazil(1)
CraneTop
Tension
Seven Cruzeiro
100t/400t(2) 550t
Seven Rio100t/400t(2) 550t
Seven Sun
100t/400t(2) 550t
Seven Waves
400t 550t
Presently outside Brazil(1)
CraneTop
Tension
Seven Seas
400t 430t
Seven Pacific
250t 260t
Seven Arctic
1000t 600t
Normand Oceanic
400t125t/325t
SkandiAcergy (3) 400t 150t
(2) Capacity of current crane installed is 100t but vessel is built to hold a 400t crane
© Subsea 7 - 20198 subsea7.com
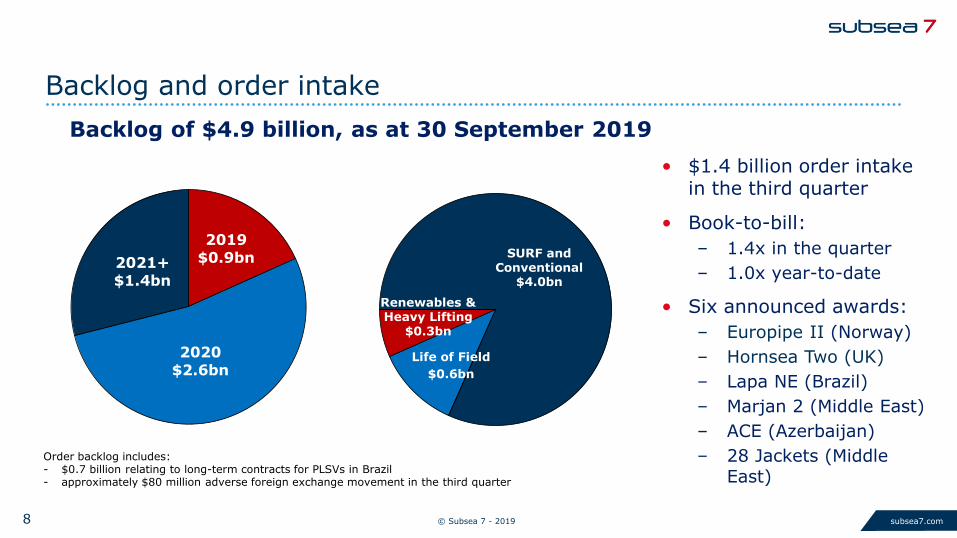
Backlog and order intake
2019
$0.9bn
2020
$2.6bn
2021+
$1.4bn
Life of Field
$0.6bn
Renewables & Heavy Lifting
$0.3bn
Order backlog includes: - $0.7 billion relating to long-term contracts for PLSVs in Brazil - approximately $80 million adverse foreign exchange movement in the third quarter
SURF and Conventional
$4.0bn
Backlog of $4.9 billion, as at 30 September 2019
• $1.4 billion order intake in the third quarter
• Book-to-bill:
– 1.4x in the quarter
– 1.0x year-to-date
• Six announced awards:
– Europipe II (Norway)
– Hornsea Two (UK)
– Lapa NE (Brazil)
– Marjan 2 (Middle East)
– ACE (Azerbaijan)
– 28 Jackets (Middle East)
© Subsea 7 - 20199 subsea7.com
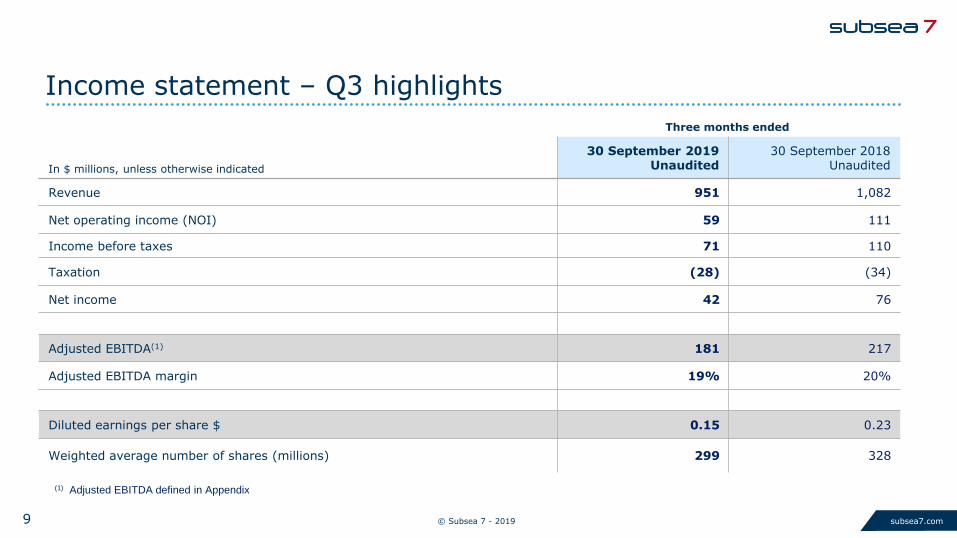
Three months ended
In $ millions, unless otherwise indicated
30 September 2019Unaudited
30 September 2018Unaudited
Revenue 951 1,082
Net operating income (NOI) 59 111
Income before taxes 71 110
Taxation (28) (34)
Net income 42 76
Adjusted EBITDA(1) 181 217
Adjusted EBITDA margin 19% 20%
Diluted earnings per share $ 0.15 0.23
Weighted average number of shares (millions) 299 328
Income statement – Q3 highlights
(1) Adjusted EBITDA defined in Appendix
© Subsea 7 - 201910 subsea7.com
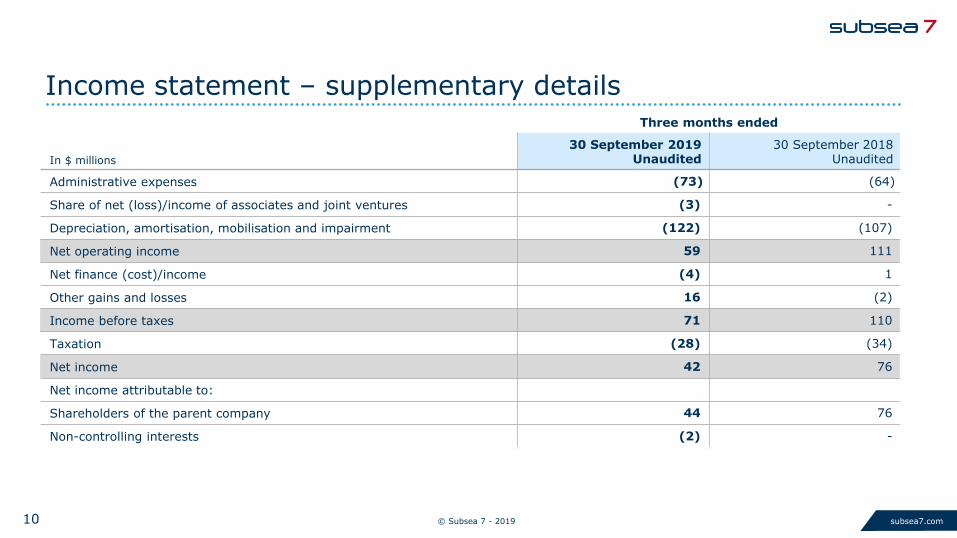
In $ millions
Three months ended
30 September 2019Unaudited
30 September 2018Unaudited
Administrative expenses (73) (64)
Share of net (loss)/income of associates and joint ventures (3) -
Depreciation, amortisation, mobilisation and impairment (122) (107)
Net operating income 59 111
Net finance (cost)/income (4) 1
Other gains and losses 16 (2)
Income before taxes 71 110
Taxation (28) (34)
Net income 42 76
Net income attributable to:
Shareholders of the parent company 44 76
Non-controlling interests (2) -
Income statement – supplementary details
© Subsea 7 - 201911 subsea7.com
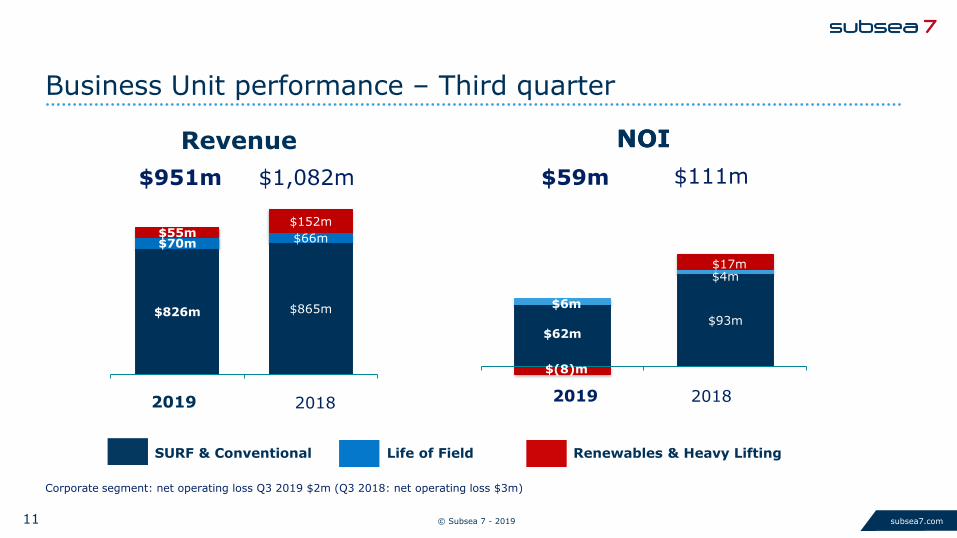
Business Unit performance – Third quarter
Corporate segment: net operating loss Q3 2019 $2m (Q3 2018: net operating loss $3m)
$59m $111m
NOI
$826m $865m
$70m $66m$55m$152m
20182019
$951m
Revenue
$1,082m
SURF & Conventional Life of Field Renewables & Heavy Lifting
2019 2018
NOI
$62m$93m
$6m
$4m
$(8)m
$17m
© Subsea 7 - 201912 subsea7.com
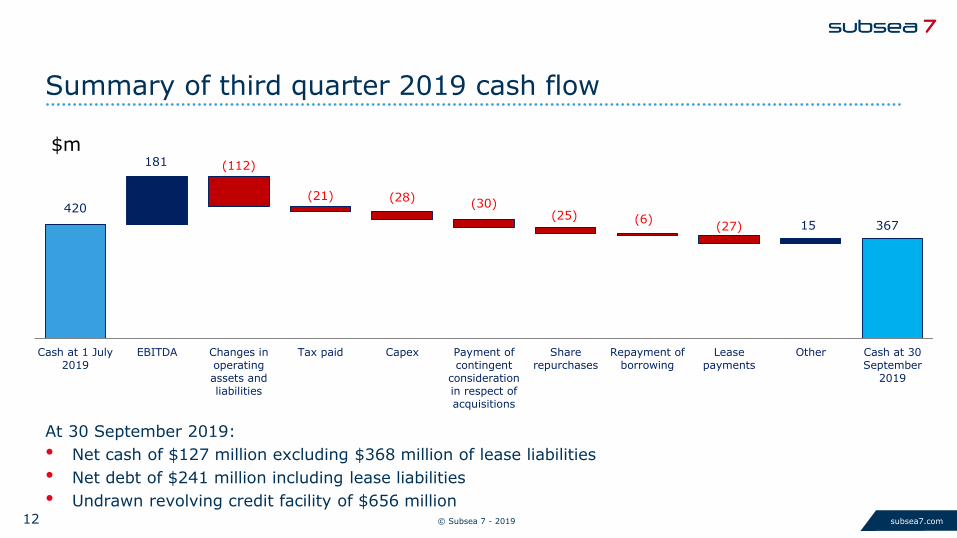
Summary of third quarter 2019 cash flow
$m
At 30 September 2019:
• Net cash of $127 million excluding $368 million of lease liabilities
• Net debt of $241 million including lease liabilities
• Undrawn revolving credit facility of $656 million
420
181 (112)
(21) (28)(30)
(25) (6)(27) 15 367
Cash at 1 July2019
EBITDA Changes inoperatingassets andliabilities
Tax paid Capex Payment ofcontingent
considerationin respect ofacquisitions
Sharerepurchases
Repayment ofborrowing
Leasepayments
Other Cash at 30September
2019
© Subsea 7 - 201913 subsea7.com
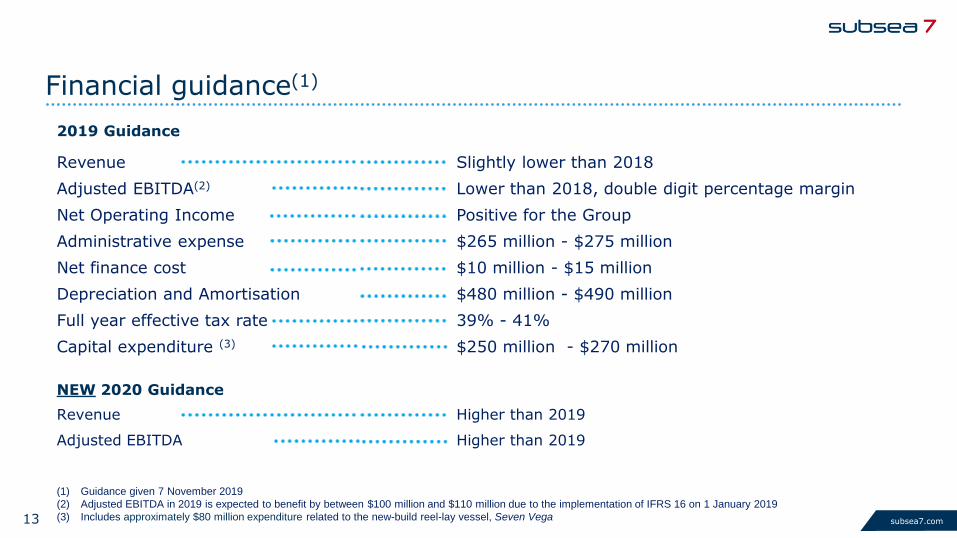
Financial guidance(1)
(1) Guidance given 7 November 2019
(2) Adjusted EBITDA in 2019 is expected to benefit by between $100 million and $110 million due to the implementation of IFRS 16 on 1 January 2019
(3) Includes approximately $80 million expenditure related to the new-build reel-lay vessel, Seven Vega
2019 Guidance
Revenue Slightly lower than 2018
Adjusted EBITDA(2) Lower than 2018, double digit percentage margin
Net Operating Income Positive for the Group
Administrative expense $265 million - $275 million
Net finance cost $10 million - $15 million
Depreciation and Amortisation $480 million - $490 million
Full year effective tax rate 39% - 41%
Capital expenditure (3) $250 million - $270 million
NEW 2020 Guidance
Revenue Higher than 2019
Adjusted EBITDA Higher than 2019
© Subsea 7 - 201914 subsea7.com
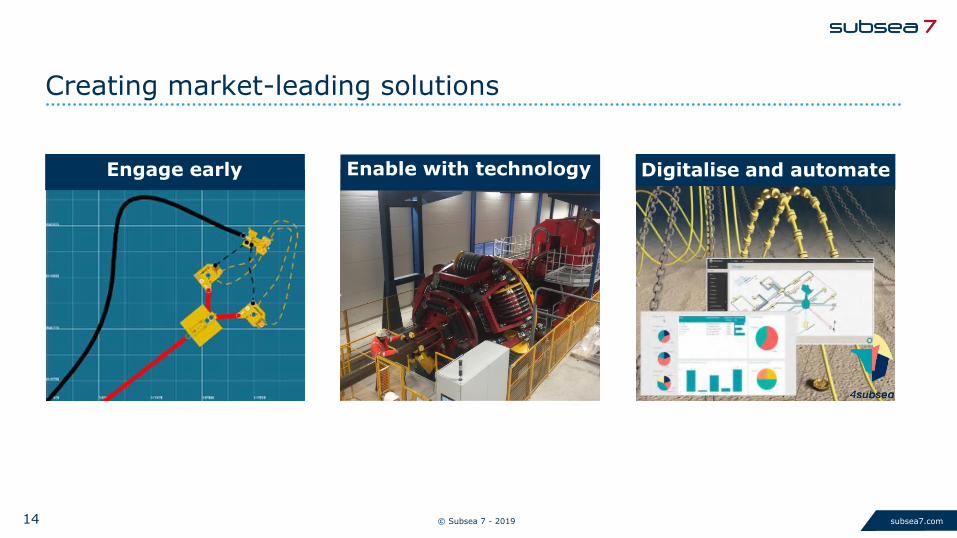
Creating market-leading solutions
Engage early Digitalise and automateEnable with technology
© Subsea 7 - 201915 subsea7.com
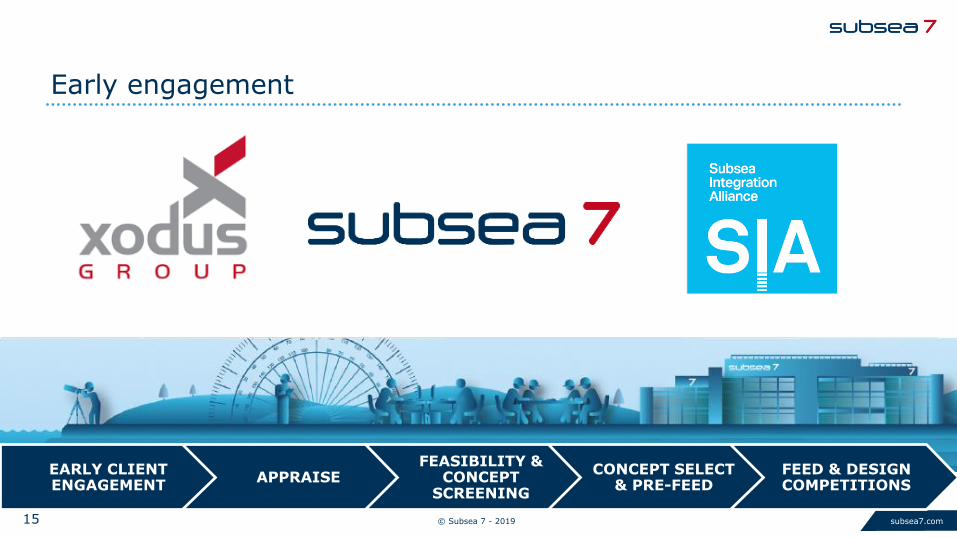
Early engagement
EARLY CLIENT ENGAGEMENT
APPRAISEFEASIBILITY &
CONCEPT SCREENING
CONCEPT SELECT & PRE-FEED
FEED & DESIGN COMPETITIONS
© Subsea 7 - 201916 subsea7.com
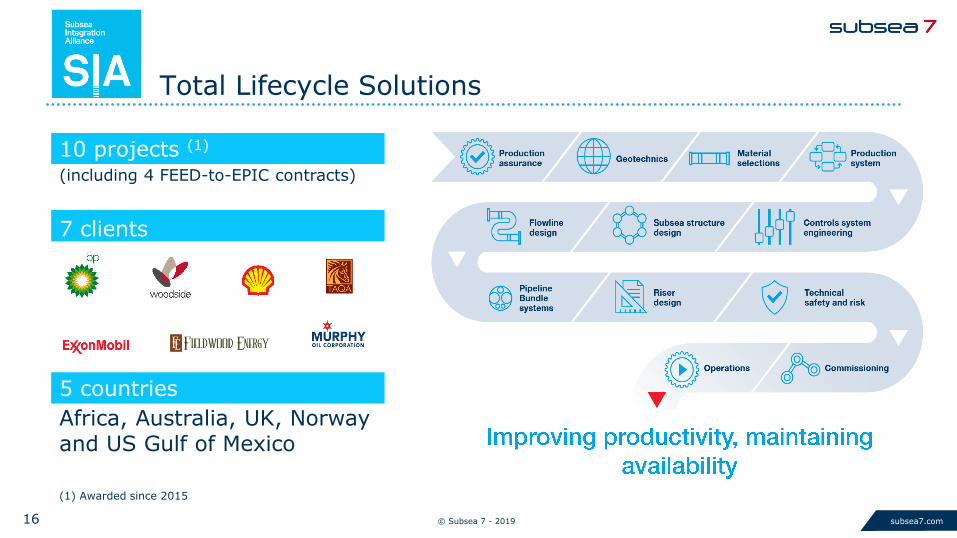
Total Lifecycle Solutions
10 projects (1)
(including 4 FEED-to-EPIC contracts)
7 clients
5 countries
Africa, Australia, UK, Norway and US Gulf of Mexico
(1) Awarded since 2015
© Subsea 7 - 201917 subsea7.com
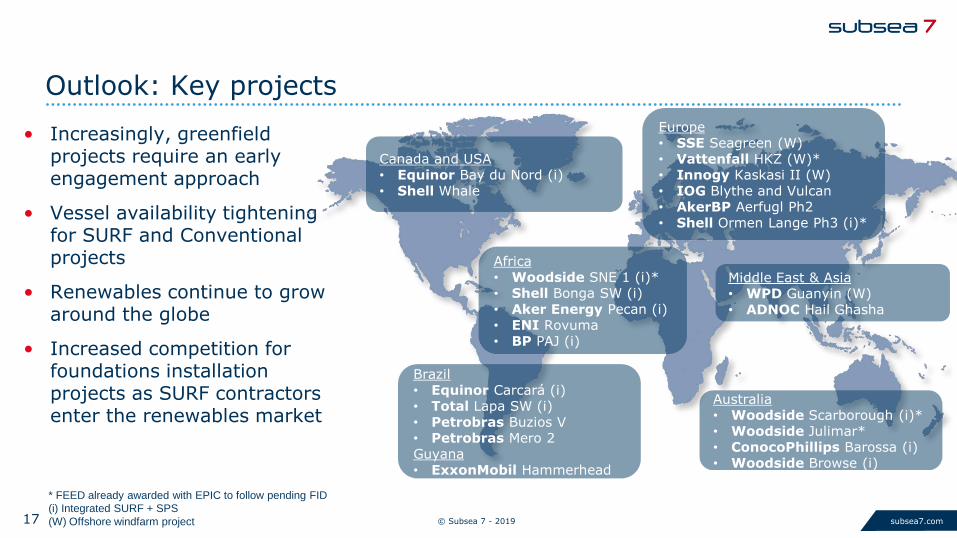
Outlook: Key projects
• Increasingly, greenfield projects require an early engagement approach
• Vessel availability tightening for SURF and Conventional projects
• Renewables continue to grow around the globe
• Increased competition for foundations installation projects as SURF contractors enter the renewables market
Africa• Woodside SNE 1 (i)*• Shell Bonga SW (i)• Aker Energy Pecan (i)• ENI Rovuma• BP PAJ (i)
Brazil• Equinor Carcará (i)• Total Lapa SW (i)• Petrobras Buzios V• Petrobras Mero 2Guyana• ExxonMobil Hammerhead
Australia• Woodside Scarborough (i)*• Woodside Julimar*• ConocoPhillips Barossa (i)• Woodside Browse (i)
* FEED already awarded with EPIC to follow pending FID
(i) Integrated SURF + SPS
(W) Offshore windfarm project
Canada and USA• Equinor Bay du Nord (i)• Shell Whale
Europe• SSE Seagreen (W)• Vattenfall HKZ (W)*• Innogy Kaskasi II (W)• IOG Blythe and Vulcan • AkerBP Aerfugl Ph2• Shell Ormen Lange Ph3 (i)*
Middle East & Asia• WPD Guanyin (W)• ADNOC Hail Ghasha
© Subsea 7 - 201918 subsea7.com
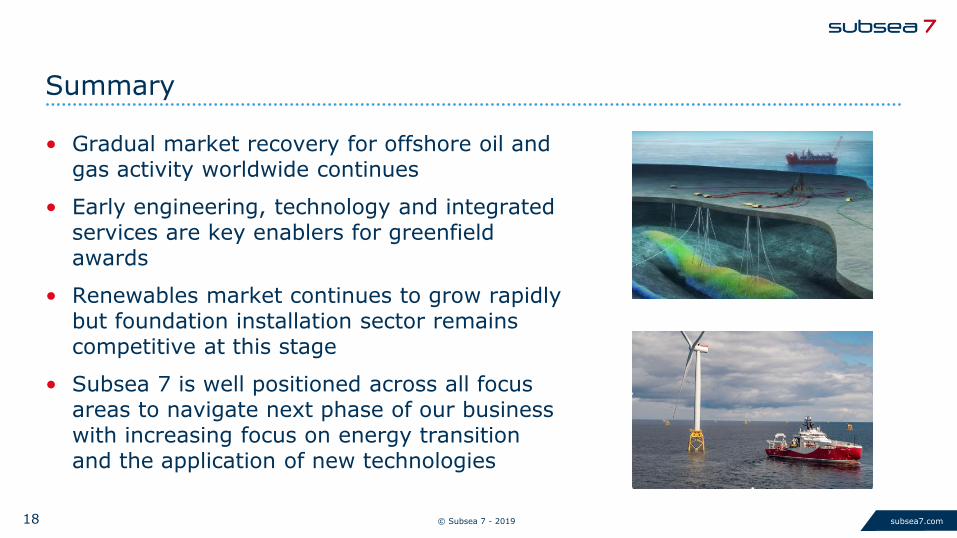
Summary
• Gradual market recovery for offshore oil and gas activity worldwide continues
• Early engineering, technology and integrated services are key enablers for greenfield awards
• Renewables market continues to grow rapidly but foundation installation sector remains competitive at this stage
• Subsea 7 is well positioned across all focus areas to navigate next phase of our business with increasing focus on energy transition and the application of new technologies
© Subsea 7 - 201919 subsea7.com
© Subsea 7 - 201920 subsea7.com
Appendix
Major project progression
Track Record
Fleet
Financial summaries
© Subsea 7 - 201921 subsea7.com
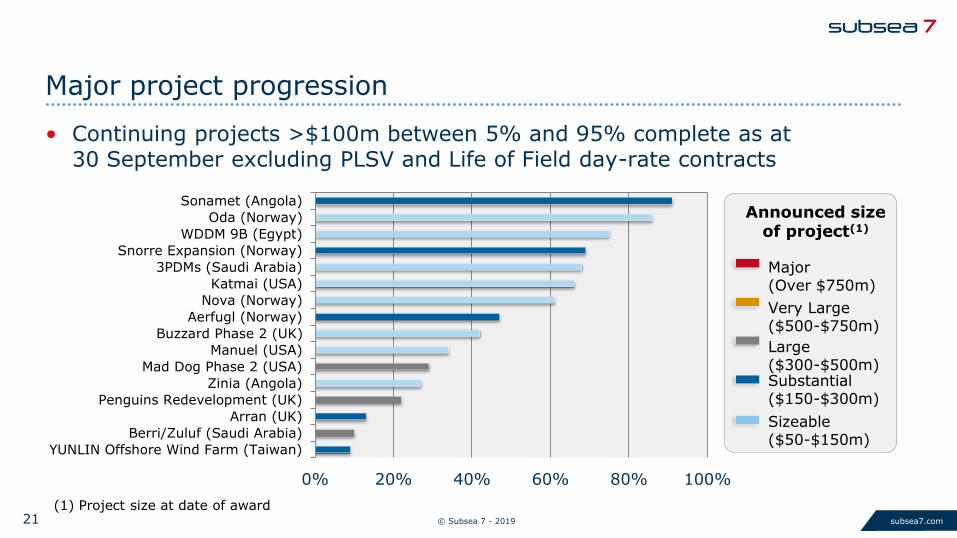
Major project progression
• Continuing projects >$100m between 5% and 95% complete as at 30 September excluding PLSV and Life of Field day-rate contracts
0% 20% 40% 60% 80% 100%
Sonamet (Angola)
Oda (Norway)
WDDM 9B (Egypt)
Snorre Expansion (Norway)
3PDMs (Saudi Arabia)
Katmai (USA)
Nova (Norway)
Aerfugl (Norway)
Buzzard Phase 2 (UK)
Manuel (USA)
Mad Dog Phase 2 (USA)
Zinia (Angola)
Penguins Redevelopment (UK)
Arran (UK)
Berri/Zuluf (Saudi Arabia)
YUNLIN Offshore Wind Farm (Taiwan)
Sizeable ($50-$150m)
Substantial($150-$300m)
Large($300-$500m)
Very Large($500-$750m)
Major(Over $750m)
Announced size of project(1)
(1) Project size at date of award
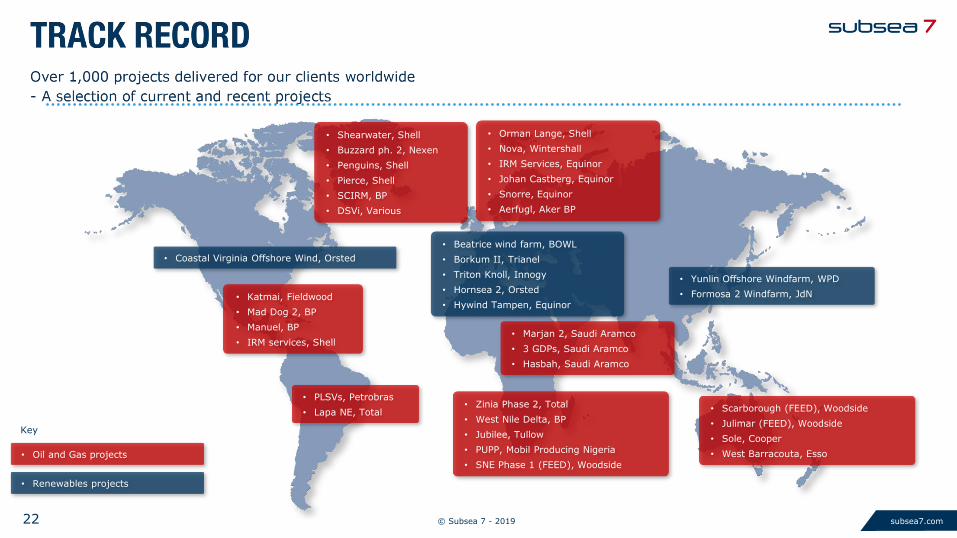
© Subsea 7 - 201922 subsea7.com
• Shearwater, Shell
• Buzzard ph. 2, Nexen
• Penguins, Shell
• Pierce, Shell
• SCIRM, BP
• DSVi, Various
• Katmai, Fieldwood
• Mad Dog 2, BP
• Manuel, BP
• IRM services, Shell
• PLSVs, Petrobras
• Lapa NE, Total• Zinia Phase 2, Total
• West Nile Delta, BP
• Jubilee, Tullow
• PUPP, Mobil Producing Nigeria
• SNE Phase 1 (FEED), Woodside
• Scarborough (FEED), Woodside
• Julimar (FEED), Woodside
• Sole, Cooper
• West Barracouta, Esso
• Orman Lange, Shell
• Nova, Wintershall
• IRM Services, Equinor
• Johan Castberg, Equinor
• Snorre, Equinor
• Aerfugl, Aker BP
• Beatrice wind farm, BOWL
• Borkum II, Trianel
• Triton Knoll, Innogy
• Hornsea 2, Orsted
• Hywind Tampen, Equinor
• Marjan 2, Saudi Aramco
• 3 GDPs, Saudi Aramco
• Hasbah, Saudi Aramco
• Yunlin Offshore Windfarm, WPD
• Formosa 2 Windfarm, JdN
• Oil and Gas projects
• Renewables projects
Key
• Coastal Virginia Offshore Wind, Orsted
© Subsea 7 - 201923 subsea7.com
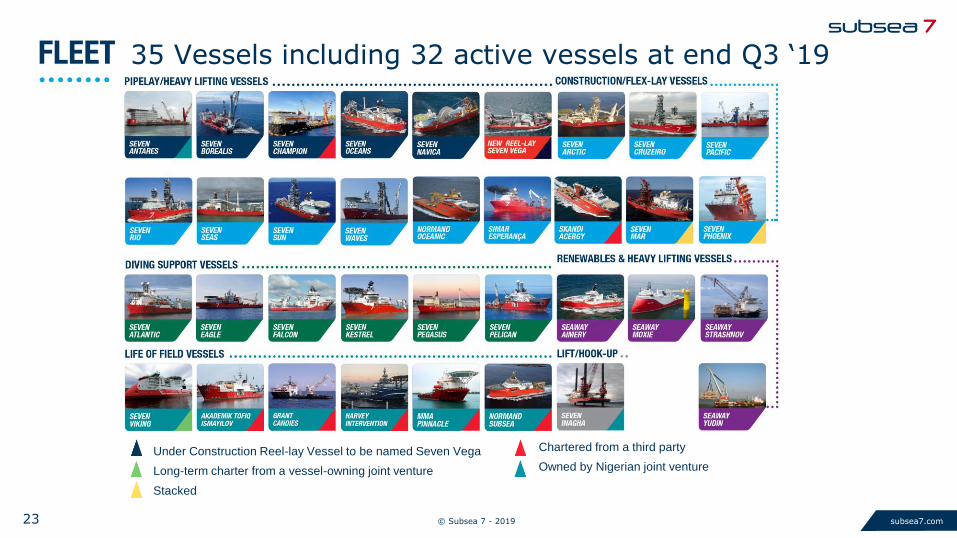
35 Vessels including 32 active vessels at end Q3 ‘19
Under Construction Reel-lay Vessel to be named Seven Vega
Long-term charter from a vessel-owning joint venture
Stacked
Chartered from a third party
Owned by Nigerian joint venture
© Subsea 7 - 201924 subsea7.com
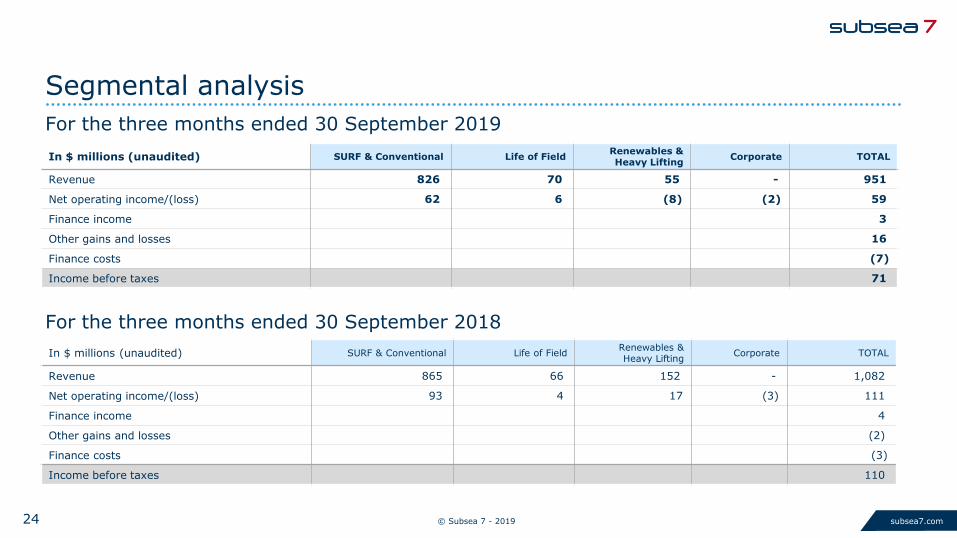
In $ millions (unaudited) SURF & Conventional Life of FieldRenewables & Heavy Lifting
Corporate TOTAL
Revenue 865 66 152 - 1,082
Net operating income/(loss) 93 4 17 (3) 111
Finance income 4
Other gains and losses (2)
Finance costs (3)
Income before taxes 110
In $ millions (unaudited) SURF & Conventional Life of FieldRenewables & Heavy Lifting
Corporate TOTAL
Revenue 826 70 55 - 951
Net operating income/(loss) 62 6 (8) (2) 59
Finance income 3
Other gains and losses 16
Finance costs (7)
Income before taxes 71
Segmental analysis
For the three months ended 30 September 2018
For the three months ended 30 September 2019
© Subsea 7 - 201925 subsea7.com
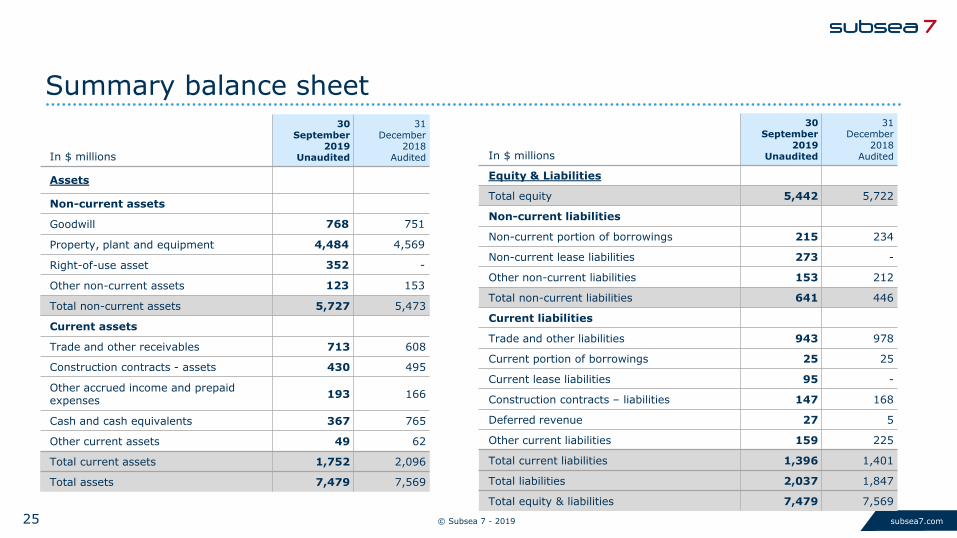
In $ millions
30 September
2019Unaudited
31 December
2018Audited
Assets
Non-current assets
Goodwill 768 751
Property, plant and equipment 4,484 4,569
Right-of-use asset 352 -
Other non-current assets 123 153
Total non-current assets 5,727 5,473
Current assets
Trade and other receivables 713 608
Construction contracts - assets 430 495
Other accrued income and prepaidexpenses
193 166
Cash and cash equivalents 367 765
Other current assets 49 62
Total current assets 1,752 2,096
Total assets 7,479 7,569
Summary balance sheet
In $ millions
30 September
2019Unaudited
31 December
2018Audited
Equity & Liabilities
Total equity 5,442 5,722
Non-current liabilities
Non-current portion of borrowings 215 234
Non-current lease liabilities 273 -
Other non-current liabilities 153 212
Total non-current liabilities 641 446
Current liabilities
Trade and other liabilities 943 978
Current portion of borrowings 25 25
Current lease liabilities 95 -
Construction contracts – liabilities 147 168
Deferred revenue 27 5
Other current liabilities 159 225
Total current liabilities 1,396 1,401
Total liabilities 2,037 1,847
Total equity & liabilities 7,479 7,569
© Subsea 7 - 201926 subsea7.com
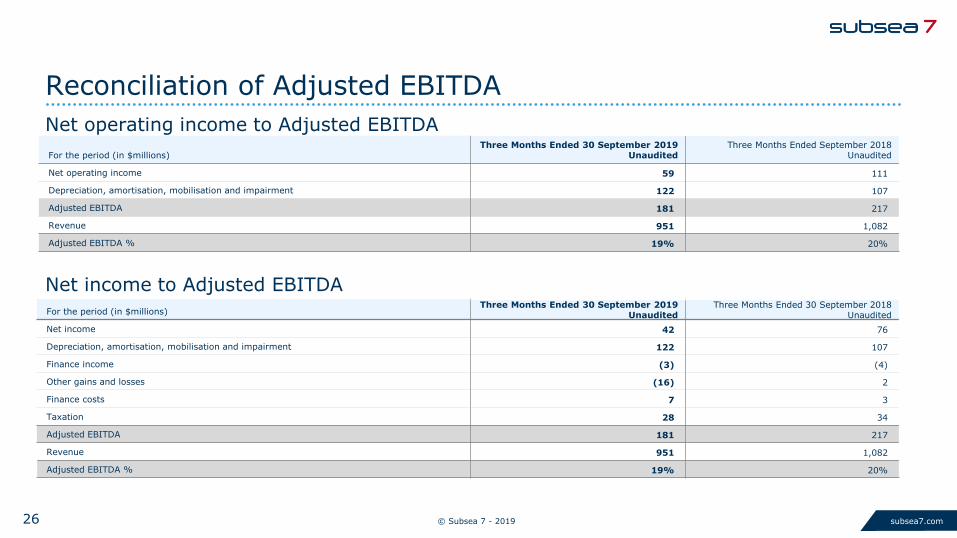
For the period (in $millions)Three Months Ended 30 September 2019
UnauditedThree Months Ended September 2018
Unaudited
Net operating income 59 111
Depreciation, amortisation, mobilisation and impairment 122 107
Adjusted EBITDA 181 217
Revenue 951 1,082
Adjusted EBITDA % 19% 20%
Reconciliation of Adjusted EBITDA
Net operating income to Adjusted EBITDA
For the period (in $millions)Three Months Ended 30 September 2019
UnauditedThree Months Ended 30 September 2018
Unaudited
Net income 42 76
Depreciation, amortisation, mobilisation and impairment 122 107
Finance income (3) (4)
Other gains and losses (16) 2
Finance costs 7 3
Taxation 28 34
Adjusted EBITDA 181 217
Revenue 951 1,082
Adjusted EBITDA % 19% 20%
Net income to Adjusted EBITDA
© Subsea 7 - 201927 subsea7.com
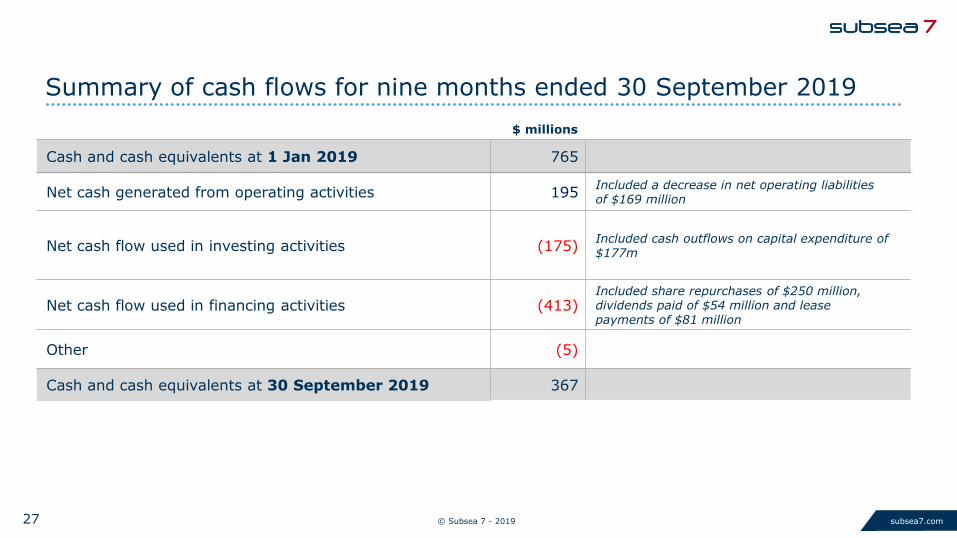
$ millions
Cash and cash equivalents at 1 Jan 2019 765
Net cash generated from operating activities 195Included a decrease in net operating liabilities of $169 million
Net cash flow used in investing activities (175)Included cash outflows on capital expenditure of $177m
Net cash flow used in financing activities (413)Included share repurchases of $250 million, dividends paid of $54 million and lease payments of $81 million
Other (5)
Cash and cash equivalents at 30 September 2019 367
Summary of cash flows for nine months ended 30 September 2019
© Subsea 7 - 201928 subsea7.com
Contact:Isabel Green, Investor Relations Director
eMail: [email protected] Line +44 20 8210 5568
Website www.subsea7.com