acxiom fy17 third quarter earnings call
TRANSCRIPT
ACXIOMQ3 FY17 CONFERENCE CALL
JANUARY 31, 2017

©2017 Acxiom
SAFE HARBOR STATEMENT
Some of the matters discussed in this presentation contain forward-looking statements regarding the company’s future business prospects which are subject to certain risks and uncertainties, including competitive pressures, adverse economic conditions and governmental regulations.
These issues and other factors that may be identified from time to time in the Company’s reports filed with the SEC could cause actual results to differ materially from those indicated in the forward-looking statements.
Our discussion today will include non-GAAP financial measures. We refer you to the Investor Relations section of our website, which includes a reconciliation to the comparable GAAP measure for each non-GAAP financial measure included in this discussion. The location of our website is www.acxiom.com.
2
©2017 Acxiom
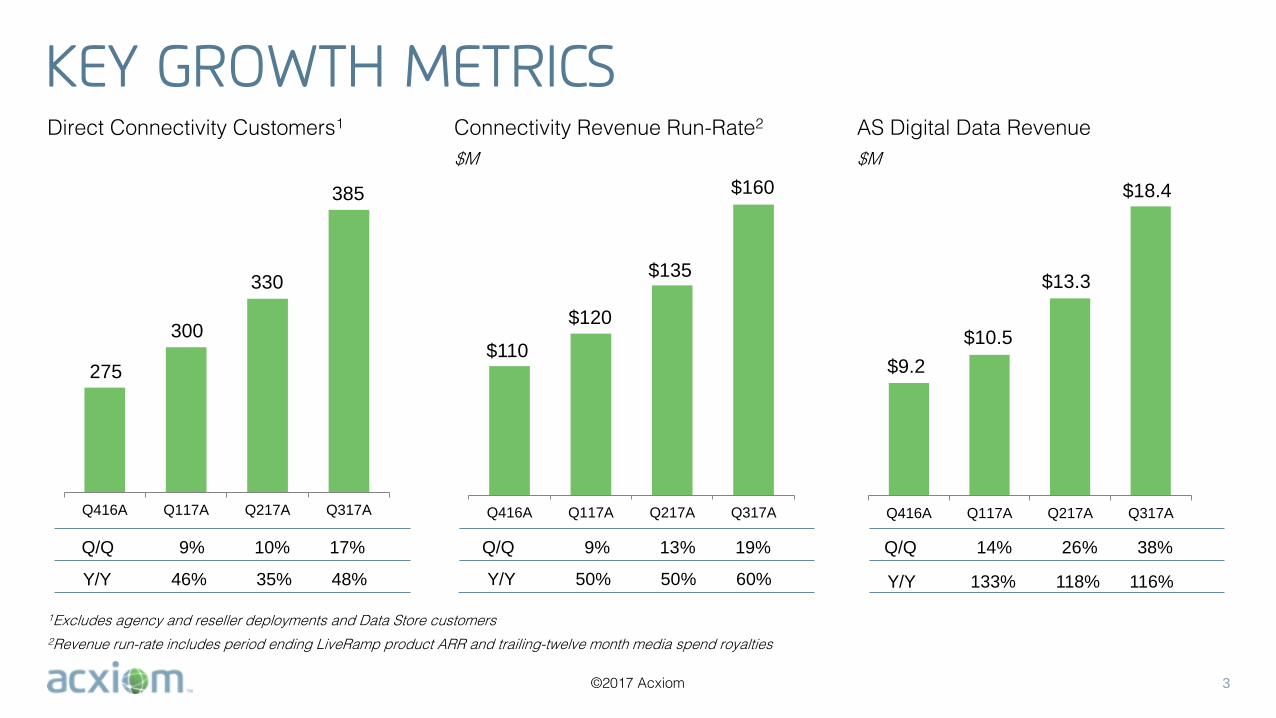
KEY GROWTH METRICS
3
Q416A Q117A Q217A Q317A
AS Digital Data Revenue
Q416A Q117A Q217A Q317A
Q/Q 14% 26% 38%
Direct Connectivity Customers1
Q/Q 9% 10% 17%
Connectivity Revenue Run-Rate2
Q/Q 9% 13% 19%
Q416A Q117A Q217A Q317A
Y/Y 46% 35% 48%
1Excludes agency and reseller deployments and Data Store customers
2Revenue run-rate includes period ending LiveRamp product ARR and trailing-twelve month media spend royalties
Y/Y 133% 118% 116%
$110
$120
Y/Y 50% 50% 60%
$9.2275
$135
$10.5
330 $13.3
$M $M
300
$160385 $18.4

©2017 Acxiom
IMPROVING TREND LINES
4
Total Company TTM Adjusted EBITDARecord Quarterly Results
TTM Trends
Non-GAAP
Non-GAAP
> 50% GM%
15% OM%
Q415A Q116A Q216A Q316A Q416A Q117A Q217A Q317A
$M
$129
$136
$142$144
$142
$149
$155
$165
Q1 / Q2 / Q3 / Q4 / Q1 / Q2 / Q3
TTM GM %
Marketing Services 34 / 34 / 33 / 34 / 34 / 34 / 35
Audience Solutions 53 / 54 / 55 / 56 / 57 / 59 / 60
Connectivity 40 / 49 / 55 / 60 / 59 / 59 / 60
TTM EBITDA %
Marketing Services 24 / 24 / 23 / 24 / 24 / 25 / 26
Audience Solutions 45 / 44 / 45 / 44 / 44 / 44 / 44
Connectivity (26) / (10) / (2) / 4 / 4 / 6 / 8
FY16A FY17A
©2017 Acxiom
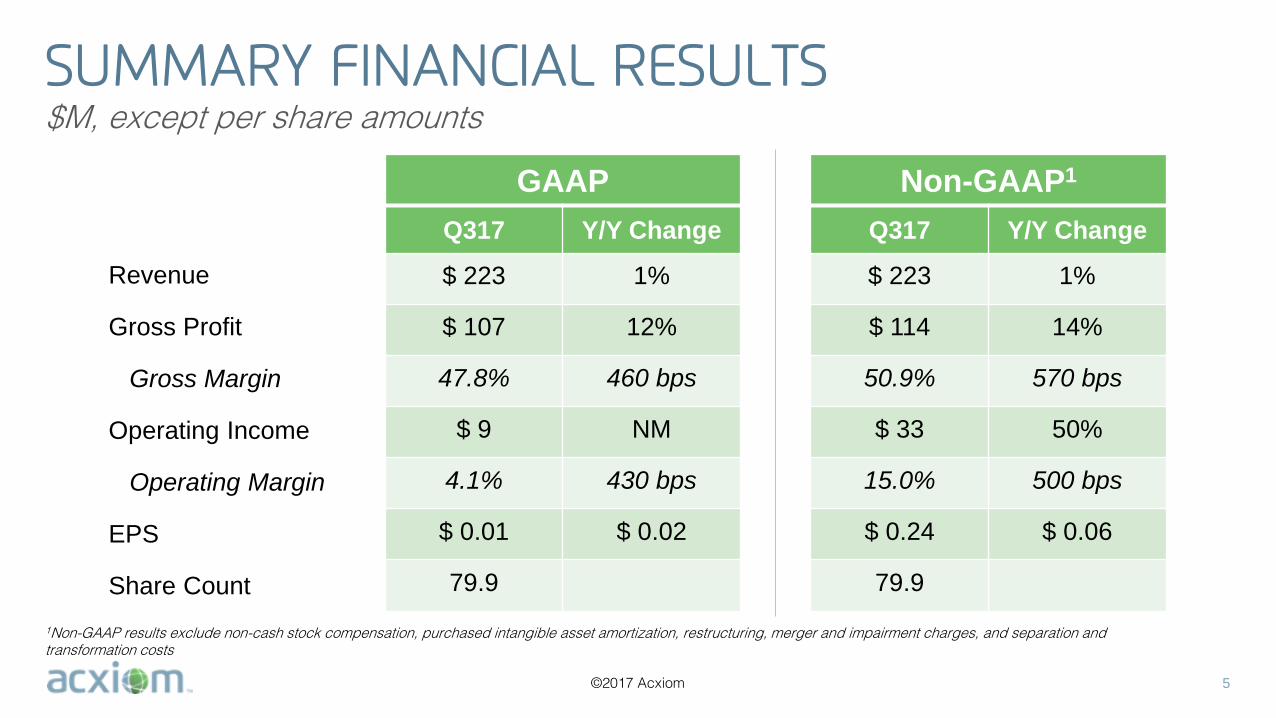
SUMMARY FINANCIAL RESULTS$M, except per share amounts
5
GAAP
Q317 Y/Y Change
$ 223 1%
$ 107 12%
47.8% 460 bps
$ 9 NM
4.1% 430 bps
$ 0.01 $ 0.02
79.9
Non-GAAP1
Q317 Y/Y Change
$ 223 1%
$ 114 14%
50.9% 570 bps
$ 33 50%
15.0% 500 bps
$ 0.24 $ 0.06
79.9
Revenue
Gross Profit
Gross Margin
Operating Income
Operating Margin
EPS
Share Count
1Non-GAAP results exclude non-cash stock compensation, purchased intangible asset amortization, restructuring, merger and impairment charges, and separation and transformation costs
©2017 Acxiom
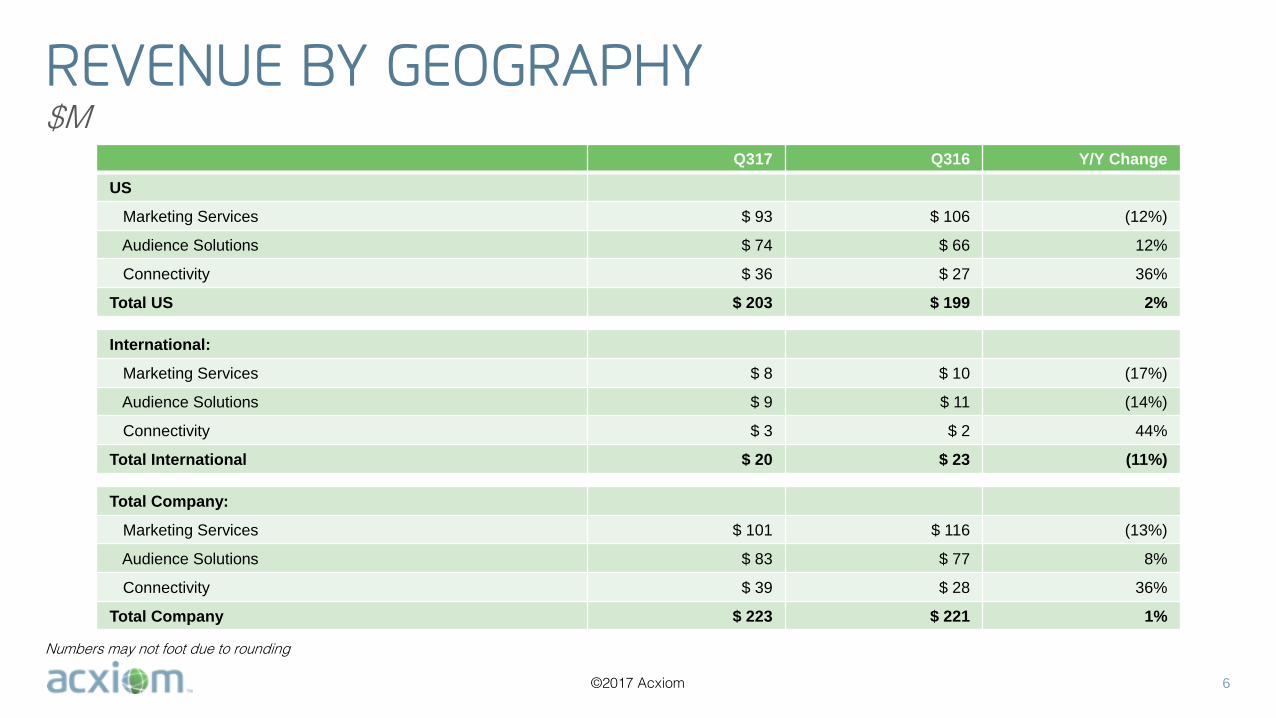
REVENUE BY GEOGRAPHY$M
6
Numbers may not foot due to rounding
Q317 Q316 Y/Y Change
US
Marketing Services $ 93 $ 106 (12%)
Audience Solutions $ 74 $ 66 12%
Connectivity $ 36 $ 27 36%
Total US $ 203 $ 199 2%
International:
Marketing Services $ 8 $ 10 (17%)
Audience Solutions $ 9 $ 11 (14%)
Connectivity $ 3 $ 2 44%
Total International $ 20 $ 23 (11%)
Total Company:
Marketing Services $ 101 $ 116 (13%)
Audience Solutions $ 83 $ 77 8%
Connectivity $ 39 $ 28 36%
Total Company $ 223 $ 221 1%
©2017 Acxiom
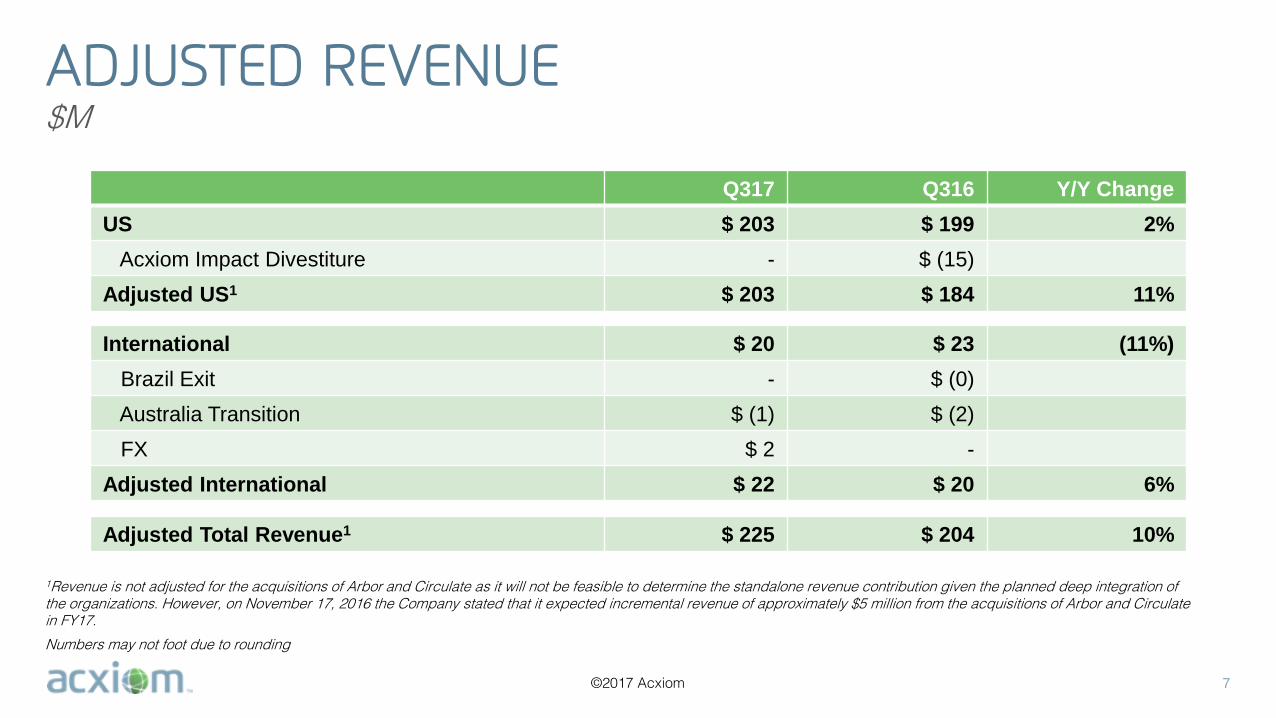
ADJUSTED REVENUE$M
7
Q317 Q316 Y/Y Change
US $ 203 $ 199 2%
Acxiom Impact Divestiture - $ (15)
Adjusted US1 $ 203 $ 184 11%
International $ 20 $ 23 (11%)
Brazil Exit - $ (0)
Australia Transition $ (1) $ (2)
FX $ 2 -
Adjusted International $ 22 $ 20 6%
Adjusted Total Revenue1 $ 225 $ 204 10%
1Revenue is not adjusted for the acquisitions of Arbor and Circulate as it will not be feasible to determine the standalone revenue contribution given the planned deep integration of the organizations. However, on November 17, 2016 the Company stated that it expected incremental revenue of approximately $5 million from the acquisitions of Arbor and Circulate in FY17.
Numbers may not foot due to rounding
©2017 Acxiom
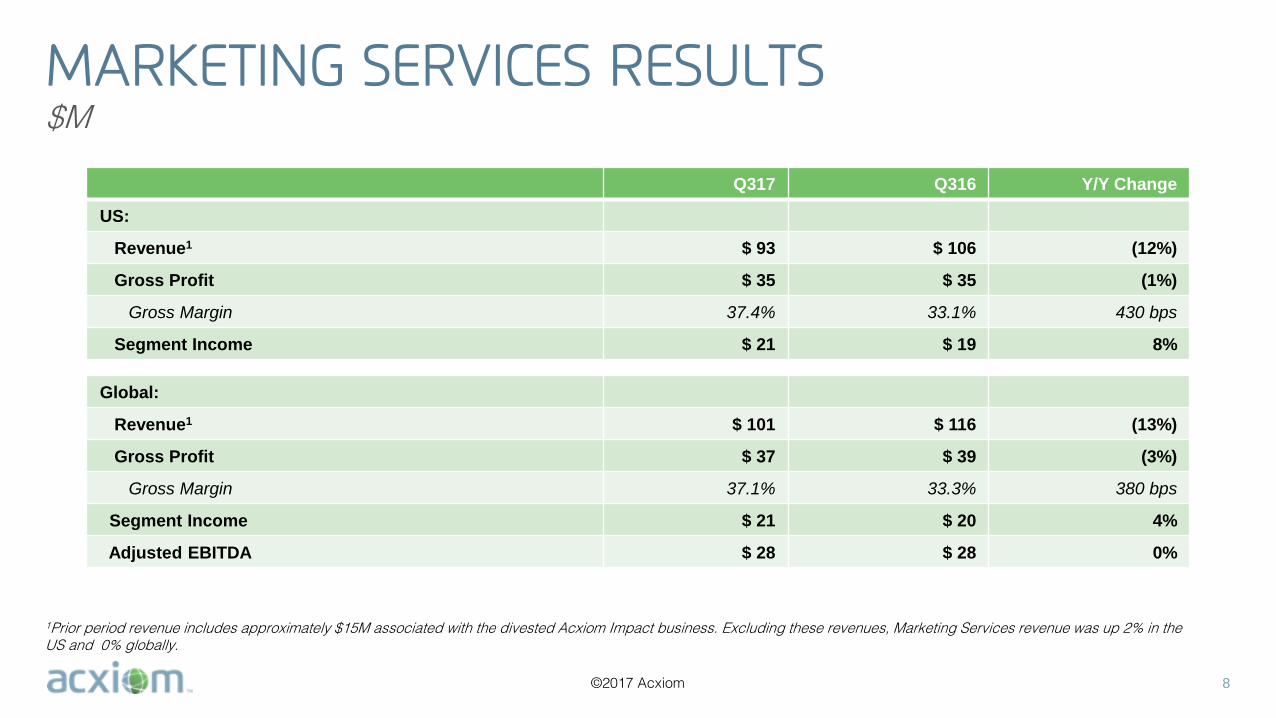
MARKETING SERVICES RESULTS$M
8
Q317 Q316 Y/Y Change
US:
Revenue1 $ 93 $ 106 (12%)
Gross Profit $ 35 $ 35 (1%)
Gross Margin 37.4% 33.1% 430 bps
Segment Income $ 21 $ 19 8%
Global:
Revenue1 $ 101 $ 116 (13%)
Gross Profit $ 37 $ 39 (3%)
Gross Margin 37.1% 33.3% 380 bps
Segment Income $ 21 $ 20 4%
Adjusted EBITDA $ 28 $ 28 0%
1Prior period revenue includes approximately $15M associated with the divested Acxiom Impact business. Excluding these revenues, Marketing Services revenue was up 2% in the US and 0% globally.
©2017 Acxiom
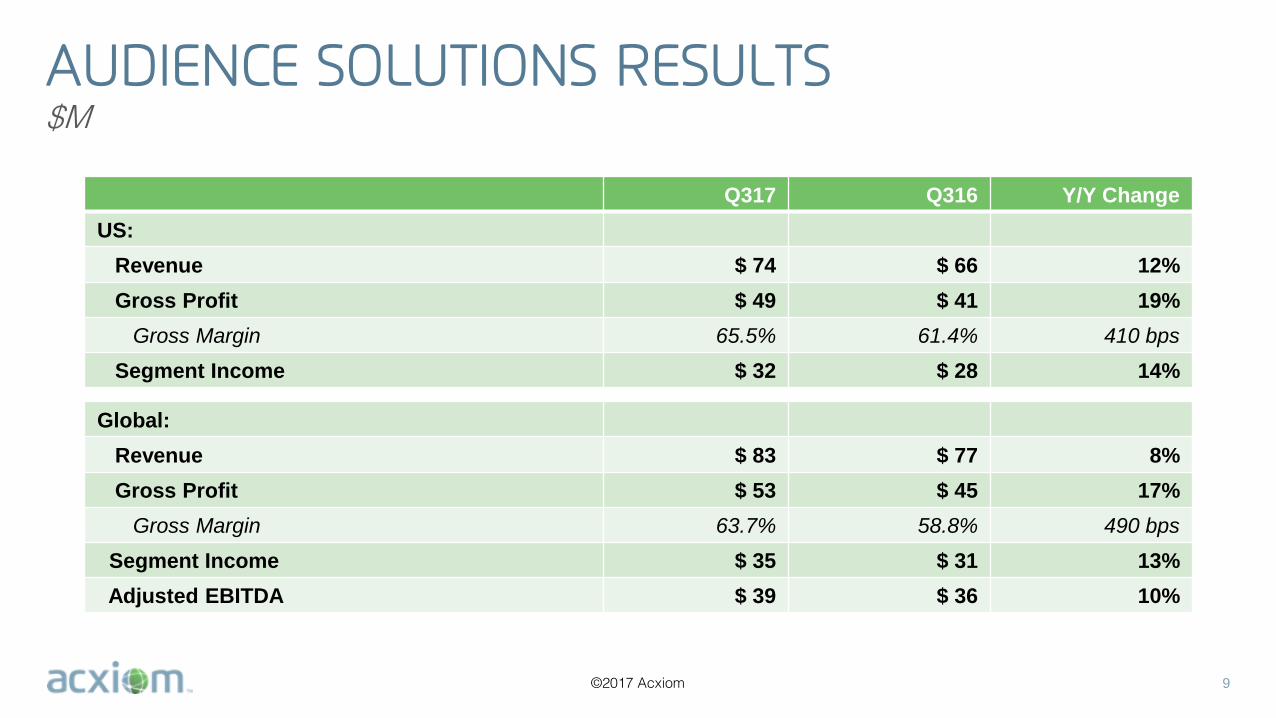
AUDIENCE SOLUTIONS RESULTS$M
9
Q317 Q316 Y/Y Change
US:
Revenue $ 74 $ 66 12%
Gross Profit $ 49 $ 41 19%
Gross Margin 65.5% 61.4% 410 bps
Segment Income $ 32 $ 28 14%
Global:
Revenue $ 83 $ 77 8%
Gross Profit $ 53 $ 45 17%
Gross Margin 63.7% 58.8% 490 bps
Segment Income $ 35 $ 31 13%
Adjusted EBITDA $ 39 $ 36 10%
©2017 Acxiom
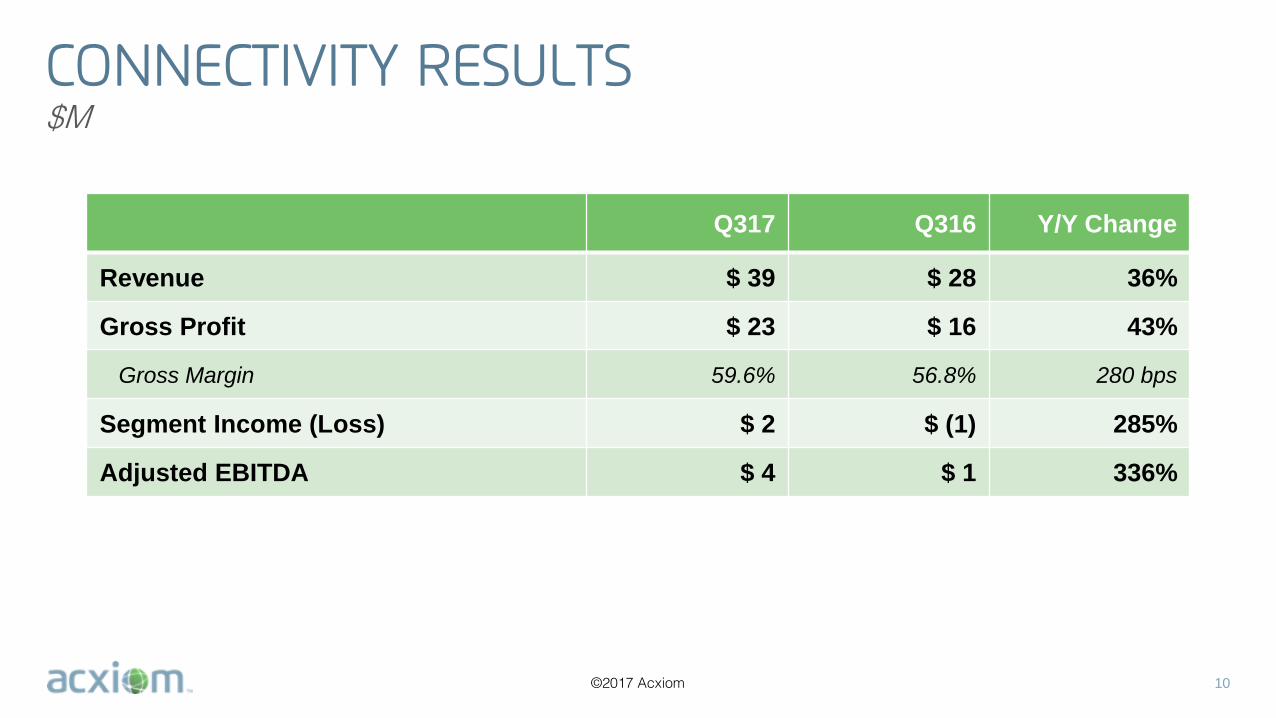
CONNECTIVITY RESULTS$M
10
Q317 Q316 Y/Y Change
Revenue $ 39 $ 28 36%
Gross Profit $ 23 $ 16 43%
Gross Margin 59.6% 56.8% 280 bps
Segment Income (Loss) $ 2 $ (1) 285%
Adjusted EBITDA $ 4 $ 1 336%
©2017 Acxiom
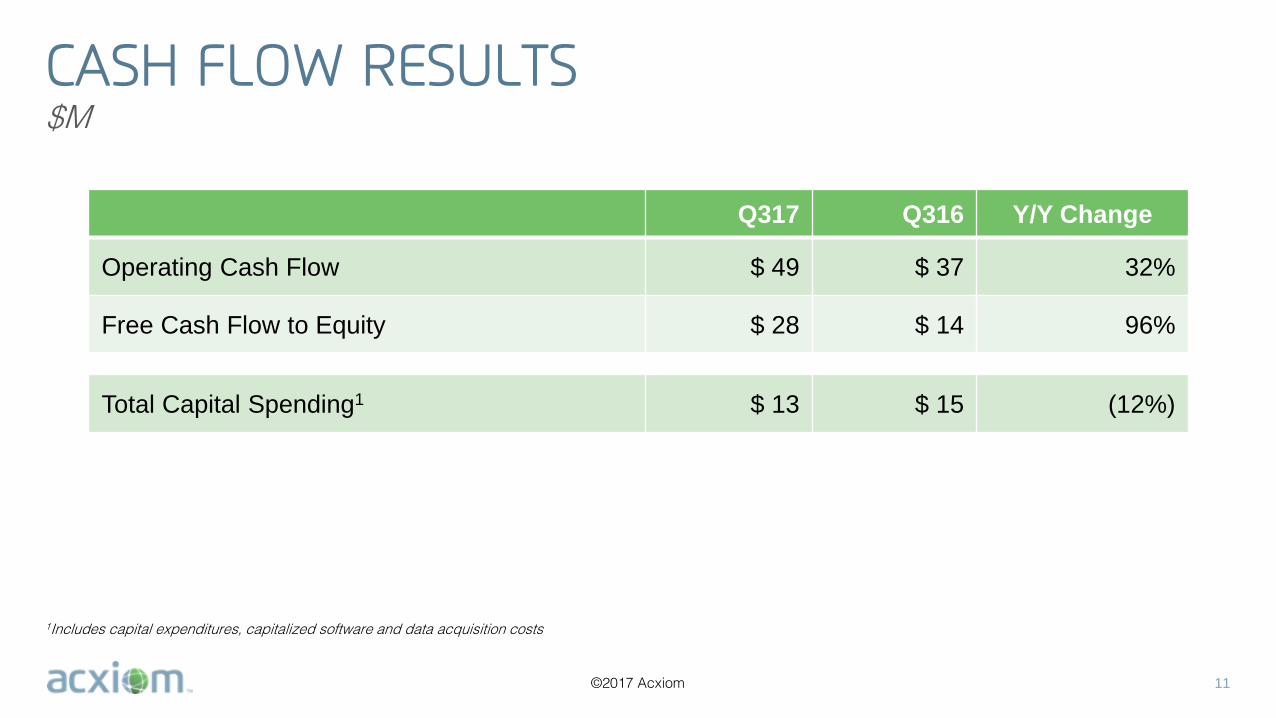
CASH FLOW RESULTS$M
11
1Includes capital expenditures, capitalized software and data acquisition costs
Q317 Q316 Y/Y Change
Operating Cash Flow $ 49 $ 37 32%
Free Cash Flow to Equity $ 28 $ 14 96%
Total Capital Spending1 $ 13 $ 15 (12%)
©2017 Acxiom
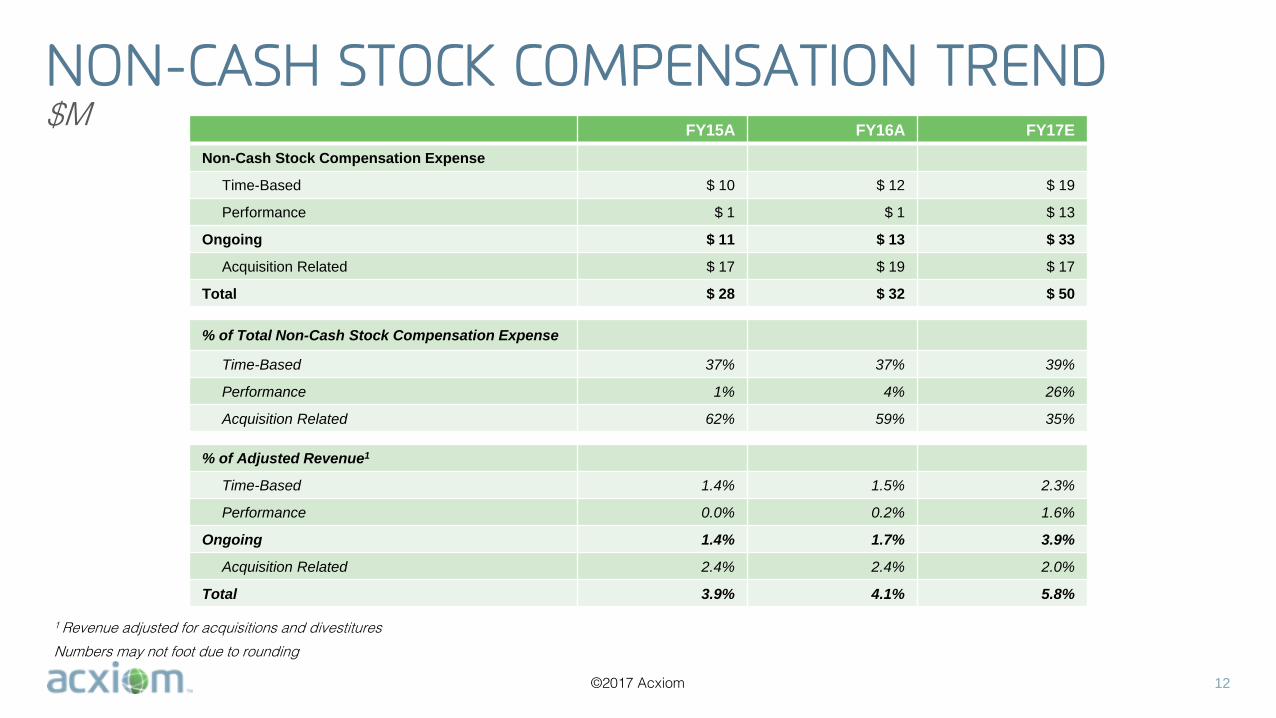
NON-CASH STOCK COMPENSATION TREND
12
FY15A FY16A FY17E
Non-Cash Stock Compensation Expense
Time-Based $ 10 $ 12 $ 19
Performance $ 1 $ 1 $ 13
Ongoing $ 11 $ 13 $ 33
Acquisition Related $ 17 $ 19 $ 17
Total $ 28 $ 32 $ 50
% of Total Non-Cash Stock Compensation Expense
Time-Based 37% 37% 39%
Performance 1% 4% 26%
Acquisition Related 62% 59% 35%
% of Adjusted Revenue1
Time-Based 1.4% 1.5% 2.3%
Performance 0.0% 0.2% 1.6%
Ongoing 1.4% 1.7% 3.9%
Acquisition Related 2.4% 2.4% 2.0%
Total 3.9% 4.1% 5.8%
$M
1 Revenue adjusted for acquisitions and divestitures
Numbers may not foot due to rounding
©2017 Acxiom
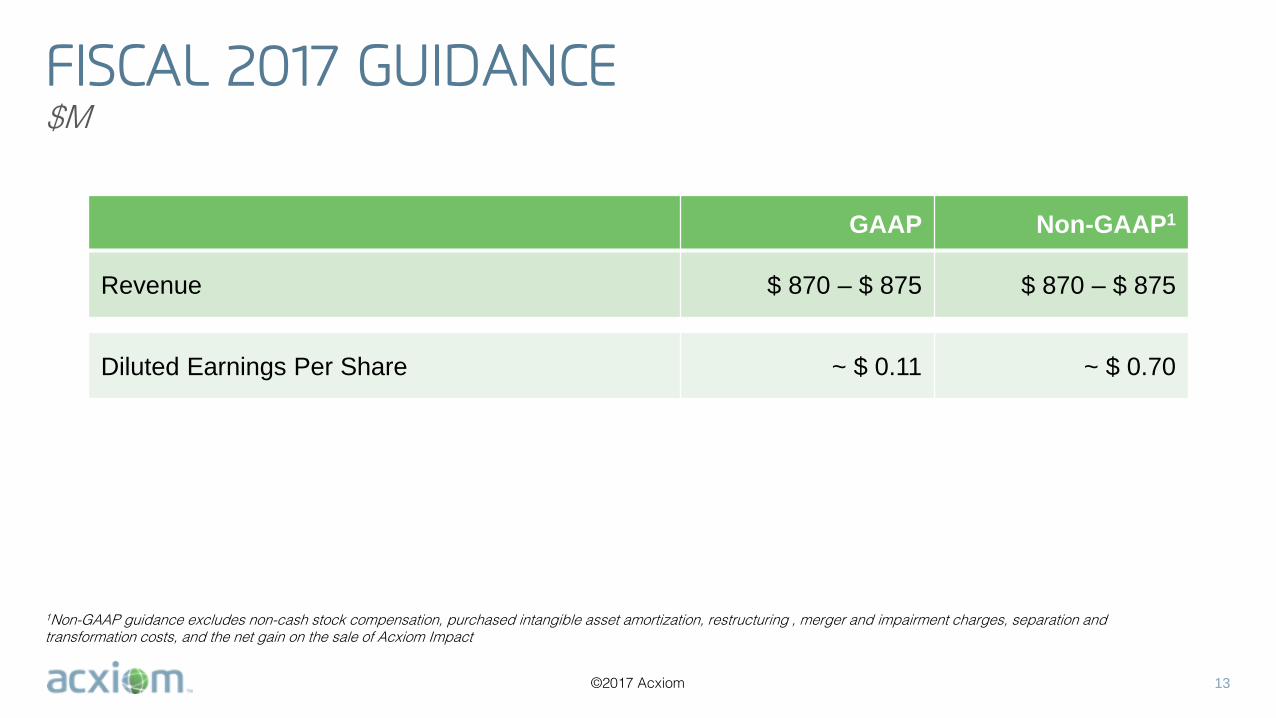
FISCAL 2017 GUIDANCE$M
13
GAAP Non-GAAP1
Revenue $ 870 – $ 875 $ 870 – $ 875
Diluted Earnings Per Share ~ $ 0.11 ~ $ 0.70
1Non-GAAP guidance excludes non-cash stock compensation, purchased intangible asset amortization, restructuring , merger and impairment charges, separation and transformation costs, and the net gain on the sale of Acxiom Impact

APPENDIX
©2017 Acxiom
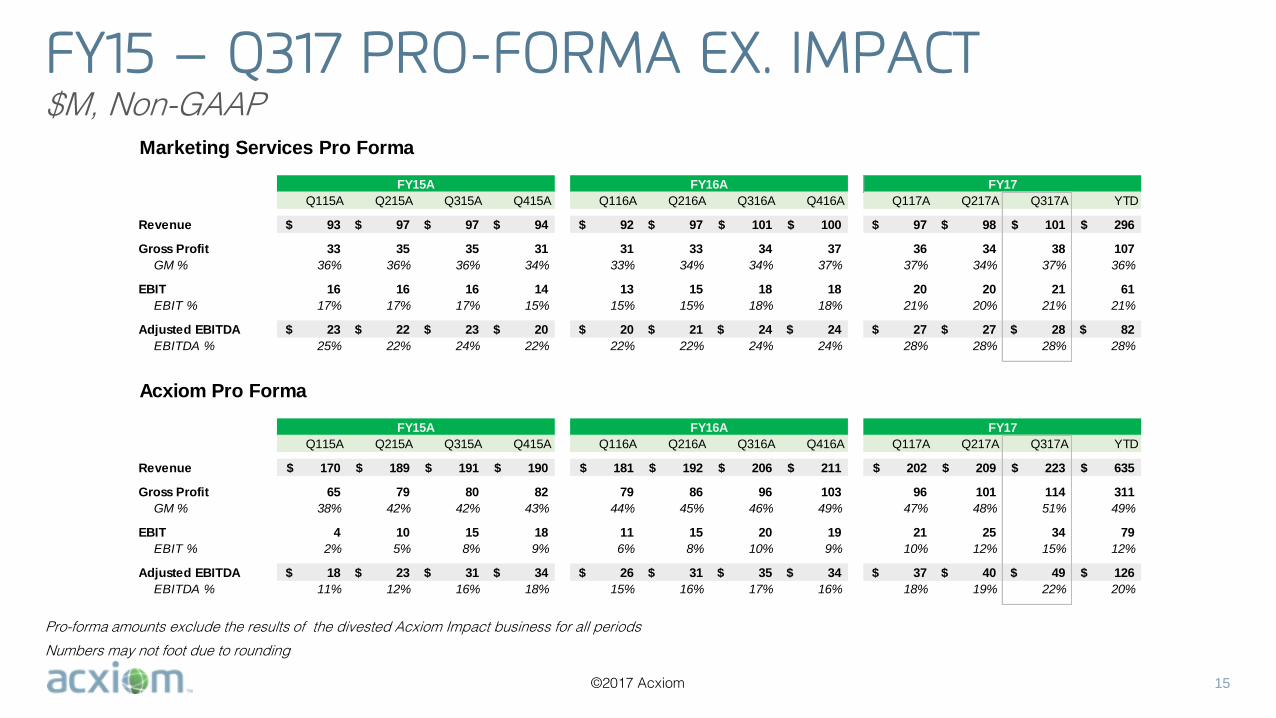
FY15 – Q317 PRO-FORMA EX. IMPACT$M, Non-GAAP
15
Pro-forma amounts exclude the results of the divested Acxiom Impact business for all periods
Numbers may not foot due to rounding
Marketing Services Pro Forma
Q115A Q215A Q315A Q415A Q116A Q216A Q316A Q416A Q117A Q217A Q317A YTD
Revenue 93$ 97$ 97$ 94$ 92$ 97$ 101$ 100$ 97$ 98$ 101$ 296$
Gross Profit 33 35 35 31 31 33 34 37 36 34 38 107
GM % 36% 36% 36% 34% 33% 34% 34% 37% 37% 34% 37% 36%
EBIT 16 16 16 14 13 15 18 18 20 20 21 61
EBIT % 17% 17% 17% 15% 15% 15% 18% 18% 21% 20% 21% 21%
Adjusted EBITDA 23$ 22$ 23$ 20$ 20$ 21$ 24$ 24$ 27$ 27$ 28$ 82$
EBITDA % 25% 22% 24% 22% 22% 22% 24% 24% 28% 28% 28% 28%
Acxiom Pro Forma
Q115A Q215A Q315A Q415A Q116A Q216A Q316A Q416A Q117A Q217A Q317A YTD
Revenue 170$ 189$ 191$ 190$ 181$ 192$ 206$ 211$ 202$ 209$ 223$ 635$
Gross Profit 65 79 80 82 79 86 96 103 96 101 114 311
GM % 38% 42% 42% 43% 44% 45% 46% 49% 47% 48% 51% 49%
EBIT 4 10 15 18 11 15 20 19 21 25 34 79
EBIT % 2% 5% 8% 9% 6% 8% 10% 9% 10% 12% 15% 12%
Adjusted EBITDA 18$ 23$ 31$ 34$ 26$ 31$ 35$ 34$ 37$ 40$ 49$ 126$
EBITDA % 11% 12% 16% 18% 15% 16% 17% 16% 18% 19% 22% 20%
FY15A FY16A
FY15A FY16A FY17
FY17
©2017 Acxiom
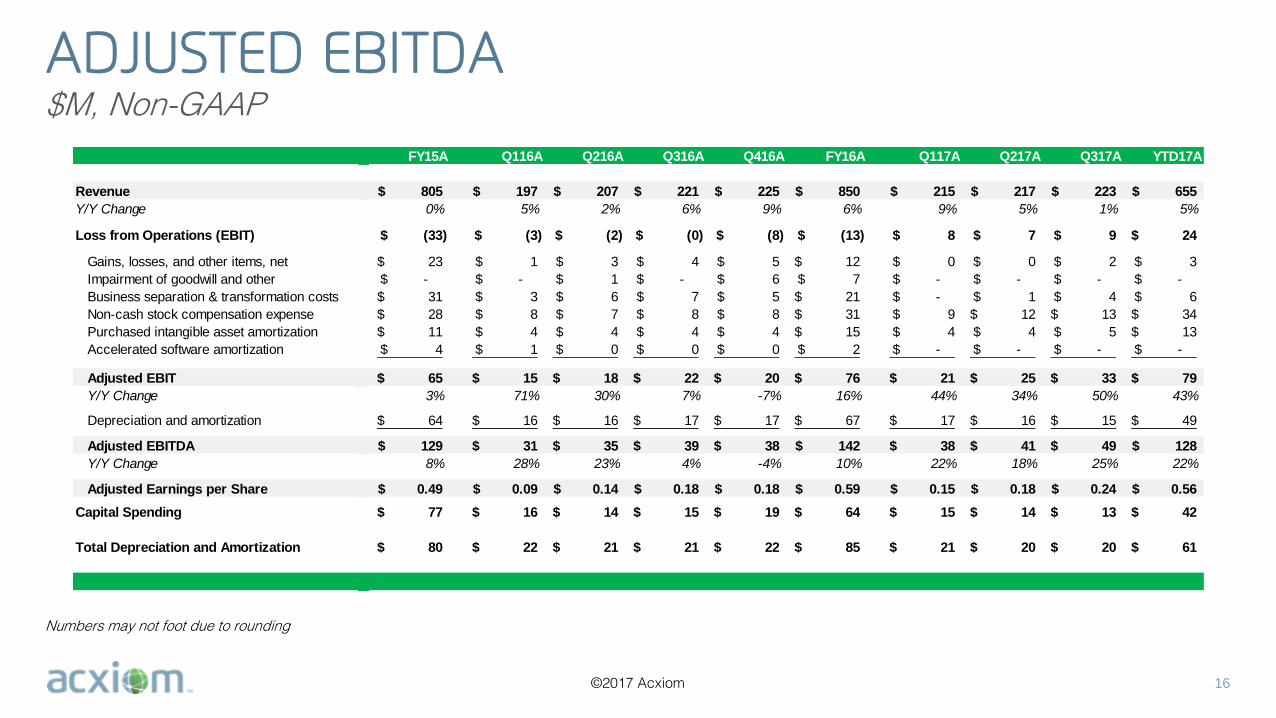
ADJUSTED EBITDA$M, Non-GAAP
16
Numbers may not foot due to rounding
FY15A Q116A Q216A Q316A Q416A FY16A Q117A Q217A Q317A YTD17A
Revenue 805$ 197$ 207$ 221$ 225$ 850$ 215$ 217$ 223$ 655$
Y/Y Change 0% 5% 2% 6% 9% 6% 9% 5% 1% 5%
Loss from Operations (EBIT) (33)$ (3)$ (2)$ (0)$ (8)$ (13)$ 8$ 7$ 9$ 24$
Gains, losses, and other items, net 23$ 1$ 3$ 4$ 5$ 12$ 0$ 0$ 2$ 3$
Impairment of goodwill and other -$ -$ 1$ -$ 6$ 7$ -$ -$ -$ -$
Business separation & transformation costs 31$ 3$ 6$ 7$ 5$ 21$ -$ 1$ 4$ 6$
Non-cash stock compensation expense 28$ 8$ 7$ 8$ 8$ 31$ 9$ 12$ 13$ 34$
Purchased intangible asset amortization 11$ 4$ 4$ 4$ 4$ 15$ 4$ 4$ 5$ 13$
Accelerated software amortization 4$ 1$ 0$ 0$ 0$ 2$ -$ -$ -$ -$
Adjusted EBIT 65$ 15$ 18$ 22$ 20$ 76$ 21$ 25$ 33$ 79$
Y/Y Change 3% 71% 30% 7% -7% 16% 44% 34% 50% 43%
Depreciation and amortization 64$ 16$ 16$ 17$ 17$ 67$ 17$ 16$ 15$ 49$
Adjusted EBITDA 129$ 31$ 35$ 39$ 38$ 142$ 38$ 41$ 49$ 128$
Y/Y Change 8% 28% 23% 4% -4% 10% 22% 18% 25% 22%
Adjusted Earnings per Share 0.49$ 0.09$ 0.14$ 0.18$ 0.18$ 0.59$ 0.15$ 0.18$ 0.24$ 0.56$
Capital Spending 77$ 16$ 14$ 15$ 19$ 64$ 15$ 14$ 13$ 42$
Total Depreciation and Amortization 80$ 22$ 21$ 21$ 22$ 85$ 21$ 20$ 20$ 61$
©2017 Acxiom
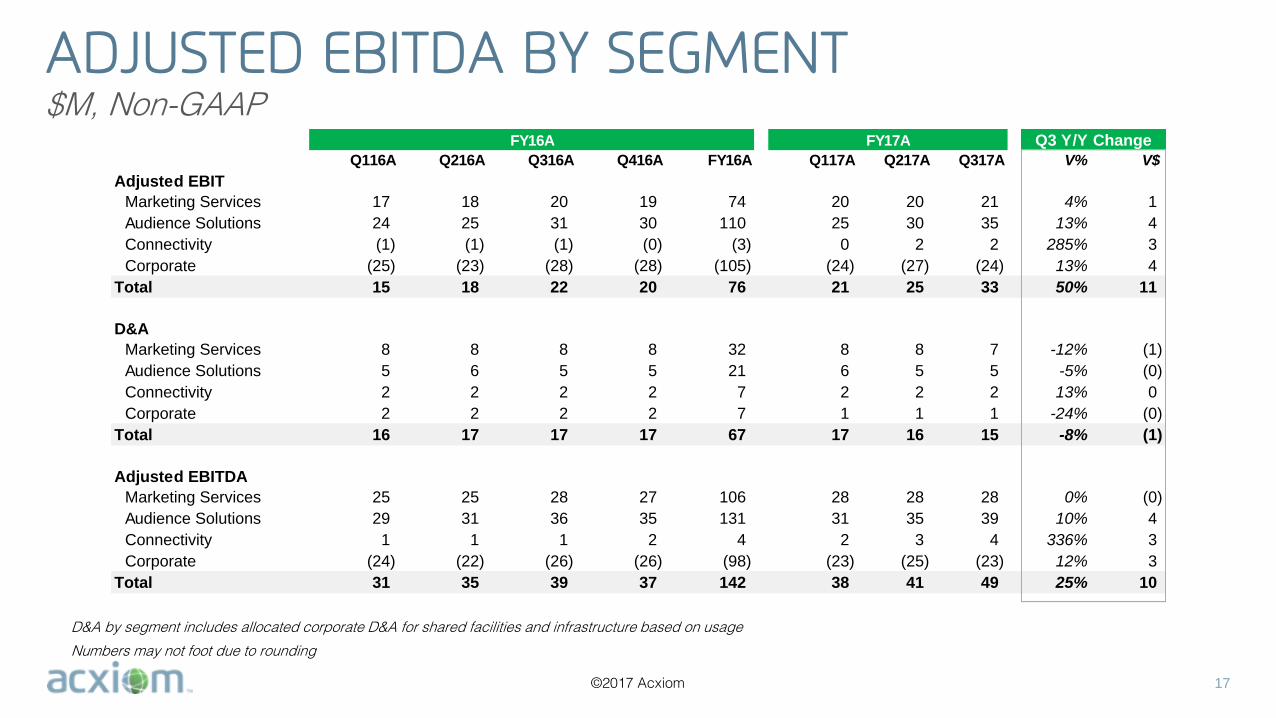
Q116A Q216A Q316A Q416A FY16A Q117A Q217A Q317A V% V$
Adjusted EBIT
Marketing Services 17 18 20 19 74 20 20 21 4% 1
Audience Solutions 24 25 31 30 110 25 30 35 13% 4
Connectivity (1) (1) (1) (0) (3) 0 2 2 285% 3
Corporate (25) (23) (28) (28) (105) (24) (27) (24) 13% 4
Total 15 18 22 20 76 21 25 33 50% 11
D&A
Marketing Services 8 8 8 8 32 8 8 7 -12% (1)
Audience Solutions 5 6 5 5 21 6 5 5 -5% (0)
Connectivity 2 2 2 2 7 2 2 2 13% 0
Corporate 2 2 2 2 7 1 1 1 -24% (0)
Total 16 17 17 17 67 17 16 15 -8% (1)
Adjusted EBITDA
Marketing Services 25 25 28 27 106 28 28 28 0% (0)
Audience Solutions 29 31 36 35 131 31 35 39 10% 4
Connectivity 1 1 1 2 4 2 3 4 336% 3
Corporate (24) (22) (26) (26) (98) (23) (25) (23) 12% 3
Total 31 35 39 37 142 38 41 49 25% 10
FY16A Q3 Y/Y ChangeFY17A
ADJUSTED EBITDA BY SEGMENT$M, Non-GAAP
17
D&A by segment includes allocated corporate D&A for shared facilities and infrastructure based on usage
Numbers may not foot due to rounding
©2017 Acxiom
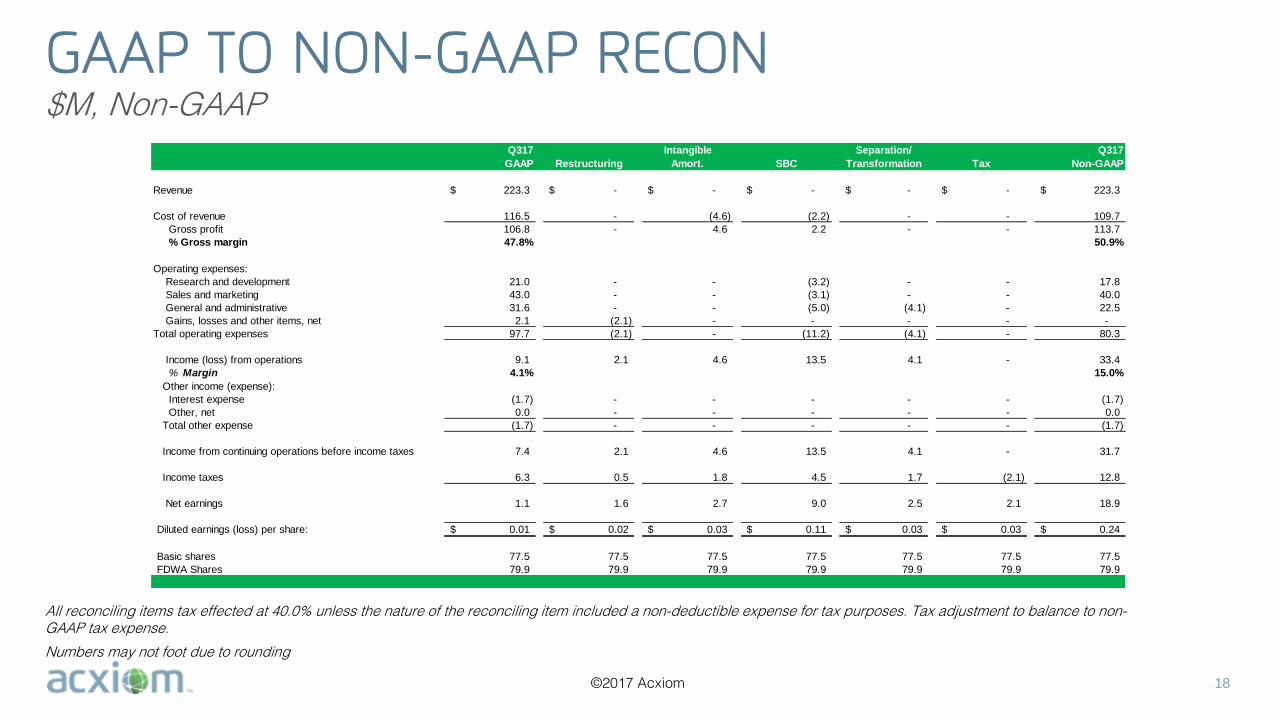
GAAP TO NON-GAAP RECON$M, Non-GAAP
18
Q317 Intangible Separation/ Q317
GAAP Restructuring Amort. SBC Transformation Tax Non-GAAP
Revenue 223.3$ -$ -$ -$ -$ -$ 223.3$
Cost of revenue 116.5 - (4.6) (2.2) - - 109.7
Gross profit 106.8 - 4.6 2.2 - - 113.7
% Gross margin 47.8% 50.9%
Operating expenses:
Research and development 21.0 - - (3.2) - - 17.8
Sales and marketing 43.0 - - (3.1) - - 40.0
General and administrative 31.6 - - (5.0) (4.1) - 22.5
Gains, losses and other items, net 2.1 (2.1) - - - - -
Total operating expenses 97.7 (2.1) - (11.2) (4.1) - 80.3
Income (loss) from operations 9.1 2.1 4.6 13.5 4.1 - 33.4
% Margin 4.1% 15.0%
Other income (expense):
Interest expense (1.7) - - - - - (1.7)
Other, net 0.0 - - - - - 0.0
Total other expense (1.7) - - - - - (1.7)
Income from continuing operations before income taxes 7.4 2.1 4.6 13.5 4.1 - 31.7
Income taxes 6.3 0.5 1.8 4.5 1.7 (2.1) 12.8
Net earnings 1.1 1.6 2.7 9.0 2.5 2.1 18.9
Diluted earnings (loss) per share: 0.01$ 0.02$ 0.03$ 0.11$ 0.03$ 0.03$ 0.24$
Basic shares 77.5 77.5 77.5 77.5 77.5 77.5 77.5
FDWA Shares 79.9 79.9 79.9 79.9 79.9 79.9 79.9
All reconciling items tax effected at 40.0% unless the nature of the reconciling item included a non-deductible expense for tax purposes. Tax adjustment to balance to non-GAAP tax expense.
Numbers may not foot due to rounding