verifone q4 fy17 earnings report
TRANSCRIPT

Q4 FY17
Financial Results
December 12, 2017

2
Non-GAAP Financial Measures
With respect to any non-GAAP financial measures
presented, reconciliations of non-GAAP to GAAP
financial measures may be found in Verifone’s quarterly
earnings release as filed with the Securities and
Exchange Commission as well as the Appendix to these
slides. Management uses non-GAAP financial
measures only in addition to and in conjunction with
results presented in accordance with GAAP.
Management believes that these Non-GAAP financial
measures help it to evaluate Verifone’s performance
and to compare Verifone’s current results with those for
prior periods as well as with the results of peer
companies. These non-GAAP financial measures
contain limitations and should be considered as a
supplement to, and not as a substitute for, or superior
to, disclosures made in accordance with GAAP
Forward Looking Statements
Today’s discussion may include “forward-looking
statements” within the meaning of the Private Securities
Litigation Reform Act of 1995. Such statements relate to
future events and expectations and involve known and
unknown risks and uncertainties. Verifone’s actual
results or actions may differ materially from those
projected in the forward-looking statements. For a
summary of the specific risk factors that could cause
results to differ materially from those expressed in the
forward-looking statements, please refer to Verifone’s
filings with the Securities and Exchange Commission,
including its annual report on Form 10-K and quarterly
reports on Form 10-Q. Verifone is under no obligation to,
and expressly disclaims any obligation to, update or
alter its forward-looking statements, whether as a result
of new information, future events, changes in
assumptions or otherwise

3
Agenda
3
Business Update
Paul Galant, CEO
Financial Update
Marc Rothman, CFO
Q&A
Paul Galant, CEO
Marc Rothman, CFO
Vin D’Agostino, Strategy
Chris Mammone, IR
4
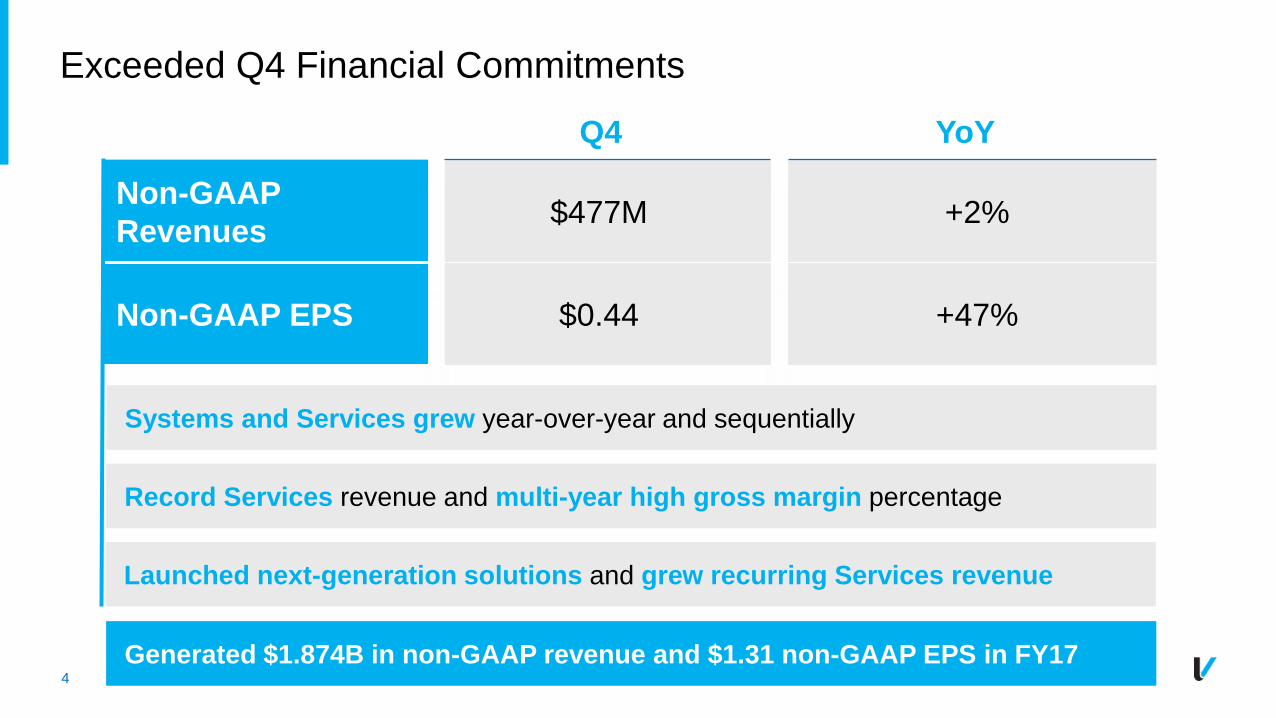
Exceeded Q4 Financial Commitments
Q4 YoY
Non-GAAP
Revenues$477M +2%
Non-GAAP EPS $0.44 +47%
Systems and Services grew year-over-year and sequentially
Record Services revenue and multi-year high gross margin percentage
Launched next-generation solutions and grew recurring Services revenue
Generated $1.874B in non-GAAP revenue and $1.31 non-GAAP EPS in FY17
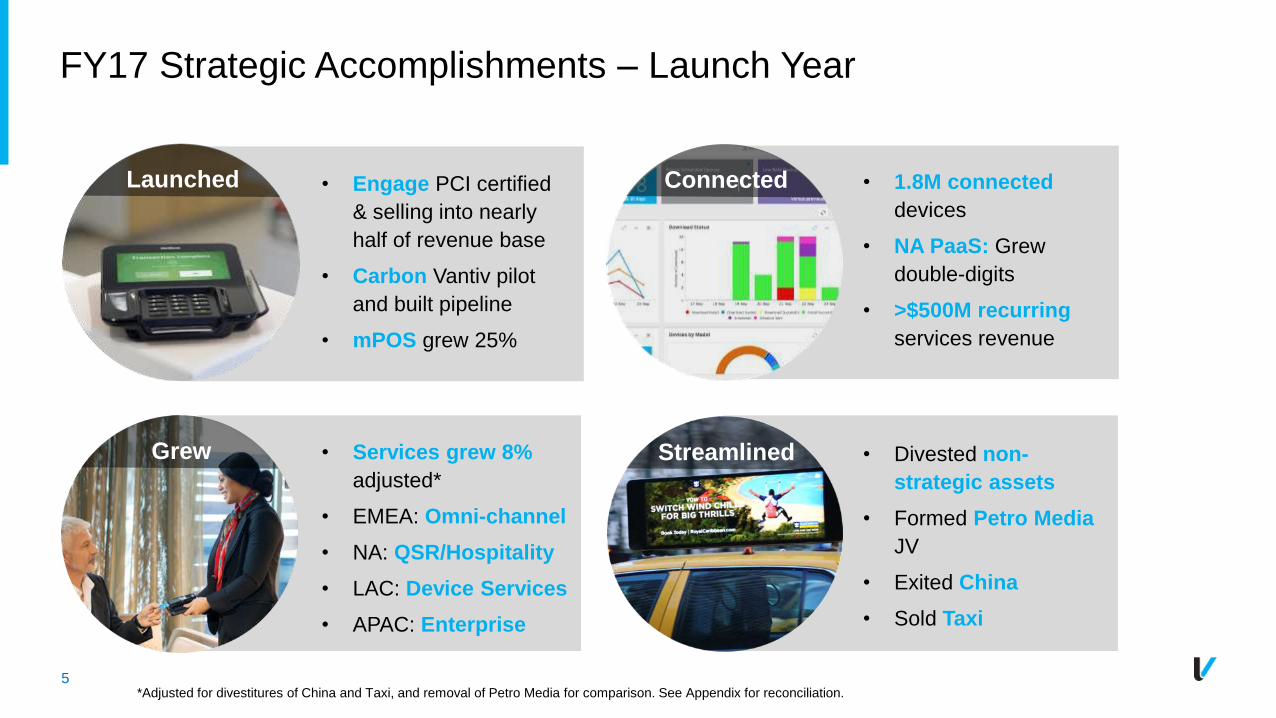
5
• Engage PCI certified
& selling into nearly
half of revenue base
• Carbon Vantiv pilot
and built pipeline
• mPOS grew 25%
• Services grew 8%
adjusted*
• EMEA: Omni-channel
• NA: QSR/Hospitality
• LAC: Device Services
• APAC: Enterprise
• 1.8M connected
devices
• NA PaaS: Grew
double-digits
• >$500M recurring
services revenue
• Divested non-
strategic assets
• Formed Petro Media
JV
• Exited China
• Sold Taxi
FY17 Strategic Accomplishments – Launch Year
*Adjusted for divestitures of China and Taxi, and removal of Petro Media for comparison. See Appendix for reconciliation.
Launched Connected
StreamlinedGrew

6
FY18 Strategic Priorities – From Launch to Scale
DEPLOY CONNECT ENABLE
• Generate meaningful
portion of total Systems
sales from new devices
• Surpass 2 million connected
devices globally
• Grow base of devices
connected to Verifone
gateways and estate
management systems
• Brand and scale Payments
and Commerce Services
Platform

7
Commerce Services
Coupons
Card-based
loyalty
programs
Employee
Management
POS solutions
Advertising
Omni-channel
PaymentServices
POS Devices
mPOS
Engage
Payment
gatewaysCarbon
Security
Services Alternative
payments
InventoryUnattended
Device
services
CRM
Ratings
Accounting
$4B
Commerce
Services>$25B+
Payment
Services
POS
Devices
>$10B+
Total Addressable Market (TAM)
The Verifone Payments and Commerce Services Platform
Charity

8
Verifone Returns to Growth in FY18
Adjusted* Growth at Midpoint
Non-GAAP Revenues +2%
Plans to offset difficult FY17 comps in Petro North America and India
Higher EPS growth from margin expansion and share buyback accretion
*Adjusted for divestitures of China and Taxi for comparison. See Appendix for reconciliation.
Confidence in execution roadmap
9
To be our clients’ most trusted,
secure, and innovative
technology partner, providing
integrated payments and
commerce solutions globally
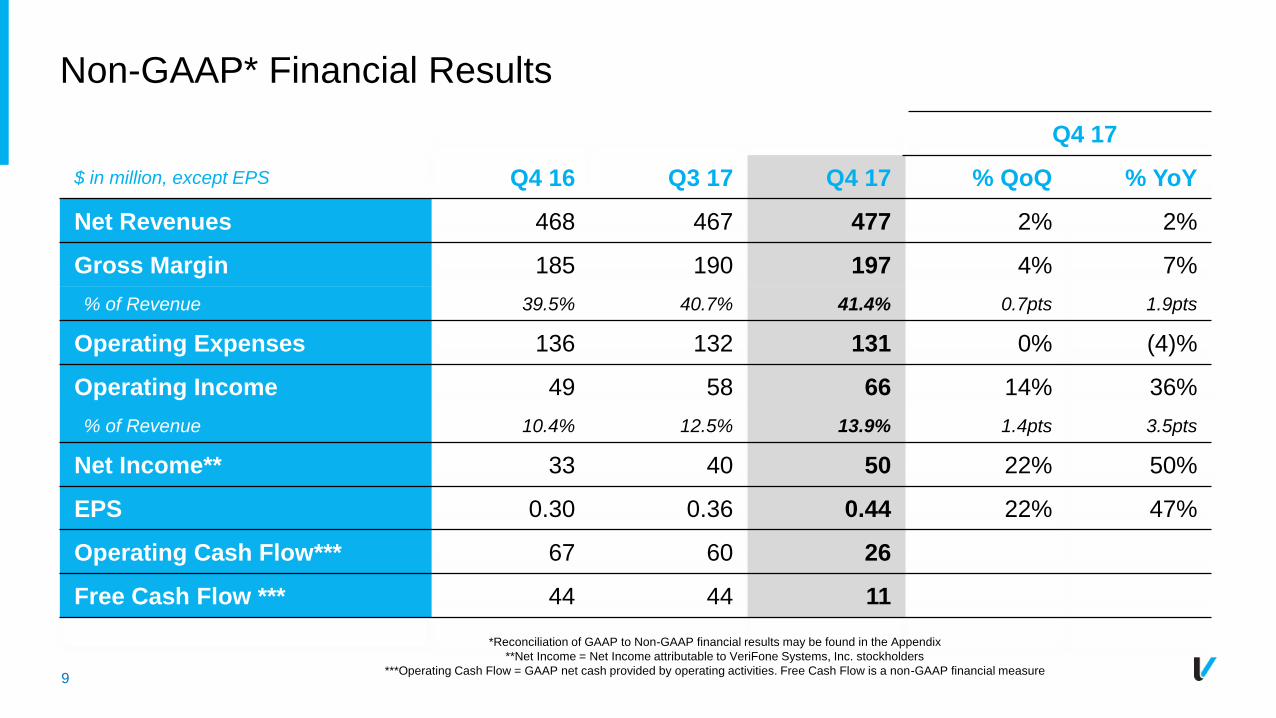
Non-GAAP* Financial Results
Q4 17
$ in million, except EPS Q4 16 Q3 17 Q4 17 % QoQ % YoY
Net Revenues 468 467 477 2% 2%
Gross Margin 185 190 197 4% 7%
% of Revenue 39.5% 40.7% 41.4% 0.7pts 1.9pts
Operating Expenses 136 132 131 0% (4)%
Operating Income 49 58 66 14% 36%
% of Revenue 10.4% 12.5% 13.9% 1.4pts 3.5pts
Net Income** 33 40 50 22% 50%
EPS 0.30 0.36 0.44 22% 47%
Operating Cash Flow*** 67 60 26
Free Cash Flow *** 44 44 11
*Reconciliation of GAAP to Non-GAAP financial results may be found in the Appendix
**Net Income = Net Income attributable to VeriFone Systems, Inc. stockholders
***Operating Cash Flow = GAAP net cash provided by operating activities. Free Cash Flow is a non-GAAP financial measure

10
Non-GAAP* Revenue and Gross Margin by Business
$ in million Q4 16 Q3 17 Q4 17
Systems 264 266 268
Services 203 201 208
Total Net Revenue 468 467 477
Services / Net Revenue 43% 43% 44%
As a % of Revenue Q4 16 Q3 17 Q4 17
Systems 35.2% 37.9% 37.7%
Services 45.1% 44.4% 46.2%
Gross Margin 39.5% 40.7% 41.4%
*Reconciliation of GAAP to Non-GAAP financial results may be found in the Appendix
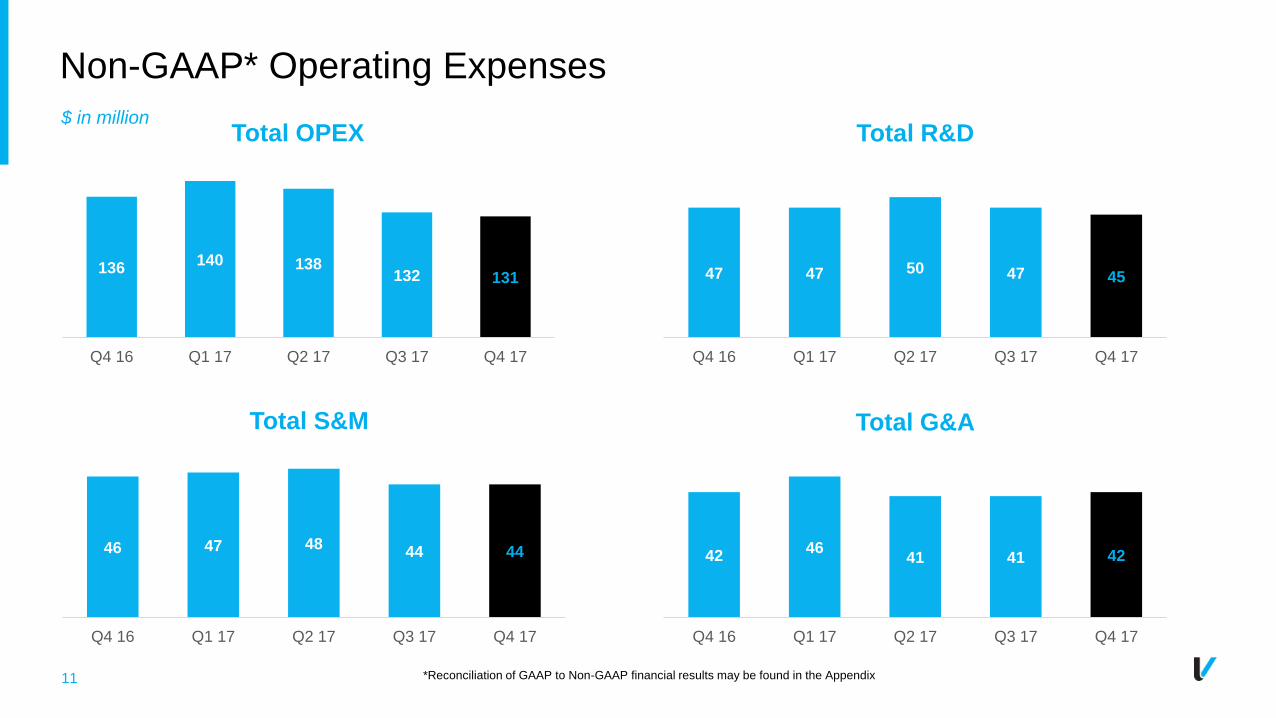
11
Non-GAAP* Operating Expenses
46 47 4844 44
Q4 16 Q1 17 Q2 17 Q3 17 Q4 17
Total S&M
136140 138
132 131
Q4 16 Q1 17 Q2 17 Q3 17 Q4 17
Total OPEX
4246
41 41 42
Q4 16 Q1 17 Q2 17 Q3 17 Q4 17
Total G&A
47 47 50 47 45
Q4 16 Q1 17 Q2 17 Q3 17 Q4 17
Total R&D$ in million
*Reconciliation of GAAP to Non-GAAP financial results may be found in the Appendix
12
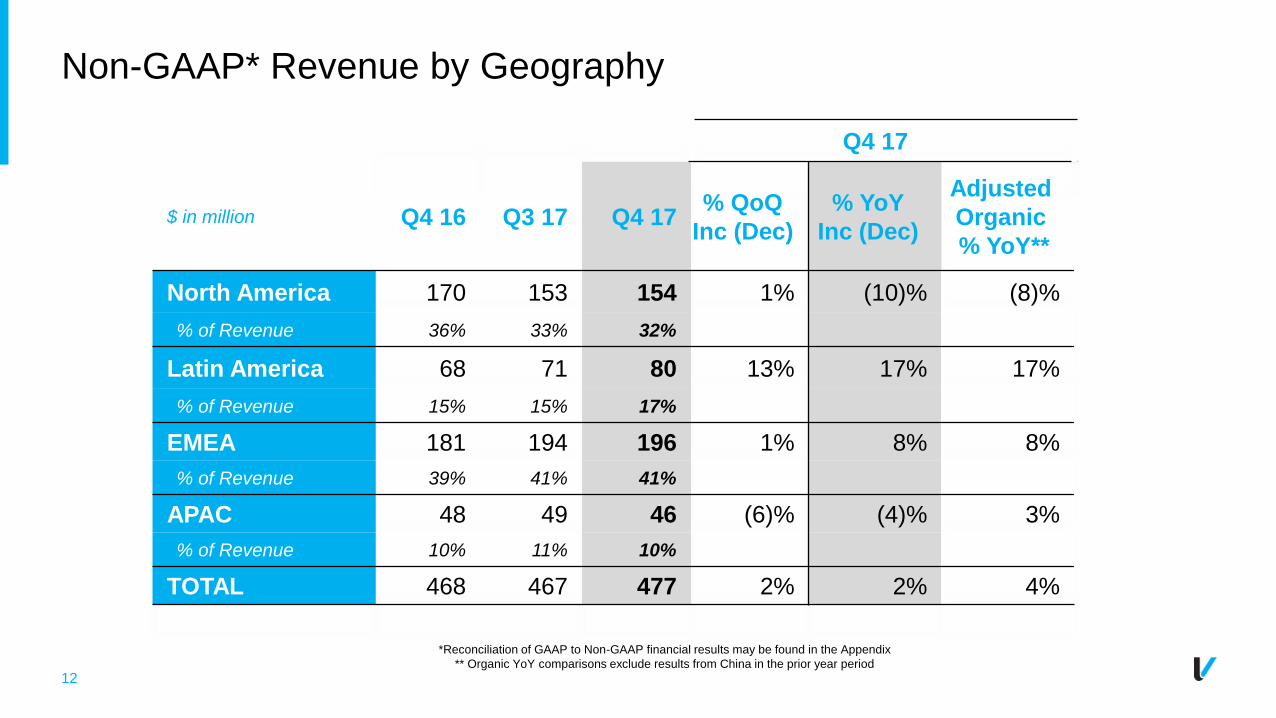
Non-GAAP* Revenue by Geography
Q4 17
$ in million Q4 16 Q3 17 Q4 17% QoQ
Inc (Dec)
% YoY
Inc (Dec)
Adjusted
Organic
% YoY**
North America 170 153 154 1% (10)% (8)%
% of Revenue 36% 33% 32%
Latin America 68 71 80 13% 17% 17%
% of Revenue 15% 15% 17%
EMEA 181 194 196 1% 8% 8%
% of Revenue 39% 41% 41%
APAC 48 49 46 (6)% (4)% 3%
% of Revenue 10% 11% 10%
TOTAL 468 467 477 2% 2% 4%
*Reconciliation of GAAP to Non-GAAP financial results may be found in the Appendix
** Organic YoY comparisons exclude results from China in the prior year period

13
Cash & Debt
933955
974
926904
878 878
831
Q1 16 Q2 16 Q3 16 Q4 16 Q1 17 Q2 17 Q3 17 Q4 17
Gross Debt186
157 157148 147
134
159
131
Q1 16 Q2 16 Q3 16 Q4 16 Q1 17 Q2 17 Q3 17 Q4 17
Total Cash$ in million
747
798817
778757
744
719700
Q1 16 Q2 16 Q3 16 Q4 16 Q1 17 Q2 17 Q3 17 Q4 17
Net Debt
Debt Statistics Credit RatingsAs of October 31, 2017
Short Term $69M S&P BB
Long Term $762M Moody’s Ba2
Outstanding $831M

14
Balance Sheet & Working Capital Metrics*
$ in million Q4 16 Q3 17 Q4 17
$ Days $ Days $ Days
Accounts Receivable, net 323 62 326 63 323 61
Inventories 175 57 127 44 127 41
Accounts Payable 155 49 157 51 145 47
Cash Conversion Cycle 70 56 55
*Reconciliation of GAAP to Non-GAAP financial results may be found in the Appendix
Accounts Receivable Days is calculated as Accounts Receivable, net divided by Non-GAAP Total Net Revenues multiplied by 90 days
Inventory Days is calculated as Average Inventory divided by Non-GAAP Total Cost of Net Revenues multiplied by 90 days
Accounts Payable Days is calculated as Accounts Payable divided by Non-GAAP Total Cost of Net Revenues multiplied by 90 days
Cash Conversion Cycle is calculated as Accounts Receivable Days plus Inventory Days less Accounts Payable Days

15
Cash Flow*
66
51
13
67
4536
60
26
Q1 16 Q2 16 Q3 16 Q4 16 Q1 17 Q2 17 Q3 17 Q4 17
Operating cash flow**
36
24
(11)
44
25
19
44
11
Q1 16 Q2 16 Q3 16 Q4 16 Q1 17 Q2 17 Q3 17 Q4 17
Free cash flow**
$26M
Operating Cash Flow
$15M
Cap Ex
$11M
Free Cash Flow
*Reconciliation of GAAP to Non-GAAP financial results may be found in the Appendix
**Operating Cash Flow = GAAP net cash provided by operating activities. Free Cash Flow is a non-GAAP financial measure
$ in million
FY17 Cap Ex of
$67M was 35%
lower YoY
16
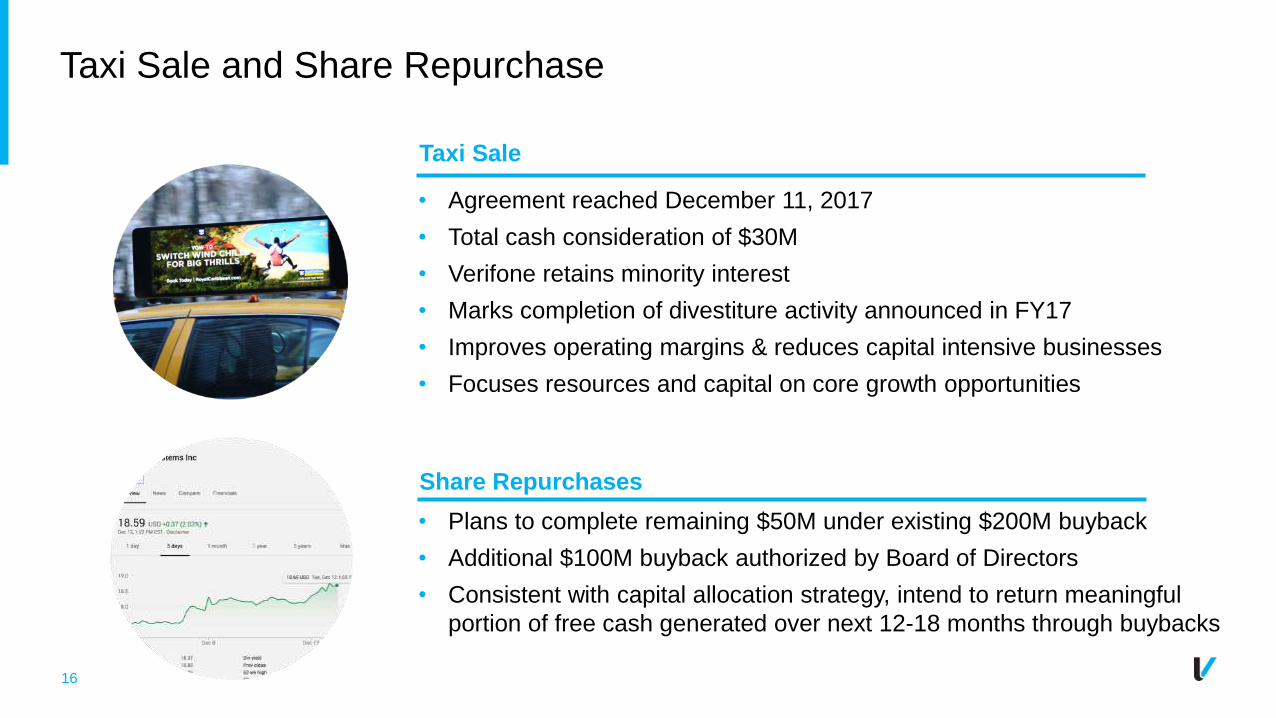
Taxi Sale and Share Repurchase
Taxi Sale
• Agreement reached December 11, 2017
• Total cash consideration of $30M
• Verifone retains minority interest
• Marks completion of divestiture activity announced in FY17
• Improves operating margins & reduces capital intensive businesses
• Focuses resources and capital on core growth opportunities
Share Repurchases
• Plans to complete remaining $50M under existing $200M buyback
• Additional $100M buyback authorized by Board of Directors
• Consistent with capital allocation strategy, intend to return meaningful
portion of free cash generated over next 12-18 months through buybacks

17
FY18 Non-GAAP* Guidance Bridge - RevenueIn $ million
*Reconciliation of GAAP to Non-GAAP guidance may be found in the Appendix.
Adjusted for divestitures of China and Taxi for comparison. See Appendix for reconciliation.
1,756
China/Taxi
Divestitures
FY17
Revenue
Adjusted
(118)
FY17
Revenue
Reported
1,874
1,756
Petro
EMV
(35)
FY17
Revenue
Adjusted
India
Surge
(35)
Core
Growth
90-
115
1,775-
1,800
FY18
Guidance

18
FY18 Non-GAAP* Guidance Bridge - EPS
0.09
FY17 EPS
Adjusted
1.40
China/Taxi
Impact
FY17 EPS
Reported
1.31
(0.10)
Scaling NPI/
efficiencies
1.47-
1.50
0.15-
0.18
FY18
Guidance
Share
Buybacks
0.02
Higher
Tax Rate
FY17 EPS
Adjusted
1.40
*Reconciliation of GAAP to Non-GAAP guidance may be found in the Appendix.
Adjusted for divestitures of China and Taxi for comparison. See Appendix for reconciliation.
19
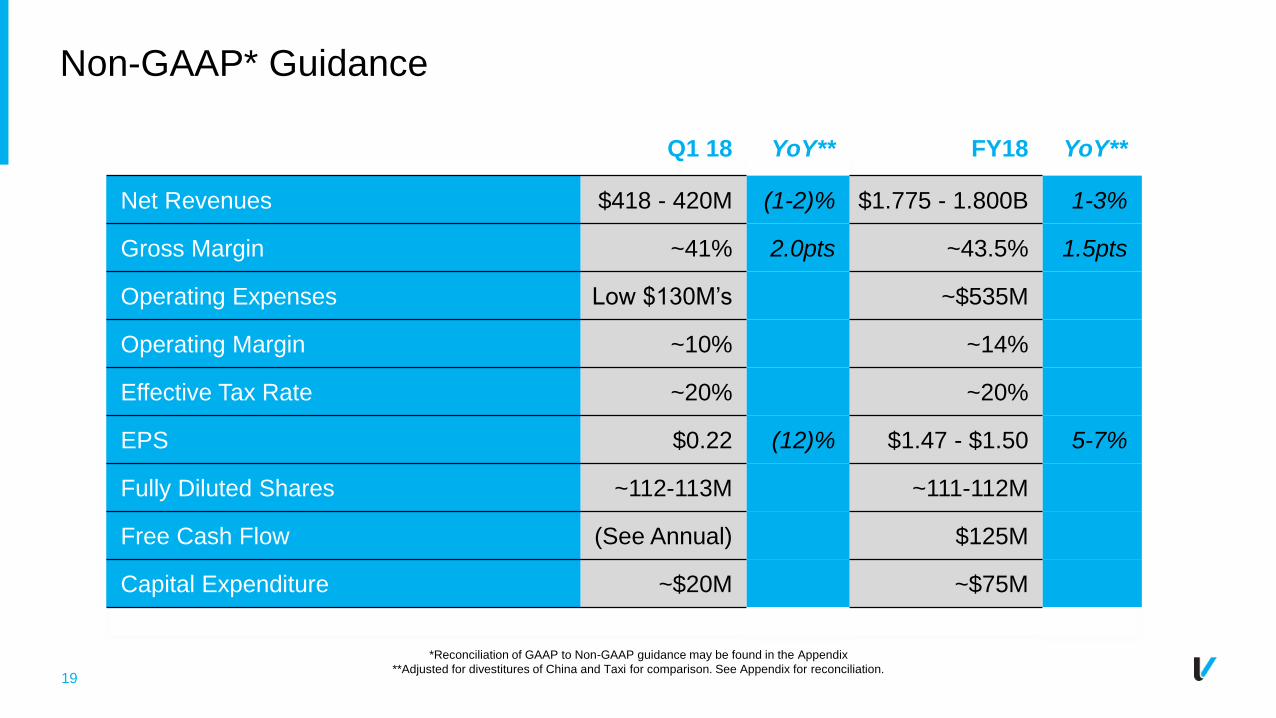
Non-GAAP* Guidance
*Reconciliation of GAAP to Non-GAAP guidance may be found in the Appendix
**Adjusted for divestitures of China and Taxi for comparison. See Appendix for reconciliation.
Q1 18 YoY** FY18 YoY**
Net Revenues $418 - 420M (1-2)% $1.775 - 1.800B 1-3%
Gross Margin ~41% 2.0pts ~43.5% 1.5pts
Operating Expenses Low $130M’s ~$535M
Operating Margin ~10% ~14%
Effective Tax Rate ~20% ~20%
EPS $0.22 (12)% $1.47 - $1.50 5-7%
Fully Diluted Shares ~112-113M ~111-112M
Free Cash Flow (See Annual) $125M
Capital Expenditure ~$20M ~$75M

2020

21
APPENDIX
21

22
Reconciliation of GAAP to Non-GAAP Key Metrics Q417
(In millions, except per share data and percentages)
Note Net revenues Gross marginGross margin
percentageOperating income
Income tax provision
Net income attributable to
VeriFone Systems, Inc. stockholdersThree Months Ended October 31, 2017
GAAP $ 476.5 $ 194.4 40.8% $ 23.7 $ 10.4 $ 3.1
Adjustments:
Amortization of purchased intangible assets E — 1.2 16.9 — 19.6
Other merger and acquisition related expenses E — — 0.3 — 0.3
Stock based compensation F — 1.4 9.8 — 9.8
Restructuring and related charges G — 0.4 7.9 — 7.9
Other charges and income G — — 7.7 — 7.7
Income tax effect of non-GAAP exclusions (2) H — — — (1.8) 1.8
Non-GAAP $ 476.5 $ 197.4 41.4% $ 66.3 $ 8.6 $ 50.2
Divested business:
Taxi Solutions business D,H 26.4 6.2 2.0 0.3 1.7
Adjusted Non-GAAP, excluding divested businesses $ 450.1 $ 191.2 42.5% $ 64.3 $ 8.3 $ 48.5
Weighted average number of shares used in computing net income per
share:Net income per share attributable to
VeriFone Systems, Inc. stockholders (1)
Basic Diluted Basic Diluted
GAAP 112.3 113.1 0.03 0.03
Non-GAAP 112.3 113.1 $ 0.45 $ 0.44
Adjusted Non-GAAP, excluding divested businesss 112.3 113.1 $ 0.43 $ 0.43
(1) Diluted net income (loss) per share is calculated by dividing the Net income (loss) attributable to VeriFone Systems, Inc. stockholders by the weighted average number of shares used in
computing net income (loss) per share attributable to VeriFone Systems, Inc. stockholders.
(2) For the purpose of computing the income tax effect of non-GAAP exclusions, we used a 14.5% rate.
23
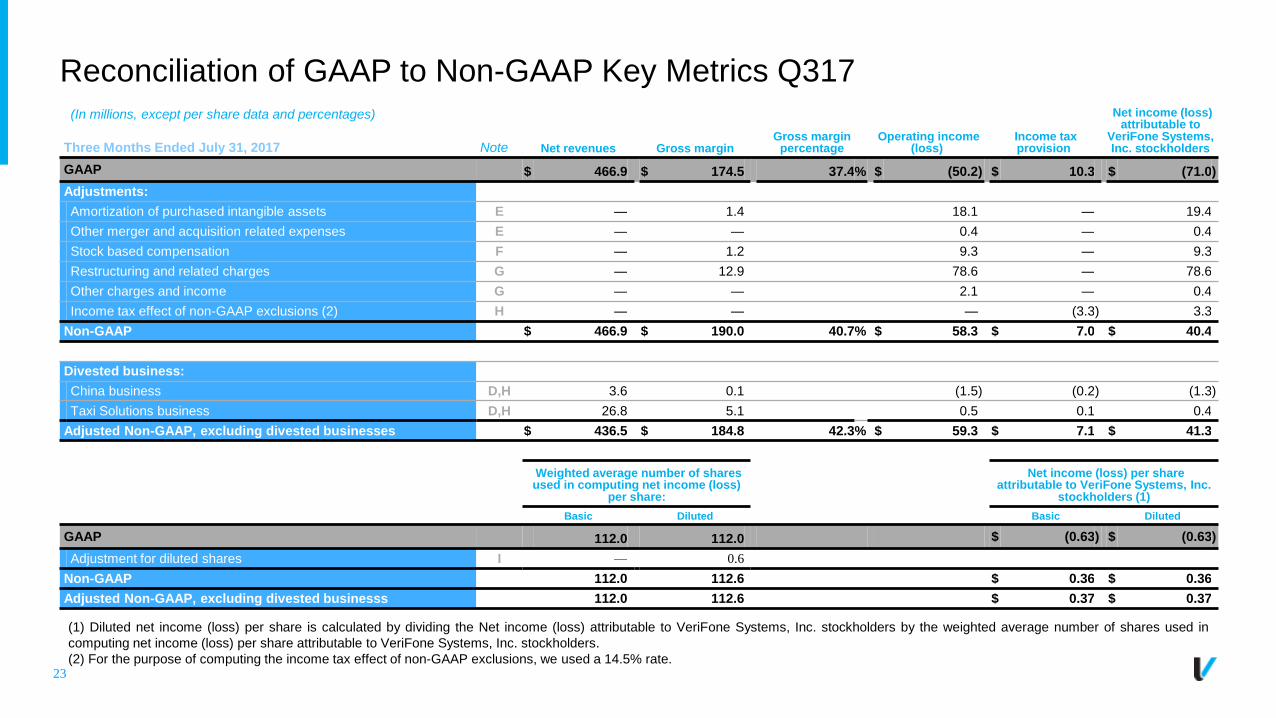
Reconciliation of GAAP to Non-GAAP Key Metrics Q317(In millions, except per share data and percentages)
Note Net revenues Gross marginGross margin
percentageOperating income
(loss)Income tax provision
Net income (loss) attributable to
VeriFone Systems, Inc. stockholdersThree Months Ended July 31, 2017
GAAP $ 466.9 $ 174.5 37.4% $ (50.2) $ 10.3 $ (71.0)
Adjustments:
Amortization of purchased intangible assets E — 1.4 18.1 — 19.4
Other merger and acquisition related expenses E — — 0.4 — 0.4
Stock based compensation F — 1.2 9.3 — 9.3
Restructuring and related charges G — 12.9 78.6 — 78.6
Other charges and income G — — 2.1 — 0.4
Income tax effect of non-GAAP exclusions (2) H — — — (3.3) 3.3
Non-GAAP $ 466.9 $ 190.0 40.7% $ 58.3 $ 7.0 $ 40.4
Divested business:
China business D,H 3.6 0.1 (1.5) (0.2) (1.3)
Taxi Solutions business D,H 26.8 5.1 0.5 0.1 0.4
Adjusted Non-GAAP, excluding divested businesses $ 436.5 $ 184.8 42.3% $ 59.3 $ 7.1 $ 41.3
Weighted average number of shares used in computing net income (loss)
per share:
Net income (loss) per share attributable to VeriFone Systems, Inc.
stockholders (1)
Basic Diluted Basic Diluted
GAAP 112.0 112.0 $ (0.63) $ (0.63)
Adjustment for diluted shares I — 0.6
Non-GAAP 112.0 112.6 $ 0.36 $ 0.36
Adjusted Non-GAAP, excluding divested businesss 112.0 112.6 $ 0.37 $ 0.37
(1) Diluted net income (loss) per share is calculated by dividing the Net income (loss) attributable to VeriFone Systems, Inc. stockholders by the weighted average number of shares used in
computing net income (loss) per share attributable to VeriFone Systems, Inc. stockholders.
(2) For the purpose of computing the income tax effect of non-GAAP exclusions, we used a 14.5% rate.
24
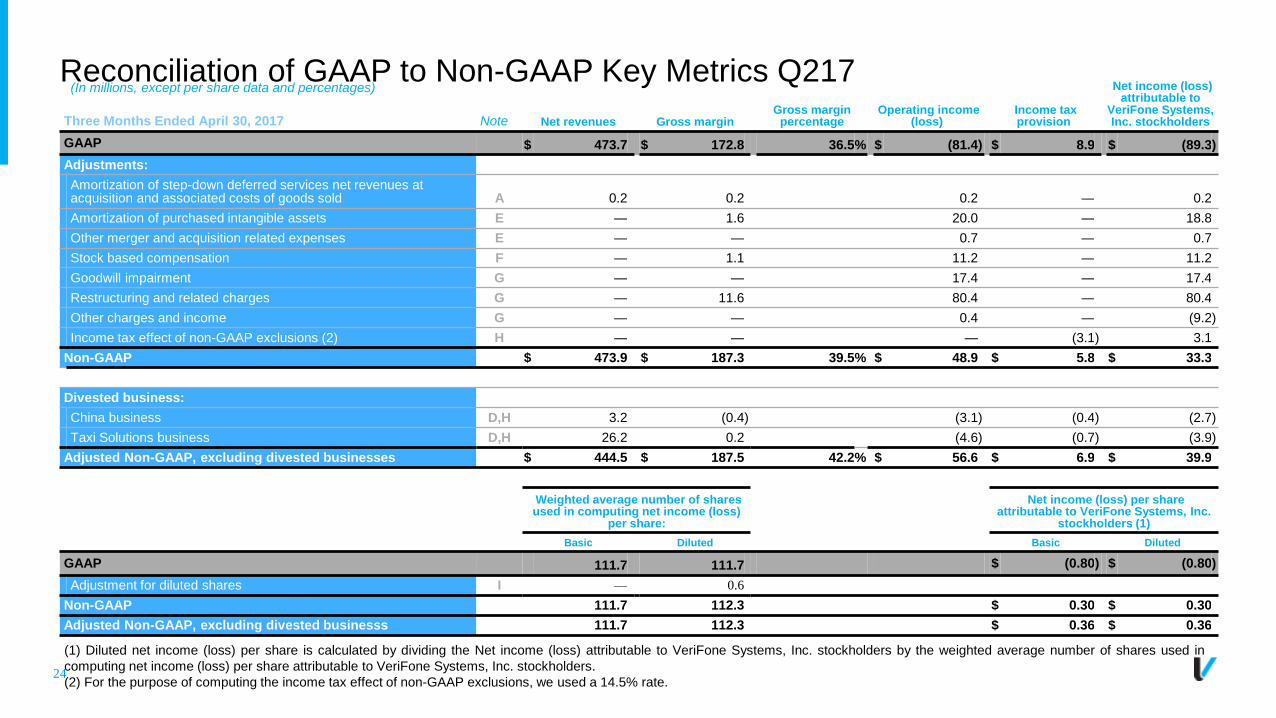
Reconciliation of GAAP to Non-GAAP Key Metrics Q217(In millions, except per share data and percentages)
Note Net revenues Gross marginGross margin
percentageOperating income
(loss)Income tax provision
Net income (loss) attributable to
VeriFone Systems, Inc. stockholdersThree Months Ended April 30, 2017
GAAP $ 473.7 $ 172.8 36.5% $ (81.4) $ 8.9 $ (89.3)
Adjustments:
Amortization of step-down deferred services net revenues at acquisition and associated costs of goods sold A 0.2 0.2 0.2 — 0.2
Amortization of purchased intangible assets E — 1.6 20.0 — 18.8
Other merger and acquisition related expenses E — — 0.7 — 0.7
Stock based compensation F — 1.1 11.2 — 11.2
Goodwill impairment G — — 17.4 — 17.4
Restructuring and related charges G — 11.6 80.4 — 80.4
Other charges and income G — — 0.4 — (9.2)
Income tax effect of non-GAAP exclusions (2) H — — — (3.1) 3.1
Non-GAAP $ 473.9 $ 187.3 39.5% $ 48.9 $ 5.8 $ 33.3
Divested business:
China business D,H 3.2 (0.4) (3.1) (0.4) (2.7)
Taxi Solutions business D,H 26.2 0.2 (4.6) (0.7) (3.9)
Adjusted Non-GAAP, excluding divested businesses $ 444.5 $ 187.5 42.2% $ 56.6 $ 6.9 $ 39.9
Weighted average number of shares used in computing net income (loss)
per share:
Net income (loss) per share attributable to VeriFone Systems, Inc.
stockholders (1)
Basic Diluted Basic Diluted
GAAP 111.7 111.7 $ (0.80) $ (0.80)
Adjustment for diluted shares I — 0.6
Non-GAAP 111.7 112.3 $ 0.30 $ 0.30
Adjusted Non-GAAP, excluding divested businesss 111.7 112.3 $ 0.36 $ 0.36
(1) Diluted net income (loss) per share is calculated by dividing the Net income (loss) attributable to VeriFone Systems, Inc. stockholders by the weighted average number of shares used in
computing net income (loss) per share attributable to VeriFone Systems, Inc. stockholders.
(2) For the purpose of computing the income tax effect of non-GAAP exclusions, we used a 14.5% rate.
25
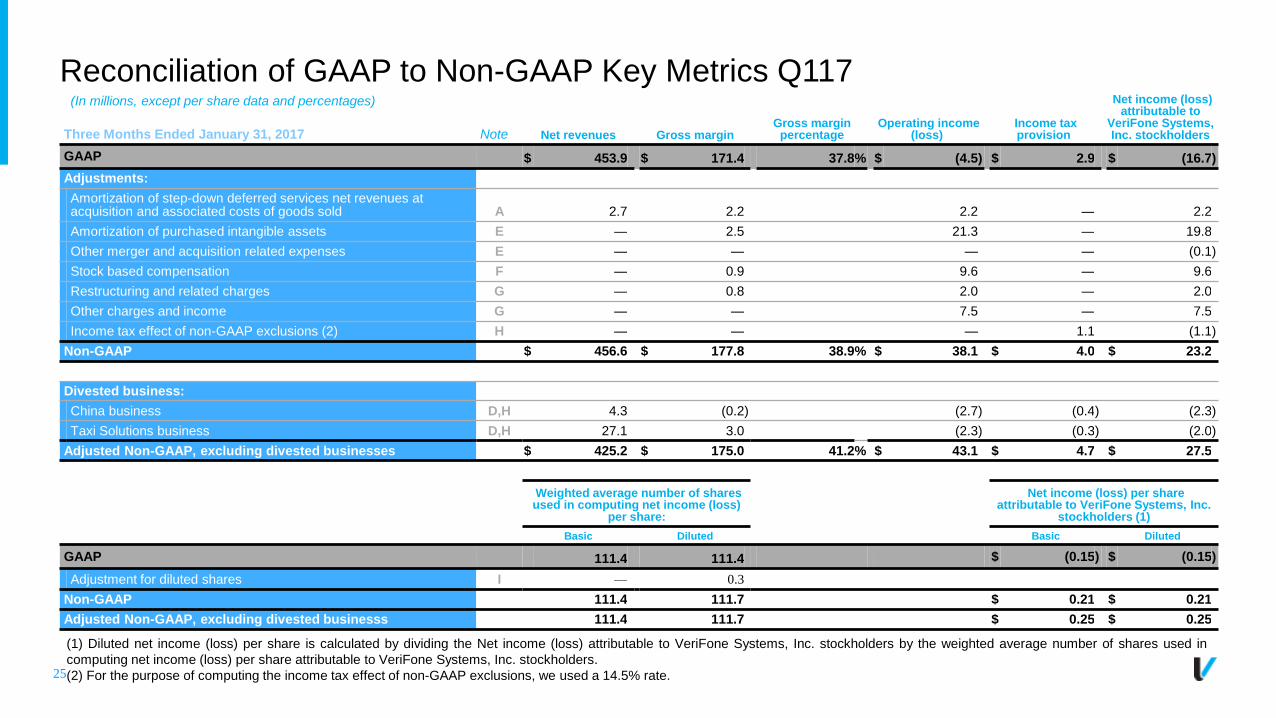
Reconciliation of GAAP to Non-GAAP Key Metrics Q117(In millions, except per share data and percentages)
Note Net revenues Gross marginGross margin
percentageOperating income
(loss)Income tax provision
Net income (loss) attributable to
VeriFone Systems, Inc. stockholdersThree Months Ended January 31, 2017
GAAP $ 453.9 $ 171.4 37.8% $ (4.5) $ 2.9 $ (16.7)
Adjustments:
Amortization of step-down deferred services net revenues at acquisition and associated costs of goods sold A 2.7 2.2 2.2 — 2.2
Amortization of purchased intangible assets E — 2.5 21.3 — 19.8
Other merger and acquisition related expenses E — — — — (0.1)
Stock based compensation F — 0.9 9.6 — 9.6
Restructuring and related charges G — 0.8 2.0 — 2.0
Other charges and income G — — 7.5 — 7.5
Income tax effect of non-GAAP exclusions (2) H — — — 1.1 (1.1)
Non-GAAP $ 456.6 $ 177.8 38.9% $ 38.1 $ 4.0 $ 23.2
Divested business:
China business D,H 4.3 (0.2) (2.7) (0.4) (2.3)
Taxi Solutions business D,H 27.1 3.0 (2.3) (0.3) (2.0)
Adjusted Non-GAAP, excluding divested businesses $ 425.2 $ 175.0 41.2% $ 43.1 $ 4.7 $ 27.5
Weighted average number of shares used in computing net income (loss)
per share:
Net income (loss) per share attributable to VeriFone Systems, Inc.
stockholders (1)
Basic Diluted Basic Diluted
GAAP 111.4 111.4 $ (0.15) $ (0.15)
Adjustment for diluted shares I — 0.3
Non-GAAP 111.4 111.7 $ 0.21 $ 0.21
Adjusted Non-GAAP, excluding divested businesss 111.4 111.7 $ 0.25 $ 0.25
(1) Diluted net income (loss) per share is calculated by dividing the Net income (loss) attributable to VeriFone Systems, Inc. stockholders by the weighted average number of shares used in
computing net income (loss) per share attributable to VeriFone Systems, Inc. stockholders.
(2) For the purpose of computing the income tax effect of non-GAAP exclusions, we used a 14.5% rate.

26
Reconciliation of GAAP to Non-GAAP Key Metrics Q416
(1) Diluted net income (loss) per share is calculated by dividing the Net income (loss) attributable to VeriFone Systems, Inc. stockholders by the weighted average number of shares used in
computing net income (loss) per share attributable to VeriFone Systems, Inc. stockholders.
(2) For the purpose of computing the income tax effect of non-GAAP exclusions, we used a 14.5% rate.
(In millions, except per share data and percentages)
Note Net revenues Gross marginGross margin
percentageOperating income
(loss)Income tax provision
Net income (loss) attributable to
VeriFone Systems, Inc. stockholdersThree Months Ended October 31, 2016
GAAP $ 464.2 $ 177.5 38.2% $ (0.9) $ 6.2 $ (4.5)
Adjustments:
Amortization of step-down in deferred services net revenues at acquisition and associated cost of goods sold A 3.4 2.4 2.4 — 2.4
Amortization of purchased intangible assets E — 3.4 28.0 — 28.0
Other merger and acquisition related expenses E — — 0.8 — (11.7)
Stock based compensation F — 0.8 9.4 — 9.4
Restructuring and related charges G — — 7.1 — 7.1
Other charges and income G — 0.6 1.9 — 1.9
Income tax effect of non-GAAP exclusions (2) H — — — (0.5) 0.5
Non-GAAP $ 467.6 $ 184.7 39.5% $ 48.7 $ 5.7 $ 33.1
Divested business:
China business D,H 3.2 (0.2) (4.3) (0.6) (3.7)
Taxi Solutions business D,H 31.1 7.5 2.3 0.3 2.0
Adjusted Non-GAAP, excluding divested businesses $ 433.3 $ 177.4 40.9% $ 50.7 $ 6.0 $ 34.8
Weighted average number of shares used in computing net income (loss)
per share:
Net income (loss) per share attributable to VeriFone Systems, Inc.
stockholders (1)
Basic Diluted Basic Diluted
GAAP 111.1 111.1 $ (0.04) $ (0.04)
Adjustment for diluted shares I — 0.3
Non-GAAP 111.1 111.4 $ 0.30 $ 0.30
Adjusted Non-GAAP, excluding divested businesss 111.1 111.4 $ 0.31 $ 0.31

27
Reconciliation of GAAP to Non-GAAP Key Metrics 2017(In millions, except per share data and percentages)
Note Net revenues Gross marginGross margin
percentageOperating income
(loss)Income tax provision
Net income (loss) attributable to
VeriFone Systems, Inc. stockholdersYear Ended October 31, 2017
GAAP $ 1,871.0 $ 713.1 38.1% $ (112.4) $ 32.5 $ (173.9)
Adjustments:
Amortization of step-down deferred services net revenues at acquisition and associated costs of goods sold A 3.0 2.4 2.4 — 2.4
Amortization of purchased intangible assets E — 6.7 76.3 — 77.6
Other merger and acquisition related expenses E — — 1.4 — 1.3
Stock based compensation F — 4.6 39.9 — 39.9
Goodwill impairment G — — 17.4 — 17.4
Restructuring and related charges G — 25.7 168.9 — 168.9
Other charges and income G — — 17.7 — 6.5
Income tax effect of non-GAAP exclusions (2) H — — — (7.1) 7.1
Non-GAAP $ 1,874.0 $ 752.5 40.2% $ 211.6 $ 25.4 $ 147.2
Divested business:
China business D,H 11.2 (0.5) (7.2) (1.0) (6.2)
Taxi Solutions business D,H 106.5 14.5 (4.5) (0.7) (3.8)
Adjusted Non-GAAP, excluding divested businesses $ 1,756.3 $ 738.5 42.0% $ 223.3 $ 27.1 $ 157.2
Weighted average number of shares used in computing net income (loss)
per share:
Net income (loss) per share attributable to VeriFone Systems, Inc.
stockholders (1)
Basic Diluted Basic Diluted
GAAP 111.8 111.8 $ (1.55) $ (1.55)
Adjustment for diluted shares I — 0.7
Non-GAAP 111.8 112.5 $ 1.32 $ 1.31
Adjusted Non-GAAP, excluding divested businesss 111.8 112.5 $ 1.41 $ 1.40
(1) Diluted net income (loss) per share is calculated by dividing the Net income (loss) attributable to VeriFone Systems, Inc. stockholders by the weighted average number of shares used in
computing net income (loss) per share attributable to VeriFone Systems, Inc. stockholders.
(2) For the purpose of computing the income tax effect of non-GAAP exclusions, we used a 14.5% rate.
28
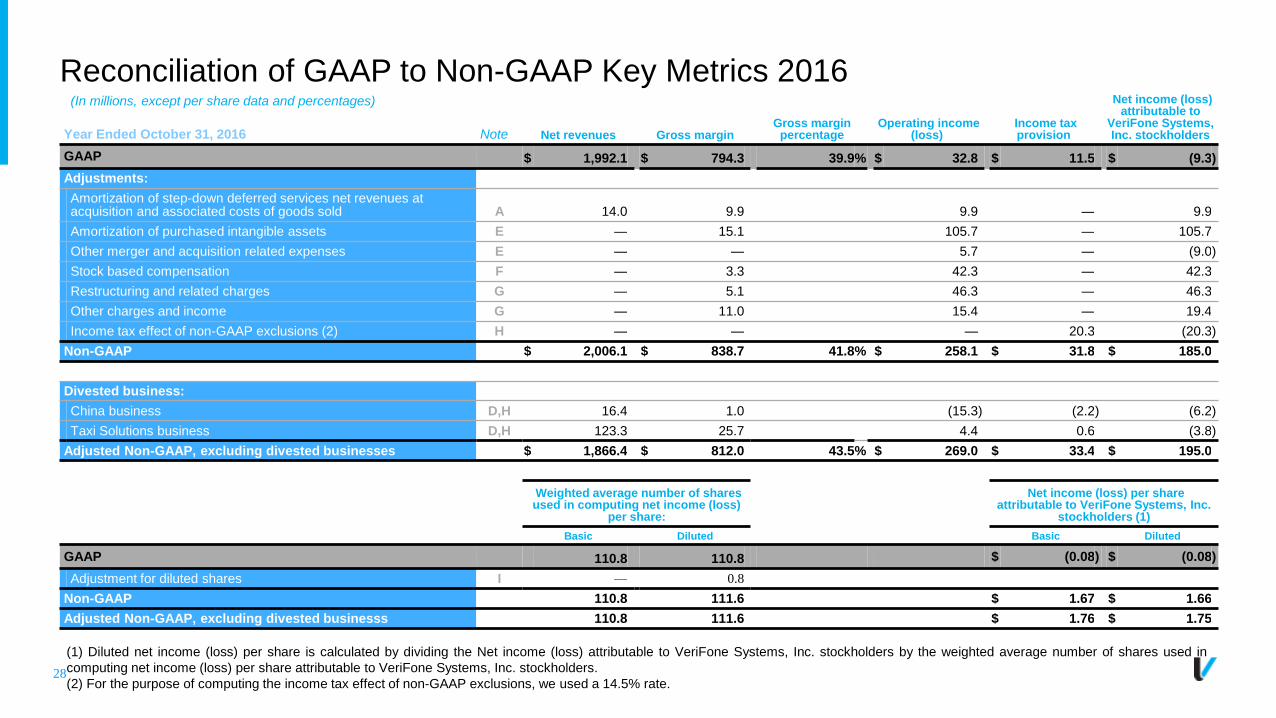
Reconciliation of GAAP to Non-GAAP Key Metrics 2016(In millions, except per share data and percentages)
Note Net revenues Gross marginGross margin
percentageOperating income
(loss)Income tax provision
Net income (loss) attributable to
VeriFone Systems, Inc. stockholdersYear Ended October 31, 2016
GAAP $ 1,992.1 $ 794.3 39.9% $ 32.8 $ 11.5 $ (9.3)
Adjustments:
Amortization of step-down deferred services net revenues at acquisition and associated costs of goods sold A 14.0 9.9 9.9 — 9.9
Amortization of purchased intangible assets E — 15.1 105.7 — 105.7
Other merger and acquisition related expenses E — — 5.7 — (9.0)
Stock based compensation F — 3.3 42.3 — 42.3
Restructuring and related charges G — 5.1 46.3 — 46.3
Other charges and income G — 11.0 15.4 — 19.4
Income tax effect of non-GAAP exclusions (2) H — — — 20.3 (20.3)
Non-GAAP $ 2,006.1 $ 838.7 41.8% $ 258.1 $ 31.8 $ 185.0
Divested business:
China business D,H 16.4 1.0 (15.3) (2.2) (6.2)
Taxi Solutions business D,H 123.3 25.7 4.4 0.6 (3.8)
Adjusted Non-GAAP, excluding divested businesses $ 1,866.4 $ 812.0 43.5% $ 269.0 $ 33.4 $ 195.0
Weighted average number of shares used in computing net income (loss)
per share:
Net income (loss) per share attributable to VeriFone Systems, Inc.
stockholders (1)
Basic Diluted Basic Diluted
GAAP 110.8 110.8 $ (0.08) $ (0.08)
Adjustment for diluted shares I — 0.8
Non-GAAP 110.8 111.6 $ 1.67 $ 1.66
Adjusted Non-GAAP, excluding divested businesss 110.8 111.6 $ 1.76 $ 1.75
(1) Diluted net income (loss) per share is calculated by dividing the Net income (loss) attributable to VeriFone Systems, Inc. stockholders by the weighted average number of shares used in
computing net income (loss) per share attributable to VeriFone Systems, Inc. stockholders.
(2) For the purpose of computing the income tax effect of non-GAAP exclusions, we used a 14.5% rate.
29
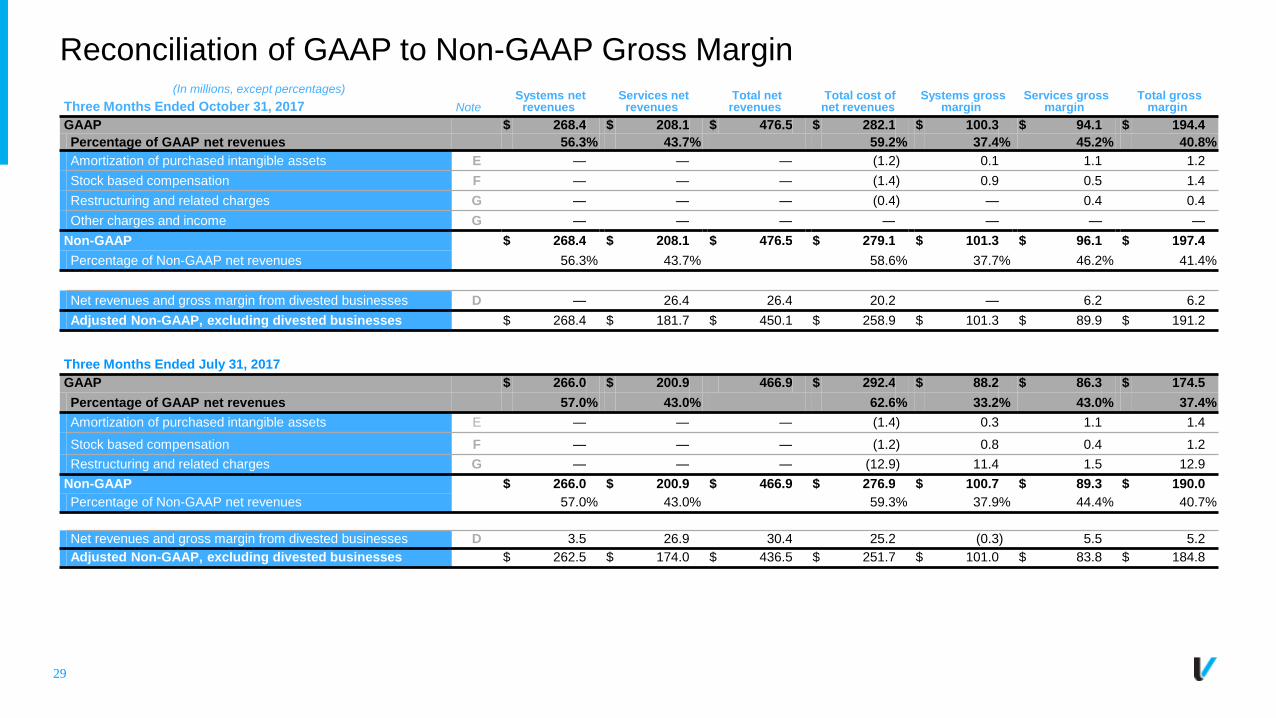
Reconciliation of GAAP to Non-GAAP Gross Margin(In millions, except percentages)
NoteSystems net
revenuesServices net
revenuesTotal net
revenuesTotal cost of
net revenuesSystems gross
marginServices gross
marginTotal gross
marginThree Months Ended October 31, 2017
GAAP $ 268.4 $ 208.1 $ 476.5 $ 282.1 $ 100.3 $ 94.1 $ 194.4
Percentage of GAAP net revenues 56.3% 43.7% 59.2% 37.4% 45.2% 40.8%
Amortization of purchased intangible assets E — — — (1.2) 0.1 1.1 1.2
Stock based compensation F — — — (1.4) 0.9 0.5 1.4
Restructuring and related charges G — — — (0.4) — 0.4 0.4
Other charges and income G — — — — — — —
Non-GAAP $ 268.4 $ 208.1 $ 476.5 $ 279.1 $ 101.3 $ 96.1 $ 197.4
Percentage of Non-GAAP net revenues 56.3% 43.7% 58.6% 37.7% 46.2% 41.4%
Net revenues and gross margin from divested businesses D — 26.4 26.4 20.2 — 6.2 6.2
Adjusted Non-GAAP, excluding divested businesses $ 268.4 $ 181.7 $ 450.1 $ 258.9 $ 101.3 $ 89.9 $ 191.2
Three Months Ended July 31, 2017
GAAP $ 266.0 $ 200.9 466.9 $ 292.4 $ 88.2 $ 86.3 $ 174.5
Percentage of GAAP net revenues 57.0% 43.0% 62.6% 33.2% 43.0% 37.4%
Amortization of purchased intangible assets E — — — (1.4) 0.3 1.1 1.4
Stock based compensation F — — — (1.2) 0.8 0.4 1.2
Restructuring and related charges G — — — (12.9) 11.4 1.5 12.9
Non-GAAP $ 266.0 $ 200.9 $ 466.9 $ 276.9 $ 100.7 $ 89.3 $ 190.0
Percentage of Non-GAAP net revenues 57.0% 43.0% 59.3% 37.9% 44.4% 40.7%
Net revenues and gross margin from divested businesses D 3.5 26.9 30.4 25.2 (0.3) 5.5 5.2
Adjusted Non-GAAP, excluding divested businesses $ 262.5 $ 174.0 $ 436.5 $ 251.7 $ 101.0 $ 83.8 $ 184.8

30
Reconciliation of GAAP to Non-GAAP Gross Margin(In millions, except percentages)
NoteSystems net
revenuesServices net
revenuesTotal net
revenuesTotal cost of
net revenuesSystems gross
marginServices gross
marginTotal gross
marginThree Months Ended April 30, 2017
GAAP $ 285.7 $ 188.0 $ 473.7 $ 300.9 $ 109.5 $ 63.3 $ 172.8
Percentage of GAAP net revenues 60.3% 39.7% 63.5% 38.3% 33.7% 36.5%
Amortization of step-down in deferred services net revenues at acquisition and associated cost of goods sold E — 0.2 — — — 0.2 0.2
Amortization of purchased intangible assets F — — — (1.6) 0.3 1.3 1.6
Stock based compensation G — — — (1.1) 0.7 0.4 1.1
Restructuring and related charges G — — — (11.6) 0.1 11.5 11.6
Non-GAAP $ 285.7 $ 188.2 $ 473.7 $ 286.6 $ 110.6 $ 76.7 $ 187.3
Percentage of Non-GAAP net revenues 60.3% 39.7% 60.5% 38.7% 40.8% 39.5%
Net revenues and gross margin from divested businesses D 3.0 26.4 29.4 29.5 (0.2) 0.1 (0.1)
Adjusted Non-GAAP, excluding divested businesses $ 282.7 $ 161.8 $ 444.3 $ 257.1 $ 110.8 $ 76.6 $ 187.4
Three Months Ended January 31, 2017
GAAP $ 265.4 $ 188.5 $ 453.9 $ 282.5 $ 99.0 $ 72.4 $ 171.4
Percentage of GAAP net revenues 58.5% 41.5% 62.2% 37.3% 38.4% 37.8%
Amortization of step-down deferred services net revenues at acquisition and associated costs of goods sold A — 2.7 2.7 0.5 — 2.2 2.2
Amortization of purchased intangible assets E — — — (2.5) 1.0 1.5 2.5
Stock based compensation F — — — (0.9) 0.6 0.3 0.9
Restructuring and related charges G — — — (0.8) — 0.8 0.8
Non-GAAP $ 265.4 $ 191.2 $ 456.6 $ 278.8 $ 100.6 $ 77.2 $ 177.8
Percentage of Non-GAAP net revenues 58.1% 41.9% 61.1% 37.9% 40.4% 38.9%
Net revenues and gross margin from divested businesses D 4.0 27.4 31.4 28.6 (0.3) 3.1 2.8
Adjusted Non-GAAP, excluding divested businesses $ 261.4 $ 163.8 $ 425.2 $ 250.2 $ 100.9 $ 74.1 $ 175.0

31
Reconciliation of GAAP to Non-GAAP Gross Margin(In millions, except percentages)
NoteSystems net
revenuesServices net
revenuesTotal net
revenuesTotal cost of
net revenuesSystems gross
marginServices gross
marginTotal gross
marginThree Months Ended October 31, 2016
GAAP $ 264.3 $ 199.9 $ 464.2 $ 286.7 $ 91.0 $ 86.5 $ 177.5
Percentage of GAAP net revenues 56.9% 43.1% 61.8% 34.4% 43.3% 38.2%
Amortization of step-down in deferred services net revenues at acquisition and associated cost of goods sold A — 3.4 3.4 1.0 — 2.4 2.4
Amortization of purchased intangible assets E — — — (3.4) 1.9 1.5 3.4
Stock based compensation F — — — (0.8) 0.5 0.3 0.8
Restructuring and related charges G — — — — (0.5) 0.5 —
Other charges and income G — — — (0.6) — 0.6 0.6
Non-GAAP $ 264.3 $ 203.3 $ 467.6 $ 282.9 $ 92.9 $ 91.8 $ 184.7
Percentage of Non-GAAP net revenues 56.5% 43.5% 60.5% 35.1% 45.2% 39.5%
Net revenues and gross margin from divested businesses D 2.6 31.7 34.3 27.0 (0.5) 7.8 7.3
Adjusted Non-GAAP, excluding divested businesses $ 261.7 $ 171.6 $ 433.3 $ 255.9 $ 93.4 $ 84.0 $ 177.4
32
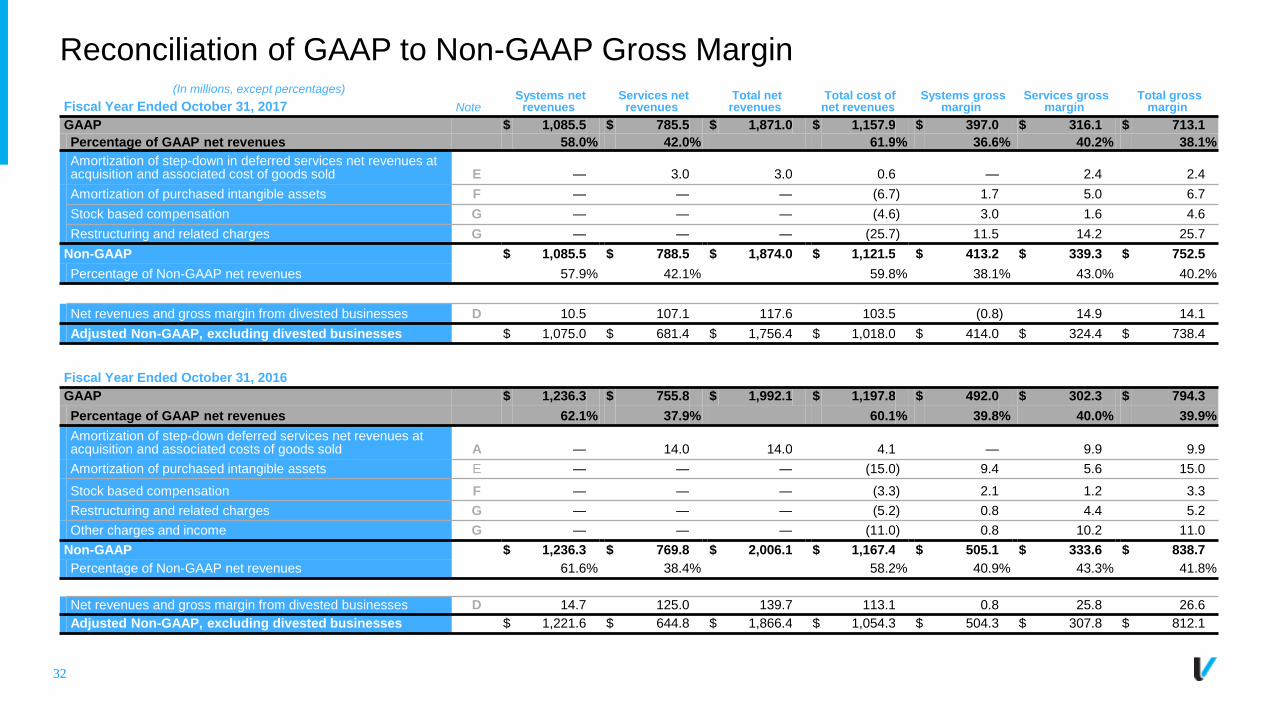
Reconciliation of GAAP to Non-GAAP Gross Margin(In millions, except percentages)
NoteSystems net
revenuesServices net
revenuesTotal net
revenuesTotal cost of
net revenuesSystems gross
marginServices gross
marginTotal gross
marginFiscal Year Ended October 31, 2017
GAAP $ 1,085.5 $ 785.5 $ 1,871.0 $ 1,157.9 $ 397.0 $ 316.1 $ 713.1
Percentage of GAAP net revenues 58.0% 42.0% 61.9% 36.6% 40.2% 38.1%
Amortization of step-down in deferred services net revenues at acquisition and associated cost of goods sold E — 3.0 3.0 0.6 — 2.4 2.4
Amortization of purchased intangible assets F — — — (6.7) 1.7 5.0 6.7
Stock based compensation G — — — (4.6) 3.0 1.6 4.6
Restructuring and related charges G — — — (25.7) 11.5 14.2 25.7
Non-GAAP $ 1,085.5 $ 788.5 $ 1,874.0 $ 1,121.5 $ 413.2 $ 339.3 $ 752.5
Percentage of Non-GAAP net revenues 57.9% 42.1% 59.8% 38.1% 43.0% 40.2%
Net revenues and gross margin from divested businesses D 10.5 107.1 117.6 103.5 (0.8) 14.9 14.1
Adjusted Non-GAAP, excluding divested businesses $ 1,075.0 $ 681.4 $ 1,756.4 $ 1,018.0 $ 414.0 $ 324.4 $ 738.4
Fiscal Year Ended October 31, 2016
GAAP $ 1,236.3 $ 755.8 $ 1,992.1 $ 1,197.8 $ 492.0 $ 302.3 $ 794.3
Percentage of GAAP net revenues 62.1% 37.9% 60.1% 39.8% 40.0% 39.9%
Amortization of step-down deferred services net revenues at acquisition and associated costs of goods sold A — 14.0 14.0 4.1 — 9.9 9.9
Amortization of purchased intangible assets E — — — (15.0) 9.4 5.6 15.0
Stock based compensation F — — — (3.3) 2.1 1.2 3.3
Restructuring and related charges G — — — (5.2) 0.8 4.4 5.2
Other charges and income G — — — (11.0) 0.8 10.2 11.0
Non-GAAP $ 1,236.3 $ 769.8 $ 2,006.1 $ 1,167.4 $ 505.1 $ 333.6 $ 838.7
Percentage of Non-GAAP net revenues 61.6% 38.4% 58.2% 40.9% 43.3% 41.8%
Net revenues and gross margin from divested businesses D 14.7 125.0 139.7 113.1 0.8 25.8 26.6
Adjusted Non-GAAP, excluding divested businesses $ 1,221.6 $ 644.8 $ 1,866.4 $ 1,054.3 $ 504.3 $ 307.8 $ 812.1

33
Reconciliation of GAAP to Non-GAAP Operating Expenses
(In millions, except percentages)
NoteResearch and development
Sales and marketing
General and administrative
Restructuring and related
charges
Amortization of purchased
intangible assets TotalThree Months Ended October 31, 2017
GAAP $ 53.1 $ 47.2 $ 47.2 $ 7.5 15.7 $ 170.7
% of total GAAP net revenues 11.1% 9.9% 9.9% 1.6% 3.3% 36.0%
Amortization of purchased intangible assets E — — — — (15.7) (15.7)
Other merger and acquisition related expenses E — — (0.3) — — (0.3)
Stock based compensation F (1.2) (2.8) (4.4) — — (8.4)
Restructuring and related charges G — — — (7.5) — (7.5)
Other charges and income G (6.7) — (1.0) — — (7.7)
Non-GAAP $ 45.2 $ 44.4 $ 41.5 $ — $ — $ 131.1
% of total Non-GAAP net revenues 9.5% 9.3% 8.7% —% —% 27.5%
Three Months Ended July 31, 2017
GAAP $ 50.7 $ 46.7 $ 44.9 $ 65.7 $ 16.7 $ 224.7
% of total GAAP net revenues 10.9% 10.0% 9.6% 13.9% 3.6% 48.1%
Amortization of purchased intangible assets E — — — — (16.7) (16.7)
Other merger and acquisition related expenses E — — (0.4) — — (0.4)
Stock based compensation F (1.8) (2.9) (3.4) — — (8.1)
Restructuring and related charges G — — — (65.7) — (65.7)
Other charges and income G (1.9) — (0.2) — — (2.1)
Non-GAAP $ 47.0 $ 43.8 $ 40.9 $ — $ — $ 131.7
% of total Non-GAAP net revenues 10.1% 9.4% 8.8% —% —% 28.2%

34
Reconciliation of GAAP to Non-GAAP Operating Expenses
(In millions, except percentages)
NoteResearch and development
Sales and marketing
General and administrative
Restructuring and related
chargesGoodwill
impairment
Amortization of purchased
intangible assets TotalThree Months Ended October 31, 2016
GAAP $ 49.4 $ 49.8 $ 47.5 $ 7.1 $ — $ 24.6 $ 178.4
% of total GAAP net revenues 10.6% 10.7% 10.2% 1.5% —% 5.3% 38.4%
Amortization of purchased intangible assets E — — — — — (24.6) (24.6)
Other merger and acquisition related expenses E — — (0.8) — — — (0.8)
Stock based compensation F (1.5) (3.2) (3.9) — — — (8.6)
Restructuring and related charges G — — — (7.1) — — (7.1)
Other charges and income G (0.4) (0.4) (0.5) — — — (1.3)
Non-GAAP $ 47.5 $ 46.2 $ 42.3 $ — $ — $ — $ 136.0
% of total Non-GAAP net revenues 10.2% 9.9% 9.0% —% —% —% 29.1%

35
Reconciliation of GAAP to Non-GAAP Net Revenues
$ in millionsGAAP net revenues
Amortization of step-down in
deferred revenue at acquisition
Non-GAAP net revenues
Net revenues from businesses
acquired in the past 12 months
Non-GAAP organic net revenues
Net revenues from divested
businessesAdjusted organic
net revenues
Note (A) (A) (B) (B) (D)
Three Months Ended October 31, 2017
North America $ 154.1 $ — $ 154.1 $ — $ 154.1 $ 23.9 $ 130.2
Latin America 80.2 — 80.2 — 80.2 — 80.2
EMEA 196.0 — 196.0 (0.5) 195.5 2.5 193.0
Asia-Pacific 46.2 — 46.2 — 46.2 — 46.2
Total $ 476.5 $ — $ 476.5 $ (0.5) $ 476.0 $ 26.4 $ 449.6
Three Months Ended July 31, 2017
North America $ 152.8 $ — $ 152.8 $ — $ 152.8 $ 24.8 $ 128.0
Latin America 71.3 — 71.3 — 71.3 — 71.3
EMEA 193.5 — 193.5 (0.5) 193.0 2.0 191.0
Asia-Pacific 49.3 — 49.3 — 49.3 3.6 45.7
Total $ 466.9 $ — $ 466.9 $ (0.5) $ 466.4 $ 30.4 $ 436.0
Three Months Ended October 31, 2016
North America $ 167.1 $ 3.4 $ 170.5 $ — $ 170.5 $ 29.4 $ 141.1
Latin America 68.3 — 68.3 — 68.3 — 68.3
EMEA 180.8 — 180.8 — 180.8 1.7 179.1
Asia-Pacific 48.0 — 48.0 — 48.0 3.2 44.8
Total $ 464.2 $ 3.4 $ 467.6 $ — $ 467.6 $ 34.3 $ 433.3
36
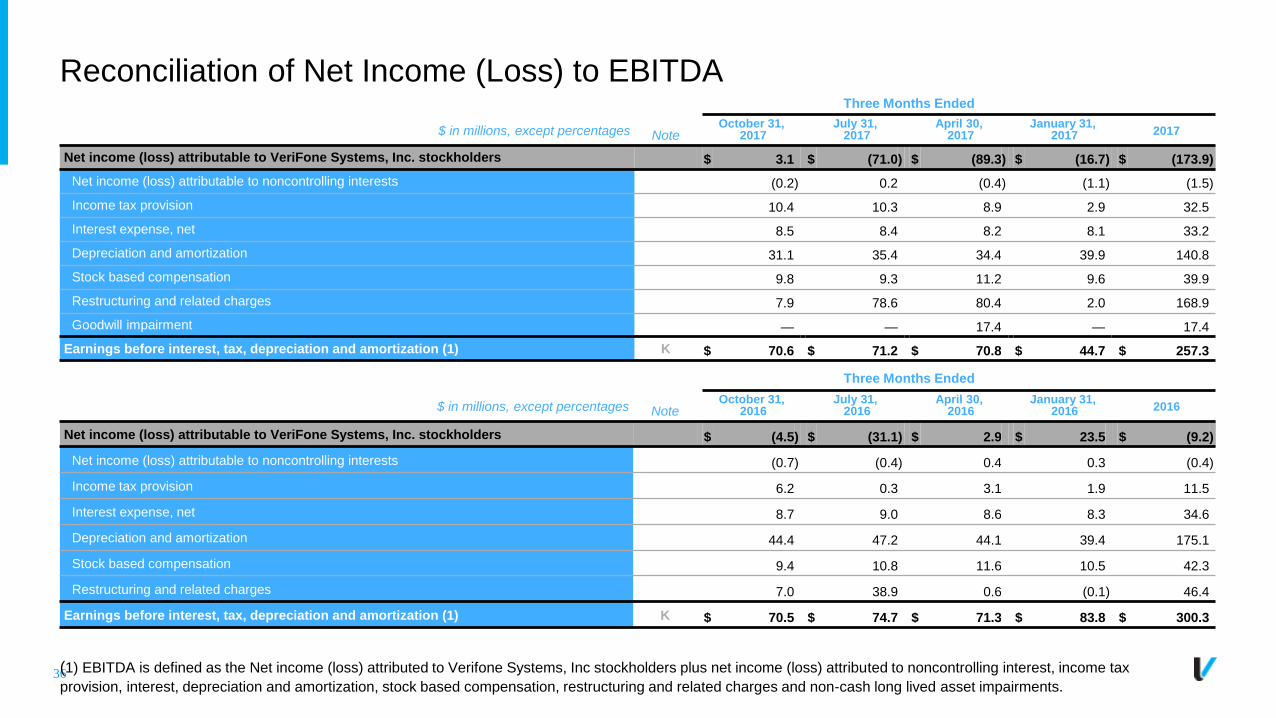
Reconciliation of Net Income (Loss) to EBITDA Three Months Ended
$ in millions, except percentages NoteOctober 31,
2017July 31,
2017April 30,
2017January 31,
2017 2017
Net income (loss) attributable to VeriFone Systems, Inc. stockholders $ 3.1 $ (71.0) $ (89.3) $ (16.7) $ (173.9)
Net income (loss) attributable to noncontrolling interests (0.2) 0.2 (0.4) (1.1) (1.5)
Income tax provision 10.4 10.3 8.9 2.9 32.5
Interest expense, net 8.5 8.4 8.2 8.1 33.2
Depreciation and amortization 31.1 35.4 34.4 39.9 140.8
Stock based compensation 9.8 9.3 11.2 9.6 39.9
Restructuring and related charges 7.9 78.6 80.4 2.0 168.9
Goodwill impairment — — 17.4 — 17.4
Earnings before interest, tax, depreciation and amortization (1) K $ 70.6 $ 71.2 $ 70.8 $ 44.7 $ 257.3
Three Months Ended
$ in millions, except percentages NoteOctober 31,
2016July 31,
2016April 30,
2016January 31,
2016 2016
Net income (loss) attributable to VeriFone Systems, Inc. stockholders $ (4.5) $ (31.1) $ 2.9 $ 23.5 $ (9.2)
Net income (loss) attributable to noncontrolling interests (0.7) (0.4) 0.4 0.3 (0.4)
Income tax provision 6.2 0.3 3.1 1.9 11.5
Interest expense, net 8.7 9.0 8.6 8.3 34.6
Depreciation and amortization 44.4 47.2 44.1 39.4 175.1
Stock based compensation 9.4 10.8 11.6 10.5 42.3
Restructuring and related charges 7.0 38.9 0.6 (0.1) 46.4
Earnings before interest, tax, depreciation and amortization (1) K $ 70.5 $ 74.7 $ 71.3 $ 83.8 $ 300.3
(1) EBITDA is defined as the Net income (loss) attributed to Verifone Systems, Inc stockholders plus net income (loss) attributed to noncontrolling interest, income tax
provision, interest, depreciation and amortization, stock based compensation, restructuring and related charges and non-cash long lived asset impairments.

37
Net Revenues and Operating Margin from Divested Businesses (1)
Three Months Ended
$ in millions, except percentagesNote
October 31, 2017
July 31, 2017
April 30, 2017
January 31, 2017
Net revenues from China business D $ — $ 3.6 $ 3.3 $ 4.3
Net revenues from Taxi Solutions business D 26.4 26.8 26.1 27.1
Net revenues from divested businesses D $ 26.4 $ 30.4 $ 29.4 $ 31.4
Operating margin from divested businesses L $ 2.0 $ (1.0) $ (7.7) $ (5.0)
Three Months Ended
$ in millions, except percentagesNote
October 31, 2016
July 31, 2016
April 30, 2016
January 31, 2016
Net revenues from China business D $ 3.2 $ 3.7 $ 3.1 $ 6.4
Net revenues from Taxi Solutions business D 31.1 29.9 29.9 32.4
Net revenues from divested businesses D $ 34.3 $ 33.6 $ 33.0 $ 38.8
Operating Margin from divested businesses L $ (2.0) $ (2.4) $ (4.4) $ (2.0)
(1) Divested businesses include significant businesses we have divested or plan to divest, specifically our former China business and Taxi Solutions business.
38
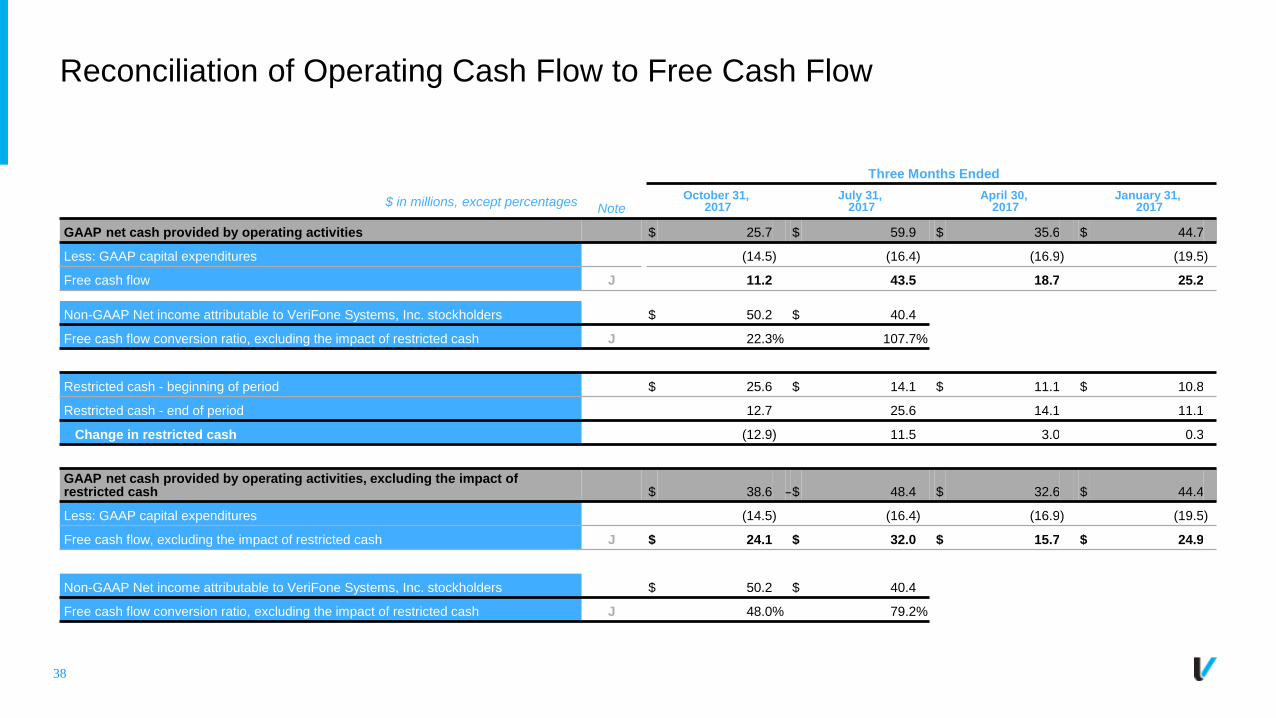
Reconciliation of Operating Cash Flow to Free Cash Flow
Three Months Ended
$ in millions, except percentagesNote
October 31, 2017
July 31, 2017
April 30, 2017
January 31, 2017
GAAP net cash provided by operating activities $ 25.7 $ 59.9 $ 35.6 $ 44.7
Less: GAAP capital expenditures (14.5) (16.4) (16.9) (19.5)
Free cash flow J 11.2 43.5 18.7 25.2
Non-GAAP Net income attributable to VeriFone Systems, Inc. stockholders $ 50.2 $ 40.4
Free cash flow conversion ratio, excluding the impact of restricted cash J 22.3% 107.7%
Restricted cash - beginning of period $ 25.6 $ 14.1 $ 11.1 $ 10.8
Restricted cash - end of period 12.7 25.6 14.1 11.1
Change in restricted cash (12.9) 11.5 3.0 0.3
GAAP net cash provided by operating activities, excluding the impact of restricted cash $ 38.6 —$ 48.4 $ 32.6 $ 44.4
Less: GAAP capital expenditures (14.5) (16.4) (16.9) (19.5)
Free cash flow, excluding the impact of restricted cash J $ 24.1 $ 32.0 $ 15.7 $ 24.9
Non-GAAP Net income attributable to VeriFone Systems, Inc. stockholders $ 50.2 $ 40.4
Free cash flow conversion ratio, excluding the impact of restricted cash J 48.0% 79.2%

39
Reconciliation of Operating Cash Flow to Free Cash Flow
Three Months Ended
$ in millions, except percentagesNote
October 31, 2016
July 31, 2016
April 30, 2016
January 31, 2016
GAAP net cash provided by operating activities $ 66.7 $ 13.0 $ 51.4 $ 66.3
Less: GAAP capital expenditures (23.1) (23.9) (27.8) (30.6)
Free cash flow J 43.6 (10.9) 23.6 35.7
Non-GAAP Net income attributable to VeriFone Systems, Inc. stockholders $ 33.1
Free cash flow conversion ratio, excluding the impact of restricted cash J 131.7%
Restricted cash - beginning of period $ 11.0 $ 10.6 $ 20.1 $ 7.0
Restricted cash - end of period 10.8 11.0 10.6 20.1
Change in restricted cash (0.2) 0.4 (9.5) 13.1
Change in restricted cash attributed to operating cash flows (0.2) 0.4 0.5 3.1
Change in restricted cash attributed to investing cash flows — (10.0) 10.0
GAAP net cash provided by operating activities, excluding the impact of restricted cash $ 66.9 $ 12.6 $ 50.9 $ 63.2
Less: GAAP capital expenditures (23.1) (23.9) (27.8) (30.6)
Free cash flow, excluding the impact of restricted cash J $ 43.8 $ (11.3) $ 23.1 $ 32.6
Non-GAAP Net income attributable to VeriFone Systems, Inc. stockholders $ 33.1
Free cash flow conversion ratio, excluding the impact of restricted cash J 132.3%

40
Reconciliation of Net Revenues Guidance
Guidance Adjusted Historical
Three Months Ending January 31, 2018
Year Ending October 31, 2018
Three Months Ending October 31, 2017
Three Months Ending January 31, 2017
Year Ending October 31, 2017$ in millions, except percentages Note
GAAP net revenues $ 431-433 $ 1,788-1,813 $ 476.5 $ 453.9 $ 1,871.0
Adjustments:
Acquisition of step-down in deferred revenue at acquisition A — — — 2.7 3.0
Non-GAAP net revenues $ 431-433 $ 1,788-1,813 $ 476.5 $ 456.6 $ 1,874.0
Net revenues from divested businesses D 13.0 13.0 26.4 31.4 117.7
Non-GAAP net revenues, excluding revenues from divested businesses $ 418-420 $ 1,775-1,800 $ 450.1 $ 425.2 $ 1,756.3

41
Reconciliation of Gross Margin, Operating Expenses and Operating Margin Guidance
Three Months Ending January 31, 2018
Year Ending October 31, 2018$ in millions, except percentages Note
GAAP Gross Margin Percentage 40.1% 42.9%
Adjustments: (1)
Amortization of purchased intangible assets E 0.4% 0.3%
Stock based compensation F 0.3% 0.3%
Non-GAAP Gross Margin Percentage 40.8% 43.5%
GAAP Operating Expenses $ 154.3 $ 627.2
Adjustments: (1)
Amortization of purchased intangible assets E 14.5 57.0
Stock based compensation F 8.8 35.2
Non-GAAP Operating Expenses $ 131.0 $ 535.0
GAAP Operating Margin 3.7% 8.1%
Adjustments: (1)
Amortization of purchased intangible assets E 3.8% 3.5%
Stock based compensation F 2.4% 2.2%
Non-GAAP Operating Margin 9.9% 13.8%

42
Reconciliation of EPS Guidance
Guidance Historical
Three Months Ending January 31, 2018
Year Ending October 31, 2018
Year Ended October 31, 2017Note
Diluted GAAP earnings (loss) per share (1) $ 0.02 $0.66-$0.69 $ (1.55)
Adjustments: (2)
Amortization of step-down in deferred services net revenues at acquisition and associated cost of goods sold A — — 0.03
Amortization of purchased intangible assets E 0.16 0.65 0.69
Stock based compensation F 0.09 0.36 0.35
Restructuring and related charges (2) G — — 1.50
Other charges and income (2) G — — 0.08
Goodwill impairment (2) G — — 0.15
Income tax effect of non-GAAP exclusions (3) H (0.05) (0.20) 0.06
Diluted Non-GAAP earnings per share (1) $ 0.22 $1.47-$1.50 $ 1.31
Diluted earnings per share from divested businesses (4) D — — (0.09)
Diluted Non-GAAP earnings per share, excluding divested businesses (1) $ 0.22 $1.47-$1.50 $ 1.40
(1) GAAP and non-GAAP diluted earnings (loss) per share are determined using the most dilutive measure, which includes outstanding RSU and RSA shares in the calculation of the weighted average diluted
shares outstanding in periods in which we expect net income.
(2) Except for the adjustments noted herein, this guidance does not include the effects of any future acquisitions/divestitures, restructuring activities, significant legal matters, and non-recurring income tax
adjustments, which are difficult to predict and which may or may not be significant.
(3) For the purpose of computing the income tax effect of non-GAAP exclusions, we used a 20% rate.
(4) Assuming Taxi Solutions business is break even in the fiscal year 2018 period prior to the sale of the business.
THIS FOOTNOTE MAINTAINED BY WHITNEY ON HER VERSION. PLEASE REVIEW THERE.

43
Explanatory Notes to Reconciliations of GAAP to Non-GAAP items
Note A: Non-GAAP net revenues, costs of goods sold and gross margin. Non-GAAP net revenues exclude the fair value decrease (step-down) in deferred revenue at acquisition. Non-GAAP
costs of goods sold exclude the costs of goods associated with the fair value decrease (step-down) in deferred revenue at acquisition. Although the step-down of deferred revenue fair value at
acquisition and associated costs of goods sold are reflected in our GAAP financial statements, they result in net revenues and gross margins immediately post-acquisition that are lower than net
revenues and gross margins that would be recognized in accordance with GAAP on those same services if they were sold under contracts entered into post-acquisition. Accordingly, we adjust the
step-down to achieve comparability to net revenues and gross margins of the acquired entity earned pre-acquisition and to our GAAP net revenues and gross margins to be earned on contracts
sold in future periods. These adjustments, which relate principally to our acquisition of AJB during February 2016, enhance the ability of our management and our investors to assess our financial
performance and trends. These non-GAAP net revenues, costs of goods sold and gross margin amounts are not intended to be a substitute for our GAAP disclosures of net revenues, costs of
goods sold and gross margin, and should be read together with our GAAP disclosures.
Note B: Non-GAAP organic net revenues. Non-GAAP organic net revenues is a financial measure of net revenues excluding "net revenues from businesses acquired in the past 12 months" (as
defined below). Verifone determines non-GAAP organic net revenues by deducting net revenues from businesses acquired in the past 12 months from non-GAAP net revenues. This non-GAAP
measure is used to evaluate Verifone net revenues without the impact of net revenues from acquired businesses. Because Verifone's business has grown through both organic growth and
strategic acquisitions, Verifone analyzes performance both with and without the impact of our recent acquisitions. Accordingly, Verifone believes that both non-GAAP net revenues and non-GAAP
organic net revenues provide useful information to investors.
Net revenues from businesses acquired in the past 12 months consists of net revenues derived from the sales channels of acquired resellers and distributors, and net revenues from Systems
and Services attributable to businesses acquired in the 12 months preceding the respective financial quarter(s). For acquisitions of small businesses that are integrated within a relatively short
time after the close of the acquisition, we assume quarterly net revenues attributable to such acquired businesses during the 12 months following acquisition remain at the same level as in the first
full quarter after the acquisition closed. During periods prior to our acquisition of former customers, net revenues from businesses acquired in the past 12 months consists of sales by Verifone to
that former customer for that period.
Note C: Non-GAAP organic net revenues at constant currency. Verifone determines non-GAAP organic net revenues at constant currency by recomputing non-GAAP organic net revenues
denominated in currencies other than U.S. Dollars in the current fiscal period using average exchange rates for that particular currency during the corresponding financial period of the prior year.
Verifone uses this non-GAAP measure to evaluate business performance and trends on a comparable basis excluding the impact of foreign currency fluctuations.
Note D: Non-GAAP net revenues, gross margin, operating income (loss) and net income (loss) from divested businesses. Verifone determines non-GAAP revenues, gross margin,
operating income (loss) and net income (loss) from divested businesses as the amounts in the reporting period that are derived from and/or directly related to significant businesses that have
either been divested or are held for sale.

44
Explanatory Notes to Reconciliations of GAAP to Non-GAAP items
Note E: Merger and Acquisition Related. Verifone adjusts certain revenues and expenses for items that are the result of mergers and acquisitions. Merger and acquisition related adjustments
include the amortization of intangible assets, contingent consideration fair market value adjustments, interest on contingent consideration, transaction expenses associated with acquisitions, and
acquisition integration expenses.
Amortization of intangible assets: Verifone incurs amortization of intangible assets in connection with its acquisitions, such as amortization of finite lived customer relationships intangibles. We are
required to allocate a portion of the purchase price of each business acquisition to the intangible assets acquired and to amortize this amount over the estimated useful lives of those acquired
intangible assets. Because these amounts have no direct correlation to Verifone’s underlying business operations, we eliminate these amortization charges and any associated minority interest
impact from our non-GAAP operating results to provide better comparability of pre-acquisition and post-acquisition operating results.
Contingent consideration fair market value adjustments and interest on contingent consideration: In connection with its acquisitions, Verifone owes contingent consideration payments based upon
the post-acquisition performance of and other factors related to acquired businesses. These contingent consideration liabilities are reported at fair market value and incur non-cash imputed
interest. Changes in the fair market value of contingent consideration and imputed interest expense vary independent of our ongoing operating results and have no direct correlation to our
underlying business operations. Accordingly, Verifone excludes these amounts from our non-GAAP operating results to provide better comparability of pre-acquisition and post-acquisition
operating results.
Transaction expenses associated with acquisitions: Verifone incurs transaction expenses in connection with its acquisitions, which include legal and other professional fees such as advisory,
accounting, valuation and consulting fees. These transaction expenses are related to acquisitions and have no direct correlation with the ongoing operation of Verifone’s business. Accordingly,
Verifone excludes these amounts from our non-GAAP operating results to provide better comparability of pre-acquisition and post-acquisition operating results.
Acquisition integration expenses: In connection with its acquisitions, Verifone incurs costs relating to the integration of the acquired business with Verifone’s ongoing business, which includes
expenses relating to the integration of facilities and other infrastructure, information technology systems and employee-related costs such as costs of personnel required to assist with integration
transitions. These acquisition integration expenses are related to acquisitions and have no direct correlation with the ongoing operation of Verifone’s business. Accordingly, Verifone excludes these
amounts from our non-GAAP operating results to provide better comparability of pre-acquisition and post-acquisition operating results.
Note F: Stock-Based Compensation. Our non-GAAP financial measures eliminate the effect of expense for stock-based compensation because they are non-cash expenses and. because of
varying available valuation methodologies, subjective assumptions and the variety of award types which affect the calculations of stock-based compensation, we believe that the exclusion of stock-
based compensation allows for more accurate comparisons of our operating results to our peer companies. Stock-based compensation is very different from other forms of compensation. A cash
salary or bonus has a fixed and unvarying cash cost. In contrast the expense associated with a stock based award is unrelated to the amount of compensation ultimately received by the employee;
and the cost to the company is based on valuation methodology and underlying assumptions that may vary over time and does not reflect any cash expenditure by the company. Furthermore, the
expense associated with granting an employee a stock based award can be spread over multiple years and may be reversed based on forfeitures which may differ from our original assumptions
unlike cash compensation expense which is typically recorded contemporaneously with the time of award or payment. Accordingly, we believe that excluding stock-based compensation expense
from our non-GAAP operating results facilitates better understanding of our long-term business performance and enhances period-to-period comparability.
45
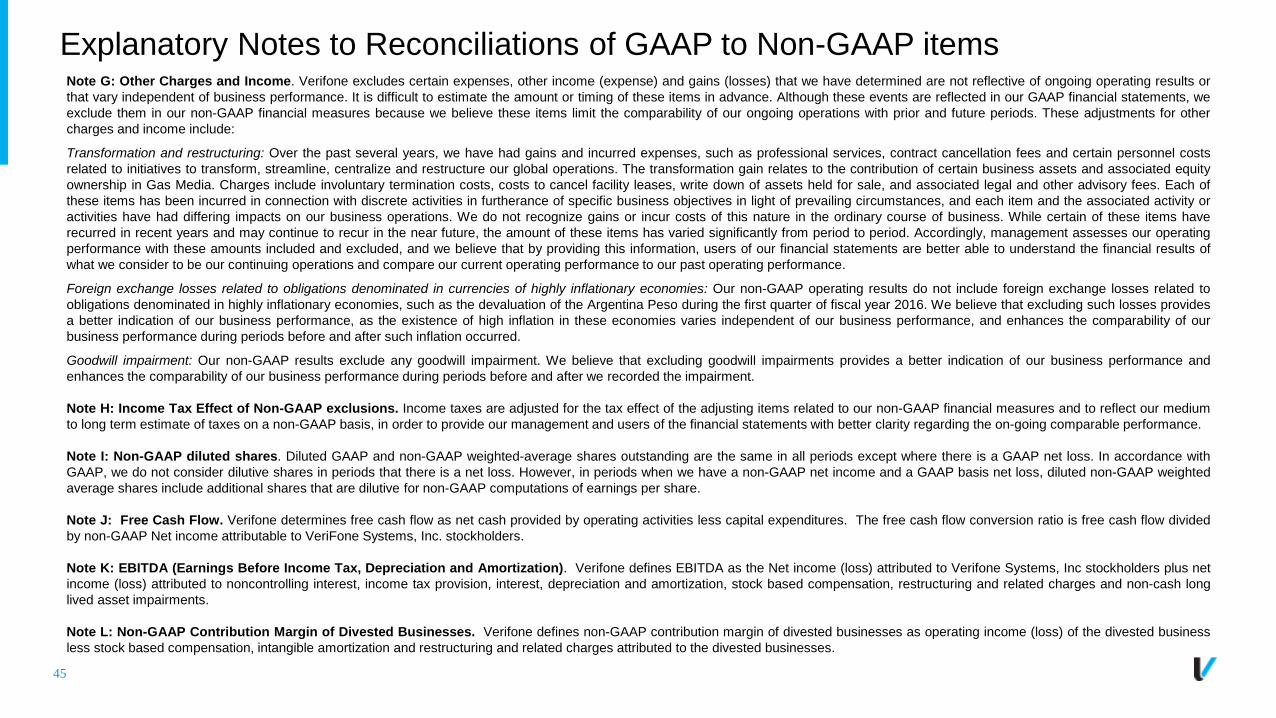
Explanatory Notes to Reconciliations of GAAP to Non-GAAP itemsNote G: Other Charges and Income. Verifone excludes certain expenses, other income (expense) and gains (losses) that we have determined are not reflective of ongoing operating results or
that vary independent of business performance. It is difficult to estimate the amount or timing of these items in advance. Although these events are reflected in our GAAP financial statements, we
exclude them in our non-GAAP financial measures because we believe these items limit the comparability of our ongoing operations with prior and future periods. These adjustments for other
charges and income include:
Transformation and restructuring: Over the past several years, we have had gains and incurred expenses, such as professional services, contract cancellation fees and certain personnel costs
related to initiatives to transform, streamline, centralize and restructure our global operations. The transformation gain relates to the contribution of certain business assets and associated equity
ownership in Gas Media. Charges include involuntary termination costs, costs to cancel facility leases, write down of assets held for sale, and associated legal and other advisory fees. Each of
these items has been incurred in connection with discrete activities in furtherance of specific business objectives in light of prevailing circumstances, and each item and the associated activity or
activities have had differing impacts on our business operations. We do not recognize gains or incur costs of this nature in the ordinary course of business. While certain of these items have
recurred in recent years and may continue to recur in the near future, the amount of these items has varied significantly from period to period. Accordingly, management assesses our operating
performance with these amounts included and excluded, and we believe that by providing this information, users of our financial statements are better able to understand the financial results of
what we consider to be our continuing operations and compare our current operating performance to our past operating performance.
Foreign exchange losses related to obligations denominated in currencies of highly inflationary economies: Our non-GAAP operating results do not include foreign exchange losses related to
obligations denominated in highly inflationary economies, such as the devaluation of the Argentina Peso during the first quarter of fiscal year 2016. We believe that excluding such losses provides
a better indication of our business performance, as the existence of high inflation in these economies varies independent of our business performance, and enhances the comparability of our
business performance during periods before and after such inflation occurred.
Goodwill impairment: Our non-GAAP results exclude any goodwill impairment. We believe that excluding goodwill impairments provides a better indication of our business performance and
enhances the comparability of our business performance during periods before and after we recorded the impairment.
Note H: Income Tax Effect of Non-GAAP exclusions. Income taxes are adjusted for the tax effect of the adjusting items related to our non-GAAP financial measures and to reflect our medium
to long term estimate of taxes on a non-GAAP basis, in order to provide our management and users of the financial statements with better clarity regarding the on-going comparable performance.
Note I: Non-GAAP diluted shares. Diluted GAAP and non-GAAP weighted-average shares outstanding are the same in all periods except where there is a GAAP net loss. In accordance with
GAAP, we do not consider dilutive shares in periods that there is a net loss. However, in periods when we have a non-GAAP net income and a GAAP basis net loss, diluted non-GAAP weighted
average shares include additional shares that are dilutive for non-GAAP computations of earnings per share.
Note J: Free Cash Flow. Verifone determines free cash flow as net cash provided by operating activities less capital expenditures. The free cash flow conversion ratio is free cash flow divided
by non-GAAP Net income attributable to VeriFone Systems, Inc. stockholders.
Note K: EBITDA (Earnings Before Income Tax, Depreciation and Amortization). Verifone defines EBITDA as the Net income (loss) attributed to Verifone Systems, Inc stockholders plus net
income (loss) attributed to noncontrolling interest, income tax provision, interest, depreciation and amortization, stock based compensation, restructuring and related charges and non-cash long
lived asset impairments.
Note L: Non-GAAP Contribution Margin of Divested Businesses. Verifone defines non-GAAP contribution margin of divested businesses as operating income (loss) of the divested business
less stock based compensation, intangible amortization and restructuring and related charges attributed to the divested businesses.