third quarter 2019 accounts - engro corporationon behalf of the board of directors of engro...
TRANSCRIPT

02third quarter 2019 accounts
third quarter 2019 accounts

01
company information
02third quarter 2019 accounts
directors’ report
Directors’ Report
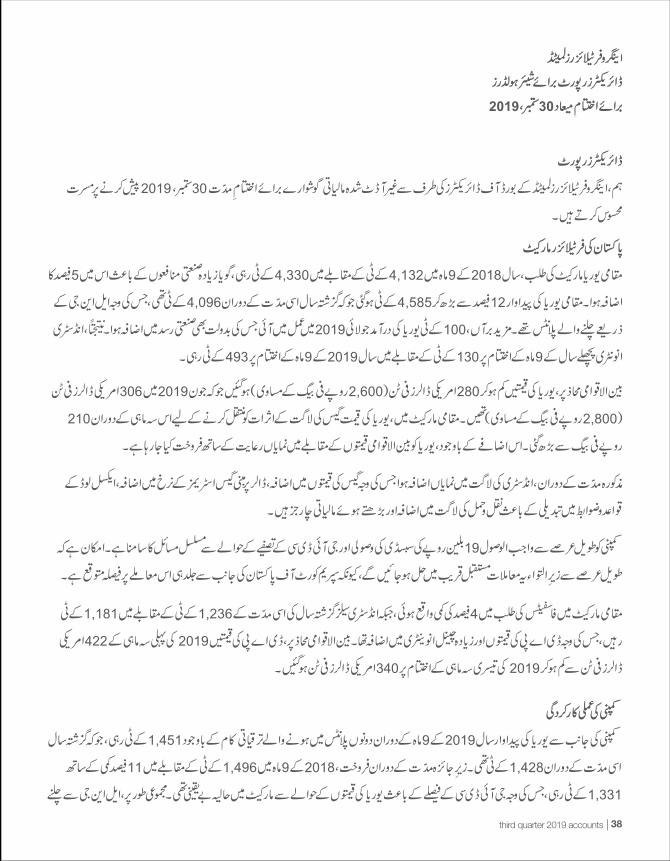
On behalf of the Board of Directors of Engro Fertilizers Limited, we are pleased to present the unaudited financial statements for the period ended September 30, 2019.
Pakistan Fertilizer Market
Local urea market demand stood at 4,330 KT vs 4,132 KT in 9M 2018, translating into an increase of 5% owing to higher industry avails. Local urea production increased by 12% to 4,585 KT compared to 4,096 KT during the same period last year due to operation of LNG based plants. Further, the import of 100 KT urea arrived in July 2019 which also added to the industry supply. Consequently, industry inventory at the end of 9M 2019 stood at 493 KT vs 130 KT at the end of 9M last year.
On the international front, urea prices have decreased to USD 280/T (landed equivalent of PKR 2,600/bag) from USD 306/T (landed equivalent PKR 2,800/bag) in June 2019. In the domestic market, the price of urea has increased by PKR 210/bag during the quarter to pass on the impact of increase in gas cost. Despite of this increase, urea continues to be sold at a significant discount to international prices.
During the period, the industry has witnessed significant increase in cost on account of rise in gas prices, escalation in price of dollar denominated gas streams, logistics cost arising from changes in axle load regulations and rising financial charges. The industry continues to face challenges in the recovery of long outstanding subsidy of PKR 19 B and settlement of GIDC. The resolution of these long outstanding matters is expected in the near future as the Supreme Court of Pakistan is expected to rule on this matter shortly.
Phosphates demand in the local market decreased by 4%, with industry sales at 1,181 KT vs 1,236 KT in the same period last year due to increase in DAP prices and high channel inventory. On the international front, DAP prices have declined from a high of USD 422/T in 1Q 2019 to USD 340/T by the end of 3Q 2019.
Company’s Operating Performance
The Company’s urea production in 9M 2019 stood at 1,451 KT compared to 1,428 KT in the corresponding period last year. This was despite turnarounds at both plants during the period. Sales during the period clocked in at 1,331 KT compared to 1,496 KT in 9M 2018, a decrease of 11% YoY owing to recent uncertainty in market regarding urea prices linked with GIDC decision. Overall, company’s urea domestic market share for the period reduced to 31% (branded urea market share: 32%) from 36% (branded urea market share: 36%) in 9M 2018, mainly due to operation of LNG based plants and import of urea. The Company’s DAP and Zorawar sales during the period stood at 303 KT vs 320 KT last year, resulting in a lower market share of 26% vs 27% for the same period last year.
The Company’s specialty fertilizer (Zarkhez, Engro NP, MOP/SOP/AS) sales clocked in at 176 KT in 9M 2019 vs 145 KT during the same period last year, an increase of 21%. The overall potash market remained stable at 27KT in 9M 2019 while the market share of the Company for the period increased to 63% from 46% last year because of better market reach.
Gross Profit of the Company was recorded at PKR 25.0 B for 9M 2019, compared to PKR 23.9 B in the same period last year, an increase of 4%. However, the gross profit as a percentage has shown a decline of 3% at an aggregate portfolio level as increase in input costs have outpaced product prices. Finance cost was higher at PKR 3,229 M (vs PKR 1,420 M last year) resulting mainly from higher policy rates.
On a standalone basis, net profit for 9M 2019 stood at PKR 13.2 B compared to PKR 12.5 B last year, resulting in an EPS of PKR 9.90 vs. PKR 9.39 in 9M 2018. Company’s consolidated profit stood at PKR 10.5 B vs. PKR 12.2 B in the corresponding period last year, resulting in EPS of PKR 7.87 vs. last year’s EPS of PKR 9.17.
The Board is pleased to recommend second interim cash dividend of PKR 6 per share for FY 2019, bringing the cumulative payout for 9M 2019 to PKR 11.0 per share. The Board has endeavored to maximize dividends on a quarterly basis. The final dividend for the year ending December 31, 2019 would be declared based upon final earnings for the year.
03
In line with the industry, EFert continues to accrue GIDC on all non-concessionary gases. The Government has recently withdrawn GIDC Ordinance 2019 which was passed on August 29, 2019. The matter is now in the Supreme Court and more clarity is awaited.
The Company obtained a stay order against GIDC applicability on concessionary gas in 2015, and no GIDC has been paid or accrued for concessionary gas supplied to the new urea plant. GIDC on concessionary gas is in direct contravention of the Fertilizer Policy and our Gas Supply Contracts, on the basis of which the Company invested USD 1.1 Billion to expand its fertilizer manufacturing capacity.
During the quarter, the Company received additional sales tax refund bonds of PKR 0.6 B against refund processing orders (RPOs), in settlement of sales tax receivable. These bonds together with the bonds issued earlier this year cumulate to PKR 2.0 B. These bonds carry simple interest at 10% p.a. payable upon completion of a 3-year term.
Other significant matters
During the quarter, the disposal of one of subsidiaries, Engro Eximp FZE, was concluded. On a consolidated basis, the Company recorded a net loss of PKR 263 M primarily on account of recognition of tax on disposal.
The financial statements also incorporate the pro-rated one-off deferred tax charge arising out of the Budget announcement of freezing the tax rate at 29% as compared to the previous announcement of reducing the tax rate to 25% in Finance Bill 2018.
During the period in first quarter, the Company sold an immovable property to Engro Polymer Limited, an associated company, recognizing a gain of PKR 678 M.
The Company was awarded with the Annual National Forum for Environment & Health (NFEH) Corporate Social Responsibility Award in September 2019. This is one of Pakistan’s premier recognition awards and winning this accolade is testimony to the high level of focus and commitment towards corporate social responsibility.
On safety front, the Company achieved an important milestone as the Commercial division completed 10 million safe manhours in September 2019.
Additionally, during the quarter. the Company’s Annual Report 2018 has been awarded the second place in the sector for the Best Presented Annual Reports Awards organized by the joint committee of the Institute of Chartered Accountants of Pakistan (ICAP) and Institute of Cost and Management Accountants of Pakistan (ICMAP), in recognition of transparent reporting and good governance practices adopted by the Company.
Near Term Outlook
Local urea demand is expected to remain stable going forward. The operation of LNG based plants and import of urea would, however, create oversupply. On DAP front, international prices are expected to stabilize and remain range bound in 4Q (USD 350-355/T). Demand for phosphates and other imported fertilizers is expected to remain restricted owing to higher prices caused by constant devaluations and recent budgetary measures. Further, initial reports of key crops indicate losses on significant acreage. This is likely to dampen farm economics and Govt of Pakistan is encouraged to support the Agri economy of Pakistan through smart subsidy to the small farmers of Pakistan.
Going forward, the Company remains committed to continue to play its role in transforming the agri landscape in Pakistan. On behalf of the Board, the Company would like to thank all stakeholders for their trust and support.
04third quarter 2019 accounts
consolidated condensed interim financial statements (unaudited) for the nine months ended september 30, 2019

05
ASSETS Non-current assets Property, plant and equipment 3 67,229,621 68,203,956 Intangible assets 4,488,006 4,487,771 Long term loans and advances 202,314 142,644 71,919,941 72,834,371 Current assets Stores, spares and loose tools 5,480,349 5,325,287 Stock-in-trade 9,303,886 11,538,309 Trade debts 4,500,018 9,109,671 Loans, advances, deposits and prepayments 3,529,086 1,363,411 Other receivables 8,639,362 9,043,657 Accrued income 253,150 54,038 Short term investments 4 24,208,961 7,722,469 Cash and bank balances 727,604 729,836 56,642,416 44,886,678 TOTAL ASSETS 128,562,357 117,721,049
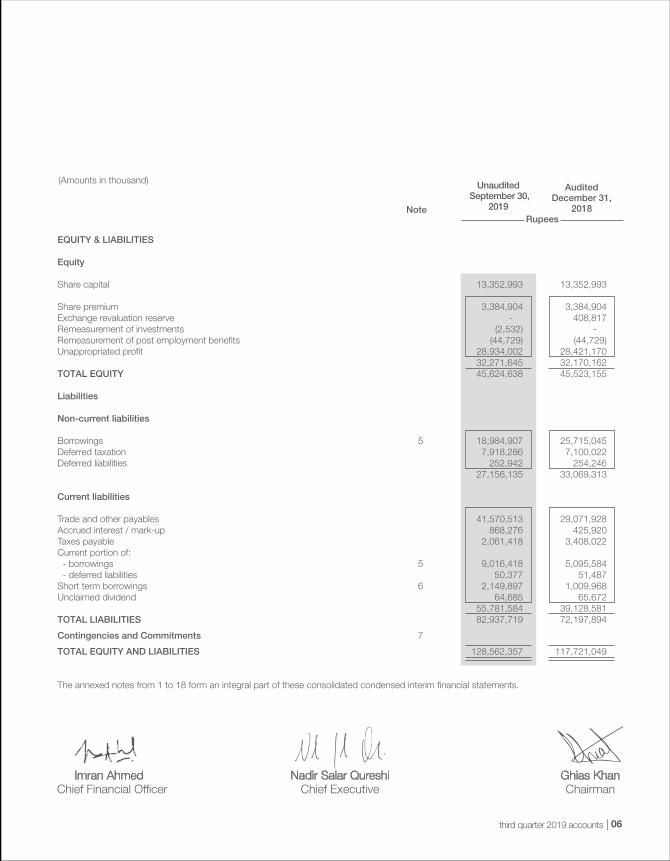
consolidated condensed interim statement of financial position as at september 30, 2019(Amounts in thousand) Unaudited
September 30,2019
AuditedDecember 31,
2018Rupees
06third quarter 2019 accounts
EQUITY & LIABILITIES Equity Share capital 13,352,993 13,352,993 Share premium 3,384,904 3,384,904 Exchange revaluation reserve - 408,817 Remeasurement of investments (2,532) - Remeasurement of post employment benefits (44,729) (44,729)Unappropriated profit 28,934,002 28,421,170 32,271,645 32,170,162 TOTAL EQUITY 45,624,638 45,523,155 Liabilities Non-current liabilities Borrowings 5 18,984,907 25,715,045 Deferred taxation 7,918,286 7,100,022 Deferred liabilities 252,942 254,246 27,156,135 33,069,313 Current liabilities Trade and other payables 41,570,513 29,071,928 Accrued interest / mark-up 868,276 425,920 Taxes payable 2,061,418 3,408,022 Current portion of: - borrowings 5 9,016,418 5,095,584 - deferred liabilities 50,377 51,487 Short term borrowings 6 2,149,897 1,009,968 Unclaimed dividend 64,685 65,672 55,781,584 39,128,581 TOTAL LIABILITIES 82,937,719 72,197,894
Contingencies and Commitments 7
TOTAL EQUITY AND LIABILITIES 128,562,357 117,721,049 The annexed notes from 1 to 18 form an integral part of these consolidated condensed interim financial statements.
(Amounts in thousand) Unaudited September 30,
2019
AuditedDecember 31,
2018Rupees

07
Net sales 8 27,106,187 28,098,690 77,749,136 69,215,104 Cost of sales (18,266,649) (18,223,228) (52,794,633) (45,319,338) Gross profit 8,839,538 9,875,462 24,954,503 23,895,766 Selling and distribution expenses (2,068,744) (1,974,961) (5,449,526) (5,245,967) Administrative expenses (296,364) (248,311) (887,347) (762,972) 6,474,430 7,652,190 18,617,630 17,886,827 Other income 9 1,214,268 213,899 3,652,650 1,867,985 Other operating expenses (502,558) (503,634) (1,489,298) (1,074,448)Finance cost (1,209,649) (533,734) (3,228,796) (1,419,875) (1,712,207) (1,037,368) (4,718,094) (2,494,323) Profit before taxation 5,976,491 6,828,721 17,552,186 17,260,489 Taxation (2,650,011) (1,729,009) (7,041,530) (5,011,401) Profit for the period 3,326,480 5,099,712 10,510,656 12,249,088 Profit attributable to : - continuing operations 3,326,480 5,093,444 10,474,470 12,233,214 - discontinued operations - 6,268 36,186 15,874
3,326,480 5,099,712 10,510,656 12,249,088
Earnings per share (basic and diluted) from : - continuing operations 2.49 3.82 7.84 9.16 - discontinued operations - - 0.03 0.01
2.49 3.82 7.87 9.17
The annexed notes from 1 to 18 form an integral part of these consolidated condensed interim financial statements.
consolidated condensed interim statement of profit or loss (unaudited) for the nine months ended september 30, 2019
Quarter ended Nine months ended
September 30, 2018
September 30, 2018
September 30, 2019
September 30, 2019
Rupees
(Amounts in thousand except for earnings per share)
08third quarter 2019 accounts
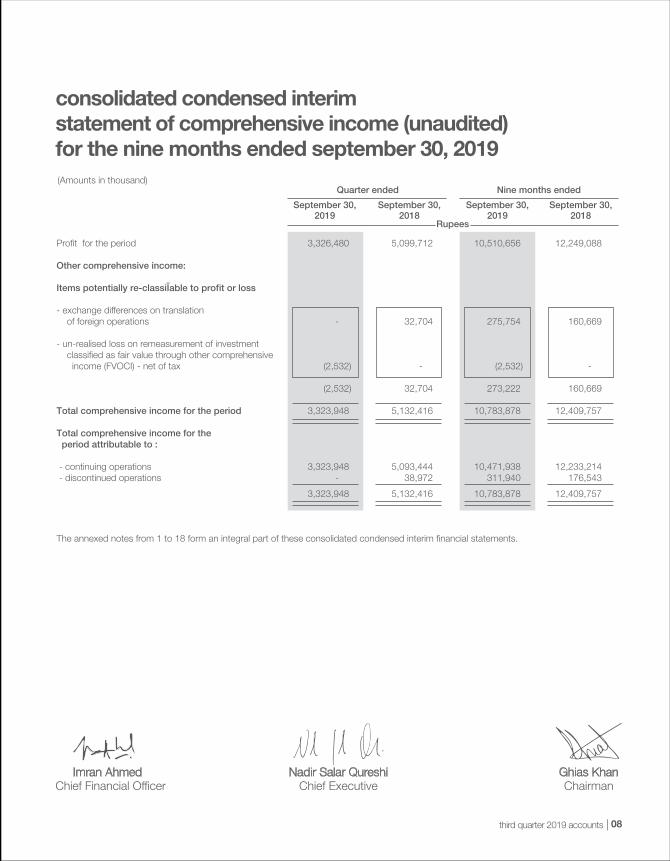
Profit for the period 3,326,480 5,099,712 10,510,656 12,249,088
Other comprehensive income: Items potentially re-classifiable to profit or loss - exchange differences on translation of foreign operations - 32,704 275,754 160,669
- un-realised loss on remeasurement of investment classified as fair value through other comprehensive income (FVOCI) - net of tax (2,532) - (2,532) -
(2,532) 32,704 273,222 160,669
Total comprehensive income for the period 3,323,948 5,132,416 10,783,878 12,409,757
Total comprehensive income for the period attributable to : - continuing operations 3,323,948 5,093,444 10,471,938 12,233,214 - discontinued operations - 38,972 311,940 176,543
3,323,948 5,132,416 10,783,878 12,409,757
The annexed notes from 1 to 18 form an integral part of these consolidated condensed interim financial statements.
consolidated condensed interim statement of comprehensive income (unaudited) for the nine months ended september 30, 2019(Amounts in thousand)
Quarter ended Nine months ended
September 30, 2018
September 30, 2018
September 30, 2019
September 30, 2019
Rupees

09
consolidated condensed interimstatement of changes in equity for the nine months ended september 30, 2019(Amounts in thousand)
Balance as at January 1, 2019 (Audited) 13,352,993 3,384,904 408,817 - (44,729) 28,421,170 45,523,155
Transactions with owners
Final dividend for the year ended December 31, 2018 @ Rs. 3.00 per share - - - - - (4,005,898) (4,005,898)1st Interim dividend for the year ending December 31, 2019 @ Rs. 5.00 per share - - - - - (6,676,497) (6,676,497) - - - - - (10,682,395) (10,682,395)Total comprehensive income for the nine months ended September 30, 2019
Profit for the period - - - - - 10,510,656 10,510,656 Other comprehensive income: - exchange revaluation - - 275,754 - - - 275,754 - un-realised loss on remeasurement of FVOCI investments - net of tax - - - (2,532) - - (2,532) - - 275,754 (2,532) - 10,510,656 10,783,878 Reclassification of exchange revaluation reserve to profit or loss on disposal of subsidiary - - (684,571) - - 684,571 -
Balance as at September 30, 2019 (Unaudited) 13,352,993 3,384,904 - (2,532) (44,729) 28,934,002 45,624,638
Balance as at January 1, 2018 (Audited) 13,352,993 3,384,904 83,183 - (47,315) 25,695,946 42,469,711
Transactions with owners
Final dividend for the year ended December 31, 2017 @ Rs. 3.00 per share - - - - - (4,005,898) (4,005,898)1st Interim dividend for the year ending December 31, 2018 @ Rs. 4.00 per share - - - - - (5,341,198) (5,341,198) - - - - - (9,347,096) (9,347,096)Total comprehensive income for the nine months ended September 30, 2018
Profit for the period - - - - - 12,249,088 12,249,088 Other comprehensive income: - exchange revaluation - - 160,669 - - - 160,669 - un-realised loss on remeasurement of FVOCI investments - net of tax - - - - - - - - - 160,669 - - 12,249,088 12,409,757 Balance as at September 30, 2018 (Unaudited) 13,352,993 3,384,904 243,852 - (47,315) 28,597,938 45,532,372
The annexed notes from 1 to 18 form an integral part of these consolidated condensed interim financial statements.
Remeasurement of investments
10third quarter 2019 accounts
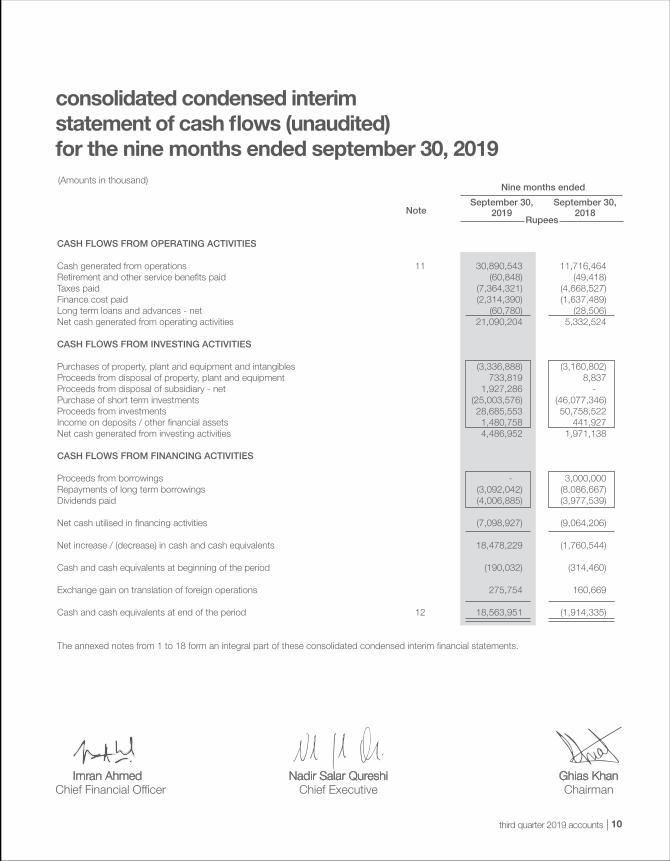
CASH FLOWS FROM OPERATING ACTIVITIES Cash generated from operations 11 30,890,543 11,716,464 Retirement and other service benefits paid (60,848) (49,418)Taxes paid (7,364,321) (4,668,527)Finance cost paid (2,314,390) (1,637,489)Long term loans and advances - net (60,780) (28,506)Net cash generated from operating activities 21,090,204 5,332,524 CASH FLOWS FROM INVESTING ACTIVITIES Purchases of property, plant and equipment and intangibles (3,336,888) (3,160,802)Proceeds from disposal of property, plant and equipment 733,819 8,837 Proceeds from disposal of subsidiary - net 1,927,286 - Purchase of short term investments (25,003,576) (46,077,346)Proceeds from investments 28,685,553 50,758,522 Income on deposits / other financial assets 1,480,758 441,927 Net cash generated from investing activities 4,486,952 1,971,138 CASH FLOWS FROM FINANCING ACTIVITIES Proceeds from borrowings - 3,000,000Repayments of long term borrowings (3,092,042) (8,086,667)Dividends paid (4,006,885) (3,977,539) Net cash utilised in financing activities (7,098,927) (9,064,206) Net increase / (decrease) in cash and cash equivalents 18,478,229 (1,760,544) Cash and cash equivalents at beginning of the period (190,032) (314,460) Exchange gain on translation of foreign operations 275,754 160,669 Cash and cash equivalents at end of the period 12 18,563,951 (1,914,335) The annexed notes from 1 to 18 form an integral part of these consolidated condensed interim financial statements.
consolidated condensed interim statement of cash flows (unaudited) for the nine months ended september 30, 2019(Amounts in thousand)
Rupees
Nine months ended
September 30, 2018
September 30, 2019
11
notes to the consolidated condensedinterim financial statements (unaudited)for the nine months ended september 30, 2019(Amounts in thousand)
1. LEGAL STATUS AND OPERATIONS 1.1 Engro Fertilizers Limited (‘the Holding Company’) is a public company incorporated on June 29, 2009 as a wholly owned subsidiary
of Engro Corporation Limited (the Parent Company), which is a subsidiary of Dawood Hercules Corporation Limited (the Ultimate Parent Company). The Holding Company is listed on Pakistan Stock Exchange Limited. The principal activity of the Holding Company is manufacturing, purchasing and marketing of fertilizers. The Holding Company’s registered office is situated at 7th & 8th floors, The Harbour Front Building, Plot Number HC-3, Block 4, Scheme Number 5, Clifton, Karachi.
1.2 The ‘Group’ consists of: Holding Company: Engro Fertilizers Limited Subsidiary Companies: Companies in which the Holding Company owns over 50% of voting rights, or companies controlled by the
Holding Company: Engro Eximp FZE 1.2.1 - 100 EFERT Agritrade (Private) Limited 1.2.2 100 100 1.2.1 Engro Eximp FZE (EEF) was incorporated in the Jebel Ali Free Zone, Emirate of Dubai, on August 4, 2011. On July 17, 2019, the Holding
Company entered into a Share Purchase Agreement (the Agreement) with the Parent Company for the sale of its entire holding in EEF. Through the Agreement, the Parent Company purchased 100% shares of EEF for a total consideration of Rs. 1,972,505.
1.2.2 EFERT Agritrade (Private) Limited (EAPL) was incorporated as a wholly owned subsidiary of the Holding Company on July 6, 2017
to carry out trading and distribution of imported fertilizer as part of the business reorganization. The Holding Company transferred its business of trading and distribution of imported fertilizer to EAPL and holds 10,000 ordinary shares of Rs. 10 each in EAPL.
2. BASIS OF PREPARATION AND SIGNIFICANT ACCOUNTING POLICIES 2.1 Statement of compliance These consolidated condensed interim financial statements have been prepared in accordance with the accounting and reporting
standards applicable in Pakistan for interim financial reporting. The accounting and reporting standards applicable in Pakistan for interim financial reporting comprise of:
- International Accounting Standard 34, ‘Interim Financial Reporting’ (IAS 34), issued by the International Accounting Standards Board
(IASB) as notified under the Companies Act, 2017 (the Act); and - provisions of and directives issued under the Act. Where the provisions of and directives issued under the Act differ with the requirements of IAS 34, the provisions of and directives issued
under the Act have been followed. 2.2 These consolidated condensed interim financial statements do not include all the information required for annual consolidated financial
statements and therefore should be read in conjunction with the annual consolidated financial statements of the Group for the year ended December 31, 2018.
September 30,2019
%age of holding
December 31,2018
12third quarter 2019 accounts
2.3 The accounting policies and the methods of computation adopted in the preparation of these consolidated condensed interim financial statements are same as those applied in the preparation of the annual consolidated financial statements of the Group for the year ended December 31, 2018, except for changes stated in note 2.4.
2.4 New accounting standards, interpretations and amendments to approved accounting standards a) Standards, interpretations and amendments to approved accounting standards that are effective for the period and are
relevant to the Group. There are certain new standards, interpretations and amendments to approved accounting standards which are applicable for the
first time on the Group’s accounting periods beginning on or after January 1, 2019 but are considered not to be relevant or have any significant effect on the Group’s financial reporting, except as follows:
- IFRS 15 - ‘Revenue from Contracts with Customers’, supersedes IAS 11 ‘Construction Contracts’, IAS 18 ‘Revenue’ and
related interpretations and it applies to all revenue arising from contracts with customers, unless those contracts are in the scope of other standards.
The new standard establishes a five-step model to account for revenue arising from contracts with customers. Under IFRS 15,
revenue is recognized at an amount that reflects the consideration to which an entity expects to be entitled in exchange for transferring goods or services to a customer. The standard requires entities to exercise judgement, taking into consideration all of the relevant facts and circumstances when applying each step of the model to contracts with their customers. The Group has assessed that significant performance obligations in its contracts with the customers are discharged at a single point of time, and therefore there is no significant financial impact of IFRS 15 on the Group.
- IFRS 16 - ‘Leases’ replaces the previous standard IAS 17 - ‘Leases’. It introduces a single lessee accounting model and requires
a lessee to recognize assets and liabilities on the statement of financial position for almost all leases. Under the new standard, an asset (the right to use the leased item) and a financial liability to pay rentals are recognised. The only exceptions are short term and low value leases. The Group has assessed that application on this standard does not have any material financial impact on these consolidated condensed interim financial statements.
- IFRS 9 - ‘Financial Instruments’ addresses the classification, measurement and recognition of financial assets and financial liabilities and replaces the related guidance in IAS 39. IFRS 9 retains but simplifies the mixed measurement model and establishes three primary measurement categories for financial assets: amortized cost, fair value through other comprehensive income (OCI) and fair value through profit and loss (FVTPL). The basis of classification depends on the entity’s business model and the contractual cash flow characteristics of the financial asset. Investments in equity instruments are required to be measured at fair value through profit or loss with the irrevocable option at inception to present changes in fair value in OCI, without recycling of fair value changes to profit or loss.
There is now a new expected credit losses model that replaces the incurred loss impairment model of IAS 39. For financial
liabilities there are no changes to classification and measurement except for the recognition of changes in own credit risk in OCI, for liabilities designated at fair value through profit or loss. IFRS 9 relaxes the requirements for hedge effectiveness by replacing the bright line hedge effectiveness tests. It requires an economic relationship between the hedged item and hedging instrument and for the ‘hedged ratio’ to be the same as the one management actually use for risk management purposes.
(Amounts in thousand)
13
(Amounts in thousand)
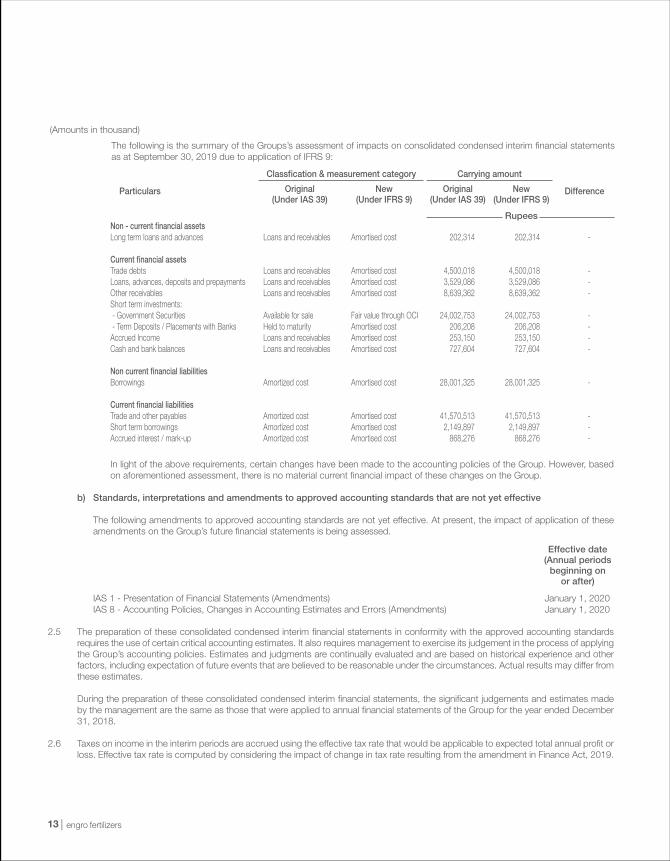
Non - current financial assets Long term loans and advances Loans and receivables Amortised cost 202,314 202,314 - Current financial assets Trade debts Loans and receivables Amortised cost 4,500,018 4,500,018 - Loans, advances, deposits and prepayments Loans and receivables Amortised cost 3,529,086 3,529,086 - Other receivables Loans and receivables Amortised cost 8,639,362 8,639,362 - Short term investments: - Government Securities Available for sale Fair value through OCI 24,002,753 24,002,753 - - Term Deposits / Placements with Banks Held to maturity Amortised cost 206,208 206,208 - Accrued Income Loans and receivables Amortised cost 253,150 253,150 - Cash and bank balances Loans and receivables Amortised cost 727,604 727,604 - Non current financial liabilities Borrowings Amortized cost Amortised cost 28,001,325 28,001,325 - Current financial liabilities Trade and other payables Amortized cost Amortised cost 41,570,513 41,570,513 - Short term borrowings Amortized cost Amortised cost 2,149,897 2,149,897 - Accrued interest / mark-up Amortized cost Amortised cost 868,276 868,276 -
New(Under IFRS 9)
New(Under IFRS 9)
Original(Under IAS 39)
Original(Under IAS 39)
Classfication & measurement category
Particulars
Carrying amount
Difference
Rupees
In light of the above requirements, certain changes have been made to the accounting policies of the Group. However, based on aforementioned assessment, there is no material current financial impact of these changes on the Group.
b) Standards, interpretations and amendments to approved accounting standards that are not yet effective
The following amendments to approved accounting standards are not yet effective. At present, the impact of application of these amendments on the Group’s future financial statements is being assessed.
IAS 1 - Presentation of Financial Statements (Amendments) January 1, 2020 IAS 8 - Accounting Policies, Changes in Accounting Estimates and Errors (Amendments) January 1, 2020
2.5 The preparation of these consolidated condensed interim financial statements in conformity with the approved accounting standards requires the use of certain critical accounting estimates. It also requires management to exercise its judgement in the process of applying the Group’s accounting policies. Estimates and judgments are continually evaluated and are based on historical experience and other factors, including expectation of future events that are believed to be reasonable under the circumstances. Actual results may differ from these estimates.
During the preparation of these consolidated condensed interim financial statements, the significant judgements and estimates made by the management are the same as those that were applied to annual financial statements of the Group for the year ended December 31, 2018.
2.6 Taxes on income in the interim periods are accrued using the effective tax rate that would be applicable to expected total annual profit or loss. Effective tax rate is computed by considering the impact of change in tax rate resulting from the amendment in Finance Act, 2019.
The following is the summary of the Groups’s assessment of impacts on consolidated condensed interim financial statements as at September 30, 2019 due to application of IFRS 9:
Effective date (Annual periods
beginning onor after)
14third quarter 2019 accounts
(Amounts in thousand)Unaudited
September 30,2019
AuditedDecember 31,
2018Rupees
September 30,2019
September 30,2019
UnauditedAdditions (at cost) Disposals (at net book value)
September 30,2018
September 30,2018
UnauditedSeptember 30,
2019
AuditedDecember 31,
2018Rupees
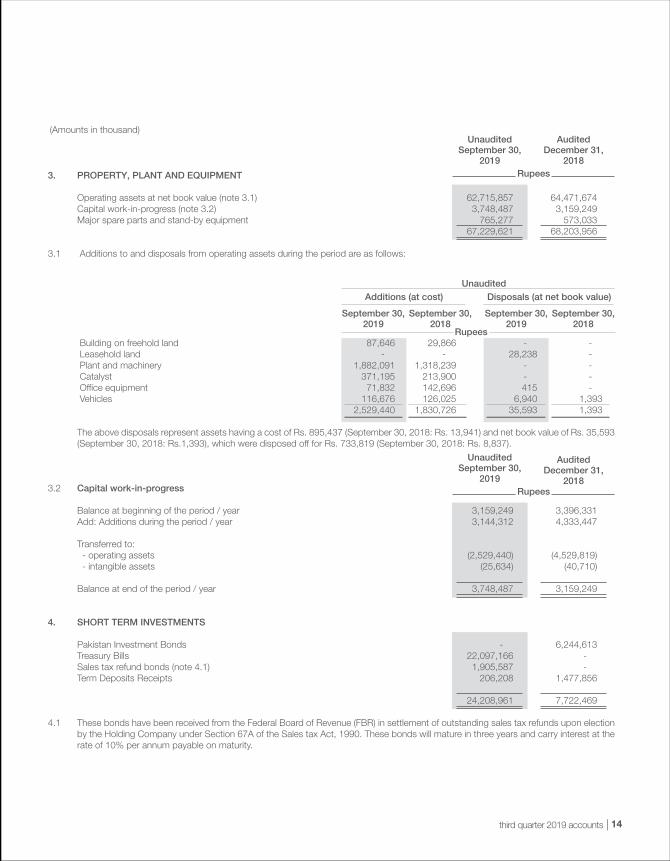
3. PROPERTY, PLANT AND EQUIPMENT Operating assets at net book value (note 3.1) 62,715,857 64,471,674 Capital work-in-progress (note 3.2) 3,748,487 3,159,249 Major spare parts and stand-by equipment 765,277 573,033 67,229,621 68,203,956 3.1 Additions to and disposals from operating assets during the period are as follows:
Building on freehold land 87,646 29,866 - - Leasehold land - - 28,238 - Plant and machinery 1,882,091 1,318,239 - - Catalyst 371,195 213,900 - - Office equipment 71,832 142,696 415 - Vehicles 116,676 126,025 6,940 1,393 2,529,440 1,830,726 35,593 1,393 The above disposals represent assets having a cost of Rs. 895,437 (September 30, 2018: Rs. 13,941) and net book value of Rs. 35,593
(September 30, 2018: Rs.1,393), which were disposed off for Rs. 733,819 (September 30, 2018: Rs. 8,837).
3.2 Capital work-in-progress Balance at beginning of the period / year 3,159,249 3,396,331 Add: Additions during the period / year 3,144,312 4,333,447 Transferred to: - operating assets (2,529,440) (4,529,819) - intangible assets (25,634) (40,710) Balance at end of the period / year 3,748,487 3,159,249 4. SHORT TERM INVESTMENTS Pakistan Investment Bonds - 6,244,613 Treasury Bills 22,097,166 - Sales tax refund bonds (note 4.1) 1,905,587 - Term Deposits Receipts 206,208 1,477,856 24,208,961 7,722,469
4.1 These bonds have been received from the Federal Board of Revenue (FBR) in settlement of outstanding sales tax refunds upon election by the Holding Company under Section 67A of the Sales tax Act, 1990. These bonds will mature in three years and carry interest at the rate of 10% per annum payable on maturity.
15
UnauditedSeptember 30,
2019
AuditedDecember 31,
2018Rupees
(Amounts in thousand)
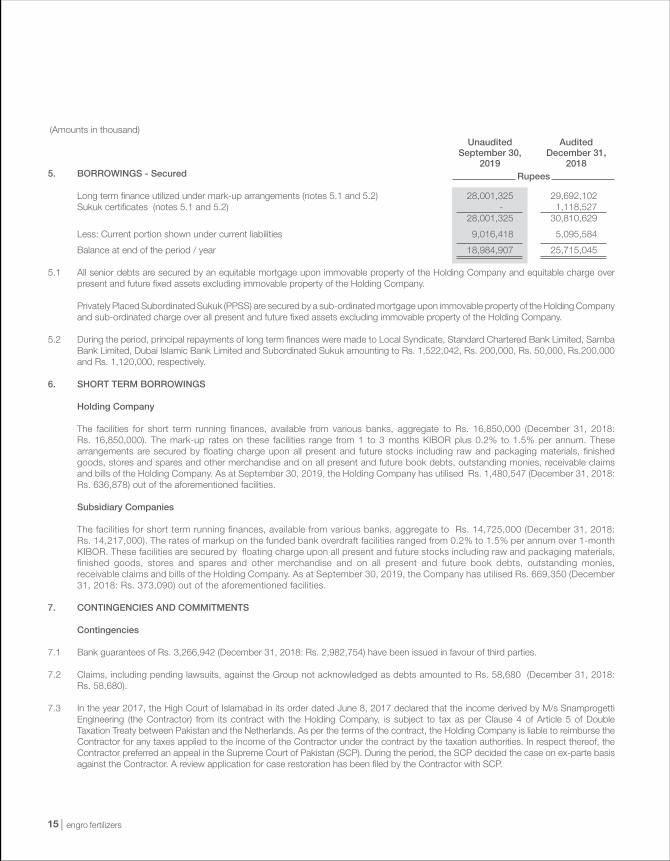
5. BORROWINGS - Secured Long term finance utilized under mark-up arrangements (notes 5.1 and 5.2) 28,001,325 29,692,102 Sukuk certificates (notes 5.1 and 5.2) - 1,118,527 28,001,325 30,810,629
Less: Current portion shown under current liabilities 9,016,418 5,095,584
Balance at end of the period / year 18,984,907 25,715,045 5.1 All senior debts are secured by an equitable mortgage upon immovable property of the Holding Company and equitable charge over
present and future fixed assets excluding immovable property of the Holding Company.
Privately Placed Subordinated Sukuk (PPSS) are secured by a sub-ordinated mortgage upon immovable property of the Holding Company and sub-ordinated charge over all present and future fixed assets excluding immovable property of the Holding Company.
5.2 During the period, principal repayments of long term finances were made to Local Syndicate, Standard Chartered Bank Limited, Samba
Bank Limited, Dubai Islamic Bank Limited and Subordinated Sukuk amounting to Rs. 1,522,042, Rs. 200,000, Rs. 50,000, Rs.200,000 and Rs. 1,120,000, respectively.
6. SHORT TERM BORROWINGS Holding Company The facilities for short term running finances, available from various banks, aggregate to Rs. 16,850,000 (December 31, 2018:
Rs. 16,850,000). The mark-up rates on these facilities range from 1 to 3 months KIBOR plus 0.2% to 1.5% per annum. These arrangements are secured by floating charge upon all present and future stocks including raw and packaging materials, finished goods, stores and spares and other merchandise and on all present and future book debts, outstanding monies, receivable claims and bills of the Holding Company. As at September 30, 2019, the Holding Company has utilised Rs. 1,480,547 (December 31, 2018: Rs. 636,878) out of the aforementioned facilities.
Subsidiary Companies The facilities for short term running finances, available from various banks, aggregate to Rs. 14,725,000 (December 31, 2018:
Rs. 14,217,000). The rates of markup on the funded bank overdraft facilities ranged from 0.2% to 1.5% per annum over 1-month KIBOR. These facilities are secured by floating charge upon all present and future stocks including raw and packaging materials, finished goods, stores and spares and other merchandise and on all present and future book debts, outstanding monies, receivable claims and bills of the Holding Company. As at September 30, 2019, the Company has utilised Rs. 669,350 (December 31, 2018: Rs. 373,090) out of the aforementioned facilities.
7. CONTINGENCIES AND COMMITMENTS Contingencies 7.1 Bank guarantees of Rs. 3,266,942 (December 31, 2018: Rs. 2,982,754) have been issued in favour of third parties. 7.2 Claims, including pending lawsuits, against the Group not acknowledged as debts amounted to Rs. 58,680 (December 31, 2018:
Rs. 58,680). 7.3 In the year 2017, the High Court of Islamabad in its order dated June 8, 2017 declared that the income derived by M/s Snamprogetti
Engineering (the Contractor) from its contract with the Holding Company, is subject to tax as per Clause 4 of Article 5 of Double Taxation Treaty between Pakistan and the Netherlands. As per the terms of the contract, the Holding Company is liable to reimburse the Contractor for any taxes applied to the income of the Contractor under the contract by the taxation authorities. In respect thereof, the Contractor preferred an appeal in the Supreme Court of Pakistan (SCP). During the period, the SCP decided the case on ex-parte basis against the Contractor. A review application for case restoration has been filed by the Contractor with SCP.

16third quarter 2019 accounts
September 30,2019
September 30,2019
Unaudited
September 30,2018
September 30,2018
UnauditedSeptember 30,
2019
AuditedDecember 31,
2018Rupees
(Amounts in thousand)
Quarter ended Nine months ended
The management of the Holding Company based on the opinion of its legal counsel is confident that the chances of restoration application being allowed by SCP are good. Accordingly, no provision has been made in this respect for the potential exposure of Rs. 1,178,391.
7.4 Except as mentioned above, as at September 30, 2019, there is no material change in the status of matters reported as contingencies
in the annual financial statements of the Group for the year ended December 31, 2018.
7.5 Commitments Commitments in respect of capital expenditure and other operational items 15,195,609 1,874,155
8. NET SALES Gross sales: - manufactured product 18,595,440 17,271,679 53,034,429 48,043,624 - purchased and packaged product 9,062,246 11,416,872 26,345,372 23,385,301 - services 10,429 - 10,429 - 27,668,115 28,688,551 79,390,230 71,428,925 Less: Sales tax 561,928 589,861 1,641,094 2,213,821 27,106,187 28,098,690 77,749,136 69,215,104
9. OTHER INCOME Income from sales under Government subsidy - - - 1,304,329 On financial assets : Income on bank accounts 4,001 1,690 16,596 6,622 Income on treasury bills, term deposit certificates and Pakistan Investment Bonds 1,054,040 84,322 1,711,762 396,561 1,058,041 86,012 1,728,358 403,183 On non-financial assets : Gain on disposal of property, plant and equipment 4,019 - 698,227 7,443 Rental income - 40,558 2,899 40,558 Reversal of liability of workers’ welfare fund - - 999,423 - Gain on disposal of spares / scrap 12,892 - 43,675 2,174 Others 139,316 87,329 180,068 110,298 156,227 127,887 1,924,292 160,473 1,214,268 213,899 3,652,650 1,867,98510. TAXATION 10.1 During the period, the income tax department amended the assessment filed by the Holding Company for the tax years 2015,
2016 and 2017. The Holding Company has filed appeals thereagainst before the Commissioner Inland Revenue Appeals (CIRA) for disallowances made in the orders, which mainly included proration of expenses to exempt/FTR incomes, exchange loss disallowances, loss on derivatives and losses purchased from Engro Eximp Agriproducts Limited, a related party, under section 59B of the Income Tax Ordinance, 2001, resulting in cumulative addition of Rs. 16,173,826 to taxable income of these tax years. The Holding Company is confident of a favorable outcome of the appeals.

17
(Amounts in thousand)
10.2 Pursuant to the approval of the Board of Directors of the Holding Company on May 10, 2019, the Holding Company withdrew its cases pending in Sindh High Court in respect of Alternate Corporate Tax (ACT) for tax years 2014 to 2016 and discharged the related tax liability amounting to Rs. 1,995,054.
11. CASH GENERATED FROM OPERATIONS Profit before taxation 17,552,186 17,260,489 Adjustment for non-cash charges and other items: Depreciation 4,249,884 3,931,875 Amortization of intangibles 25,512 20,822 Amortization of deferred income (2,891) (2,891) Gain on disposal of property, plant and equipment (698,227) (7,443) Gain on disposal of subsidiary (120,002) - Provision for service benefits 61,994 54,493 Income on deposits / other financial assets (1,728,358) (403,183) Financial charges 2,946,059 1,410,938 Exchange loss on revaluation of long term borrowings 267,600 - Amortisation of transaction cost on borrowings 15,137 8,937 Provision for doubt-ful trade debts 13,371 - Provision for net realisable value of stock in trade 28,591 33,874 Provision for surplus and slow moving stores and spares 7,550 14,816 Working capital changes (note 11.1) 8,272,137 (10,606,263) 30,890,543 11,716,464 11.1 Working capital changes
Decrease / (Increase) in current assets
- Stores, spares and loose tools (162,612) (196,674) - Stock-in-trade 2,205,832 (11,874,019) - Trade debts 4,374,175 (1,595,491) - Loans, advances, deposits and prepayments (2,375,485) 16,772 - Other receivables (1,690,605) 412,040 2,351,305 (13,237,372) Increase in trade and other payables 5,920,832 2,631,109 8,272,137 (10,606,263)
12. CASH AND CASH EQUIVALENTS
Cash and bank balances 727,604 651,572 Short term investments 19,986,244 1,391,194 Short term borrowings (2,149,897) (3,957,101) 18,563,951 (1,914,335)
13. FINANCIAL RISK MANAGEMENT AND FINANCIAL INSTRUMENTS
13.1 Financial risk factors
The Group’s activities expose it to a variety of financial risks including: market risk (currency risk, interest rate risk and other price risk), credit risk and liquidity risk.
There have been no changes in the risk management policies during the period, consequently these consolidated condensed interim financial statements do not include all the financial risk management information and disclosures required in the annual consolidated financial statements.
September 30,2019
September 30,2018Rupees
Nine months ended (Unaudited)
18third quarter 2019 accounts
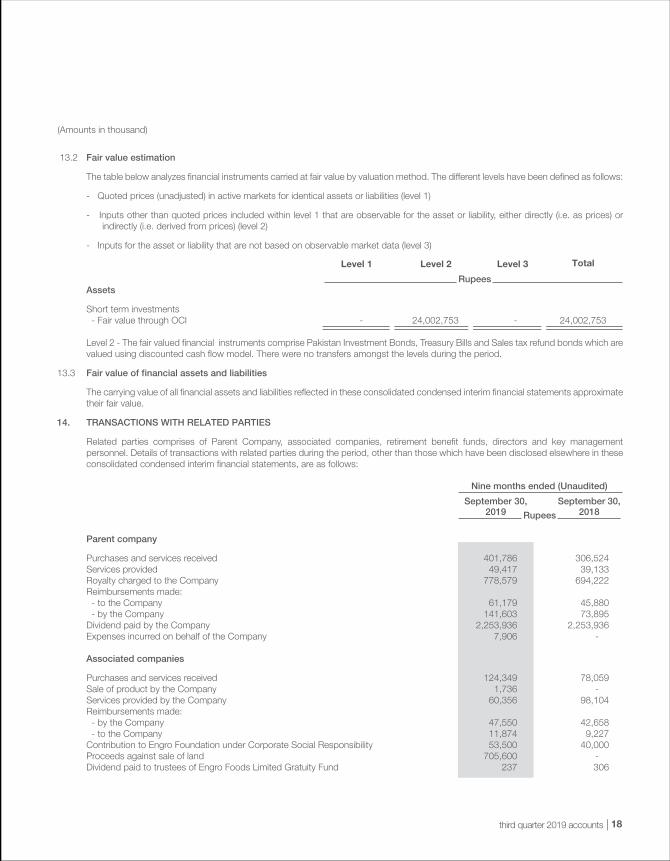
13.2 Fair value estimation
The table below analyzes financial instruments carried at fair value by valuation method. The different levels have been defined as follows:
- Quoted prices (unadjusted) in active markets for identical assets or liabilities (level 1)
- Inputs other than quoted prices included within level 1 that are observable for the asset or liability, either directly (i.e. as prices) or indirectly (i.e. derived from prices) (level 2)
- Inputs for the asset or liability that are not based on observable market data (level 3)
Assets
Short term investments - Fair value through OCI - 24,002,753 - 24,002,753
Level 2 - The fair valued financial instruments comprise Pakistan Investment Bonds, Treasury Bills and Sales tax refund bonds which are valued using discounted cash flow model. There were no transfers amongst the levels during the period.
13.3 Fair value of financial assets and liabilities
The carrying value of all financial assets and liabilities reflected in these consolidated condensed interim financial statements approximate their fair value.
14. TRANSACTIONS WITH RELATED PARTIES
Related parties comprises of Parent Company, associated companies, retirement benefit funds, directors and key management personnel. Details of transactions with related parties during the period, other than those which have been disclosed elsewhere in these consolidated condensed interim financial statements, are as follows:
Parent company
Purchases and services received 401,786 306,524 Services provided 49,417 39,133 Royalty charged to the Company 778,579 694,222 Reimbursements made: - to the Company 61,179 45,880 - by the Company 141,603 73,895 Dividend paid by the Company 2,253,936 2,253,936 Expenses incurred on behalf of the Company 7,906 - Associated companies
Purchases and services received 124,349 78,059 Sale of product by the Company 1,736 - Services provided by the Company 60,356 98,104 Reimbursements made: - by the Company 47,550 42,658 - to the Company 11,874 9,227 Contribution to Engro Foundation under Corporate Social Responsibility 53,500 40,000 Proceeds against sale of land 705,600 - Dividend paid to trustees of Engro Foods Limited Gratuity Fund 237 306
(Amounts in thousand)
Level 1 Level 2 Level 3 Total
Rupees
September 30,2019
September 30,2018Rupees
Nine months ended (Unaudited)
19
September 30,2019
September 30,2018Rupees
Nine months ended (Unaudited)(Amounts in thousand)
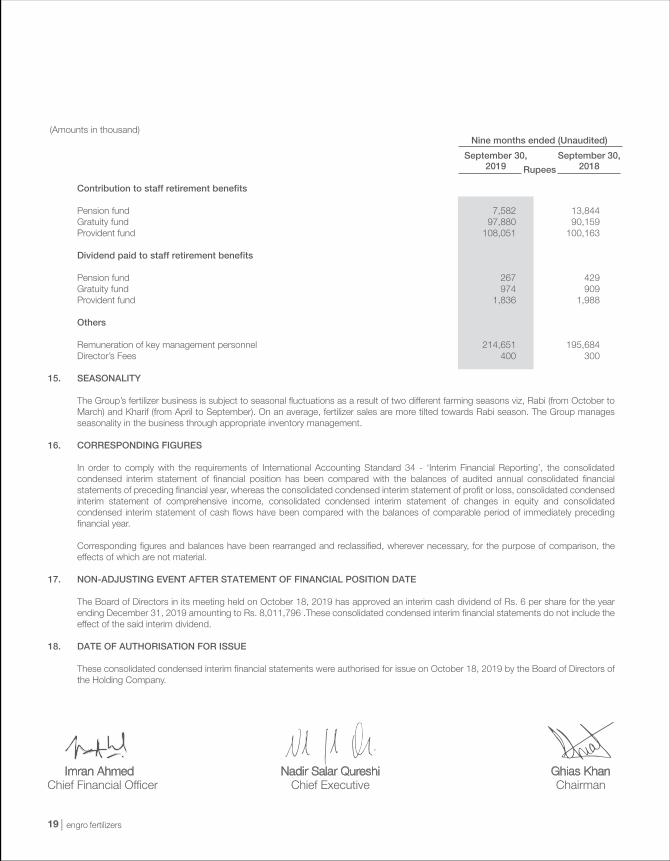
Contribution to staff retirement benefits Pension fund 7,582 13,844 Gratuity fund 97,880 90,159 Provident fund 108,051 100,163 Dividend paid to staff retirement benefits Pension fund 267 429 Gratuity fund 974 909 Provident fund 1,836 1,988 Others Remuneration of key management personnel 214,651 195,684 Director’s Fees 400 300 15. SEASONALITY The Group’s fertilizer business is subject to seasonal fluctuations as a result of two different farming seasons viz, Rabi (from October to
March) and Kharif (from April to September). On an average, fertilizer sales are more tilted towards Rabi season. The Group manages seasonality in the business through appropriate inventory management.
16. CORRESPONDING FIGURES In order to comply with the requirements of International Accounting Standard 34 - ‘Interim Financial Reporting’, the consolidated
condensed interim statement of financial position has been compared with the balances of audited annual consolidated financial statements of preceding financial year, whereas the consolidated condensed interim statement of profit or loss, consolidated condensed interim statement of comprehensive income, consolidated condensed interim statement of changes in equity and consolidated condensed interim statement of cash flows have been compared with the balances of comparable period of immediately preceding financial year.
Corresponding figures and balances have been rearranged and reclassified, wherever necessary, for the purpose of comparison, the effects of which are not material.
17. NON-ADJUSTING EVENT AFTER STATEMENT OF FINANCIAL POSITION DATE The Board of Directors in its meeting held on October 18, 2019 has approved an interim cash dividend of Rs. 6 per share for the year
ending December 31, 2019 amounting to Rs. 8,011,796 .These consolidated condensed interim financial statements do not include the effect of the said interim dividend.
18. DATE OF AUTHORISATION FOR ISSUE These consolidated condensed interim financial statements were authorised for issue on October 18, 2019 by the Board of Directors of
the Holding Company.

20third quarter 2019 accounts
condensed interim financial statements (unaudited)for the nine months ended september 30, 2019
21
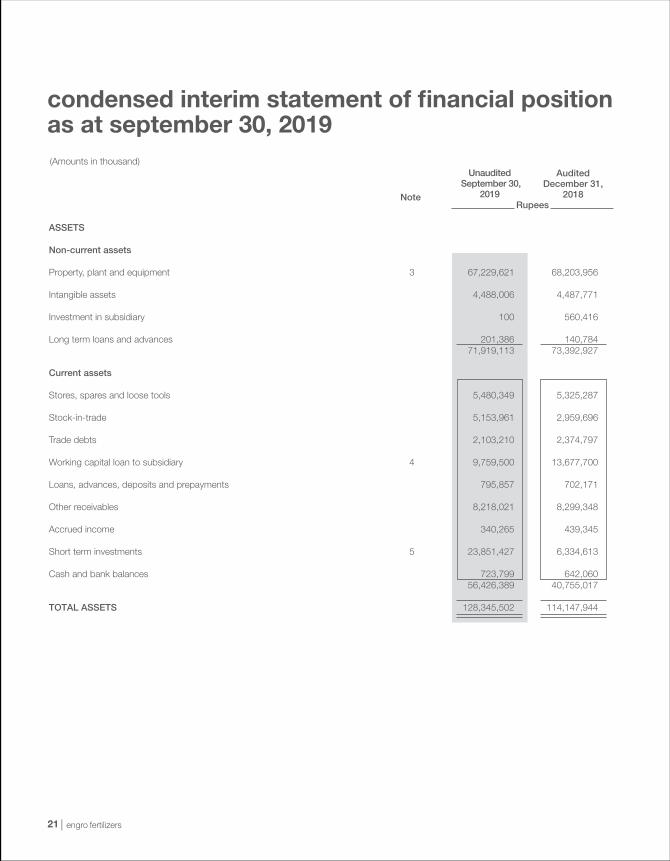
ASSETS Non-current assets Property, plant and equipment 3 67,229,621 68,203,956
Intangible assets 4,488,006 4,487,771 Investment in subsidiary 100 560,416 Long term loans and advances 201,386 140,784 71,919,113 73,392,927
Current assets Stores, spares and loose tools 5,480,349 5,325,287 Stock-in-trade 5,153,961 2,959,696 Trade debts 2,103,210 2,374,797 Working capital loan to subsidiary 4 9,759,500 13,677,700 Loans, advances, deposits and prepayments 795,857 702,171 Other receivables 8,218,021 8,299,348 Accrued income 340,265 439,345 Short term investments 5 23,851,427 6,334,613 Cash and bank balances 723,799 642,060 56,426,389 40,755,017 TOTAL ASSETS 128,345,502 114,147,944
condensed interim statement of financial position as at september 30, 2019 (Amounts in thousand)
Unaudited September 30,
2019
AuditedDecember 31,
2018Rupees

22third quarter 2019 accounts
EQUITY & LIABILITIES
Equity Share capital 13,352,993 13,352,993 Reserves Share premium 3,384,904 3,384,904 Reserve on amalgamation (304,027) (304,027)Remeasurement of post employment benefits (45,083) (45,083)Remeasurement of investments (2,532) - Unappropriated profit 29,149,222 26,606,961 32,182,484 29,642,755 TOTAL EQUITY 45,535,477 42,995,748 Liabilities Non-current liabilities Borrowings 6 18,984,907 25,715,045 Deferred taxation 7,918,286 7,100,022 Deferred liabilities 250,226 252,050 27,153,419 33,067,117 Current liabilities Trade and other payables 42,553,149 28,626,619 Accrued interest / mark-up 640,881 405,620 Taxes payable 1,851,000 3,203,439 Current portion of: - borrowings 6 9,016,418 5,095,584 - deferred liabilities 49,926 51,267 Short term borrowings 7 1,480,547 636,878 Unclaimed dividend 64,685 65,672 55,656,606 38,085,079 TOTAL LIABILITIES 82,810,025 71,152,196 Contingencies and Commitments 8 TOTAL EQUITY & LIABILITIES 128,345,502 114,147,944 The annexed notes from 1 to 19 form an integral part of these condensed interim financial statements.
(Amounts in thousand)Unaudited
September 30,2019
AuditedDecember 31,
2018Rupees

23
condensed interim statement of profit or loss (unaudited) for the nine months ended september 30, 2019
(Amounts in thousand except for earnings per share)
Net sales 9 18,539,344 17,139,278 52,881,187 47,280,766 Cost of sales (11,143,959) (9,012,517) (31,778,305) (27,202,993) Gross profit 7,395,385 8,126,761 21,102,882 20,077,773 Selling and distribution expenses (1,606,959) (1,577,719) (4,375,948) (4,340,270) Administrative expenses (290,394) (238,286) (853,767) (730,466) 5,498,032 6,310,756 15,873,167 15,007,037
Other income 10 2,886,498 1,932,824 7,697,082 3,909,114 Other operating expenses (502,195) (503,634) (1,487,409) (1,074,448)Finance cost (886,085) (473,321) (2,922,258) (1,349,882) (1,388,280) (976,955) (4,409,667) (2,424,330) Profit before taxation 6,996,250 7,266,625 19,160,582 16,491,821 Taxation 11 (2,288,080) (1,252,526) (5,935,926) (3,956,214) Profit for the period 4,708,170 6,014,099 13,224,656 12,535,607
Earnings per share - basic and diluted 3.53 4.50 9.90 9.39 The annexed notes from 1 to 19 form an integral part of these condensed interim financial statements.
Quarter ended Nine months ended
September 30, 2018
September 30, 2018
September 30, 2019
September 30, 2019
Rupees
24third quarter 2019 accounts
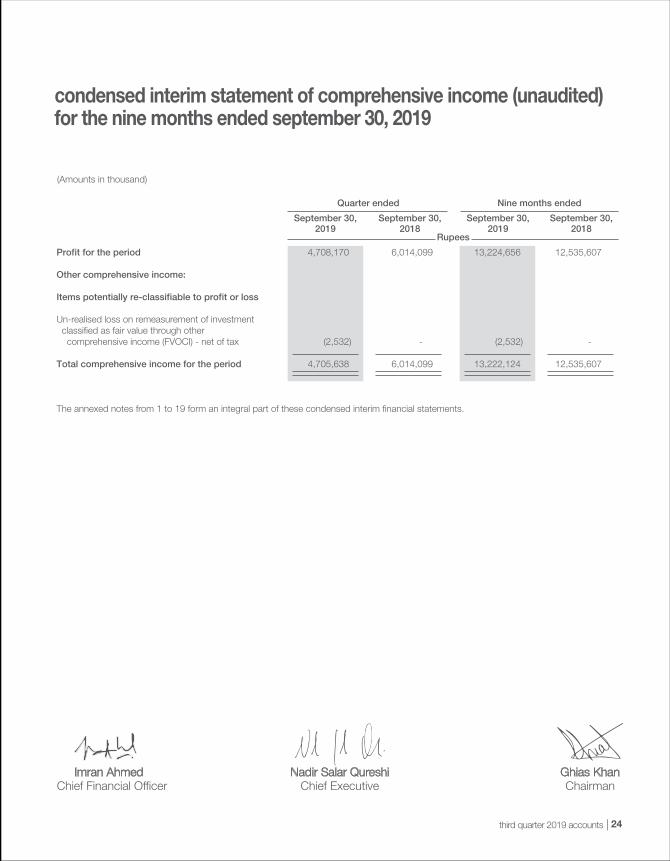
condensed interim statement of comprehensive income (unaudited)for the nine months ended september 30, 2019
(Amounts in thousand)
Profit for the period 4,708,170 6,014,099 13,224,656 12,535,607 Other comprehensive income: Items potentially re-classifiable to profit or loss Un-realised loss on remeasurement of investment classified as fair value through other comprehensive income (FVOCI) - net of tax (2,532) - (2,532) - Total comprehensive income for the period 4,705,638 6,014,099 13,222,124 12,535,607 The annexed notes from 1 to 19 form an integral part of these condensed interim financial statements.
Quarter ended Nine months ended
September 30, 2018
September 30, 2018
September 30, 2019
September 30, 2019
Rupees
25
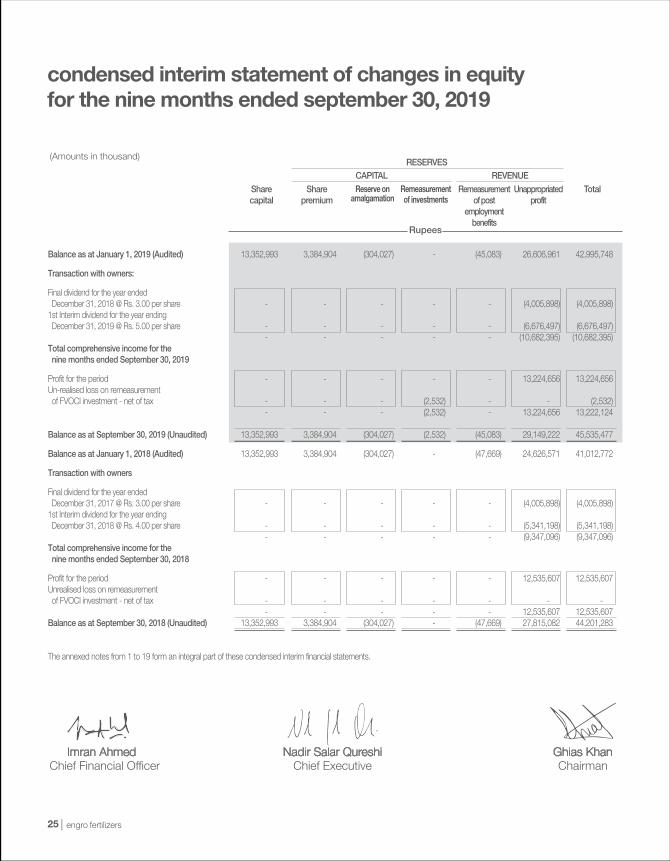
condensed interim statement of changes in equity for the nine months ended september 30, 2019
(Amounts in thousand)
Balance as at January 1, 2019 (Audited) 13,352,993 3,384,904 (304,027) - (45,083) 26,606,961 42,995,748
Transaction with owners:
Final dividend for the year ended December 31, 2018 @ Rs. 3.00 per share - - - - - (4,005,898) (4,005,898)1st Interim dividend for the year ending December 31, 2019 @ Rs. 5.00 per share - - - - - (6,676,497) (6,676,497) - - - - - (10,682,395) (10,682,395)Total comprehensive income for the nine months ended September 30, 2019
Profit for the period - - - - - 13,224,656 13,224,656 Un-realised loss on remeasurement of FVOCI investment - net of tax - - - (2,532) - - (2,532) - - - (2,532) - 13,224,656 13,222,124
Balance as at September 30, 2019 (Unaudited) 13,352,993 3,384,904 (304,027) (2,532) (45,083) 29,149,222 45,535,477
Balance as at January 1, 2018 (Audited) 13,352,993 3,384,904 (304,027) - (47,669) 24,626,571 41,012,772
Transaction with owners
Final dividend for the year ended December 31, 2017 @ Rs. 3.00 per share - - - - - (4,005,898) (4,005,898)1st Interim dividend for the year ending December 31, 2018 @ Rs. 4.00 per share - - - - - (5,341,198) (5,341,198) - - - - - (9,347,096) (9,347,096)Total comprehensive income for the nine months ended September 30, 2018
Profit for the period - - - - - 12,535,607 12,535,607 Unrealised loss on remeasurement of FVOCI investment - net of tax - - - - - - - - - - - - 12,535,607 12,535,607 Balance as at September 30, 2018 (Unaudited) 13,352,993 3,384,904 (304,027) - (47,669) 27,815,082 44,201,283 The annexed notes from 1 to 19 form an integral part of these condensed interim financial statements.
Remeasurement of investments
Reserve on amalgamation
26third quarter 2019 accounts
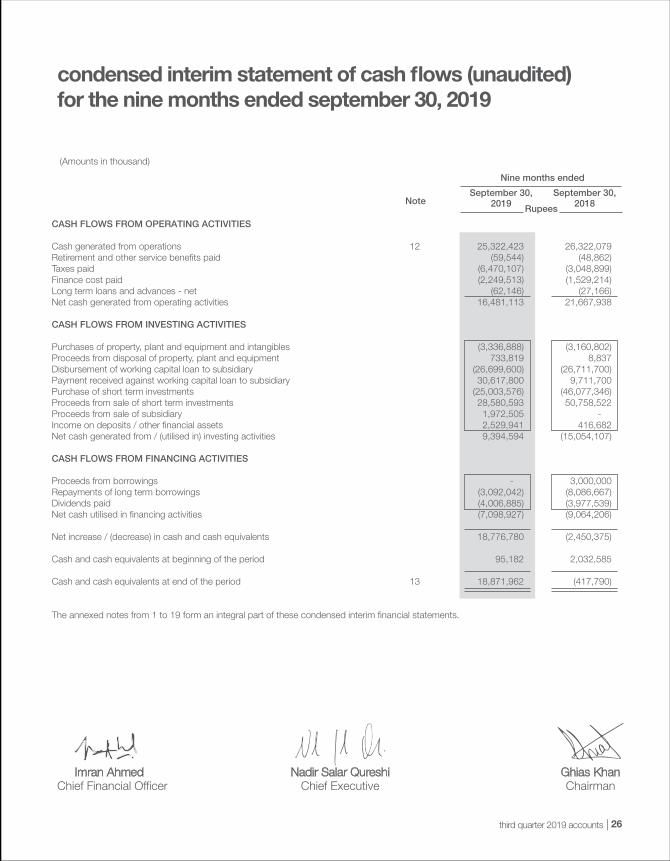
condensed interim statement of cash flows (unaudited) for the nine months ended september 30, 2019
(Amounts in thousand)
CASH FLOWS FROM OPERATING ACTIVITIES Cash generated from operations 12 25,322,423 26,322,079 Retirement and other service benefits paid (59,544) (48,862)Taxes paid (6,470,107) (3,048,899)Finance cost paid (2,249,513) (1,529,214)Long term loans and advances - net (62,146) (27,166)Net cash generated from operating activities 16,481,113 21,667,938 CASH FLOWS FROM INVESTING ACTIVITIES Purchases of property, plant and equipment and intangibles (3,336,888) (3,160,802)Proceeds from disposal of property, plant and equipment 733,819 8,837 Disbursement of working capital loan to subsidiary (26,699,600) (26,711,700)Payment received against working capital loan to subsidiary 30,617,800 9,711,700 Purchase of short term investments (25,003,576) (46,077,346)Proceeds from sale of short term investments 28,580,593 50,758,522 Proceeds from sale of subsidiary 1,972,505 - Income on deposits / other financial assets 2,529,941 416,682 Net cash generated from / (utilised in) investing activities 9,394,594 (15,054,107) CASH FLOWS FROM FINANCING ACTIVITIES Proceeds from borrowings - 3,000,000 Repayments of long term borrowings (3,092,042) (8,086,667)Dividends paid (4,006,885) (3,977,539)Net cash utilised in financing activities (7,098,927) (9,064,206) Net increase / (decrease) in cash and cash equivalents 18,776,780 (2,450,375) Cash and cash equivalents at beginning of the period 95,182 2,032,585 Cash and cash equivalents at end of the period 13 18,871,962 (417,790) The annexed notes from 1 to 19 form an integral part of these condensed interim financial statements.
Rupees
Nine months ended
September 30, 2018
September 30, 2019

27
notes to the condensed interim financial statements (unaudited)for the nine months ended september 30, 2019
(Amounts in thousand)
1. LEGAL STATUS AND OPERATIONS 1.1 Engro Fertilizers Limited (‘the Company’) is a public company incorporated in Pakistan on June 29, 2009, as a wholly owned subsidiary
of Engro Corporation Limited (the Holding Company), which is a subsidiary of Dawood Hercules Corporation Limited (the Ultimate Parent Company). The Company is listed on Pakistan Stock Exchange Limited (PSX). The principal activity of the Company is manufacturing, purchasing and marketing of fertilizers. The registered head office of the Company is situated at 7th and 8th floors, The Harbour Front Building, Plot Number HC-3, Block 4, Scheme Number 5, Clifton, Karachi.
2. BASIS OF PREPARATION AND SIGNIFICANT ACCOUNTING POLICIES 2.1 Statement of compliance These condensed interim financial statements have been prepared in accordance with the accounting and reporting standards applicable
in Pakistan for interim financial reporting. The accounting and reporting standards applicable in Pakistan for interim financial reporting comprise of:
- International Accounting Standard 34, ‘Interim Financial Reporting’, (IAS 34) issued by the International Accounting Standards Board (IASB) as notified under the Companies Act, 2017 (the Act); and
- provisions of and directives issued under the Act. Where the provisions of or directives issued under the Act differs with the requirements of IAS 34, the provisions of and directives issued
under the Act have been followed. 2.2 These condensed interim financial statements represent the condensed interim financial statements of the Company on a standalone
basis. The consolidated condensed interim financial statements of the Company and its subsidiary companies are presented separately. These condensed interim financial statements do not include all the information required for annual financial statements and therefore should be read in conjunction with the audited annual financial statements of the Company for the year ended December 31, 2018.
2.3 The accounting policies and the methods of computation adopted in the preparation of these condensed interim financial statements are same as those applied in the preparation of the annual financial statements of the Company for the year ended December 31, 2018 except for changes stated in note 2.4.
2.4 New accounting standards, interpretations and amendments to approved accounting standards a) Standards, interpretations and amendments to approved accounting standards that are effective for the period and are
relevant to the Company There are certain new standards, interpretations and amendments to approved accounting standards which are applicable for the
first time on the Company’s accounting periods beginning on or after January 1, 2019 but are considered not to be relevant or have any significant effect on the Company’s financial reporting, except as follows:
- IFRS 15 - ‘Revenue from Contracts with Customers’, supersedes IAS 11 ‘Construction Contracts’, IAS 18 ‘Revenue’ and
related interpretations and it applies to all revenue arising from contracts with customers, unless those contracts are in the scope of other standards.
The new standard establishes a five-step model to account for revenue arising from contracts with customers. Under IFRS 15,
revenue is recognized at an amount that reflects the consideration to which an entity expects to be entitled in exchange for transferring goods or services to a customer. The standard requires entities to exercise judgement, taking into consideration all of the relevant facts and circumstances when applying each step of the model to contracts with their customers. The Company has assessed that significant performance obligations in its contracts with the customers are discharged at a single point of time, and therefore there is no significant financial impact of IFRS 15 on the Company.
- IFRS 16 - ‘Leases’ replaces the previous standard IAS 17 - ‘Leases’. It introduces a single lessee accounting model and requires
a lessee to recognize assets and liabilities on the statement of financial position for almost all leases. Under the new standard, an asset (the right to use the leased item) and a financial liability to pay rentals are recognised. The only exceptions are short term and low value leases. The Company has assessed that application of this standard does not have any financial impact on these condensed interim financial statements.

28third quarter 2019 accounts
(Amounts in thousand)
- IFRS 9 - ‘Financial Instruments’ addresses the classification, measurement and recognition of financial assets and financial liabilities and replaces the related guidance in IAS 39. IFRS 9 retains but simplifies the mixed measurement model and establishes three primary measurement categories for financial assets: amortised cost, fair value through other comprehensive income (OCI) and fair value through profit or loss (FVTPL). The basis of classification depends on the entity’s business model and the contractual cash flow characteristics of the financial asset. Investments in equity instruments are required to be measured at fair value through profit or loss with the irrevocable option at inception to present changes in fair value in OCI, without recycling of fair value changes to profit or loss.
There is now a new expected credit losses model that replaces the incurred loss impairment model of IAS 39. For financial
liabilities there are no changes to classification and measurement except for the recognition of changes in own credit risk in OCI, for liabilities designated at fair value through profit or loss. IFRS 9 relaxes the requirements for hedge effectiveness by replacing the bright line hedge effectiveness tests. It requires an economic relationship between the hedged item and hedging instrument and for the ‘hedged ratio’ to be the same as the one management actually use for risk management purposes.
The following is the summary of the Company’s assessment of impacts on condensed interim financial statements as at
September 30, 2019 due to application of IFRS 9:
In light of the above requirements, certain changes have been made to the accounting policies of the Company. However, based on aforementioned assessment, there is no material current financial impact of these changes on the Company.
b) Standards, interpretations and amendments to approved accounting standards that are not yet effective
The following amendments to approved accounting standards are not yet effective. At present, the impact of application of these amendments on the Company’s future financial statements is being assessed.
Non - current financial assets Long term loans and advances Loans and receivables Amortised cost 201,386 201,386 - Current financial assets Trade debts Loans and receivables Amortised cost 2,103,210 2,103,210 - Working capital loan to subsidiary Loans and receivables Amortised cost 9,759,500 9,759,500 - Loans, advances, deposits and prepayments Loans and receivables Amortised cost 795,857 795,857 - Other receivables Loans and receivables Amortised cost 8,218,021 8,218,021 - Short term investments: - Government Securities Available for sale Fair value through OCI 23,654,819 23,654,819 - - Term Deposits / Placements with Banks Held to maturity Amortised cost 196,607 196,607 - Accrued Income Loans and receivables Amortised cost 340,265 340,265 - Cash and bank balances Loans and receivables Amortised cost 723,799 723,799 - Non current financial liabilities Borrowings Amortized cost Amortised cost 18,984,907 18,984,907 - Current financial liabilities Trade and other payables Amortized cost Amortised cost 42,553,149 42,553,149 - Short term borrowings Amortized cost Amortised cost 1,480,547 1,480,547 - Accrued interest / mark-up Amortized cost Amortised cost 640,881 640,881 -
New(Under IFRS 9)
New(Under IFRS 9)
Original(Under IAS 39)
Original(Under IAS 39)
Classfication & measurement category
Particulars
Carrying amount
Difference
Rupees

29
UnauditedSeptember 30,
2019
AuditedDecember 31,
2018Rupees
(Amounts in thousand)
IAS 1 - Presentation of Financial Statements (Amendments) January 1, 2020 IAS 8 - Accounting Policies, Changes in Accounting Estimates and Errors (Amendments) January 1, 2020 2.5 The preparation of these condensed interim financial statements in conformity with the approved accounting standards requires the use
of certain critical accounting estimates. It also requires management to exercise its judgement in the process of applying the Company’s accounting policies. Estimates and judgments are continually evaluated and are based on historical experience and other factors, including expectation of future events that are believed to be reasonable under the circumstances. Actual results may differ from these estimates.
During the preparation of these condensed interim financial statements, the significant judgements and estimates made by the
management are the same as those that were applied to annual financial statements of the Company for the year ended December 31, 2018.
2.6 Taxes on income in the interim periods are accrued using the effective tax rate that would be applicable to expected total annual profit or
loss. Effective tax rate is computed by considering the impact of change in tax rate resulting from the amendment in Finance Act, 2019.
3. PROPERTY, PLANT AND EQUIPMENT Operating assets at net book value (note 4.1) 62,715,857 64,471,674 Capital work-in-progress (note 4.2) 3,748,487 3,159,249 Major spare parts and stand-by equipment 765,277 573,033 67,229,621 68,203,956
3.1 Additions to and disposals from operating assets during the period are as follows:
Building on freehold land 87,646 29,866 - - Leasehold land - - 28,238 - Plant and machinery 1,882,091 1,318,239 - - Catalyst 371,195 213,900 - - Office equipment 71,832 142,696 415 - Vehicles 116,676 126,025 6,940 1,393 2,529,440 1,830,726 35,593 1,393
The above disposals represent assets having a cost of Rs. 895,437 (September 30, 2018: Rs. 13,941) and net book value of Rs. 35,593
(September 30, 2018: Rs.1,393), which were disposed off for Rs. 733,819 (September 30, 2018: Rs. 8,837).
Effective date (Annual periods
beginning onor after)
September 30,2019
September 30,2019
UnauditedAdditions (at cost) Disposals (at net book value)
September 30,2018
September 30,2018

30third quarter 2019 accounts
(Amounts in thousand)
UnauditedSeptember 30,
2019
AuditedDecember 31,
2018Rupees
UnauditedSeptember 30,
2019
AuditedDecember 31,
2018Rupees
UnauditedSeptember 30,
2019
AuditedDecember 31,
2018Rupees
3.2 Capital work-in-progress Balance at beginning of the period / year 3,159,249 3,396,331 Add: Additions during the period / year 3,144,312 4,333,447 Transferred to: - operating assets (2,529,440) (4,529,819) - intangible assets (25,634) (40,710) Balance at end of the period / year 3,748,487 3,159,249 4. WORKING CAPITAL LOAN TO SUBSIDIARY The working capital loan facility limit provided to EFert Agritrade (Private) Limited (EAPL) has been extended to Rs. 19,000,000. The
mark-up on this loan is receivable at the rate of 1 month KIBOR + 0.5% on quarterly basis. The total facility availed by EAPL at the period end amounts to Rs. 9,759,500 (December 31, 2018: Rs. 13,677,700).
5. SHORT TERM INVESTMENTS Pakistan Investment Bonds - 6,244,613 Treasury Bills 22,097,166 - Sales tax refund bonds (note 5.1) 1,557,653 - Others 196,608 90,000 23,851,427 6,334,613 5.1 These bonds have been received from the Federal Board of Revenue (FBR) in settlement of outstanding sales tax refunds upon election
by the Company under Section 67A of the Sales tax Act, 1990. These bonds will mature in three years and carry interest at the rate of 10% per annum payable on maturity.
6. BORROWINGS - Secured Long term finance utilised under mark-up arrangements (notes 6.1 and 6.2) 28,001,325 29,692,102 Sukuk Certificates (notes 6.1 and 6.2) - 1,118,527 28,001,325 30,810,629 Less: Current portion shown under current liabilities 9,016,418 5,095,584
Balance at end of the period / year 18,984,907 25,715,045
6.1 All senior debts are secured by an equitable mortgage upon immovable property of the Company and equitable charge over present and future fixed assets excluding immovable property of the Company.
Privately Placed Subordinated Sukuk (PPSS) are secured by a sub-ordinated mortgage upon immovable property of the Company and sub-ordinated charge over all present and future fixed assets excluding immovable property of the Company.
6.2 During the period, principal repayments of long term finances were made to Local Syndicate, Standard Chartered Bank Limited, Samba Bank Limited, Dubai Islamic Bank Limited and Subordinated Sukuk amounting to Rs. 1,522,042, Rs. 200,000, Rs. 50,000, Rs.200,000 and Rs. 1,120,000, respectively.

31
September 30,2019
September 30,2019
UnauditedQuarter ended Nine months ended
September 30,2018
September 30,2018
(Amounts in thousand)
UnauditedSeptember 30,
2019
AuditedDecember 31,
2018Rupees
7. SHORT TERM BORROWINGS The facilities for short term running finances, available from various banks, aggregate to Rs. 16,850,000 (December 31, 2018: Rs.
16,850,000). The mark-up rates on these facilities range from 1 to 3 months KIBOR plus 0.2% to 1.5% per annum. These arrangements are secured by floating charge upon all present and future stocks including raw and packaging materials, finished goods, stores and spares and other merchandise and on all present and future book debts, outstanding monies, receivable claims and bills of the Company. As at September 30, 2019, the Company has utilised Rs. 1,480,547 (December 31, 2018: Rs. 636,878) out of the aforementioned facilities.
8. CONTINGENCIES AND COMMITMENTS Contingencies 8.1 Bank guarantees of Rs. 2,616,942 (December 31, 2018: Rs. 2,582,754) have been issued in favour of third parties. 8.2 Claims, including pending lawsuits, against the Company not acknowledged as debts amounted to Rs. 58,680 (December 31, 2018:
Rs. 58,680). 8.3 In the year 2017, the High Court of Islamabad in its order dated June 8, 2017 declared that the income derived by M/s Snamprogetti
Engineering (the Contractor) from its contract with the Company, is subject to tax as per Clause 4 of Article 5 of Double Taxation Treaty between Pakistan and the Netherlands. As per the terms of the contract, the Company is liable to reimburse the Contractor for any taxes applied to the income of the Contractor under the contract by the taxation authorities. In respect thereof, the Contractor preferred an appeal in the Supreme Court of Pakistan (SCP). During the period, the SCP decided the case on ex-parte basis against the Contractor. A review application for case restoration has been filed by the Contractor with SCP. The management of the Company based on the opinion of its legal counsel is confident that the chances of restoration application being allowed by SCP are good. Accordingly, no provision has been made in this respect for the potential exposure of Rs. 1,178,391.
8.4 Except as mentioned above, as at September 30, 2019, there is no material change in the status of matters reported as contingencies
in the annual financial statements of the Company for the year ended December 31, 2018.
8.5 Commitments Commitments in respect of capital expenditure and other operational items 2,692,931 1,684,473
9. NET SALES
Gross sales: - manufactured product 18,595,440 17,271,679 53,034,429 48,043,624 - purchased and packaged product 299,149 217,183 880,060 1,082,338 - services 13,069 - 13,069 - 18,907,658 17,488,862 53,927,558 49,125,962 Less: Sales tax 368,314 349,584 1,046,371 1,845,196 18,539,344 17,139,278 52,881,187 47,280,766
32third quarter 2019 accounts
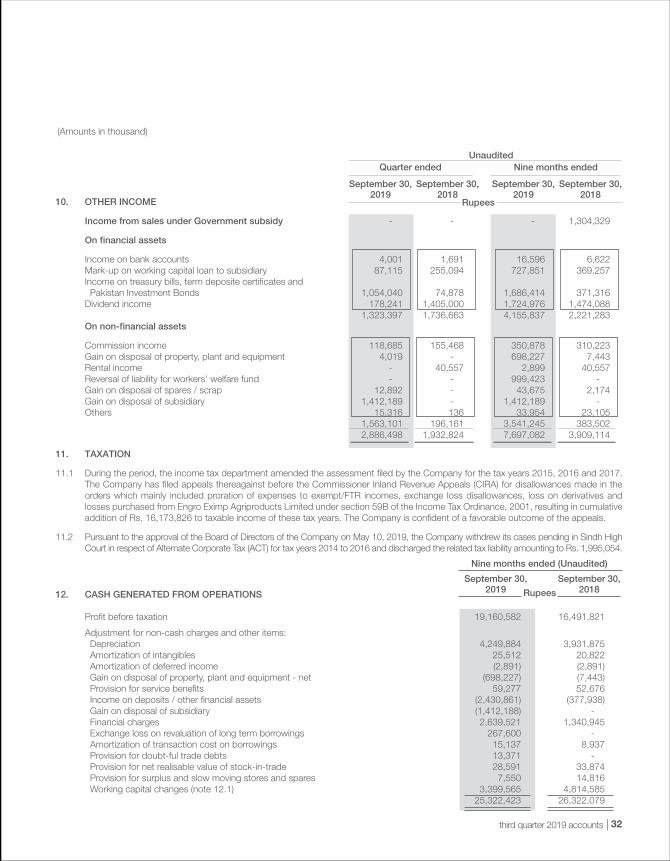
10. OTHER INCOME
Income from sales under Government subsidy - - - 1,304,329
On financial assets
Income on bank accounts 4,001 1,691 16,596 6,622 Mark-up on working capital loan to subsidiary 87,115 255,094 727,851 369,257 Income on treasury bills, term deposite certificates and Pakistan Investment Bonds 1,054,040 74,878 1,686,414 371,316 Dividend income 178,241 1,405,000 1,724,976 1,474,088 1,323,397 1,736,663 4,155,837 2,221,283 On non-financial assets
Commission income 118,685 155,468 350,878 310,223 Gain on disposal of property, plant and equipment 4,019 - 698,227 7,443 Rental income - 40,557 2,899 40,557 Reversal of liability for workers’ welfare fund - - 999,423 - Gain on disposal of spares / scrap 12,892 - 43,675 2,174 Gain on disposal of subsidiary 1,412,189 - 1,412,189 - Others 15,316 136 33,954 23,105 1,563,101 196,161 3,541,245 383,502 2,886,498 1,932,824 7,697,082 3,909,114
11. TAXATION
11.1 During the period, the income tax department amended the assessment filed by the Company for the tax years 2015, 2016 and 2017. The Company has filed appeals thereagainst before the Commissioner Inland Revenue Appeals (CIRA) for disallowances made in the orders which mainly included proration of expenses to exempt/FTR incomes, exchange loss disallowances, loss on derivatives and losses purchased from Engro Eximp Agriproducts Limited under section 59B of the Income Tax Ordinance, 2001, resulting in cumulative addition of Rs. 16,173,826 to taxable income of these tax years. The Company is confident of a favorable outcome of the appeals.
11.2 Pursuant to the approval of the Board of Directors of the Company on May 10, 2019, the Company withdrew its cases pending in Sindh High Court in respect of Alternate Corporate Tax (ACT) for tax years 2014 to 2016 and discharged the related tax liability amounting to Rs. 1,995,054.
12. CASH GENERATED FROM OPERATIONS
Profit before taxation 19,160,582 16,491,821
Adjustment for non-cash charges and other items: Depreciation 4,249,884 3,931,875 Amortization of intangibles 25,512 20,822 Amortization of deferred income (2,891) (2,891) Gain on disposal of property, plant and equipment - net (698,227) (7,443) Provision for service benefits 59,277 52,676 Income on deposits / other financial assets (2,430,861) (377,938) Gain on disposal of subsidiary (1,412,188) - Financial charges 2,639,521 1,340,945 Exchange loss on revaluation of long term borrowings 267,600 - Amortization of transaction cost on borrowings 15,137 8,937 Provision for doubt-ful trade debts 13,371 - Provision for net realisable value of stock-in-trade 28,591 33,874 Provision for surplus and slow moving stores and spares 7,550 14,816 Working capital changes (note 12.1) 3,399,565 4,814,585 25,322,423 26,322,079
September 30,2019
September 30,2019
UnauditedQuarter ended Nine months ended
September 30,2018
September 30,2018
(Amounts in thousand)
September 30,2019
September 30,2018Rupees
Nine months ended (Unaudited)
33
(Amounts in thousand)
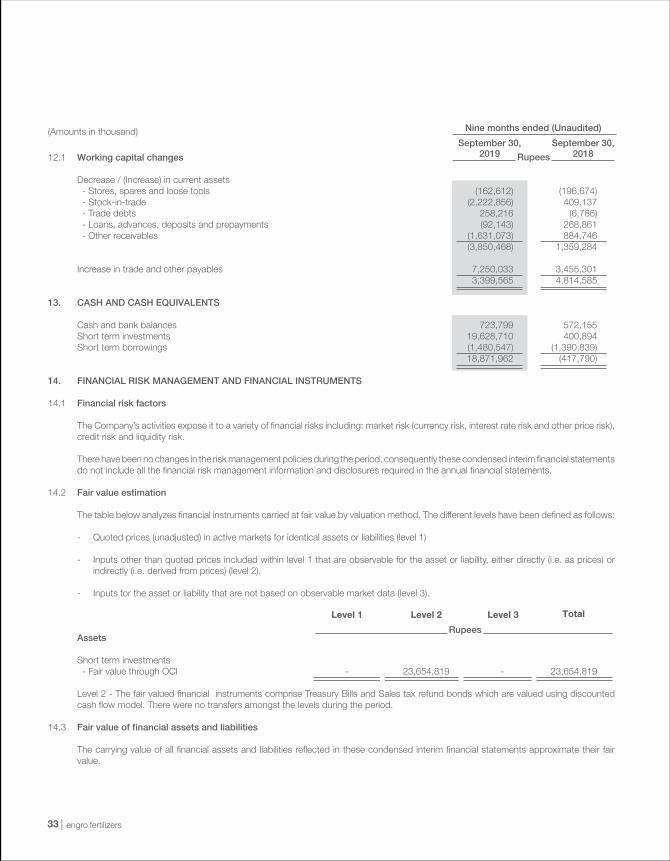
12.1 Working capital changes
Decrease / (Increase) in current assets - Stores, spares and loose tools (162,612) (196,674) - Stock-in-trade (2,222,856) 409,137 - Trade debts 258,216 (6,786) - Loans, advances, deposits and prepayments (92,143) 268,861 - Other receivables (1,631,073) 884,746 (3,850,468) 1,359,284 Increase in trade and other payables 7,250,033 3,455,301 3,399,565 4,814,585
13. CASH AND CASH EQUIVALENTS Cash and bank balances 723,799 572,155 Short term investments 19,628,710 400,894 Short term borrowings (1,480,547) (1,390,839) 18,871,962 (417,790) 14. FINANCIAL RISK MANAGEMENT AND FINANCIAL INSTRUMENTS 14.1 Financial risk factors The Company’s activities expose it to a variety of financial risks including: market risk (currency risk, interest rate risk and other price risk),
credit risk and liquidity risk. There have been no changes in the risk management policies during the period, consequently these condensed interim financial statements
do not include all the financial risk management information and disclosures required in the annual financial statements. 14.2 Fair value estimation The table below analyzes financial instruments carried at fair value by valuation method. The different levels have been defined as follows: - Quoted prices (unadjusted) in active markets for identical assets or liabilities (level 1) - Inputs other than quoted prices included within level 1 that are observable for the asset or liability, either directly (i.e. as prices) or
indirectly (i.e. derived from prices) (level 2). - Inputs for the asset or liability that are not based on observable market data (level 3).
Assets
Short term investments - Fair value through OCI - 23,654,819 - 23,654,819
Level 2 - The fair valued financial instruments comprise Treasury Bills and Sales tax refund bonds which are valued using discounted cash flow model. There were no transfers amongst the levels during the period.
14.3 Fair value of financial assets and liabilities
The carrying value of all financial assets and liabilities reflected in these condensed interim financial statements approximate their fair value.
September 30,2019
September 30,2018Rupees
Nine months ended (Unaudited)
Level 1 Level 2 Level 3 Total
Rupees

34third quarter 2019 accounts
(Amounts in thousand)
15. TRANSACTIONS WITH RELATED PARTIES Related parties comprise of Parent Company, associated companies, retirement benefit funds, directors and key management personnel.
Details of transactions with related parties during the period, other than those which have been disclosed elsewhere in these condensed interim financial statements, are as follows:
Parent company Purchases and services received 401,786 306,524 Services provided 49,417 39,133 Royalty charged to the Company 778,579 694,222 Reimbursements made: - to the Company 61,179 45,880 - by the Company 141,603 70,176 Dividend paid by the Company 2,253,936 2,253,936 Subsidiary companies Purchase and services received - 40,349 Reimbursements made: - by the Company 3,097 57,026 - to the Company 22,235 28,833 Dividend received by the Company 1,724,975 1,474,088 Payment of funds collected against sales made on behalf of subsidiary 28,467,410 21,438,651 Disbursements of working capital loan to subsidiary 22,781,400 26,711,700 Repayment received against working capital loan to subsidiary 26,699,600 9,711,700 Mark-up received on working capital loan to subsidiary 727,851 369,257 Commission income earned from subsidiary 350,878 310,223 Associated companies Purchases and services received 124,349 78,059 Sale of product by the Company 1,736 - Services provided by the Company 60,356 98,104 Advance received against sale of land 705,600 - Reimbursements made: - by the Company 47,550 42,658 - to the Company 11,874 9,227 Contribution to Engro Foundation under Corporate Social Responsibility 53,500 40,000 Dividend paid to trustees of Engro Foods Limited Gratuity Fund 237 306 Contribution to staff retirement benefits Pension fund 7,582 13,844 Gratuity fund 96,793 89,285 Provident fund 106,733 99,114
September 30,2019
September 30,2018Rupees
Nine months ended (Unaudited)
35
(Amounts in thousand)
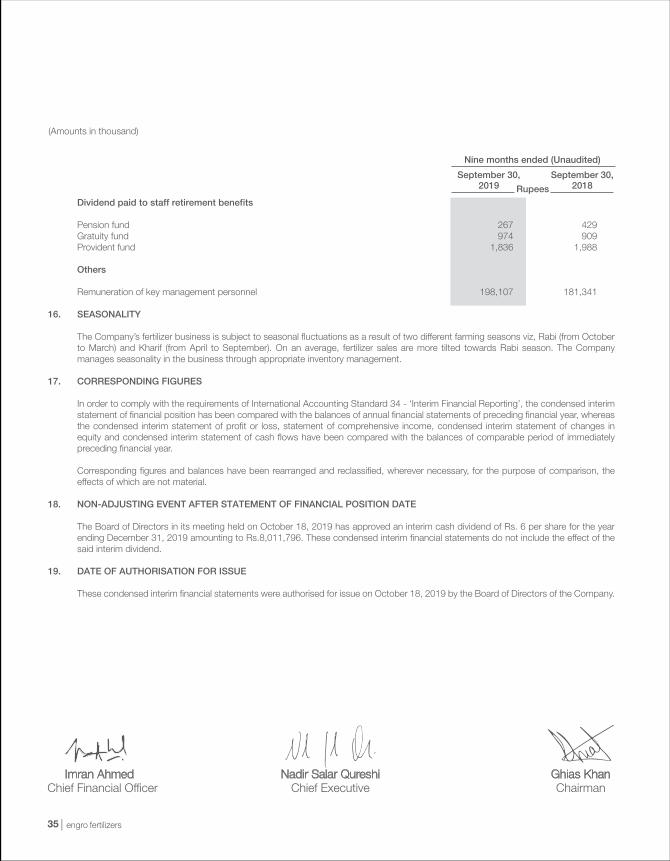
Dividend paid to staff retirement benefits Pension fund 267 429 Gratuity fund 974 909 Provident fund 1,836 1,988 Others Remuneration of key management personnel 198,107 181,341 16. SEASONALITY The Company’s fertilizer business is subject to seasonal fluctuations as a result of two different farming seasons viz, Rabi (from October
to March) and Kharif (from April to September). On an average, fertilizer sales are more tilted towards Rabi season. The Company manages seasonality in the business through appropriate inventory management.
17. CORRESPONDING FIGURES In order to comply with the requirements of International Accounting Standard 34 - ‘Interim Financial Reporting’, the condensed interim
statement of financial position has been compared with the balances of annual financial statements of preceding financial year, whereas the condensed interim statement of profit or loss, statement of comprehensive income, condensed interim statement of changes in equity and condensed interim statement of cash flows have been compared with the balances of comparable period of immediately preceding financial year.
Corresponding figures and balances have been rearranged and reclassified, wherever necessary, for the purpose of comparison, the effects of which are not material.
18. NON-ADJUSTING EVENT AFTER STATEMENT OF FINANCIAL POSITION DATE The Board of Directors in its meeting held on October 18, 2019 has approved an interim cash dividend of Rs. 6 per share for the year
ending December 31, 2019 amounting to Rs.8,011,796. These condensed interim financial statements do not include the effect of the said interim dividend.
19. DATE OF AUTHORISATION FOR ISSUE These condensed interim financial statements were authorised for issue on October 18, 2019 by the Board of Directors of the Company.
September 30,2019
September 30,2018Rupees
Nine months ended (Unaudited)

36third quarter 2019 accounts

37
38third quarter 2019 accounts

01