third quarter 2011 and the years to come - vestas | home/media/vestas/investor/investor...
TRANSCRIPT

Third quarter 2011 and the years to come9 November 2011 │ Vestas │ Aarhus │ Denmark

Agenda
Third quarter 20112
1. Introduction
2. Nine months 2011
3. Guidance 2011
4. Vestas as of today
5. Challenging 2012 and 2013
6. Financial priorities and goals
7. Q & A
Mr Engel
Mr Nørremark
Mr Nørremark
Mr Engel
Mr Engel
Mr Engel
Mr Engel and Mr Nørremark

Third quarter 20113
This presentation contains forward-looking statements concerning Vestas' financial condition, results ofoperations and business. All statements other than statements of historical fact are, or may be deemed to be,forward-looking statements. Forward-looking statements are statements of future expectations that are basedon management’s current expectations and assumptions and involve known and unknown risks and uncertaintiesthat could cause actual results, performance or events to differ materially from those expressed or implied inthese statements.
Forward-looking statements include, among other things, statements concerning Vestas' potential exposure tomarket risks and statements expressing management’s expectations, beliefs, estimates, forecasts, projectionsand assumptions. There are a number of factors that could affect Vestas' future operations and could causeVestas' results to differ materially from those expressed in the forward-looking statements included in thispresentation, including (without limitation): (a) changes in demand for Vestas' products; (b) currency and interestrate fluctuations; (c) loss of market share and industry competition; (d) environmental and physical risks; (e)legislative, fiscal and regulatory developments, including changes in tax or accounting policies; (f) economic andfinancial market conditions in various countries and regions; (g) political risks, including the risks of expropriationand renegotiation of the terms of contracts with governmental entities, and delays or advancements in theapproval of projects; (h) ability to enforce patents; (i) product development risks; (j) cost of commodities; (k)customer credit risks; and (l) supply of components.
All forward-looking statements contained in this presentation are expressly qualified by the cautionarystatements contained or referenced to in this statement. Undue reliance should not be placed on forward-lookingstatements. Additional factors that may affect future results are contained in Vestas' annual report for the yearended 31 December 2010 (available at www.vestas.com/investor) and these factors also should be considered.Each forward-looking statement speaks only as of the date of this presentation. Vestas does not undertake anyobligation to publicly update or revise any forward-looking statement as a result of new information or futureevents others than required by Danish law. In light of these risks, results could differ materially from those stated,implied or inferred from the forward-looking statements contained in this presentation.
Disclaimer and cautionary statement
Introduction

Third quarter 20115
It no longer makes sense to talk about revenues of EUR 15bn
four years from now.
Triple15: Cancelled.

Third quarter 20116
This is aboutimproving profit andsecuring cash flow.

Major changes in major markets
Third quarter 20117
Two years ago Today
North AmericaNo PTC extension expected.
No Federal Renewable Energy Standard.
EuropeSovereign crises in Europe.
AsiaIntense competition.

Third quarter 20118
New opportunitiesin new markets.
Third quarter 20119
Wind Power becomes more and more
competitive. Day-by-Day!

Third quarter 201110
Our Vision:Wind, Oil and Gas.
INTACT!

Third quarter 201111
2012 and 2013:
Challenging years due to macro economic outlook.

Third quarter 201112
Our Mission:Failure is not an option.
INTACT!

Third quarter 201113
Our high ambitionsare not cancelled.

International Energy AgencyAs of this morning, 9 November 2011
‘Delaying action is a false economy:For every $1 of investment avoided in the power sector before 2020 an additional $4.3 would need to be spent after 2020 to compensate for the increased emissions.’
Source: IEA, World Energy Outlook 2011
Third quarter 201114

Nine months 2011
Third quarter 2011
Third quarter 201116
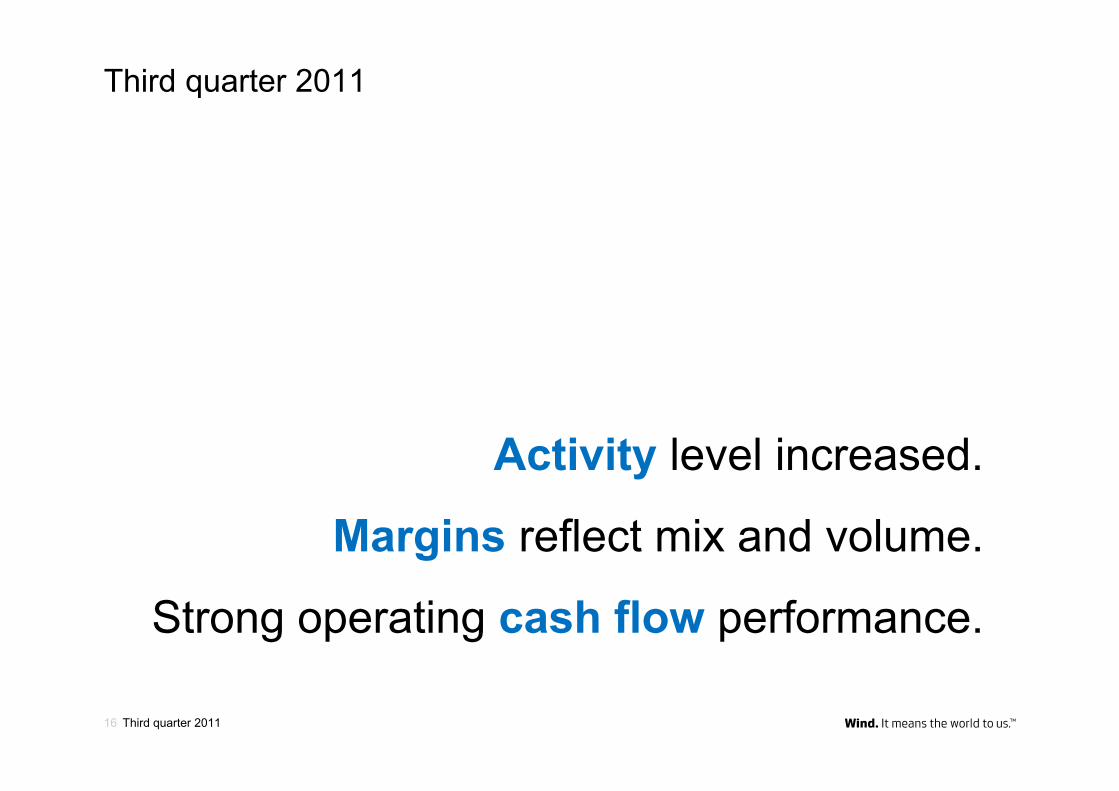
Activity level increased.
Margins reflect mix and volume.
Strong operating cash flow performance.

387
588
1,456
634
1,4171,525
Q1 Q2 Q3 Q1 Q2 Q3
2010 2011
Activity at VestasOur main cash driver
ShipmentsMW
Q3 2011 vs. Q2 2011:Shipments up 8%.
Q3 2011 vs. Q3 2010:Shipments up 5%.
9M 2011 vs. 9M 2010:Shipments up 47%.
Third quarter 201117

Q3 2011 vs. Q2 2011:Deliveries up 13%.
Q3 2011 vs. Q3 2010:Deliveries down 25%.
9M 2011 vs. 9M 2010:Deliveries down 1%.
Deliveries to customers
Third quarter 201118
The main revenue driver
758839
1,688
864
1,127
1,270
Q1 Q2 Q3 Q1 Q2 Q3
2010 2011
DeliveriesMW
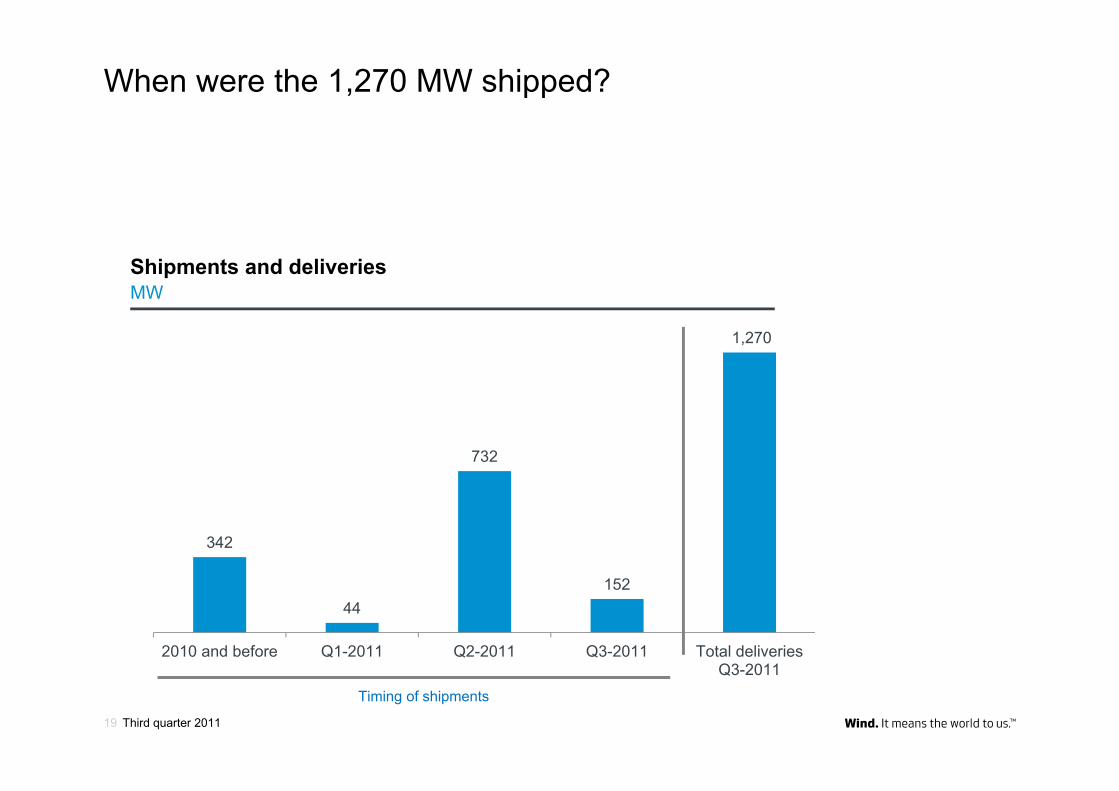
When were the 1,270 MW shipped?
Shipments and deliveriesMW
342
44
732
152
1,270
2010 and before Q1-2011 Q2-2011 Q3-2011 Total deliveriesQ3-2011
Timing of shipments
Third quarter 201119

Profit and loss account versus cash flowMajor fluctuations in earnings Q-on-Q
mEUR Q32011
Q22011
Change
Revenue 1,337 1,401 (5)%
Cost of sales (1,227) (1,153) 6%
Gross profit 110 248 (56)%
Fixed costs *) (202) (171) 18%
Operating profit/(loss) (92) 77 -
Profit/(loss) for the period (60) 55 -
Gross margin 8.2% 17.7% (9.5) pts.
EBITDA margin 0.1% 10.7% (10.6) pts.
EBIT margin (6.9)% 5.5% -
*) Sum of research and development costs, selling anddistribution expenses and administrative expenses.
Gross margin down due to mix of projectsand lower volume.
Cost of sales and fixed costs increased by depreciation and amortisation.
mEUR Q32011
Q22011 Change
Operating cash flow 407 126 223%
CF from investments (131) (189) (31)%
Free cash flow 276 (63) -
Third quarter 201120
Third quarter 201121
Every contract has its own characteristics.

Third quarter 201122
1. Scope – type of contract.2. Uniqueness of offering.3. Value of revenue.4. Scale.5. OPEX/CAPEX allocation.6. Design lifetime.7. Cost differentiation.8. Risk allocation.9. Early generation sharing.10. Relationship efficiency.
Quarterly profit & loss fluctuations driven by mix of contracts
Distribution of margins+200 projects a year
Pricing and risk variablesNot exhaustive

258
394
357
719
656
0
200
400
600
800
1,000
1,200
1,400
Q2-2011 Q3-2011
Turnkey/EPC Supply-and-installation Supply-only
14
Variations in revenue recognition between contract types
Third quarter 201123
However, risk element in each contract is the primary margin explanatory variable
Delivery split on contractsMW
From 1% turnkey/EPC in Q2 to 20% in Q3.
Turnkey projects generate higher margins when shipped and lower margins when delivered.
Transfer of risk.
Transfer of risk.
Percentage of completion.

Revenue: 80Cost: 55Profit 25Profit (%) 31
Project profitability
Third quarter 201124
Illustrative example
• Nacelle• Blades• Tower• Installation• Transport
Supply & Installation
• Foundations• Roads• Civil works• Cranes• Installation• Transport
• Nacelle• Blades• Tower
Revenue: 100Cost: 70Profit 30Profit (%) 30
Revenue: 50Cost: 45Profit 5Profit (%) 10
Revenue: 130Cost: 100Profit 30Profit (%) 23
EPC Contracts / Turnkey
In principle, cash flow is identical in either case.

Fixed cost base
Third quarter 201125
Depreciation and amortisation explain most of the increase from Q2-2011 to Q3-2011
140
192178
197
169 171
202
Q1-2010 Q2-2010 Q3-2010 Q4-2010 Q1-2011 Q2-2011 Q3-2011
Fixed costmEUR

Net working capitalMake-to-order pays off
mEUR 9M2011
Q2 2011 Change
9M2010
Inventories 2,608 2,545 2% 4,000
Trade receivables 591 629 (6)% 791
Construction contracts in progress 188 113 66% 172
Other receivables 350 379 (8)% 352
Prepayments from customers (1,794) (1,452) 24% (3,097)
Trade payables (1,276) (1,090) 17% (1,258)
Other current liabilities (267) (252) 6% (264)
Net working capital 400 872 (54)% 696
As per cent of revenue 6% 14% 8 %-pts. 10%
Stable inventories and increased prepayments reflect that make-to-order is paying off.
Net working capital ratio to be further improved by reducing inventories and by higher order intake.
Third quarter 201126

Net working capital items – deeper dive
Third quarter 201127
Inventories consisting of:1. Contract-related inventories.2. Components.
Prepayments consisting of:1. Milestone payments.2. Down payments and prepayments.

Balance sheet
Assets (mEUR) Q32011
Q22011
Change Q32010
Change
Intangible assets 1,177 1,145 3% 966 22%
• Completed development projects 512 170 201% 144 256%
• Development projects in progress 257 568 (55)% 423 (39)%
Property, plant and equipment 1,816 1,755 3% 1,680 8%
Other non-current assets 358 290 23% 336 7%
Current assets 4,099 3,954 4% 5,596 (27%)
Total assets 7,450 7,144 4% 8,578 (13%)
Equity and liabilities (mEUR) Q32011
Q22011
Change Q32010
Change
Equity 2,618 2,707 (3%) 2,587 1%
Non-current liabilities 1,237 1,396 (11%) 995 24%
Current liabilities 3,595 3,041 18% 4,996 (28%)
Total equity and liabilities 7,450 7,144 4% 8,578 (13%)
Increase in completed development projects and decrease in development projects in progress primarily due to V112 being put into serial production.
Third quarter 201128

Net debt
Third quarter 201129
To be further reduced
404
896
727
579
1,000 1,071
834
Q1 Q2 Q3 Q4 Q1 Q2 Q3
2010 2011
Net debtmEUR
Net debt reduced by 22% from Q2-2011 to Q3-2011

Warranty provisions and quality
6.6%
4.5%
5.7%
2.8%2.4%
2007 2008 2009 2010 9M 2011
Warranty provisionPer cent of revenue
0
1
2
3
4
5
6
7
Lost Production FactorPer cent
Failure is not an option Quality / Lost Production
Factor
Third quarter 201130

Cash flow statementMain lines
mEUR Q32011
Q22011
Q32010
9M2011
9M2010
Profit for the period (60) 55 187 (90) 5
Adjustment for non-cash transactions 15 69 263 161 141
Corporation tax paid (11) (25) (23) (43) (79)
Interest received and paid (net) (9) (11) (24) (34) (33)Cash flow from operating activities before change in working capital (65) 88 403 (6) 34
Change in working capital 472 38 (41) 272 (379)
Cash flow from operating activities 407 126 362 266 (345)
Cash flow from investing activities (131) (189) (182) (484) (533)
Free cash flow 276 (63) 180 (218) (878)
Cash flow from financing activities (158) 63 (225) 188 543
Free cash flow improvement of EUR 660m from 9M 2010 to 9M 2011.
Third quarter 201131

Shipments main determinant of cash flow
Third quarter 201132
Cash flow from operationsmEUR
ShipmentsMW
‐400
‐200
0
200
400
600
800
‐
500
1,000
1,500
2,000
2,500
3,000
Shipments (quarterly) MW Cash flow from Operations
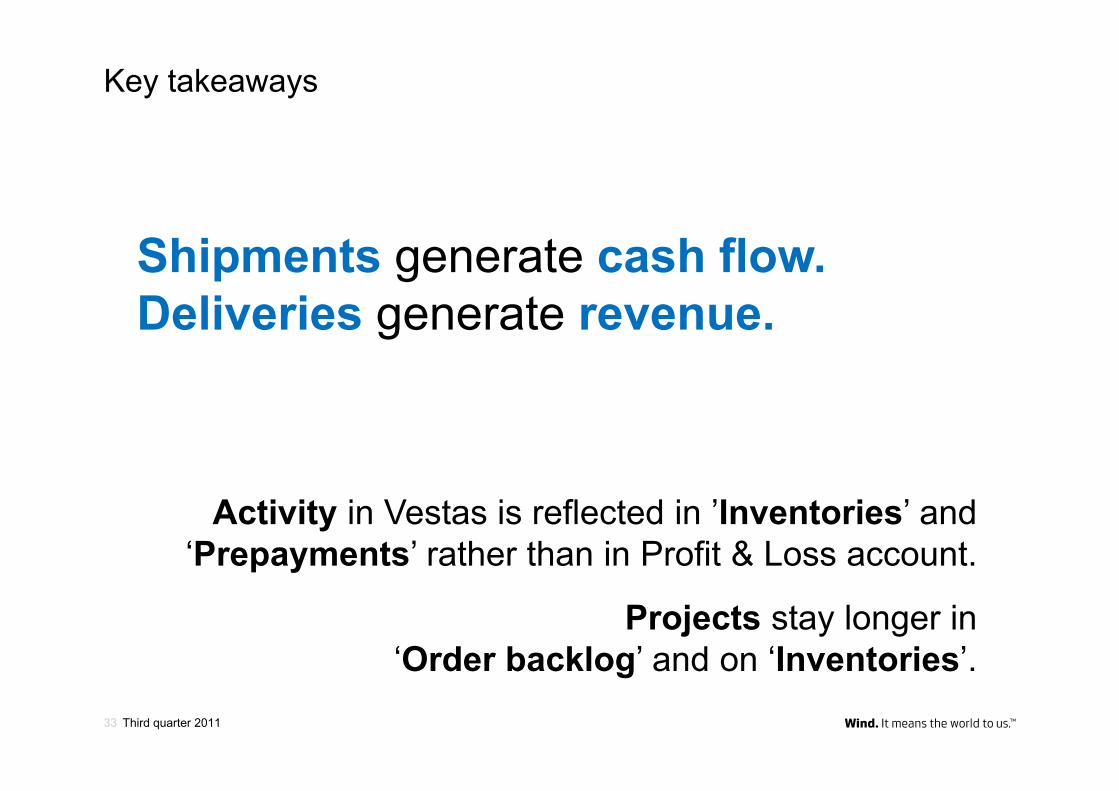
Key takeaways
Shipments generate cash flow.Deliveries generate revenue.
Activity in Vestas is reflected in ’Inventories’ and ‘Prepayments’ rather than in Profit & Loss account.
Projects stay longer in ‘Order backlog’ and on ‘Inventories’.
Third quarter 201133
Guidance 2011
Third quarter 201135
Why did we adjust our guidance?

Third quarter 201136
The reason to adjust guidance: Our new generator plant in Travemünde, Germany
Generators are being produced every day
– but not in the expected quantities.

The reason to adjust guidance: Our new generator plant Delivery interaction
Raw material & suppliers
Manufac-turing
Factory assembly & testing
Transport Installation Operation
Gear
Generator
Hydraulic
Electrical
Controls
Mechanical
Raw material
Raw material
Hydraulic systems
Electrical components
Electrical, electronically
Steel, cast, fasteners
Blades
Towers
Controls
Blades
Towers
Controls
Nacelle
Composite, paint
Steel
Electrical, electronically
Nacelle
Cranes
Lifting equipment
Manpower
Tools
Mechanical completion
Commis-sioning
Goods receipt
Schedule
Regular operation
Third quarter 201137

The reason to adjust guidance: Our new generator plant
Raw material & suppliers
Manufac-turing
Factory assembly & testing
Transport Installation Operation
Gear
Generator
Hydraulic
Electrical
Controls
Mechanical
Raw material
Raw material
Hydraulic systems
Electrical components
Electrical, electronically
Steel, cast, fasteners
Blades
Towers
Controls
Blades
Towers
Controls
Nacelle
Composite, paint
Steel
Electrical, electronically
Nacelle
Cranes
Lifting equipment
Manpower
Tools
Mechanical completion
Commis-sioning
Goods receipt
Schedule
Regular operation
Delivery interaction
Third quarter 201138
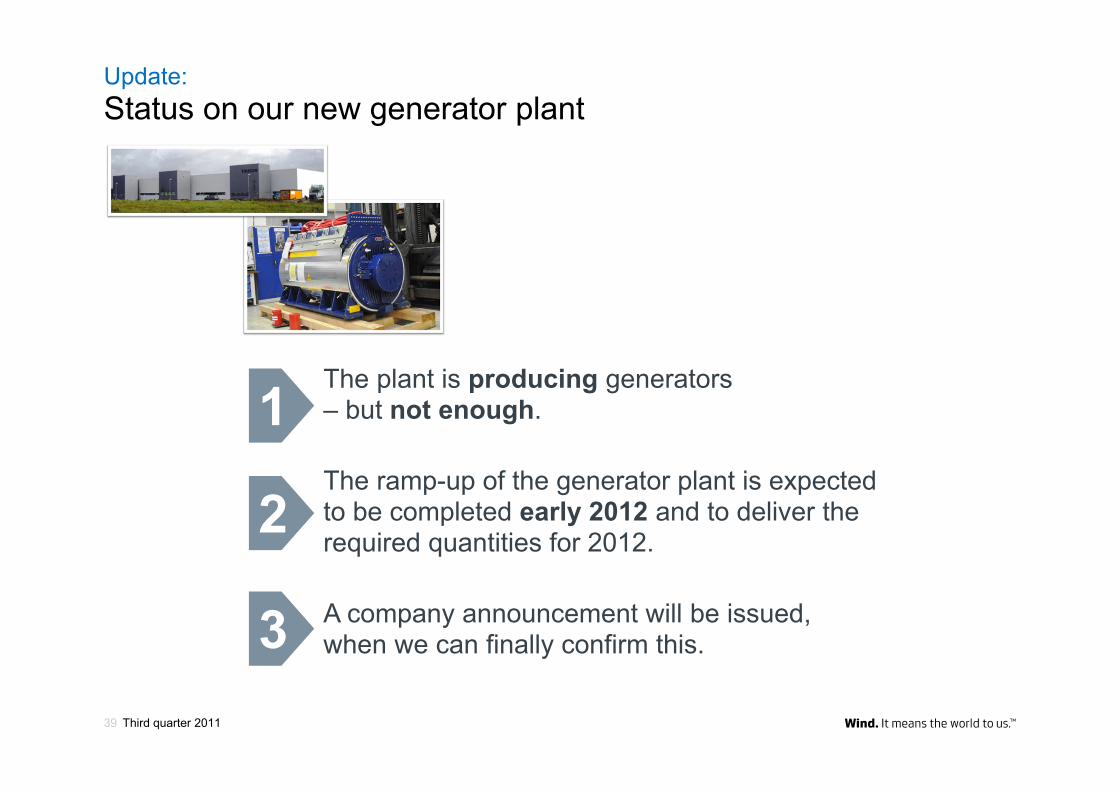
Update:Status on our new generator plant
Third quarter 201139
The plant is producing generators– but not enough.
The ramp-up of the generator plant is expected to be completed early 2012 and to deliver the required quantities for 2012.
A company announcement will be issued, when we can finally confirm this.
1
2
3

Guidance 2011
Order intake, firm and unconditional (MW) 7,000-8,000
Production and shipments (MW) ~5,500
Revenue (mEUR) ~6,400
- of which service revenue (mEUR) 700
EBIT margin (%) ~4
EBIT margin, service (%) 15
Financials, net (mEUR) (60)
Tax rate (%) 28
Investments (mEUR) 850
Free cash flow (mEUR) > 0
Warranty provisions (%) < 3
Industrial injuries (per one million working hours) ≤ 5
Customer loyalty (index) 72
Share of renewable energy (%) 40
Share of renewable electricity (%) 95
Quality level (Sigma) ≥ 5
EBIT margin in Q4 of ~13%.
Third quarter 201140

630 2,265 1,316 863
2,426
Q1 Q2 Q3 Oct Nov. - Dec.
Order intake of 7,000-8,000 MW in 2011
Third quarter 201141
Stable average selling price despite market sentiment
Order intake 2011MW
Mid-range
Average selling price of order intakePrice/MW
0.0
0.2
0.4
0.6
0.8
1.0
1.2
1.4
FY FY FY FY FY Q1 Q2 Q3 Q4 Q1 Q2 Q3
2005 2006 2007 2008 2009 2010 2011
Announced orders
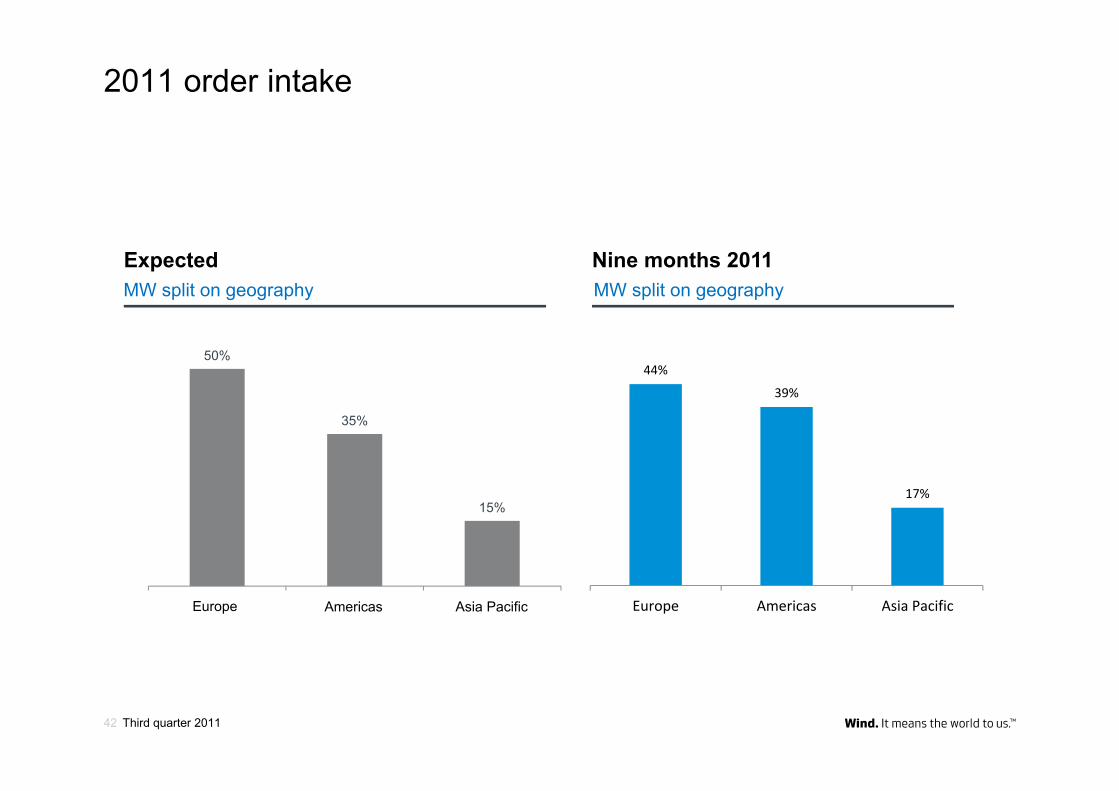
2011 order intake
ExpectedMW split on geography
Nine months 2011MW split on geography
44%
39%
17%
Europe Americas Asia Pacific
50%
35%
15%
Europe Americas Asia PacificEurope Americas Asia Pacific
Third quarter 201142

The back-end loaded 2011 means that recognition of revenue and EBIT relies on smooth project execution in Q4.
Please still remember!
Third quarter 201143

(1,000)
(800)
(600)
(400)
(200)
0
200
400
600
800
1,000
2007 2008 2009 2010 2011
Cash generationStrong working capital improvement
InvestmentsmEUR
Free cash flow
Cash flow from operationsmEUR
Third quarter 201144
Vestas as of today

Qualified
Third quarter 201146
Global presence.
In the region for the region.
Most versatile product platform.
Strong IPR giving freedom to operate.
Product roadmap matching future demand.

Global presence
Third quarter 201147
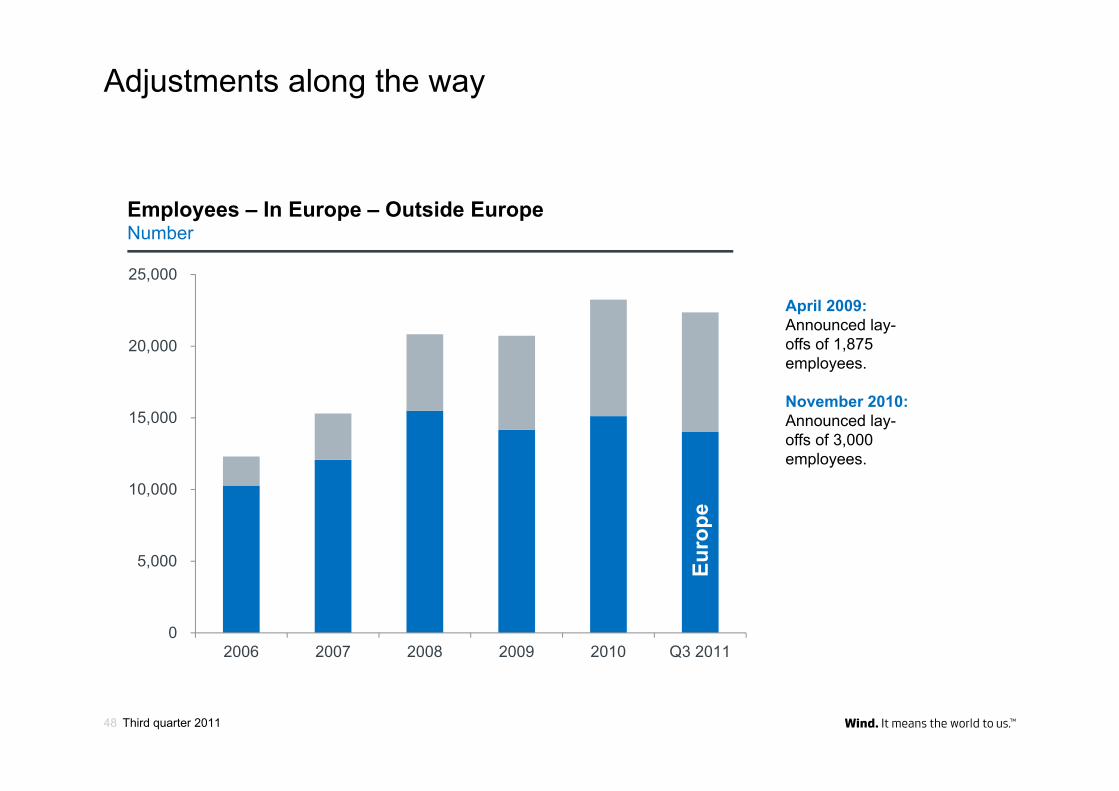
Adjustments along the way
Third quarter 201148
April 2009:Announced lay-offs of 1,875 employees.
November 2010:Announced lay-offs of 3,000 employees.
0
5,000
10,000
15,000
20,000
25,000
2006 2007 2008 2009 2010 Q3 2011
Employees – In Europe – Outside EuropeNumber
Euro
pe
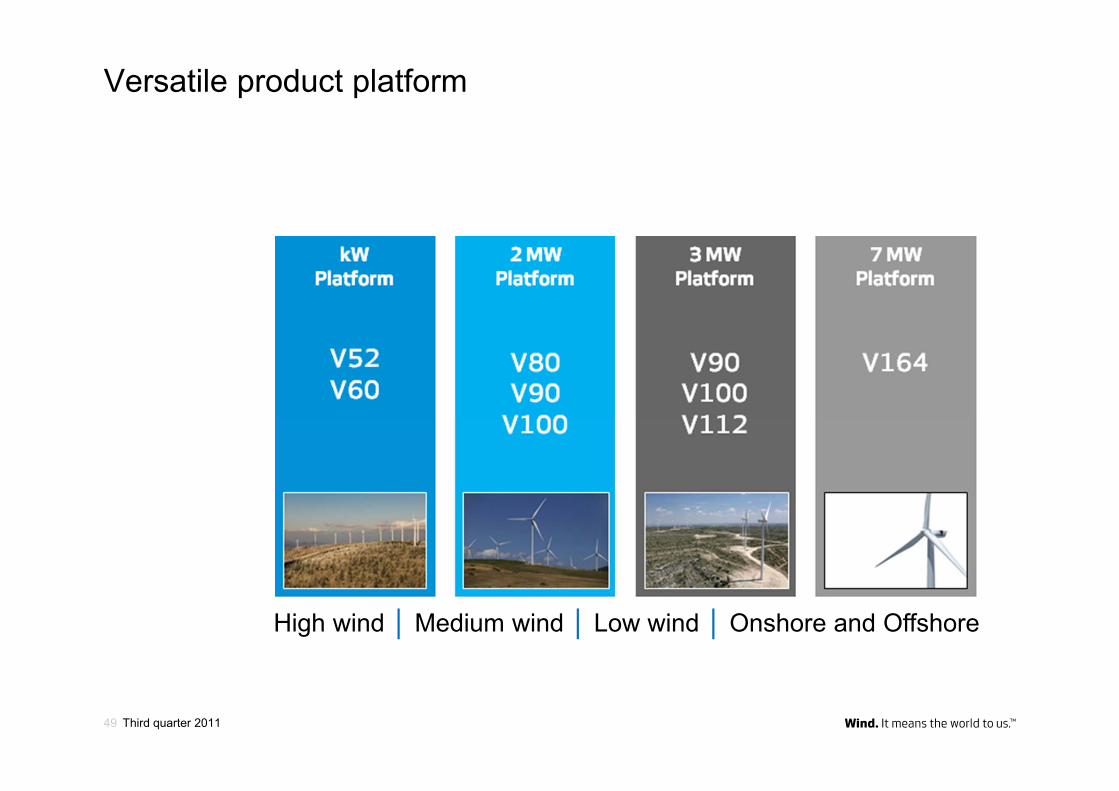
Versatile product platform
Third quarter 2011
High wind │ Medium wind │ Low wind │ Onshore and Offshore
49

Service business still more important
Service revenuemEUR per year
214
298
396
504
623
700
2006 2007 2008 2009 2010 2011E
Strategic agreement with Caterpillar.
Third quarter 201150

Recent service offerings
Third quarter 201151
SiteHunt®
SiteDesign®
Electrical PreDesign
Power Plant Controller
VestasOnline® Business (SCADA)version 3.9 – Enhanced data.

Installed capacity giving sizable base for service business
Third quarter 201152
10 largest manufacturers in 2010Accumulated installed capacity (MW)
Source: Vestas
47,375

Enlarging the scope of our business
Third quarter 201153

Constantly improving quality and efficiency
Third quarter 201154
+40 per cent more per line in three years.
SafetyInjuries per one million working hours
Patent applicationsNumber
EfficiencyBlades, 44 metres
LPF target 2012: < 2
Lost Production FactorPer cent
25.3
20.8
15.6
8.15.0 3.3
2006 2007 2008 2009 2010 2011 -9M
1550
100
153 165
227
2005 2006 2007 2008 2009 2010

What customers demandReliable technology.► Track record of installed capacity of design platforms offered.► Turbine development plans.
Relevant capability.► Worldwide manufacturing capacity.► Existing sub-supply chain management.► Past experiences in up-scaling capacity.
Sufficient organisational strength.► Offshore wind experience.► Relevant manpower in place.► Flexibility in scope of supply.
Sufficient financial strength.Convincing track record.► Onshore & offshore project references.
Third quarter 201155

Competition remains fierce.
Third quarter 201156

Challenging 2012 and 2013

We are – right now – preparingVestas for a situation
without a PTC in 2013.
Third quarter 201158

Third quarter 201159
To be here in the long run– we cannot fail in the short run.
We are not adjusting– we are changing.
Third quarter 201160

COSTS INVESTMENTS REVENUE
Third quarter 201161

Higher degree of capacity utilisation.► Use all of our endeavours to create valuable order intake.
► If orders are lacking, capacity will be reduced.
More efficient use of resources.► Leverage successful implementation of shared services.
► Sharper focus on the return on our efforts.► Improved scalability.
Third quarter 201162

New organisational set-up.► Taking even more care of our customers.
► New organisational and management structure► to be initiated on 8 February 2012.
Third quarter 201163
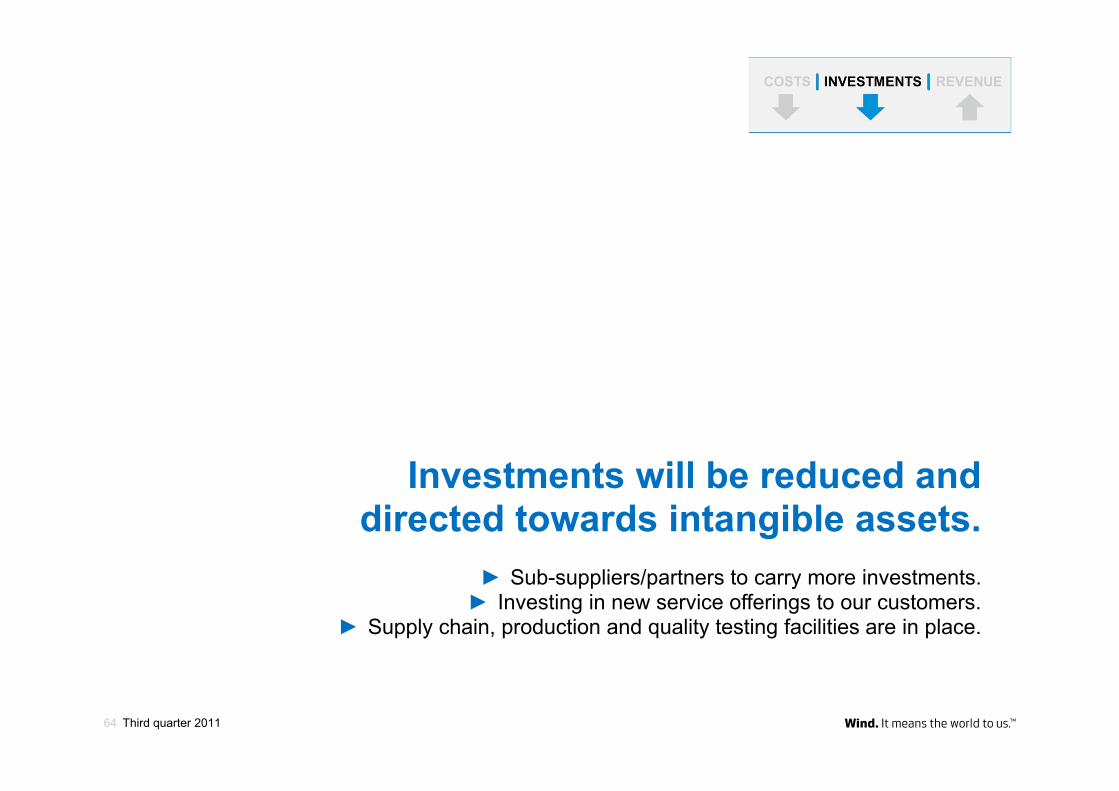
Investments will be reduced and directed towards intangible assets.
► Sub-suppliers/partners to carry more investments.► Investing in new service offerings to our customers.
► Supply chain, production and quality testing facilities are in place.
Third quarter 201164

1
40
8
28
V112 – an important part of our future
Third quarter 201165
Adjacent technology includes:
New generator technology GridStreamer™ technology Test and verification facilities and equipment
Adjacent technologies developed in connection with one new WTG platform will be used across old and future platforms.
Development cost
Production capacity conversion and ramp-up
V100-2.6 MW2 MW GridStreamer™
12
2 MW MK7 (V100-1.8)
16
V112
111
8
32
Adjacent technologydevelopment
Index figures
Incremental innovationNew platform

0
3,000
6,000
9,000
12,000
15,000
18,000 2 MW PlatformAccumulated installed base (MW)
Third quarter 201166
Leveraging a new platform2004
As a further development, the V90-1.8 MW combines a 90 metre-rotor with the well-tested V80 nacelle.
2000
First V80-2.0 MW wind turbine installed.
2005
Installed in challenging conditions both onshore and offshore.
MK4 MK6 MK7
2008
V90-1.8 MW 60 Hz (US) version introduced.
2009
The V100 is introduced.
2010
2 MW GridStreamer™. Adapt to new grid requirements
MK8MK5MK3MK2
1995
V63-1.5 MW and V66-1.65, first multi-MW was the basis for the 2 MW platform.
Track Record• More than 8,100 V80s/V90s/V100s are
producing power in 21 countries around the world.
• Almost 800 V63/V66 have been installed worldwide.
Upgrades focus on:• Safety• Quality• Reliability, Lost Production Factor• Accessing new market requirements• Maintaining competitiveness

Cost-out on products, without loss of quality.
Third quarter 201167
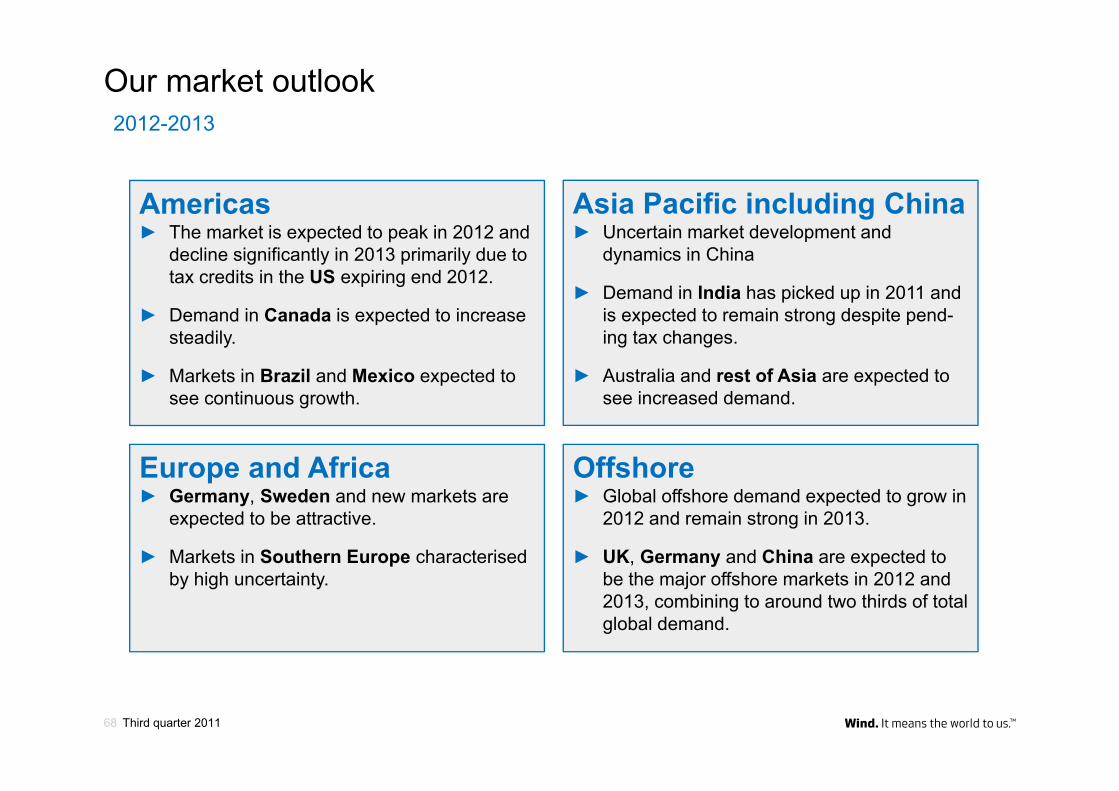
Our market outlook2012-2013
Third quarter 201168
Europe and Africa► Germany, Sweden and new markets are
expected to be attractive.
► Markets in Southern Europe characterised by high uncertainty.
Americas► The market is expected to peak in 2012 and
decline significantly in 2013 primarily due to tax credits in the US expiring end 2012.
► Demand in Canada is expected to increase steadily.
► Markets in Brazil and Mexico expected to see continuous growth.
Asia Pacific including China► Uncertain market development and
dynamics in China
► Demand in India has picked up in 2011 and is expected to remain strong despite pend-ing tax changes.
► Australia and rest of Asia are expected to see increased demand.
Offshore► Global offshore demand expected to grow in
2012 and remain strong in 2013.
► UK, Germany and China are expected to be the major offshore markets in 2012 and 2013, combining to around two thirds of total global demand.
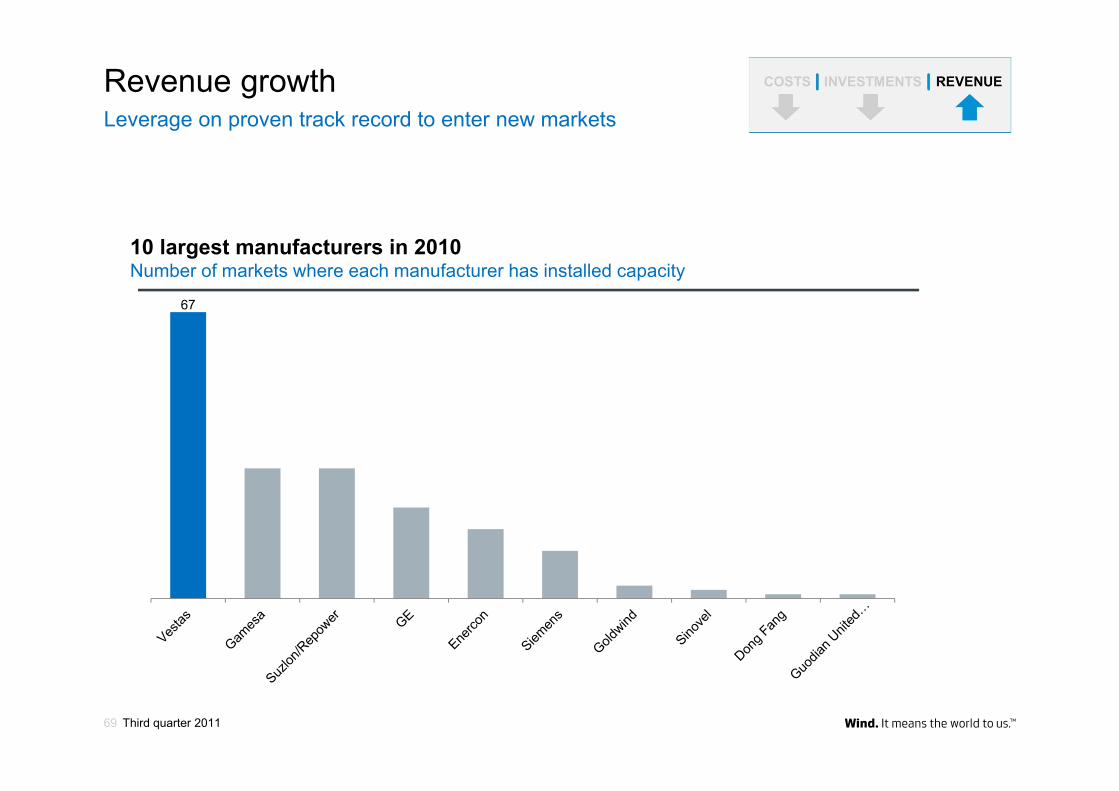
Revenue growthLeverage on proven track record to enter new markets
67
10 largest manufacturers in 2010Number of markets where each manufacturer has installed capacity
Third quarter 201169
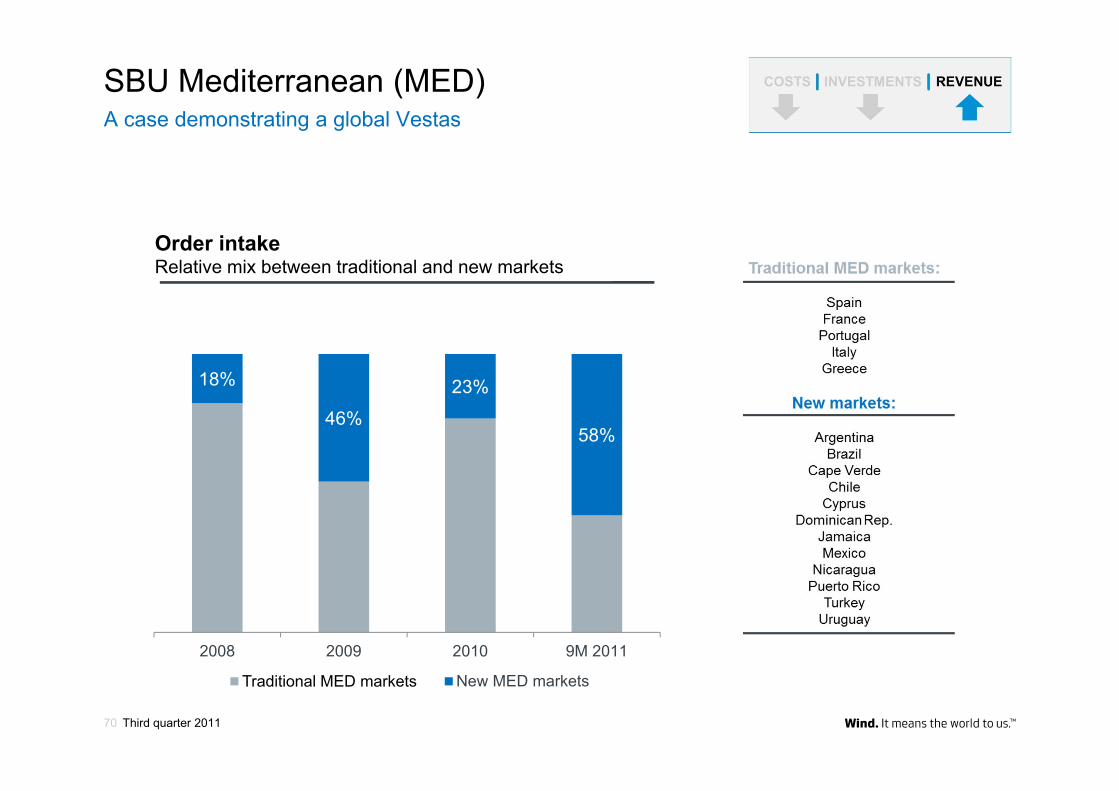
A case demonstrating a global Vestas SBU Mediterranean (MED)
18%
46%
23%
58%
2008 2009 2010 9M 2011
Traditionel MED markets New MED markets
Order intakeRelative mix between traditional and new markets
Traditional MED markets
Third quarter 201170

New andexistingTurbines
New Services
New Upgrades
New Offerings
…while constantly lowering the Cost of Energy.
Revenue sources to expand
Third quarter 201171
Developingcustomer landscape.
Pension funds.CaCoCos.Carbon Conscious Companies.
Third quarter 201172
Inclusiveness.
Vestas will be sustainable in every aspect of the way we do business.
Third quarter 201173

Financial priorities and goals
For the benefit of primarilyFOUR STAKEHOLDERS:
1. CUSTOMERS │ 2. SHAREHOLDERS │ 3. EMPLOYEES │ 4. POLITICIANS
Third quarter 201175

Guidance for 2012New guidance principles to be announced on 8 February 2012We will also evaluate our communication principles
Reducing costs by at leastEUR 150m end 2012.
Investments of EUR 650m.Tangibles: EUR 200m │ Intangibles: EUR 450m
Positive free cash flow.
Third quarter 201176

Mid-term guidance
Vestas expects to gain market share and to deliver a high single-digit
EBIT margin with a normalised US market.
Third quarter 201177
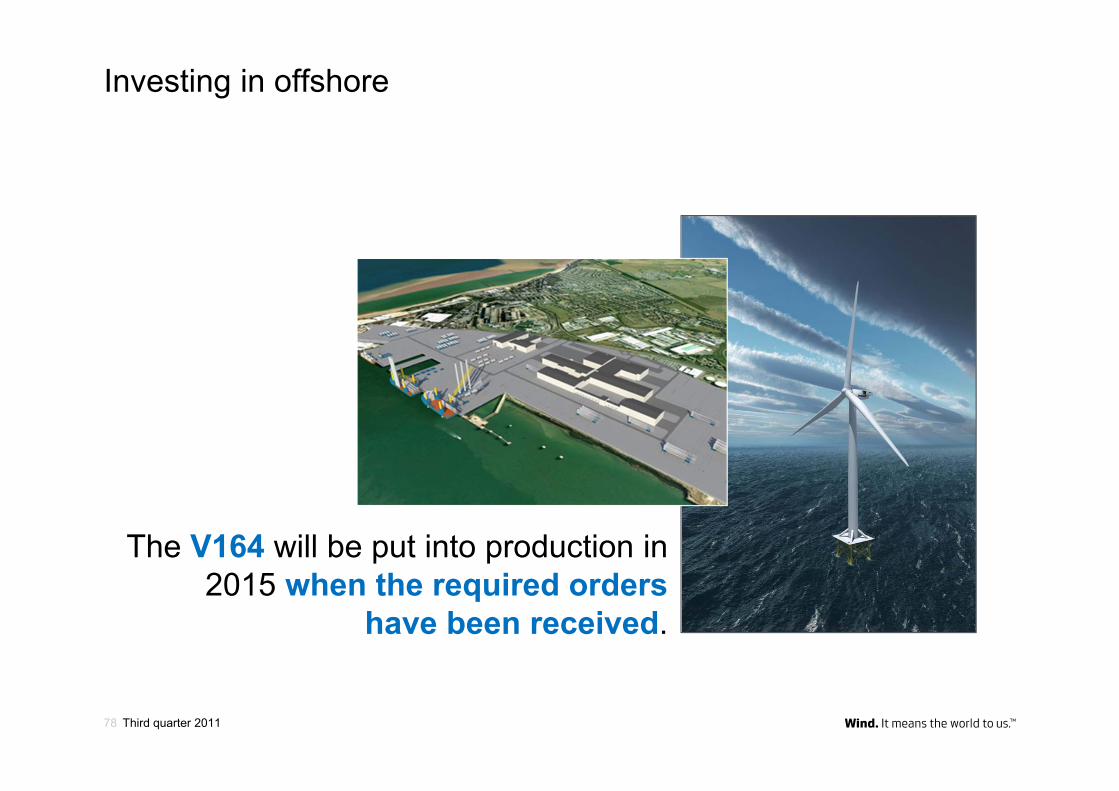
Investing in offshore
Third quarter 201178
The V164 will be put into production in 2015 when the required orders
have been received.

Vestas and the USA
Third quarter 201179
Preparing for no PTC in the USA in 2013
2012 2013
Vestas TOTAL Cost reduction of at least EUR 150m
Huge impact for Vestas
Vestas USA End 2012: Decision ?

Vestas expects to enter 2012 with the largest order backlog ever.
Third quarter 201180
This is about improving profit and securing cash flow.
Third quarter 201181

Financial Calendar
Third quarter 2011
1st Quarter 2012
2 May 2012
New York CityUSA
4th Quarter 2011
8 February 2012
LondonUnited Kingdom
82

Q & A

Copyright NoticeThe documents are created by Vestas Wind Systems A/S and contain copyrighted material, trademarks, and other proprietary information. All rights reserved. No part of the documents may be reproduced or copied in any form or by anymeans - such as graphic, electronic, or mechanical, including photocopying, taping, or information storage and retrieval systems without the prior written permission of Vestas Wind Systems A/S. The use of these documents by you, oranyone else authorized by you, is prohibited unless specifically permitted by Vestas Wind Systems A/S. You may not alter or remove any trademark, copyright or other notice from the documents. The documents are provided “as is” andVestas Wind Systems A/S shall not have any responsibility or liability whatsoever for the results of use of the documents by you.
In case we have unintentionally violated copyrighted material, we want to be informed immediately in order to straighten things out and thus to honour any obligatory fees.
Third quarter 201184