the customer & triple15 - vestas/media/vestas/investor/investor pdf... · direct cost perform...
TRANSCRIPT

The Customer & Triple15
Bob FritzSVP VWS Quality

The road to Triple15 goes through the Customer
EDP
Stadtkraft
Cathiness
AES
RESTrust Power
Eon
Vestas Capital Markets Day, USA – 1-2 September 2010Slide 2
Vestas can either:
Compete on Price or Differentiate
on Value
Vestas Capital Markets Day, USA – 1-2 September 2010Slide 3

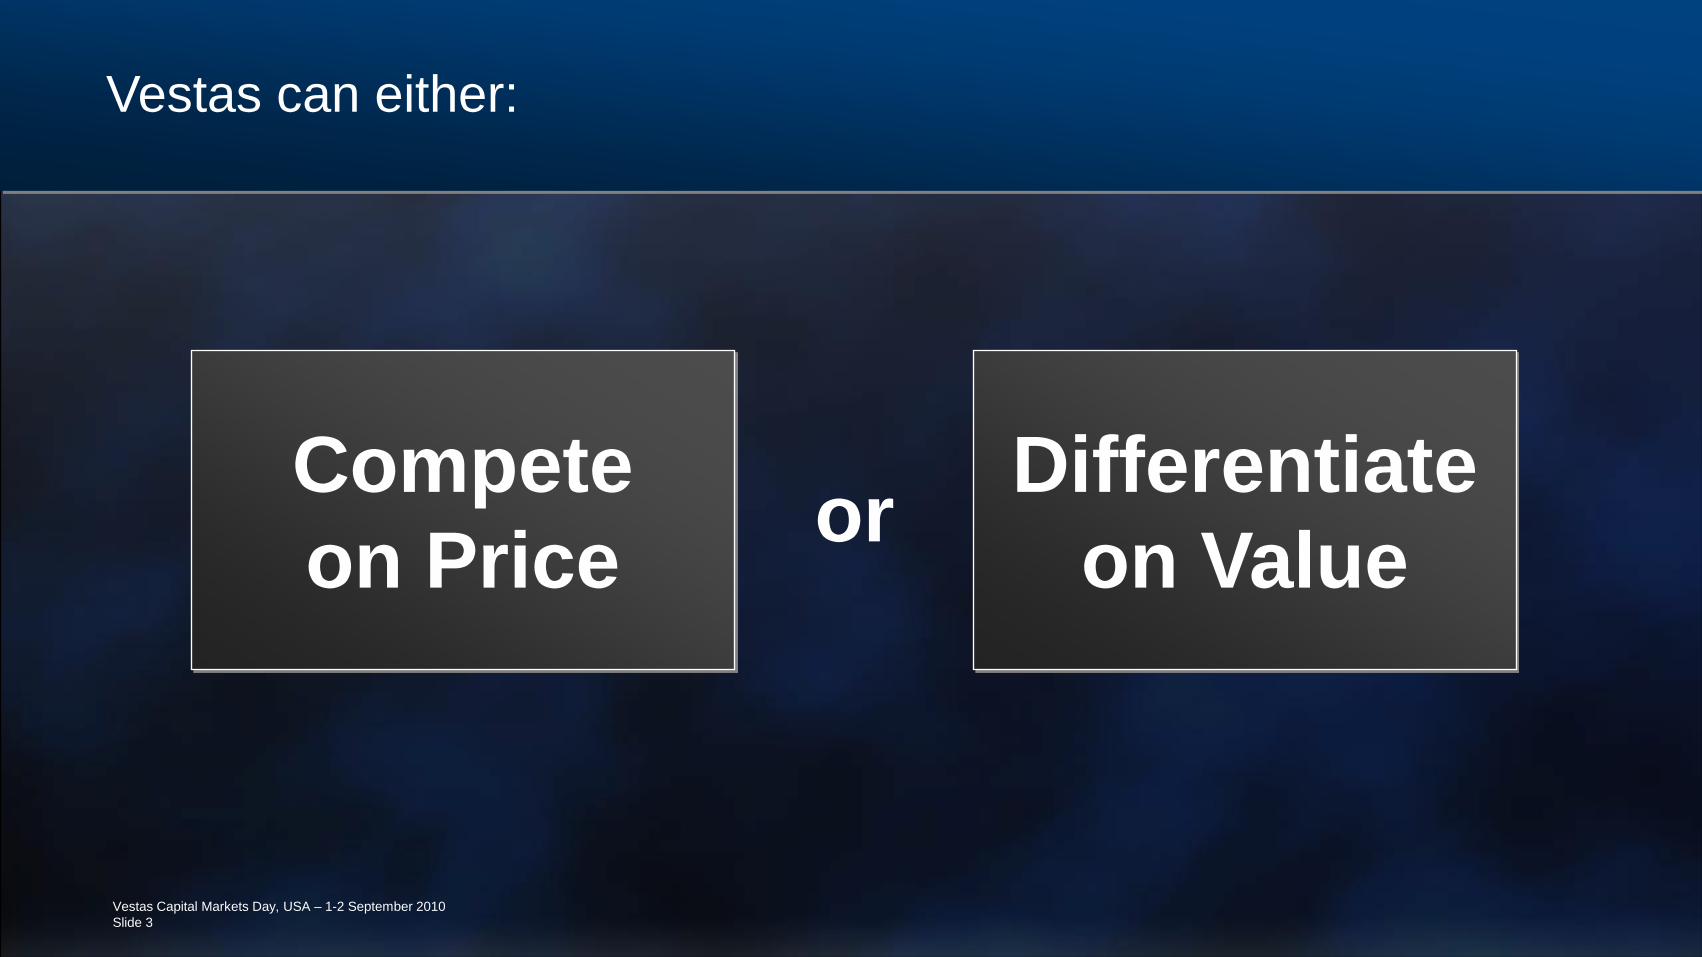
Vestas can either:
Compete on Price or Differentiate
on Value
Price wars are ”desperation” strategy. Who wins ?
We choose the Price we will Sell at !
The owner chooses the Value they will Buy at !
The smart guys know the RIGHT answer !!!
Vestas Capital Markets Day, USA – 1-2 September 2010Slide 4

Discussion about the Owner (s)
• Most wind generation projects are financed on a non-recourse, off balance sheet basis.
• 60%-70% of the project cost is financed.
• Financiers have altered their risk acceptance levels… Recent global issues…
• Greater focus on revenue/cost variables..
• Higher acceptable wind probabilities
• More ”in depth” query on machine/ component capability
• More sensitivity to ”new technology”
Vestas Capital Markets Day, USA – 1-2 September 2010Slide 5
How does the Owner(s) make the decision???
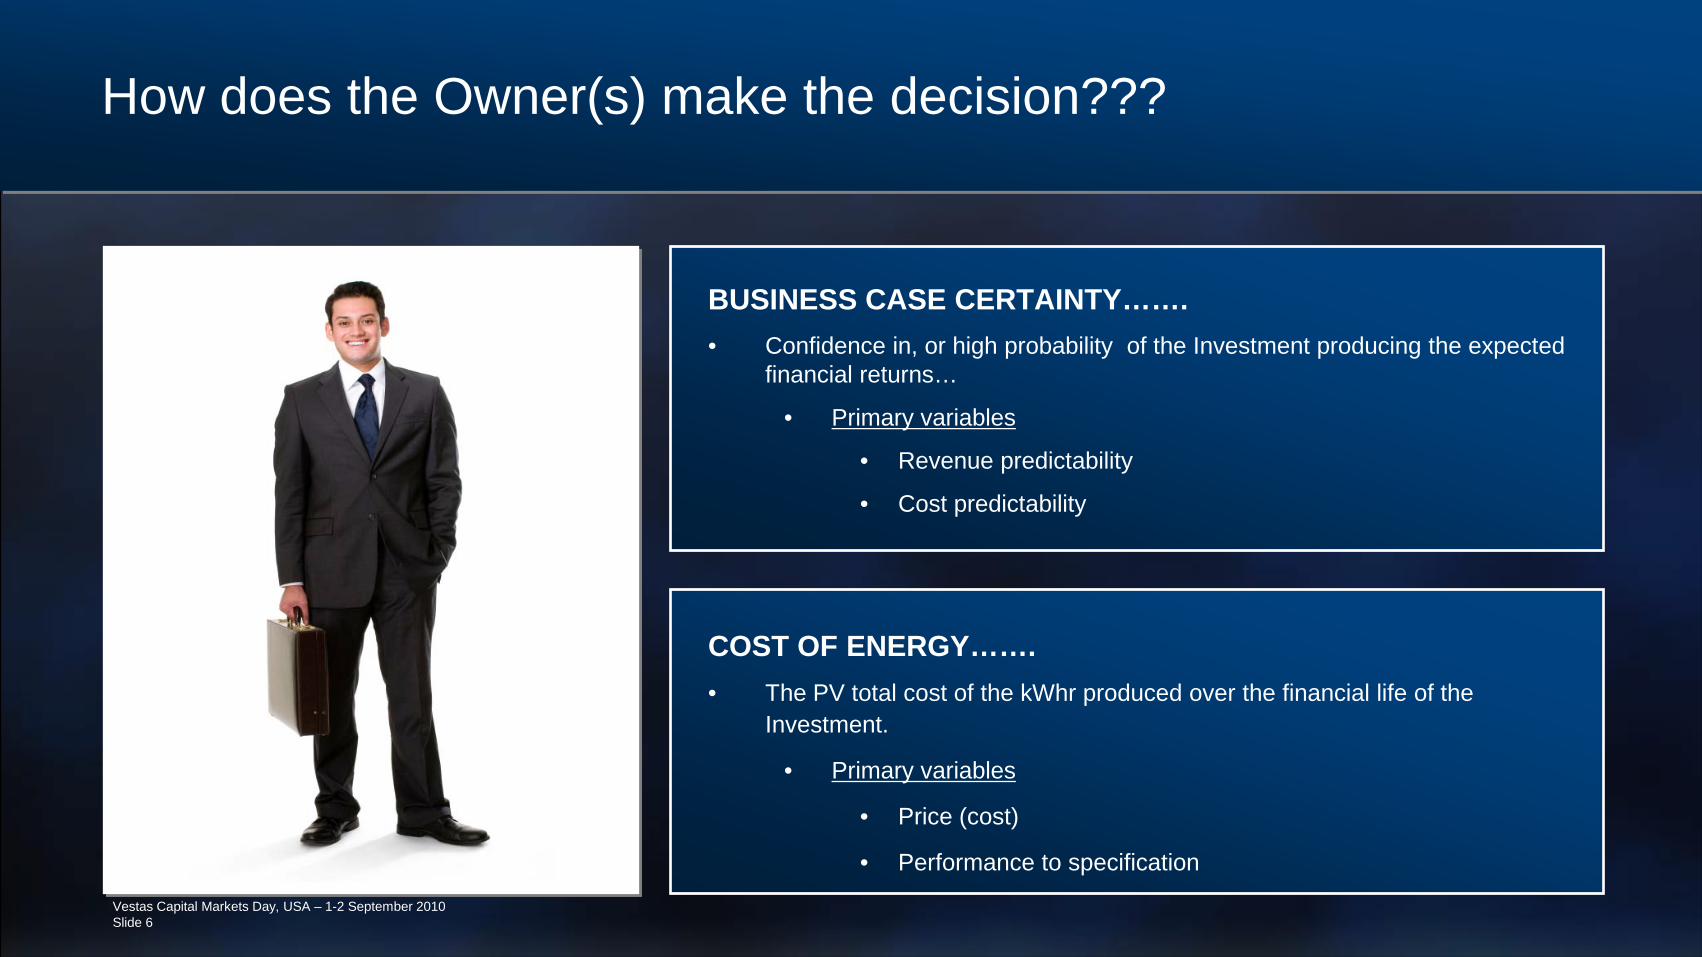
BUSINESS CASE CERTAINTY…….• Confidence in, or high probability of the Investment producing the expected
financial returns…
• Primary variables
• Revenue predictability
• Cost predictability
COST OF ENERGY…….• The PV total cost of the kWhr produced over the financial life of the
Investment.
• Primary variables
• Price (cost)
• Performance to specification
Vestas Capital Markets Day, USA – 1-2 September 2010Slide 6

How does the Owner(s) make the decision???
COST OF ENERGY…….• The PV total cost of the kWhr produced over the financial life of the
Investment.
• Primary variables
• Price (cost)
• Performance to specification
AKA; the voice of the customer
BUSINESS CASE CERTAINTY…….• Confidence in, or high probability of the investment producing the
Expected financial returns…
• Primary variables
• Revenue predictability
• Cost predictability
The turbine represents about 70% of the initial project cost and almost 100% of the Business Case Certainty, depends on its performance.
Vestas Capital Markets Day, USA – 1-2 September 2010Slide 7
INTERPRETING THE VOICE OF THE CUSTOMER :
Expectations controlled / Influenced by suppliers
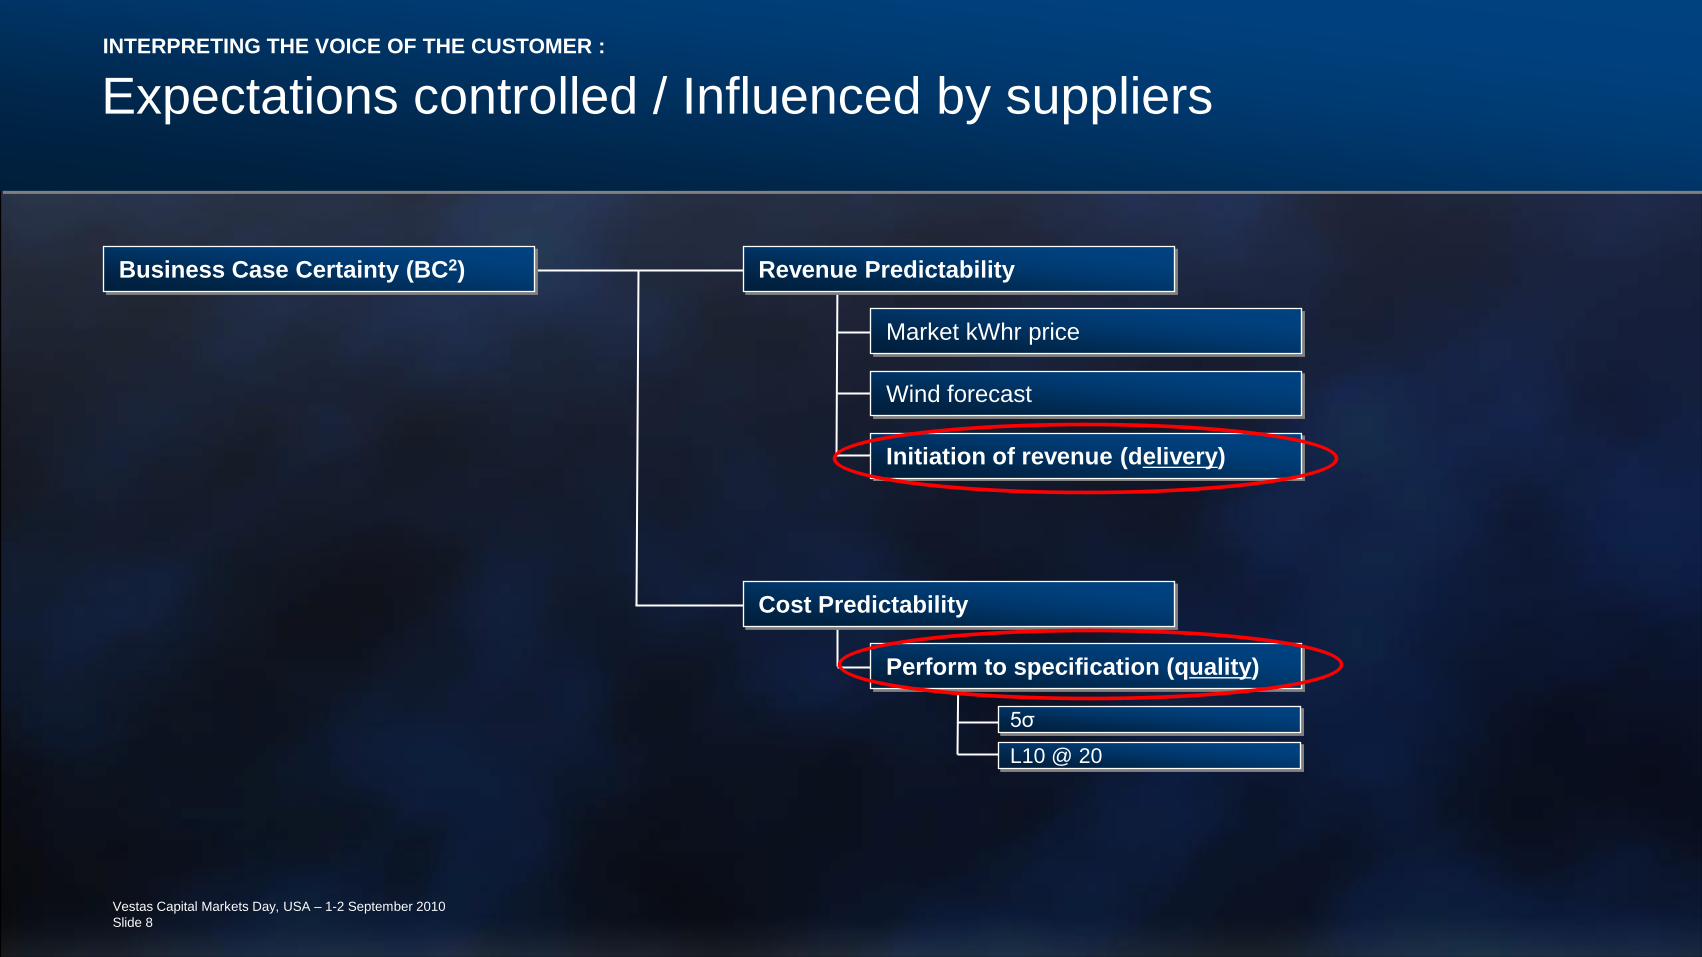
Business Case Certainty (BC2) Revenue Predictability
Market kWhr price
Wind forecast
Initiation of revenue (delivery)
Cost Predictability
Perform to specification (quality)
5σ
L10 @ 20
Vestas Capital Markets Day, USA – 1-2 September 2010Slide 8

INTERPRETING THE VOICE OF THE CUSTOMER :
Expectations controlled / Influenced by supplier
Cost of Energy (COE) Price (cost) (efficiency)
Direct cost
Perform to specification (quality)
5σ
L10 @ 20
Material & supply cost
LaborCOPQ
IDC
Cap cost
OH
WC
Vestas Capital Markets Day, USA – 1-2 September 2010Slide 9

INTERPRETING THE VOICE OF THE CUSTOMER :
Expectations controlled / Influenced by supplier
Initiation of revenue (delivery)
Delivery management
Production plan
Logistics control
Construction control
The Business Case forecasted revenue to start at a certain point. Should this not occur, the Business Case will be negatively impacted and non recoverable.
Delivering the machine to a commissioned state on schedule
MUST Have “On Time Delivery”
Vestas Capital Markets Day, USA – 1-2 September 2010Slide 10

INTERPRETING THE VOICE OF THE CUSTOMER :
Expectations controlled / Influenced by supplier
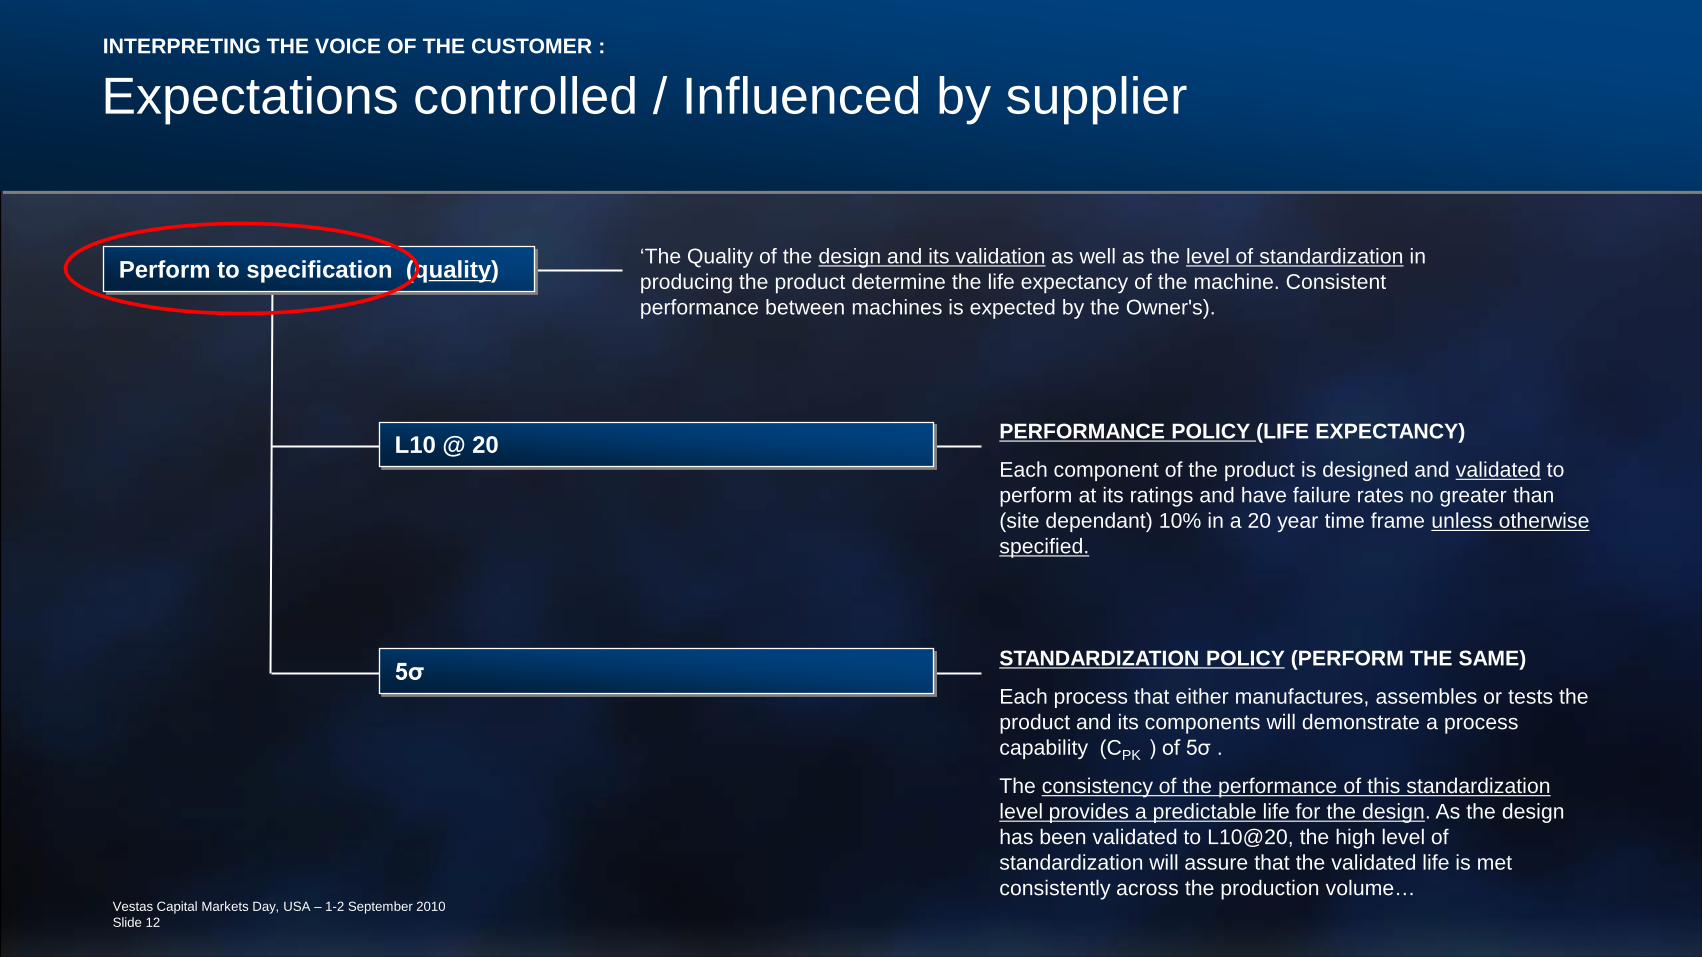
Perform to specification (quality) ‘The Quality of the design and its validation as well as the level of standardization in producing the product determine the life expectancy of the machine. Consistent performance between machines is expected by the Owner's).
REMEMBER:Owner (s) making an investment
• Expects a Return on the Investment
• The size and the confidence of the return determines If & What they will invest in !
• The Size of the return is COE (cost of energy)
• The Confidence of the return is the predictability of the performance (life expectancy)
Vestas Capital Markets Day, USA – 1-2 September 2010Slide 11
INTERPRETING THE VOICE OF THE CUSTOMER :
Expectations controlled / Influenced by supplier
L10 @ 20 PERFORMANCE POLICY (LIFE EXPECTANCY)
Each component of the product is designed and validated to perform at its ratings and have failure rates no greater than (site dependant) 10% in a 20 year time frame unless otherwise specified.
Perform to specification (quality)
5σ STANDARDIZATION POLICY (PERFORM THE SAME)
Each process that either manufactures, assembles or tests the product and its components will demonstrate a process capability (CPK ) of 5σ .
The consistency of the performance of this standardization level provides a predictable life for the design. As the design has been validated to L10@20, the high level of standardization will assure that the validated life is met consistently across the production volume…
Vestas Capital Markets Day, USA – 1-2 September 2010Slide 12
‘The Quality of the design and its validation as well as the level of standardization in producing the product determine the life expectancy of the machine. Consistent performance between machines is expected by the Owner's).

L10 @ 20
L 20 @ 20 has 18- 30 M€ greater cost than L10 @ 20L 20 @ 10 has 40- 61M€ greater cost than L10 @ 20
20
10
30
40
50
1 10 100Years
20
Perc
ent F
ailu
re
L10 @ 20
L20 @ 20
L20 @ 10
100 mw
L10@20 = 10% failure in 20 years
Vestas Capital Markets Day, USA – 1-2 September 2010Slide 13

5σ standardization
SPANThe amount of processes
or suppliers that havecontrols installed.
LEVELThe standardization levelof the lowest performing
process or supplier
Degree of standardization control
Vestas Capital Markets Day, USA – 1-2 September 2010Slide 14
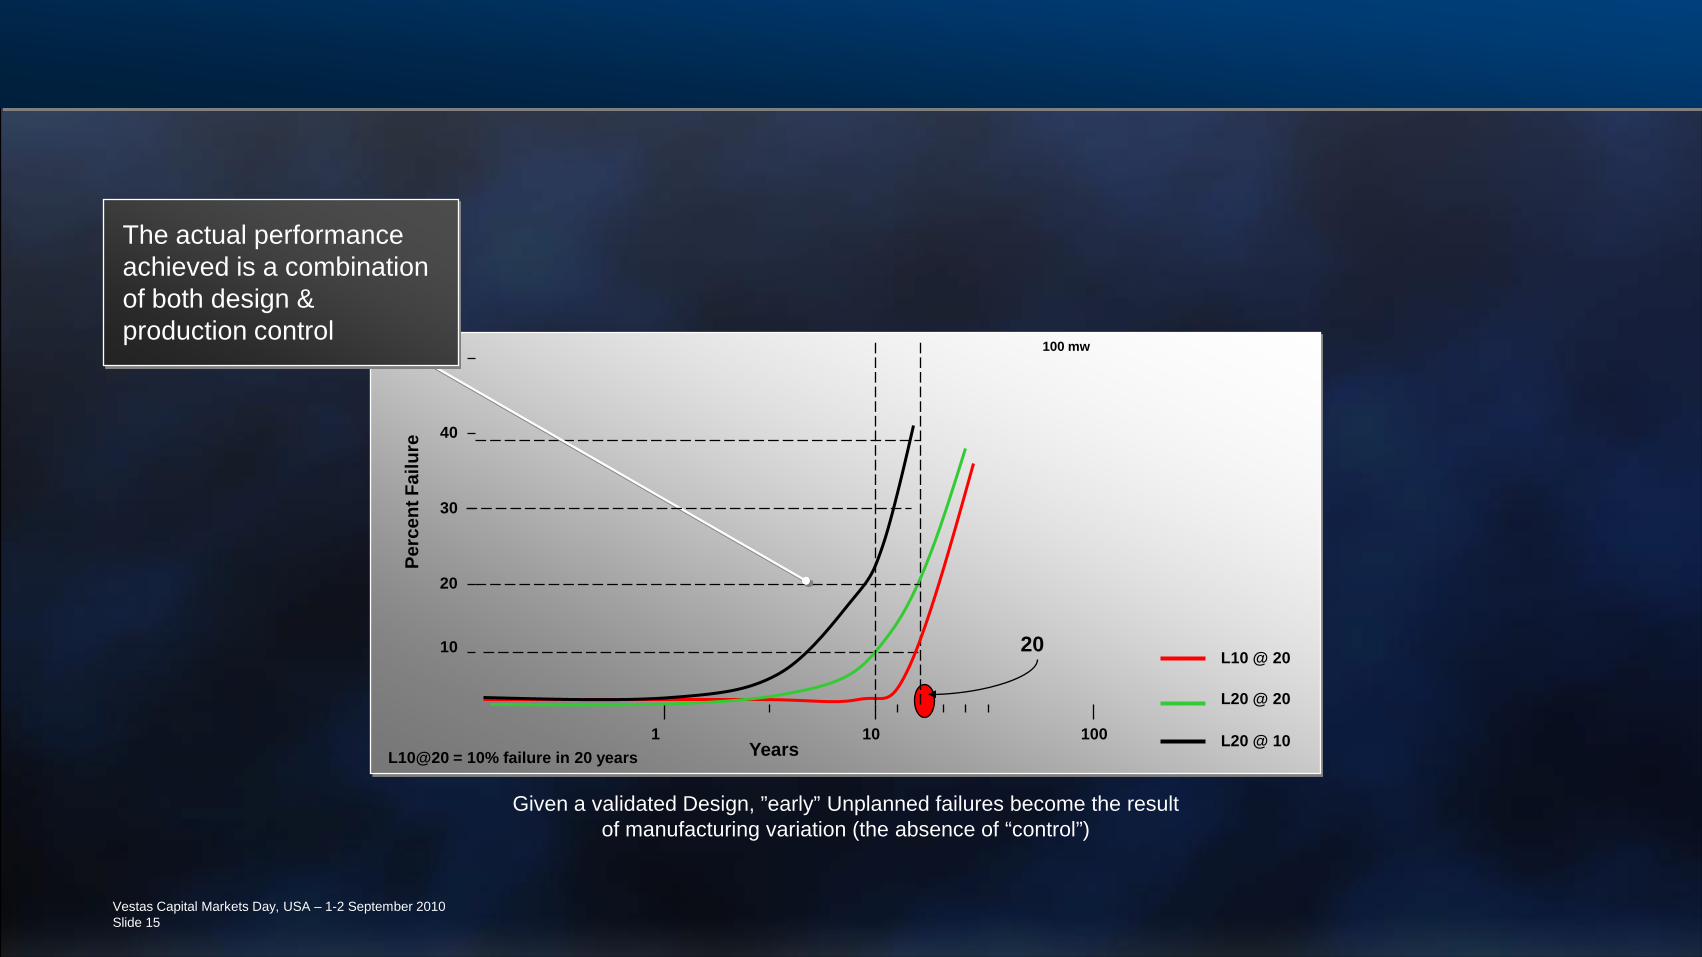
Given a validated Design, ”early” Unplanned failures become the result of manufacturing variation (the absence of “control”)
20
10
30
40
50
1 10 100Years
20
Perc
ent F
ailu
re
L10 @ 20
L20 @ 20
L20 @ 10
100 mw
L10@20 = 10% failure in 20 years
The actual performance achieved is a combination of both design & production control
Vestas Capital Markets Day, USA – 1-2 September 2010Slide 15
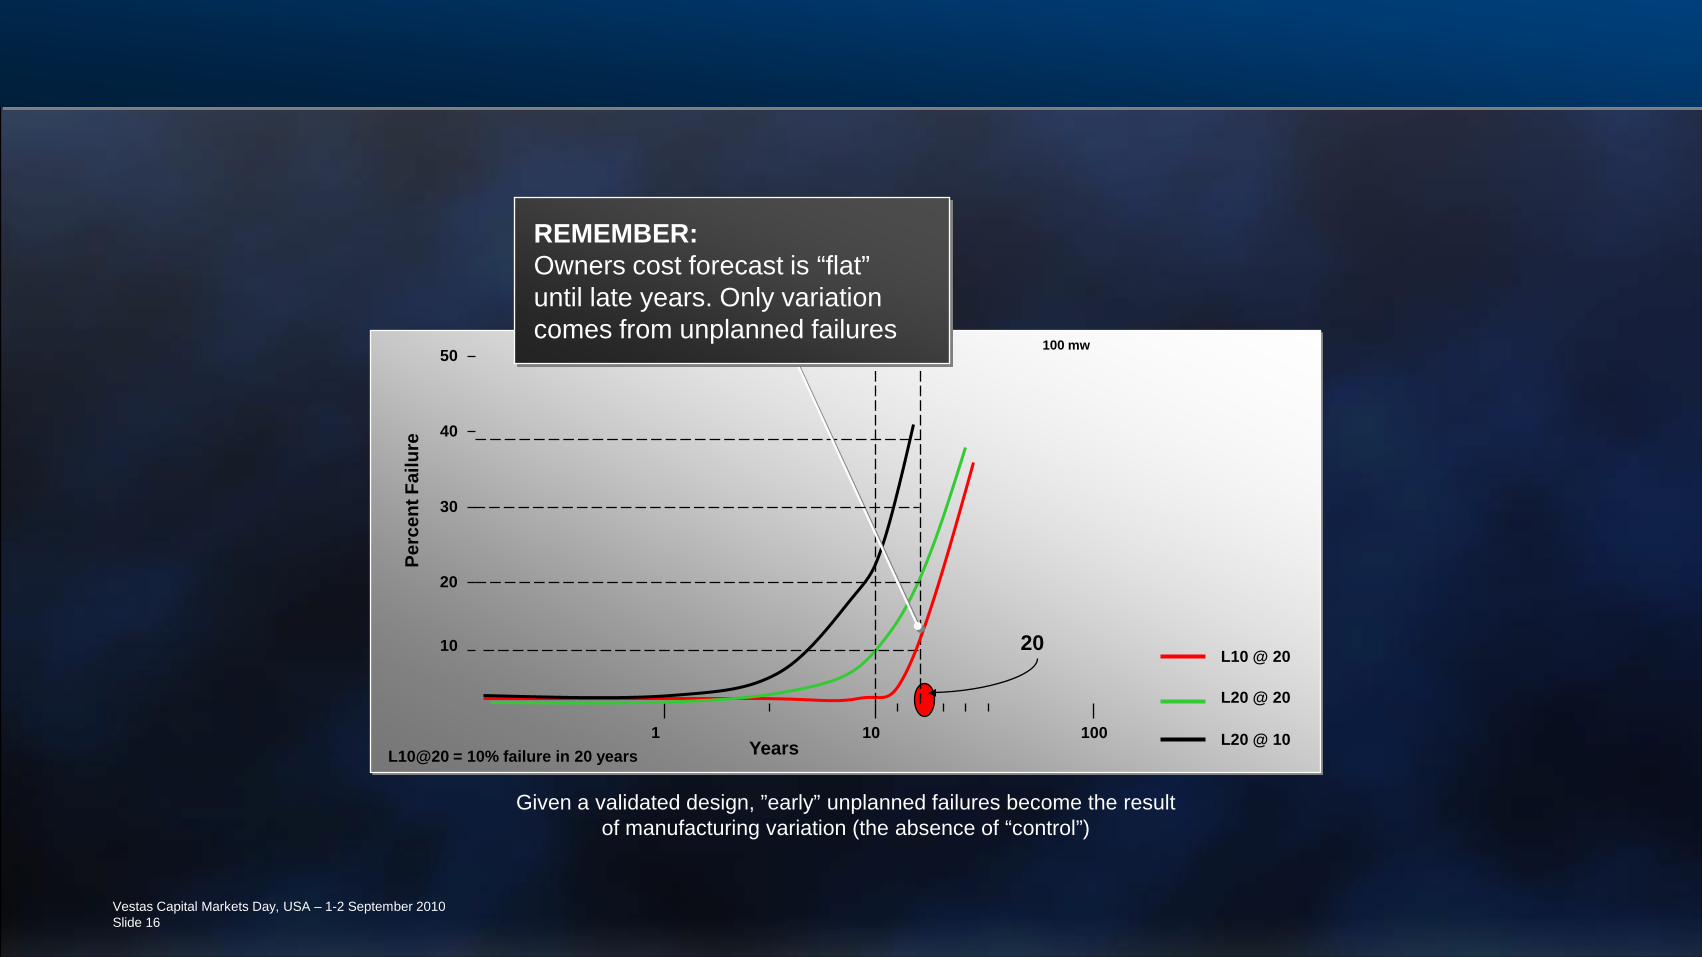
Given a validated design, ”early” unplanned failures become the result of manufacturing variation (the absence of “control”)
20
10
30
40
50
1 10 100Years
20
Perc
ent F
ailu
re
L10 @ 20
L20 @ 20
L20 @ 10
100 mw
L10@20 = 10% failure in 20 years
REMEMBER:Owners cost forecast is “flat” until late years. Only variation comes from unplanned failures
Vestas Capital Markets Day, USA – 1-2 September 2010Slide 16
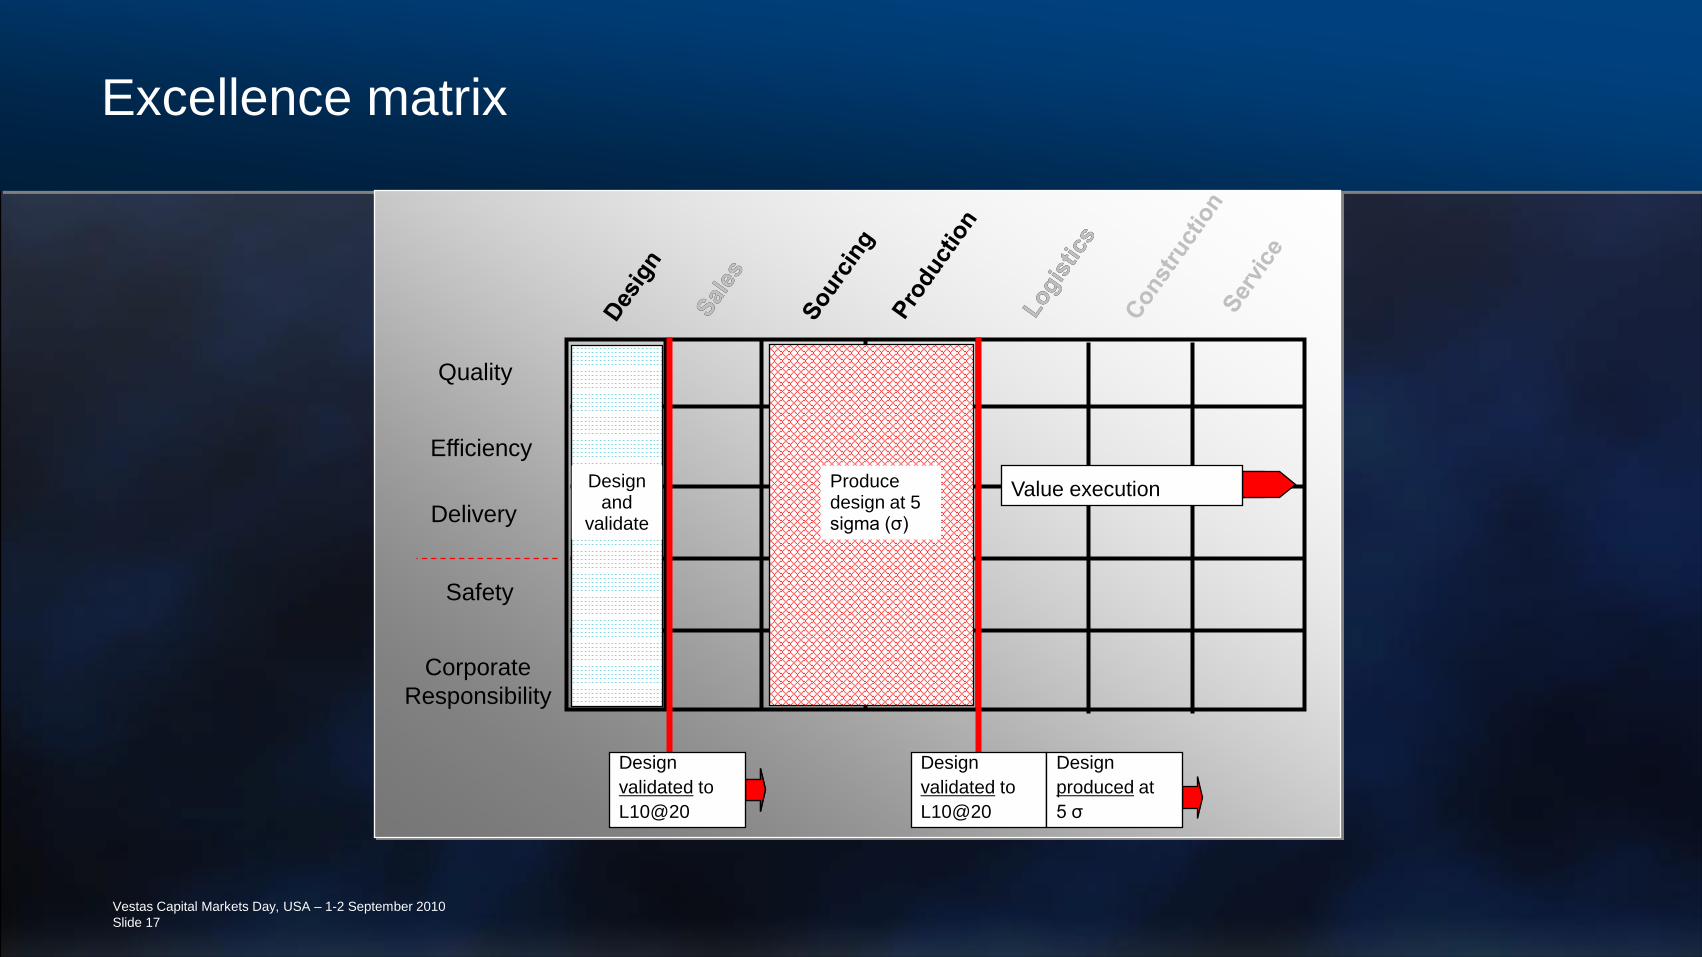
Excellence matrix
Quality
Safety
Delivery
CorporateResponsibility
Efficiency
Designvalidated toL10@20
Designproduced at5 σ
Design and
validate
Produce design at 5 sigma (σ)
Value execution
Designvalidated toL10@20
Vestas Capital Markets Day, USA – 1-2 September 2010Slide 17

Excellence matrix – The ”How ”!
Quality
Safety
Delivery
CorporateResponsibility
Efficiency
Maintain the value created in production and design
Vestas Capital Markets Day, USA – 1-2 September 2010Slide 18

Grandfather told me that:
“When it comes to Quality, a little Paranoia never
hurt anybody”
TODAY’S INTERPRETATION:
If you can’t find a process or performance to improve…… Look Harder !
Vestas Capital Markets Day, USA – 1-2 September 2010Slide 19
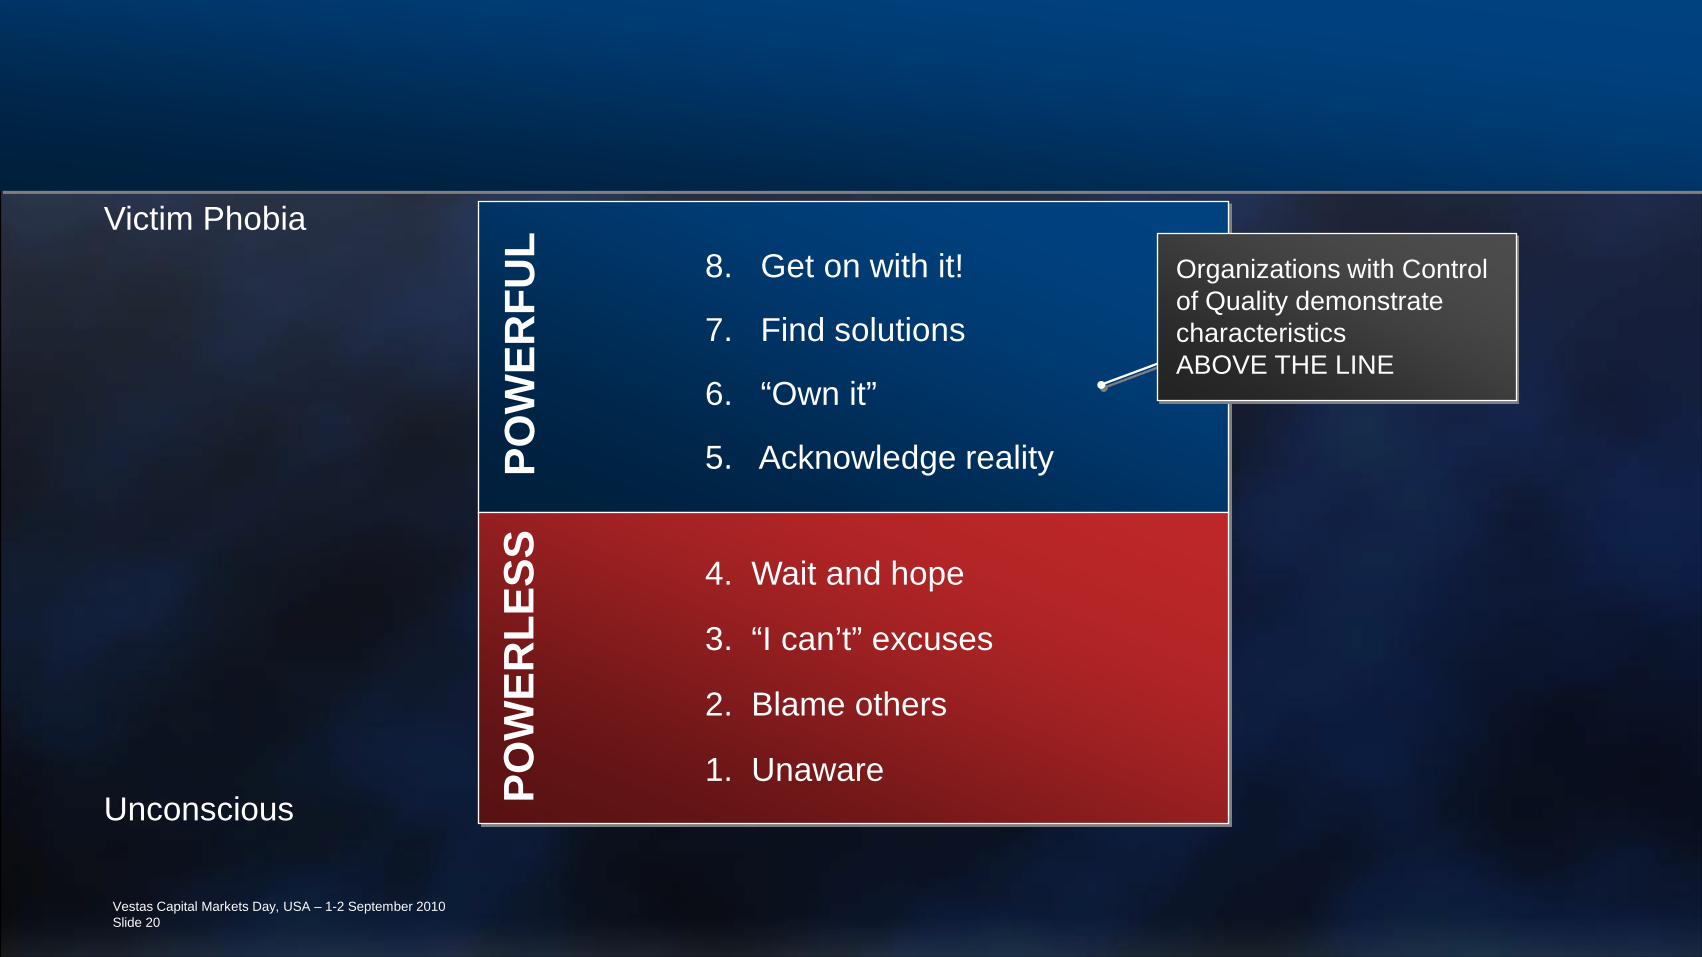
Unconscious
8. Get on with it!
7. Find solutions
6. “Own it”
5. Acknowledge realityPOW
ERFU
LVictim Phobia
4. Wait and hope
3. “I can’t” excuses
2. Blame others
1. UnawarePOW
ERLE
SS
Organizations with Control of Quality demonstrate characteristics ABOVE THE LINE
Vestas Capital Markets Day, USA – 1-2 September 2010Slide 20

IN SHORT
We must embrace Quality as a prime characteristic of your product.
We must have the determination to establish, control, improve the control AND sustain the improved control of the product production… and its performance.
This is a leadership issue…. The leaders must decide whether Quality is a part of their brand characteristic…
How do I Qualify as ”with control”….
Vestas Capital Markets Day, USA – 1-2 September 2010Slide 21

Q & A
Vestas Capital Markets Day, USA – 1-2 September 2010Slide 22