third harmonic filter design in mitigating high current at
TRANSCRIPT

i
Third Harmonic Filter Design in Mitigating High Current
At the Generator Neutral
by
NUR AFIFAH BINTI GHAZALI
16387
Dissertation submitted in partial fulfilment of
the requirements for the
Bachelor of Engineering (Hons)
(Electrical and Electronic Engineering)
JANUARY 2016
Universiti Teknologi PETRONAS
Bandar Seri Iskandar
31750 Tronoh
Perak Darul Ridzuan

ii
CERTIFICATION OF APPROVAL
Third Harmonic Filter Design in Mitigating High Current
At the Generator Neutral
by
NUR AFIFAH BINTI GHAZALI
16387
A project dissertation submitted to the
Electrical and Electronics Engineering Programme
Universiti Teknologi PETRONAS
in partial fulfilment of the requirement for the
Bachelor of Engineering (Hons)
(Electrical and Electronic Engineering)
Approved by,
________________________
(Ir. Dr. Mohd Faris Abdullah)
UNIVERSITI TEKNOLOGI PETRONAS
BANDAR SERI ISKANDAR,
TRONOH, PERAK
January 2015
iii
CERTIFICATION OF ORIGINALITY
This is to certify that I am responsible for the work submitted in this project, that the
original work is my own except as specified in the references and
acknowledgements, and that the original work contained herein have not been
undertaken or done by unspecified sources or persons.
___________________________________________
NUR AFIFAH BINTI GHAZALI
iv
ABSTRACT
Harmonic is commonly known power quality problem which caused by
non-linear load. Nevertheless, harmonic was also found at the synchronous
generator instead of at the load. The effect of the triplen harmonic to the
generator neutral is high current which lead to high temperature of the
component at the generator neutral. Recent researches had identified the major
component of the triplen harmonic is third harmonic which initiated by the
synchronous generator itself. There are numerous techniques to reduce the effect
of harmonic in power system network. By installing harmonic filter is one of the
techniques to mitigate the harmonic current. A study about installing harmonic
filter at the generator neutral had been introduced to counter this arising issue.
The objectives of this study are to study the various harmonic filters used in
mitigating the third harmonic current and to design harmonic filter that can
reduced the third harmonic current at generator neutral and validate the
modelling with experimental values. This method had been tested using the
Matlab Simulink simulation to show how the filter mitigates the high third
harmonic current at the generator neutral. Before running the simulation, the
fundamental and third harmonic current modelling is constructed and validates
the modelling using the experimental values. Series passive filter and active filter
can reduce the high current at the generator neutral.

v
ACKNOWLEDGEMENT
The author would like to show her gratitude to her Final Year Project supervisor, Ir.
Dr Mohd Faris Abdullah for his unlimited guidance and teaching throughout her
Final Year Project. His comments and ideas are very beneficial for this project which
allows her to complete this project within the time frame.
Besides, the author also wants to thank the graduate assistances, Ms. Iylia and Mr.
Izzalden for helping her in the simulation and understanding the Final Year Project
title in depth. They shared their experience and knowledge which are useful for the
Final Year Project.
Not to forget, appreciation to the family members and friends that always there to
give moral support throughout this project.
Lastly, lots of thanks to the parties that involved directly or indirectly in helping the
author to complete this project.
0
Table of Contents
CERTIFICATION OF ORIGINALITY ...................................................................... iii
ABSTRACT .................................................................................................................... iv
ACKNOWLEDGEMENT .............................................................................................. v
CHAPTER 1: INTRODUCTION .................................................................................. 6
1.1. Background Of Study ...................................................................................... 6
1.2. Problem Statement ........................................................................................... 6
1.3. Objective And Scope Of Study ........................................................................ 7
CHAPTER 2: LITERATURE REVIEW AND THEORY .......................................... 8
2.1 Power Quality ................................................................................................... 8
2.2. Harmonic ......................................................................................................... 10
2.3. Neutral Earthing Impedance ......................................................................... 11
2.4. Filters ............................................................................................................... 11
2.4.1. Active filter .................................................................................................. 11
2.4.2. Passive filter................................................................................................. 13
2.4.3. Hybrid power filter ..................................................................................... 17
CHAPTER 3: METHODOLOGY ............................................................................... 19
3.1. Research Methodology ................................................................................... 19
3.2. Project Gantt Chart ....................................................................................... 21
3.3. Key Milestone ................................................................................................. 21
3.4 System Modelling ........................................................................................... 22
3.4.1 Fundamental Model .................................................................................... 22
3.4.2 Third Harmonic Model .................................................................................... 26
3.4.3 Comparison Analysis using Fundamental Model and Third Harmonic
Model with Experimental Values ............................................................................. 30
3.4.4 Third Harmonic Model with Filters ............................................................... 31
CHAPTER 4: RESULTS AND DISCUSSION .......................................................... 35
4.1 Shunt Passive Filters at the R load, L load and RL load ................................. 35
4.2 Series Passive Filters at the R load, L load and RL load ................................. 40
4.3 Shunt Active Filters at the R load, L load and RL load ................................... 44
4.4 Hybrid Filters at the R load, L load and RL load ............................................ 47

1
4.5 Practical Implementation and Economic Consideration ................................. 50
CHAPTER 5: CONCLUSION AND RECOMMENDATION ................................. 51
REFERENCE ................................................................................................................ 52
APPENDICES ............................................................................................................... 54

2
List of Figures
FIGURE 1 Example of power quality problems [5] ....................................................... 10
FIGURE 2 Third harmonic propagation model [7] ......................................................... 11
FIGURE 3 Voltage Sourced Active power filter [11] ..................................................... 12
FIGURE 4 Current Sourced Active power filter [11] ..................................................... 13
FIGURE 5 Passive power filter [12] ............................................................................... 13
FIGURE 6 Example of Application of Passive Series Filter [15] ................................... 14
FIGURE 7 Passive series filter configuration [14] .......................................................... 14
FIGURE 8 Example of Application of Passive Shunt Filter [15] ................................... 15
FIGURE 9 Passive shunt filter configuration [14] .......................................................... 15
FIGURE 10 Single tuned passive filter [17] .................................................................... 16
FIGURE 11 High Pass shunt filter configuration[18] ..................................................... 17
FIGURE 12 Hybrid Power filter [17] .............................................................................. 18
FIGURE 13 Flowchart .................................................................................................... 19
FIGURE 14 Fundamental Model with Resistive Load ................................................... 23
FIGURE 15 Fundamental Model with Inductive Load ................................................... 24
FIGURE 16 Fundamental Model with RL load .............................................................. 25
FIGURE 17 Third Harmonic Model with Resistive Load .............................................. 26
FIGURE 18 Third Harmonic Model with Inductive Load .............................................. 27
FIGURE 19 Third Harmonic Model with RL Load ........................................................ 28
FIGURE 20 Third Harmonic Model with Shunt Passive Filter ...................................... 31
FIGURE 21 Third Harmonic Model with Series Passive Filter ...................................... 32
FIGURE 22 Single Tuned Passive Filter ........................................................................ 32
FIGURE 23 High Pass Passive Filter .............................................................................. 33
FIGURE 24 C type High Pass Passive Filter .................................................................. 33
FIGURE 25 Third Harmonic Model with Active Filter .................................................. 33
FIGURE 26 Active Filter Configurations ....................................................................... 34
FIGURE 27 Third Harmonic Model with Hybrid Filter ................................................. 34
FIGURE 28 Comparison of Neutral Current (Point A) with and without Third
harmonic Shunt Single Tuned Filter for R load ......................................... 36
FIGURE 29 Comparison of Current at Point B with and without Third harmonic
Shunt Single Tuned Filter for R load ......................................................... 37

3
FIGURE 30 Comparison of Current at Point C with and without Third harmonic
Shunt Single Tuned Filter for R load ......................................................... 37
FIGURE 31 Percentage Difference between Filters at Different Point of Current for
R Load ........................................................................................................ 39
FIGURE 32 Percentage Difference between Filters at Different Point of Current for L
Load ........................................................................................................... 39
FIGURE 33 Percentage Difference between Filters at Different Point of Current for
RL Load ..................................................................................................... 39
FIGURE 34 Comparison of Neutral Current (Point A) with and without Third
harmonic Series Single Tuned Series Passive Filter at R Load ................. 40
FIGURE 35 Comparison of Phase Current at Point B with and without Third
harmonic Series Single Tuned Series Passive Filter for R load ................ 41
FIGURE 36 Comparison of Phase Current at Point C with and without Third
harmonic Series Single Tuned Series Passive Filter for R load ................ 41
FIGURE 37 Percentage Difference between Filters at Different Point of Current for
R Load ........................................................................................................ 43
FIGURE 38 Percentage Difference between Filters at Different Point of Current for L
Load ........................................................................................................... 43
FIGURE 39 Percentage Difference between Filters at Different Point of Current for
RL Load ..................................................................................................... 43
FIGURE 40 Comparison of Neutral Current (Point A) with and without Third
harmonic Shunt Active Filter ..................................................................... 44
FIGURE 41 Comparison of Phase Current at Point B with and without Third
harmonic Shunt Active Filter ..................................................................... 45
FIGURE 42 Comparison of Phase Current at Point C with and without Third
harmonic Shunt Active Filter ..................................................................... 45
FIGURE 43 Percentage Difference between Filters at Different Point of Current for
all Load ...................................................................................................... 46
FIGURE 44 Comparison of Neutral Current (Point A) with and without Third
harmonic Hybrid Filter .............................................................................. 47
FIGURE 45 Comparison of Phase Current at Point B with and without Third
harmonic Hybrid Filter .............................................................................. 48
FIGURE 46 Comparison of Phase Current at Point C with and without Third
harmonic Hybrid Filter .............................................................................. 48

4
FIGURE 47 Percentage Difference between Filters at Different Point of Current for
All Load ..................................................................................................... 49

5
List of Tables
TABLE 1 Project Gantt Chart ......................................................................................... 21
TABLE 2 Key Milestones ............................................................................................... 22
TABLE 3 Parameters for Fundamental Model with Resistive Load .............................. 23
TABLE 4 Parameters for Fundamental Model with Inductive Load .............................. 24
TABLE 5 Parameters for Fundamental Model with RL load ......................................... 25
TABLE 6 Third Harmonic Model with Resistive Load Parameters ............................... 27
TABLE 7 Parameters for Third Harmonic Model with Inductive Load ......................... 28
TABLE 8 Parameters for Third Harmonic Model with RL Load ................................... 29
TABLE 9 Summary of Percentage Error ........................................................................ 30
TABLE 10 Summary of Percentage Difference of Neutral Current and Phase Current
Before and After Shunt Passive Filter .......................................................... 38
TABLE 11 Summary of Percentage Difference of Neutral Current and Phase Current
Before and After Series Passive Filter ......................................................... 42
TABLE 12 Summary of Percentage Difference of Neutral Current and Phase Current
Before and After Shunt Active Filter ........................................................... 46
TABLE 13 Summary of Percentage Difference of Neutral Current and Phase Current
Before and After Shunt Active Filter ........................................................... 49

6
CHAPTER 1
INTRODUCTION
1.1. Background Of Study
Power quality problem is an unwanted phenomenon in electrical power system
such as harmonic, surge, transient etc. Harmonic in the electrical system is
commonly caused by the non-linear load.
In recent research at Universiti Teknologi Petronas (UTP), it was found that
triplen harmonic current circulating at generator neutral that originated from the
synchronous generator itself. Third harmonic is the major component of this
triplen harmonic current. Salient pole synchronous generator is one of harmonic
sources and its third harmonic depends on winding design in terms of pitch
factor, distribution factor and slot skew.
There are many methods to minimize third harmonic currents from synchronous
generator such as using 2/3 pitch winding generator, zigzag connection
alternator, resonance shunts on the generator, third harmonic current trap,
Petersen Coil and harmonic filter. Filter in electric power system is designed to
mitigate the harmonic problem. Harmonic filters in general can be categorized as
passive or active filters.
1.2. Problem Statement
Third harmonic current continuously flow from synchronous generator and return
to its neutral during steady state condition via neutral/ground path has caused the
neutral grounding resistor to experience high temperature at UTP Gas District
Cooling (GDC) plant. Therefore, it is very important to mitigate this high third
harmonic current using suitable harmonic filter.

7
1.3. Objective And Scope Of Study
The objectives of this project:
To study the various harmonic filters used in mitigating the third
harmonic current.
To design the harmonic filter that effectively reduced the third harmonic
current at generator neutral and validate with experimental value.
The scope of study is to design the harmonic filter to mitigate the high third
harmonic current originated from salient pole synchronous generator that return
to its neutral. The configuration is such that salient pole synchronous generator is
directly connected to the load whether at medium or low voltage system.

8
CHAPTER 2
LITERATURE REVIEW AND THEORY
2.1 Power Quality
In electrical power system, there is a parameter to measure the quality of the
power in order to enhance or to maintain the respective electrical devices. This
parameter is called power quality. There are a few definitions for power quality
according to different sources. For example, according to [1], power quality is the
characteristics of the voltages during the standard operation. In the other hand,
power quality is defined as the suitability of the grounding and powering with the
other connected devices in standard operation [2]. Figure 1 shows a few
examples of power quality problems.
Power quality is divided into three groups which are voltage stability, power
supply continuity and voltage waveform. First level is normal quality, second
level is high quality and third level is premium quality. The purpose of these
levels is to classify the level of the power quality. In the event of harmonic
voltage, the power quality level is premium level where it can be compensated
occasionally. While harmonic current level of power quality is also premium
quality except the event is fully compensated [3]. These three levels of power
quality depend on the demand characteristics of the customers [4].
Power quality problem would arise when there is harmonic in voltage and
current on the electrical power system. Harmonic in electrical power system is a
norm and mostly is caused by the non-linear load such as rectifiers and variable
frequency drives.

9
Voltage sag
Voltage swell
Voltage
distortion
Voltage
interruption

10
Harmonic
voltage
FIGURE 1 Example of power quality problems [5]
2.2. Harmonic
Harmonic is distorted current or voltage waveforms causes by short pulses
when flow back to the other part of power system. There are three groups of
harmonic which include positive, negative and zero sequence harmonic.
Positive sequence harmonic consist of 1st, 4
th, 7
th, 10
th etc order of harmonic.
These harmonic develop current that rotate in same direction with the
fundamental frequency. For negative sequence harmonic, it is the vice versa
of the positive sequence where it includes 2nd
, 5th
, 8th
, 11th
etc order of
harmonic. There is one more group of harmonic which is zero sequence
harmonic. The current does not rotate in any direction and it flows in the
neutral wire which leads to additional losses in the power system. Triplen
harmonic (3rd
, 6th
, 9th
etc) are a part of zero sequence harmonic [6].
However, it is rarely to find even numbered triplen harmonic in AC system.
This is because even harmonic will cancel each other. According to [7], the
third harmonic model is achieved by connecting the synchronous generator
third harmonic sequence network to the zero-sequence network of the power
system. Figure 2 shows the third harmonic propagation model. The third
harmonic model parameters for synchronous generator are determined from
the open circuit and short circuit tests.

11
FIGURE 2 Third harmonic propagation model [7]
2.3. Neutral Earthing Impedance
Generator equipped with Neutral Earthing Resistor (NER) for the purpose to
reduce earth fault current. NER in generator is designed to reduce the physical
damage during earth fault current event by dispersing the over voltage that pass
through the neutral point up to the safe value.
The study carried by [8] had proved that besides non-linear load as the source
of harmonic, there is one other source which causes the harmonic. The source is
the synchronous generator. The effects of the harmonic is the generator NER
become hot especially during its parallel operation with the utility grid.
2.4. Filters
The function of filter in power system is to provide low impedance path to
trap the harmonic at the respective place where the filter is tuned. Logically, the
filter absorbs the harmonic by having a zero impedance at the tuning
frequency [9].
2.4.1. Active filter
Active filter is made up of complex power electronics converter. Its
working principle is by injecting the harmonic current into the power
12
system. The filter is placed before the non-linear load. There are two
types of existing active filter which are voltage sourced active power
filter and current sourced active power filter.
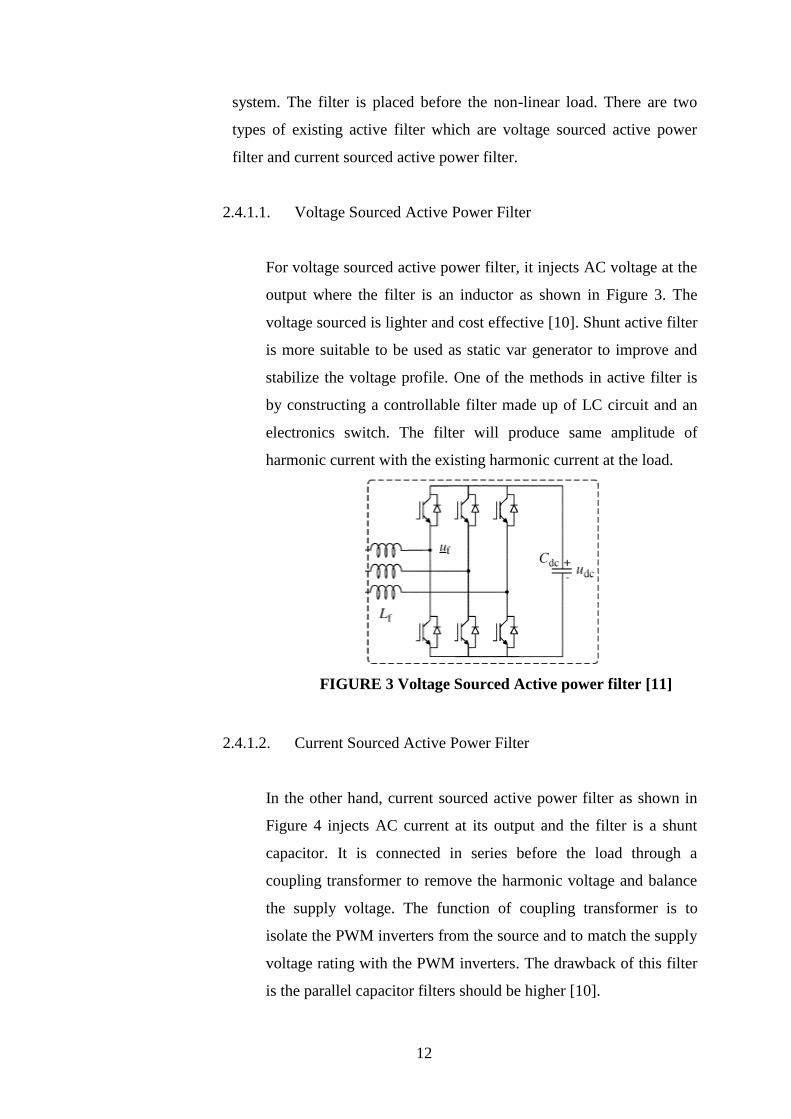
2.4.1.1. Voltage Sourced Active Power Filter
For voltage sourced active power filter, it injects AC voltage at the
output where the filter is an inductor as shown in Figure 3. The
voltage sourced is lighter and cost effective [10]. Shunt active filter
is more suitable to be used as static var generator to improve and
stabilize the voltage profile. One of the methods in active filter is
by constructing a controllable filter made up of LC circuit and an
electronics switch. The filter will produce same amplitude of
harmonic current with the existing harmonic current at the load.
FIGURE 3 Voltage Sourced Active power filter [11]
2.4.1.2. Current Sourced Active Power Filter
In the other hand, current sourced active power filter as shown in
Figure 4 injects AC current at its output and the filter is a shunt
capacitor. It is connected in series before the load through a
coupling transformer to remove the harmonic voltage and balance
the supply voltage. The function of coupling transformer is to
isolate the PWM inverters from the source and to match the supply
voltage rating with the PWM inverters. The drawback of this filter
is the parallel capacitor filters should be higher [10].

13
FIGURE 4 Current Sourced Active power filter [11]
2.4.2. Passive filter
Capacitor, resistor and inductor are examples of passive components
which are used for passive filter. The passive filter functions by
adjusting the frequency of resonance to eliminate the desired
harmonic. Figure 5 shows the connection of passive filter from the
source to the load. The classification of the filters is based on the type
of harmonic generation components source present in the system.
Passive filters are classified as passive series filter and shunt filter.
FIGURE 5 Passive power filter [12]
2.4.2.1. Passive series filter
The components of the passive series filter are connected in
series with the load as shows in Figure 6 where the

14
components arrangement as shows in Figure 7. Normally, the
series filter is to block a single harmonic current such as third
harmonic current since it only works in single frequency. This
is because it is limited in blocking multiple harmonic currents
[13]. The disadvantage of the passive series filter is the
components need to be designed according to the rated load
current [14].
FIGURE 6 Example of Application of Passive Series Filter [15]
FIGURE 7 Passive series filter configuration [14]
2.4.2.2. Passive shunt filter
Passive shunt filter is connected in parallel as shown in the
Figure 8. The components are connected in series as shown in
Figure 9. The designed passive shunt filter will provide very
low impedance path for harmonic current equivalent to its

15
tuned frequency. There are two types of passive shunt filter,
which are:
A. Single tuned filter
B. High pass filter
FIGURE 8 Example of Application of Passive Shunt Filter [15]
FIGURE 9 Passive shunt filter configuration [14]
A. Single tuned passive filter
Figure 10 is one of the non-complex shunt passive filter
which consist of designable inductor and capacitor to
provide the lowest impedance path by increasing the
frequency order. The components of passive filter are
simple hence it also cost effective compared to complex
active filter. According to [16], calculation can be done to

16
get the designed parameters. All the steps to calculate the
parameters are given by (1) to (5).
FIGURE 10 Single tuned passive filter [17]
Reactive power, kVAR
kVAR = kVA x sin( ) (1)
Filter reactance, Xfil
Xfil =
(2)
Capacitive Reactance, Xcap
Xcap =
(3)
Inductive Reactance, XL
XL =
(4)
Harmonic frequency, fh
fh =
(5)
Where,
h = Harmonic order
L = Inductance (H)
C = Capacitance (F)
17
B. High pass filter
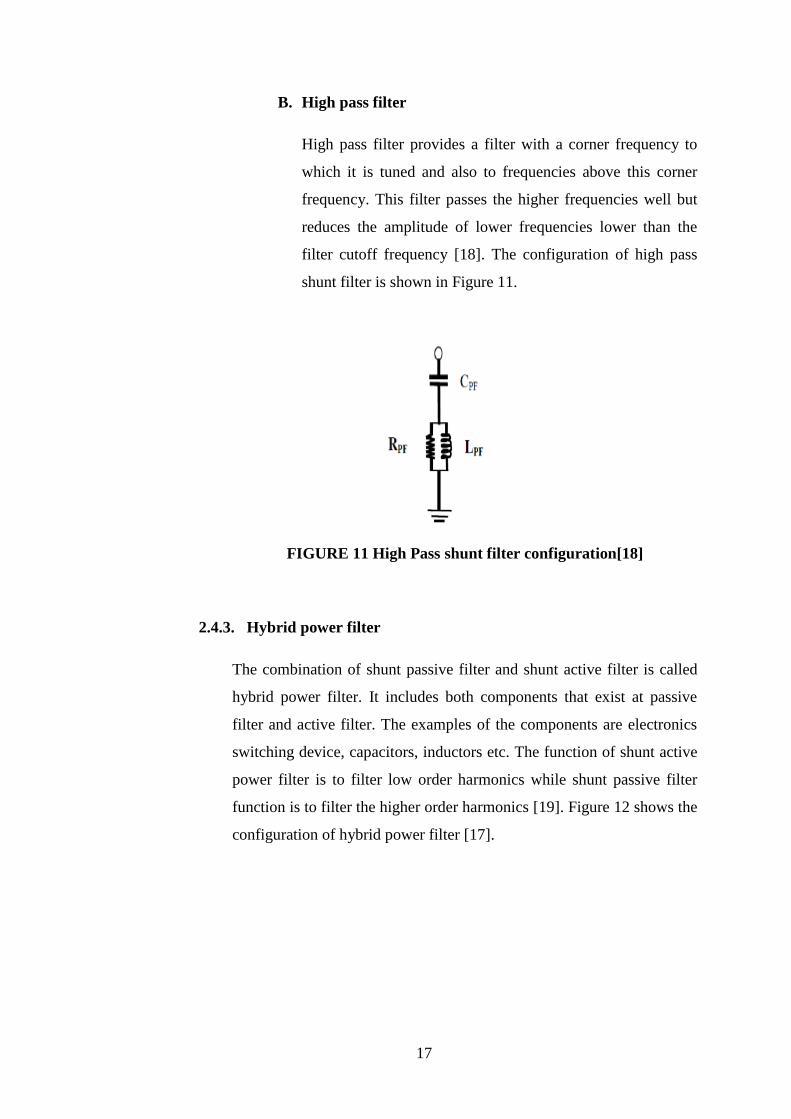
High pass filter provides a filter with a corner frequency to
which it is tuned and also to frequencies above this corner
frequency. This filter passes the higher frequencies well but
reduces the amplitude of lower frequencies lower than the
filter cutoff frequency [18]. The configuration of high pass
shunt filter is shown in Figure 11.
FIGURE 11 High Pass shunt filter configuration[18]
2.4.3. Hybrid power filter
The combination of shunt passive filter and shunt active filter is called
hybrid power filter. It includes both components that exist at passive
filter and active filter. The examples of the components are electronics
switching device, capacitors, inductors etc. The function of shunt active
power filter is to filter low order harmonics while shunt passive filter
function is to filter the higher order harmonics [19]. Figure 12 shows the
configuration of hybrid power filter [17].

18
FIGURE 12 Hybrid Power filter [17]

19
CHAPTER 3
METHODOLOGY
3.1. Research Methodology
FIGURE 13 Flowchart
Start
Literature review
Modelling for third
harmonic filter current
Simulation with
filter
Output
verification
Results
Full report
completion
End
No
Yes
Third harmonic modelling
for synchronous generator

20
Based on the flow chart in Figure 13, the project starts with the literature review.
The author reads through the research paper, journals, books and other resources
related to the project title to get the overall understanding. The information about
types of filter is gathered in order to design the filter.
After the completion of literature review, the author starts with the modelling the
third harmonic of synchronous generator and harmonic filter using the Matlab
Simulink. Once the modelling is complete, the simulation for the filter is carried out.
The output of the simulation is verified. If the result shows the third harmonic is
successfully removed then the objectives of the project are achieved. If not, the
simulation will continue with different design of filter until the desired result is
achieved.

21
3.2. Project Gantt Chart
The purpose of a Gantt chart is to show the time scale of the tasks for the final
year project. The Gantt chart in Table 1 is to ensure the author to keep on track
to ensure the project timeline of the key milestone is followed accordingly.
TABLE 1 Project Gantt chart
Week 1 2 3 4 5 6 7 8 9 10 11 12 13 14 15
No. Tasks
1Literature
Review
2Familirizing
with the
simulation tools
3Modelling third
harmonic for
generator
4Model various
type of filter
5
Simulation with
the
experimental
data
6
Verifying the
output of the
simulation
3.3. Key Milestone
A key milestone is developed to keep on track on the project timeline in order to
complete the project within the time frame. The key milestone is as shown in
Table 2.

22
TABLE 2 Key milestones
Week 1 2 3 4 5 6 7 8 9 10 11 12 13 14 15
No. Tasks
1
Literature
review
completion
2
Third harmonic
filter model
achieved
3
Simulation with
filter is carried
out
4Output
verification
5Result
achieved
6 Full report
completion
3.4 System Modelling
Before running the simulation, the author first needs to design the fundamental
model and third harmonic model for synchronous generator by using Matlab
Simulink. The author implements the respective parameters in the modelling. The
result of simulation from the modelling is compared with the experimental value.
3.4.1 Fundamental Model
Each of the blocks shown in Figure 14 has its own parameters as stated in
Table 3. The circuit was modelled based on diagram in Figure 2 with
fundamental frequency which is 50 Hz. The circuit is analysed at the output
of three phase VI measurement where it measure the current and voltage from
the source. The simulation is carried out by varying the voltage and the load
impedance simultaneously. The RMS value of the current is displayed at the
display block.
3.4.1.1 Resistive Load
The modelling for the fundamental model with resistive load is as in Figure
14. Table 3 shows the parameters for the simulation of fundamental model.

23
FIGURE 14 Fundamental Model with Resistive Load
TABLE 3 Parameters for Fundamental Model with Resistive Load
Parameters Values
Source resistance
( )
48
Source Inductance
(H)
1.53
Frequency
(Hz)
50
No Load Voltage
(V) 303.84 292.16 266.67 256.89 249.06
Load Impedance
( ) 686.00 800.00 1200.00 1600.00 2400.00
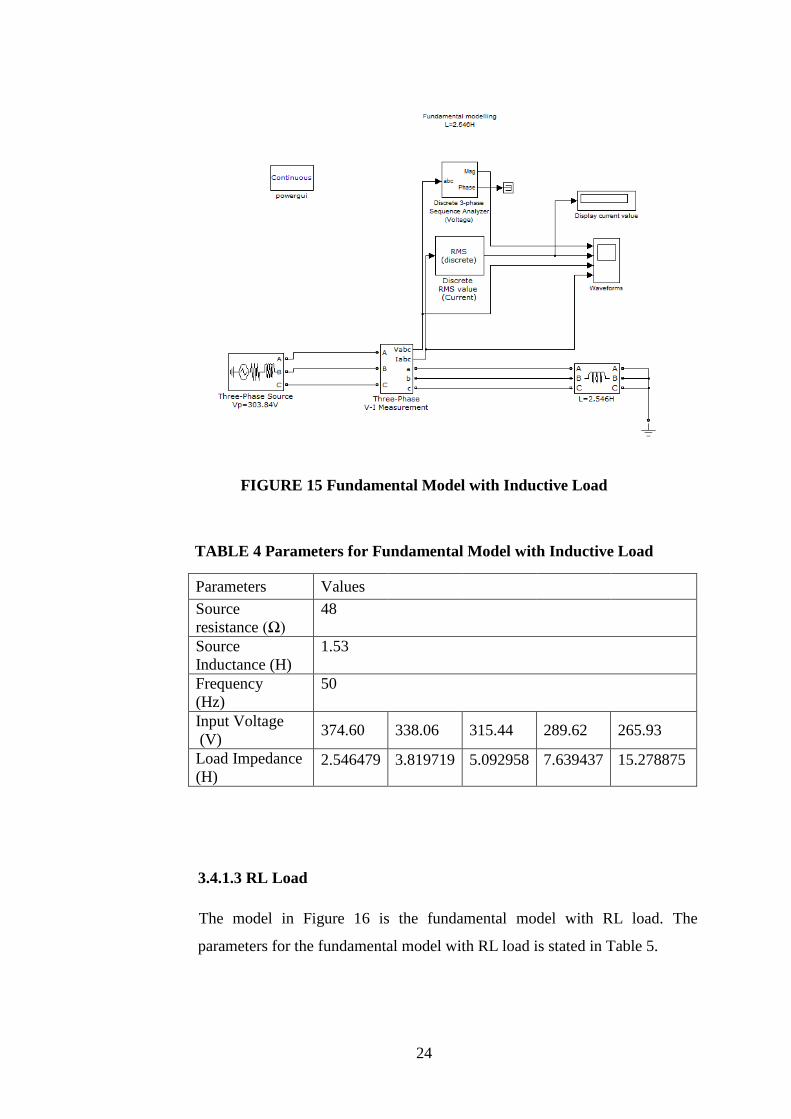
3.4.1.2 Inductive Load
Figure 15 is the modelling for fundamental with inductive load. The
parameters for the model are in Table 4.
24
FIGURE 15 Fundamental Model with Inductive Load
TABLE 4 Parameters for Fundamental Model with Inductive Load
Parameters Values
Source
resistance ( )
48
Source
Inductance (H)
1.53
Frequency
(Hz)
50
Input Voltage
(V) 374.60 338.06 315.44 289.62 265.93
Load Impedance
(H) 2.546479 3.819719 5.092958 7.639437 15.278875
3.4.1.3 RL Load
The model in Figure 16 is the fundamental model with RL load. The
parameters for the fundamental model with RL load is stated in Table 5.

25
FIGURE 16 Fundamental Model with RL load
TABLE 5 Parameters for Fundamental Model with RL load
Parameters Values
Source
resistance (
)
48
Source
Inductance
(H)
1.53
Frequency
(Hz)
50
Input Voltage
(V) 244.29386 236.480826 236.877646 238.307222 238.246143
Resistive load
( ) 960.00 1600.00 2400.00 3600.00 4800.00
Inductive
load
(H)
2.101 3.80062004 5.09932438 7.60124008 11.398677

26
3.4.2 Third Harmonic Model
The circuit for third harmonic was modelled based on diagram in Figure 2 with
frequency 150 Hz. The third harmonic model uses three separate sources to
achieve the zero sequence where the voltages are in the same phase. Since the
voltage sources do not have the source impedance, external RL branch is added
to be the source impedance. The circuit is analysed at the output of three phase
VI measurement where it measure the current and voltage from the source.
Besides, the neutral current is also measured in order to compare its values
before and after the filter is added. The simulation is carried out by varying the
voltage and the load impedance simultaneously. The RMS value of the current is
displayed at the display block.
3.4.2.1 Resistive Load
The model in Figure 17 is the third harmonic model with resistive load. Table
6 showed the parameters for third harmonic model with resistive load.
FIGURE 17 Third Harmonic Model with Resistive Load
27
TABLE 6 Third Harmonic Model with Resistive Load Parameters
Parameters Values
Source
resistance
( )
3.92
Source
Inductance
(H)
0.041656
Frequency
(Hz)
150
Input
Voltage
(V)
A
5.08
5.25
5.97
5.50
5.62
6.97
7.07
7.27
8.96
8.13
8.28
10.21
9.20
9.86
11.38
B
C
Phase
Angle
(◦)
A 74.06
85.82
67.79
57.35
71.10
55.25
27.19
39.53
28.53
14.31
25.92
16.66
2.85
12.77
5.29
B
C
Load
impedance
( )
691.21
0.03385
H
764.72 -
0.00245
H
1127.74
-0.02387
H
1663.75
-
0.07770H
2582.34
-
0.07808H
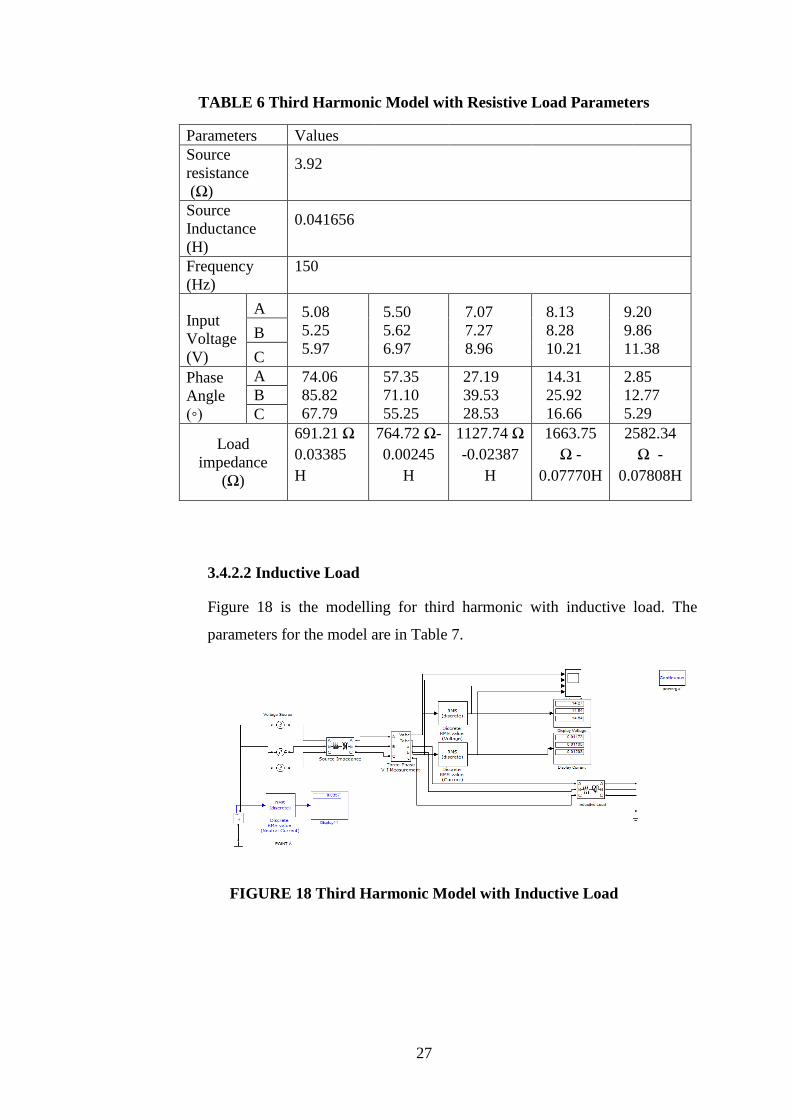
3.4.2.2 Inductive Load
Figure 18 is the modelling for third harmonic with inductive load. The
parameters for the model are in Table 7.
FIGURE 18 Third Harmonic Model with Inductive Load

28
TABLE 7 Parameters for Third Harmonic Model with Inductive Load
Parameters Values
Source
resistance
( )
3.92
Source
Inductance
(H)
0.041656
Frequency
(Hz)
150
Input
Voltage
(V)
A
14.73
15.01
15.11
13.66
14.02
14.20
13.27
13.65
14.07
12.97
13.60
14.02
12.48
12.97
13.78
B
C
Phase
Angle
(◦)
A -20.71
-17.21
-20.40
-22.51
-18.09
-21.65
-21.74
-17.77
-20.25
-21.18
-15.75
-20.15
-21.63
-15.41
-18.95
B
C
Load
impedance
( )
145.79
1.28142H
299.90
1.68539H
445.56
2.56431H
270.75
4.03679H
1907.36
7.69842H
3.4.2.3 RL Load
The configuration in Figure 19 is the third harmonic model with RL load.
The parameters for the fundamental model with RL load is stated in Table 8.
FIGURE 19 Third Harmonic Model with RL Load

29
TABLE 8 Parameters for Third Harmonic Model with RL Load
Parameters Values
Source
resistance
( )
3.92
Source
Inductance
(H)
0.041656
Frequency
(Hz)
150
Input
Voltage
(V)
A
10.62
11.26
12.14
11.02
11.68
12.82
11.20
11.78
12.72
11.49
12.04
12.92
11.52
12.10
12.94
B
C
Phase
Angle
(◦)
A
10.69
14.54
10.12
-1.83
3.93
-0.81
-6.06
0.19
-4.13
-
10.58
-4.81
-8.40
-
14.12
-7.72
-
12.05
B
C
Load
impedance
( )
1864.40
1.55098H
3776.65
3.04459H
5146.09
5.29564H
5686.03
8.32488H
10742.96
9.76574H

30
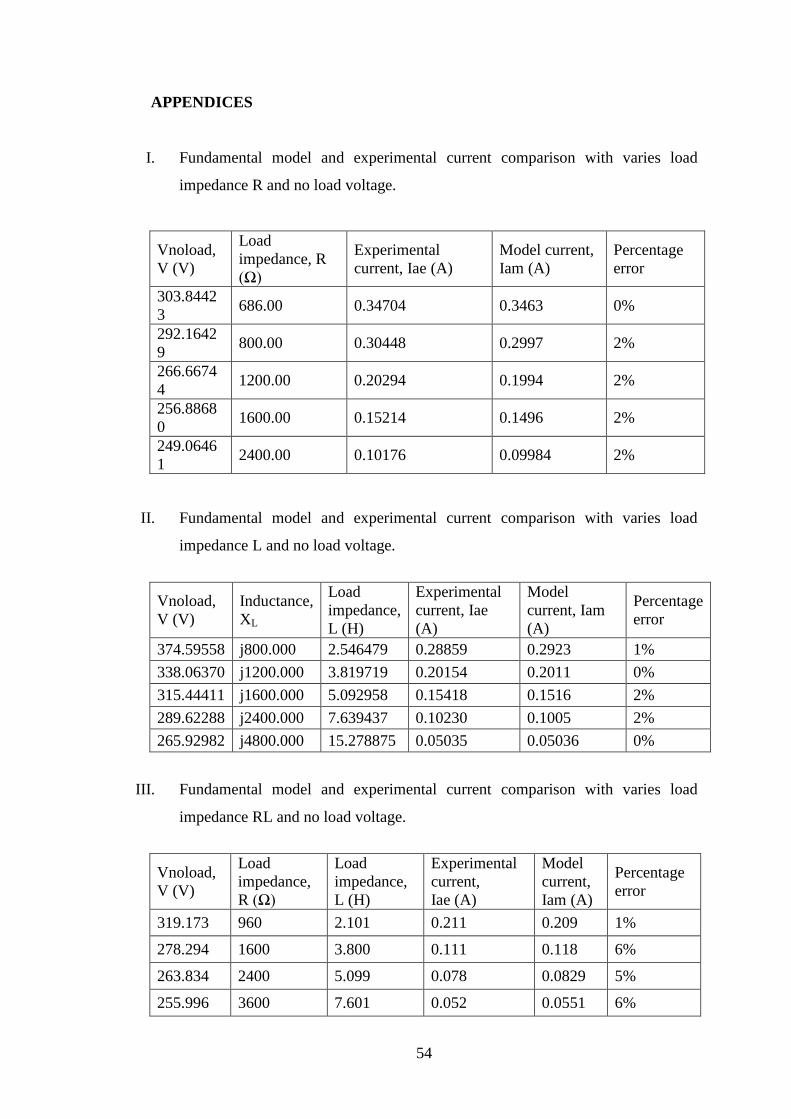
3.4.3 Comparison Analysis using Fundamental Model and Third Harmonic
Model with Experimental Values
The complete results for the simulation of fundamental model and
third harmonic model with resistive load, inductive load and RL load can be
referred at Appendices section and summary of the percentage error is in
Table 9. The percentage error is the percentage difference between the the
value of current experimental and simulation.
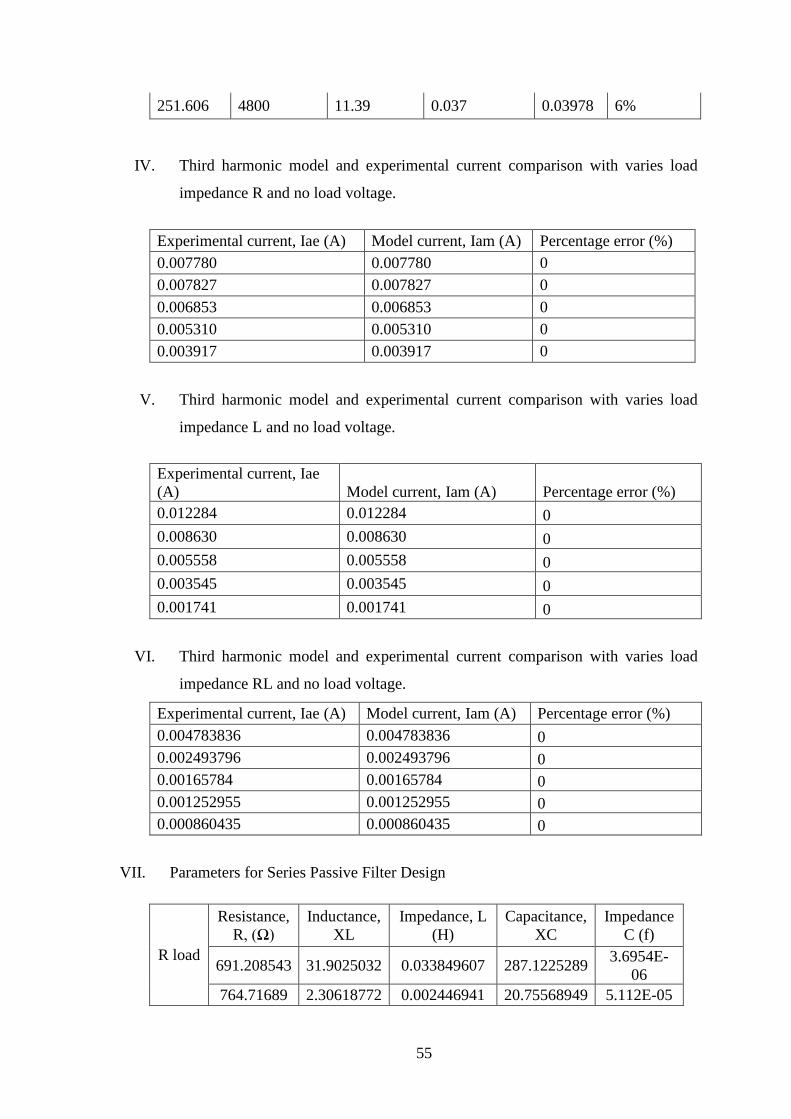
According to the result in Appendices, the percentage error for
between the experimental values and simulation values for fundamental
model is in range 0% to 2%. On the other hand, third harmonic model had the
zero percentage error. During the experiment, it is found that the values of the
measured load impedance are different with the theoretical values. In order to
model the circuit respective to the experiment, the author used the measured
values of the load impedance instead of the rated values. Thus, the percentage
error of circuit modelled is zero.
The author managed to achieve the circuit modelling according to the
experiment based on the experimental values in her modelling. All
components like power source, impedance, VI measurement and loads can be
obtained from Simulink Library Browser. The type of the filters used for the
simulation circuits are also modelled using Matlab which will be discussed in
the next part.
TABLE 9 Summary of Percentage Error
Type of modelling Type of load Range of percentage error
(%)
Fundamental
Resistive Load 0 – 2
Inductive Load 0 – 2
RL Load 1 – 6
Third Harmonic
Resistive Load 0
Inductive Load 0
RL Load 0

31
3.4.4 Third Harmonic Model with Filters
The third harmonic models are added with the filter to observe the behaviour of the
third harmonic in the system. There are a few important things that must be
considered when doing the analysis which are the neutral current, voltage and current
at different nodes. Hence, there are three points of measurements to identify if there
are any changes with the system once the filter is connected. Point A is where the
neutral current is measured, point B is current between the source and the filter is
measured and last but not least point C is current measured at the load. The phase
current considered is only in phase A because the other two phases have the same
pattern and values are not much different with phase A.
3.4.4.1 Shunt Passive Filter
Figure 20 shows the example of third harmonic circuit modelled with shunt
passive filter.
FIGURE 20 Third Harmonic Model with Shunt Passive Filter
There are three types of passive filters available in Matlab Simulink which
includes single tuned filter, high pass filter and c type high pass filter. The
values of the parameters were referring to the experimental values.
3.4.4.2 Series Passive Filters

32
Another method in mitigating the high current in neutral current is by
connecting the passive filter in series. Figure 21 shows the example of third
harmonic circuit modelled with shunt passive filter.
FIGURE 21 Third Harmonic Model with Series Passive Filter
There are also three types of passive filters connected which are single tuned
filter refer Figure 22, high pass filter refer Figure 23 and C type high pass
filter refer Figure 24. Since the connection is in series, so each of the phase is
connected with passive filter. The subsystem components are representing the
passive filter. The parameters for each of the components for the filter can be
found in the Appendix VII.
FIGURE 22 Single Tuned Passive Filter

33
FIGURE 23 High Pass Passive Filter
FIGURE 24 C type High Pass Passive Filter
3.4.4.3 Active Filters
Active filter is one of the methods to reduce harmonic current. Figure 25
shows the design of third harmonic model with shunt active filter.
FIGURE 25 Third Harmonic Model with Active Filter

34
The active filter configuration is shown in Figure 26. In order to make the
circuit uncomplicated, the subsystem is used to represent the active filter.
FIGURE 26 Active Filter Configurations
3.4.4.4 Hybrid Filters
Hybrid filter is the combination of shunt active filter and shunt passive filter.
Figure 27 shows the design of hybrid filter.
FIGURE 26
FIGURE 27 Third Harmonic Model with Hybrid Filter

35
CHAPTER 4
RESULTS AND DISCUSSION
4.1 Shunt Passive Filters at the R load, L load and RL load
Figure 28 and Figure 29 shows that the current is higher after the single tuned
filter is connected to the R load system. While Figure 30 shows the phase current
at the load is less after the shunt single tuned filter is connected. This proves that
by connecting the shunt single tuned filter, the third harmonic current at the load
is reduced. Nevertheless, the current at other points of measurement especially at
the neutral is very high after the filter is connected. Therefore, the single tuned
filter in the circuit modelled is not the solution to mitigate the high current at the
neutral as proven with the simulation result.

36
Results for the high pass filter and results for C type high pass filter in Appendix
IX show that the same pattern of current with single tuned filter which is current
is higher after the filter is connected to the system. The current at the load is less
after the filter is connected. This proves that the by connecting only the shunt
passive filter, the third harmonic current at the load is reduced. Nonetheless, the
current at other points of measurement especially at the neutral is very high after
the passive filter is connected in parallel. Even with L load and RL load
connected, the pattern of the results are the same. Therefore, the shunt passive
filter in the circuit modelled for R load, L load and RL load are not the solution
to mitigate the high current at the neutral as proven with the simulation result.
FIGURE 28 Comparison of Neutral Current (Point A) with and without Third
harmonic Shunt Single Tuned Filter for R load
0
0.1
0.2
0.3
0.4
0.5
0.6
691.21 764.72 1127.74 1663.75 2582.34
Ne
utr
al C
urr
en
t
R Load
Before
After

37
FIGURE 29 Comparison of Current at Point B with and without Third
harmonic Shunt Single Tuned Filter for R load
FIGURE 30 Comparison of Current at Point C with and without Third
harmonic Shunt Single Tuned Filter for R load
0
0.02
0.04
0.06
0.08
0.1
0.12
0.14
0.16
0.18
691.21 764.72 1127.74 1663.75 2582.34
Ph
ase
Cu
rre
nt
R Load
Before
After
0
0.001
0.002
0.003
0.004
0.005
0.006
0.007
0.008
691.21 764.72 1127.74 1663.75 2582.34
Ph
ase
Cu
rre
nt
R Load
Before
After

38
The neutral current and phase current at the source and filter are higher than with
shunt passive filter connected. In the other hand, the current at load have
significantly reduced after the shunt filter connected based on the simulation
result. Table 10 shows the summary for the neutral current and phase current
from the shunt passive filters. From the table, it shows that percentage difference
of current at the load is highest when C type High Pass filter is connected. This
is because C type high pass filter filter the most third harmonic current at the
load compared to other filters. As a result, C type High Pass filter is the most
suitable filter to filter the third harmonic current at the load which has average
percentage difference -76% at the R load, -98% at the L load and -100% at the
RL load but not feasible to filter the third harmonic current at the generator
neutral. The graph of average percentage difference for R load can be referred at
Figure 31, Figure 32 for L load and Figure 33 for RL load.
TABLE 10 Summary of Percentage Difference of Neutral Current and Phase
Current Before and After Shunt Passive Filter
Average Percentage Difference at Neutral
Current (%)
Average Percentage Difference at Phase Current at Load (%)
Single Tuned Filter
High Pass Filter
C Type High Pass Filter
Single Tuned Filter
High Pass Filter
C Type High Pass Filter
R Load 2398 2957 2916 -65 -71 -76
L Load 7551 7690 7661 -98 -98 -98
RL Load
19287 19341 19330 -99 -99 -100

39
FIGURE 31 Percentage Difference between Filters at Different Point of Current
for R Load
FIGURE 32 Percentage Difference between Filters at Different Point of Current
for L Load
FIGURE 33 Percentage Difference between Filters at Different Point of Current
for RL Load
-500%
0%
500%
1000%
1500%
2000%
2500%
3000%
3500%
Neutral Current P
erc
en
tage
Dif
fere
nce
Type of current
Single Tuned
Highpass filter
C type highpass filter
-1000%
0%
1000%
2000%
3000%
4000%
5000%
6000%
7000%
8000%
9000%
Neutral Current Load Phase Current
Pe
rce
nta
ge D
iffe
ren
ce
Type of current
Single Tuned
Highpass filter
C type highpass filter
-5000%
0%
5000%
10000%
15000%
20000%
25000%
Neutral Current Load Phase Current
Pe
rce
nta
ge D
iffe
ren
ce
Type of current
Single Tuned
Highpass filter
C type highpass filter

40
4.2 Series Passive Filters at the R load, L load and RL load
When single tuned filter connected in series for each of the phase from the
source, the result of the neutral current at Figure 34 shows that the current
reduced. At the point B and point C, the current also decreased as shown in
Figure 35 and 36 respectively. According to result of series passive filter for all
types of load in Appendix IX, the current at each point is reduced which means
the third harmonic current circulating at load and the neutral is reduced
significantly. Therefore, the series passive filter in the circuit modelled for R
load, L load and RL load are the the solution to mitigate the high current at the
neutral as proven with the simulation result.
FIGURE 34 Comparison of Neutral Current (Point A) with and without Third
harmonic Series Single Tuned Series Passive Filter at R Load
0
0.005
0.01
0.015
0.02
0.025
691.21 764.72 1127.74 1663.75 2582.34
Ne
utr
al C
urr
en
t
R Load
Before
After

41
FIGURE 35 Comparison of Phase Current at Point B with and without Third
harmonic Series Single Tuned Series Passive Filter for R load
FIGURE 36 Comparison of Phase Current at Point C with and without Third
harmonic Series Single Tuned Series Passive Filter for R load
0
0.001
0.002
0.003
0.004
0.005
0.006
0.007
0.008
691.21 764.72 1127.74 1663.75 2582.34
Ph
ase
Cu
rre
nt
R Load
Before
After
0
0.001
0.002
0.003
0.004
0.005
0.006
0.007
0.008
691.21 764.72 1127.74 1663.75 2582.34
Ph
ase
Cu
rre
nt
R Load
Before
After
42
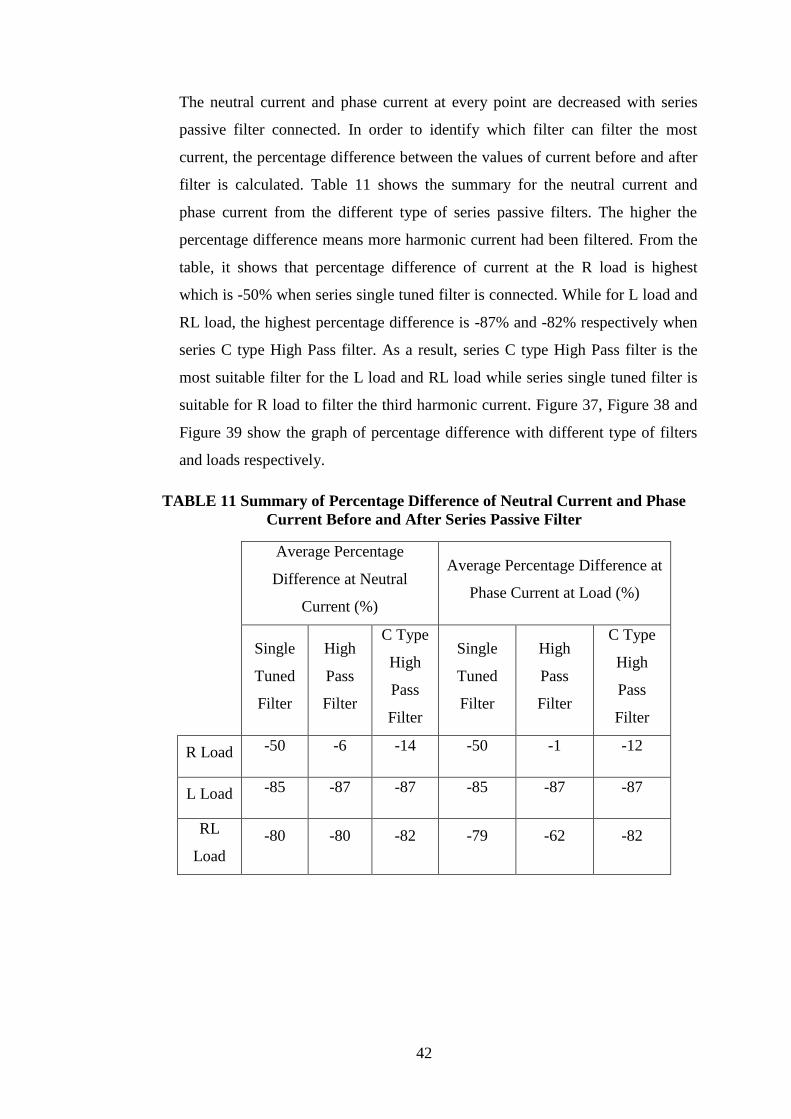
The neutral current and phase current at every point are decreased with series
passive filter connected. In order to identify which filter can filter the most
current, the percentage difference between the values of current before and after
filter is calculated. Table 11 shows the summary for the neutral current and
phase current from the different type of series passive filters. The higher the
percentage difference means more harmonic current had been filtered. From the
table, it shows that percentage difference of current at the R load is highest
which is -50% when series single tuned filter is connected. While for L load and
RL load, the highest percentage difference is -87% and -82% respectively when
series C type High Pass filter. As a result, series C type High Pass filter is the
most suitable filter for the L load and RL load while series single tuned filter is
suitable for R load to filter the third harmonic current. Figure 37, Figure 38 and
Figure 39 show the graph of percentage difference with different type of filters
and loads respectively.
TABLE 11 Summary of Percentage Difference of Neutral Current and Phase
Current Before and After Series Passive Filter
Average Percentage
Difference at Neutral
Current (%)
Average Percentage Difference at
Phase Current at Load (%)
Single
Tuned
Filter
High
Pass
Filter
C Type
High
Pass
Filter
Single
Tuned
Filter
High
Pass
Filter
C Type
High
Pass
Filter
R Load -50 -6 -14 -50 -1 -12
L Load -85 -87 -87 -85 -87 -87
RL
Load
-80 -80 -82 -79 -62 -82

43
FIGURE 37 Percentage Difference between Filters at Different Point of Current
for R Load
FIGURE 38 Percentage Difference between Filters at Different Point of Current
for L Load
FIGURE 39 Percentage Difference between Filters at Different Point of Current
for RL Load
-60%
-50%
-40%
-30%
-20%
-10%
0%
Neutral Current
Load Phase Current
Pe
rce
nta
ge D
iffe
ren
ce
Type of current
Single Tuned
Highpass filter
C type highpass filter
-88%
-87%
-87%
-86%
-86%
-85%
-85%
-84%
Neutral Current Load Phase Current
Pe
rce
nta
ge D
iffe
ren
ce
Type of current
Single Tuned
Highpass filter
C type highpass filter
-100%
-80%
-60%
-40%
-20%
0%
Neutral Current
Load Phase Current
Pe
rce
nta
ge D
iffe
ren
ce
Type of current
Single Tuned
Highpass filter
C type highpass filter

44
4.3 Shunt Active Filters at the R load, L load and RL load
When shunt active filter is connected, the result of the neutral current at Figure
40 shows that the current is slightly reduced. On the other hand at the point B,
the current is increased as shown in Figure 41 while at point C referred to Figure
42 the current is slightly decreased. According to result of shunt active filter for
all types of load in Appendix IX, the current at each point A and point C is
reduced which means the third harmonic current circulating at load and the
neutral is reduced except at point B.
FIGURE 40 Comparison of Neutral Current (Point A) with and without Third
harmonic Shunt Active Filter
0
0.005
0.01
0.015
0.02
0.025
691.21 764.72 1127.74 1663.75 2582.34
Cu
rre
nt
R Load
Before
After

45
FIGURE 41 Comparison of Phase Current at Point B with and without Third
harmonic Shunt Active Filter
FIGURE 42 Comparison of Phase Current at Point C with and without Third
harmonic Shunt Active Filter
0
0.005
0.01
0.015
0.02
0.025
0.03
0.035
691.21 764.72 1127.74 1663.75 2582.34
Cu
rre
nt
R Load
Before
After
0
0.001
0.002
0.003
0.004
0.005
0.006
0.007
0.008
691.21 764.72 1127.74 1663.75 2582.34
Cu
rre
nt
R Load
Before
After

46
The neutral current and phase current at the load are decreased with shunt active
filter connected. In order to identify which filter can filter the most current, the
percentage difference between the values of current before and after filter is
calculated. Table 12 shows the summary for the neutral current and phase
current from the shunt active filters. The higher the percentage difference means
more harmonic current had been filtered. As a result, shunt active filter is
suitable filter for the R load, L load and RL load to filter the third harmonic
current with -6% percentage differences.
TABLE 12 Summary of Percentage Difference of Neutral Current and Phase
Current Before and After Shunt Active Filter
Average Percentage
Difference at Neutral
Current (%)
Average Percentage Difference
at Phase Current at Load (%)
R Load -6 -6
L Load -6 -6
RL
Load -6 -6
FIGURE 43 Percentage Difference between Filters at Different Point of Current
for all Load
-10%
-9%
-8%
-7%
-6%
-5%
-4%
-3%
-2%
-1%
0%
Neutral Current Load Phase Current
Pe
rce
nta
ge D
iffe
ren
ce
Type of current
R
L
RL

47
4.4 Hybrid Filters at the R load, L load and RL load
The combination of shunt active filter with shunt passive filter is called hybrid
filter. When the filters is connected, the result of the neutral current at Figure 44
shows that the current is considerably reduced. On the other hand at the point B,
the current is increased as shown in Figure 45 while at point C referred to Figure
46 the current is decreased. According to result of shunt active filter for all types
of load in Appendix IX, the current at each point A and point C is reduced which
means the third harmonic current circulating at load and the neutral is reduced
except at point B.
FIGURE 44 Comparison of Neutral Current (Point A) with and without Third
harmonic Hybrid Filter
0
0.005
0.01
0.015
0.02
0.025
691.21 764.72 1127.74 1663.75 2582.34
Ne
utr
al C
urr
en
t
R Load
Before
After

48
FIGURE 45 Comparison of Phase Current at Point B with and without Third
harmonic Hybrid Filter
FIGURE 46 Comparison of Phase Current at Point C with and without Third
harmonic Hybrid Filter
0
0.05
0.1
0.15
0.2
0.25
691.21 764.72 1127.74 1663.75 2582.34
Cu
rre
nt
R Load
Before
After
0
0.001
0.002
0.003
0.004
0.005
0.006
0.007
0.008
691.21 764.72 1127.74 1663.75 2582.34
Cu
rre
nt
R Load
Before
After

49
The neutral current and phase current at the load are decreased with shunt active
filter connected. In order to identify which filter can filter the most current, the
percentage difference between the values of current before and after filter is
calculated. Table 13 shows the summary for the neutral current and phase
current from the shunt active filters. The higher the percentage difference means
more harmonic current had been filtered. As a result, shunt active filter is
suitable filter for the R load, L load and RL load to filter the third harmonic
current with percentage difference range in 75% to 100%. The graph for
percentage difference for different load is shown in Figure 47.
TABLE 13 Summary of Percentage Difference of Neutral Current and Phase
Current Before and After Shunt Active Filter
Average Percentage
Difference at Neutral
Current (%)
Average Percentage Difference
at Phase Current at Load (%)
R Load -100% -75%
L Load -100% -98%
RL
Load -100% -100%
FIGURE 47 Percentage Difference between Filters at Different Point of Current
for All Load
-120%
-100%
-80%
-60%
-40%
-20%
0%
Neutral Current Load Phase Current
Pe
rce
nta
ge D
iffe
ren
ce
Type of current
R
L
RL

50
4.5 Practical Implementation and Economic Consideration
According to the simulation result above, the suitable filters to filter the third
harmonic are series passive filter, shunt active filter and hybrid filter. In term of
practical implementation, there are a few criteria need to be considered. One of it is
the economic consideration. Customer usually will choose product which is cheap,
very reliable, low maintenance and economy wise.
Series passive filter can filter out most of the third harmonic current at the generator
neutral compared to other type of filter as referred to the result. However,
implementation of series passive filter to the real system can cause high cost. This is
because the design of series passive filter will need to be attached at the existing
system in series which it may need to interrupt the configuration of the existing
system. With this kind of interruption to the real system, it may cause any
unnecessary side effect to the existing system.
The other two types of filters are shunt active filter and hybrid filter (shunt passive
filter and shunt active filter). These two types of filters are connected in parallel with
the existing system which it will not disrupt the existing system. Besides, the cost of
implementation will be less because of the parallel connection.

51
CHAPTER 5
CONCLUSION AND RECOMMENDATION
In conclusion, modelling the fundamental and third harmonic current in Matlab
Simulink and compare with the experimental values can show the reliability of the
simulation using the modelling. With the tolerate percentage error between the
simulation values and experimental values proved that the Matlab Simulink
simulation can be used as a model to design the third harmonic current filter.
Therefore, it is easier to simulate the mitigation of high current when the third
harmonic filter had been designed. Hence, it reduced the time consumption to do the
experiment and also can be used as a guideline for real installation.
Shunt passive filter is where passive filter is connected parallel to the system. The
outcomes when shunt passive filter is connected to the system are the third harmonic
current at the three different type of load is reduced while the neutral current
increased.
When passive filter is connected in series for each phase, the third harmonic current
at the system including the neutral current is reduced. Series single tuned filter is the
filter that can reduce the most neutral current at R load while series C type passive
filter is most suitable with L load and RL load.
Shunt active filter and hybrid filter are both filters had the neutral current reduced.
The different between these two filters are the percentage difference of the neutral
current. Hybrid filter had higher percentage difference compared to shunt active
filter.
As recommendation, when the simulation with third harmonic filter design achieved
the objectives, the implementation to the real system should be carry out to test the
functionality with taking into consideration of economy and maintenance aspect of
the filter design towards the existing system such as the generator neutral.
52
REFERENCE
[1] M. Bollen, “Appendix B: IEEE Standards on Power Quality,” Understanding Power
Quality Problems:Voltage Sags and Interruptions. Wiley-IEEE Press, pp. 481–483,
2000.
[2] “IEEE Recommended Practice for Powering and Grounding Electronic Equipment -
Redline,” IEEE Std 1100-2005 (Revision of IEEE Std 1100-1999) - Redline. pp. 1–
703, 2006.
[3] T. Ise, Y. Hayashi, and K. Tsuji, “Definitions of power quality levels and the simplest
approach for unbundled power quality services,” Harmon. Qual. Power, 2000.
Proceedings. Ninth Int. Conf., vol. 2, pp. 385–390 vol.2, 2000.
[4] T. L. Skvarenina, The Power Electronics Handbook. CRC Press, 2001.
[5] J. B. Dixit and A. Yadav, Electrical Power Quality. Laxmi Publications Pvt Limited,
2010.
[6] M. F. Abdullah, N. H. Hamid, Z. Baharudin, M. F. I. Khamis, and M. H. M. Nasir,
“The Study of Triplen Harmonics Currents Produced by Salient Pole Synchronous
Generator,” no. July, pp. 1–5, 2011.
[7] M. Faris, Z. Baharudin, and N. Hisham, “The Third Harmonic Model for Salient Pole
Synchronous Generator Under Balanced Load,” vol. 29, no. 2, pp. 519–526, 2014.
[8] M. F. Bin Abdullah, N. H. Bin Hamid, Z. Bin Baharudin, M. F. I. Bin Khamis, N. S.
R. B. Hashim, and S. Bin Yusof, “Investigation on high neutral earthing resistor
temperature when islanded generator connected to utility grid,” 2010 9th Int. Power
Energy Conf. IPEC 2010, pp. 642–647, 2010.
[9] G. J. Wakileh, Power Systems Harmonics: Fundamentals, Analysis and Filter
Design. Springer, 2001.
[10] M. H. Rashid, Power Electronics Handbook: Devices, Circuits and Applications.
Elsevier Science, 2010.
[11] M. Routimo, M. Salo, and H. Tuusa, “Comparison of voltage-source and current-
source shunt active power filters,” IEEE Trans. Power Electron., vol. 22, no. 2, pp.
636–643, 2007.
[12] C. S. Lam and M. C. Wong, Design and Control of Hybrid Active Power Filters.
Springer Berlin Heidelberg, 2013.
[13] M. H. Bollen, Integration of Distributed Generation in the Power System. John Wiley
& Sons, 2011.
[14] L. L. Grigsby, Power Systems, Third Edition, no. v. 4. Taylor & Francis, 2012.
[15] K. K. Srivastava, S. Shakil, and A. V. Pandey, “Harmonics & Its Mitigation
Technique by Passive Shunt Filter,” Int. J. Soft Comput. Eng., vol. 3, no. 2, pp. 325–
331, 2013.
53
[16] G. G. Pozzebon, R. Q. Machado, N. R. Gomes, L. N. Canha, and A. Barin, “Wavelet
and PCA to Power Quality Disturbance Classification Applying a RBF Network,”
2009.
[17] S. Parthasarathy, L. J. Sindhujah, and P. G. Scholar, “Harmonic Mitigation in a
Rectifier System Using Hybrid Power Filter,” pp. 483–488, 2012.
[18] M. S. ABRAHAM JYOTHIMON, HARMONICS IN BUILDINGS: HARMONIC
BUILDING. UNIVERSITY OF BATH,UK.
[19] P. Electronics, “STUDY OF HYBRID ACTIVE POWER FILTER FOR POWER
QUALITY IMPROVEMENT Master of Technology STUDY OF HYBRID ACTIVE
POWER FILTER FOR POWER QUALITY Master of Technology,” 2014.
54
APPENDICES
I. Fundamental model and experimental current comparison with varies load
impedance R and no load voltage.
Vnoload,
V (V)
Load
impedance, R
( )
Experimental
current, Iae (A)
Model current,
Iam (A)
Percentage
error
303.8442
3 686.00 0.34704 0.3463 0%
292.1642
9 800.00 0.30448 0.2997 2%
266.6674
4 1200.00 0.20294 0.1994 2%
256.8868
0 1600.00 0.15214 0.1496 2%
249.0646
1 2400.00 0.10176 0.09984 2%
II. Fundamental model and experimental current comparison with varies load
impedance L and no load voltage.
Vnoload,
V (V)
Inductance,
XL
Load
impedance,
L (H)
Experimental
current, Iae
(A)
Model
current, Iam
(A)
Percentage
error
374.59558 j800.000 2.546479 0.28859 0.2923 1%
338.06370 j1200.000 3.819719 0.20154 0.2011 0%
315.44411 j1600.000 5.092958 0.15418 0.1516 2%
289.62288 j2400.000 7.639437 0.10230 0.1005 2%
265.92982 j4800.000 15.278875 0.05035 0.05036 0%
III. Fundamental model and experimental current comparison with varies load
impedance RL and no load voltage.
Vnoload,
V (V)
Load
impedance,
R ( )
Load
impedance,
L (H)
Experimental
current,
Iae (A)
Model
current,
Iam (A)
Percentage
error
319.173 960 2.101 0.211 0.209 1%
278.294 1600 3.800 0.111 0.118 6%
263.834 2400 5.099 0.078 0.0829 5%
255.996 3600 7.601 0.052 0.0551 6%
55
251.606 4800 11.39 0.037 0.03978 6%
IV. Third harmonic model and experimental current comparison with varies load
impedance R and no load voltage.
Experimental current, Iae (A) Model current, Iam (A) Percentage error (%)
0.007780 0.007780 0
0.007827 0.007827 0
0.006853 0.006853 0
0.005310 0.005310 0
0.003917 0.003917 0
V. Third harmonic model and experimental current comparison with varies load
impedance L and no load voltage.
Experimental current, Iae
(A) Model current, Iam (A) Percentage error (%)
0.012284 0.012284 0
0.008630 0.008630 0
0.005558 0.005558 0
0.003545 0.003545 0
0.001741 0.001741 0
VI. Third harmonic model and experimental current comparison with varies load
impedance RL and no load voltage.
Experimental current, Iae (A) Model current, Iam (A) Percentage error (%)
0.004783836 0.004783836 0
0.002493796 0.002493796 0
0.00165784 0.00165784 0
0.001252955 0.001252955 0
0.000860435 0.000860435 0
VII. Parameters for Series Passive Filter Design
R load
Resistance,
R, ( )
Inductance,
XL
Impedance, L
(H)
Capacitance,
XC
Impedance
C (f)
691.208543 31.9025032 0.033849607 287.1225289 3.6954E-
06
764.71689 2.30618772 0.002446941 20.75568949 5.112E-05

56
1127.73591 22.4942036 0.023867091 202.4478324 5.241E-06
1663.74659 73.2337694 0.077703443 659.103925 1.6098E-
06
2582.3356 73.5861084 0.078077286 662.274976 1.6021E-
06
L load
145.793787 1207.71165 1.281421856 10869.40482 9.7616E-
08
299.897469 1588.44444 1.685391895 14295.99995 7.4219E-
08
445.563982 2416.80138 2.564305906 21751.21241 4.878E-08
270.752933 3804.58918 4.0367945 34241.30265 3.0987E-
08
1907.36223 7255.59426 7.698424606 65300.3483 1.6249E-
08
RL
load
1864.40014 1461.76789 1.550983899 13155.91098 8.0651E-
08
3776.64941 2869.45947 3.04459106 25825.13525 4.1085E-
08
5146.09353 4991.02763 5.295644788 44919.24866 2.3621E-
08
5686.02664 7846.01307 8.324878424 70614.11763 1.5026E-
08
10742.9609 9203.99406 9.765741009 82835.94657 1.2809E-
08
VIII. The voltage and current waveform at the load

57
IX. Results for current value of different load for different types of filters at different points
Series Passive Filter
Single Tuned High Pass C type high pass
R Neutral
Current
Phase
current
at the
filter
Phase
current
at the
load

58
L Neutral
Current
Phase
current
at the
filter
Phase
current
at the
load

59
RL Neutral
Current
Phase
current
at the
filter
Phase
current
at the
load

60
Shunt Passive Filter Active filter Hybrid filter
Single Tuned High Pass C type high pass
R Neutral
Current
Phase
current
at the
filter
Phase
current
at the
load

61
L Neutral
Current
Phase
current
at the
filter
Phase
current
at the
load
RL
Neutral
Current

62
Phase
current
at the
filter
Phase
current
at the
load

0